Investment Portfolio Details Updated to 9/30/08(*)
Investment Portfolio Details
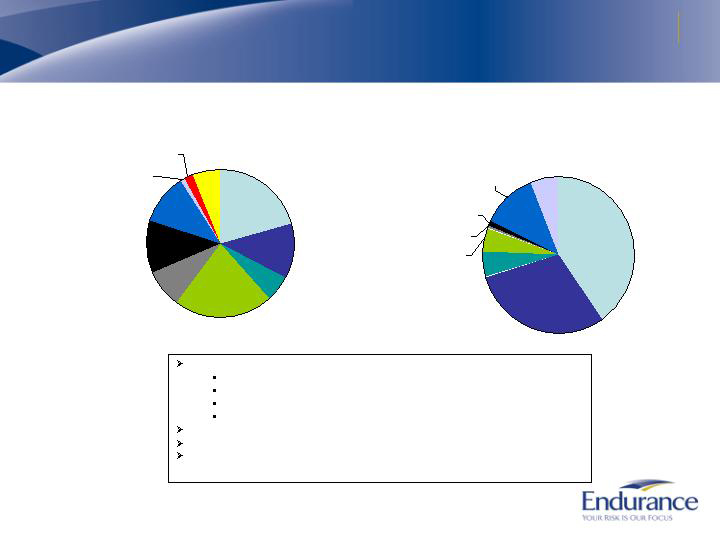
Total cash and invested assets of $5.5 billion
$4.5 billion Fixed Income Investment Portfolio
Average credit rating of AAA
$2.5 billion of AAA-rated & Agency Structured Fixed Income
Agency MBS $1.2 billion
AAA Non-Agency RMBS $468 million (no subprime)
AAA Non-Agency CMBS $594 million
AAA Auto loan backed $114 million
AAA Credit card backed $109 million
$1.2 billion Government and Agency Debentures
$668 million of Corporate Debt and $104 million of Municipals
Predominately senior indebtedness
Unsecured debt of Financial Institutions - $241 million
(59 individual issuers, none greater than $36 million)
High Yield $44 million
$55 million Below AAA-rated Structured Fixed Income
RMBS $5 million
CMBS $18 million
ABS $31 million
$338 million of Other Investments
Diversified portfolio of hedge funds and high yield bank loan funds
$667 million of Cash and Cash equivalents
Consists primarily of bank deposits, US Government/Agency
securities, and money market funds invested in US Government /
Agency securities
Portfolio Commentary
No exposure to Fannie Mae and Freddie
Mac preferred equity or subordinated debt
or any security issued by Washington
Mutual
No sub-prime mortgage backed securities.
No credit or interest rate derivatives
Immaterial exposure to other troubled
financial institutions (Lehman- $6.5 million
pre-write down book value, and AIG - $3.5
million pre-write down book value)
Expected realized losses, other-than-
temporary impairment charges and
alternative investment losses in the 3rd
quarter of approximately $64 million and
within risk management tolerances (~1%
of 9/30/08 Cash/Invested Assets and < 3%
of Shareholders equity).
Portfolio experienced approximately $70
million to $75 million increase in net unrealized
loss during quarter ended 9/30/08 (less than
1.4% of Cash and Invested Assets)
(*) Data estimated as of September 30, 2008.
7