
Endurance Specialty Holdings Ltd.
Balance Sheet Quality and Financial Strength

Forward Looking Statements
Some of the statements in this presentation include forward-looking statements which reflect our current views with respect to future events and financial performance. Such statements include forward-looking statements both with respect to us in general and the insurance and reinsurance sectors specifically, both as to underwriting and investment matters. Statements which include the words "expect," "intend," "plan," "believe," "project," "anticipate," "seek," "will," and similar statements of a future or forward-looking nature identify forward-looking statements in this presentation for purposes of the U.S. federal securities laws or otherwise. We intend these forward-looking statements to be covered by the safe harbor provisions for forward-looking statements in the Private Securities Litigation Reform Act of 1995.
All forward-looking statements address matters that involve risks and uncertainties. Accordingly, there are or may be important factors that could cause actual results to differ from those indicated in the forward-looking statements. These factors include, but are not limited to, developments in the world’s financial and capital markets that could adversely affect the performance of Endurance’s investment portfolio or access to capital, changes in the composition of Endurance's investment portfolio, competition, possible terrorism or the outbreak of war, the frequency or severity of unpredictable catastrophic events, changes in demand for insurance or reinsurance, rating agency actions, uncertainties in our reserving process, a change in our tax status, acceptance of our products, the availability of reinsurance or retrocessional coverage, retention of key personnel, political conditions, the impact of current legislation and regulatory initiatives, changes in accounting policies, changes in general economic conditions and other factors described in our Annual Report on Form 10-K for the year ended December 31, 2007.
Forward-looking statements speak only as of the date on which they are made, and we undertake no obligation publicly to update or revise any forward-looking statement, whether as a result of new information, future developments or otherwise.

Highlights of Endurance’s Balance Sheet Strength as of
September 30, 2008
High quality assets with low counterparty risk
Cash and invested assets of $5.5 Billion (*)
Average credit rating of AAA
Limited investments in troubled financial institutions
Conservative portfolio strategy has protected balance sheet
Very low exposure to reinsurance counterparties or other credit risk
Significant reserve base and careful attention to setting of reserves
Total reserves of $3.3 Billion
IBNR represents 66% of total reserves ( > 80% of long tail casualty reserves are IBNR)
Global schedule P reserve analysis disclosed annually highlights reserve position and
commitment to transparency
Efficient and stable capital structure, with low leverage
Total capital of $2.9 Billion
Common Equity $2.1 Billion
Preferred Equity $0.20 Billion
Long Term Debt $0.45 Billion
Contingent Common Equity $0.15 Billion
Excellent Financial Strength Ratings:
S&P: A (stable). Upgraded December 2006. ERM considered “Excellent”.
AM Best A (stable). Upgraded December 2007.
Moody’s: A2 (stable).
(*) = Includes investments pending settlement, net

Excellent Liquidity Position
Cash and cash equivalents of $667 million at 9/30/08 (*)
Consists primarily of bank deposits, US Government/Agency securities, and money market
funds invested in US Government / Agency securities
High quality fixed income investment portfolio, including fixed maturity securities, short term
investments and hybrid preferred equities, of $4.5 billion at 9/30/08 with strong cash flows
Portfolio generates annual principal and interest payments of > $1 billion
Short duration of 3.2 years
$1.2 billion credit facility (matures 2012)
Provides capacity for very low cost borrowings (LIBOR + max of 38 bps) and letters of credit
> $600 million of unused capacity at 9/30/08
Widely syndicated facility with 16 participant banks
$150 million variable forward sale of equity can be drawn upon quickly through 2010
Positive operating cash flows provide additional flexibility
(*) Includes investments pending settlement, net

Strong Capital Base
Low leverage: Debt/Total Capital of
16.5% at 9/30/08
Balance sheet financed with long
duration liabilities / hybrid capital
$250M 10 year senior notes (due 2015,
6.15% coupon)
$200M 30 year senior notes (due 2034,
7.00% coupon)
$200M perpetual preferred stock (no
maturity, 7.75% coupon)
$150M contingent equity provides quick
source of common equity through 2010
Excellent risk based capital management
maintains strong rating agency capital
position while providing capacity for
capital management and growth
Approximately $180M of share
repurchases and common share
dividends paid through first nine months
of 2008
Strong and Flexible
Capital Structure
$, Millions
$1,748
$2,254
$2,320
$2,745
$3,111
$2,866

Investment Portfolio Composition as of September 30, 2008
Cash and Cash
Equivalents 12%
ABS 5%
Agency RMBS 22%
Non-Agency RMBS
9%
CMBS 11%
Government &
Agency 21%
Other Investments
6%
Municipals 2%
Investment Grade
Corporates 11%
High Yield
Corporates 1%
AAA 30%
US
Government
& Agency
40%
Other
Investments
6%
Cash and
Cash
Equivalents
12%
AA 5%
A 5%
BBB 1%
High Yield 1%
Diversified, high quality, short duration fixed income portfolio
Average rating – Aaa/AAA
Duration – 3.2 years
Book Yield – 4.9%
Market yield – 5.6%
No sub-prime mortgage backed securities.
No credit or interest rate derivatives.
No exposure to Fannie Mae and Freddie Mac preferred equity or
subordinated debt or any security issued by Washington Mutual
NOTES: (a) “Other Investments” includes hedge funds and high yield bank loan funds
(b) Includes investments pending settlement, net
(c) Includes agency RMBS
Total Invested Assets $5.5 Billion
Total Portfolio Rating Allocation
Total Portfolio Sector Allocation
(a)
(b)
(a)
(c)
(b)
6

Investment Portfolio Details as of September 30, 2008
Investment Portfolio Details
Total cash and invested assets of $5.5 billion
$4.5 billion Fixed Income Investment Portfolio
Average credit rating of AAA
$2.6 billion of AAA-rated & Agency Structured Fixed Income
Agency MBS $1.2 billion
AAA Non-Agency RMBS $480 million (no subprime)
AAA Non-Agency CMBS $594 million
AAA Auto loan backed $114 million
AAA Credit card backed $109 million
$1.2 billion Government and Agency Debentures
$668 million of Corporate Debt and $104 million of Municipals
Predominately senior indebtedness
Unsecured debt of Financial Institutions - $241 million (59
individual issuers, none greater than $36 million)
High Yield $44 million
Hybrid Perpetual Preferred Equity $40 million
$55 million Below AAA-rated Structured Fixed Income
RMBS $5 million
CMBS $18 million
ABS $32 million
$338 million of Other Investments
Diversified portfolio of hedge funds and high yield bank loan funds
$667 million of Cash and Cash equivalents
Consists primarily of bank deposits, US Government/Agency securities,
and money market funds invested in US Government / Agency
securities
Portfolio Commentary
No exposure to Fannie Mae and Freddie Mac
preferred equity or subordinated debt or any
security issued by Washington Mutual.
No sub-prime mortgage backed securities.
No credit or interest rate derivatives.
Immaterial exposure to other troubled
financial institutions (Lehman- $6.5 million
pre-write down book value, and AIG - $3.5
million pre-write down book value)
Realized losses, other-than-temporary
impairment charges and alternative investment
losses in the 3rd quarter of approximately $70
million and within risk management tolerances
(1.3% of 9/30/08 Cash/Invested Assets and
3.1% of Shareholders equity).
Portfolio experienced $72 million increase
in net unrealized loss during quarter
ended 9/30/08 (1.3% of Cash and
Invested Assets)
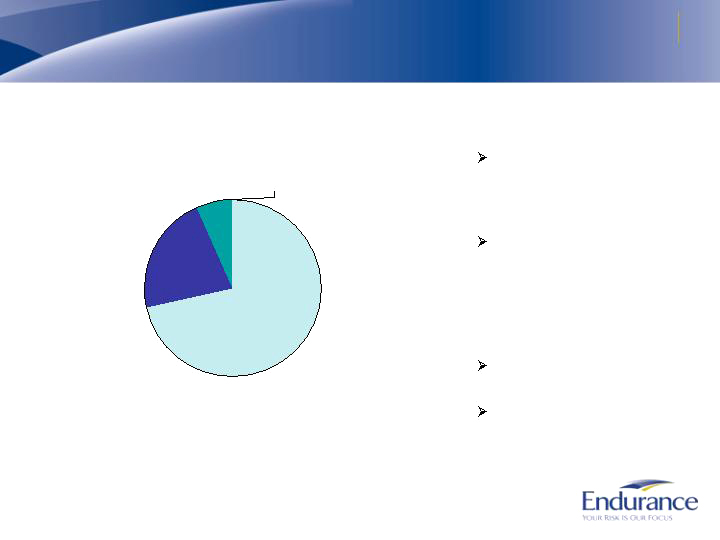
RMBS Portfolio Allocation 09/30/08
US Gov’t Agency-
backed
(FN/FH/GN) 71.5%
AAA Non-Agency
Prime 21.8%
AAA Non-Agency
Alt-A 6.4%
<AAA Non-Agency
0.3%
RMBS Sector Commentary
Primarily US Agency exposure,
backed by Fannie Mae, Freddie
Mac and Ginnie Mae – 72%
Non-agency bonds in the
portfolio are the most senior in
the issue’s capital structure,
protected by significant
subordination
No sub-prime collateral
Less than AAA-rated exposure is
immaterial
Total RMBS $1.7 Billion
8

Conclusion
Endurance has excellent financial strength and liquidity
Strong and stable ratings
High quality assets and exceptional liquidity
Strong and flexible capital base
Enterprise Risk Management is competitive advantage for Endurance
ERM guides underwriting and asset management philosophy
Endurance one of very few insurers to receive “Excellent” ERM rating from
Standard & Poor’s
Endurance ready to meet client needs
Dedicated industry specialists
Stable and consistent market
Underwriting and pricing transparency