
Endurance Specialty Holdings Ltd.
3rd Quarter 2008

2
Forward Looking Statements & Regulation G Disclaimer
Safe Harbor for Forward Looking Statements
Some of the statements in this presentation include forward-looking statements which reflect our current views with respect to future events and financial performance. Such statements include forward-looking statements both with respect to us in general and the insurance and reinsurance sectors specifically, both as to underwriting and investment matters. Statements which include the words “expect,” “intend,” “plan,” “believe,” “project,” “anticipate,” “seek,” “will,” and similar statements of a future or forward-looking nature identify forward-looking statements in this presentation for purposes of the U.S. federal securities laws or otherwise. We intend these forward-looking statements to be covered by the safe harbor provisions for forward-looking statements in the Private Securities Litigation Reform Act of 1995.
All forward-looking statements address matters that involve risks and uncertainties. Accordingly, there are or may be important factors that could cause actual results to differ from those indicated in the forward-looking statements. These factors include, but are not limited to, developments in the world’s financial and capital markets that could adversely affect the performance of Endurance’s investment portfolio or access to capital, changes in the composition of Endurance’s investment portfolio, competition, possible terrorism or the outbreak of war, the frequency or severity of unpredictable catastrophic events, changes in demand for insurance or reinsurance, rating agency actions, uncertainties in our reserving process, a change in our tax status, acceptance of our products, the availability of reinsurance or retrocessional coverage, retention of key personnel, political conditions, the impact of current legislation and regulatory initiatives, changes in accounting policies, changes in general economic conditions and other factors described in our Annual Report on Form 10-K for the year ended December 31, 2007.
Forward-looking statements speak only as of the date on which they are made, and we undertake no obligation publicly to update or revise any forward-looking statement, whether as a result of new information, future developments or otherwise.
Regulation G Disclaimer
In presenting the Company’s results, management has included and discussed certain non-GAAP measures. Management believes that these non-GAAP measures, which may be defined differently by other companies, better explain the Company’s results of operations in a manner that allows for a more complete understanding of the underlying trends in the Company’s business. However, these measures should not be viewed as a substitute for those determined in accordance with GAAP. For a complete description of non-GAAP measures and reconciliations, please review the Investor Financial Supplement on our web site at www.endurance.bm.
The combined ratio is the sum of the loss, acquisition expense and general and administrative expense ratios. Endurance presents the combined ratio as a measure that is commonly recognized as a standard of performance by investors, analysts, rating agencies and other users of its financial information. The combined ratio, excluding prior year net loss reserve development, enables investors, analysts, rating agencies and other users of its financial information to more easily analyze Endurance’s results of underwriting activities in a manner similar to how management analyzes Endurance’s underlying business performance. The combined ratio, excluding prior year net loss reserve development, should not be viewed as a substitute for the combined ratio.
Total premiums written is a non-GAAP internal performance measure used by Endurance in the management of its operations. Total premiums written represents gross premiums written and deposit premiums, which are premiums on contracts that are deemed as either transferring only significant timing risk or transferring only significant underwriting risk and thus are required to be accounted for under GAAP as deposits. Endurance believes these amounts are significant to its business and underwriting process and excluding them distorts the analysis of its premium trends. In addition to presenting gross premiums written determined in accordance with GAAP, Endurance believes that total premiums written enables investors, analysts, rating agencies and other users of its financial information to more easily analyze Endurance’s results of underwriting activities in a manner similar to how management analyzes Endurance’s underlying business performance. Total premiums written should not be viewed as a substitute for gross premiums written determined in accordance with GAAP.
Return on Average Equity (ROAE) is comprised using the average common equity calculated as the arithmetic average of the beginning and ending common equity balances for stated periods. Return on Beginning Equity (ROBE) is comprised using the beginning common equity for stated periods. The Company presents various measures of Return on Equity that are commonly recognized as a standard of performance by investors, analysts, rating agencies and other users of its financial information.

Agenda
Appendix
4.
Review of Financial Results
3.
Financial Strength Summary
2.
Endurance Overview
1.

Endurance Overview
We have a high quality balance
sheet with excellent capitalization,
liquidity and ratings
Financial results have been strong
Endurance is well positioned with a
strong, scaleable and globally
diversified franchise
Established specialty operations in the United
States, Bermuda, United Kingdom,
Continental Europe and Asia
Strong diversification by product line,
geography, and distribution source
We are leveraging our investments in people,
technology and infrastructure to capitalize on
current market opportunities
$2.9 Billion of total capital, with low cost
structure, conservative investments and
reserves, and active capital management
Excellent Liquidity with > $1 Billion of annual
portfolio cash flows and $1.33 Billion of credit
and equity facilities
A (Excellent) ratings from AM Best and S&P.
Endurance received highest ERM ranking of
“Excellent” from Standard & Poor’s
Inception to date annualized ROE of ~14%
Inception to date combined ratio of 92.6%
Diluted Book Value per share
has grown 40% since 2003

Endurances is Well Positioned to Benefit From Market Changes
Drivers of a Hardening Market
Endurance is Poised to Benefit
Industry Capital Position has been
significantly reduced, with increased
appreciation of risk
> $25 Billion of Catastrophe and
large risk losses
$50 - $100+ Billion of
investment portfolio declines
Replacement capital is not
available Reinsurance may
be only capital alternative
Significant impairment of several
large industry participants
Increasing focus on
counterparty risk and limit
concentration
Broader syndication of risk will
result
Florida market changes likely to
create more demand for private
reinsurance
We have exceptional financial
strength, liquidity and capital
resources
Established global reinsurance
operations located throughout the
U.S., U.K., Continental Europe and
Asia.
We have well established insurance
operations located throughout the
U.S., U.K., and Bermuda that are
particularly well positioned in specialty
lines dominated by impaired
competitors
Clients and distribution partners view
Endurance as a “go to” market
We are ready to capitalize on potential
emerging opportunities

Leveraging Our Core Strengths
Focus on business segments that
reward our specialized knowledge
and relationships
Supported by investments in
enabling technology and
disciplined, technical
underwriting approach
Portfolio managed with key risk
management concepts –
diversification, value at risk and data
quality
Portfolio
Management
Technology
and
Discipline
OUR GOAL:
To become the best
specialty insurance
and reinsurance
company in the
world
Capital
Management
Specialization
Actively manage capital to maintain
efficient capital level and enhance
returns on equity
“We’ll know we’ve reached our goal when we
have achieved industry leading returns on
equity over time, share price multiples and
ratings at the top of our peer group and when
we are considered by our employees and
customers as the best in the business.”

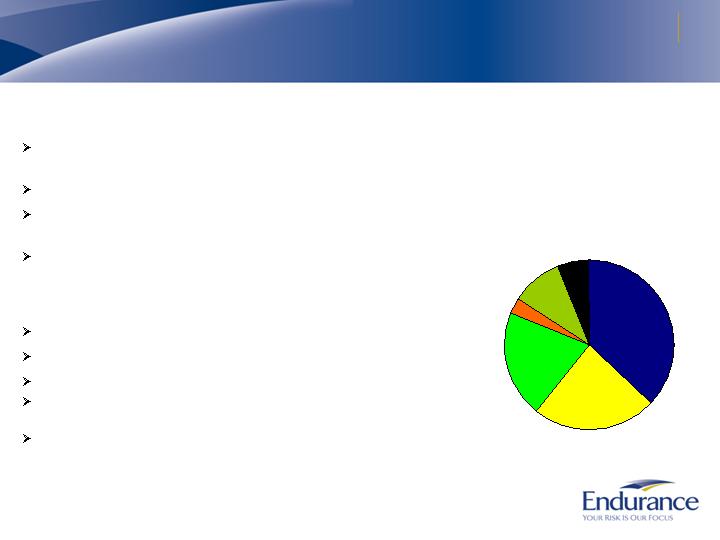
Our Book of Business is Well Diversified
Total Written Premiums of $2.3 Billion*
By Segment
* Includes deposit premiums, based on the 12 months ended September 30, 2008
By Line of Business
Property - Insurance
Property - Reinsurance
Casualty -
Reinsurance
Casualty - Insurance
Healthcare Liability
Workers’
Compensation
Professional Lines
Catastrophe
Agriculture Reinsurance
Aerospace and Marine
Surety and Other Specialty
Agriculture Insurance
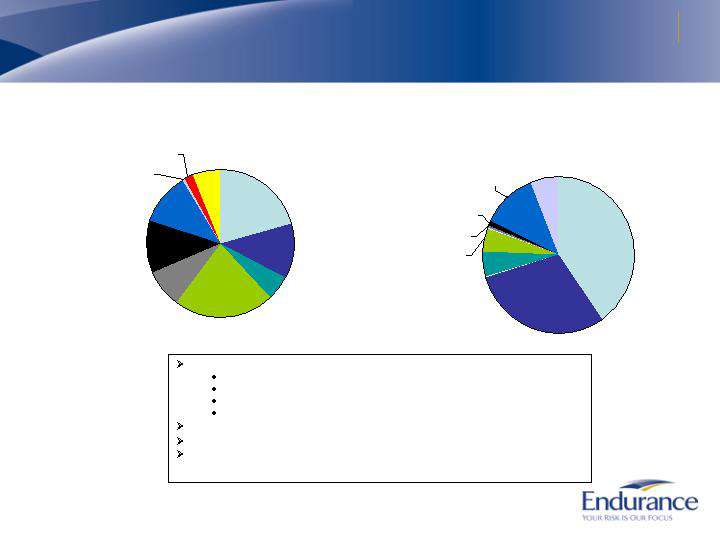
Reinsurance Segment Differentiation
Reinsurance Total Written
Premiums of $849 million*
By Line of Business
* Includes deposit premiums, based on the 12 months ended September 30, 2008
Catastrophe
37.0%
Property
23.4%
Agriculture
3.2%
Casualty
20.6%
Aerospace and Marine
9.7%
Surety and other specialty
6.1%
Endurance differentiates its reinsurance by:
Focusing on clients that are at the forefront of their
specialty
Having industry experts head each business unit
Leading the market in performance of value added claims
and underwriting audits
Strategically located in key global reinsurance markets
(Bermuda, NY, London, Zurich, Singapore)
Property catastrophe business
Leading underwriter of world wide catastrophe risk
Proprietary modeling technology
Cycle exists, but market remains technically driven
Peak exposures include US Wind, CA Earthquake,
European Wind/Flood
Excellent long term profitability even with large cats

Insurance Segment Differentiation
Insurance Total Written
Premiums of $1.4 billion*
By Line of Business
Casualty
8.2%
Professional
Lines
7.9%
Healthcare
Liability
5.9%
Property
10.9%
Workers’
Compensation
18.5%
Agriculture
48.6%
* Based on the 12 months ended September 30, 2008
Technology, expertise and distribution will
allow us to optimize cycle performance
Bermuda
Excess casualty, D&O and healthcare:
Leading market providers
Mature portfolio
Volatile classes of casualty insurance require highly
specialized underwriting and have produced strong
historical results
U.S. Based Insurance
Specialty excess and surplus insurance, workers’
compensation and agriculture
Diversification, capital utilization and return potential
significantly enhanced by ARMtech acquisition
Specialized teams of underwriters added to further
expand and diversify E&S operations
UK Property Business
Lead Market for UK Middle Market Property Insurance
New Construction Unit

Industry Leading Risk Management and Transparency
Enterprise Risk Management has been a focus of Endurance
since inception
Risk management is infused in our culture
Integrated underwriting system measures company wide
exposure at the contract level to identify concentration risk
Significant emphasis placed on pricing, reserving and claims
monitoring
Completion of extensive client audits
Investment portfolio is prudently managed to avoid excess risk
Endurance’s ERM was rated “Excellent” by S&P in 2008
First class of 2001 and youngest company to achieve the
designation
Only 4% of companies in the U.S. and Bermuda have achieved
the top recognition of excellent
Management is committed to providing industry leading
transparency
Detailed investment information provided in financial
supplement and in SEC documents
Complete global loss triangles reported in early February 2008
S&P ERM Scores for North
America and Bermuda Companies
Adequate,
71%
Excellent,
4%
Weak, 5%
Strong,
10%
Adequate
with
Positive
Trend,
10%
Source: Standard and Poor’s (as of April 2008)
10

Agenda
Appendix
4
Review of Financial Results
3
Financial Strength
Summary
2
Endurance Overview
1
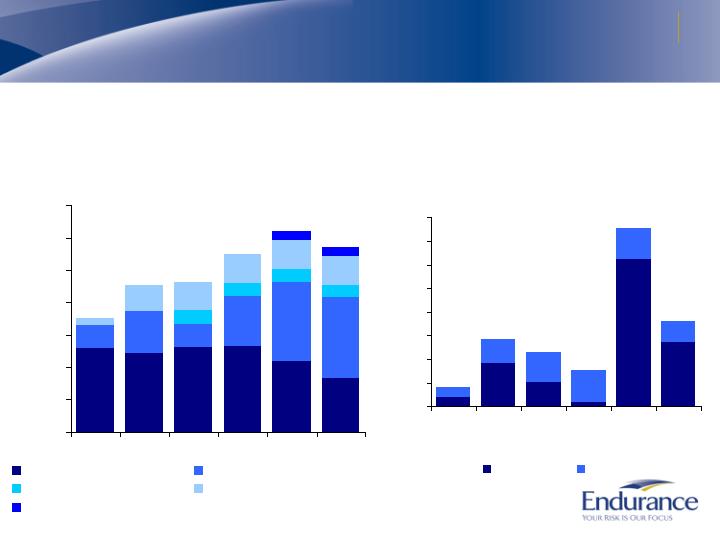
Strong Balance Sheet with Active Capital Management
$1,300
$1,213
$1,309
$1,318
$1,091
$822
$345
$650
$364
$780
$1,221
$1,247
$200
$200
$200
$200
$103
$391
$447
$447
$449
$447
$150
$150
$0
$500
$1,000
$1,500
$2,000
$2,500
$3,000
$3,500
2003
2004
2005
2006
2007
3Q08
Common Share Capital
Retained Earnings
Preferred Equity
Debt
Contingent Equity
Strong and Flexible
Capital Structure
$, Millions
$1,748
$2,254
$2,320
$2,745
$20
$92
$52
$10
$312
$135
$21
$50
$62
$66
$64
$45
$0
$50
$100
$150
$200
$250
$300
$350
$400
2003
2004
2005
2006
2007
3Q08
YTD
Repurchases
Dividends
$, Millions
$1.0 Billion of Capital
Returned to Shareholders
(Inception to date)
$41
$142
$114
$76
$376
$3,111
$2,866
$180
12

Endurance’s Balance Sheet Strength as of September 30, 2008
High quality assets with low counterparty risk
Cash and invested assets of $5.5 Billion (*)
Average credit rating of AAA
Limited investments in troubled financial institutions
Conservative portfolio strategy has protected balance sheet
Very low exposure to reinsurance counterparties or other credit risk
Significant reserve base and careful attention to setting of reserves
Total reserves of $3.3 Billion
IBNR represents 66% of total reserves (> 80% of long tail casualty reserves are
IBNR)
Global schedule P reserve analysis disclosed annually highlights reserve
position and commitment to transparency
Efficient and stable capital structure, with low leverage
Total capital of $2.9 Billion
Common Equity $2.1 Billion
Preferred Equity $0.20 Billion
Long Term Debt $0.45 Billion
Contingent Common Equity $0.15 Billion
Excellent Financial Strength Ratings:
S&P: A (stable) Upgraded December 2006. ERM considered “Excellent”.
AM Best A (stable) Upgraded December 2007.
Moody’s: A2 (stable)
(*) = Includes investments pending settlement, net

Endurance’s Reserve Strength as of September 30, 2008
(in millions)
$106.1
$1,194.8
$302.3
$1,603.2
$1,758.5
$841.5
$840.6
$76.4
Insurance Segment
Reinsurance Segment
Endurance maintains prudent reserve levels*
IBNR represents 66% of company reserves
81% of long tail reserves are IBNR
* Prior to deposit accounting adjustments

Maintain Excellent Liquidity Position
Cash and cash equivalents of $667 million at 9/30/08 (*)
Consists primarily of bank deposits, US Government/Agency securities, and money market
funds invested in US Government / Agency securities
High quality fixed income investment portfolio, including fixed maturity securities,
short term investments and hybrid preferred equities, of $4.5 billion at 9/30/08 with
strong cash flows
Portfolio generates annual principal and interest payments of > $1 billion
Short duration of 3.2 years
$1.2 billion credit facility (matures 2012)
Provides capacity for very low cost borrowings (LIBOR + max of 38 bps) and letters of credit
> $600 million of unused capacity at 9/30/08
Widely syndicated facility with 16 participant banks
$150 million variable forward sale of equity can be drawn upon quickly through 2010
Positive operating cash flows provide additional flexibility
(*) Includes investments pending settlement, net
Investment Portfolio Composition as of September 30, 2008
Cash and Cash
Equivalents 12%
ABS 5%
Agency RMBS 22%
Non-Agency RMBS
9%
CMBS 11%
Government &
Agency 21%
Other Investments
6%
Municipals 2%
Investment Grade
Corporates 11%
High Yield
Corporates 1%
AAA 30%
US
Government
& Agency
40%
Other
Investments
6%
Cash and
Cash
Equivalents
12%
AA 5%
A 5%
BBB 1%
High Yield 1%
Diversified, high quality, short duration fixed income portfolio
Average rating – Aaa/AAA
Duration – 3.2 years
Book Yield – 4.9%
Market yield – 5.6%
No sub-prime mortgage backed securities.
No credit or interest rate derivatives.
No exposure to Fannie Mae and Freddie Mac preferred equity or
subordinated debt or any security issued by Washington Mutual
NOTES: (a) “Other Investments” includes hedge funds and high yield bank loan funds
(b) Includes investments pending settlement, net
(c) Includes agency RMBS
Total Invested Assets $5.5 Billion
Total Portfolio Rating Allocation
Total Portfolio Sector Allocation
(a)
(b)
(a)
(c)
(b)
16

Agenda
Appendix
4
Review of Financial
Results
3
Financial Strength Summary
2
Endurance Overview
1

Strong Financial Performance
Combined Ratio
Annualized Operating
Return on Average Equity
Inception to 9/30/08 combined ratio of 92.6%
Inception to 9/30/08 Operating ROE of 14.2%**
* Composite peer median based on SNL data, Platinum, Allied World, Arch, Ren Re, IPC re, Axis,
Transatlantic, Everest, Partner Re, Montpelier and Max Capital
** Inception to 9/30/08 Net Income ROE of 13.5%.
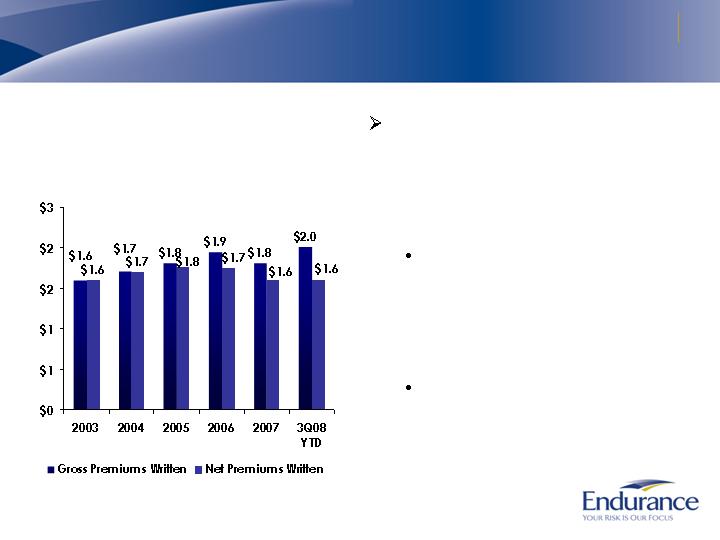
Portfolio Management Has Generated Stable Premiums
Premiums Written*
(in millions)
* Includes deposit premiums
We actively manage the
portfolio by entering new
attractive business while
exiting or reducing premiums
in less attractive lines
Disciplined cycle
management has resulted
in underlying product mix
shifting significantly over
time
Result of active portfolio
and cycle management
and well timed acquisitions
has been stable premiums
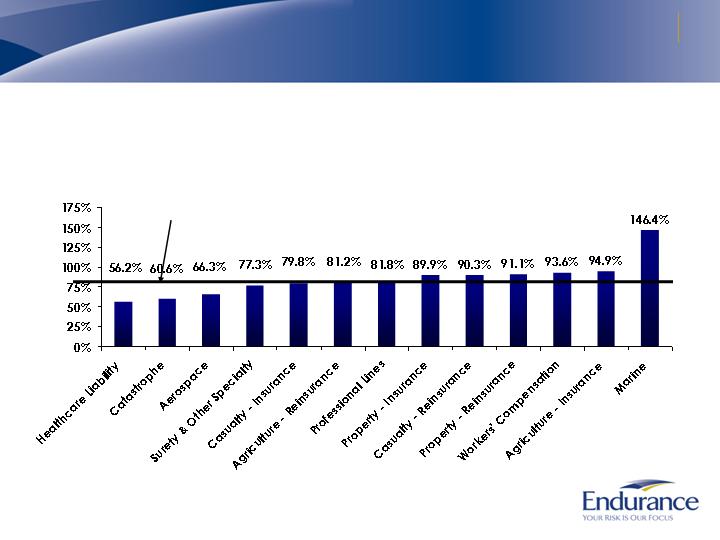
Underwriting Has Been Strong
Inception to Date Underwriting Ratio*
* Underwriting ratio is defined as losses and acquisition expenses divided by earned
premium, from inception through 9/30/08 and is before deposit accounting adjustments.
Inception to Date Underwriting
Ratio is 82.4%*

Delivering Shareholder Value
$, Millions
Fully Diluted Book Value Per
Common Share
$24.03
$27.91
$23.17
$28.87
$35.05
$33.68
Since 2003, fully diluted book value
per share has grown nearly 40%
For the first nine months of 2008,
book value per share has declined
3.9%
Adversely impacted by the hurricanes
and credit markets
Peers* have experienced an average
decline in book value of 4.8% year to
date
Endurance has paid $4.88 per share
in dividends to shareholders since the
beginning of 2003
* Composite peer average based on peer data, Platinum, Allied World, Arch, Ren Re, IPC re, Axis,
Transatlantic, Everest, Partner Re, Montpelier and Max Capital

Conclusion
Endurance is well positioned to take advantage of market opportunities
Our insurance and reinsurance operations are firmly established in
Bermuda, the US, UK, Continental Europe, and Asia
Our infrastructure is scaleable
Experienced underwriters who fully comprehend cycle dynamics
We have a high quality balance sheet with excellent capitalization,
liquidity and ratings
Our clients and brokers see Endurance as source of strength and
transparency and a “go to” market
We have generated strong underwriting and investment returns coupled
with active capital management
Achieved success across market cycles and through periods of historic
catastrophe losses

Agenda
Appendix
4
Review of Financial Results
3
Financial Strength Summary
2
Endurance Overview
1

Appendix – Consolidated Statements of Income - YTD
SEPT. 30, 2008
SEPT. 30, 2007
SEPT. 30, 2006
DEC. 31, 2007
DEC. 31, 2006
UNDERWRITING REVENUES
Gross premiums written
$2,010,798
$1,503,365
$1,498,847
$1,781,115
$1,789,642
Premiums ceded
(406,603)
(143,858)
(161,738)
(206,140)
(204,078)
Net premiums written
$1,604,195
$1,359,507
$1,337,109
$1,574,975
$1,585,564
Change in unearned premiums
(269,438)
(165,169)
(102,250)
19,825
53,010
Net premiums earned
$1,334,757
$1,194,338
$1,234,859
$1,594,800
$1,638,574
Other underwriting (loss) income
(1,519)
(7,442)
(328)
1,602
1,390
Total underwriting revenues
$1,333,238
$1,186,896
$1,234,531
$1,596,402
$1,639,964
UNDERWRITING EXPENSES
Losses and loss expenses
$910,328
$604,229
$696,210
$749,081
$827,630
Acquisition expenses
220,608
218,075
236,302
307,576
317,489
General and administrative expenses
160,308
152,614
138,494
217,269
190,373
Total underwriting expenses
$1,291,244
$974,918
$1,071,006
$1,273,926
$1,335,492
Underwriting income
$41,994
$211,978
$163,525
$322,476
$304,472
OTHER OPERATING REVENUE
Net investment income
$134,770
$215,966
$185,416
$281,276
$257,449
Interest expense
(22,603)
(22,593)
(22,513)
(30,125)
(30,041)
Amortization of intangibles
(7,913)
(3,381)
(3,474)
(5,286)
(4,600)
Total other operating revenue
$104,254
$189,992
$159,429
$245,865
$222,808
INCOME BEFORE OTHER ITEMS
$146,248
$401,970
$322,954
$568,341
$527,280
OTHER
Net foreign exchange (losses) gains
($12,963)
($1,241)
$11,250
($7,970)
$21,021
Net realized losses on investments
(45,566)
(14,177)
(18,434)
(18,302)
(20,342)
Income tax expense
(5,962)
(17,975)
(16,454)
(20,962)
(29,833)
NET INCOME
$81,757
$368,577
$299,316
$521,107
$498,126
Diluted earnings per common share
$1.10
$5.02
$4.03
$7.17
$6.73
YEAR ENDED
NINE MONTHS ENDED
24

Appendix – Consolidated Balance Sheets
SEPT. 30, 2008
JUNE 30, 2008
MAR. 31, 2008
DEC. 31, 2007
SEPT. 30, 2007
ASSETS
Cash and cash equivalents
$514,875
$656,158
$549,692
$567,825
$600,042
Fixed income investments available for sale, at fair value
(1)
4,398,816
4,604,653
4,710,467
4,647,590
4,791,313
Short term investments available for sale, at fair value
136,624
---
---
12,646
12,495
Other investments
338,151
366,886
369,347
358,128
343,926
Premiums receivable, net
1,130,184
1,101,610
1,088,998
723,832
768,162
Deferred acquisition costs
202,912
194,390
184,646
168,968
212,000
Securities lending collateral
134,256
153,062
241,343
173,041
195,727
Prepaid reinsurance premiums
205,284
205,454
268,442
122,594
92,466
Losses recoverable
281,074
270,053
150,665
187,354
96,008
Accrued investment income
32,893
37,930
33,650
38,543
36,075
Goodwill and intangible assets
202,682
205,635
208,202
206,632
69,388
Deferred tax assets
31,978
14,788
17,702
---
46,926
Receivable on pending investment sales
196,481
2,070
2,131
3,209
81,546
Other assets
63,002
73,667
50,630
60,791
50,852
TOTAL ASSETS
$7,869,212
$7,886,356
$7,875,915
$7,271,153
$7,396,926
LIABILITIES
Reserve for losses and loss expenses
$3,278,934
$3,080,274
$2,928,427
$2,892,224
$2,841,810
Reserve for unearned premiums
1,201,292
1,222,830
1,269,318
855,085
999,046
Deposit liabilities
85,701
89,718
105,115
108,943
130,272
Reinsurance balances payable
320,615
272,901
224,223
162,899
153,815
Securities lending payable
135,853
153,062
241,343
173,041
195,727
Debt
447,413
448,793
448,978
448,753
447,235
Payable on penidng investment purchases
44,621
3,902
704
426
28,485
Deferred tax liability
---
---
---
922
---
Other liabilities
86,066
80,981
119,633
116,601
74,915
TOTAL LIABILITIES
$5,600,495
$5,352,461
$5,337,741
$4,758,894
$4,871,305
TOTAL SHAREHOLDERS’ EQUITY
$2,268,717
$2,533,895
$2,538,174
$2,512,259
$2,525,621
TOTAL LIABILITIES AND SHAREHOLDERS’ EQUITY
$7,869,212
$7,886,356
$7,875,915
$7,271,153
$7,396,926
check
Book value per common share
$36.55
$39.97
$39.83
$38.94
$36.21
Diluted book value per common share (treasury stock method)
$33.68
$36.72
$36.00
$35.05
$32.81
25

Appendix – Total Gross Written Premiums by Line of
Business
SEPT. 30, 2008
SEPT. 30, 2007
SEPT. 30, 2006
DEC. 31, 2007
DEC. 31, 2006
INSURANCE SEGMENT
Property
$119,116
$96,256
$129,024
$134,161
$173,292
Casualty
107,642
99,273
92,957
125,124
128,933
Healthcare liability
69,987
77,105
89,921
92,361
106,988
Workers’ compensation
195,076
189,173
31,424
262,228
93,779
Agriculture
660,193
-
-
42,242
-
Professional lines
78,029
63,239
52,835
85,440
73,753
TOTAL INSURANCE
$1,230,043
$525,046
$396,161
$741,556
$576,745
REINSURANCE SEGMENT
Casualty
$159,434
$185,730
$349,700
$201,032
$400,111
Property
184,214
214,584
296,713
228,796
318,883
Catastrophe
301,277
331,689
272,843
345,187
291,755
Agriculture
20,185
124,095
109,228
131,325
107,104
Aerospace and Marine
70,600
81,223
154,064
92,882
180,203
Surety and other specialty
47,382
64,754
72,028
68,892
73,833
TOTAL REINSURANCE
$783,092
$1,002,075
$1,254,576
$1,068,114
$1,371,889
TOTAL COMPANY SUBTOTAL
$2,013,135
$1,527,121
$1,650,737
$1,809,670
$1,948,634
DEPOSIT ACCOUNTING ADJUSTMENT
[a]
(2,337)
(23,756)
(151,890)
(28,555)
(158,992)
REPORTED TOTALS
$2,010,798
$1,503,365
$1,498,847
$1,781,115
$1,789,642
FOR THE NINE MONTHS ENDED
FOR THE YEARS ENDED
[a]
For internal management reporting purposes, underwriting results by segment are presented on the basis of applying reinsurance accounting to all reinsurance contracts written. However, for financial statement presentation purposes, management determined that certain reinsurance contracts written during the period were more appropriately accounted for under the deposit method of accounting specified by AICPA SOP 98-7 whereby net premiums due on such contracts were recorded as deposit liabilities. The adjustment herein reconciles the Company’s gross premiums written by segment to the Company’s financial statement presentation.
26

Appendix – Consolidated Segment Data
Total
Deposit
Company
Accounting
Reported
Insurance
Reinsurance
Sub-total
Adjustment [a]
Totals
UNDERWRITING REVENUES
Gross premiums written
$1,230,043
$783,092
$2,013,135
($2,337)
$2,010,798
Net premiums written
$839,132
$767,400
$1,606,532
($2,337)
$1,604,195
Net premiums earned
$683,662
$656,712
$1,340,374
($5,617)
$1,334,757
Other underwriting loss
---
---
---
(1,519)
(1,519)
Total underwriting revenues
$683,662
$656,712
$1,340,374
($7,136)
$1,333,238
UNDERWRITING EXPENSES
Losses and loss expenses
$513,598
$405,451
$919,049
($8,721)
$910,328
Acquisition expenses
76,182
143,185
219,367
1,241
220,608
General and administrative expenses
77,308
83,000
160,308
---
160,308
Total expenses
$667,088
$631,636
$1,298,724
($7,480)
$1,291,244
UNDERWRITING INCOME
$16,574
$25,076
$41,650
$344
$41,994
GAAP RATIOS
Loss ratio
75.1%
61.7%
68.6%
155.3%
68.2%
Acquisition expense ratio
11.2%
21.8%
16.4%
(22.1)%
16.5%
General and administrative expense ratio
11.3%
12.7%
11.9%
---
12.0%
Combined ratio
97.6%
96.2%
96.9%
133.2%
96.7%
For the nine months ended September 30, 2008
[a]
For internal management reporting purposes, underwriting results by segment are presented on the basis of applying reinsurance accounting to all reinsurance contracts written. However, for financial statement presentation purposes, management determined that certain reinsurance contracts written during the period were more appropriately accounted for under the deposit method of accounting specified by AICPA SOP 98-7 whereby net premiums due on such contracts were recorded as
deposit liabilities. The adjustment herein reconciles the Company’s underwriting results by segment to the Company’s financial statement presentation.
27
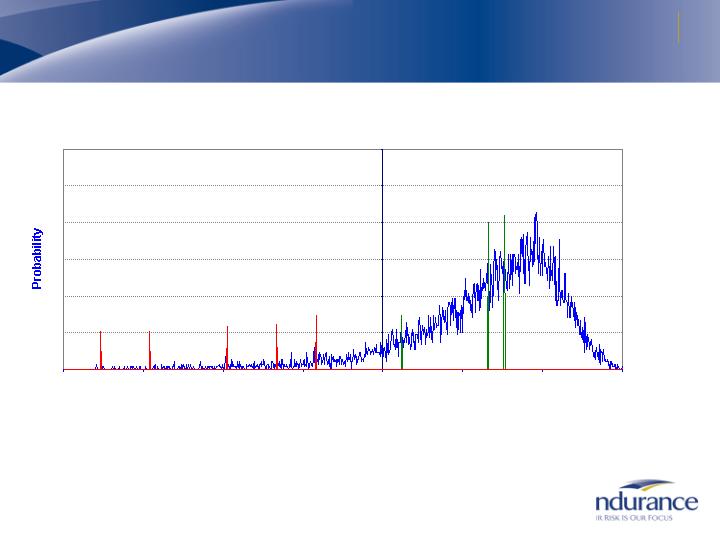
The above chart represents a cumulative analysis of our in-force underwriting portfolio on a full year basis based on thousands of potential
scenarios. Loss years are driven largely by the occurrence of natural catastrophes and incorrect pricing of other property and casualty exposures.
The operating income depicted includes net premiums earned plus net investment income, acquisition expenses and G&A expenses. The
operating income depicted excludes the effects of income tax (expenses) benefits, amortization of intangibles and interest expense. Forecasted
investment income, acquisition and G&A expenses are held constant across all scenarios. Losses included above are net of reinsurance. Our
stated objective is to maintain a risk management tolerance that limits our loss in a 1-in-100 year year to be no more than 25% of our shareholders’
equity.
Changes in Endurance’s underwriting portfolio, investment portfolio, risk control mechanisms, market conditions and other factors may cause actual
results to vary considerably from those indicated by our value at risk curve. For a listing of risks related to Endurance and its future performance,
please see “Risk Factors” in our Annual Report on Form 10-K for the year ended December 31, 2007 and in our Quarterly Report on Form 10-Q for
the quarter ended September 30, 2008.
Appendix – Annual Aggregate Risk Curve
Endurance Operating Income Profile
as of July 1, 2008
-1000
-750
-500
-250
0
250
500
750
Operating Result - $ Millions
1-in-500
Year
$882 Mil
Loss
1-in-250
Year
$729 Mil
Loss
1-in-100
Year
$487 Mil
Loss
1-in-50
Year
$330 Mil
Loss
1-in-25
Year
$209 Mil
Loss
1-in-10
Year
$61 Mil
Gain
Average
Result
$330 Mil
Gain
Median
Result
$380 Mil
Gain
28

Appendix - Investment Portfolio Details as of September 30, 2008
Investment Portfolio Details
Total cash and invested assets of $5.5 billion
$4.5 billion Fixed Income Investment Portfolio
Average credit rating of AAA
$2.6 billion of AAA-rated & Agency Structured Fixed Income
Agency MBS $1.2 billion
AAA Non-Agency RMBS $480 million (no subprime)
AAA Non-Agency CMBS $594 million
AAA Auto loan backed $114 million
AAA Credit card backed $109 million
$1.2 billion Government and Agency Debentures
$668 million of Corporate Debt and $104 million of Municipals
Predominately senior indebtedness
Unsecured debt of Financial Institutions - $241 million (59
individual issuers, none greater than $36 million)
High Yield $44 million
Hybrid Perpetual Preferred Equity $40 million
$55 million Below AAA-rated Structured Fixed Income
RMBS $5 million
CMBS $18 million
ABS $32 million
$338 million of Other Investments
Diversified portfolio of hedge funds and high yield bank loan funds
$667 million of Cash and Cash equivalents
Consists primarily of bank deposits, US Government/Agency securities,
and money market funds invested in US Government / Agency securities
Portfolio Commentary
No exposure to Fannie Mae and Freddie
Mac preferred equity or subordinated debt
or any security issued by Washington
Mutual.
No sub-prime mortgage backed securities.
No credit or interest rate derivatives.
Immaterial exposure to other troubled
financial institutions (Lehman- $6.5 million
pre-write down book value, and AIG - $3.5
million pre-write down book value)
Realized losses, other-than-temporary
impairment charges and alternative
investment losses in the 3 rd quarter of
approximately $70 million and within risk
management tolerances (1.3% of 9/30/08
Cash/Invested Assets and 3.1% of
Shareholders equity).
Portfolio experienced $72 million increase
in net unrealized loss during quarter ended
9/30/08 (1.3% of Cash and Invested
Assets)

Appendix – Twenty-Five Largest Corporate Holdings
As of September 30, 2008
Amortized
Unrealized
Credit
ISSUER (1) (2) (4)
Cost
Fair Value
Gain (Loss)
Quality (3)
CITIGROUP INC
$35,519
$33,416
($2,032)
AA
JPMORGAN CHASE & CO
25,767
24,620
(1,147)
A
WELLS FARGO & COMPANY
23,077
22,766
(311)
AA
PRUDENTIAL FINANCIAL INC
20,969
20,653
(316)
A
AUSTRALIA AND NEW ZEALAND BANKING GROUP LIMITED
19,150
18,323
(1,113)
A
ORACLE CORPORATION
17,634
17,128
(506)
A
ING GROEP NV
15,909
14,673
(1,236)
A
GENERAL ELECTRIC CO
15,434
14,297
(1,349)
AAA
HBOS PLC
15,714
13,573
(1,965)
A
ROYAL BANK OF SCOTLAND GROUP PLC
15,951
13,507
(2,390)
A
VERIZON COMMUNICATIONS INC.
13,715
13,397
(318)
A
HSBC HOLDINGS PLC
13,933
13,291
(643)
AA
AT&T INC
12,909
12,798
(111)
A
VODAFONE GROUP PLC
12,595
12,459
(136)
A
BANK OF AMERICA CORP
11,329
10,940
(513)
AA
SIEMENS AG
9,412
9,436
24
AA
MIDAMERICAN ENERGY COMPANY
8,622
8,586
(37)
A
METLIFE INC
8,519
8,315
(231)
AA
DEERE & CO
8,046
8,162
116
A
ASTRAZENECA PLC
8,164
8,083
(77)
AA
CISCO SYSTEMS, INC.
8,216
8,033
(183)
A
GENWORTH FINANCIAL INC.
9,000
7,920
(1,080)
A
GOLDMAN SACHS GROUP INC/THE
8,743
7,784
(959)
AA
TOTAL SA
6,848
6,942
22
AA
HARTFORD FINANCIAL SERVICES GROUP
6,478
6,399
(79)
A
(1) Corporate issuers exclude government-backed, government-sponsored enterprises, covered bonds and cash and cash equivalents.
(2) Credit exposures represent only direct exposure to fixed maturities and short term investments of the parent issuer and its major subsidiaries.
These exposures exclude asset and mortgage-backed securities that were issued, sponsored or serviced by the parent.
(3) Represents weighted average credit quality of underlying issues.
(4) Excludes fixed income preferred securities.
30

Appendix – Operating Income (Loss) Reconciliation
QUARTERS ENDED
NINE MONTHS ENDED
SEPTEMBER 30,
SEPTEMBER 30,
2008
2007
2008
2007
Net (loss) income
($99,392)
$131,401
$81,757
$368,577
Add (Less) after-tax items:
Net foreign exchange losses (gains)
15,400
(546)
12,798
(918)
Net realized losses on investments
27,934
3,013
43,456
12,583
Operating (loss) income before preferred dividends
($56,058)
$133,868
$138,011
$380,242
Preferred dividends
(3,875)
(3,875)
(11,625)
(11,625)
Operating (loss) income (attributable) available
to common shareholders
($59,933)
$129,993
$126,386
$368,617
Weighted average common shares outstanding
Basic
57,570
64,468
58,314
65,530
Dilutive
57,570
70,431
63,633
71,126
Basic per common share data
Net (loss) income available to common shareholders
($1.79)
$1.98
$1.20
$5.45
Add (Less) after-tax items:
Net foreign exchange losses (gains)
0.27
(0.01)
0.22
(0.01)
Net realized losses on investments
0.48
0.05
0.75
0.19
Operating (loss) income (attributable) available
to common shareholders
($1.04)
$2.02
$2.17
$5.63
Diluted per common share data
Net (loss) income available to common shareholders
($1.79)
$1.81
$1.10
$5.02
Add (Less) after-tax items:
Net foreign exchange losses (gains)
0.27
---
0.20
(0.01)
Net realized losses on investments
0.48
0.04
0.69
0.17
Operating (loss) income (attributable) available
to common shareholders
($1.04)
$1.85
$1.99
$5.18
Earnings Per Share Information – As Reported, GAAP
31

Appendix – Book Value Per Share
DEC. 31,
2008
2007
2007
DILUTIVE COMMON
Price per share at period end
$30.92
$41.55
$41.73
SHARES OUTSTANDING:
AS-IF CONVERTED [a]
Basic common shares outstanding
[b]
56,597
64,223
59,384
Add: unvested restricted shares and restricted share units
1,098
1,039
1,041
Add: dilutive warrants outstanding
5,595
7,202
7,095
Weighted average exercise price per share
$15.12
$16.12
$15.87
Add: dilutive options outstanding
2,012
2,169
2,045
Weighted average exercise price per share
$17.68
$18.18
$18.12
Book Value
[c]
$2,068,717
$2,325,621
$2,312,259
Add: proceeds from converted warrants
84,596
116,102
112,593
Add: proceeds from converted options
35,572
39,439
37,059
Pro forma book value
$2,188,885
$2,481,162
$2,461,911
Dilutive shares outstanding
65,302
74,634
69,564
Basic book value per common share
$36.55
$36.21
$38.94
Diluted book value per common share
$33.52
$33.24
$35.39
DILUTIVE COMMON
Price per share at period end
$30.92
$41.55
$41.73
SHARES OUTSTANDING:
TREASURY STOCK
Basic common shares outstanding
[b]
56,597
64,223
59,384
METHOD
Add: unvested restricted shares and restricted share units
1,098
1,039
1,041
Add: dilutive warrants outstanding
5,595
7,202
7,095
Weighted average exercise price per share
$15.12
$16.12
$15.87
Less: warrants bought back via treasury method
(2,736)
(2,794)
(2,698)
Add: dilutive options outstanding
2,012
2,169
2,045
Weighted average exercise price per share
$17.68
$18.18
$18.12
Less: options bought back via treasury method
(1,151)
(950)
(889)
Dilutive shares outstanding
61,415
70,891
65,978
Basic book value per common share
$36.55
$36.21
$38.94
Diluted book value per common share
$33.68
$32.81
$35.05
SEPTEMBER 30,
[a]
The as-if converted method assumes that the proceeds received upon exercise of options and warrants will be retained by the Company and the resulting common shares from exercise will remain outstanding.
[b]
Basic common shares includes vested restricted share units.
[c]
Excludes the $200 million liquidation value of the preferred shares.
32