
Investor Presentation

Forward looking statements & regulation G disclaimer
Safe Harbor for Forward Looking Statements
Some of the statements in this presentation include forward-looking statements which reflect our current views with respect to future events and financial performance. Such
statements include forward-looking statements both with respect to us in general and the insurance and reinsurance sectors specifically, both as to underwriting and investment
matters. Statements which include the words “expect,” “intend,” “plan,” “believe,” “project,” “anticipate,” “seek,” “will,” and similar statements of a future or forward-looking nature
identify forward-looking statements in this presentation for purposes of the U.S. federal securities laws or otherwise. We intend these forward-looking statements to be covered by
the safe harbor provisions for forward-looking statements in the Private Securities Litigation Reform Act of 1995.
All forward-looking statements address matters that involve risks and uncertainties. Accordingly, there are or may be important factors that could cause actual results to differ from
those indicated in the forward-looking statements. These factors include, but are not limited to, developments in the world’s financial and capital markets that could adversely
affect the performance of Endurance’s investment portfolio or access to capital, changes in the composition of Endurance’s investment portfolio, competition, possible terrorism or
the outbreak of war, the frequency or severity of unpredictable catastrophic events, changes in demand for insurance or reinsurance, rating agency actions, uncertainties in our
reserving process, a change in our tax status, acceptance of our products, the availability of reinsurance or retrocessional coverage, retention of key personnel, political
conditions, the impact of current legislation and regulatory initiatives, changes in accounting policies, changes in general economic conditions and other factors described in our
most recent Annual Report on Form 10-K.
Forward-looking statements speak only as of the date on which they are made, and we undertake no obligation publicly to update or revise any forward-looking statement,
whether as a result of new information, future developments or otherwise.
Regulation G Disclaimer
In presenting the Company’s results, management has included and discussed certain non-GAAP measures. Management believes that these non-GAAP measures, which may
be defined differently by other companies, better explain the Company’s results of operations in a manner that allows for a more complete understanding of the underlying trends
in the Company’s business. However, these measures should not be viewed as a substitute for those determined in accordance with GAAP. For a complete description of non-
GAAP measures and reconciliations, please review the Investor Financial Supplement on our web site at www.endurance.bm.
The combined ratio is the sum of the loss, acquisition expense and general and administrative expense ratios. Endurance presents the combined ratio as a measure that is
commonly recognized as a standard of performance by investors, analysts, rating agencies and other users of its financial information. The combined ratio, excluding prior year
net loss reserve development, enables investors, analysts, rating agencies and other users of its financial information to more easily analyze Endurance’s results of underwriting
activities in a manner similar to how management analyzes Endurance’s underlying business performance. The combined ratio, excluding prior year net loss reserve
development, should not be viewed as a substitute for the combined ratio.
Net premiums written (prior to deposit accounting adjustments) is a non-GAAP internal performance measure used by Endurance in the management of its operations. Net
premiums written (prior to deposit accounting adjustments) represents net premiums written and deposit premiums, which are premiums on contracts that are deemed as either
transferring only significant timing risk or transferring only significant underwriting risk and thus are required to be accounted for under GAAP as deposits. Endurance believes
these amounts are significant to its business and underwriting process and excluding them distorts the analysis of its premium trends. In addition to presenting gross premiums
written determined in accordance with GAAP, Endurance believes that net premiums written (prior to deposit accounting adjustments) enables investors, analysts, rating agencies
and other users of its financial information to more easily analyze Endurance’s results of underwriting activities in a manner similar to how management analyzes Endurance’s
underlying business performance. Net premiums written (prior to deposit accounting adjustments) should not be viewed as a substitute for gross premiums written determined in
accordance with GAAP.
Return on Average Equity (ROAE) is comprised using the average common equity calculated as the arithmetic average of the beginning and ending common equity balances for
stated periods. Return on Beginning Equity (ROBE) is comprised using the beginning common equity for stated periods. The Company presents various measures of Return on
Equity that are commonly recognized as a standard of performance by investors, analysts, rating agencies and other users of its financial information.
2

Investor value proposition
Deep expertise across business units
Specialty focus and strong diversification has the
potential to generate higher returns for shareholders,
with lower volatility
Strong balance sheet supported by conservative
investment portfolio and prudent reserve balances
Meaningfully improved the risk management and
diversification of our business over the past three
years
Proven track record of success: superior ROE,
underwriting expertise, extensive distribution
capabilities, risk management culture
Well positioned to fill gaps left by weakened
incumbents
Established global specialty franchise with full
range of capabilities
0%
20%
40%
60%
80%
100%
120%
140%
5%
10%
15%
20%
25%
Price/Book vs. ROE
3-year average operating ROAE
Endurance
1.
Common stock price as a percentage of book value per share as of March 31, 2009
Note: Composite peer median based on SNL data. Includes Allied World, Arch, Ren Re, IPC Re, Axis, Transatlantic, Everest, Partner Re,
Montpelier, Platinum and Max Capital
Compelling
investment
opportunity
We believe Endurance offers investors significant upside potential
3
Introduction to Endurance Specialty Holdings
Strong Market Positioning
Widely diversified, global specialty insurance and reinsurance provider
Over 700 employees in global offices across the United States, Bermuda, Europe, and Asia
Domiciled in Bermuda
Traded on the New York Stock Exchange (ENH)
Excellent Operating Results
14.1% annualized operating ROE since inception
10.7% annualized growth in book value per share plus dividends since inception
92.2% combined ratio inception to date
Solid Financial Foundation
Excellent financial strength with nearly $7.8 BN in assets, $2.7 BN in total capital and $2.3
BN in shareholders’ equity as of March 31, 2009
High quality, liquid investment portfolio
Prudent loss reserves
Rated “A” by A.M. Best and Standard and Poor’s and A2 by Moody’s with stable outlooks
Received the highest ERM ranking of “Excellent” from Standard and Poor’s
Endurance is poised to generate superior returns on equity over time
4
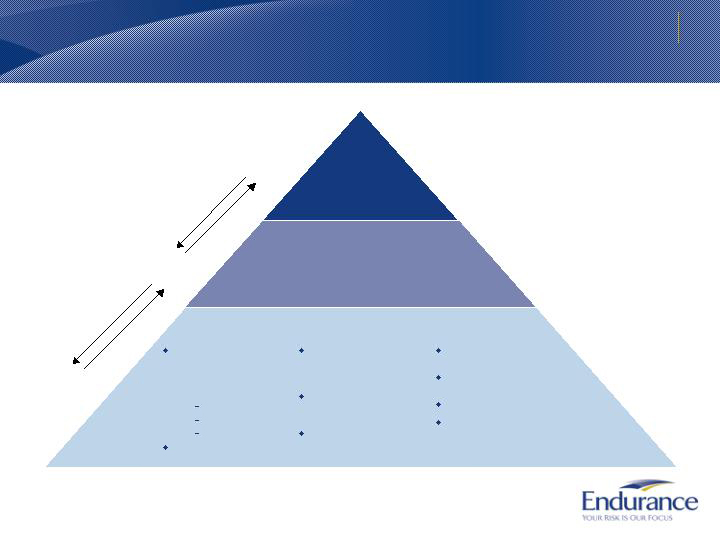
Our strategy is focused on delivering superior results for shareholders
Our vision
Our commitments
Our strategy
Growth in book value
Superior returns on equity across underwriting cycles
Ethics, integrity, and transparency
To become
the best specialty
insurance and
reinsurance company
in the world
Growth through
specialization
Maximizing returns through
focused portfolio
management
Balance sheet
strength and durability
Aggressively deploy capital to
opportunities where we can
maintain a competitive
advantage based on
specialized:
Products
Technology
Distribution
Invest to ensure that business
model is scalable
Manage pricing cyclicality
through broad access to
distribution and focus on
returns-based underwriting
Manage loss volatility through
a diversified portfolio of
businesses
Leverage strengths across the
businesses, e.g. dynamic
capital allocation
Maintain strong balance sheet
and reserves
Nurture conservative risk
culture
Leverage best-in-class ERM
Employ disciplined capital
management across our
underwriting and investment
activities
5
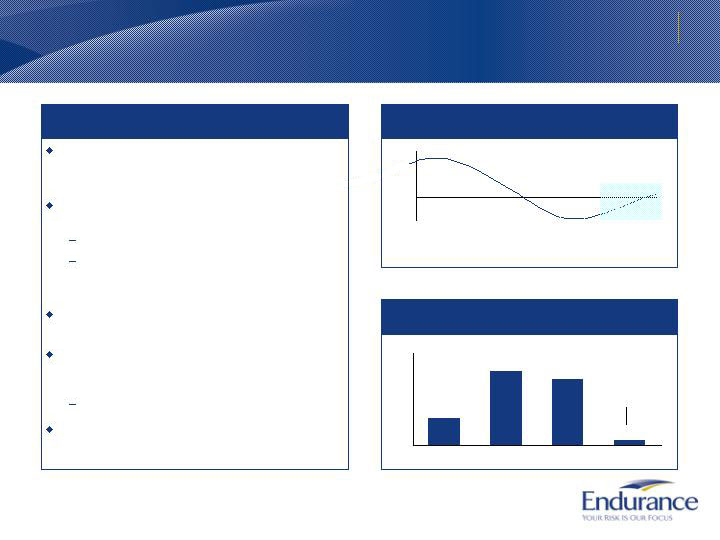
More attractive margins
Better retention driven by deeper relationships
and expertise
High barriers to entry
Stable earnings
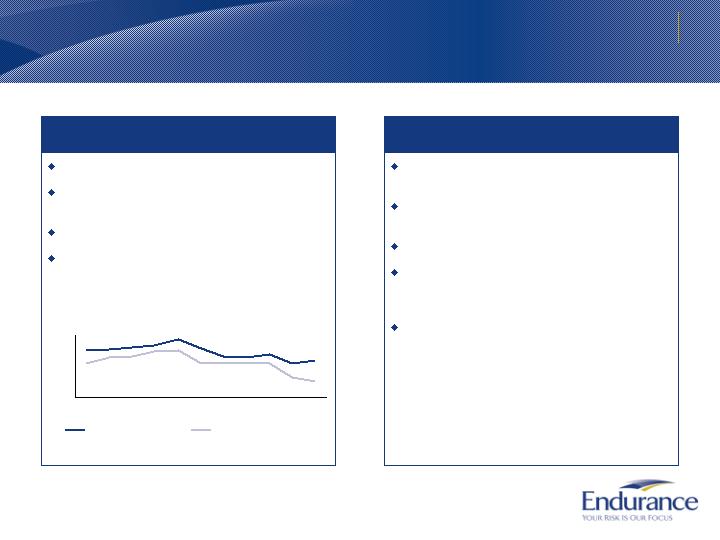
How specialization leads to success
Why Endurance is well-positioned to succeed
Deep underwriting knowledge of markets and
distribution across major specialty lines
Technological advantage which improves our
pricing ability and efficiency
Customized operating model by market type
Active portfolio management to deploy and
retract capital in response to changing
market conditions
Strong balance sheet positions us well to
compete, particularly against those who
have faltered
Source: AM Best US Surplus Lines, 2008 Market Review
60%
80%
100%
120%
1997
1999
2001
2003
2005
2007
Industry combined ratio
Surplus Lines combined ratio
One example of the success of specialization:
Excess and surplus lines outperform the overall
P&C industry
Growth through specialization
Specialty businesses are an attractive market where Endurance is well-poised to succeed
6
Rapid entry into workers’ compensation as the
market became attractive in 2006; managed
exit from the business as margins tightened
in 2008
Exiting the UK property business when it
did not meet our business mix and
profitability requirements
Introduction of surety, aerospace, and
agriculture businesses which have different
risk profiles than catastrophe to create a more
diversified portfolio
Exiting offshore energy and national property
accounts in 2005 following Katrina, given
unanticipated volatility and lack of model
clarity; decision validated by 2008 results
Maximizing returns through focused portfolio management
Levers we employ in portfolio management
Thoughtfully but aggressively entering markets
when conditions are attractive
Diversify risks through the introduction of low
correlation businesses
Actively monitor and react to changing market
conditions
Reduce exposures during soft markets
Increase/decrease the amount of ceded
business as necessary
Exit selected business lines when
fundamentals dictate doing so
Some examples
While growing through specialization and building robust businesses that withstand both hard and
soft cycles, we also maximize our returns through active portfolio management
Organizational agility underpins our ability to allocate capital dynamically
7
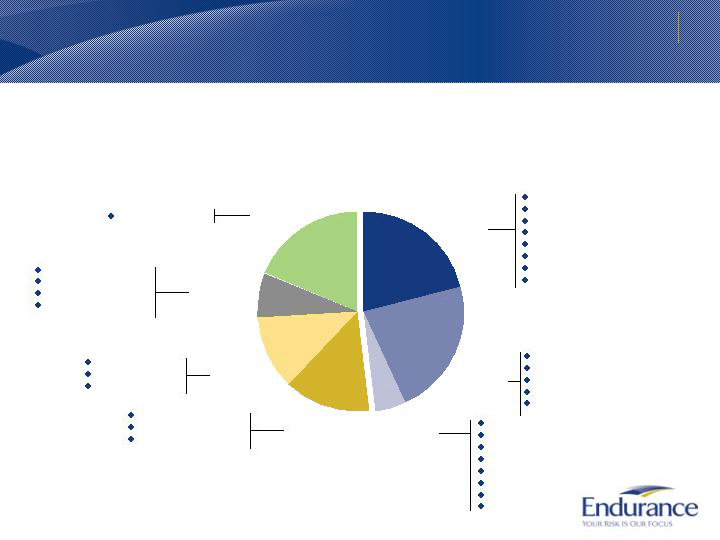
Business overview
Endurance’s business units
2008 Net premiums written: $1.78 BN
Reinsurance
Insurance
Agriculture
Personal Accident
Surety
Casualty & Workers’ Compensation
Professional Liability
Property Per Risk
Small Business
Direct Treaty
Aerospace
Casualty Clash
International Property Catastrophe
US Property Catastrophe
Workers’ Compensation Catastrophe
ARMtech Agriculture
US Property
US Casualty
US Miscellaneous E&O
UK Property
Healthcare
Excess Casualty
Professional Lines
Workers’ Compensation
Habitational
Environmental
International
5%
Fortune 1000
12%
Middle Market
12%
21%
Bermuda
21%
US
19%
Program
10%
Casualty
Marine
Motor
Personal Accident
Professional Indemnity
Property
Surety
Trade Credit
Small Risk
8
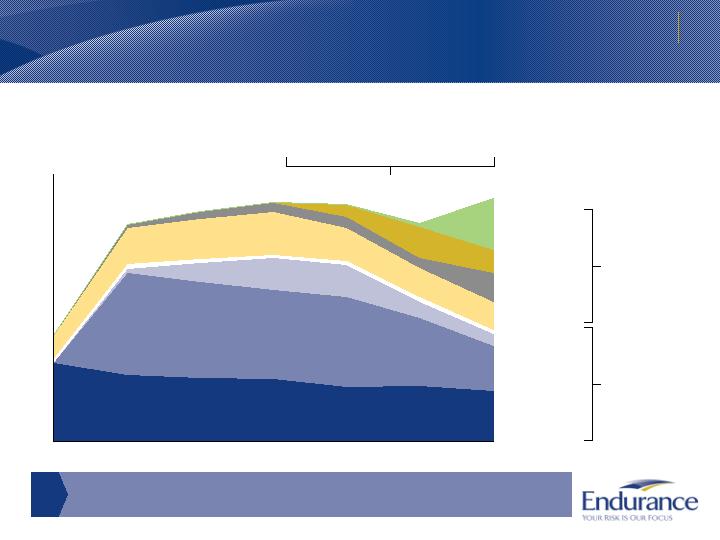
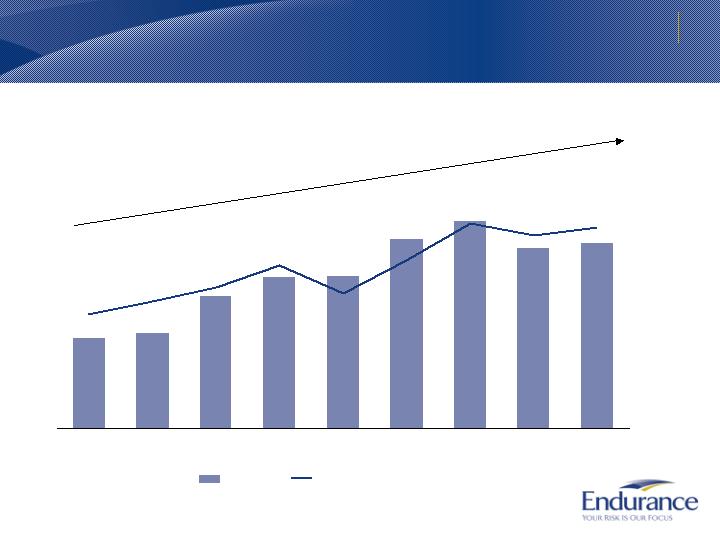
Endurance is expanding its capabilities into a range of attractive businesses
2002
2003
2004
2005
2006
2007
2008
Growth curve of our business1
2002-2008
1. Based on net premiums written
Small Risk
Program
Middle Market
International
Fortune 1000
US
Bermuda
Reinsurance
Insurance
Meaningfully improved risk
management and diversification
of our business since 2005
We have successfully identified new opportunities while remaining
disciplined in softening markets
9
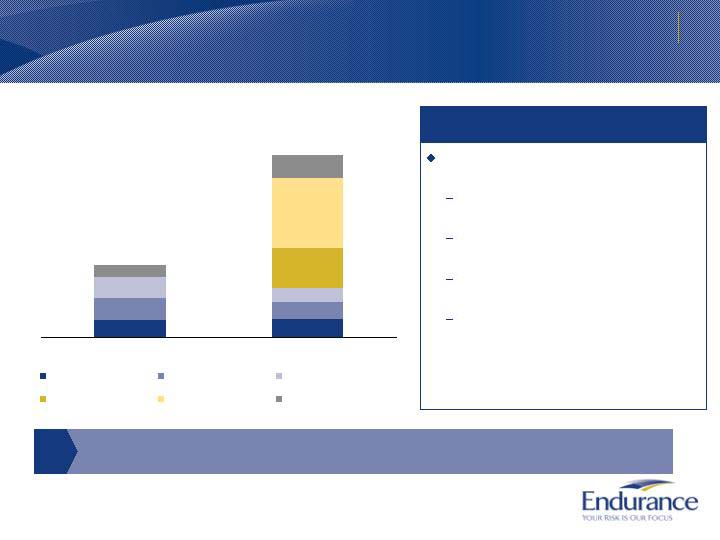
Continue to expand insurance capabilities while maintaining discipline
2005
2008
Property
Casualty
Healthcare
Workers’ compensation
Agriculture
Professional lines
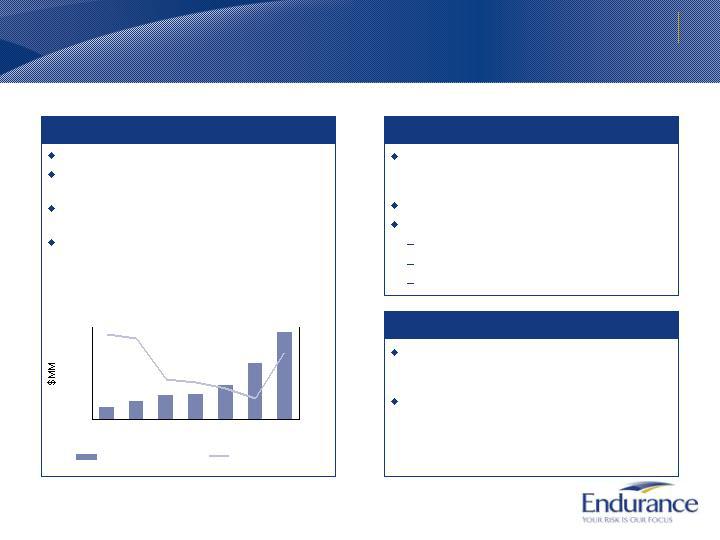
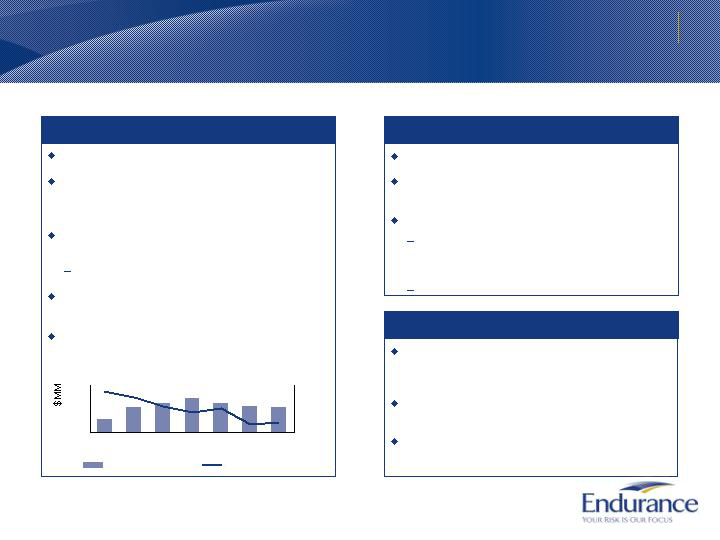
$387.7
$980.6
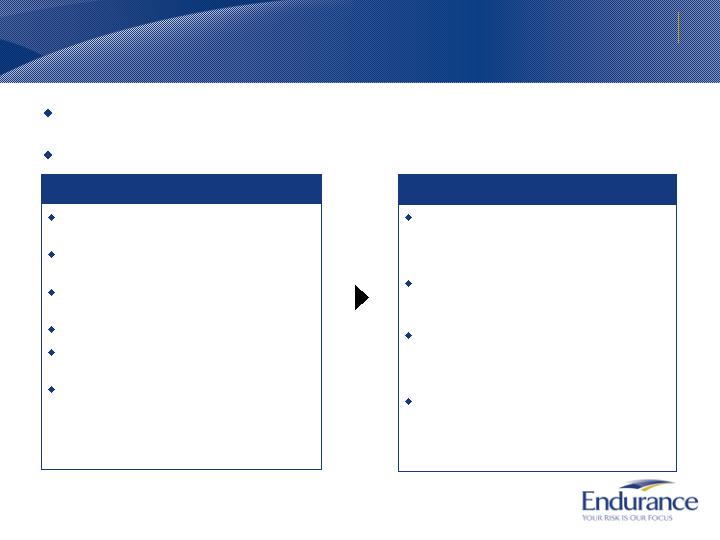
Over the past three years we have meaningfully grown our insurance business
through the addition of new capabilities and distribution relationships
Expanding the insurance portfolio
We have significantly broadened our
insurance capabilities.
Added agriculture line of business
through the acquisition of ARMtech
Opportunistically grew in workers’
compensation
Expanded professional lines through
addition of underwriting teams
Meaningfully expanded our
distribution relationships
Insurance net premiums written
10

Reinsurance book has reduced due to cycle management but is highly scaleable
2005
2008
Casualty
Property
Catastrophe
Agriculture
Aerospace and Marine
Surety and other
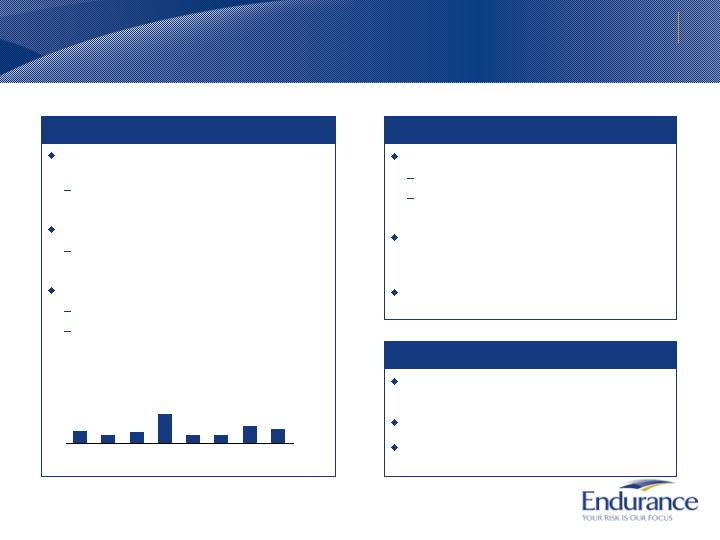
$1,375.0
$808.8
During the softening market of the past three years we have been disciplined in
writing reinsurance business
Managing the reinsurance portfolio
Active portfolio management has enhanced
reinsurance portfolio:
Portfolio reduced where pricing, terms or
data quality have not met our requirements
Casualty declined 57%
Property declined 46%
Aerospace and Marine declined 67%
Improved deployment of catastrophe
capacity has improved risk adjusted returns
We have maintained our underwriting expertise
and are well positioned to grow as opportunities
arise
Reinsurance net premiums written*
* Prior to deposit accounting adjustments
11
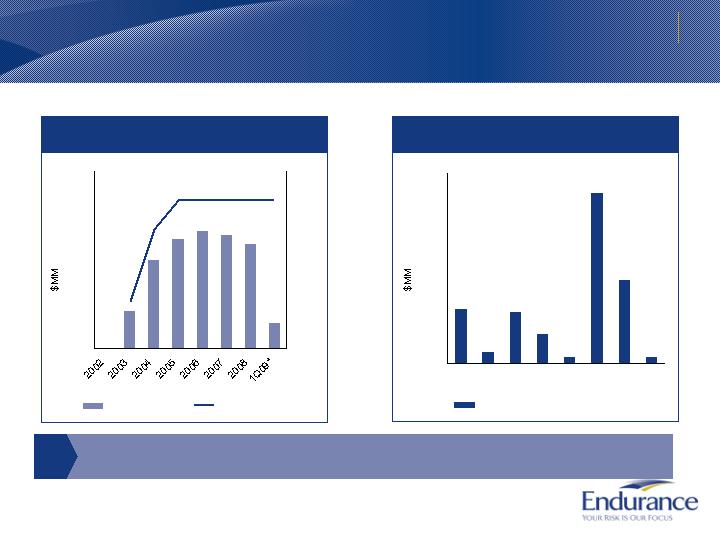
Our results
Summary
Strong growth in book value since inception
105% Increase in diluted book value per share plus dividends since inception (10.7%
annualized)
Superior returns on equity
19.3% average operating ROE from 2006 through 2008, and better than peer median
throughout the cycle
14.1% inception to date operating ROE
Exceptional underwriting performance
Inception to date combined ratio of 92.2%
2008 Ike and Gustav losses were below peer averages
Disciplined capital management approach exemplified by
Attractive dividend yield of ~3-4%
$1.1 billion of capital returned to shareholders since inception
Performance across key metrics compares favorably to peers
12
Our results
Diluted book value per common share has grown 105% since inception*
Book Value ($MM) and Diluted Book Value
Per Common Share ($)
From December 31, 2001 - March 31, 2009
1,162
1,218
1,645
1,862
1,873
2,298
2,512
2,207
2,254
$19.37
$24.03
$35.05
$33.06
$34.34
$28.87
$21.73
$27.91
$23.17
2001
2002
2003
2004
2005
2006
2007
2008
1Q09
Book Value
Diluted Book Value Per Share
Note: Diluted Book Value Per Share calculated on weighted number of average diluted shares outstanding.
* Diluted book value growth plus dividends
10.7% CAGR, diluted book
value per common share*
13
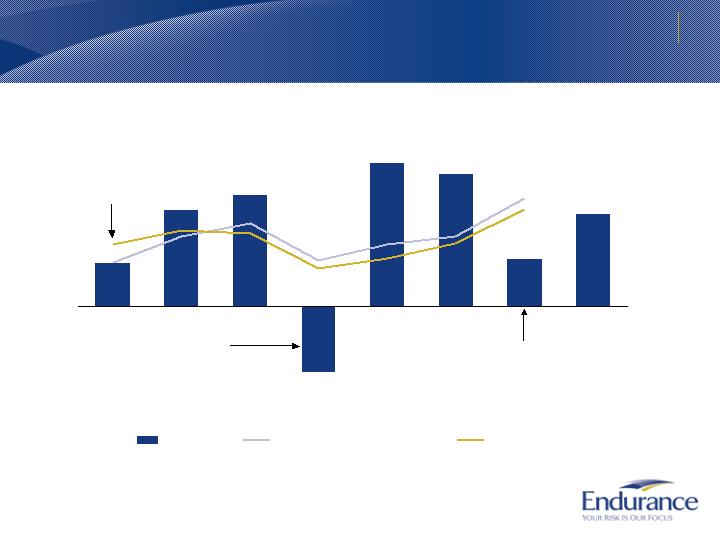
16.6%
-11.9%
7.8%
17.3%
19.9%
25.7%
23.8%
8.5%
2002
2003
2004
2005
2006
2007
2008
1Q09
Operating ROE(%)1
From 2002-2008
1. ROE is defined as 3-yr rolling average operating ROAE
2. Composite peer median based on SNL data. Includes Allied World, Arch, Ren Re, IPC re, Axis, Transatlantic, Everest, PartnerRe, Platinum,
Montpelier and Max Capital
Impact of Hurricanes Gustav and Ike
claims and mark to market accounting
impact from investment portfolio
Impact of Hurricanes
Katrina, Rita, and
Wilma claims
Endurance
ENH 3-year rolling average ROE
19%
Median peer 3-year rolling average ROE
First year after
inception; capital not
yet fully deployed
18%
8.4%
6.9%
Our results
We have outperformed peers throughout the cycle1
14
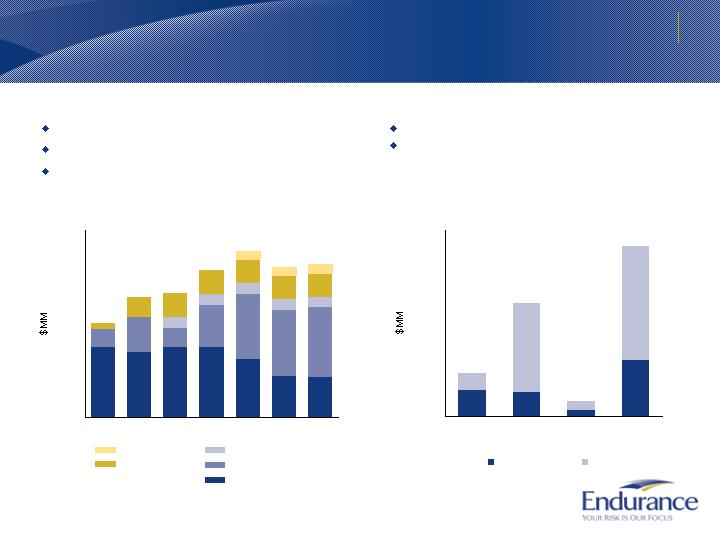
Balance sheet strength at March 31, 2009
Strong and flexible capital structure
IBNR represents 68% of company reserves
79% of long tail reserves are IBNR
Prudent and strong reserves
0
500
1,000
1,500
2,000
2,500
3,000
3,500
Short Tail
Long Tail
Other
Total
Case Reserves
IBNR
1,300
1,213
1,309
1,318
1,091
762
749
345
650
364
780
1,221
1,245
1,305
200
200
200
200
200
103
391
447
447
449
447
447
150
150
150
0
500
1,000
1,500
2,000
2,500
3,000
3,500
2003
2004
2005
2006
2007
2008
1Q09
Established history and growth
Rated “A” by A.M. Best and S&P; A2 by Moody’s
Debt to total capital of 16.6%
Common Share Capital
Retained Earnings
Preferred Equity
Debt
Contingent Equity
Reserves as of March 31, 2009
15
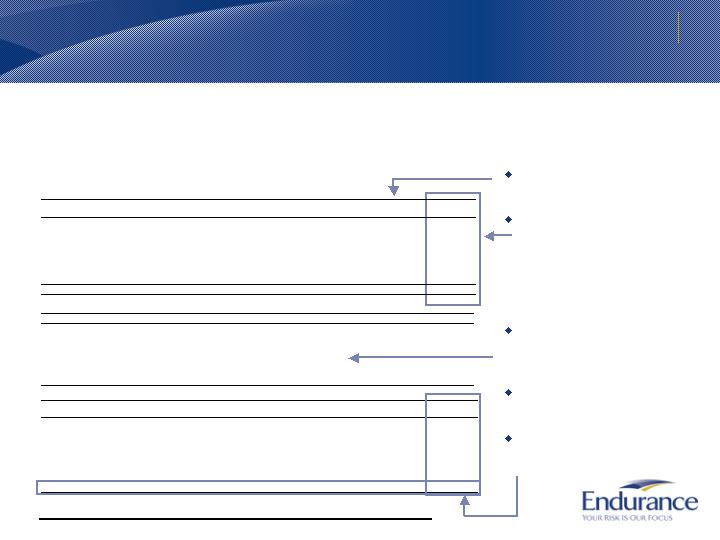
Timely published loss triangles—an example of our commitment to transparency
Industry-leading practice: loss triangles published annually in February
provide a transparent view of Endurance’s loss development
Composition of Ultimate Loss &
Loss Adjustment Expense (LAE)
for each accident year
Ultimate Loss & LAE ratios
represent latest available
estimate of loss and expenses as
a percentage of earned premiums
What to look for:
Loss emergence shows the
change in total expected losses
over time
Negative total development figures
represent reserves that have been
released into earnings
Changes in reserves at end of
each 12-month period for each
accident year are reflected in
Ultimate Loss & LAE
Ultimate Loss
& LAE Ratio
Ultimate Loss
& LAE
Additional Case
Reserves
Case Reserves
& ALAE
Paid Loss &
ALAE
Earned
Premium
Accident
Year
62%
6,821,449
63,717
2,032,628
109,925
1,069,639
3,545,538
10,934,196
77%
1,661,170
22,757
687,581
18,324
443,097
489,409
2,164,829
2008
54%
961,097
17,466
447,286
19,887
162,789
313,668
1,763,709
2007
46%
858,200
8,539
328,621
12,215
105,119
403,706
1,878,301
2006
101%
1,801,464
7,102
225,370
27,078
211,331
1,330,584
1,788,208
2005
52%
847,145
3,981
180,870
12,837
71,612
577,846
1,635,212
2004
41%
513,376
2,865
124,598
10,258
56,153
319,503
1,241,128
2003
39%
178,677
1,007
38,278
9,326
19,539
110,528
461,490
2002
24%
320
0
24
0
0
295
1,320
2001
ULAE
IBNR
Gross
ITD summary
Endurance Specialty Holdings LTD.
Accident Year Global Development Triangles
Valuation date: December 31, 2008
Value in Thousands USD(1.4629 USD/GBP)
Ultimate Loss & LAE
1,661,170
2008
961,097
976,391
2007
858,200
908,165
989,294
2006
1,801,464
1,833,851
1,863,194
1,804,173
2005
847,145
879,490
908,496
993,890
1,095,479
2004
513,376
528,584
538,247
556,093
628,688
736,190
2003
178,677
182,052
189,694
195,440
182,184
209,542
240,931
2002
320
277
319
322
398
2001
96
84
72
60
48
36
24
12
(682,181)
43
(3,417)
(22,853)
(47,830)
(65,584)
(264,654)
(277,884)
7,503,628
Total
1,661,170
2008
(15,295)
(15,295)
976,391
2007
(131,094)
(49,965)
(81,129)
989,294
2006
(2,710)
(32,387)
(29,343)
59,020
1,804,173
2005
(248,334)
(32,345)
(29,006)
(85,394)
(101,589)
1,095,479
2004
(222,814)
(15,207)
(9,664)
(17,845)
(72,595)
(107,502)
736,190
2003
(62,254)
(3,375)
(7,643)
(5,746)
13,256
(27,357)
(31,389)
240,931
2002
320
43
(42)
(3)
(75)
398
2001
Total
Development
84 - 96
72 - 84
60 - 72
48 - 60
36 - 48
24 - 36
12 - 24
@ 12
Loss Emergence
Calendar Year Emergence
2003
2004
2005
2006
2007
2008
Total Development
(31,389)
(134,462)
(161,003)
(49,969)
(156,826)
(148,531)
(682,180)
16
Cash and equivalents, $877mm1
Government and agency debt,
$722mm
Agency MBS, $1,124mm
Government guaranteed Corporates,
$568mm
ABS, $225mm
Foreign government, $199mm
Investment grade and high-yield
corporates and munis, $467mm
Non-agency CMBS, $513mm
Non-agency RMBS, $326mm
Short term, $140mm
Other, $286mm
Alternatives are limited and carefully selected
Currently carried at an average of 78% of amortized cost:
96% of CMBS are super-senior and senior issues
67% of RMBS are vintage 2005 or older
No subprime MBS
No credit or interest rate derivatives
Investment portfolio composition at March 31, 2009
Market yield: 5.0%
Book yield: 4.6%
Average rating: Aaa/AAA
Duration: 2.06 years
60% of
investments are in
cash, U.S.
Government or
U.S. Government
backed securities
(1) Net of investments pending settlement
17
Senior non-agency RMBS portfolio as of 3/31/09
The RMBS portfolio is trading $143mm below face value (69%). The current discount to face
value would be realized through actual writedowns on the securities under the following
approximate cumulative default and severity scenarios:
’06 and ‘07 Prime – 60% cumulative defaults / 75% loss severity
‘05 and Earlier Prime – 45% cumulative defaults / 60% loss severity
‘06 Alt-A – 70% cumulative defaults / 80% loss severity
‘05 Alt-A – 55% cumulative defaults / 70% loss severity
‘04 and Earlier Alt-A – 40% cumulative defaults / 60% loss severity
Vintage
Face Amount
Market Value
Average Credit
Enhancement
Average 60+
Delinquency
Collateral
Cumulative Loss
to Date
2007
$99,503
$62,904
7.5%
4.9%
0.3%
2006
$69,747
$40,286
10.4%
7.6%
0.7%
2005
$48,716
$34,691
6.1%
2.8%
0.1%
2004 and Earlier
$144,888
$109,479
7.8%
1.6%
0.1%
Total
$362,854
$247,360
8.0%
3.8%
0.3%
Vintage
Face Amount
Market Value
Average Credit
Enhancement
Average 60+
Delinquency
Collateral
Cumulative Loss
to Date
2007
$0
$0
2006
$5,950
$3,796
8.8%
20.3%
1.6%
2005
$60,806
$44,461
7.2%
8.5%
0.5%
2004 and Earlier
$32,772
$23,815
14.4%
6.5%
0.4%
Total
$99,528
$72,072
9.7%
8.5%
0.5%
Vintage
Face Amount
Market Value
Average Credit
Enhancement
Average 60+
Delinquency
Collateral
Cumulative Loss
to Date
2007
$99,503
$62,904
7.5%
4.9%
0.3%
2006
$75,697
$44,082
10.2%
8.7%
0.8%
2005
$109,522
$79,152
6.7%
6.0%
0.3%
2004 and Earlier
$177,660
$133,294
9.0%
2.5%
0.1%
Total
$462,382
$319,432(1)
8.3%
4.9%
0.3%
Prime
Alt-A
Total
(1) Does not include $7 million of notes that are non-US RMBS.
Current market valuation of the non-agency RMBS portfolio implies a significantly worse
underlying loan default rate than the current delinquency rate of 4.9%
18

The CMBS portfolio is trading $125mm below face value (80%). The current discount to
face value would be realized through actual writedowns on the securities under the following
approximate cumulative default and severity scenarios:
‘06 and ‘07 Vintage – 95% cumulative defaults / 50% loss severity
‘05 Vintage – 80% cumulative defaults / 45% loss severity
$0
$20
$40
$60
$80
$100
$120
2007
2006
2005
2004 and Earlier
Vintage
Defeased Adjusted Credit Enhancement
Between 10% and 20%
Between 20% and 30%
Greater than 30%
The analysis above excludes a seasoned CMBS portfolio (88% 2004 and earlier) with an
aggregate market value of $19mm and the following average characteristics:
Loan Age
Defeased Adjusted
Credit Enhancement
Current Delinquencies
Collateral Cum Loss to
Date
9.4 years
26.4%
2.9%
1.5%
Vintage
Face Amount
Market Value
Average Credit
Enhancement
Average 60+
Delinquency
Collateral
Cumulative Loss
to Date
2007
$148,337
$100,070
30.6%
2.2%
0.00%
2006
$145,910
$101,831
30.5%
1.7%
0.00%
2005
$117,892
$95,027
29.2%
1.1%
0.04%
2004 and Earlier
$204,180
$194,044
33.8%
1.3%
0.48%
Total
$616,319
$490,972
31.6%
1.5%
0.2%
CMBS
Senior non-agency CMBS portfolio as of 3/31/09
(1)
(1)
Current market valuation of the non-agency CMBS portfolio implies a significantly worse
underlying loan default rate than the current delinquency rate of 1.5%
19
Conclusion
Endurance is a compelling investment opportunity
Endurance offers investors significant upside potential, based on combination of:
Strong franchise positions in attractive specialty markets
Globally diversified portfolio of insurance and reinsurance units operated with deep and distinctive expertise
Superior distribution capabilities with strong access to independent agent, middle market and retail
distribution networks
Active portfolio management actions have maintained strong risk adjusted return potential while reducing
overall volatility
Excellent balance sheet strength and liquidity
High quality fixed income investment portfolio offers upside potential from current market values
Prudent reserving philosophy and strong reserve position; Strong history of favorable development
Industry leading ERM
The future outlook is attractive
Outlook for P&C insurance sector overall is attractive;
Pricing in most lines is stable or improving with opportunities to continue generating attractive returns
Endurance is well-positioned to fill gaps left by weakened incumbents
Relative value vs. peers
ENH currently trading at a discount to book and peers, which appears unwarranted given strong absolute
and relative performance and strong positioning
P&C stock prices have fallen in line with other financials, which appears unwarranted given the industry’s
financial performance and improving market conditions
20
Appendix

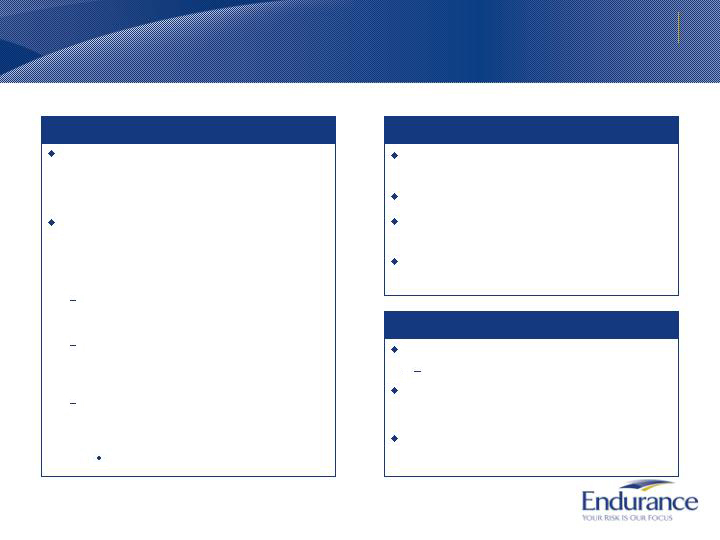
Growth through specialization
We have a strong track record of entering new businesses to meet our strategic aims
Buy
Build
Partner
2008
2006
2001
2002
2003
2004
2005
2007
Acquired
LaSalle
portfolio
Acquired
HartRe
Acquired
ARMtech
Partnered with
leading California
workers’ comp
provider
Acquired XL
Surety
reinsurance
Established
US
reinsurance
Established
UK/Europe
reinsurance
Established
Fortune
1000
insurance
Established
UK Middle
Market
insurance
Established
US
Middle
Market
insurance
Established
Agriculture
reinsurance
Partnered with
leading
environmental
contractor provider
Established
operations
Partnered with
leading habitational
risk provider
Established
catastrophe
reinsurance
22
Balance sheet strength and durability
Our commitment to ERM supports superior performance
Best-in-class
ERM
Optimally manage capital and risks
Manage towards a required return on
risk-adjusted capital
Quantify risks taken and limit ones
that threaten solvency/viability
Clearly defined risk tolerances
and controls
Asset management: approach
incorporates capital-at-risk limits,
stress testing and ratings triggers
Liability management
Concentration management
Delegated authorities
Strong governance structure
Senior management understands and
values ERM as a source of
competitive advantage
Board of Directors highly skilled in
insurance and finance
Corporate culture
Ownership mentality
Transparency and communication of
ERM strategies
“Excellent” ERM rating by S&P in 2008
Youngest company and one of only four P&C companies in the U.S. and
Bermuda to achieve the highest designation
23

Business organization and competitive advantages
1. % of net written premiums in 2008
Each of our
businesses
are led by
industry
leading
professionals
with market
expertise and
maintain the
following
sources of
competitive
advantage
Endurance
Insurance
55%1
Middle Market
Small Risk
Program
Bermuda
US
Fortune 1000
International
Reinsurance
45%
Diverse mix of access to exposure, split
between insurance and reinsurance,
and across customer segments
Service and
technology-based
distribution
strategy
Strong local
presences
Strong product
development
Cost-efficient
production
Professional
team with
extremely strong
underwriting
experience
Long-term
relationships
(over 20 years)
with key brokers
Very strong
reinsurance
relationships
Individual risk
underwriting
model, as
opposed to
market share
approach
Very low
historical loss
ratio based on
superior
underwriting
Deep
distribution
management
capabilities
Utilize
technology to
enhance control
environment
Multi-disciplined
teams of
professionals
dedicated to
program
management
and oversight
Access to
business
through
combination of
insurance and
reinsurance
networks
3-pronged
underwriting
approach
Specialized
Relationship-
based
Opportunistic
Dedicated
professional
teams with skills
tailored to each
approach
Face-to-face
service model
and access to
global network
of clients
Industry leading
underwriting
margins
Aggressive
portfolio
management
Industry leading
technology and
modeling
Distinctive
footprint and
lean
underwriting
approach vs.
most Bermuda
competitors
Shifting focus of
business to
Zurich and
Singapore
Strong local
market
presence with
experienced
professionals
24
Case study: ARMtech represents a successful entry into Agriculture
1.
As of October 9, 2008
2.
Premiums and loss ratios are net of cessions to the FCIC only
Acquired in December 2007
Traditional multi peril crop insurer with a 6.1%
market share of the $4.7 BN MPCI market1
Endurance’s portfolio currently includes over
50,000 clients and 100,000+ individual policies
Agriculture insurance is an attractive and growing
segment
Overview of Small Risk – ARMtech
Strong local presence of field representatives that
deliver technology driven products to independent
agents
Product development expertise
Expense advantage – low cost manufacturer
Leverage technology
Centralized and scaleable back office
Well distributed sales and claims staff
Competitive advantage
We will leverage our exceptional customer
service, scalable operating platform, and low cost
structure to grow the market share
Continue to grow in the small risk space utilizing
strong local presence and distribution, product
development, and technology
Go forward strategy and outlook
0
100
200
300
400
2002
2003
2004
2005
2006
2007
2008
60%
80%
100%
Net written premium
Net loss ratio
ARMtech performance from 2002-20082
25
We are now building a similarly differentiated specialized portfolio within Middle Market
Endurance began investing and organically
growing it’s US middle market business in 2005
Developed a well established branch network
Provide admitted and non-admitted policy
forms
World class policy administration system that
allows for rapid integration of new products
Middle Market represents a large but fragmented
opportunity with attractive margins. This space:
Reflects less concentrated single risk
exposures, which balances our Fortune 1000
business
Represents business which is often poorly
served by standard carriers
Has historical results better than industry
Overview of Middle Market
Our credible underwriting staff with extensive
experience managing through hard and soft
markets
Long term relationships with key producers who
are leaders in the wholesale distribution system
Proven ability to attract underwriters and find
niche pockets of attractive business, e.g.
successfully opened 10 branch locations
Competitive advantage
Extend our existing US business model
geographically and by product
Continue to organically build through leveraging
existing capabilities and hiring new teams to take
advantage of current market opportunities
Go forward strategy and outlook
26
Case study: Strong performance in Bermuda Cat driven by strategy and cycle management
This business is one of the highest margin
businesses through the underwriting cycle
Rating agency constraints and market
behaviors put floor on cycle
Success requires active portfolio management
Key is to maintain proper infrastructure and
set of internal controls
Track record of attractive underwriting margins
Inception to date underwriting ratio of 59.5%
Our performance in 2008 with Ike and Gustav
was significantly better than peers1
Overview of Bermuda Catastrophe
Industry leading technical underwriter
Recognized as Excellent in ERM by S&P
Face-to-face contact with clients aids risk
selection
Seasoned industry participant that has leveraged
active client management to move towards more
attractive accounts
Global reinsurance network provides greater
access to clients
Competitive advantage
Continue to write quality business through both
hard and soft cycles
Attract internal and external sources of capital
Portfolio manage concentrations and leverage
global network to seek out diversifying exposures
Go forward strategy and outlook
52.0%
34.0%
44.0%
126.0%
36.6%
33.3%
74.9%
58.2%
2002
2003
2004
2005
2006
2007
2008
1Q09
1. Composite peer median based on SNL data. Includes Platinum, Allied World, Arch, Ren Re, IPC re, Axis, Transatlantic, Everest, PartnerRe,
Montpelier and Max Capital
Underwriting Ratio from 2002-1Q09
27
51%
76%
101%
126%
151%
176%
1998
2000
2002
2004
2006
2008
Case study: Our California Workers’ Comp insurance play represents a successful, replicable business model
California market identified as an opportunity,
especially in small business niche markets (small,
regional company focus through independent agents)
Entered the business in 2006 with a partner who
provided technology and distribution expertise
Partner was a successful reinsurance client
Relationship parlayed into primary insurance
partnership; serves as template for future
opportunities
Ramped up the business to over 100,000 policies in
three years
In late 2008, concluded that expected loss cost
trends would continue to erode and competitive
pressures would increase
Exited the business in early 2009
From 2006 to 2008, we wrote $541 MM in net
premiums and the business has generated returns
above initial expectations
Overview of California Workers’ Compensation
$
$50
$100
$150
$200
$250
$300
2006
2007
2008
2009
Net premiums written
Workers’ Comp insurance industry performance1
1995-2008
1. Source: WCIRB estimated accident year combined loss and expense ratios
Note: 2008 industry combined ratios projected based on market trends and Endurance’s performance
Exited
business
Endurance spotted an historic
opportunity to enter what is generally
considered a difficult market
28
Historically a high margin business
Comprised of large risk casualty business which
includes, healthcare, excess casualty, and
professional lines insurance
Endurance is expanding market share by opening
2 new offices
US healthcare team and US professional lines
Challenges faced by large distressed carriers
creating opportunities
This business has generated economic margins
of ~30% (includes underwriting and investment
returns)
Overview of Fortune 1000
Strong distribution management capabilities
Demonstrated low underwriting ratio as
compared to peers
Endurance is a technical risk underwriter
Actuarial models built around exposure
management based on proprietary
information gained from client knowledge
Strong reliance on pricing tools
Competitive advantage
Continue to selectively expand our footprint from
Bermuda to the United States to better align with
evolving distribution model
Leverage our distribution management
capabilities
We believe the combination of underwriting
excellence and expanded operational capabilities
positions us very well for the next 5 years
Go forward strategy and outlook
Fortune 1000 – business overview
Fortune 1000 Performance
0
100
200
300
400
2002
2003
2004
2005
2006
2007
2008
50%
90%
Net premiums written
Underwriting Ratio
29
Program business overview
Represents a large opportunity for Endurance in
today’s marketplace as the weakening of
incumbents will increase available share of new
program businesses
To be individually underwritten in a cost effective
way this business is better accessed through
distribution partnerships
We have two distinct partnership models
depending on the type of risk:
Overview of Program Business
Broad underwriting capabilities
Better qualified to monitor underwritten
business
Ability and discipline to be selective
Underwriting mature books of business that are
susceptible to analysis
Demonstrated successful experience in this
business model
Competitive advantage
Capitalize on weakness of large incumbents
Flight to more stable business partners
Leverage in-house underwriting expertise
Go forward strategy and outlook
Details
Example
Ongoing where
partner underwrites
using Endurance’s
underwriting
technology platform
Entry in 2006 when
the business was
attractive, exit in
2009 as cost trends
eroded and
competitive
pressures increased
Environmental
insurance
California Worker’s
compensation
Ongoing
partnership
Opportunistic
entry and exit
30
US Reinsurance is the broadest and deepest
reinsurance market with a wide variety of risks,
aggressive competitors and pronounced
underwriting cycles
Historically, reinsurers in the US have competed
using market tracking and market share
strategies. However, Endurance aspires to
generate higher margins by using a three-
pronged approach
Specialized underwriting: Stable, well-respected
underwriting teams that operate as specialists
within their niche
Opportunistic/capabilities underwriting:
Opportunistic approach to identifying and targeting
attractive businesses while maintaining discipline
to exit and enter markets as the cycle dictates
Relationship underwriting: Focused strategy of
working with best of breed companies that have
strong franchises and are less susceptible to
competition
Technical underwriters similar to Endurance
Overview of US Reinsurance
Distinctive combination of cycle management and
comprehensive underwriting capabilities
Experienced team with broad expertise
Specialist underwriters supported by claims and
actuarial teams
Flexible technology platform
Competitive advantage
Expand specialty underwriting products
Surety and direct lines of business
Opportunistically enter markets that are
experiencing greater diversification due to
counterparty risk
Expand relationships where clients are proving to
be strategically positioned to withstand market
pressures
Go forward strategy and outlook
US Reinsurance business overview
31
Global operations in London, Zurich, and
Singapore
Broadly bifurcated market approach to serve both
London and local markets
Maintain capabilities to serve in both markets
Deep and broad relationships with clients
Positioning resources to replicate strategy
employed in the US
Represents a large opportunity for Endurance in
today’s marketplace as the weakening of large
incumbents will increase available share of new
business
Overview of International Reinsurance
Differentiated operating model which combines
specialized underwriting skills with operational
efficiency
Local senior underwriters
Lean focused multi-disciplinary team
Leverage of assembled network of expertise to
draw from the Bermuda catastrophe and New
York specialist teams
Competitive advantage
Leverage relationships into other lines of
business
We have widely dispersed cat clients and
contract base
Build network through face to face contact and
ability to respond quickly to market opportunities
Go forward strategy and outlook
International Reinsurance business overview
32

Financial results for first quarter 2009
9.7
0.11
1.13
1.24
Fully diluted net income EPS
(1.5)
(1.3)
89.5
88.2
Operating income
0.6
0.5
77.8
78.3
Net income
6.9
(42.2)
37.7
1.7
(9.0)
% Change
0.09
(24.2)
17.7
6.3
(57.9)
$ Change
1.31
1.40
Fully diluted operating EPS
57.4
33.2
Net underwriting income
46.9
64.6
Net investment income
372.0
378.3
Net premiums earned
640.8
582.9
Net premiums written
March 31,
2008
March 31,
2009
$MM (except per share data and %)
Financial highlights
$36.00
$34.34
Book value per share
84.4%
92.2%
Combined ratio
2.40
2.73
Investment leverage
13.5%
15.9%
General and administrative expense ratio
20.0%
18.1%
Acquisition expense ratio
50.9%
58.2%
Net loss ratio
14.7%
16.6%
Operating ROE
March 31,
2008
March 31,
2009
Key operating ratios
33
Net written premiums
164.3
18.4
11.2
29.6
Professional lines
0.4
0.9
222.4
223.3
Agriculture
(9.5)
(77.7)
4.2
18.5
16.7
% Change
33.7
(59.0)
0.7
2.8
2.5
$ Change
356.1
322.4
Total insurance
75.9
16.9
Workers’ compensation
16.5
17.2
Healthcare liability
15.1
17.9
Casualty
15.0
17.5
Property
March 31,
2008
March 31,
2009
In $MM
Insurance Segment
(11.7)
(3.2)
27.3
24.1
Surety and other specialty
(66.7)
(24.4)
36.6
12.2
Aerospace and marine
(8.3)
(55.0)
4.0
1.9
6.8
% Change
(23.9)
(6.0)
4.2
0.7
4.8
$ Change
286.7
262.8
Total reinsurance
10.9
4.9
Agriculture
105.2
109.4
Catastrophe
36.2
36.9
Property
70.5
75.3
Casualty
March 31,
2008
March 31,
2009
In $MM
Reinsurance Segment*
15.0
(0.3)
(2.0)
(2.3)
Deposit accounting adjustments
(9.0)
% Change
(57.9)
$ Change
640.8
582.9
Total
March 31,
2008
March 31,
2009
In $MM
Total
* Prior to deposit accounting adjustments
34

Financial overview: historical
$1.24
74
78
65
33
378
583
March 31,
2009
$1.31
83
99
130
111
1,766
1,784
2008
($3.60)
(223)
(220)
180
(410)
1,724
1,619
2005
$6.73
483
498
257
304
1,639
1,586
2006
$7.13
506
521
281
322
1,595
1,575
2007
$4.00
263
263
71
179
1,174
1,598
2003
$5.28
356
356
122
232
1,633
1,697
2004
1,644
102
Net income available to
common shareholders
1,697
102
Net income before
preferred dividend
1,149
822
10,278
11,207
2002
through
1Q09
$1.73
43
51
369
765
2002
Diluted EPS
Net investment income
Net underwriting income
Net premiums earned
Net premiums written
In $MM
Financial highlights since 2002
$34.34
16.6%
92.2%
March 31,
2009*
$33.06
8.5%
93.5%
2008
$35.05
23.8%
79.9%
2007
$28.87
25.7%
81.5%
2006
$27.91
19.9%
85.8%
2004
$23.17
(11.9%)
123.5%
2005
$24.03
17.3%
84.7%
2003
$21.73
7.8%
86.2%
2002
Book value per share
14.1%
Operating ROE
92.3%
Combined ratio
Inception-
to-date
Key operating ratios
* Operating ROE is annualized
35
0
20
40
60
80
100
$0.00
$0.20
$0.40
$0.60
$0.80
$1.00
$1.20
Dividends paid
Annual dividend/share
0
50
100
150
200
250
300
350
2002
2003
2004
2005
2006
2007
2008
1Q09
Share repurchases
Pay an attractive dividend yield
Return capital as market conditions soften
Note: Dividend yield based on common shares. Endurance also issues a $1.94 dividend to its preferred shares on an annual basis.
Capital management
We have maintained a disciplined capital management approach
* Annual dividend per share is annualized for 2009
Actively manage capital and have returned approximately $1.1BN in capital to
shareholders, inception-to-date
36