|
Exhibit 99.1 
|
Endurance Specialty Holdings Investor Presentation
|
|
2 Forward looking statements & regulation G disclaimer Safe Harbor for Forward Looking Statements Some of the statements in this presentation may include forward-looking statements which reflect our current views with respect to future events and financial performance. Such statements include forward-looking statements both with respect to us in general and the insurance and reinsurance sectors specifically, both as to underwriting and investment matters. Statements which include the words “should”,”expect,” “intend,” “plan,” “believe,” “project,” “anticipate,” “seek,” “will,” and similar statements of a future or forward-looking nature identify forward-looking statements in this presentation for purposes of the U.S. federal securities laws or otherwise. We intend these forward-looking statements to be covered by the safe harbor provisions for forward-looking statements in the Private Securities Litigation Reform Act of 1995. All forward-looking statements address matters that involve risks and uncertainties. Accordingly, there are or may be important factors that could cause actual results to differ from those indicated in the forward-looking statements. These factors include, but are not limited to, the effects of competitors’ pricing policies, greater frequency or severity of claims and loss activity, changes in market conditions in the agriculture insurance industry, termination of or changes in the terms of the U.S. multiple peril crop insurance program, a decreased demand for property and casualty insurance or reinsurance, changes in the availability, cost or quality of reinsurance or retrocessional coverage, our inability to renew business previously underwritten or acquired, our inability to maintain our applicable financial strength ratings, our inability to effectively integrate acquired operations, uncertainties in our reserving process, changes to our tax status, changes in insurance regulations, reduced acceptance of our existing or new products and services, a loss of business from and credit risk related to our broker counterparties, assessments for high risk or otherwise uninsured individuals, possible terrorism or the outbreak of war, a loss of key personnel, political conditions, changes in insurance regulation, changes in accounting policies, our investment performance, the valuation of our invested assets, a breach of our investment guidelines, the unavailability of capital in the future, developments in the world’s financial and capital markets and our access to such markets, government intervention in the insurance and reinsurance industry, illiquidity in the credit markets, changes in general economic conditions and other factors described in our most recently filed Annual Report on Form 10-K . Forward-looking statements speak only as of the date on which they are made, and we undertake no obligation publicly to update or revise any forward-looking statement, whether as a result of new information, future developments or otherwise. Regulation G Disclaimer In presenting the Company’s results, management has included and discussed certain non-GAAP measures. Management believes that these non-GAAP measures, which may be defined differently by other companies, better explain the Company’s results of operations in a manner that allows for a more complete understanding of the underlying trends in the Company’s business. However, these measures should not be viewed as a substitute for those determined in accordance with GAAP. For a complete description of non-GAAP measures and reconciliations, please review the Investor Financial Supplement on our web site at www.endurance.bm. The combined ratio is the sum of the loss, acquisition expense and general and administrative expense ratios. Endurance presents the combined ratio as a measure that is commonly recognized as a standard of performance by investors, analysts, rating agencies and other users of its financial information. The combined ratio, excluding prior year net loss reserve development, enables investors, analysts, rating agencies and other users of its financial information to more easily analyze Endurance’s results of underwriting activities in a manner similar to how management analyzes Endurance’s underlying business performance. The combined ratio, excluding prior year net loss reserve development, should not be viewed as a substitute for the combined ratio. Net premiums written is a non-GAAP internal performance measure used by Endurance in the management of its operations. Net premiums written represents net premiums written and deposit premiums, which are premiums on contracts that are deemed as either transferring only significant timing risk or transferring only significant underwriting risk and thus are required to be accounted for under GAAP as deposits. Endurance believes these amounts are significant to its business and underwriting process and excluding them distorts the analysis of its premium trends. In addition to presenting gross premiums written determined in accordance with GAAP, Endurance believes that net premiums written enables investors, analysts, rating agencies and other users of its financial information to more easily analyze Endurance’s results of underwriting activities in a manner similar to how management analyzes Endurance’s underlying business performance. Net premiums written should not be viewed as a substitute for gross premiums written determined in accordance with GAAP. Return on Average Equity (ROAE) is comprised using the average common equity calculated as the arithmetic average of the beginning and ending common equity balances for stated periods. Return on Beginning Equity (ROBE) is comprised using the beginning common equity for stated periods. The Company presents various measures of Return on Equity that are commonly recognized as a standard of performance by investors, analysts, rating agencies and other users of its financial information.
|
|
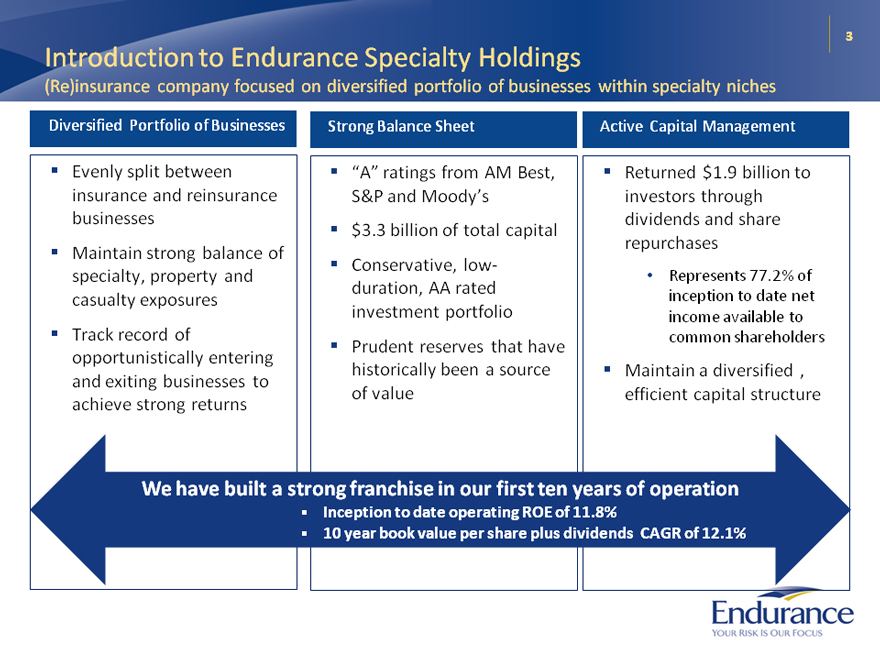
3 Introduction to Endurance Specialty Holdings (Re)insurance company focused on diversified portfolio of businesses within specialty niches Diversified Portfolio of Businesses Evenly split between insurance and reinsurance businesses Maintain strong balance of specialty, property and casualty exposures Track record of opportunistically entering and exiting businesses to achieve strong returns Strong Balance Sheet “A” ratings from AM Best, S&P and Moody’s $3.3 billion of total capital Conservative, low- duration, AA rated investment portfolio Prudent reserves that have historically been a source of value Active Capital Management Returned $1.9 billion to investors through dividends and share repurchases Represents 77.2% of inception to date net income available to common shareholders Maintain a diversified , efficient capital structure We have built a strong franchise in our first ten years of operation Inception to date operating ROE of 11.8% 10 year book value per share plus dividends CAGR of 12.1%
|
|
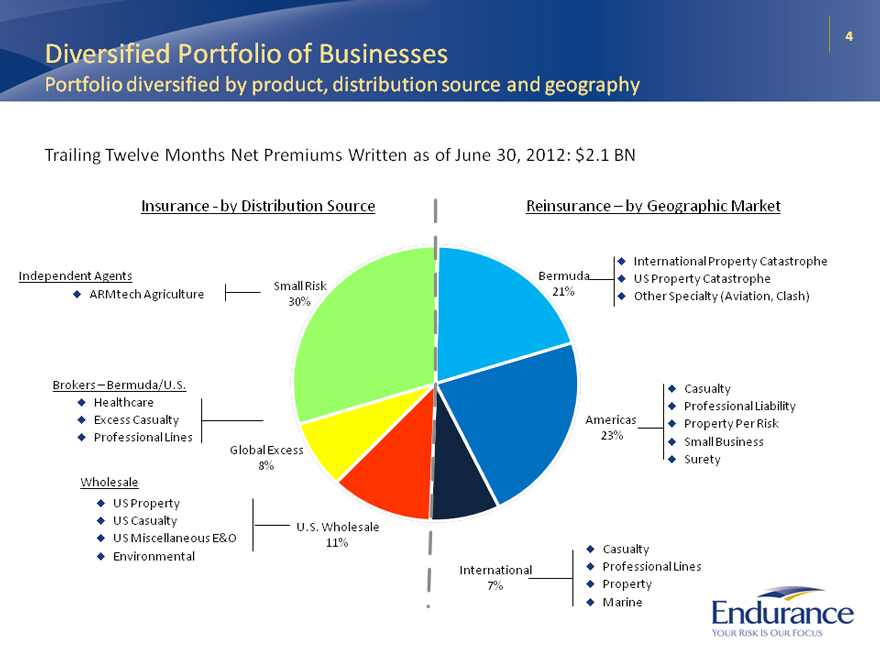
4 Diversified Portfolio of Businesses Portfolio diversified by product, distribution source and geography Trailing Twelve Months Net Premiums Written as of June 30, 2012: $2.1 BN Insurance—by Distribution Source Reinsurance – by Geographic Market International Property Catastrophe Independent Agents Small Risk Bermuda US Property Catastrophe ARMtech Agriculture 21% Other Specialty (Aviation, Clash) 30% Brokers – Bermuda/U.S. Casualty Healthcare Professional Liability Excess Casualty Americas Property Per Risk Professional Lines 23% Small Business Global Excess Surety 8% Wholesale US Property US Casualty U.S. Wholesale US Miscellaneous E&O 11% Casualty Environmental International Professional Lines 7% Property Marine
|
|
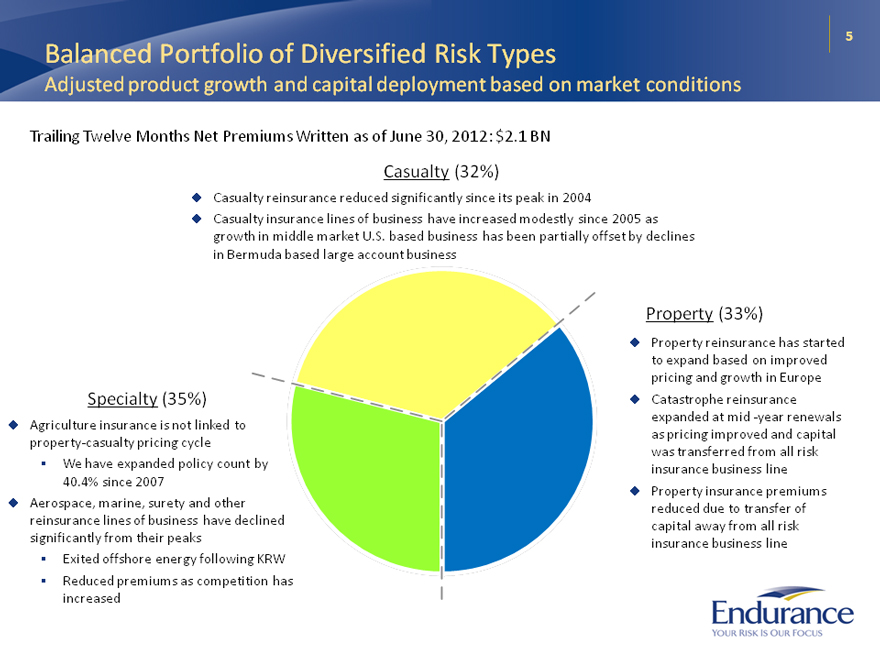
5 Balanced Portfolio of Diversified Risk Types Adjusted product growth and capital deployment based on market conditions Trailing Twelve Months Net Premiums Written as of June 30, 2012: $2.1 BN Casualty (32%) Casualty reinsurance reduced significantly since its peak in 2004 Casualty insurance lines of business have increased modestly since 2005 as growth in middle market U.S. based business has been partially offset by declines in Bermuda based large account business Property (33%) Property reinsurance has started to expand based on improved pricing and growth in Europe Specialty (35%) Catastrophe reinsurance expanded at mid -year renewals Agriculture insurance is not linked to as pricing improved and capital property-casualty pricing cycle was transferred from all risk We have expanded policy count by insurance business line 40.4% since 2007 Property insurance premiums Aerospace, marine, surety and other reduced due to transfer of reinsurance lines of business have declined capital away from all risk significantly from their peaks insurance business line Exited offshore energy following KRW Reduced premiums as competition has increased
|
|
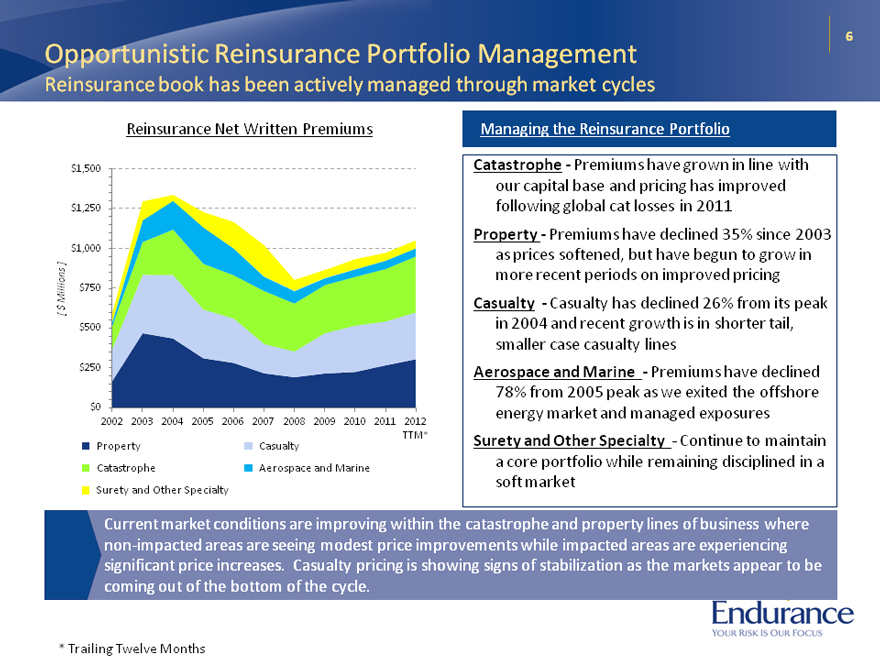
6 Opportunistic Reinsurance Portfolio Management Reinsurance book has been actively managed through market cycles Reinsurance Net Written Premiums $1,500 $1,250 $1,000 $750 $500 $250 $0 2002 2003 2004 2005 2006 2007 2008 2009 2010 2011 2012 TTM* Property Catastrophe Surety and Other Specialty Casualty Aerospace and Marine [$ Millions] Managing the Reinsurance Portfolio Catastrophe—Premiums have grown in line with our capital base and pricing has improved following global cat losses in 2011 Property—Premiums have declined 35% since 2003 as prices softened, but have begun to grow in more recent periods on improved pricing Casualty—Casualty has declined 26% from its peak in 2004 and recent growth is in shorter tail, smaller case casualty lines Aerospace and Marine—Premiums have declined 78% from 2005 peak as we exited the offshore energy market and managed exposures Surety and Other Specialty—Continue to maintain a core portfolio while remaining disciplined in a soft market Current market conditions are improving within the catastrophe and property lines of business where non-impacted areas are seeing modest price improvements while impacted areas are experiencing significant price increases. Casualty pricing is showing signs of stabilization as the markets appear to be coming out of the bottom of the cycle. * Trailing Twelve Months
|
|
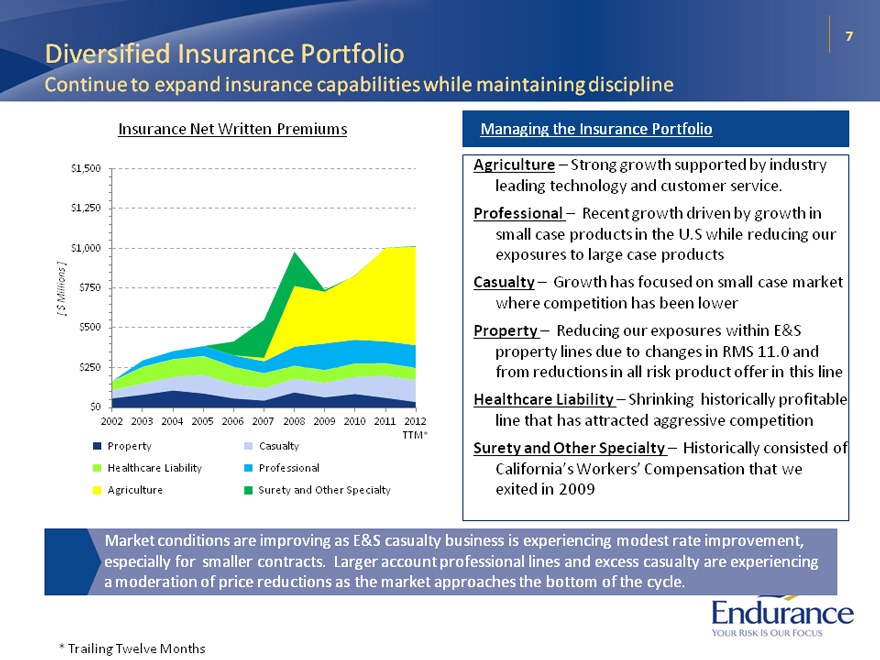
7 Diversified Insurance Portfolio Continue to expand insurance capabilities while maintaining discipline Insurance Net Written Premiums $1,500 $1,250 $1,000 $750 $500 $250 $0 [ $ Millions] 2002 2003 2004 2005 2006 Property Healthcare Liability Agriculture Managing the Insurance Portfolio 2007 2008 2009 2010 2011 2012 TTM* Casualty Professional Surety and Other Specialty Agriculture – Strong growth supported by industry leading technology and customer service. Professional – Recent growth driven by growth in small case products in the U.S while reducing our exposures to large case products Casualty – Growth has focused on small case market where competition has been lower Property – Reducing our exposures within E&S property lines due to changes in RMS 11.0 and from reductions in all risk product offer in this line Healthcare Liability – Shrinking historically profitable line that has attracted aggressive competition Surety and Other Specialty – Historically consisted of California’s Workers’ Compensation that we exited in 2009 Market conditions are improving as E&S casualty business is experiencing modest rate improvement, especially for smaller contracts. Larger account professional lines and excess casualty are experiencing a moderation of price reductions as the market approaches the bottom of the cycle. * Trailing Twelve Months
|
|
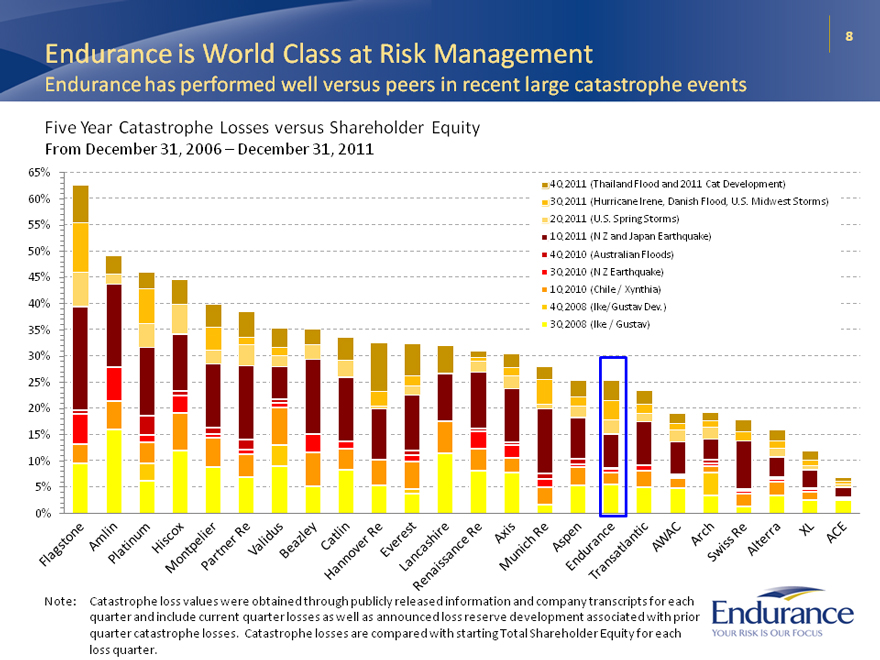
8 Endurance is World Class at Risk Management Endurance has performed well versus peers in recent large catastrophe events Five Year Catastrophe Losses versus Shareholder Equity From December 31, 2006 – December 31, 2011 65% 60% 55% 50% 45% 40% 35% 30% 25% 20% 15% 10% 5% 0% 4Q 2011 (Thailand Flood and 2011 Cat Development) 3Q 2011 (Hurricane Irene, Danish Flood, U.S. Midwest Storms) 2Q 2011 (U.S. Spring Storms) 1Q 2011 (N Z and Japan Earthquake) 4Q 2010 (Australian Floods) 3Q 2010 (N Z Earthquake) 1Q 2010 (Chile / Xynthia) 4Q 2008 (Ike/Gustav Dev.) 3Q 2008 (Ike / Gustav) Note: Catastrophe loss values were obtained through publicly released information and company transcripts for each quarter and include current quarter losses as well as announced loss reserve development associated with prior quarter catastrophe losses. Catastrophe losses are compared with starting Total Shareholder Equity for each loss quarter.
|
|
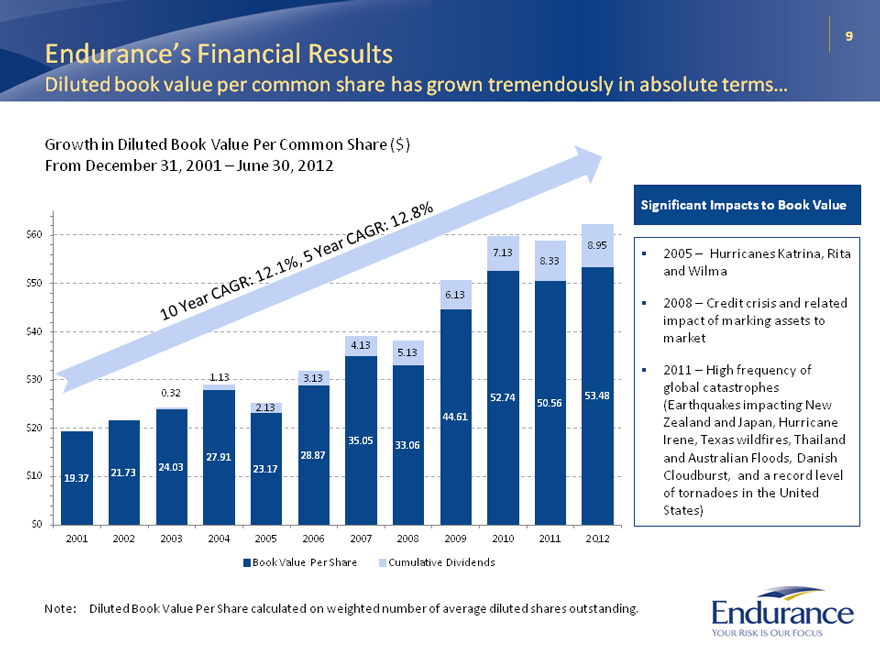
9 Endurance’s Financial Results Diluted book value per common share has grown tremendously in absolute terms… Growth in Diluted Book Value Per Common Share ($) From December 31, 2001 – June 30, 2012 $60 7.13 8.95 8.33 $50 6.13 $40 4.13 5.13 $30 1.13 3.13 0.32 53.48 52.74 50.56 2.13 44.61 $20 35.05 33.06 27.91 28.87 24.03 23.17 $10 21.73 19.37 $0 2001 2002 2003 2004 2005 2006 2007 2008 2009 2010 2011 2Q12 Book Value Per Share Cumulative Dividends Significant Impacts to Book Value 2005 – Hurricanes Katrina, Rita and Wilma 2008 – Credit crisis and related impact of marking assets to market 2011 – High frequency of global catastrophes (Earthquakes impacting New Zealand and Japan, Hurricane Irene, Texas wildfires, Thailand and Australian Floods, Danish Cloudburst, and a record level of tornadoes in the United States) Note: Diluted Book Value Per Share calculated on weighted number of average diluted shares outstanding.
|
|
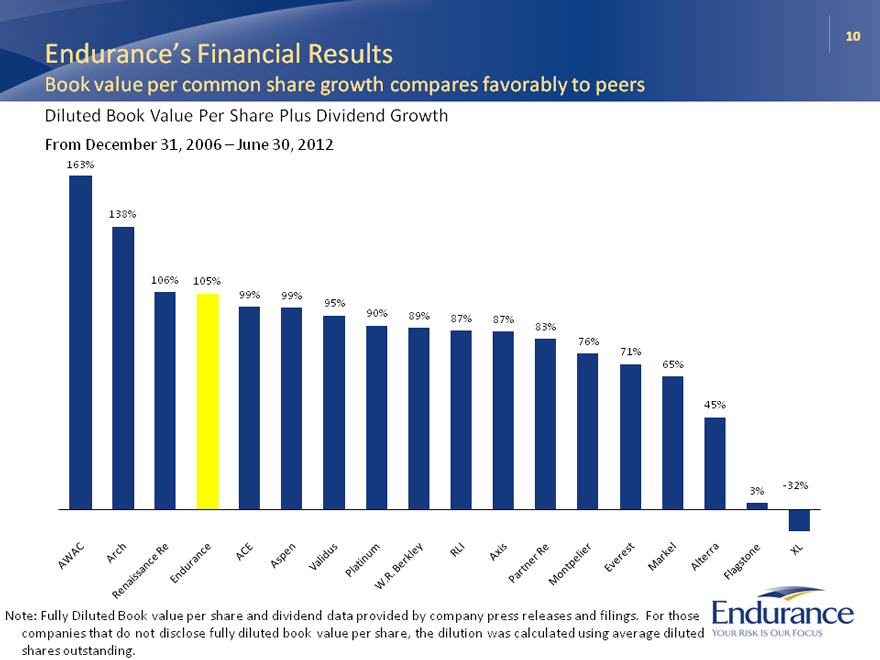
10 Endurance’s Financial Results Book value per common share growth compares favorably to peers Diluted Book Value Per Share Plus Dividend Growth From December 31, 2006 – June 30, 2012 163% 138% 106% 105% 99% 99% 95% 90% 89% 87% 87% 83% 76% 71% 65% 45% -32% 3% Note: Fully Diluted Book value per share and dividend data provided by company press releases and filings. For those companies that do not disclose fully diluted book value per share, the dilution was calculated using average diluted shares outstanding.
|
|
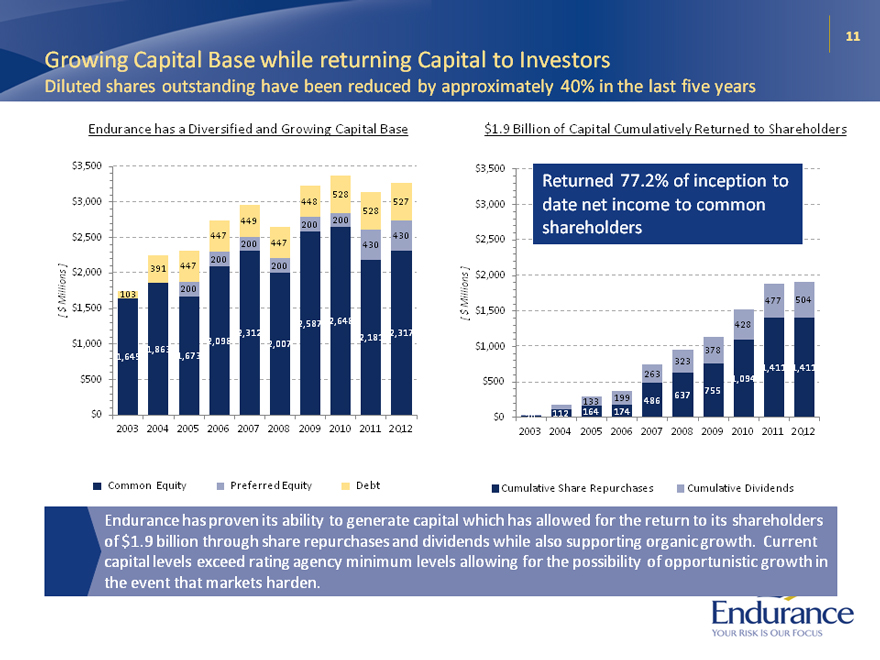
11 Growing Capital Base while returning Capital to Investors Diluted shares outstanding have been reduced by approximately 40% in the last five years Endurance has a Diversified and Growing Capital Base $3,500 $3,000 $2,500 $2,000 $1,500 $1,000 $500 $0 103 1,645 2003 391 447 200 1,863 1,673 2004 2005 449 447 200 447 200 200 2,312 2,098 2,007 2006 2007 2008 528 448 200 200 2,587 2,648 2009 2010 527 528 430 430 2,317 2,181 [ $ Millions] 2011 2Q12 $3,500 $3,000 $2,500 $2,000 $1,500 $1,000 $500 $0 20 2003 263 133 199 486 112 164 174 2004 2005 2006 2007 477 504 428 378 323 1,411 1,411 1,094 755 637 2008 2009 2010 2011 2Q12 Returned 77.2% of inception to date net income to common shareholders $1.9 Billion of Capital Cumulatively Returned to Shareholders Common Equity Preferred Equity Debt Cumulative Share Repurchases Cumulative Dividends Endurance has proven its ability to generate capital which has allowed for the return to its shareholders of $1.9 billion through share repurchases and dividends while also supporting organic growth. Current capital levels exceed rating agency minimum levels allowing for the possibility of opportunistic growth in the event that markets harden.
|
|
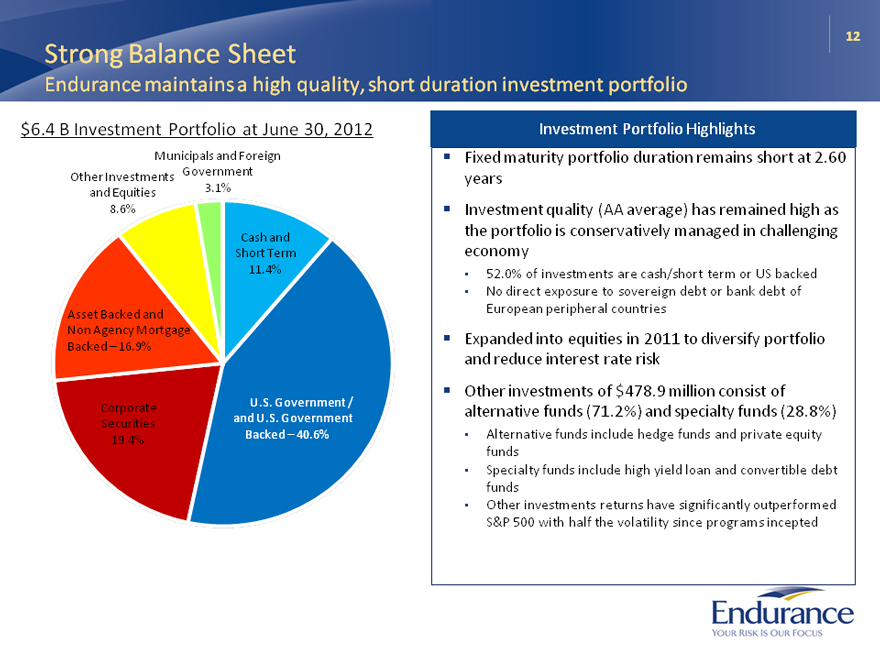
12 Strong Balance Sheet Endurance maintains a high quality, short duration investment portfolio $6.4 B Investment Portfolio at June 30, 2012 Municipals and Foreign Other Investments Government and Equities 3.1% 8.6% Asset Backed and Non Agency Mortgage Backed – 16.9% Corporate Securities 19.4% Cash and Short Term 11.4% U.S. Government / and U.S. Government Backed – 40.6% Investment Portfolio Highlights Fixed maturity portfolio duration remains short at 2.60 years Investment quality (AA average) has remained high as the portfolio is conservatively managed in challenging economy 52.0% of investments are cash/short term or US backed No direct exposure to sovereign debt or bank debt of European peripheral countries Expanded into equities in 2011 to diversify portfolio and reduce interest rate risk Other investments of $478.9 million consist of alternative funds (71.2%) and specialty funds (28.8%) Alternative funds include hedge funds and private equity funds Specialty funds include high yield loan and convertible debt funds Other investments returns have significantly outperformed S&P 500 with half the volatility since programs incepted
|
|
13 Conclusion Endurance is a compelling investment opportunity Strategically manage our businesses Selectively reduced reinsurance premiums, especially in competitive longer tail lines Shifted capital from all risk insurance business line to property catastrophe reinsurance business line Active capital deployment to return excess capital to shareholders—Reduced diluted shares outstanding by approximately 40% in the last five years Maintain excellent balance sheet strength and liquidity High quality, short duration investment portfolio; fixed maturity investments have an average credit quality of AA Prudent reserving philosophy and strong reserve position; strong history of favorable development Capital levels well in excess of rating agency minimums provide flexibility to grow in potentially hardening markets The outlook for Endurance’s book of business remains attractive Experiencing improved pricing across most of our lines of business Catastrophe lines have remained disciplined and profitable and market conditions are improving Small account casualty insurance lines are experiencing rate hardening
|

|
Appendix
Overview of ARMtech
|
|
16 Overview of ARMtech Acquisition of ARMtech has been a great success for Endurance ARMtech was founded by software developers and has maintained a strong focus on providing industry leading service through leveraging technology Writes crop insurance through independent agents across 44 states Based in Lubbock, Texas with historic concentration in Texas and southern states Recent growth has further balanced the portfolio geographically and by crop ARMtech built a leading specialty crop insurance business from scratch over the last 11 years Approximate 7% market share and is 5th largest of 15 industry participants Has grown to over 159,000 policies in force 2012 crop year* gross written premiums estimated to be $905 million Endurance purchased ARMtech in December 2007 at a purchase price of approximately $125 million Since the acquisition, ARMtech has generated in excess of $160 million in operating profit ARMtech has grown MPCI policy count by 40.4% since 2007 Agriculture insurance provides strong return potential, diversification in Endurance’s portfolio of (re)insurance risks and is an efficient user of capital 2012 crop year is defined as July 1, 2011 through June 30, 2012 which is the period covered by crop insurance and reinsurance
|
|
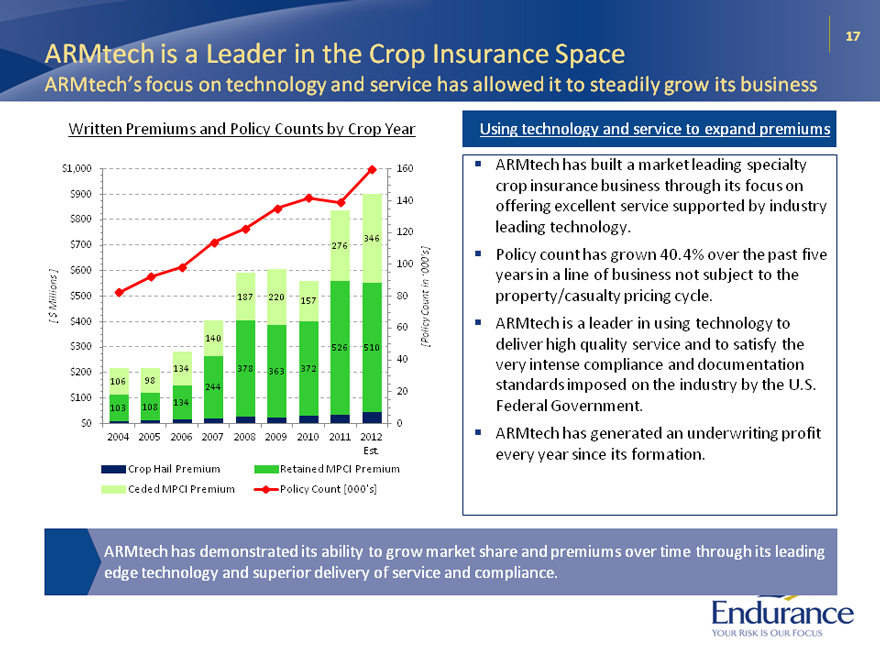
17 ARMtech is a Leader in the Crop Insurance Space ARMtech’s focus on technology and service has allowed it to steadily grow its business Written Premiums and Policy Counts by Crop Year Using technology and service to expand premiums [$ millions] $1,000 $900 $800 $700 $600 $500 $400 $300 $200 $100 $0 106 103 140 134 98 244 108 134 187 378 276 220 157 526 363 372 160 140 120 346 100 ‘000’s] 80 60 510 40 20 0 2004 2005 2006 2007 2008 2009 2010 2011 2012 Est. [Policy Count in ‘000’ s] Crop Hail Premium Retained MPCI Premium Ceded MPCI Premium Policy Count [000’s] ARMtech has built a market leading specialty crop insurance business through its focus on offering excellent service supported by industry leading technology. Policy count has grown 40.4% over the past five years in a line of business not subject to the property/casualty pricing cycle. ARMtech is a leader in using technology to deliver high quality service and to satisfy the very intense compliance and documentation standards imposed on the industry by the U.S. Federal Government. ARMtech has generated an underwriting profit every year since its formation. ARMtech has demonstrated its ability to grow market share and premiums over time through its leading edge technology and superior delivery of service and compliance.
|
|
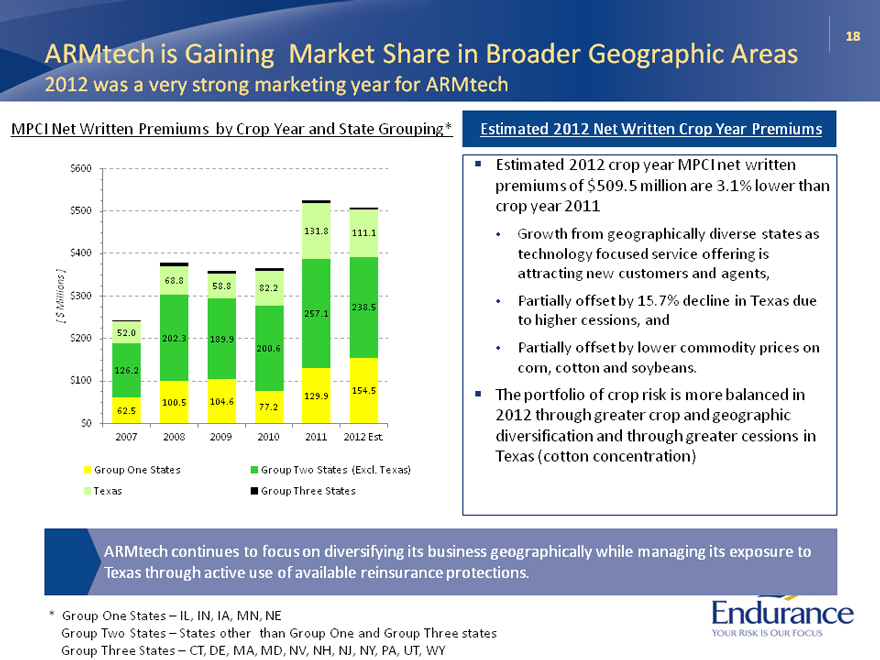
18 ARMtech is Gaining Market Share in Broader Geographic Areas 2012 was a very strong marketing year for ARMtech MPCI Net Written Premiums by Crop Year and State Grouping* $600 [$ Millions] $500 $400 $300 $200 $100 $0 52.0 126.2 62.5 2007 68.8 202.3 100.5 2008 58.8 189.9 104.6 2009 82.2 200.6 77.2 2010 131.8 257.1 129.9 2011 111.1 238.5 154.5 2012 Est. Group One States Texas Group Two States (Excl. Texas) Group Three States Estimated 2012 Net Written Crop Year Premiums Estimated 2012 crop year MPCI net written premiums of $509.5 million are 3.1% lower than crop year 2011 Growth from geographically diverse states as technology focused service offering is attracting new customers and agents, Partially offset by 15.7% decline in Texas due to higher cessions, and Partially offset by lower commodity prices on corn, cotton and soybeans. The portfolio of crop risk is more balanced in 2012 through greater crop and geographic diversification and through greater cessions in Texas (cotton concentration) ARMtech continues to focus on diversifying its business geographically while managing its exposure to Texas through active use of available reinsurance protections. *Group One States – IL, IN, IA, MN, NE Group Two States – States other than Group One and Group Three states Group Three States – CT, DE, MA, MD, NV, NH, NJ, NY, PA, UT, WY Agriculture Insurance is Not Correlated with the P&C Business Cycle
|
|
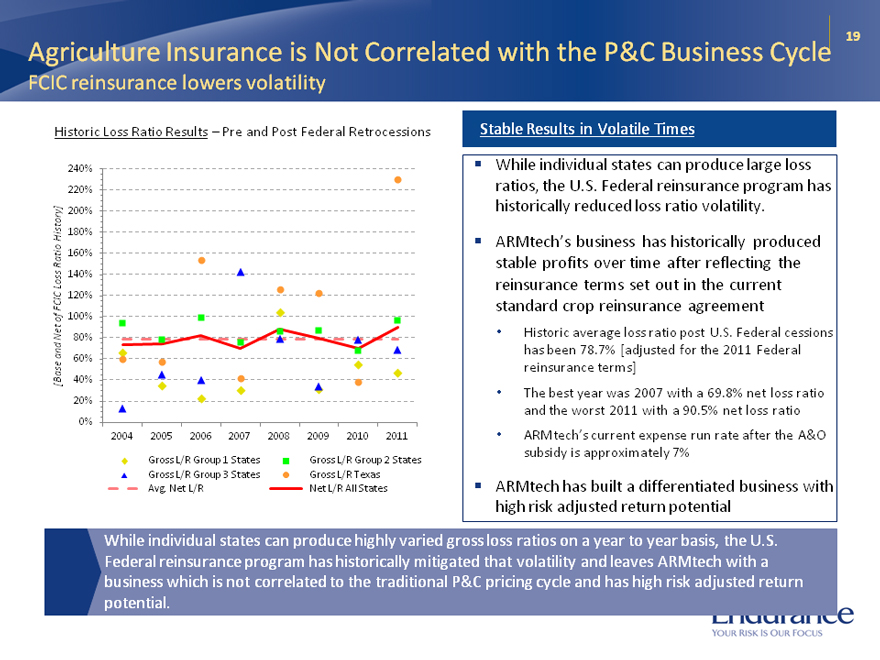
19 FCIC reinsurance lowers volatility Historic Loss Ratio Results – Pre and Post Federal Retrocessions Stable Results in Volatile Times 2004 2005 2006 2007 2008 2009 2010 2011 Gross L/R Group 1 States Gross L/R Group 3 States Avg. Net L/R Gross L/R Group 2 States Gross L/R Texas Net L/R All States While individual states can produce large loss ratios, the U.S. Federal reinsurance program has historically reduced loss ratio volatility. ARMtech’s business has historically produced stable profits over time after reflecting the reinsurance terms set out in the current standard crop reinsurance agreement Historic average loss ratio post U.S. Federal cessions has been 78.7% [adjusted for the 2011 Federal reinsurance terms] The best year was 2007 with a 69.8% net loss ratio and the worst 2011 with a 90.5% net loss ratio ARMtech’s current expense run rate after the A&O subsidy is approximately 7% ARMtech has built a differentiated business with high risk adjusted return potential While individual states can produce highly varied gross loss ratios on a year to year basis, the U.S. Federal reinsurance program has historically mitigated that volatility and leaves ARMtech with a business which is not correlated to the traditional P&C pricing cycle and has high risk adjusted return potential.
|
|
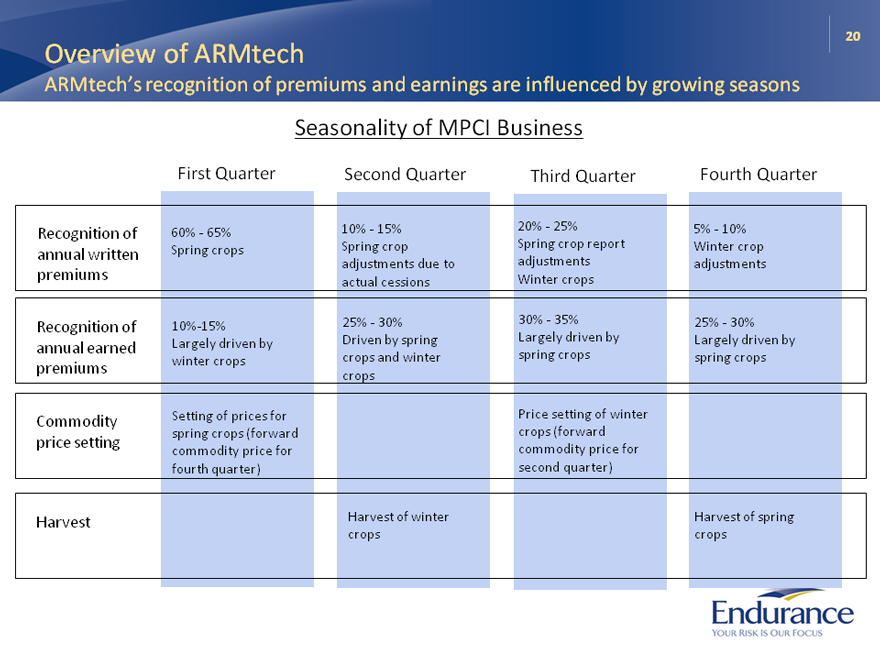
20 Overview of ARMtech ARMtech’s recognition of premiums and earnings are influenced by growing seasons Seasonality of MPCI Business Recognition of annual written premiums Recognition of annual earned premiums Commodity price setting Harvest First Quarter 60%—65% Spring crops 10%-15% Largely driven by winter crops Setting of prices for spring crops (forward commodity price for fourth quarter) Second Quarter 10%—15% Spring crop adjustments due to actual cessions 25%—30% Driven by spring crops and winter crops Harvest of winter crops Third Quarter 20%—25% Spring crop report adjustments Winter crops 30%—35% Largely driven by spring crops Price setting of winter crops (forward commodity price for second quarter) Fourth Quarter 5%—10% Winter crop adjustments 25%—30% Largely driven by spring crops Harvest of spring crops
|
|
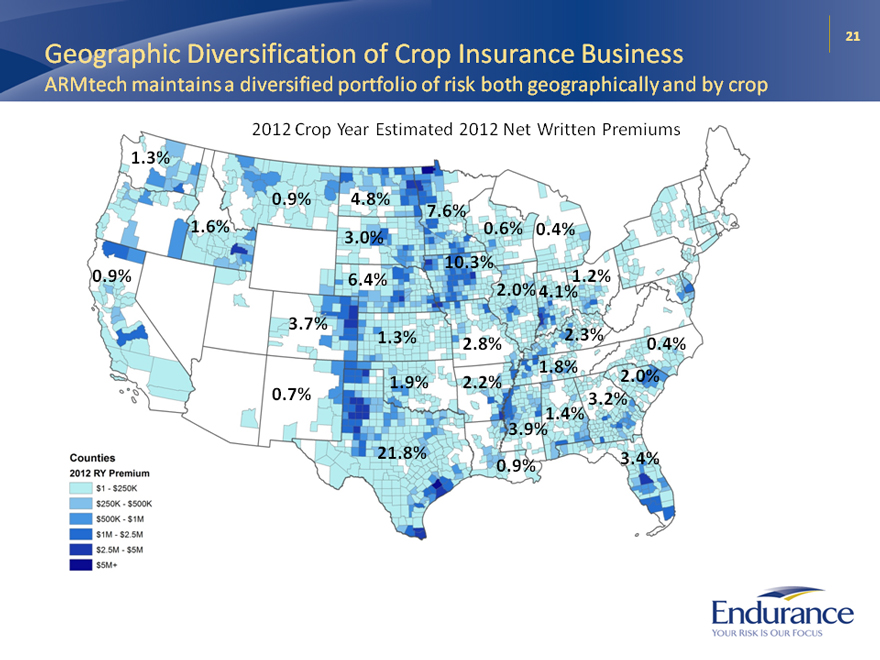
21 Geographic Diversification of Crop Insurance Business ARMtech maintains a diversified portfolio of risk both geographically and by crop 2012 Crop Year Estimated 2012 Net Written Premiums 1.3% 0.9% 4.8% 7.6% 1.6% 0.6% 0.4% 3.0% 10.3% 0.9% 6.4% 1.2% 2.0% 4.1% 3.7% 1.3% 2.3% 2.8% 0.4% 1.8% 1.9% 2.2% 2.0% 0.7% 3.2% 1.4% 3.9% 21.8% 3.4% 0.9%
|
|
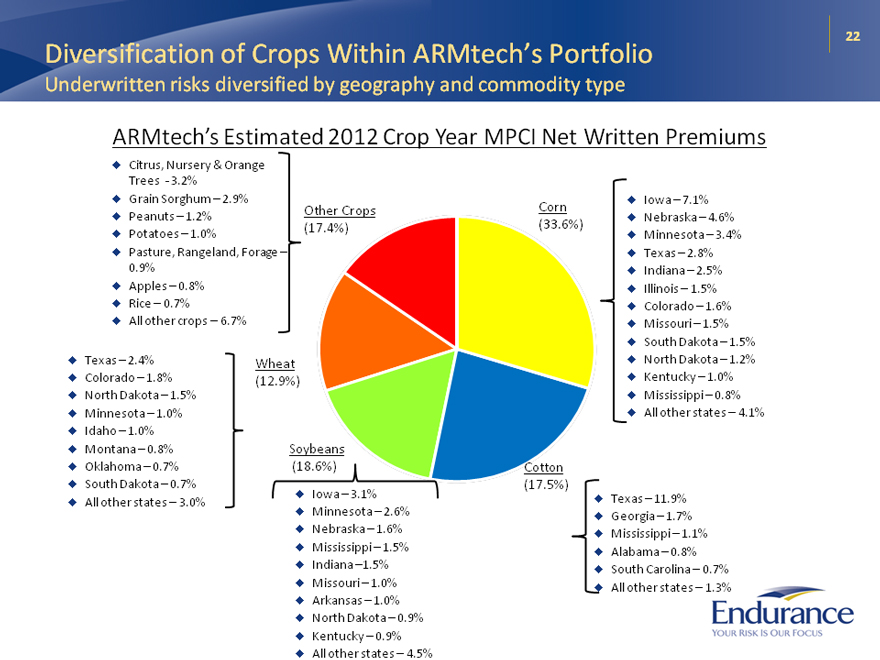
22 Diversification of Crops Within ARMtech’s Portfolio Underwritten risks diversified by geography and commodity type ARMtech’s Estimated 2012 Crop Year MPCI Net Written Premiums Citrus, Nursery & Orange Trees—3.2% Grain Sorghum – 2.9% Peanuts – 1.2% Potatoes – 1.0% Pasture, Rangeland, Forage – 0.9% Apples – 0.8% Rice – 0.7% All other crops – 6.7% Other Crops (17.4%) Texas – 2.4% Colorado – 1.8% North Dakota – 1.5% Minnesota – 1.0% Idaho – 1.0% Montana – 0.8% Oklahoma – 0.7% South Dakota – 0.7% All other states – 3.0% Wheat (12.9%) Soybeans (18.6%) Iowa – 3.1% Minnesota – 2.6% Nebraska – 1.6% Mississippi – 1.5% Indiana –1.5% Missouri – 1.0% Arkansas – 1.0% North Dakota – 0.9% Kentucky – 0.9% All other states – 4.5% Corn (33.6%) Cotton (17.5%) Iowa – 7.1% Nebraska – 4.6% Minnesota – 3.4% Texas – 2.8% Indiana – 2.5% Illinois – 1.5% Colorado – 1.6% Missouri – 1.5% South Dakota – 1.5% North Dakota – 1.2% Kentucky – 1.0% Mississippi – 0.8% All other states – 4.1% Texas – 11.9% Georgia – 1.7% Mississippi – 1.1% Alabama – 0.8% South Carolina – 0.7% All other states – 1.3%
|
|
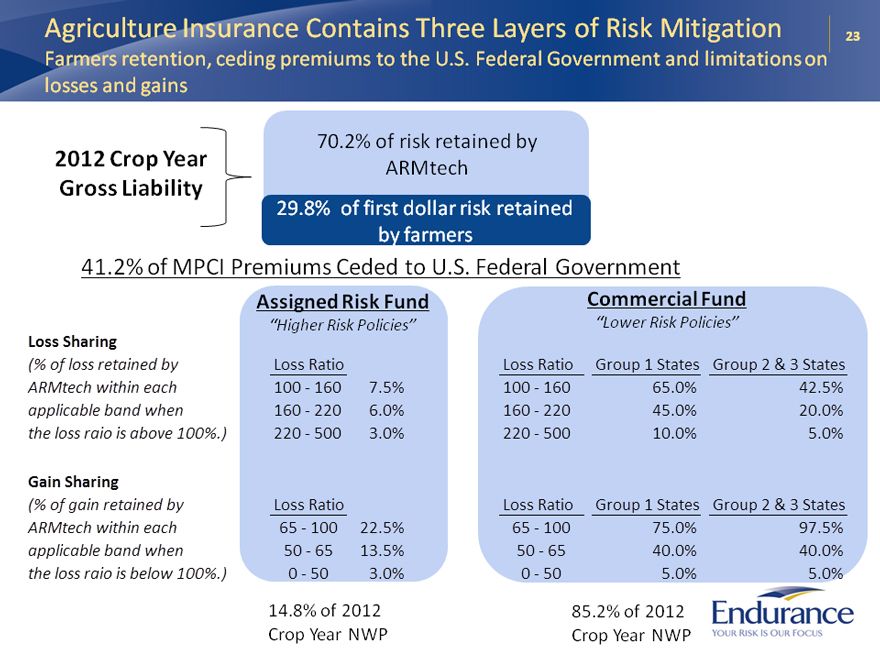
23 Agriculture Insurance Contains Three Layers of Risk Mitigation Farmers retention, ceding premiums to the U.S. Federal Government and limitations on losses and gains 2012 Crop Year Gross Liability 70.2% of risk retained by ARMtech 29.8% of first dollar risk retained by farmers 41.2% of MPCI Premiums Ceded to U.S. Federal Government Loss Sharing (% of loss retained by ARMtech within each applicable band when the loss raio is above 100%.) Gain Sharing (% of gain retained by ARMtech within each applicable band when the loss raio is below 100%.) Assigned Risk Fund “Higher Risk Policies” Loss Ratio 100—160 7.5% 160—220 6.0% 220—500 3.0% Loss Ratio 65—100 22.5% 50—65 13.5% 0—50 3.0% Commercial Fund “Lower Risk Policies” Loss Ratio 100—160 160—220 220—500 Group 1 States 65.0% 45.0% 10.0% Group 2 & 3 States 42.5% 20.0% 5.0% Loss Ratio 65—100 50—65 0—50 Group 1 States 75.0% 40.0% 5.0% Group 2 & 3 States 97.5% 40.0% 5.0% 14.8% of 2012 Crop Year NWP 85.2% of 2012 Crop Year NWP
|
|
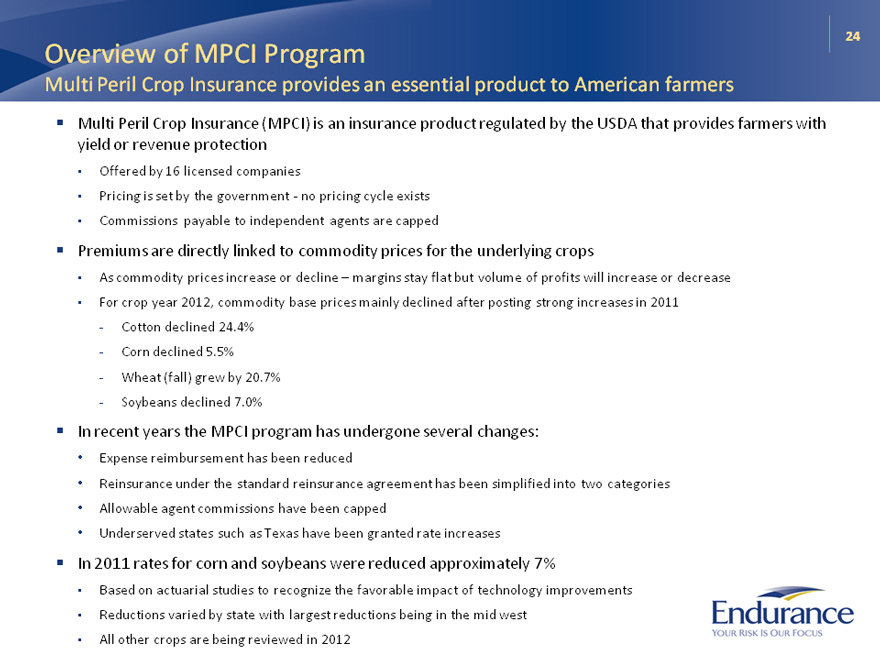
24 Overview of MPCI Program Multi Peril Crop Insurance provides an essential product to American farmers Multi Peril Crop Insurance (MPCI) is an insurance product regulated by the USDA that provides farmers with yield or revenue protection Offered by 16 licensed companies Pricing is set by the government—no pricing cycle exists Commissions payable to independent agents are capped Premiums are directly linked to commodity prices for the underlying crops As commodity prices increase or decline – margins stay flat but volume of profits will increase or decrease For crop year 2012, commodity base prices mainly declined after posting strong increases in 2011 Cotton declined 24.4% Corn declined 5.5% Wheat (fall) grew by 20.7% Soybeans declined 7.0% In recent years the MPCI program has undergone several changes: Expense reimbursement has been reduced Reinsurance under the standard reinsurance agreement has been simplified into two categories Allowable agent commissions have been capped Underserved states such as Texas have been granted rate increases In 2011 rates for corn and soybeans were reduced approximately 7% Based on actuarial studies to recognize the favorable impact of technology improvements Reductions varied by state with largest reductions being in the mid west All other crops are being reviewed in 2012
|

|
Other Miscellaneous Information
|
|
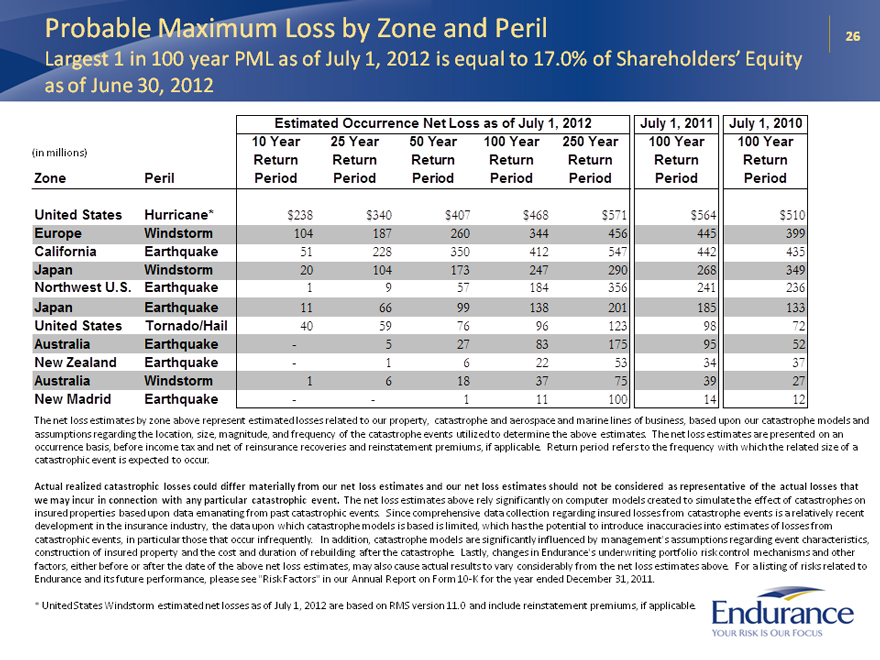
26 Probable Maximum Loss by Zone and Peril Largest 1 in 100 year PML as of July 1, 2012 is equal to 17.0% of Shareholders’ Equity as of June 30, 2012 (in millions) Zone United States Europe California Japan Northwest U.S. Japan United States Australia New Zealand Australia New Madrid Peril Hurricane* Windstorm Earthquake Windstorm Earthquake Earthquake Tornado/Hail Earthquake Earthquake Windstorm Earthquake Estimated Occurrence Net Loss as of July 1, 2012 July 1, 2011 July 1, 2010 10 Year Return Period $238 104 51 20 1 11 40—- 1—25 Year Return Period $340 187 228 104 9 66 59 5 1 6—50 Year Return Period $407 260 350 173 57 99 76 27 6 18 1 100 Year Return Period $468 344 412 247 184 138 96 83 22 37 11 250 Year Return Period $571 456 547 290 356 201 123 175 53 75 100 100 Year Return Period $564 445 442 268 241 185 98 95 34 39 14 100 Year Return Period $510 399 435 349 236 133 72 52 37 27 12 The net loss estimates by zone above represent estimated losses related to our property, catastrophe and aerospace and marine lines of business, based upon our catastrophe models and assumptions regarding the location, size, magnitude, and frequency of the catastrophe events utilized to determine the above estimates. The net loss estimates are presented on an occurrence basis, before income tax and net of reinsurance recoveries and reinstatement premiums, if applicable. Return period refers to the frequency with which the related size of a catastrophic event is expected to occur. Actual realized catastrophic losses could differ materially from our net loss estimates and our net loss estimates should not be considered as representative of the actual losses that we may incur in connection with any particular catastrophic event. The net loss estimates above rely significantly on computer models created to simulate the effect of catastrophes on insured properties based upon data emanating from past catastrophic events. Since comprehensive data collection regarding insured losses from catastrophe events is a relatively recent development in the insurance industry, the data upon which catastrophe models is based is limited, which has the potential to introduce inaccuracies into estimates of losses from catastrophic events, in particular those that occur infrequently. In addition, catastrophe models are significantly influenced by management’s assumptions regarding event characteristics, construction of insured property and the cost and duration of rebuilding after the catastrophe. Lastly, changes in Endurance’s underwriting portfolio risk control mechanisms and other factors, either before or after the date of the above net loss estimates, may also cause actual results to vary considerably from the net loss estimates above. For a listing of risks related to Endurance and its future performance, please see “Risk Factors” in our Annual Report on Form 10-K for the year ended December 31, 2011. * United States Windstorm estimated net losses as of July 1, 2012 are based on RMS version 11.0 and include reinstatement premiums, if applicable.
|
|
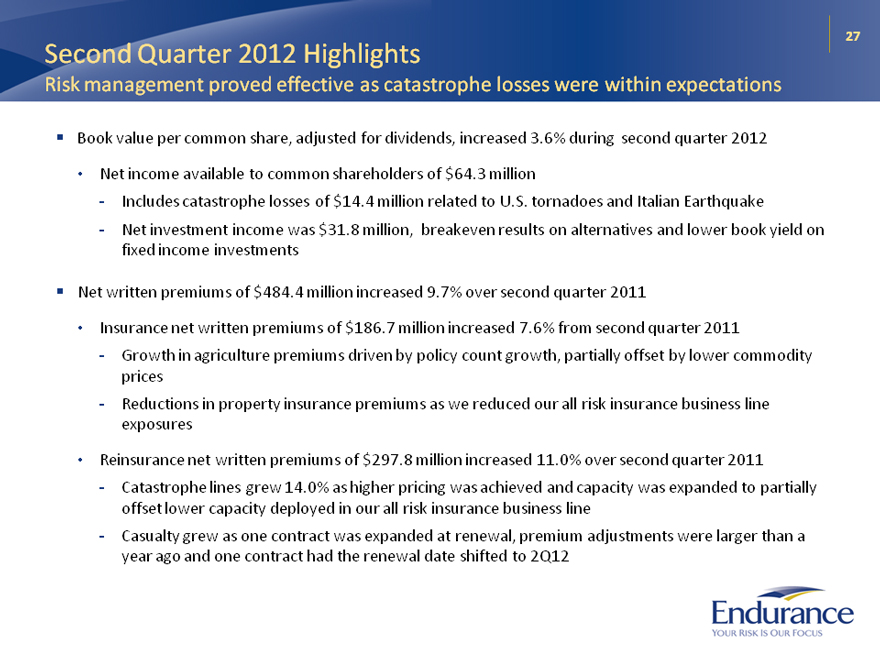
27 Second Quarter 2012 Highlights Risk management proved effective as catastrophe losses were within expectations Book value per common share, adjusted for dividends, increased 3.6% during second quarter 2012 Net income available to common shareholders of $64.3 million Includes catastrophe losses of $14.4 million related to U.S. tornadoes and Italian Earthquake Net investment income was $31.8 million, breakeven results on alternatives and lower book yield on fixed income investments Net written premiums of $484.4 million increased 9.7% over second quarter 2011 Insurance net written premiums of $186.7 million increased 7.6% from second quarter 2011 Growth in agriculture premiums driven by policy count growth, partially offset by lower commodity prices Reductions in property insurance premiums as we reduced our all risk insurance business line exposures Reinsurance net written premiums of $297.8 million increased 11.0% over second quarter 2011 Catastrophe lines grew 14.0% as higher pricing was achieved and capacity was expanded to partially offset lower capacity deployed in our all risk insurance business line Casualty grew as one contract was expanded at renewal, premium adjustments were larger than a year ago and one contract had the renewal date shifted to 2Q12
|
|
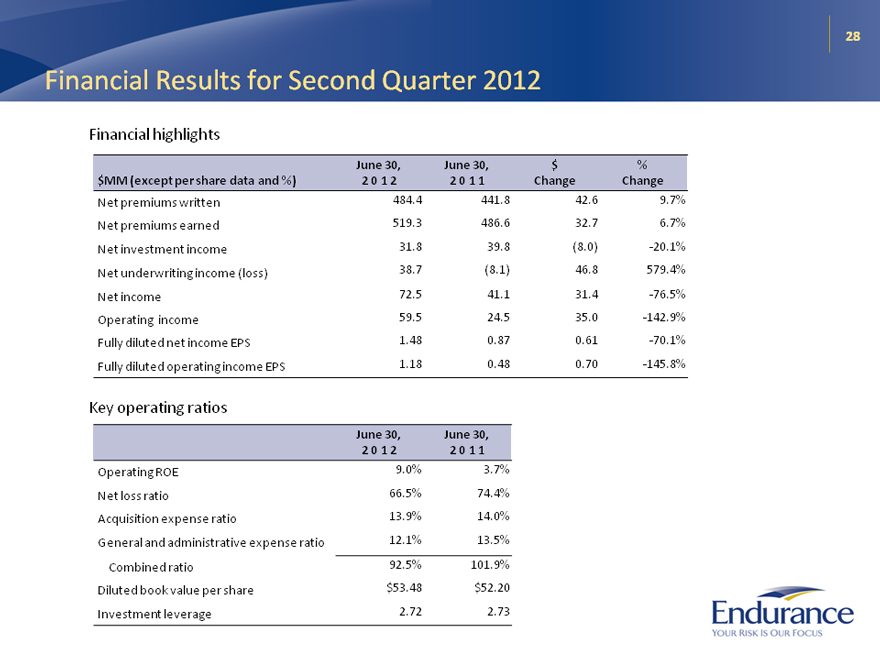
28 Financial Results for Second Quarter 2012 Financial highlights $MM (except per share data and %) Net premiums written Net premiums earned Net investment income Net underwriting income (loss) Net income Operating income Fully diluted net income EPS Fully diluted operating income EPS June 30, 2 0 1 2 484.4 519.3 31.8 38.7 72.5 59.5 1.48 1.18 June 30, 2 0 1 1 441.8 486.6 39.8 (8.1) 41.1 24.5 0.87 0.48 $ Change 42.6 32.7 (8.0) 46.8 31.4 35.0 0.61 0.70 % Change 9.7% 6.7% -20.1% 579.4% -76.5% -142.9% -70.1% -145.8% Key operating ratios Operating ROE Net loss ratio Acquisition expense ratio General and administrative expense ratio Combined ratio Diluted book value per share Investment leverage June 30, 2 0 1 2 9.0% 66.5% 13.9% 12.1% 92.5% $53.48 2.72 June 30, 2 0 1 1 3.7% 74.4% 14.0% 13.5% 101.9% $52.20 2.73
|
|
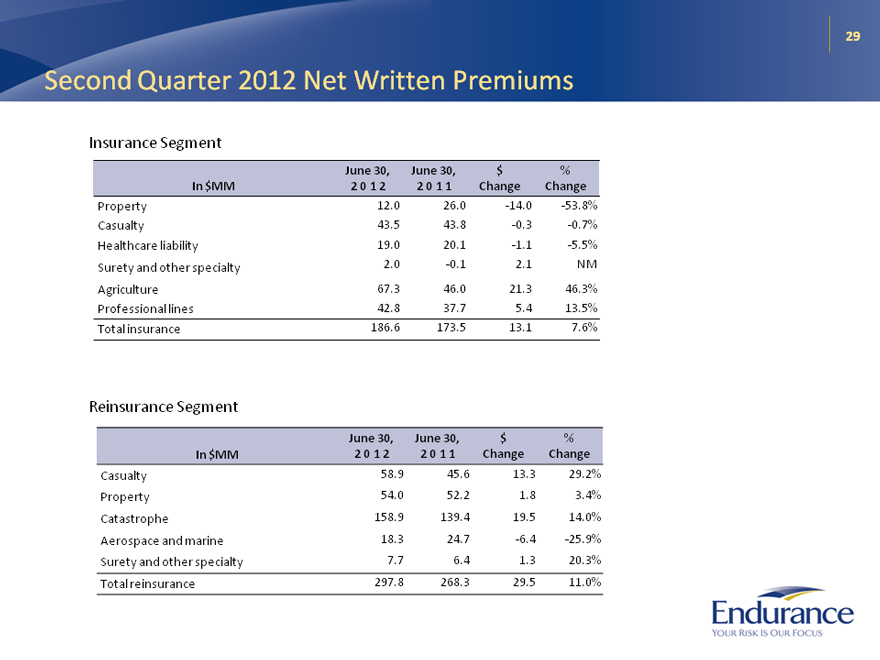
29 Second Quarter 2012 Net Written Premiums Insurance Segment In $MM Property Casualty Healthcare liability Surety and other specialty Agriculture Professional lines Total insurance June 30, 2 0 1 2 12.0 43.5 19.0 2.0 67.3 42.8 186.6 June 30, 2 0 1 1 26.0 43.8 20.1 -0.1 46.0 37.7 173.5 $ Change -14.0 -0.3 -1.1 2.1 21.3 5.4 13.1 % Change -53.8% -0.7% -5.5% NM 46.3% 13.5% 7.6% Reinsurance Segment In $MM Casualty Property Catastrophe Aerospace and marine Surety and other specialty Total reinsurance June 30, 2 0 1 2 58.9 54.0 158.9 18.3 7.7 297.8 June 30, 2 0 1 1 45.6 52.2 139.4 24.7 6.4 268.3 $ Change 13.3 1.8 19.5 -6.4 1.3 29.5 % Change 29.2% 3.4% 14.0% -25.9% 20.3% 11.0%
|
|
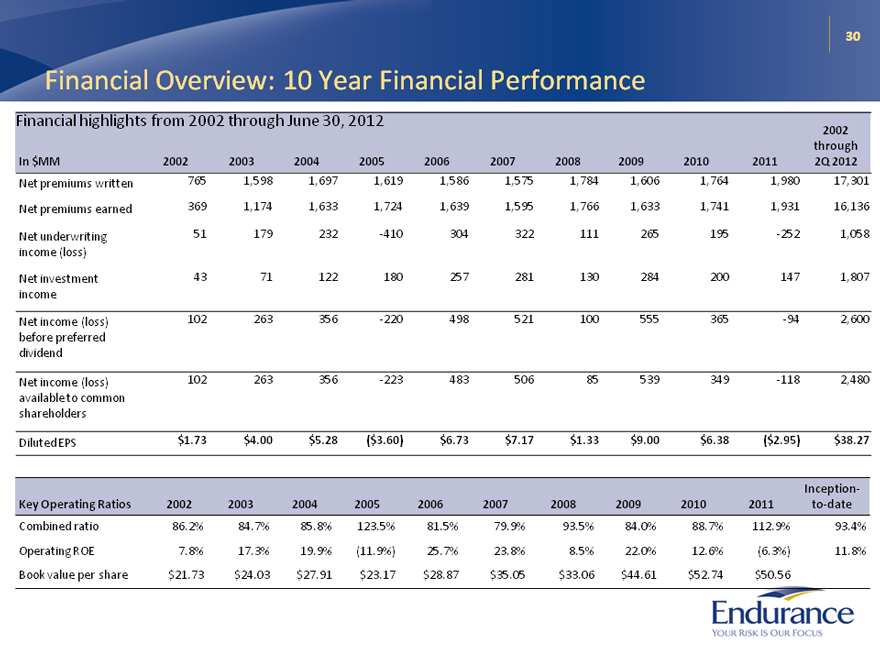
30 Financial Overview: 10 Year Financial Performance Financial highlights from 2002 through June 30, 2012 In $MM Net premiums written Net premiums earned Net underwriting income (loss) Net investment income Net income (loss) before preferred dividend Net income (loss) available to common shareholders Diluted EPS Key Operating Ratios Combined ratio Operating ROE Book value per share 2002 765 369 51 43 102 102 $1.73 2002 86.2% 7.8% $21.73 2003 1,598 1,174 179 71 263 263 $4.00 2003 84.7% 17.3% $24.03 2004 1,697 1,633 232 122 356 356 $5.28 2004 85.8% 19.9% $27.91 2005 1,619 1,724 -410 180 -220 -223 ($3.60) 2005 123.5% (11.9%) $23.17 2006 1,586 1,639 304 257 498 483 $6.73 2006 81.5% 25.7% $28.87 2007 1,575 1,595 322 281 521 506 $7.17 2007 79.9% 23.8% $35.05 2008 1,784 1,766 111 130 100 85 $1.33 2008 93.5% 8.5% $33.06 2009 1,606 1,633 265 284 555 539 $9.00 2009 84.0% 22.0% $44.61 2010 1,764 1,741 195 200 365 349 $6.38 2010 88.7% 12.6% $52.74 2011 1,980 1,931 -252 147 -94 -118 ($2.95) 2011 112.9% (6.3%) $50.56 2002 through 2Q 2012 17,301 16,136 1,058 1,807 2,600 2,480 $38.27 Inception- to-date 93.4% 11.8%