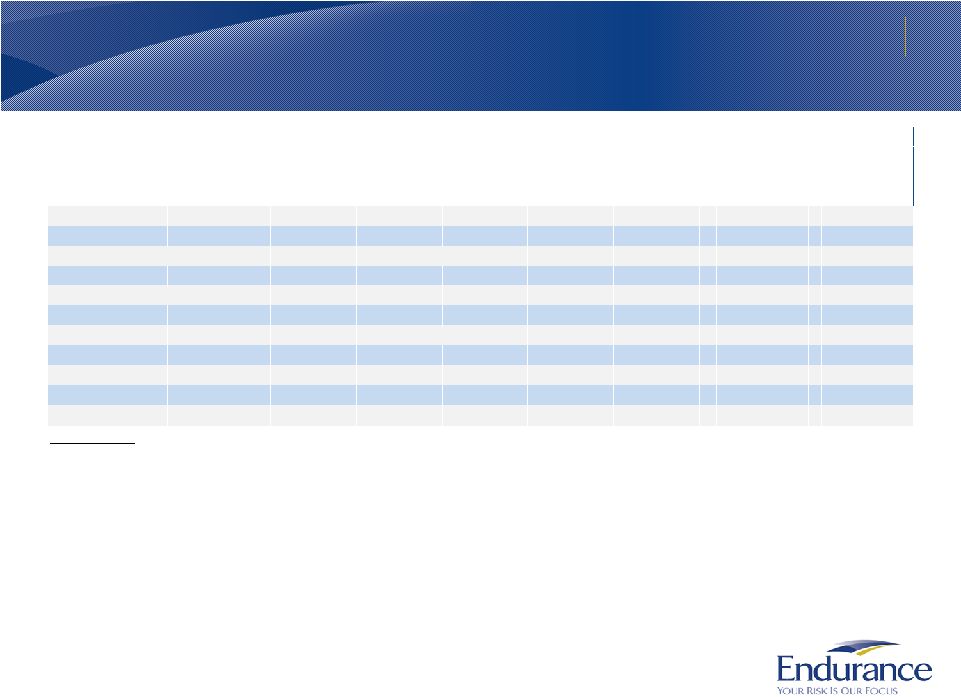
The net loss estimates by zone above represent estimated losses related to our property, catastrophe and aerospace and marine lines of business, based upon our catastrophe models and assumptions regarding the location, size, magnitude, and frequency of the catastrophe events utilized to determine the above estimates. The net loss estimates are presented on an occurrence basis, before income tax and net of reinsurance recoveries and reinstatement premiums, if applicable. Return period refers to the frequency with which the related size of a catastrophic event is expected to occur. Actual realized catastrophic losses could differ materially from our net loss estimates and our net loss estimates should not be considered as representative of the actual losses that we may incur in connection with any particular catastrophic event. The net loss estimates above rely significantly on computer models created to simulate the effect of catastrophes on insured properties based upon data emanating from past catastrophic events. Since comprehensive data collection regarding insured losses from catastrophe events is a relatively recent development in the insurance industry, the data upon which catastrophe models is based is limited, which has the potential to introduce inaccuracies into estimates of losses from catastrophic events, in particular those that occur infrequently. In addition, catastrophe models are significantly influenced by management's assumptions regarding event characteristics, construction of insured property and the cost and duration of rebuilding after the catastrophe. Lastly, changes in Endurance's underwriting portfolio risk control mechanisms and other factors, either before or after the date of the above net loss estimates, may also cause actual results to vary considerably from the net loss estimates above. For a listing of risks related to Endurance and its future performance, please see "Risk Factors" in our Annual Report on Form 10-K for the year ended December 31, 2011. * United States Windstorm estimated net losses as of July 1, 2012 are based on RMS version 11.0 and include reinstatement premiums, if applicable. 26 Probable Maximum Loss by Zone and Peril Largest 1 in 100 year PML as of July 1, 2012 is equal to 16.6% of Shareholders’ Equity as of September 30, 2012 Values in $ Millions Estimated Occurrence Net Loss as of July 1, 2012 July 1, 2011 July 1, 2010 1-in-10 1-in-25 1-in-50 1-in-100 1-in-250 1-in-100 1-in-100 Year Year Year Year Year Year Year Zone Peril Return Return Return Return Return Return Return United States Hurricane $238 $340 $407 $468 $571 $564 $510 Europe Windstorm 104 187 260 344 456 445 399 California Earthquake 51 228 350 412 547 442 435 Japan Windstorm 20 104 173 247 290 268 349 Northwest U.S. Earthquake 1 9 57 184 356 241 236 Japan Earthquake 11 66 99 138 201 185 133 United States Tornado/Hail 40 59 76 96 123 98 72 Australia Earthquake - 5 27 83 175 95 52 New Zealand Earthquake - 1 6 22 53 34 37 Australia Windstorm 1 6 18 37 75 39 27 New Madrid Earthquake - - 1 11 100 14 12 | 
