Exhibit 99.2

Investor Day 2010B September 14, 2010
2 Cautionary Statement Safe Harbor Statement under the Private Securities Litigation Reform Act of 1995: This slide presentation, as well as our accompanying oral remarks, contain numerous “forward-looking statements” regarding our operations for 2010 and subsequent fiscal years, the expected impact on our business of healthcare reform, future opportunities for growth and expansion, accounting estimates related to our MMIS business, financial guidance for fiscal year 2010, and various other matters. All of our forward-looking statements are subject to numerous risks, uncertainties, and other factors that could cause our actual results to differ materially. Anyone viewing or listening to this presentation is urged to read the risk factors and cautionary statements found under Item 1A in our 2009 Annual Report on Form 10-K filed on March 16, 2010, our first quarter 2010 Quarterly Report filed on May 10, 2010, our second quarter 2010 Quarterly Report filed on August 4th, 2010 and the risk factors and cautionary statements found in our other reports and filings with the Securities and Exchange Commission and available for viewing on its website at www.sec.gov. Except to the extent otherwise required by federal securities laws, we do not undertake to address or update forward-looking statements in future filings or communications regarding our business or operating results.

Agenda Time Topic Speaker 12:30pm-12:35pm Opening Remarks Juan José Orellana, VP Investor Relations J. Mario Molina, MD, Chief Executive Officer (video) 12:35pm-1:10pm Business Overview John Molina, Chief Financial Officer 1:10pm-1:30pm Panel 1 Q&A 1:30pm-1:40pm Coffee Break 1:40pm-2:15pm Operational Update Terry Bayer, Chief Operating Officer 2:15pm-2:40pm The New 16 Million Jean Glossa, MD, Medical Director 2:40pm-3:00pm Panel 2 Q&A 3:00pm-3:30pm MMS – Accounting Update Joseph White, Chief Accounting Officer 3:30pm-4:00pm 2010 Financial Update John Molina, Chief Financial Officer 4:00pm-4:15pm Panel 3 Q&A 4:15pm End of Program 3

Business Overview John Molina Chief Financial Officer
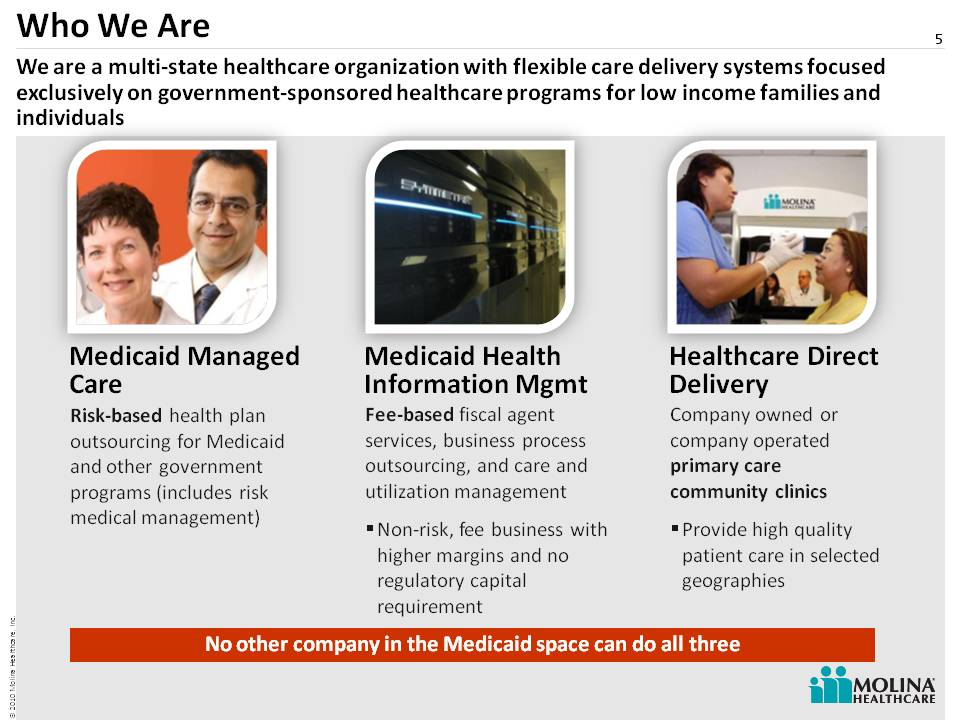
Fee-based fiscal agent services, business process outsourcing, and care and utilization management Non-risk, fee business with higher margins and no regulatory capital requirement Who We Are 5 No other company in the Medicaid space can do all three Medicaid Managed Care Medicaid Health Information Mgmt Healthcare Direct Delivery We are a multi-state healthcare organization with flexible care delivery systems focused exclusively on government-sponsored healthcare programs for low income families and individuals Company owned or company operated primary care community clinics Provide high quality patient care in selected geographies Risk-based health plan outsourcing for Medicaid and other government programs (in cludes risk medical management)
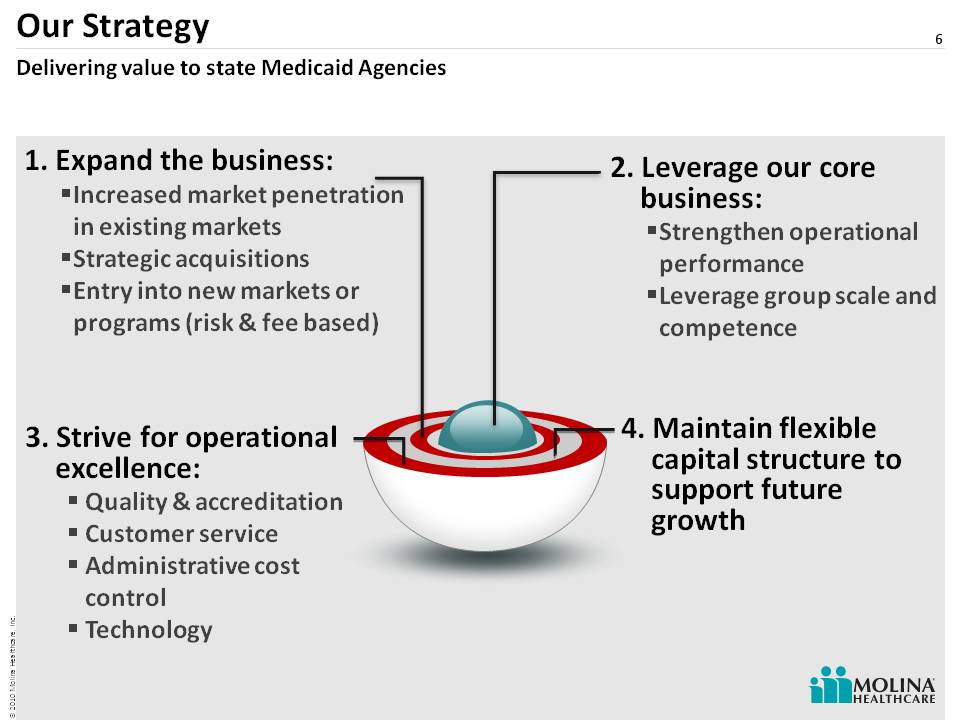
6 Our Strategy 2. Leverage our core business: Strengthen operational performance Leverage group scale and competence 1. Expand the business: Increased market penetration in existing markets Strategic acquisitions Entry into new markets or programs (risk & fee based) (Gp:) 3. Strive for operational excellence: Quality & accreditation Customer service Administrative cost control Technology Delivering value to state Medicaid Agencies 4. Maintain flexible capital structure to support future growth
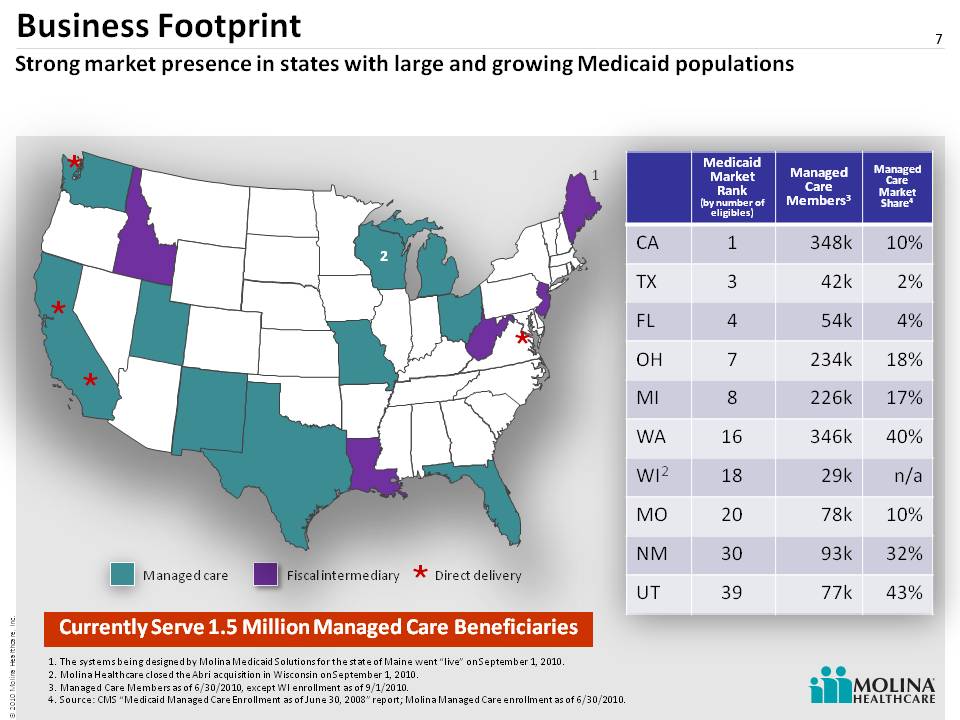
Business Footprint 7 Managed care Fiscal intermediary The systems being designed by Molina Medicaid Solutions for the state of Maine went “live” on September 1, 2010. Molina Healthcare closed the Abri acquisition in Wisconsin on September 1, 2010. Managed Care Members as of 6/30/2010, except WI enrollment as of 9/1/2010. Source: CMS “Medicaid Managed Care Enrollment as of June 30, 2008” report; Molina Managed Care enrollment as of 6/30/2010. Strong market presence in states with large and growing Medicaid populations Direct delivery Medicaid Market Rank (by number of eligibles) Managed Care Members 3 Managed Care Market Share 4 CA 1 348k 10% TX 3 42k 2% FL 4 54k 4% OH 7 234k 18% MI 8 226k 17% WA 16 346k 40% WI 18 29k n/a MO 20 78k 10% NM 30 93k 32% UT 39 77k 43% The systems being designed by Molin a Medicaid Solutions for the state of Maine went “live” on September 1, 2010. Molina Healthcare closed the Abri acquisition in Wisconsin on September 1, 2010. Managed Care Members as of 6/30/2010, except WI enrollment as of 9/1/2010. Source: CMS “Medicaid Managed Care Enrollment as of June 30, 2008” report; Molina Managed Care enrollment as of 6/30/2010. Currently Serve 1.5 Million Managed Care Beneficiaries
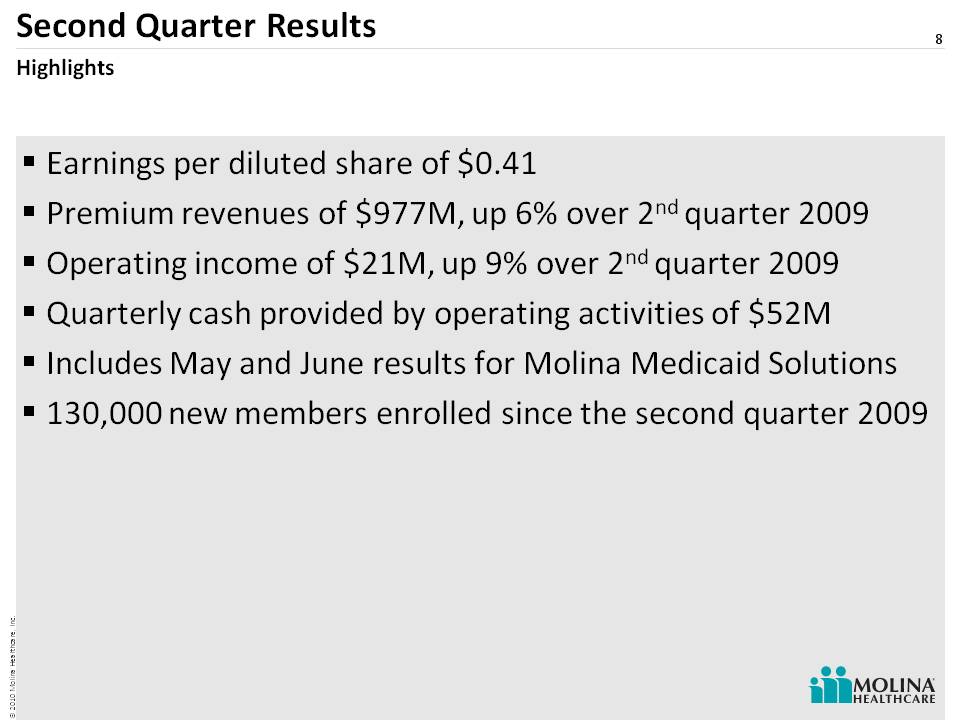
8 Second Quarter Results Earnings per diluted share of $0.41Premium revenues of $977M, up 6% over 2nd quarter 2009 Operating income of $21M, up 9% over 2nd quarter 2009 Quarterly cash provided by operating activities of $52M Includes May and June results for Molina Medicaid Solutions 130,000 new members enrolled since the second quarter 2009Highlights
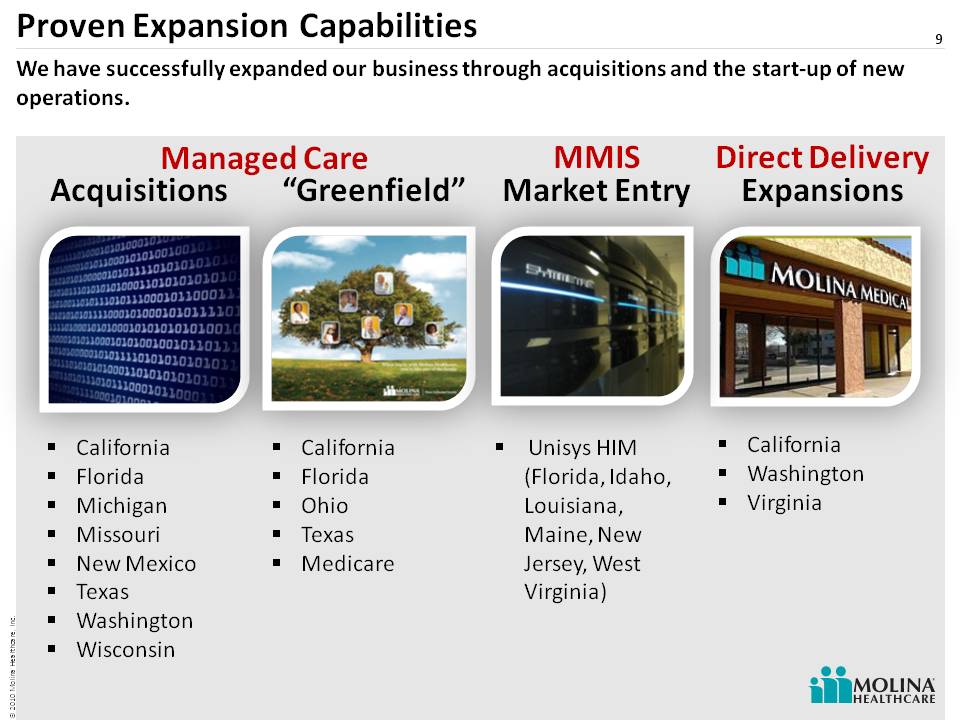
Proven Expansion Capabilities 9 “Greenfield” California Florida Ohio Texas Medicare Managed Care Acquisitions California Florida Michigan Missouri New Mexico Texas Washington Wisconsin Unisys HIM (Florida, Idaho, Louisiana, Maine, New Jersey, West Virginia) MMIS Market Entry California Washington Virginia Direct Delivery Expansions We have successfully expanded our business through acquisitions and the start-up of new operations.
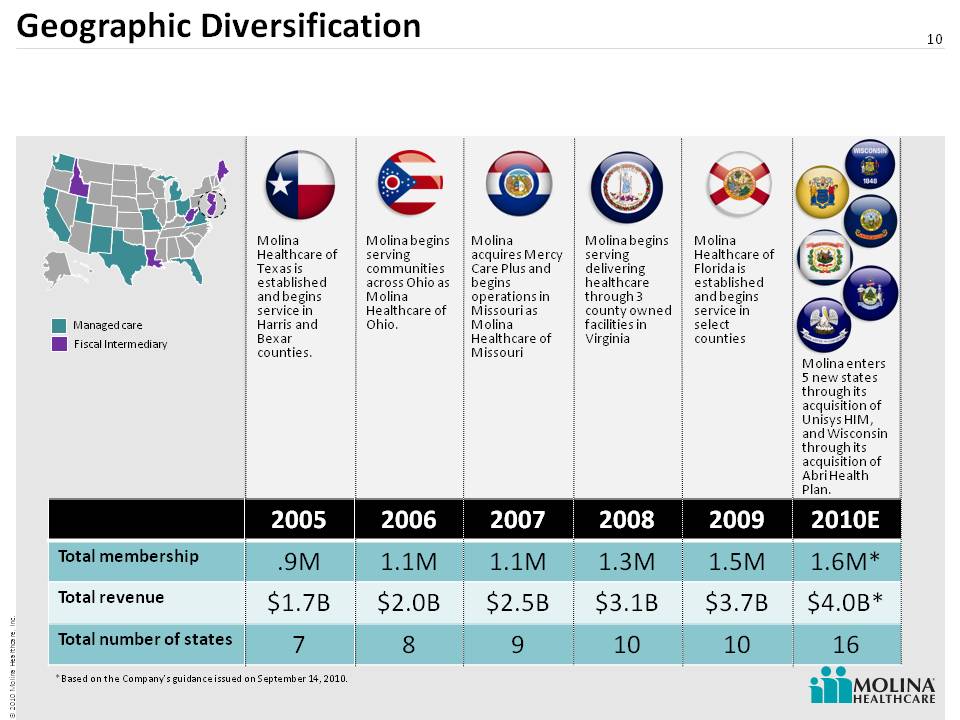
Geographic Diversification 10 Molina enters 5 new states through its acquisition of Unisys HIM, and Wisconsin through its acquisition of Abri Health Plan. Molina acquires Mercy Care Plus and begins operations in Missouri as Molina Healthcare of Missouri Molina begins serving delivering healthcare through 3 county owned facilities in Virginia Molina Healthcare of Texas is established and begins service in Harris and Bexar counties. Molina begins serving communities across Ohio as Molina Healthcare of Ohio. Managed care Fiscal Intermediary Molina Healthcare of Florida is established and begins service in select counties *Based on the Company’s guidance issued on September 14, 2010. 2005 2006& #160; 2007 2008 2009 2010E Total membership .9M 1.1M 1.1M 1.3M 1.5M 1.6M* Total revenue $1.7B $2.0B $2.5B $3.1B $3.7B $4.0B* Total number of states 7 8 9 10 10 16
11 Health Plan Update
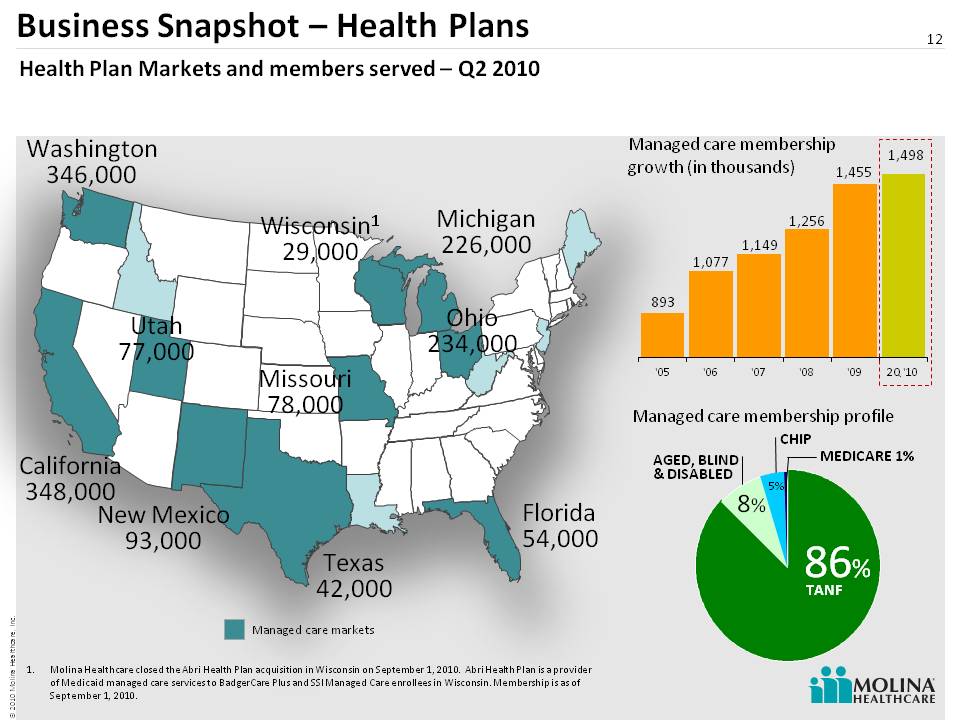
12 Business Snapshot – Health Plans 12 Health Plan Markets and members served – Q2 2010 Washington 346,000 California 348,000 New Mexico 93,000 Utah 77,000 Texas 42,000 Missouri 78,000 Michigan 226,000 Ohio 234,000 Florida 54,000 Managed care membership growth (in thousands) Managed care membership profile (Gp:) 87% (Gp:) TANF 8% 5% AGED, BLIND& DISABLED MEDICARE 1% (Gp:) 86% (Gp:) TANF 8% 5% CHIP Molina Healthcare closed the Abri Health Plan acquisition in Wisconsin on September 1, 2010. Abri Health Plan is a provider of Medicaid managed care services to Badge rCare Plus and SSI Managed Care enrollees in Wisconsin. Membership is as of September 1, 2010. Wisconsin1 29,000 Managed care markets
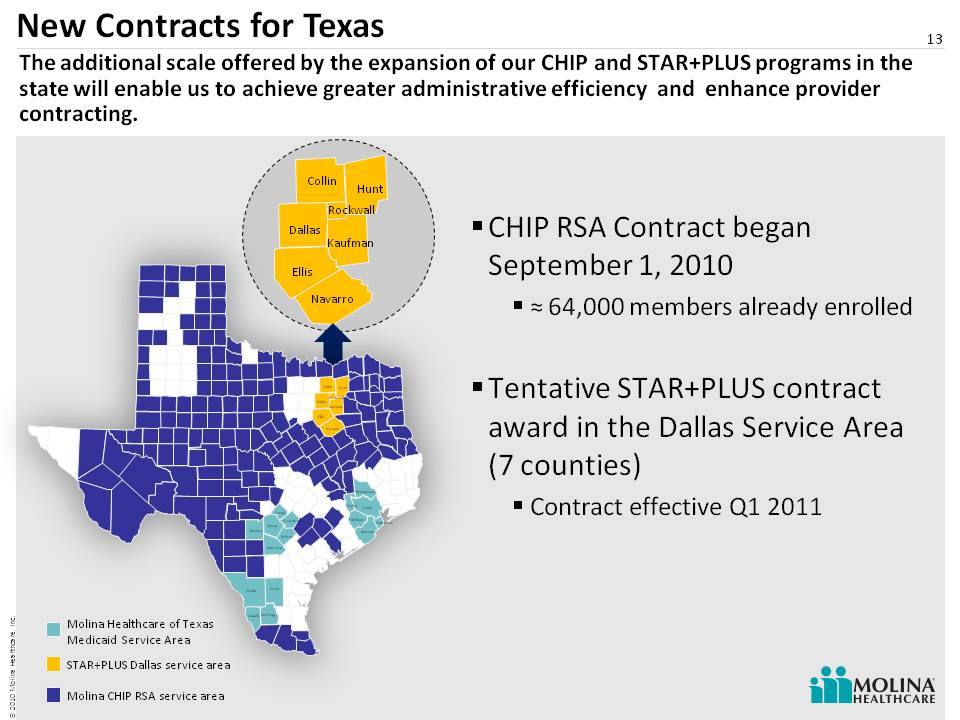
13 New Contracts for Texas 13 CHIP RSA Contract began September 1, 2010˜ 64,000 members already enrolled Tentative STAR+PLUS contract award in the Dallas Service Area (7 counties) Contract effective Q1 2011 Molina Healthcare of Texas Medicaid Service Area STAR+PLUS Dallas service area Collin Dallas Ellis Navarro Hunt Kaufman Rockwall Collin Dallas Atascosa Bexar Comal Duval Ellis Guadalupe Jim Hogg Medina Navarro Webb Wilson Zapata Brazoria Fort Bend Galveston Harris Hunt Kaufman Montgomery Rockwall Waller Molina CHIP RSA service area The additional scale offered by the expansion of our CHIP and STAR+PLUS programs in the state will enable us to achieve greater administrative efficiency and enhance provider contracting.
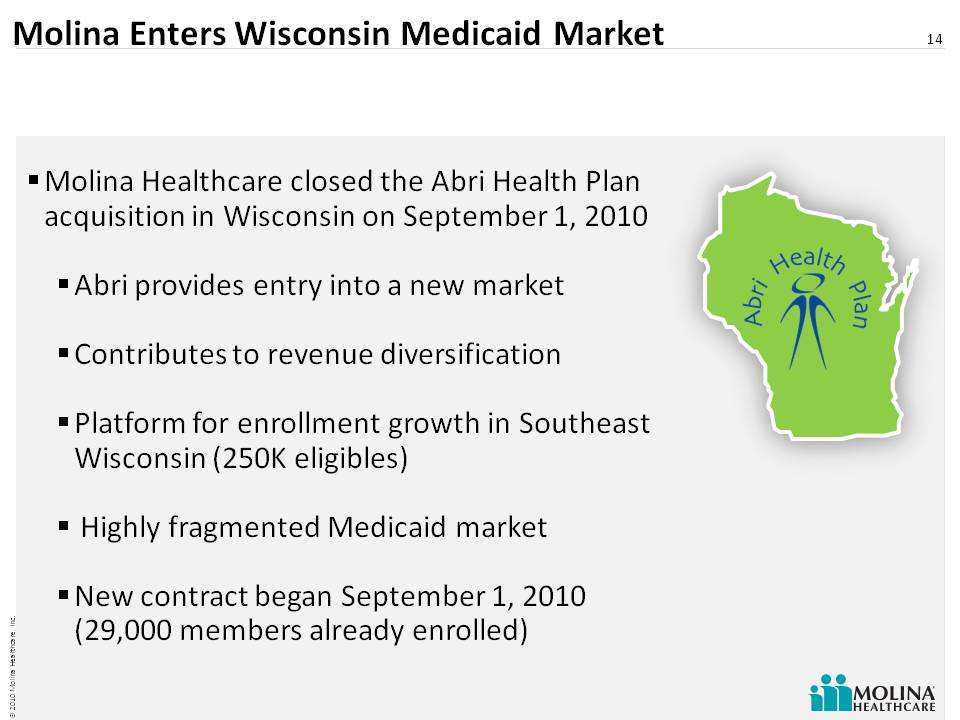
Molina Enters Wisconsin Medicaid Market Molina Healthcare closed the Abri Health Plan acquisition in Wisconsin on September 1, 2010 Abri provides entry into a new market Contributes to revenue diversification Platform for enrollment growth in Southeast Wisconsin (250K eligibles) Highly fragmented Medicaid market New contract began September 1, 2010 (29,000 members already enrolled) 14
Trends in Medicaid Managed Care 15 ABD expansion State budgets under pressure Growth in populations that are harder to manage Consolidation Preparation for Healthcare Reform (2014)

16 Getting Ready for 2014
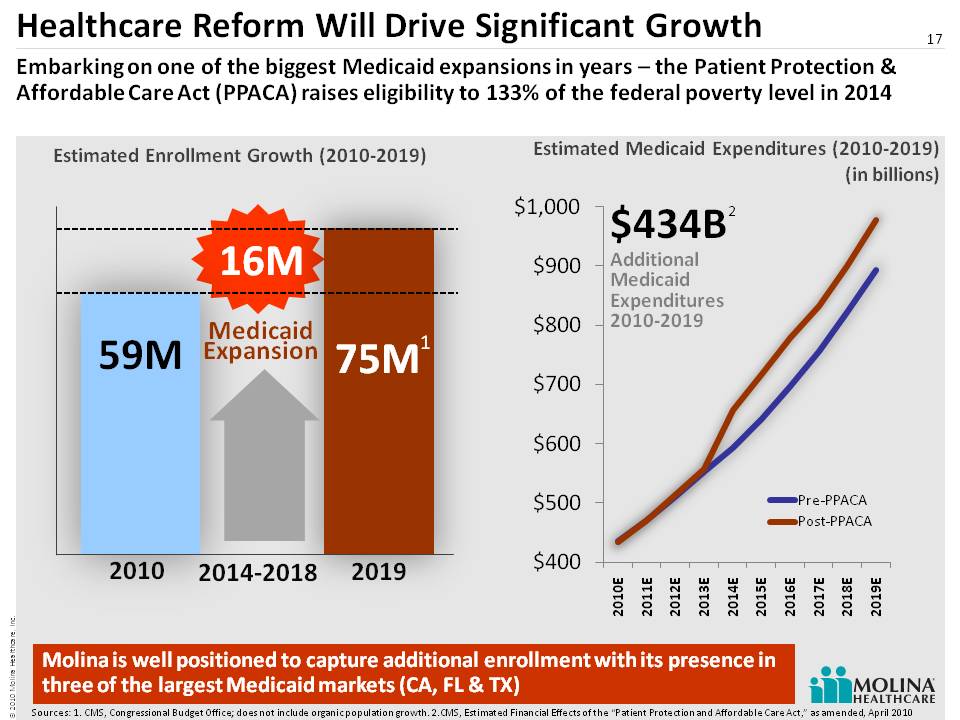
Healthcare Reform Will Drive Significant Growth 17 59M 2014-2018 2010 2019 16M 75M Medicaid Expansion Embarking on one of the biggest Medicaid expansions in years – the Patient Protection & Affordable Care Act (PPACA) raises eligibility to 133% of the federal poverty level in 2014 Estimated Medicaid Expenditures (2010-2019) (in billions) Estimated Enrollment Growth (2010-2019) Molina is well positioned to capture additional enrollment with its presence in three of the largest Medicaid markets (CA, FL & TX) $434B Additional Medicaid Expenditures 2010-2019 1 2 Sources: 1. CMS, Congressional Budget Office; does not include organic population growth. 2.CMS, Estimated Financial Effects of the “Patient Protection and Affordable Care Act,” as amended, April 2010
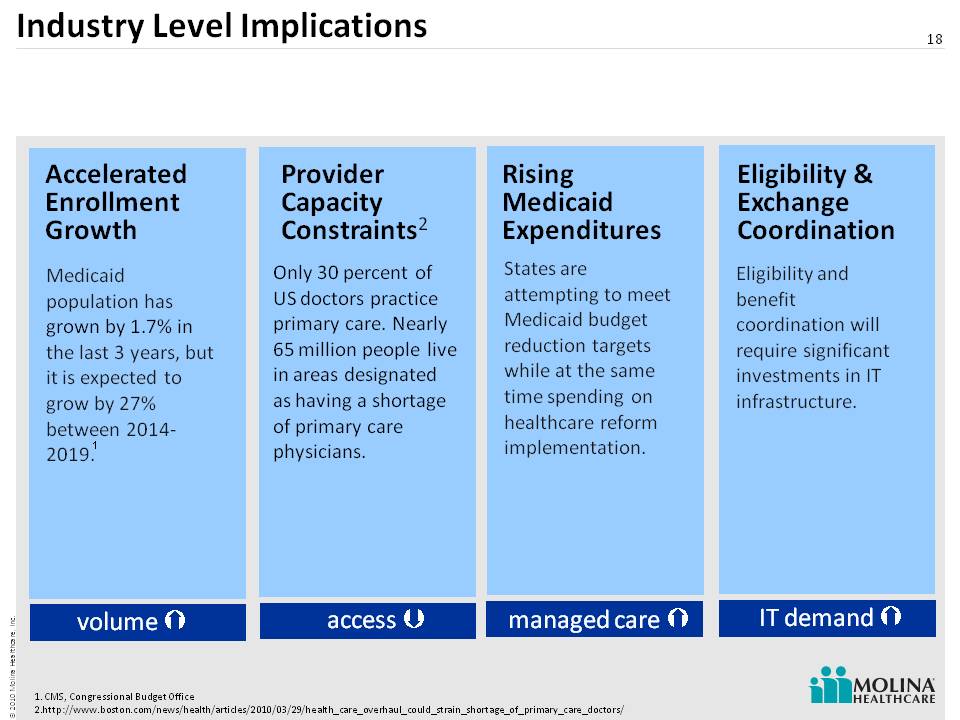
Industry Level Implications 18 Accelerated Enrollment Growth Provider Capacity Constraints 2 Eligibility & Exchange Coordination Rising Medicaid Expenditures Medicaid population has grown by 1.7% in the last 3 years, but it is expected to grow by 27% between 2014-2019. Only 30 percent of US doctors practice primary care. Nearly 65 million people live in areas designated as having a shortage of primary care physicians. States are attempting to meet Medicaid budget reduction targets while at the same time spending on healthcare reform implementation. Eligibility and benefit coordination will require significant investments in IT infrastructure. volume access IT demand managed care CMS, Congressional Budget Office http://www.boston.com/news/health/articles/2010/03/29/health_care_overhaul_could_strain_shortage_of_primary_care_doctors/ 1
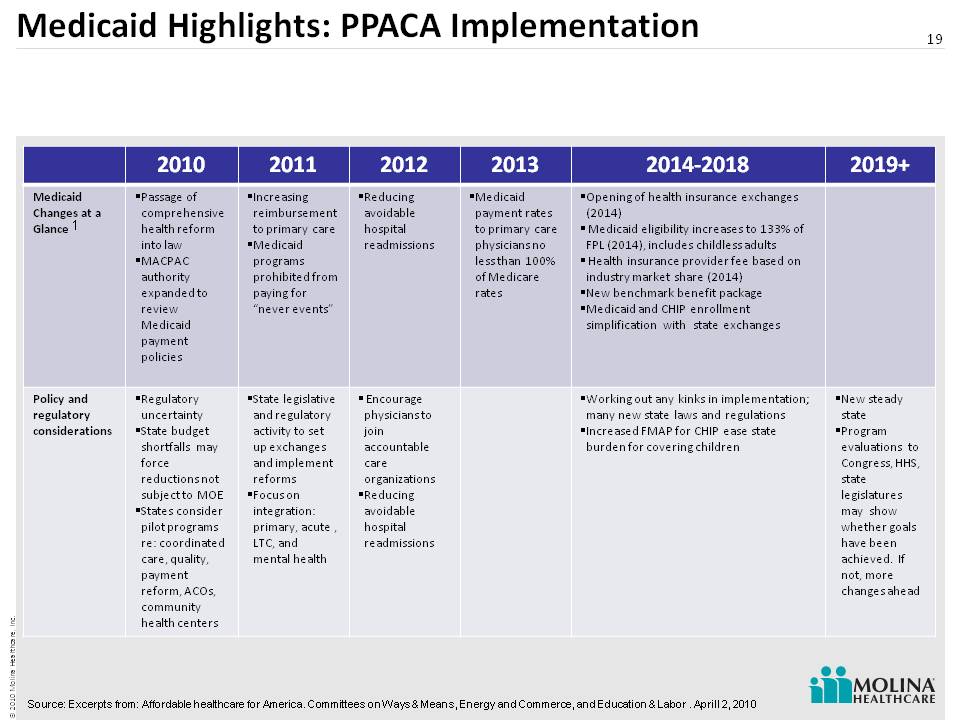
Medicaid Highlights: PPACA Implementation 19 1 Source: Excerpts from: Affordable healthcare for America. Committees on Ways & Means, Energy and Commerce, and Education & Labor . Aprill 2, 2010 2010 2011 2012 2013 2014-2018 2019+ Medicaid Changes at a Glance Passage of comprehensive health reform into law MACPAC authority expanded to review Medicaid payment policies Increasing reimbursement to primary care Medicaid programs prohibited from paying for “never events” Reducing avoidable hospital readmissions Medicaid payment rates to primary care physicians no less than 100% of Medicare rates Opening of health insurance exchanges (2014) Medicaid eligibility increases to 133% of FPL (2014), includes childless adults Health insurance provider fee based on industry market share (2014) New benchmark benefit packag e Medicaid and CHIP enrollment simplification with state exchanges Policy and regulatory considerations Regulatory uncertainty State budget shortfalls may force reductions not subject to MOE States consider pilot programs re: coordinated care, quality, payment reform, ACOs, community health centers State legislative and regulatory activity to set up exchanges and implement reforms Focus on integration: primary, acute , LTC, and mental health Encourage physicians to join accountable care organizations Reducing avoidable hospital readmissions Working out any kinks in implementation; many new state laws and regulations Increased FMAP for CHIP ease state burden for covering children New steady state Program evaluations to Congress, HHS, state legislatures may show whether goals have been achieved. If not, more changes ahead
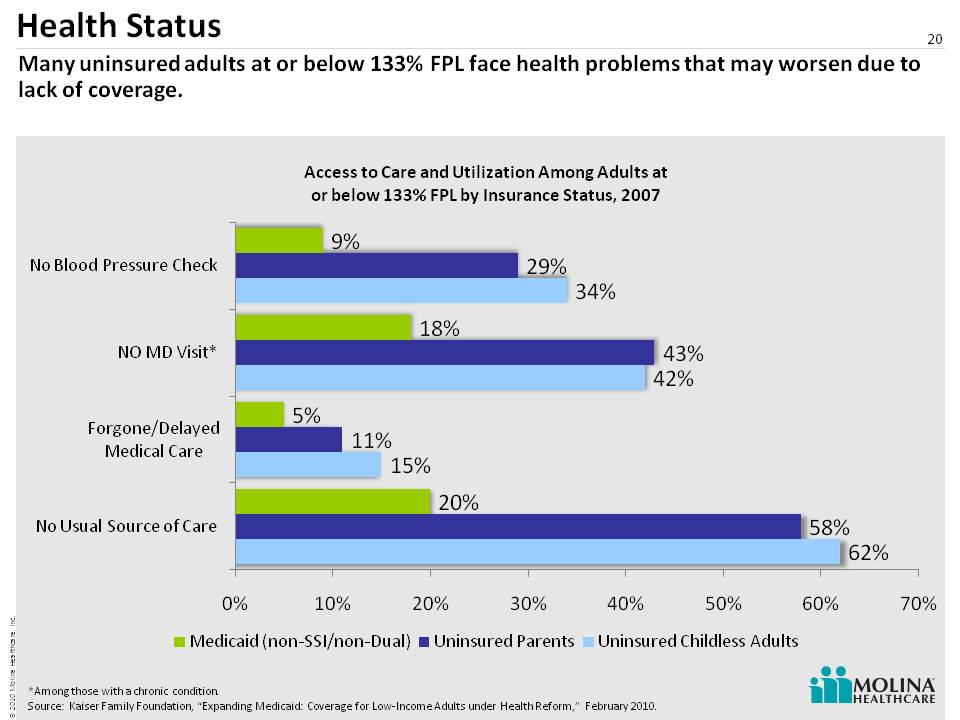
Health Status 20 Many uninsured adults at or below 133% FPL face health problems that may worsen due to lack of coverage. *Among those with a chronic condition. Source: Kaiser Family Foundation, “Expanding Medicaid: Coverage for Low-Income Adults under Health Reform,” February 2010.
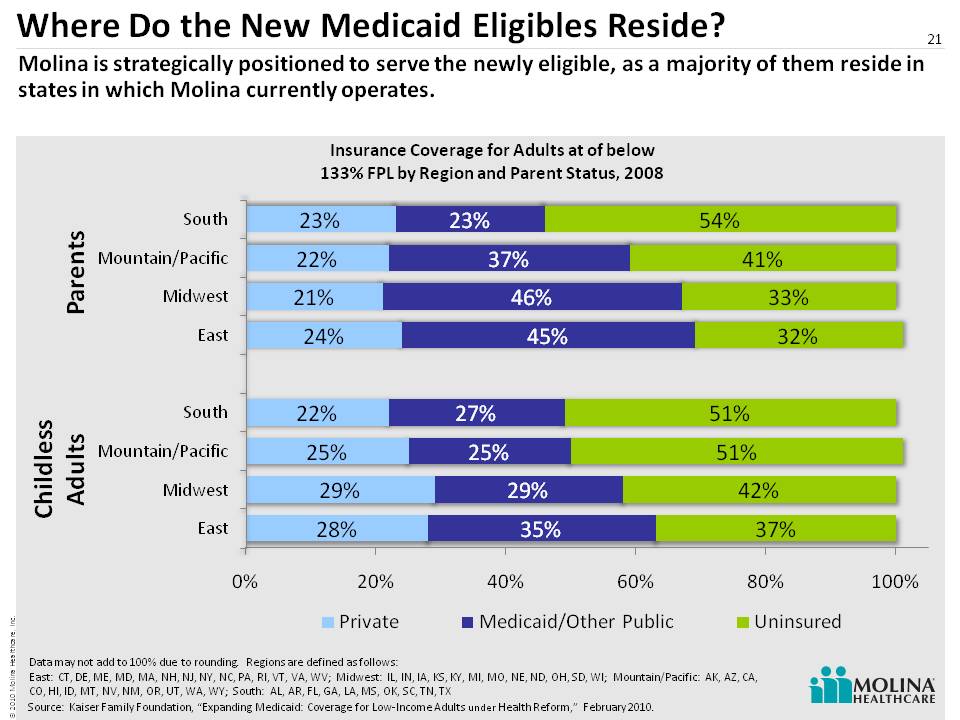
Where Do the New Medicaid Eligibles Reside? 21 Molina is strategically positioned to serve the newly eligible, as a majority of them reside in states in which Molina currently operates. Source: Kaiser Family Foundation, “Expanding Medicaid: Coverage for Low-Income Adults under Health Reform,” February 2010. Parents Childless Adults Data may not add to 100% due to rounding. Regions are defined as follows: East: CT, DE, ME, MD, MA, NH, NJ, NY, NC, PA, RI, VT, VA, WV; Midwest: IL, IN, IA, KS, KY, MI, MO, NE, ND, OH, SD, WI; Mountain/Pacific: AK, AZ, CA, CO, HI, ID, MT, NV, NM, OR, UT, WA, WY; South: AL, AR, FL, GA, LA, MS, OK, SC, TN, TX
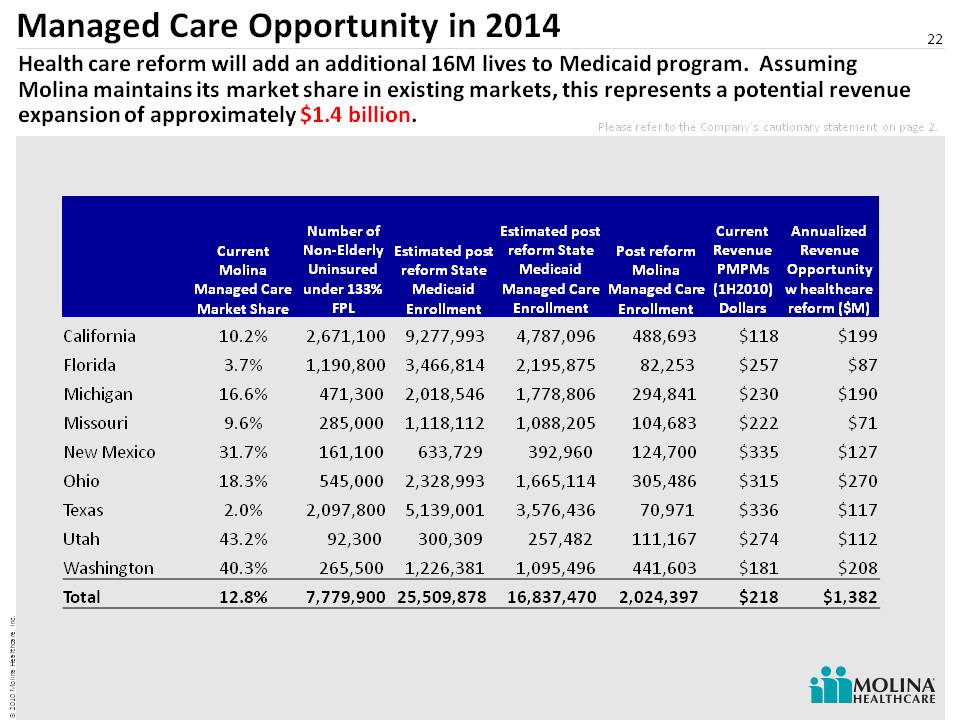
Managed Care Opportunity in 2014 22 Health care reform will add an additional 16M lives to Medicaid program. Assuming Molina maintains its market share in existing markets, this represents a potential revenue expansion of approximately $1.4 billion. Please refer to the Company’s cautionary statement on page 2. Current Molina Managed Care Market Share Number of Non-Elderly Uninsured under 133% FPL Estimated post reform State Medicaid Enrollment Estimated post reform State Medicaid Managed Care Enrollment Post reform Molina Managed Care Enrollment Current Revenue PMPMs (1H2010) Dollars Annualized Revenue Opportunity w healthcare reform ($M) California 10.2% 2,671,100 9,277,993 4,787,096 488,693 $118 $199 Florida 3.7% 1,190,800 3,466,814 2,195,875 82,253 $257 $87 Michigan 16.6% 471,300 2,018,546 1,778,806 294,841 $230 $190 Missouri 9.6% 285,000 1,118,112 1,088,205 104,683 $222 $71 New Mexico 31.7% 161,100 633,729 392,960 124,700 $335 $127 Ohio 18.3% 545,000 2,328,993 1,665,114 305,486 $315 $270 Texas 2.0% 2,097,800 5,139,001 3,576,436 70,971 $336 $117 Utah 43.2% 92,300 300,309 257,482 111,167 $274 $112 Washington 40.3% 265,500 1,226,381 1,095,496 441,603 $181 $208 Total 12.8% 7,779,900 25,509,878 16,837,470 2,024,397 $218 $1,382
Alignment of Reform Requirements 30 year focus on government-sponsored healthcare programs for low income families and individuals Experience in highly regulated local environments History of transparency Direct Delivery capability Located in key expansion states (CA, FL, TX) Long history of arranging for quality healthcare 23 Molina is strategically positioned for reform through its core competencies and its 30 year history of serving Medicaid members and participants in other government programs.
Areas of Uncertainty 24 ExchangesRedetermination of eligibilityProvider payments (Medicaid @ Medicare Rates)Federalization of MedicaidUniformity/Regionalization of MMSPatient ratios Coordination with other government programs
What We Know 25 Areas of focus will include:QualityCustomer serviceInformation technology Compliance
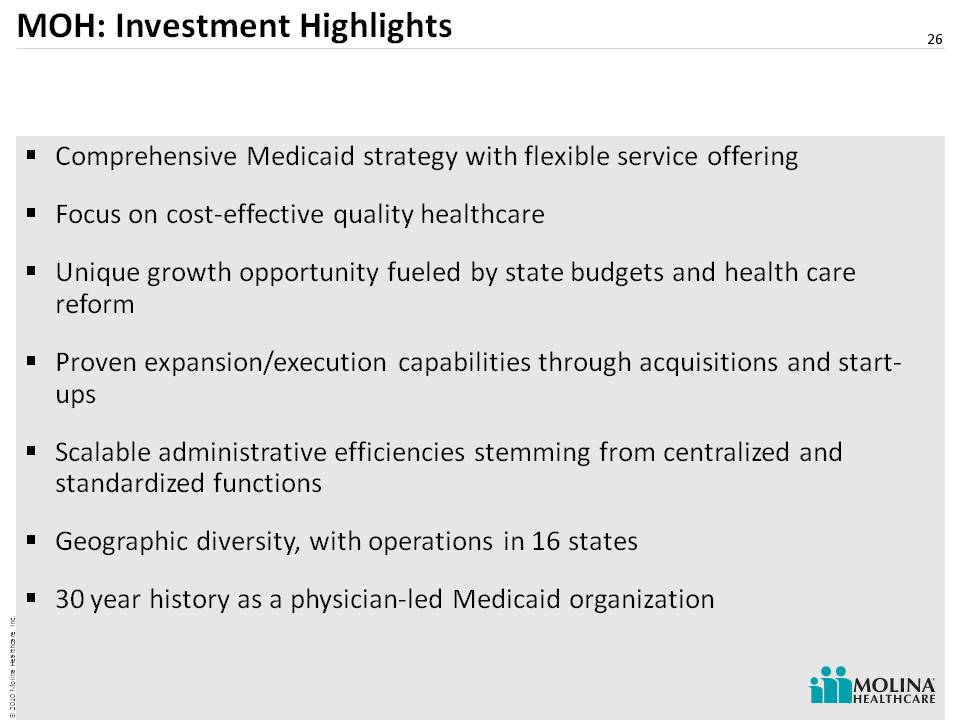
26 Comprehensive Medicaid strategy with flexible service offering Focus on cost-effective quality healthcare Unique growth opportunity fueled by state budgets and health care reform Proven expansion/execution capabilities through acquisitions and start-ups Scalable administrative efficiencies stemming from centralized and standardized functions Geographic diversity, with operations in 16 states 30 year history as a physician-led Medicaid organization MOH: Investment Highlights

Panel 1 Q&A 27
28 Operations UpdateTerry BayerChief Operating Officer
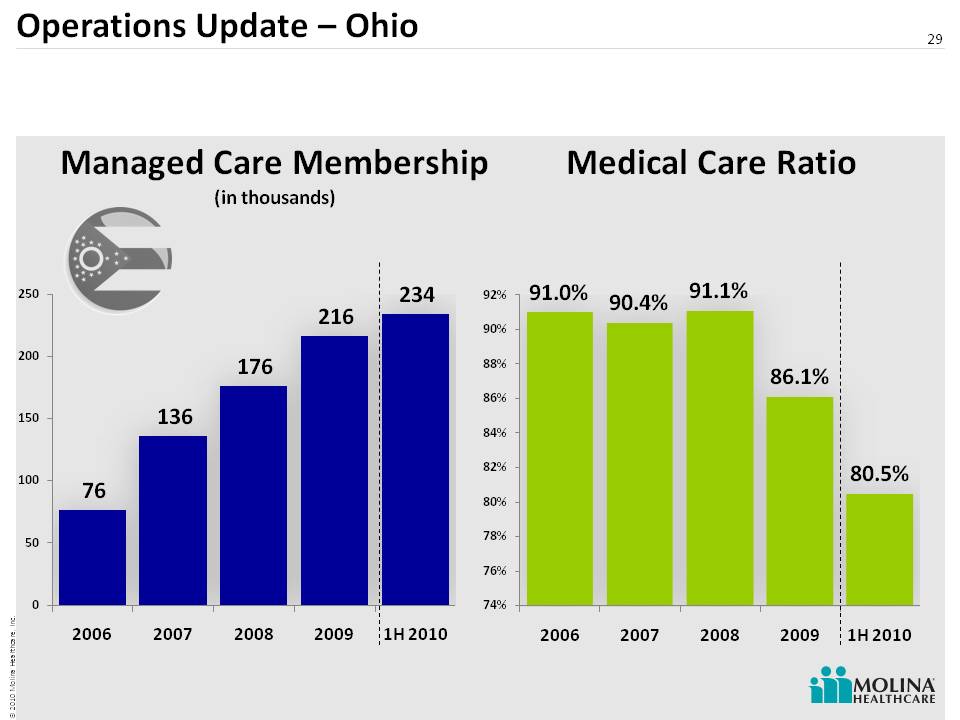
Operations Update – Ohio 29 Medical Care Ratio Managed Care Membership(in thousands)
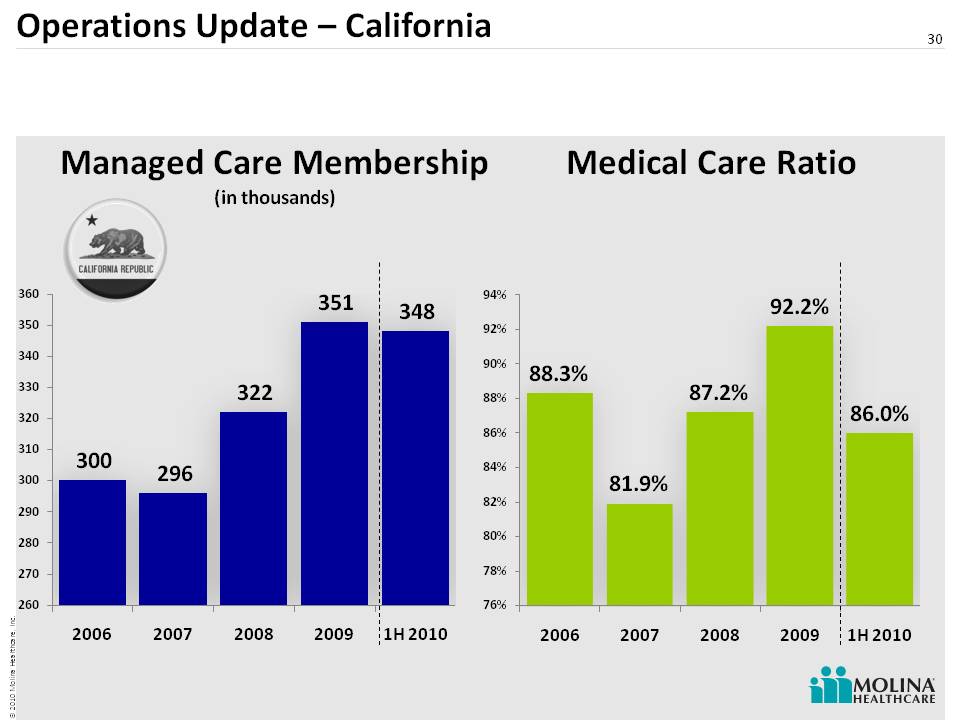
Operations Update – California 30 Medical Care Ratio Managed Care Membership (in thousands)
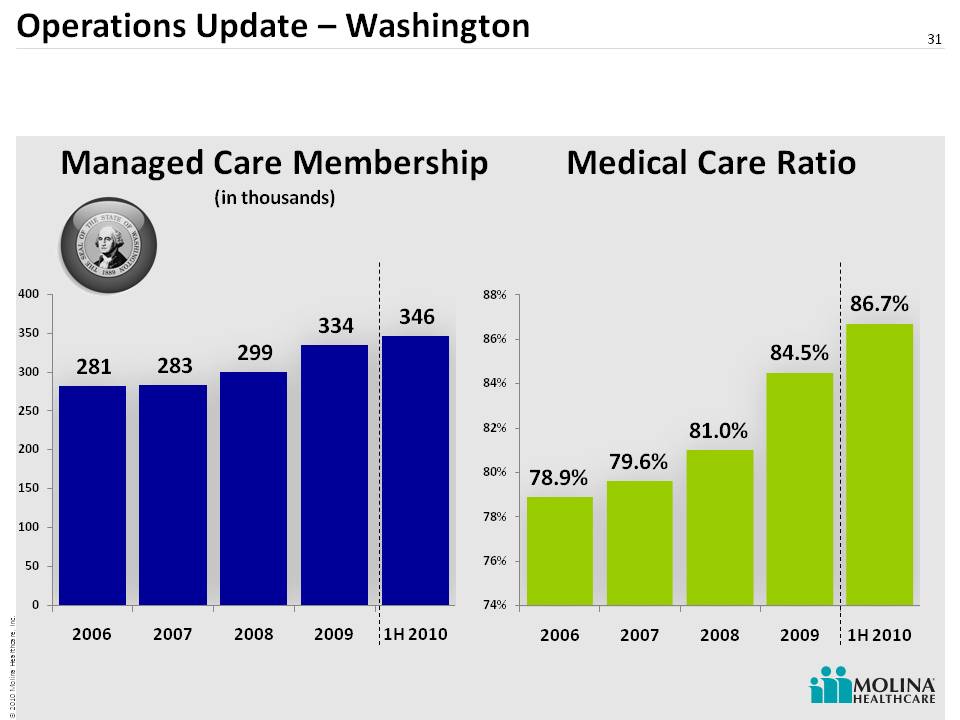
Operations Update – Washington 31Medical Care RatioManaged Care Membership(in thousands)
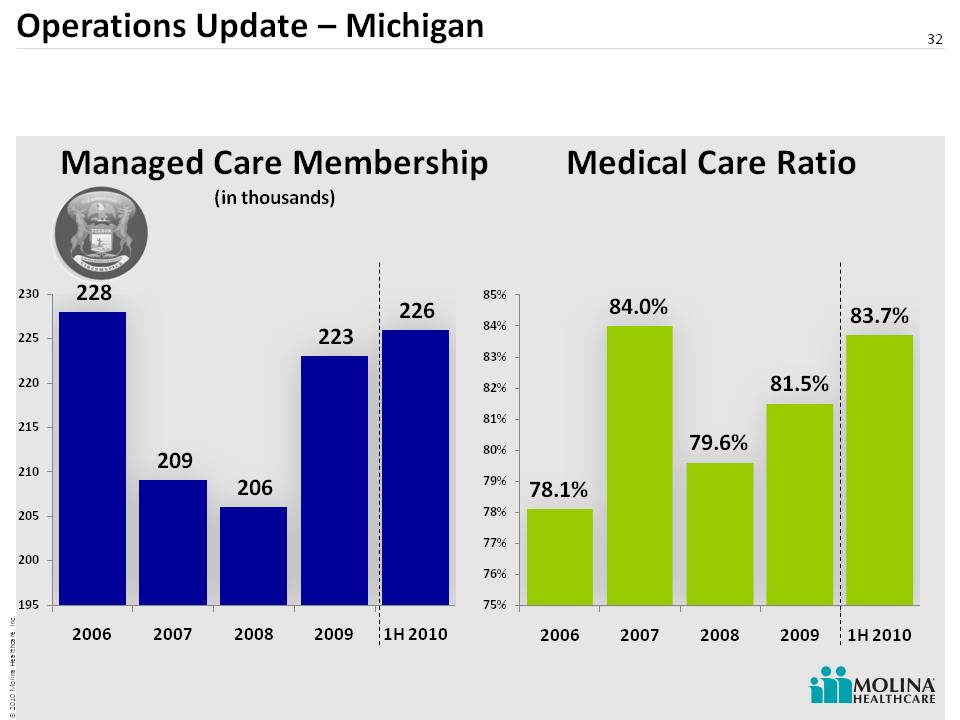
Operations Update – Michigan 32 Managed Care Membership(in thousands) Medical Care Ratio
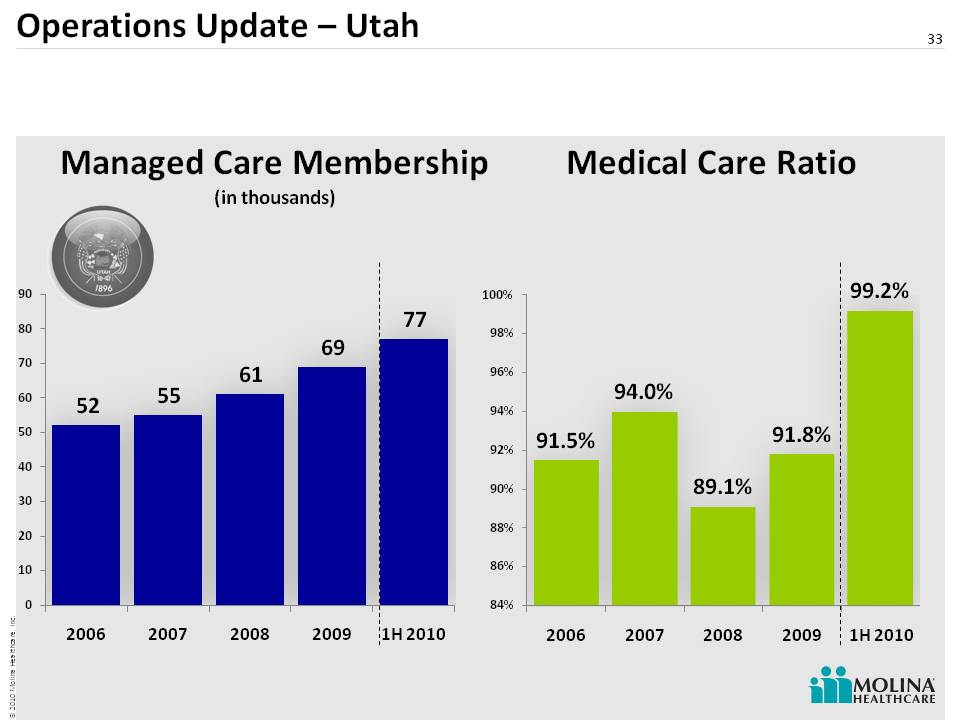
Operations Update – Utah 33 Medical Care Ratio Managed Care Membership (in thousands)
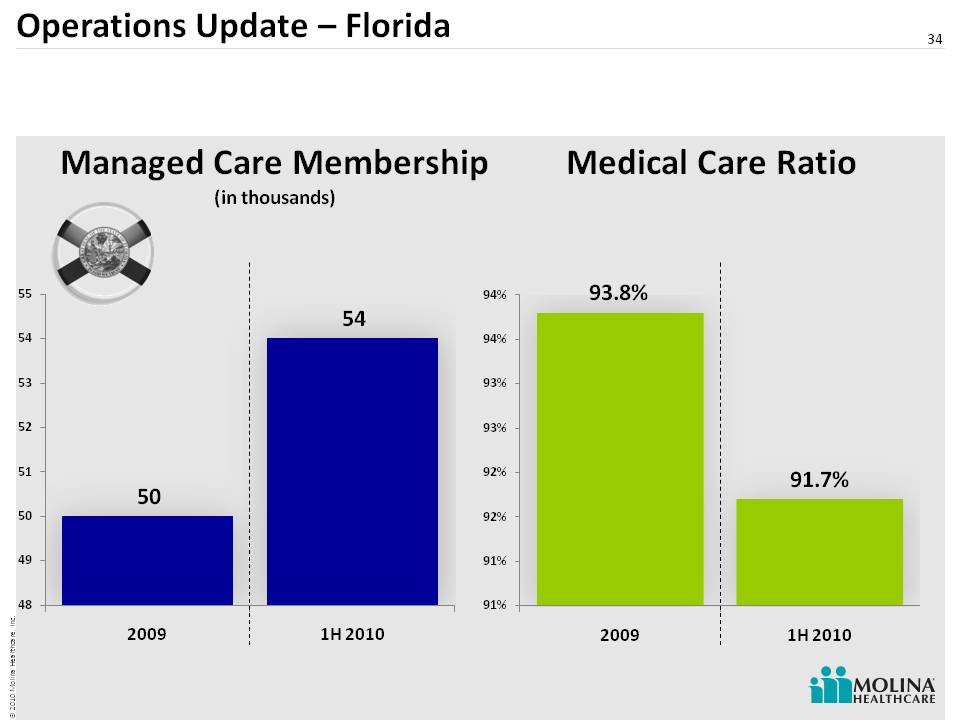
Operations Update – Florida 34 Medical Care Ratio Managed Care Membership (in thousands)
35 Molina Medicaid Solutions Update
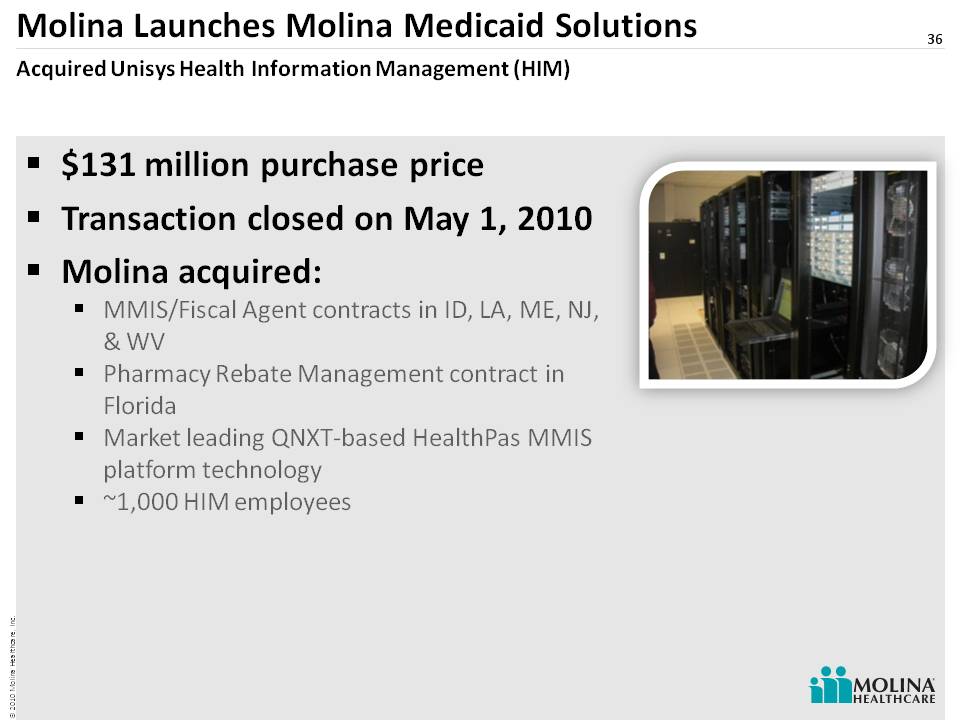
Molina Launches Molina Medicaid Solutions 36 Acquired Unisys Health Information Management (HIM) $131 million purchase price Transaction closed on May 1, 2010 Molina acquired: MMIS/Fiscal Agent contracts in ID, LA, ME, NJ, & WV Pharmacy Rebate Management contract in Florida Market leading QNXT-based HealthPas MMIS platform technology ~1,000 HIM employees
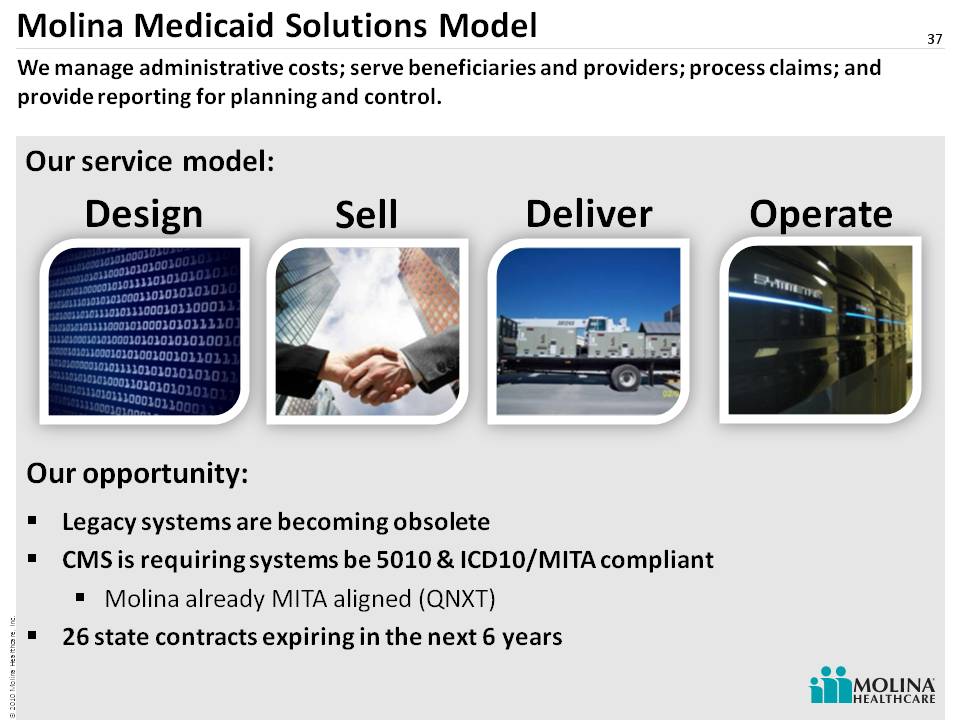
Molina Medicaid Solutions Model We manage administrative costs; serve beneficiaries and providers; process claims; and provide reporting for planning and control. Design Sell Deliver Operate Our service model: Our opportunity: 37 Legacy systems are becoming obsolete CMS is requiring systems be 5010 & ICD10/MITA compliant Molina already MITA aligned (QNXT) 26 state contracts expiring in the next 6 years
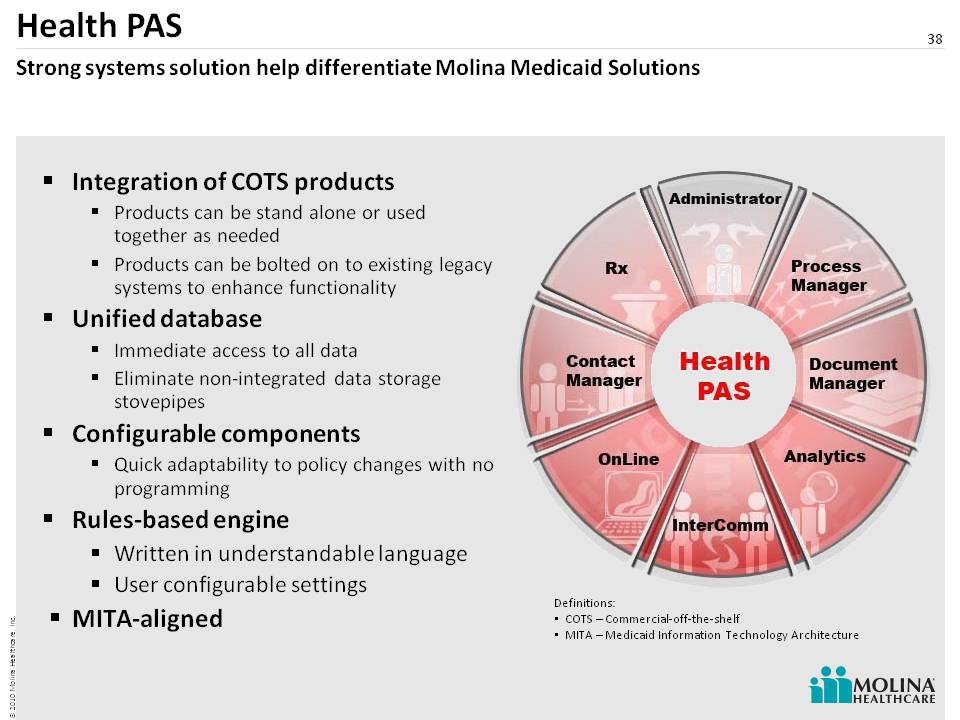
Integration of COTS products Products can be stand alone or used together as needed Products can be bolted on to existing legacy systems to enhance functionality Unified database Immediate access to all data Eliminate non-integrated data storage stovepipes Configurable components Quick adaptability to policy changes with no programming Rules-based engine Written in understandable language User configurable settings MITA-aligned Definitions: COTS – Commercial-off-the-shelf MITA – Medicaid Information Technology Architecture Health PAS Strong systems solution help differentiate Molina Medicaid Solutions 38
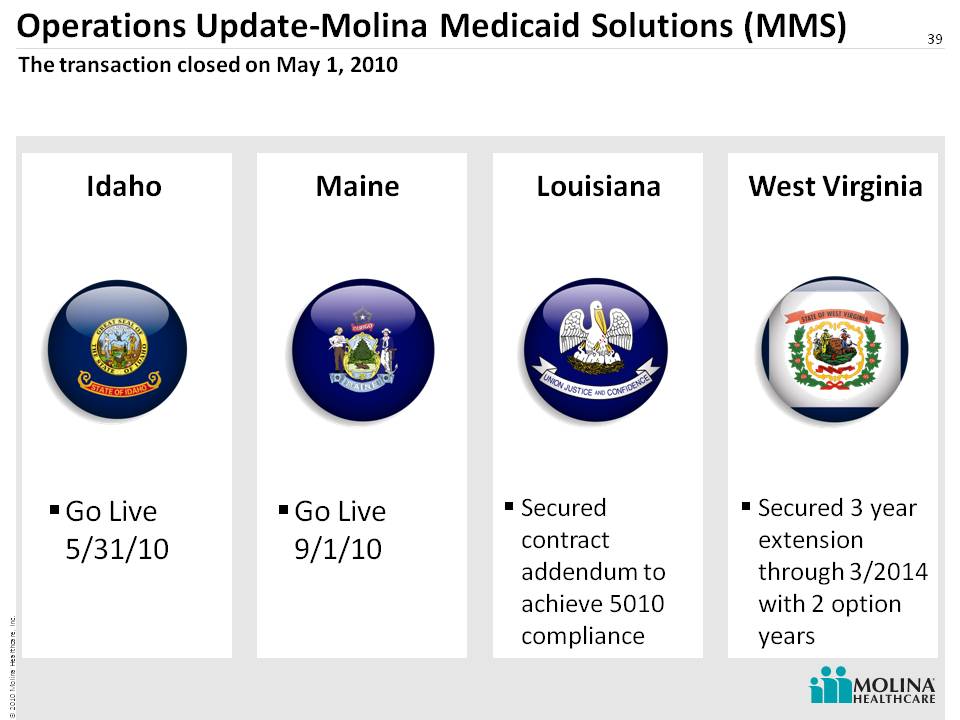
Operations Update-Molina Medicaid Solutions (MMS) 39 Go Live 5/31/10 The transaction closed on May 1, 2010 Go Live 9/1/10 Idaho Maine Louisiana West Virginia Secured contract addendum to achieve 5010 compliance Secured 3 year extension through 3/2014 with 2 option years
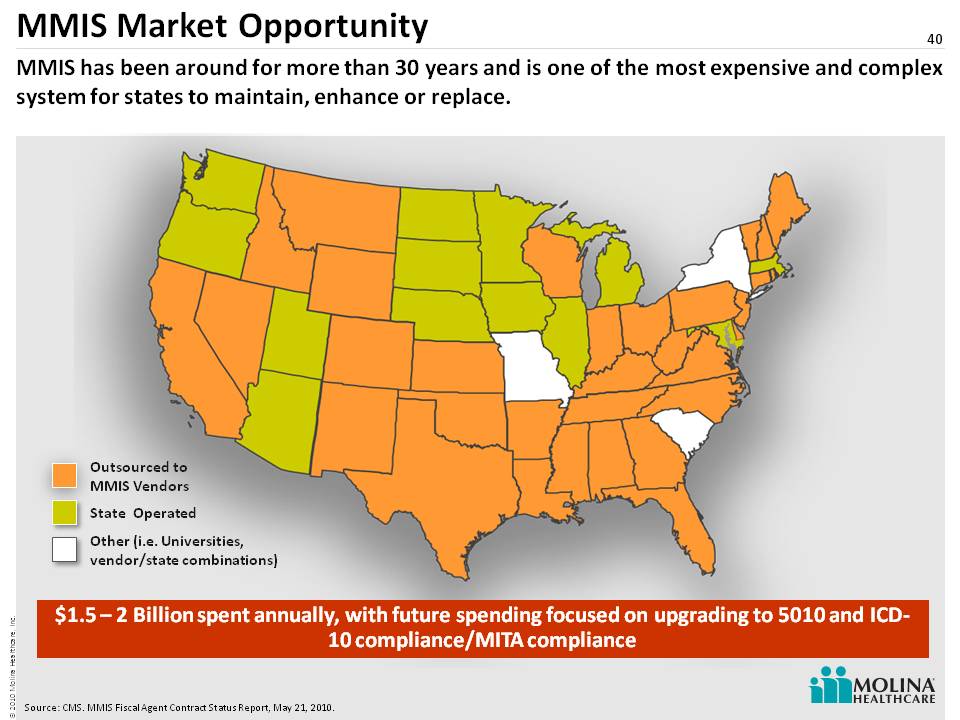
MMIS Market Opportunity 40 MMIS has been around for more than 30 years and is one of the most expensive and complex system for states to maintain, enhance or replace. Outsourced toMMIS Vendors State Operated Other (i.e. Universities, vendor/state combinations) Source: CMS. MMIS Fiscal Agent Contract Status Report, May 21, 2010. $1.5 – 2 Billion spent annually, with future spending focused on upgrading to 5010 and ICD-10 compliance/MITA compliance
41 The New 16 Million Jean Glossa, MD, MBA, FACPMedical Director
42 Who is the 2014 Medicaid Beneficiary? Industry implications of PPACAWho are the 16M new patients and how do they compare with the current Molina members?Molina’s experience caring for this population Topics for this portion of the presentation
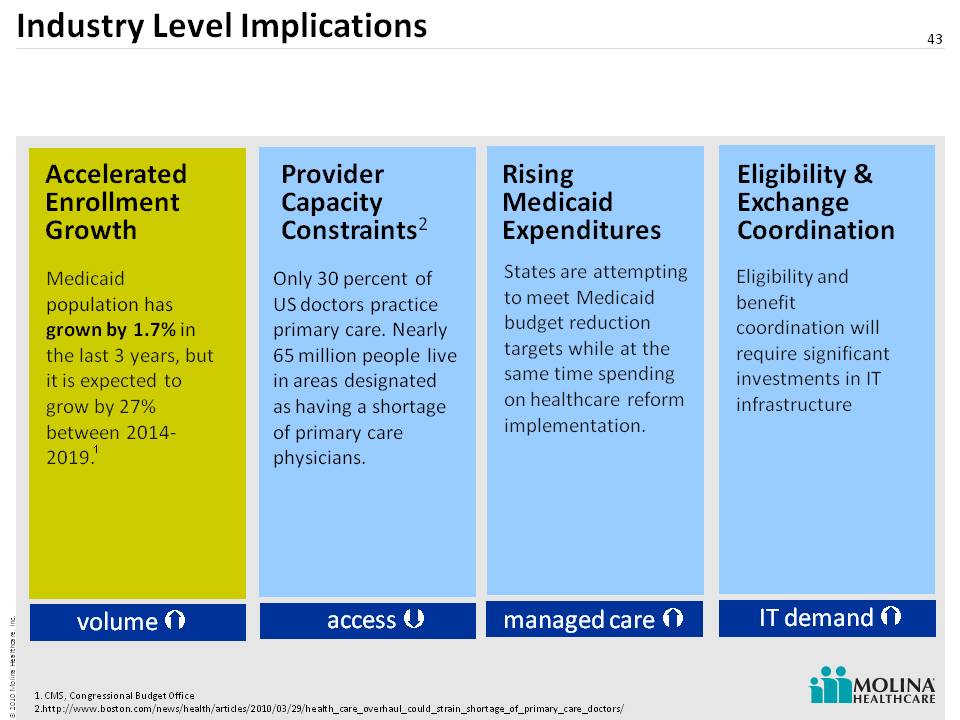
Industry Level Implications 43 Eligibility & Exchange Coordination Rising Medicaid Expenditures Medicaid population has grown by 1.7% in the last 3 years, but it is expected to grow by 27% between 2014-2019. States are attempting to meet Medicaid budget reduction targets while at the same time spending on healthcare reform implementation. Eligibility and benefit coordination will require significant investments in IT infrastructure volume access IT demand managed care Accelerated Enrollment Growth ProviderCapacity Constraints2 Only 30 percent of US doctors practice primary care. Nearly 65 million people live in areas designated as having a shortage of primary care physicians. 1. CMS, Congressional Budget Office 2. http://www.boston.com/news/health/articles/2010/03/29/health_care_overhaul_could_strain_shortage_of_primary_c are_doctors/ 1
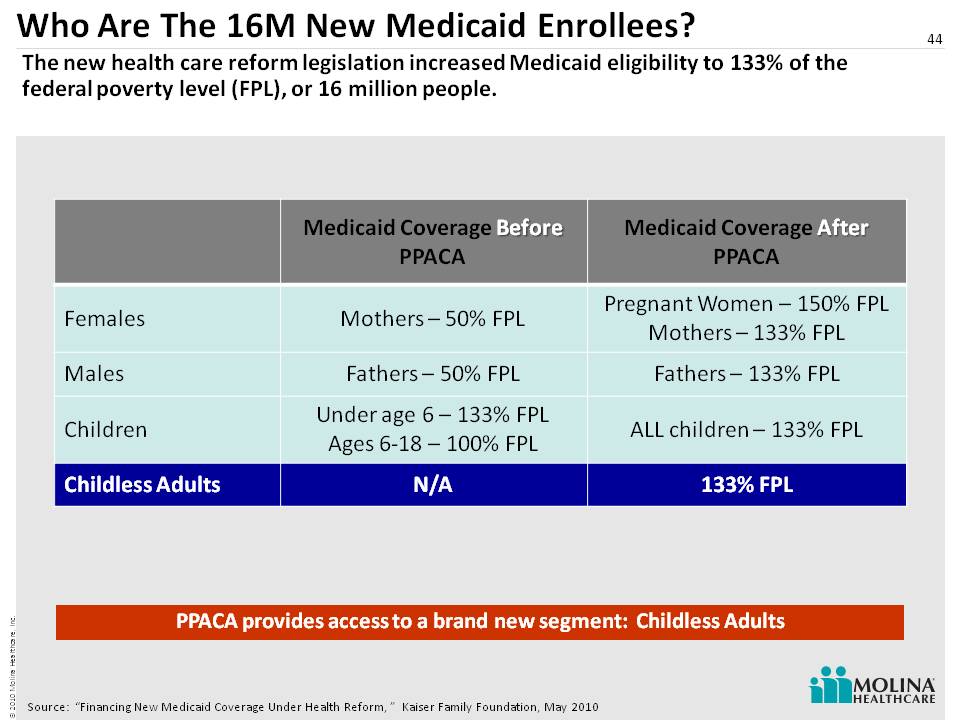
Who Are The 16M New Medicaid Enrollees? 44 The new health care reform legislation increased Medicaid eligibility to 133% of the federal poverty level (FPL), or 16 million people. Source: “Financing New Medicaid Coverage Under Health Reform, ” Kaiser Family Foundation, May 2010 PPACA provides access to a brand new segment: Childless Adults
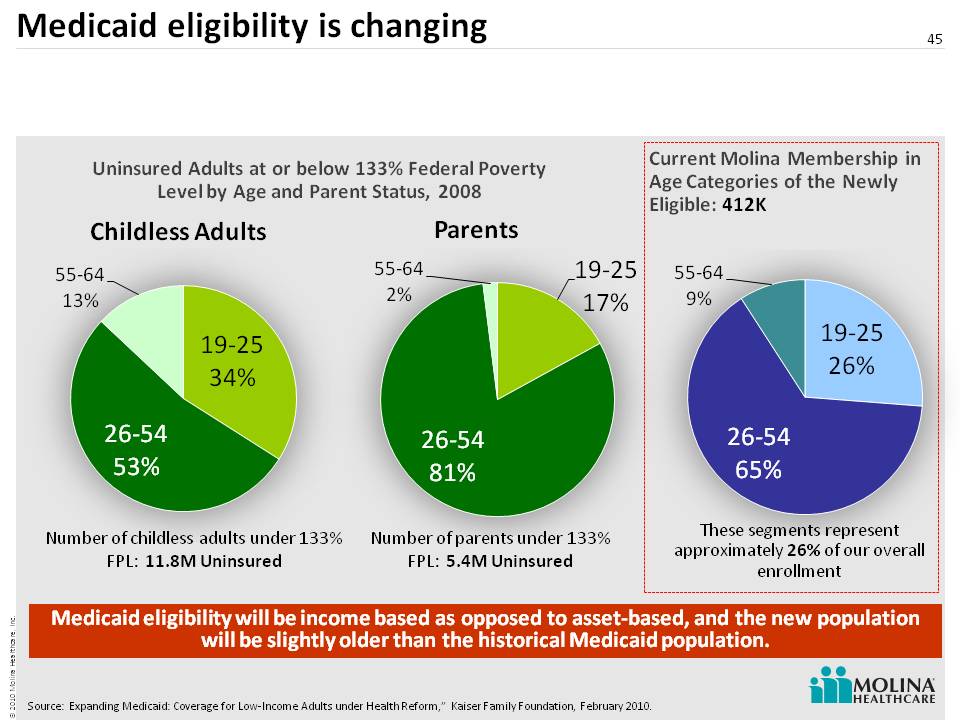
Medicaid eligibility is changing 45 Source: Expanding Medicaid: Coverage for Low-Income Adults under Health Reform,” Kaiser Family Foundation, February 2010. Number of childless adults under 133% FPL: 11.8M Uninsured Number of parents under 133% FPL: 5.4M Uninsured Uninsured Adults at or below 133% Federal Poverty Level by Age and Parent Status, 2008 Childless Adults Parents These segments represent approximately 26% of our overall enrollment Current Molina Membership in Age Categories of the Newly Eligible: 412K Medicaid eligibility will be income based as opposed to asset-based, and the new population will be slightly older than the historical Medicaid po pulation.
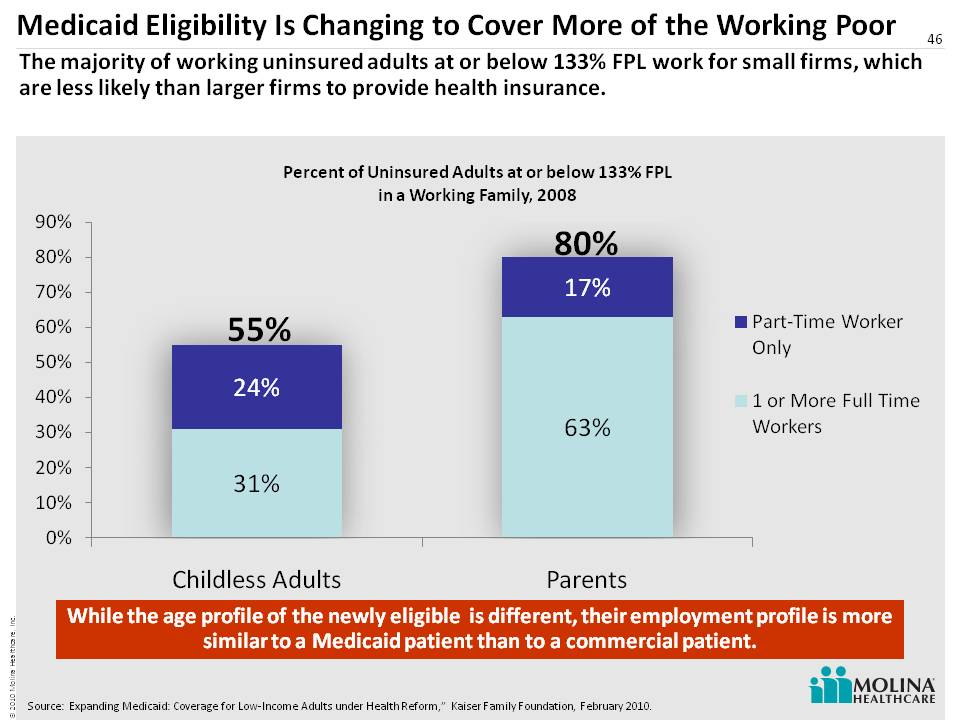
46 Medicaid Eligibility Is Changing to Cover More of the Working Poor 55% 80% While the age profile of the newly eligible is different, their employment profile is more similar to a Medicaid patient than to a commercial patient. The majority of working uninsured adults at or below 133% FPL work for small firms, which are less likely than larger firms to provide health insurance. Source: Expanding Medicaid: Coverage for Low-Income Adults under Health Reform,” Kaiser Family Foundation, February 2010.
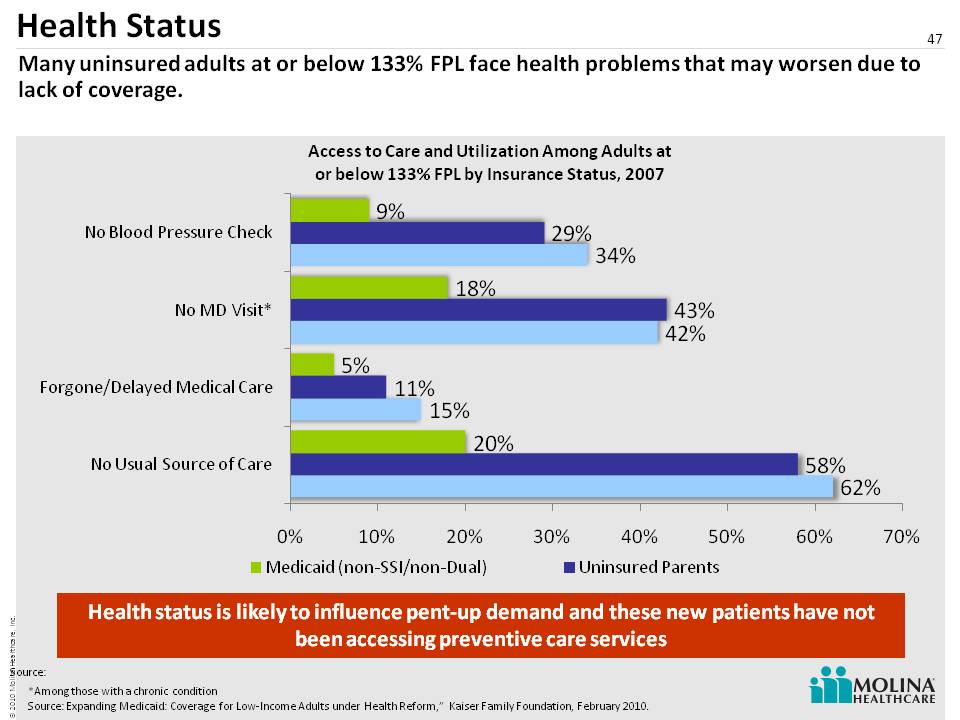
Health Status 47 Many uninsured adults at or below 133% FPL face health problems that may worsen due to lack of coverage. *Among those with a chronic condition Source: Expanding Medicaid: Coverage for Low-Income Adults under Health Reform,” Kaiser Family Foundation, February 2010. Health status is likely to influence pent-up demand and these new patients have not been accessing preventive care services Source:

Where Do the New Medicaid Eligibles Reside? 48 Molina is strategically positioned to serve the newly eligible, as a majority of them reside in states in which Molina currently operates. Source: “Expanding Medicaid: Coverage for Low-Income Adults under Health Reform,” Kaiser Family Foundation, February 2010. Parents Childless Adults Data may not add to 100% due to rounding. Regions are defined as follows: East: CT, DE, ME, MD, MA, NH, NJ, NY, NC, PA, RI, VT, VA, WV; Midwest: IL, IN, IA, KS, KY, MI, MO, NE, ND, OH, SD, WI; Mountain/Pacific: AK, AZ, CA, CO, HI, ID, MT, NV, NM, OR, UT, WA, WY; South: AL, AR, FL, GA, LA, MS, OK, SC, TN, TX
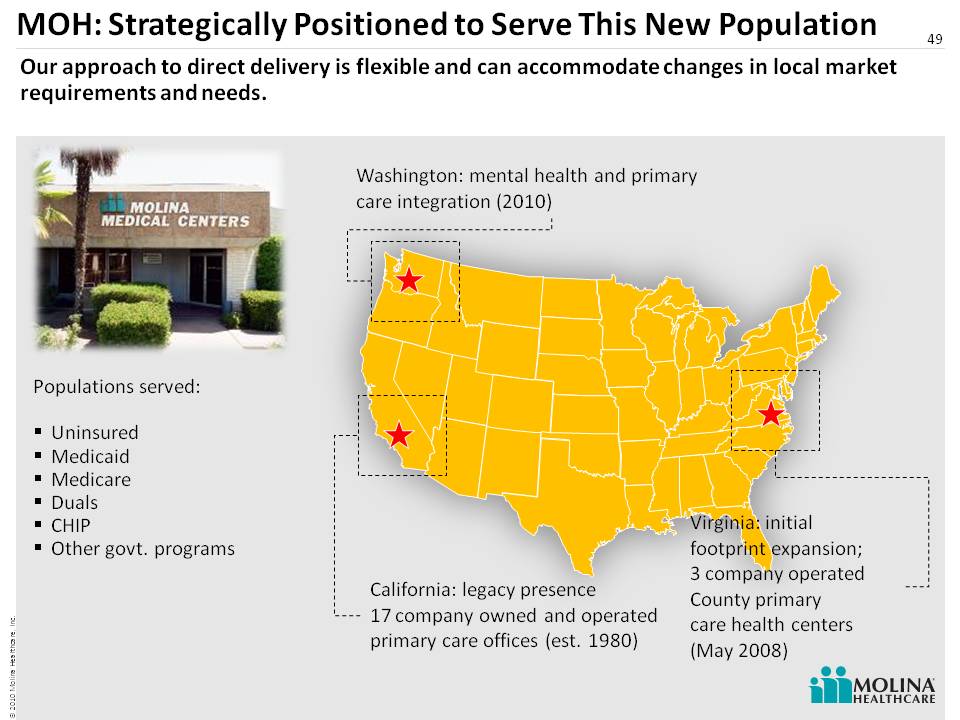
49 California: legacy presence 17 company owned and operated primary care offices (est. 1980) Virginia: initial footprint expansion; 3 company operated County primary care health centers (May 2008) Washington: mental health and primary care integration (2010) Populations served: Uninsured Medicaid Medicare Duals CHIP Other govt. programs Our approach to direct delivery is flexible and can accommodate changes in local market requirements and needs. MOH: Strategically Positioned to Serve This New Population
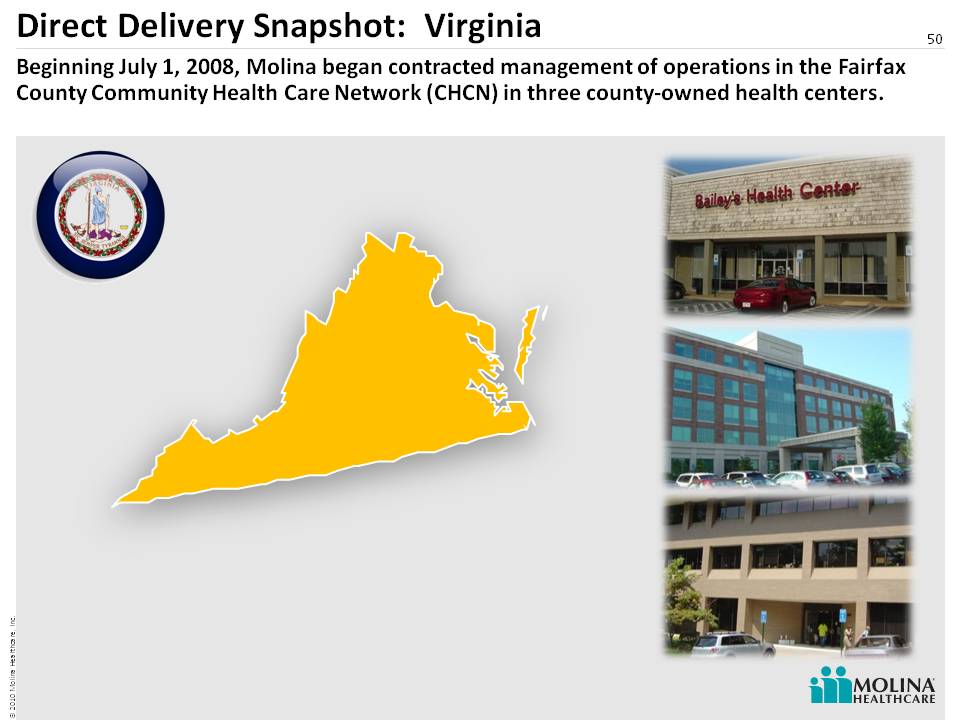
Direct Delivery Snapshot: Virginia 50 Beginning July 1, 2008, Molina began contracted management of operations in the Fairfax County Community Health Care Network (CHCN) in three county-owned health centers.
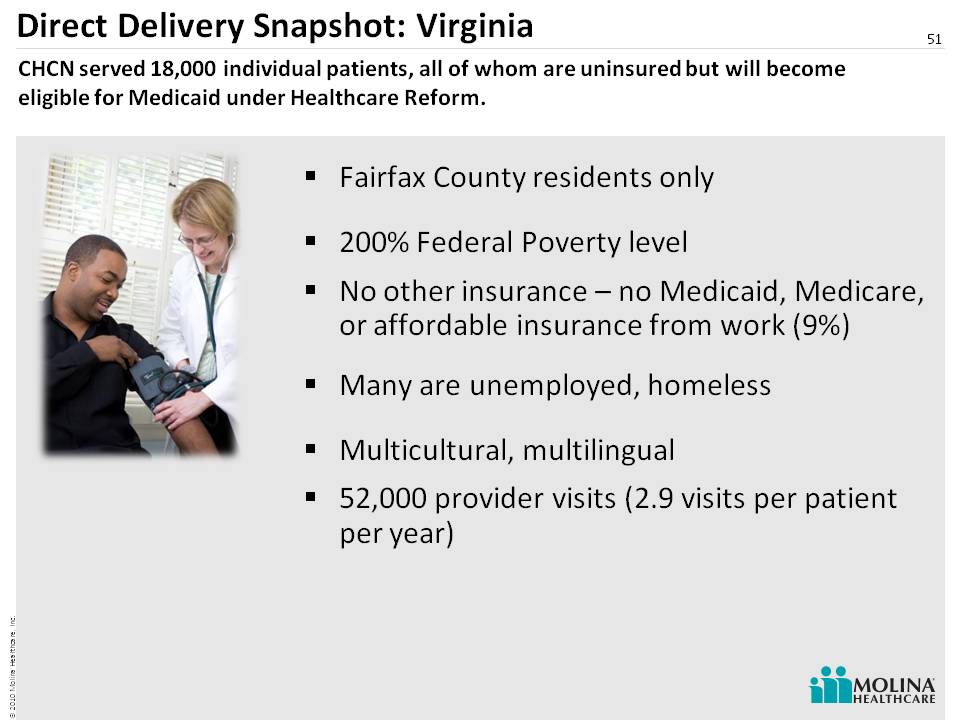
Direct Delivery Snapshot: Virginia Fairfax County residents only 200% Federal Poverty level No other insurance – no Medicaid, Medicare, or affordable insurance from work (9%) Many are unemployed, homeless Multicultural, multilingual 52,000 provider visits (2.9 visits per patient per year) 51 CHCN served 18,000 individual patients, all of whom are uninsured but will become eligible for Medicaid under Healthcare Reform.
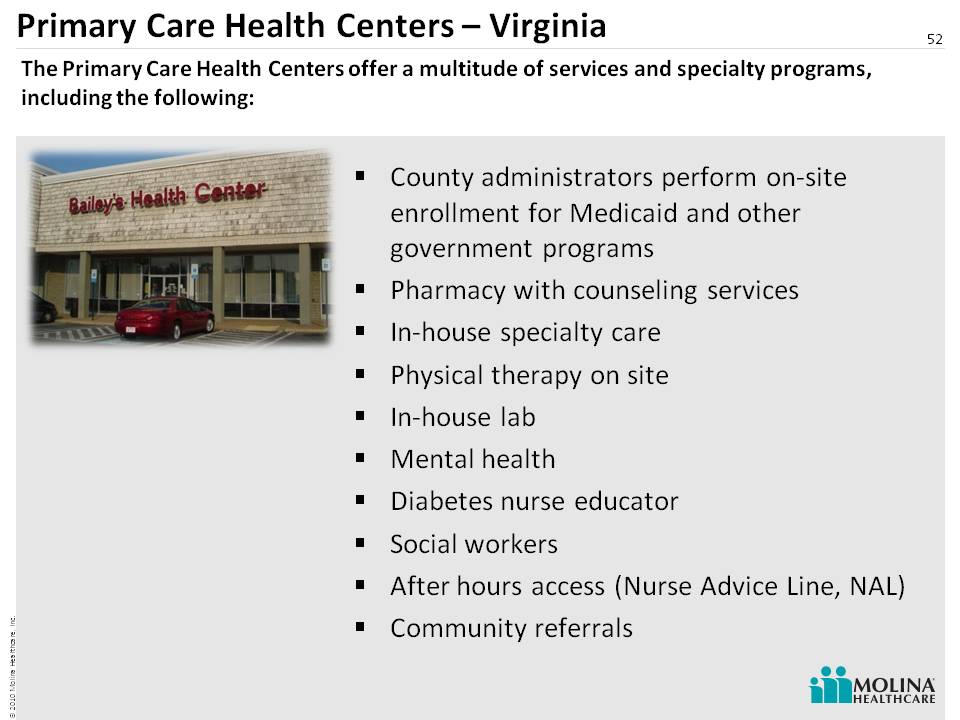
Primary Care Health Centers – Virginia County administrators perform on-site enrollment for Medicaid and other government programs Pharmacy with counseling services In-house specialty care Physical therapy on site In-house lab Mental health Diabetes nurse educator Social workers After hours access (Nurse Advice Line, NAL) Community referrals 52 The Primary Care Health Centers offer a multitude of services and specialty programs, including the following:
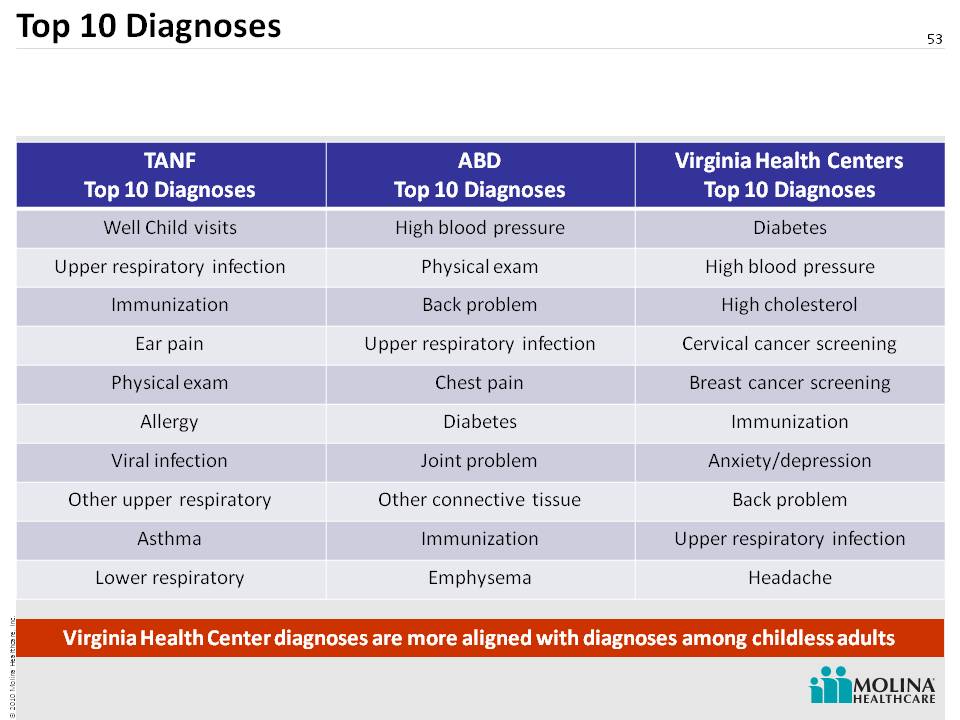
Top 10 Diagnoses 53 Virginia Health Center diagnoses are more aligned with diagnoses among childless adults TANF Top 10 Diagnoses ABD Top 10 Diagnoses Virginia Health Centers Top 10 Diagnoses Well Child visits High blood pressure Diabetes Upper respiratory infection Physical exam High blood pressure Immunization Back problem High cholesterol Ear pain Upper respiratory infection Cervical cancer screening Physical exam Chest pain Breast cancer screening Allergy Diabetes Immunization Viral infection Joint problem Anxiety/depression Other upper respiratory Other connective tissue Back problem Asthma Immunization Upper respiratory infection Lower respiratory Emphysema Headache
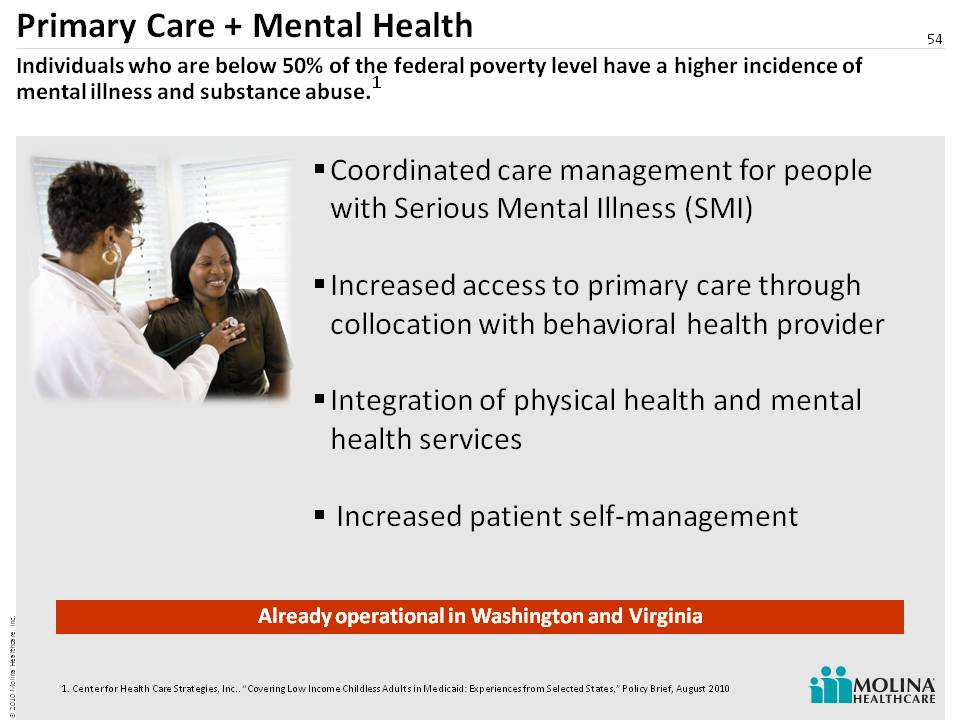
Primary Care + Mental Health 54 Individuals who are below 50% of the federal poverty level have a higher incidence of mental illness and substance abuse. Coordinated care management for people with Serious Mental Illness (SMI) Increased access to primary care through collocation with behavioral health provider Integration of physical health and mental health services Increased patient self-management Already operational in Washington and Virginia 1 1. Center for Health Care Strategies, Inc.. “Covering Low Income Childless Adults in Medicaid: Experiences from Selected States,” Policy Brief, August 2010
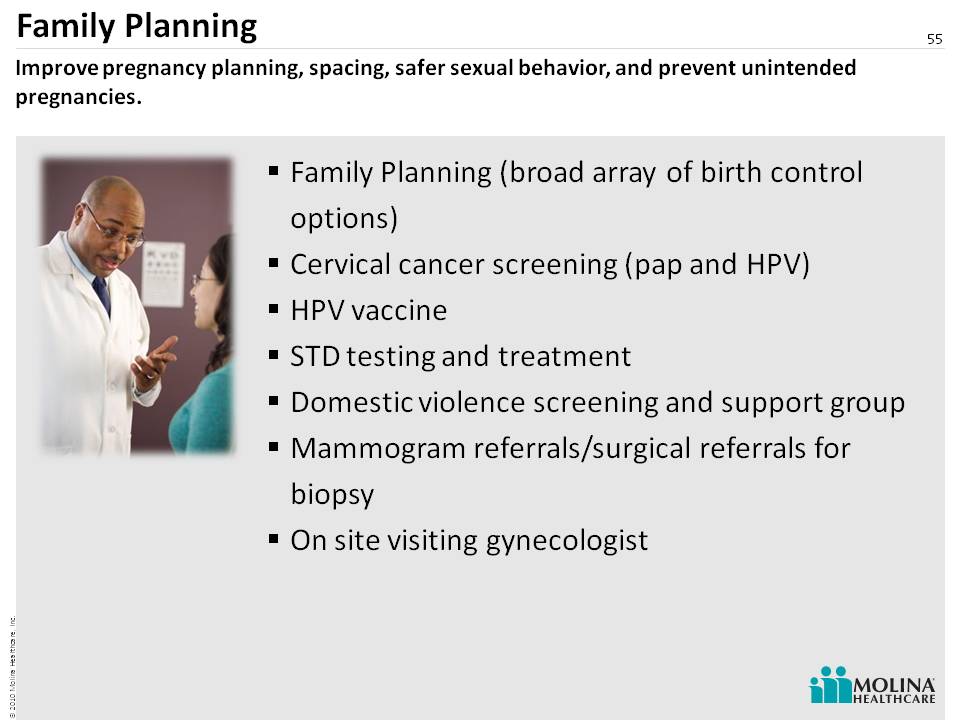
Family Planning 55 Improve pregnancy planning, spacing, safer sexual behavior, and prevent unintended pregnancies. Family Planning (broad array of birth control options) Cervical cancer screening (pap and HPV) HPV vaccine STD testing and treatment Domestic violence screening and support group Mammogram referrals/surgical referrals for biopsy On site visiting gynecologist
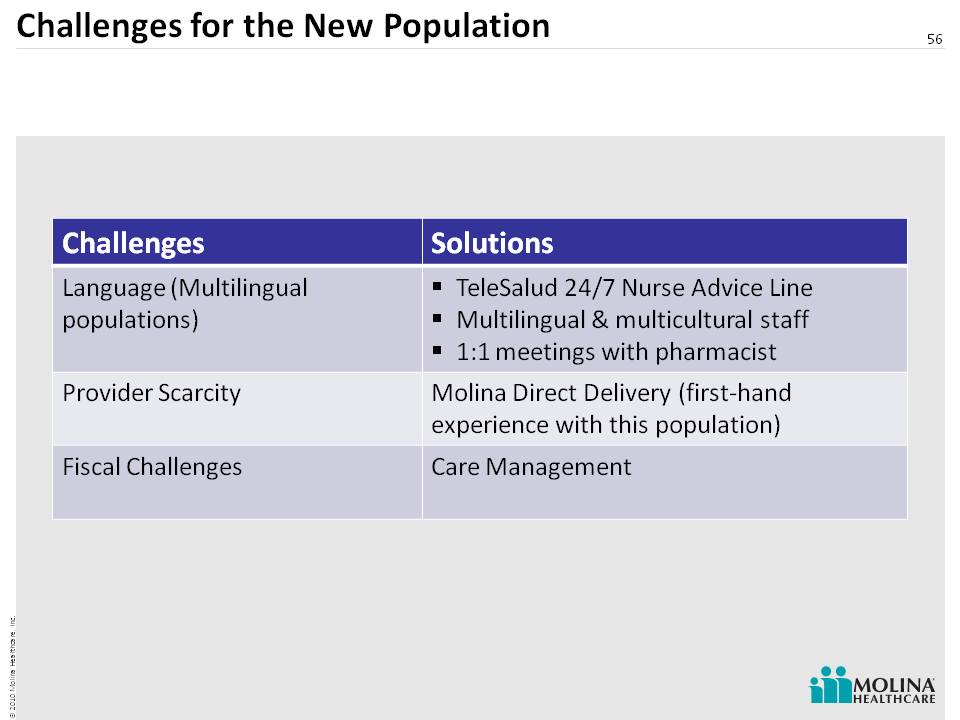
56 Challenges for the New Population Challenges Solutions Language (Multilingual populations) TeleSalud 24/7 Nurse Advice Line Multilingual & multicultural staff 1:1 meetings with pharmacist Provider Scarcity Molina Direct Delivery (first-hand experience with this population) Fiscal Challenges Care Management
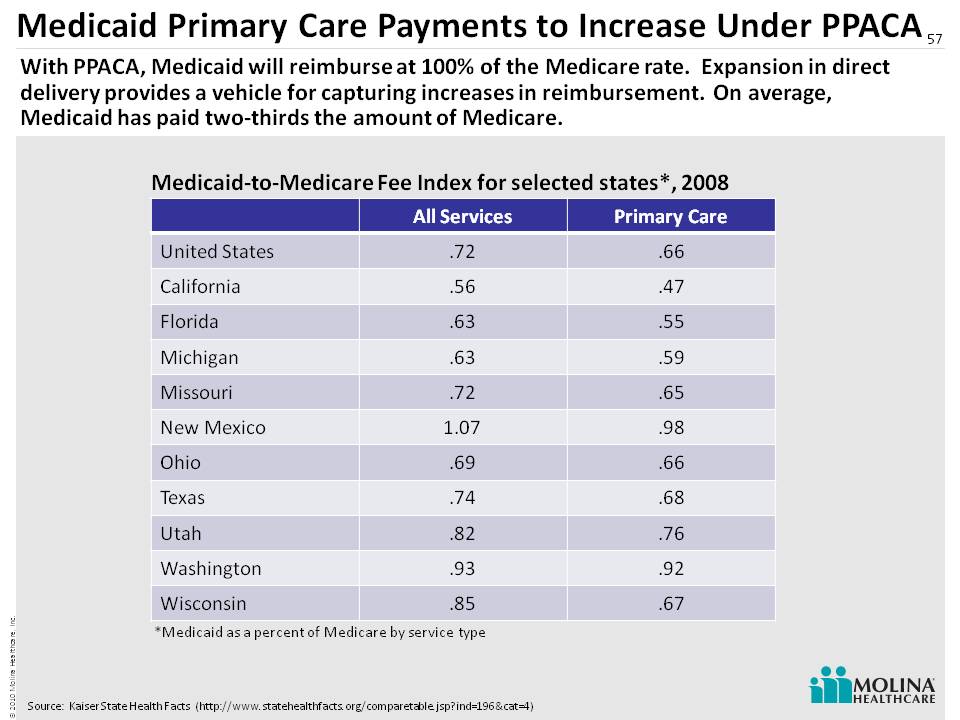
Medicaid Primary Care Payments to Increase Under PPACA 57 Medicaid-to-Medicare Fee Index for selected states*, 2008 Source: Kaiser State Health Facts (http://www.statehealthfacts.org/comparetable.jsp?ind=196&cat=4) *Medicaid as a percent of Medicare by service type With PPACA, Medicaid will reimburse at 100% of the Medicare rate. Expansion in direct delivery provides a vehicle for capturing increases in reimbursement. On average, Medicaid has paid two-thirds the amount of Medicare. All Services Primary Care United States .72 .66 California .56 .47 Florida .63 .55 Michigan .63 .59 Missouri .72 .65 New Mexico 1.07 .98 Ohio .69 .66 Texas .74 .68 Utah .82 .76 Washington .93 .92 Wisconsin .85 .67
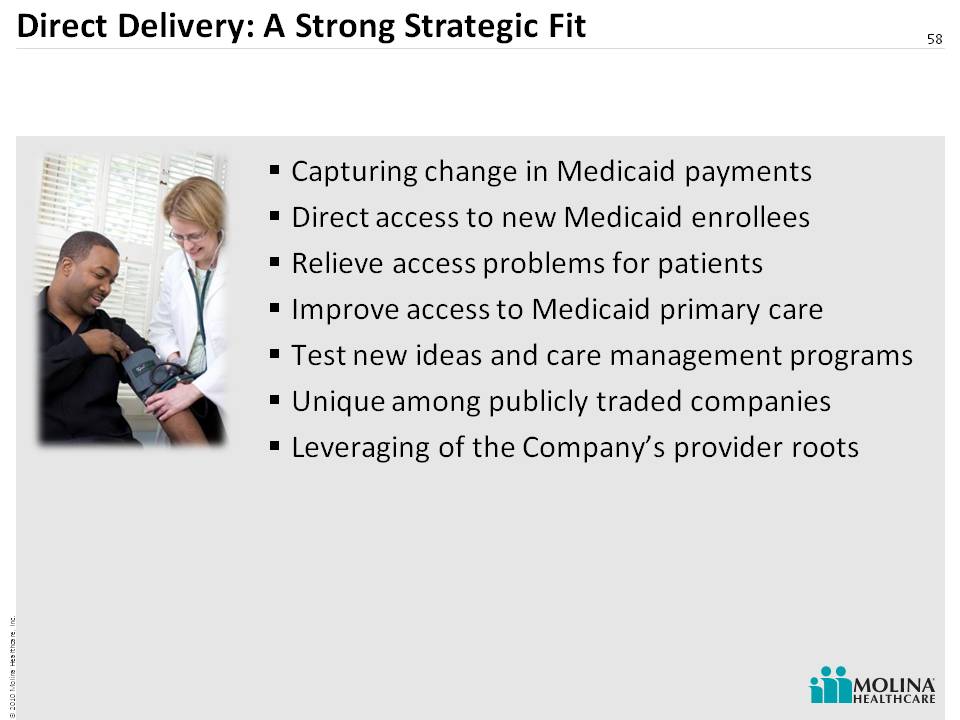
Direct Delivery: A Strong Strategic Fit 58 Capturing change in Medicaid payments Direct access to new Medicaid enrollees Relieve access problems for patients Improve access to Medicaid primary care Test new ideas and care management programs Unique among publicly traded companies Leveraging of the Company’s provider roots
Panel 2 Q&A 59
60 Molina Medicaid SolutionsAccounting Update Joseph White Chief Accounting Officer
Molina Medicaid Solutions 61 Certain key accounting practices have a significant impact on revenue, cost and profitability trends Key Accounting Practices: Purchase Accounting Revenue Recognition Cost Recognition

Key Accounting Practices: Purchase Accounting 62 Purchase Price $131M Contract Backlog18% Customer Relationships19% REDUCTION TO REVENUEFaster amortization: Spread only over base life of contract AMORTIZATION EXPENSESlower amortization: Spread over base life of contract & option years An unusual feature of MMS purchase accounting is the amortization of a portion of the purchase price against revenue $M $M * *With the exception of Q210 amortization amounts, all amounts are estimates and subject to change. Actual results may differ materially. See cautionary statement. * * * * Please refer to the Company’s cautionary statement on page 2.
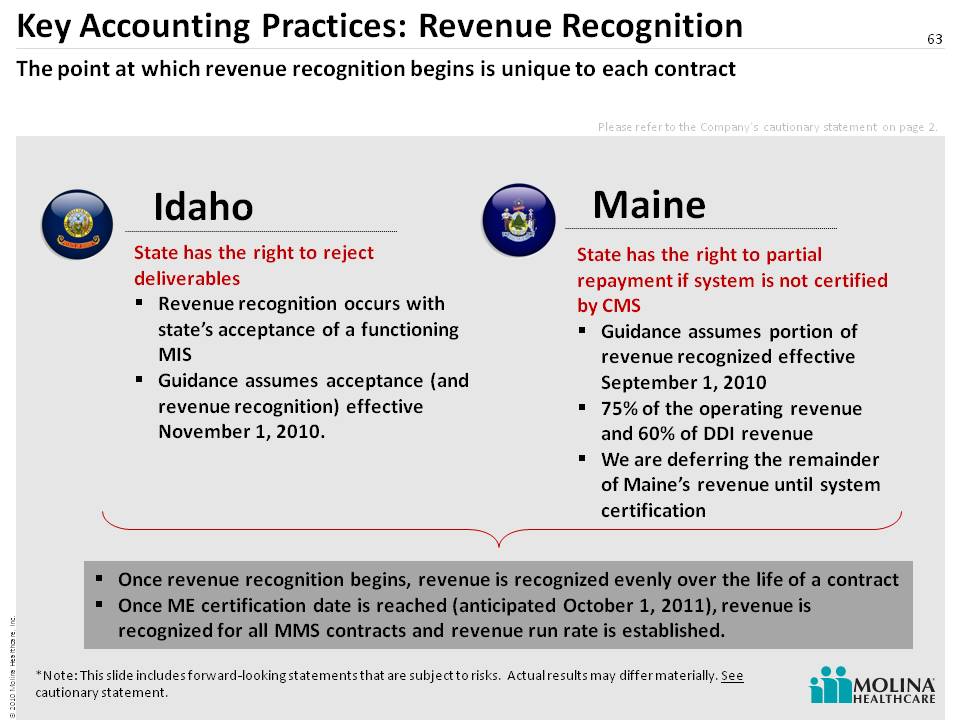
Key Accounting Practices: Revenue Recognition 63 State has the right to reject deliverables Revenue recognition occurs with state’s acceptance of a functioning MIS Guidance assumes acceptance (and revenue recognition) effective November 1, 2010. The point at which revenue recognition begins is unique to each contract Idaho Maine State has the right to partial repayment if system is not certified by CMS Guidance assumes portion of revenue recognized effective September 1, 2010 75% of the operating revenue and 60% of DDI revenue We are deferring the remainder of Maine’s revenue until system certification Once revenue recognition begins, revenue is recognized evenly over the life of a contract Once ME certification date is reached (anticipated Oc tober 1, 2011), revenue is recognized for all MMS contracts and revenue run rate is established. *Note: This slide includes forward-looking statements that are subject to risks. Actual results may differ materially. See cautionary statement. Please refer to the Company’s cautionary statement on page 2.
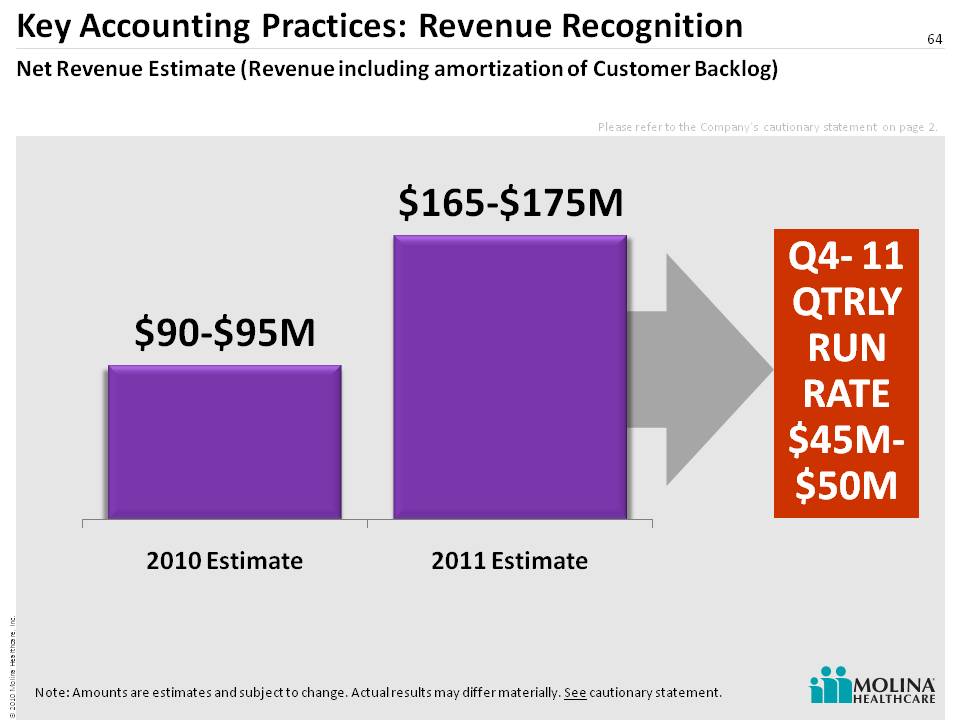
Key Accounting Practices: Revenue Recognition 64 Net Revenue Estimate (Revenue including amortization of Customer Backlog) Q4- 11 QTRLY RUN RATE $45M-$50M Note: Amounts are estimates and subject to change. Actual results may differ materially. See cautionary statement. Please refer to the Company’s cautionary statement on page 2.
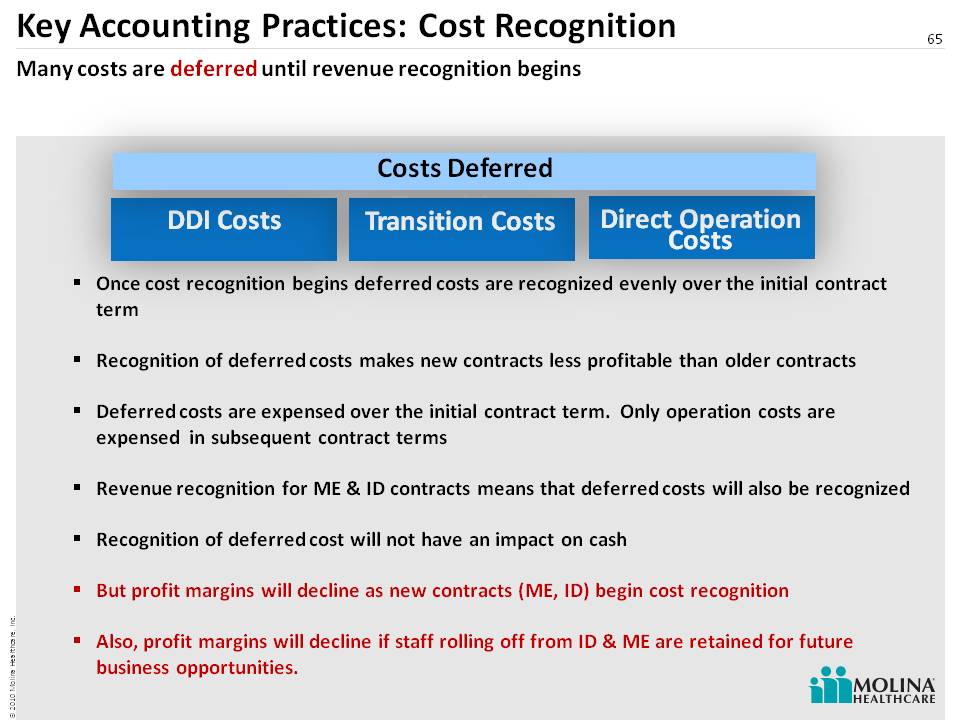
Key Accounting Practices: Cost Recognition 65 Many costs are deferred until revenue recognition begins Once cost recognition begins deferred costs are recognized evenly over the initial contract term Recognition of deferred costs makes new contracts less profitable than older contractsDeferred costs are expensed over the initial contract term. Only operation costs are expensed in subsequent contract terms Revenue recognition for ME & ID contracts means that deferred costs will also be recognizedRecognition of deferred cost will not have an impact on cashBut profit margins will decline as new contracts (ME, ID) begin cost recognitionAlso, profit margins will decline if staff rolling off from ID & ME are retained for future business opportunities. DDI Costs Transition Costs Direct Operation Costs Transition Costs Direct Operation Costs Costs Deferred
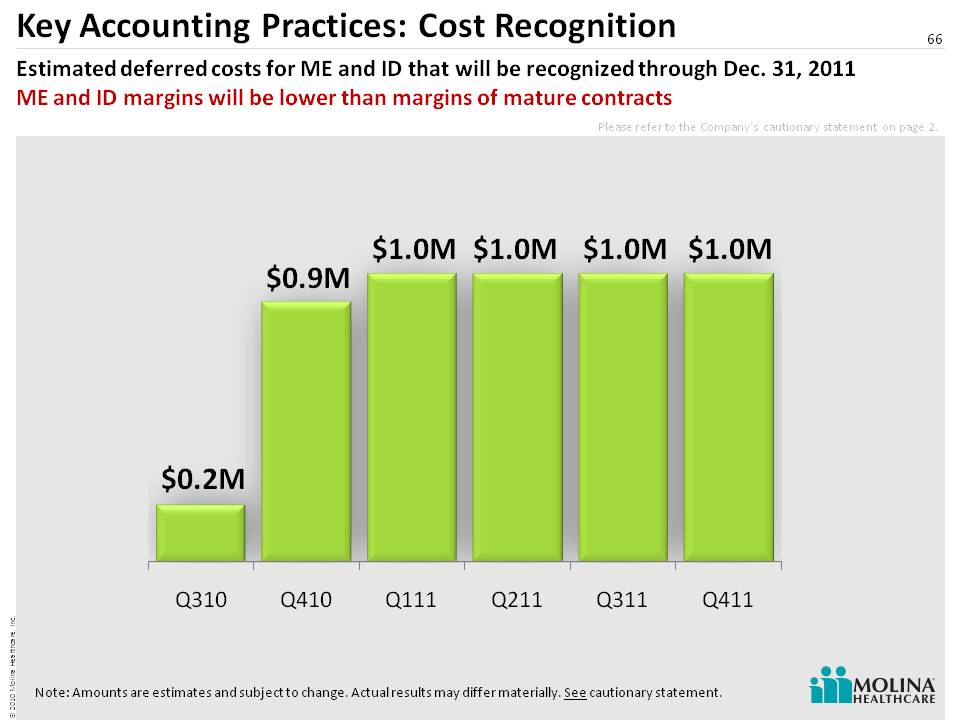
Key Accounting Practices: Cost Recognition 66 Estimated deferred costs for ME and ID that will be recognized through Dec. 31, 2011 ME and ID margins will be lower than margins of mature contracts Note: Amounts are estimates and subject to change. Actual results may differ materially. See cautionary statement. Please refer to the Company’s cautionary statement on page 2.

Profitability Trends: Estimated Margins 67 Profitability declines in Q3-10, falls further in Q4-10, stabilizes in Q1-11 and climbs thereafter.ME and ID margins will be lower than margins of mature contracts Note: Percentages are estimates and subject to change. Actual results may differ materially. See cautionary statement.Operating Profit Margin – Operating profit (net revenue less cost of service revenue) as a percentage of net revenue. Pretax Margin – Pretax profit as a percentage of net revenue. Net revenue denotes service revenue including amortization of Customer Backlog. Please refer to the Company’s cautionary statement on page 2. 2Q-2010 2H-2010 FY 2010 FY 2011 Long Term** Operating Profit M argin(1) 32% 16% - 20% 18% - 22% 18% - 22% 20% - 25% Pretax Margin(2) 24% 9% - 11% 10% - 14% 10% - 14% 13%-16% Observations Higher as only contracts for which deferred cost had been fully amortized (LA, NJ, WV) were generating revenue Amortization of deferred cost as ME (Sept 1) and ID (Nov 1) begin recognizing revenue will lower margins throughout 2H-10 Margin 4Q-10 will be approx one half of 3Q-10 Costs of pursuing new business Excludes corporate charges Amortization of deferred cost in ID & ME cont. Costs of pursuing new business Excludes corporate charges System certification expected in ME in 2H-11 contributes to higher margins H2 margin twice H1 **Estimate for current business only Cost of pursuing new b usiness Excludes corporate charges
68 2010 Financial UpdateJohn MolinaChief Financial Officer

Cautionary Statement 69 Safe Harbor Statement under the Private Securities Litigation Reform Act of 1995: This slide presentation, as well as our accompanying oral remarks, contain numerous “forward-looking statements” regarding our operations for 2010 and subsequent fiscal years, the expected impact on our business of healthcare reform, future opportunities for growth and expansion, accounting estimates related to our MMIS business, financial guidance for fiscal year 2010, and various other matters. All of our forward-looking statements are subject to numerous risks, uncertainties, and other factors that could cause our actual results to differ materially. Anyone viewing or listening to this presentation is urged to read the risk factors and cautionary statements found under Item 1A in our 2009 Annual Report on Form 10-K filed on March 16, 2010, our first quarter 2010 Quarterly Report filed on May 10, 2010, our second quarter 2010 Quarterly Report filed on August 4th, 2010 and the risk factors and cautionary statements found in our other reports and filings with the Securities and Exchange Commission and available for viewing on its website at www.sec.gov. Except to the extent otherwise required by federal securities laws, we do not undertake to address or update forward-looking statements in future filings or communications regarding our business or operating results.
70 Drivers of Revised Guidance Equity IssuanceWisconsin AcquisitionTX CHIP RSA AwardMI Premium ReductionsOther Premium Rates ChangesImproved MMS Visibility
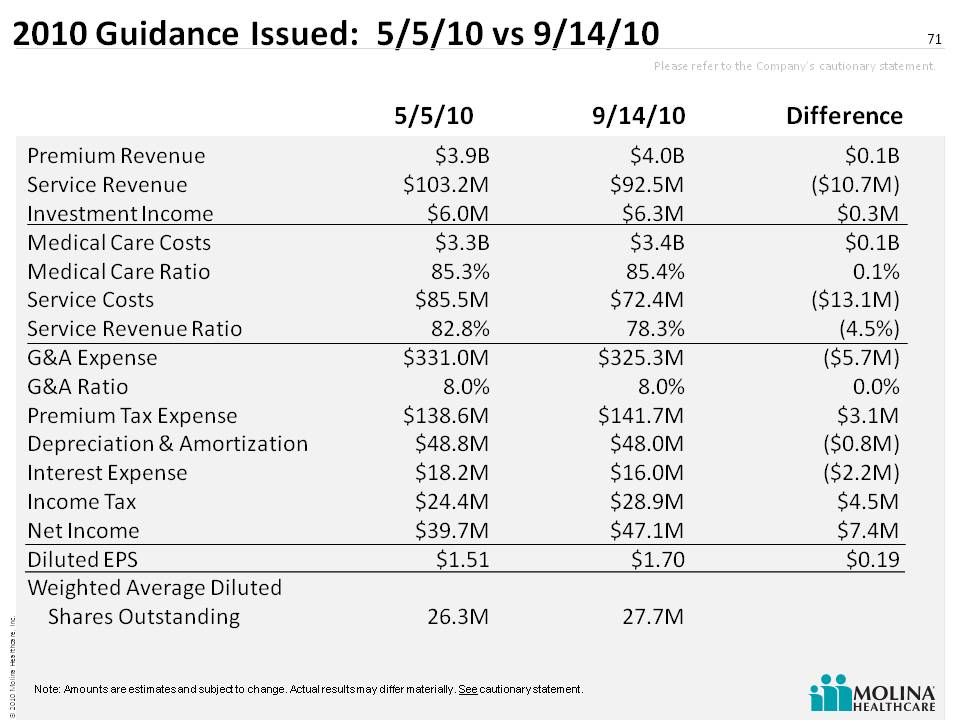
2010 Guidance Issued: 5/5/10 vs 9/14/10 71 5/5/10 9/14/10 Difference Premium Revenue Service Revenue Investment Income Medical Care Costs Medical Care Ratio Service Costs Service Revenue Ratio G&A Expense G&A Ratio Premium Tax Expense Depreciation & AmortizationInterest Expense Income Tax Net Income Diluted EPS Weighted Average Diluted Shares Outstanding $3.9B $103.2M $6.0M $3.3B 85.3% $85.5M 82.8% $331.0M 8.0% $138.6M $48.8M $18.2M $24.4M $39.7M $1.51 26.3M $0.1B ($10.7M) $0.3M $0.1B 0.1% ($13.1M) (4.5%) ($5.7M) 0.0% $3.1M ($0.8M) ($2.2M) $4.5M $7.4M $0.19 $4.0B $92.5M $6.3M $3.4B 85.4% $72.4M 78.3% $325.3M 8.0% $141.7M $48.0M $16.0M $28.9M $47 .1M $1.70 27.7M Note: Amounts are estimates and subject to change. Actual results may differ materially. See cautionary statement. Please refer to the Company’s cautionary statement.
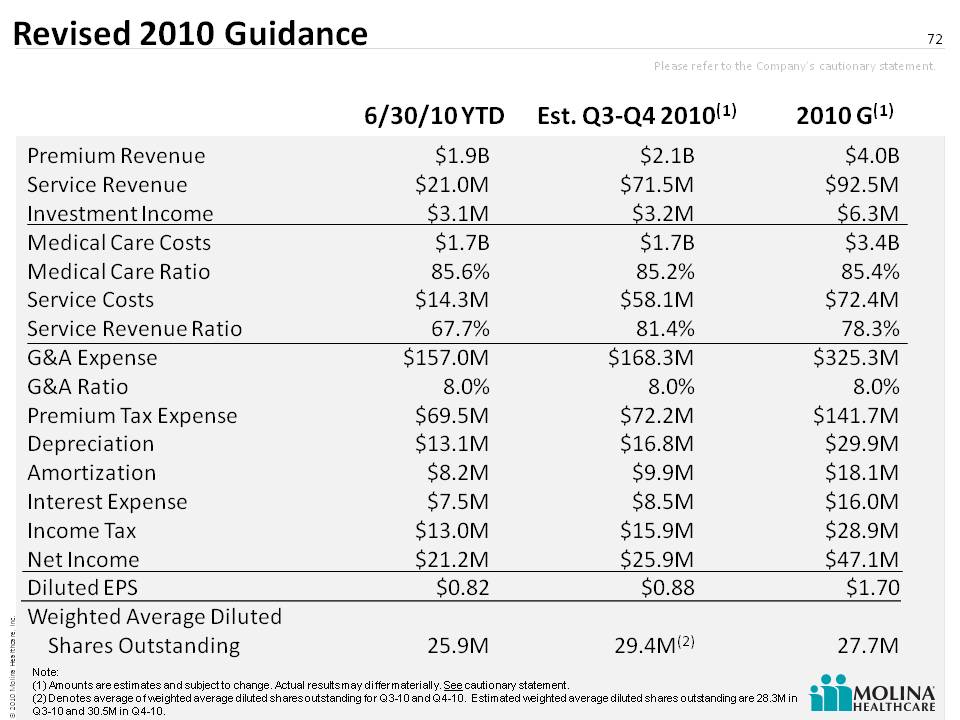
Revised 2010 Guidance 72 6/30/10 YTD Est. Q3-Q4 2010(1) 2010 G(1) Premium Revenue Service RevenueInvestment IncomeMedical Care CostsMedical Care RatioService CostsService Revenue Ratio G&A ExpenseG&A RatioPremium Tax ExpenseDepreciation AmortizationInterest ExpenseIncome TaxNet Income Diluted EPS Weighted Average Diluted Shares Outstanding $1.9B$21.0M$3.1M$1.7B85.6%$14.3M67.7%$157.0M8.0%$69.5 M$13.1M$8.2M$7.5M$13.0M $21.2M$0.8225.9M $2.1B $71.5M$3.2M$1.7B85.2%$58.1M81.4%$168.3M8.0 $72.2M$16.8M$9.9M$8.5M$15.9M$25.9M$0.8829.4M(2) $4.0B$92.5M$6.3M$3.4B85.4%$72.4M78.3%$325.3M8.0%$141.7M $29.9M$18.1M $16.0M$28.9M $47.1M $1.7027.7M Note: (1) Amounts are estimates and subject to change. Actual results may differ materially. See cautionary statement.(2) Denotes average of weighted average diluted shares outstanding for Q3-10 and Q4-10. Estima ted weighted average diluted shares outstanding are 28.3M in Q3-10 and 30.5M in Q4-10. Please refer to the Company’s cautionary statement.
Key Assumptions for 2010 Guidance* 73 MOH will keep current benefit of approximately $0.8M per month from Medicaid Rx rebates through December 31, 2010 No change to MI premium rates effective October 1, 2010 2% premium rate increase in California effective October 1, 2010 Normal flu patterns through December 31, 2010 Note: In the event any of these listed assumptions regarding future events prove to be inaccurate, actual results could differ materially. Please refer to the Company’s cautionary statement.
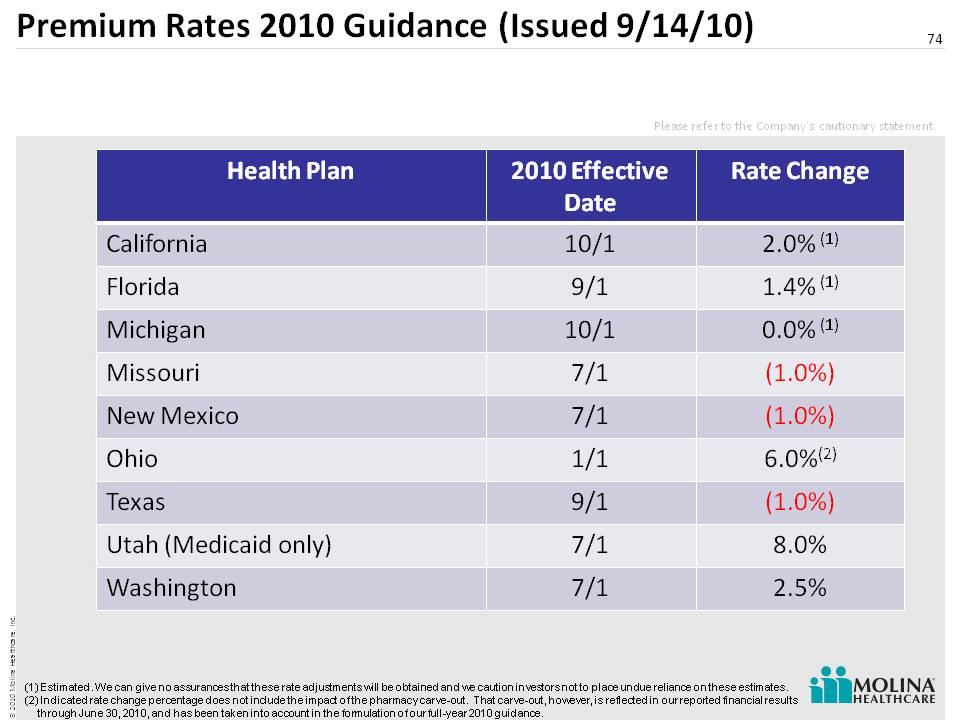
Premium Rates 2010 Guidance (Issued 9/14/10) 74 Health Plan 2010 Effective Date Rate Change California 10/1 2.0% (1) Florida 9/1 1.4% (1) Michigan 10/1 0.0% (1) Missouri 7/1 (1.0%) New Mexico 7/1 (1.0%) Ohio 1/1 6.0%(2) Texas 9/1 (1.0%) Utah (Medicaid only) 7/1 8.0% Washington 7/1 2.5% (1) Estimated. We can give no assurances that these rate adjustments will be obtained and we caution investors not to place undue reliance on these estimates. (2) Indicated rate change percentage does not include the impact of the pharmacy carve-out. That carve-out, however, is reflected in our reported financial results through June 30, 2010, and has been taken into account in the formulation of our full-year 2010 guidance. Please ref er to the Company’s cautionary statement.

Panel 3 Q&A 75

76 Appendix
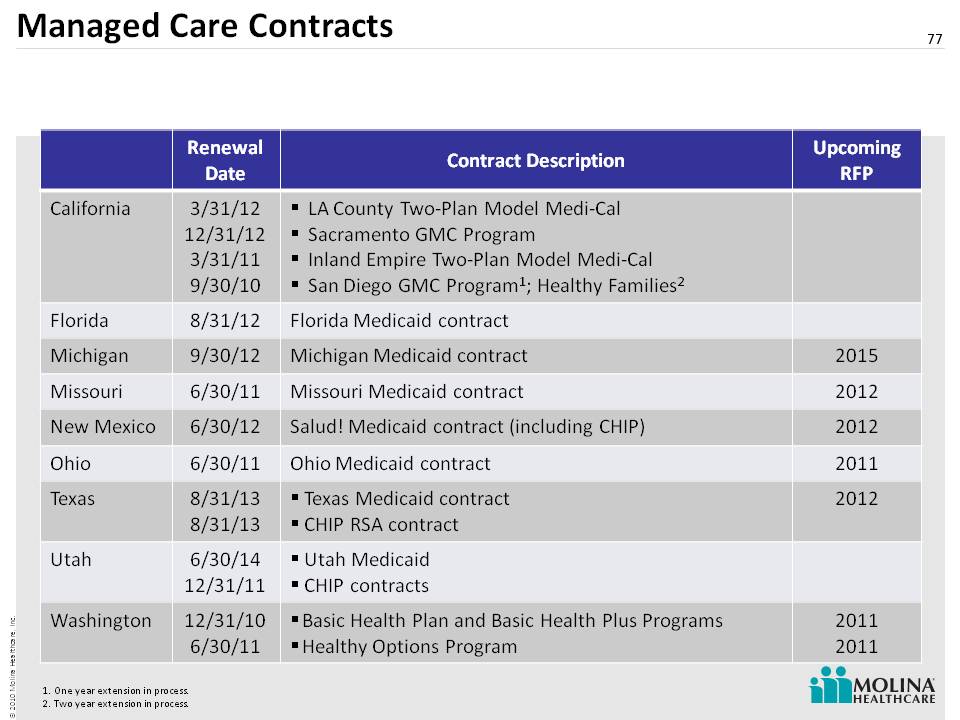
Managed Care Contracts 77 One year extension in process.Two year extension in process. Renewal Date Contract Description Upcoming RFP California 3/31/12 12/31/12 3/31/11 9/30/10 LA County Two-Plan Model Medi-Cal Sacramento GMC Program Inland Empire Two-Plan Model Medi-Cal San Diego GMC Program1; Healthy Families2 Florida 8/31/12 Florida Medicaid contract Michigan 9/30/12 Michigan Medicaid contract 2015 Missouri 6/30/11 Missouri Medicaid contract 2012 New Mexico 6/30/12 Salud! Medicaid contract (including CHIP) 2012 Ohio 6/30/11 Ohio Medicaid contract 2011 Texas 8/31/13 8/31/13 Texas Medicaid contract CHIP RSA contract 2012 Utah 6/30/14 12/31/11 Utah Medicaid CHIP contracts Washington 12/31/10 6/30/11 Basic Health Plan and Basic Health Plus Programs Healthy Options Program 2011 2011
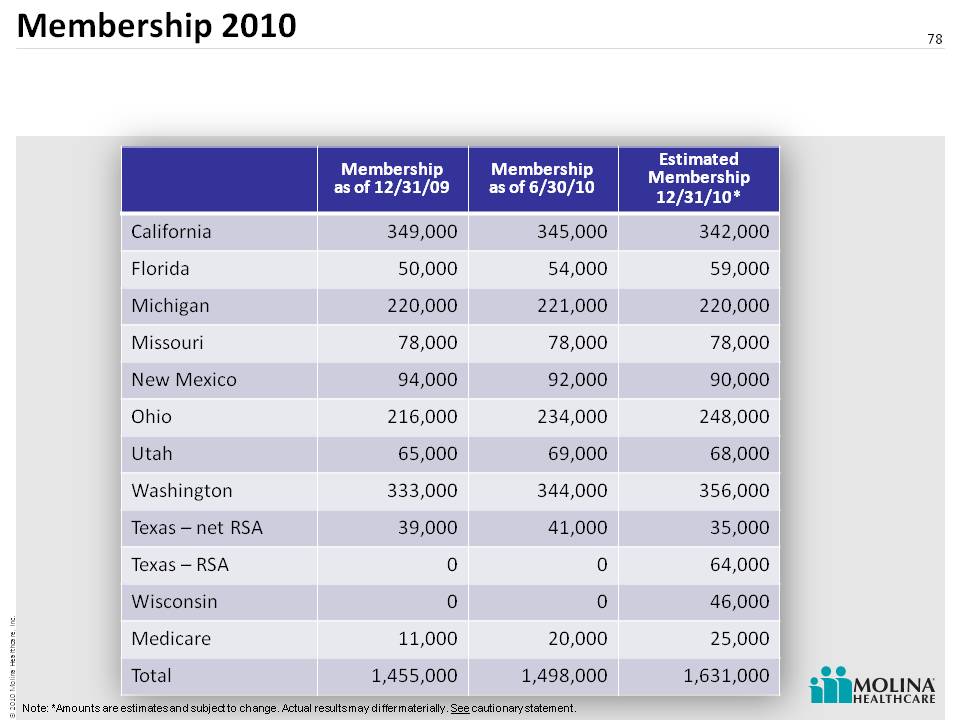
Membership 2010 78 Note: *Amounts are estimates and subject to change. Actual results may differ materially. See cautionary statement. Membership as of 12/31/09 Membership as of 6/30/10 Estimated Membership 12/31/10* California 349,000 345,000 342,000 Florida 50,000 54,000 59,000 Michigan 220,000 221,000 220,000 Missouri 78,000 78,000 78,000 New Mexico 94,000 92,000 90,000 Ohio 216,000 234,000 248,000 Utah 65,000 69,000 68,000 Washington 333,000 344,000 356,000 Texas – net RSA 39,000 41,000 35,000 Texas – RSA 0 0 64,000 Wisconsin 0 0 46,000 Medicare 11,000 20,000 25,000 Total 1,455,000 1,498,000 1,631,000