Exhibit 99.1
Molina Healthcare, Inc.J.P. Morgan Healthcare Conference Joe ZubretskyPresident & Chief Executive OfficerJanuary 7, 2019

Cautionary Statement Safe Harbor Statement under the Private Securities Litigation Reform Act of 1995:This slide presentation and our accompanying oral remarks contain forward-looking statements regarding, without limitation, our business, operations, turnaround, plans, guidance, projections, and longer-term outlook within the meaning of Section 27A of the Securities Act of 1933, or Securities Act, and Section 21E of the Securities Exchange Act of 1934, or Securities Exchange Act. We intend such forward-looking statements to be covered by the safe harbor provisions for forward-looking statements contained in the Private Securities Litigation Reform Act of 1995, and we are including this statement for purposes of complying with such safe harbor provisions. All statements, other than statements of historical facts, included in this presentation may be deemed to be forward-looking statements for purposes of the Securities Act and the Securities Exchange Act. Without limiting the foregoing, we use the words “anticipate(s),” “are confident,” “believe(s),” “estimate(s),” “expect(s),” “guidance,” “intend(s),” “may,” “outlook,” “plan(s),” “project(s) or “projection(s),” “will,” “would,” “could,” “should,” and similar expressions to identify forward-looking statements, although not all forward-looking statements contain these identifying words. We cannot guarantee that we will actually achieve the plans, intentions, outlook, or expectations disclosed in our forward-looking statements and, accordingly, you should not place undue reliance on our forward-looking statements. Anyone viewing or listening to this presentation is urged to read the risk factors and cautionary statements found under Item 1A in our Form 10-K annual report, as well as the risk factors and cautionary statements in our quarterly reports and in our other reports and filings with the Securities and Exchange Commission and available for viewing on its website at sec.gov. Except to the extent otherwise required by federal securities laws, we caution you that we do not undertake any obligation to update forward-looking statements made by us.
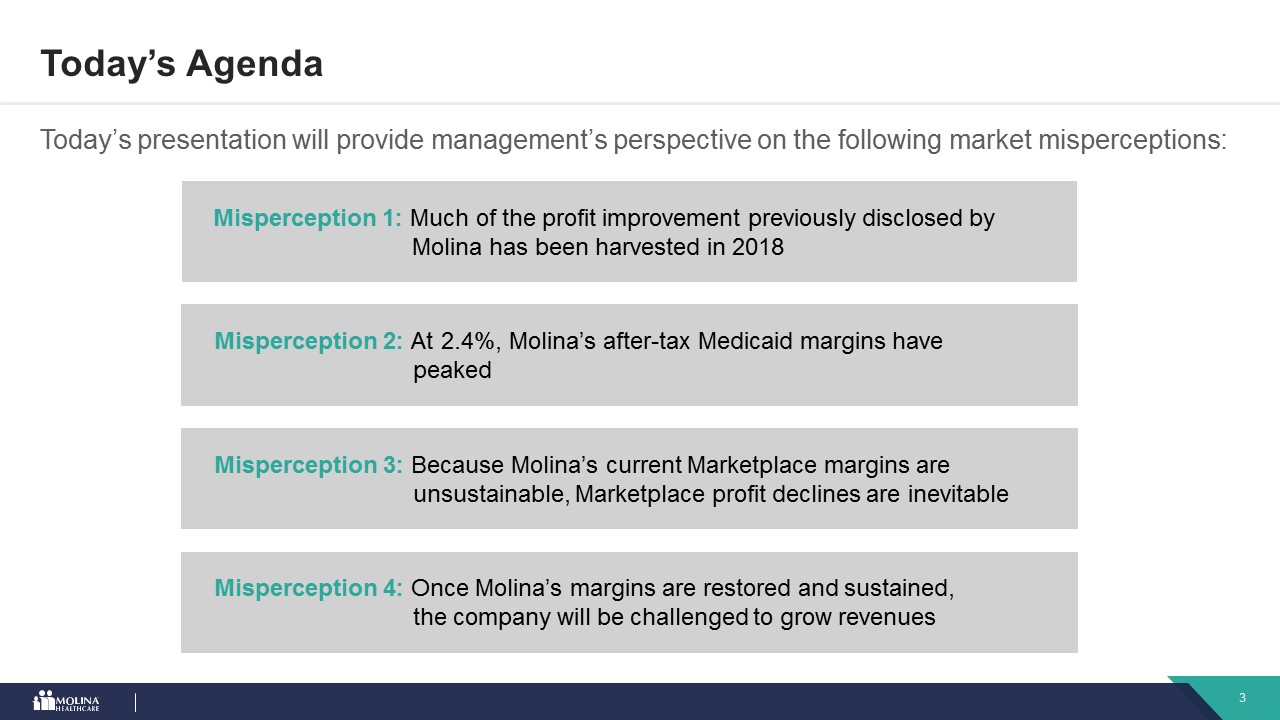
Today’s Agenda Today’s presentation will provide management’s perspective on the following market misperceptions: Misperception 1: Much of the profit improvement previously disclosed by Molina has been harvested in 2018 Misperception 2: At 2.4%, Molina’s after-tax Medicaid margins have peaked Misperception 3: Because Molina’s current Marketplace margins are unsustainable, Marketplace profit declines are inevitable Misperception 4: Once Molina’s margins are restored and sustained, the company will be challenged to grow revenues
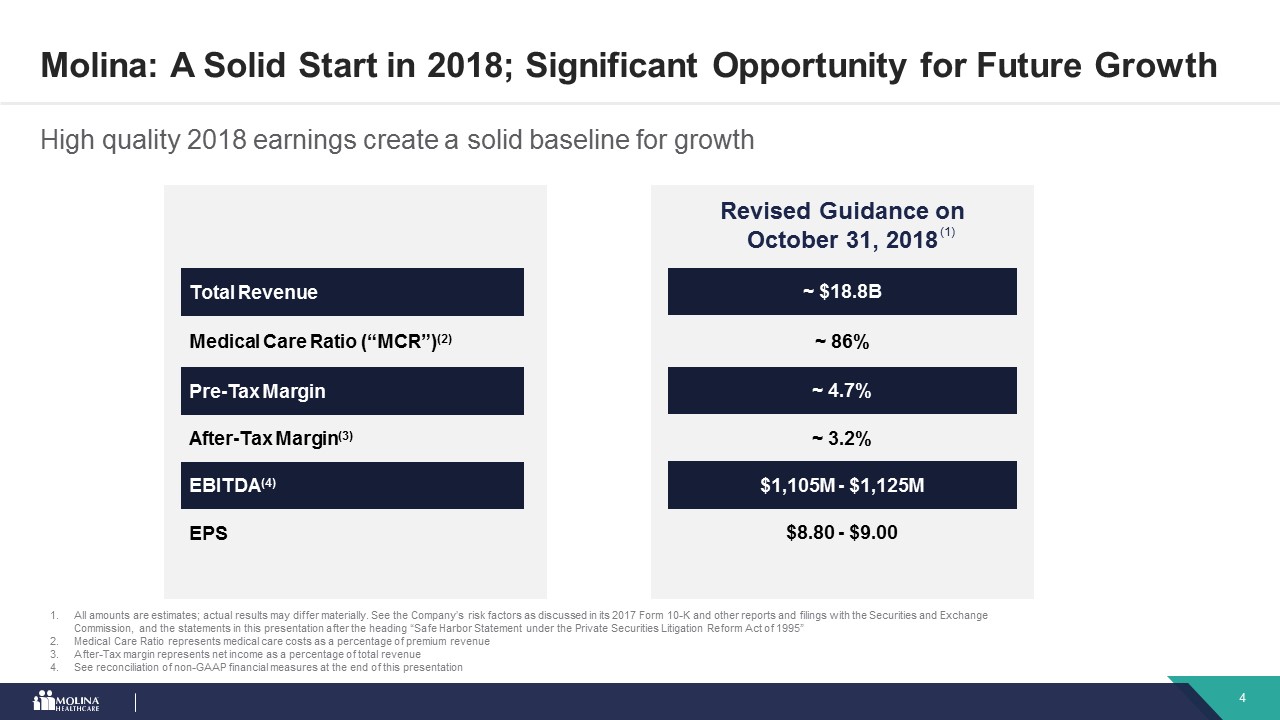
High quality 2018 earnings create a solid baseline for growth Molina: A Solid Start in 2018; Significant Opportunity for Future Growth All amounts are estimates; actual results may differ materially. See the Company’s risk factors as discussed in its 2017 Form 10-K and other reports and filings with the Securities and Exchange Commission, and the statements in this presentation after the heading “Safe Harbor Statement under the Private Securities Litigation Reform Act of 1995”Medical Care Ratio represents medical care costs as a percentage of premium revenueAfter-Tax margin represents net income as a percentage of total revenueSee reconciliation of non-GAAP financial measures at the end of this presentation Revised Guidance on October 31, 2018 ~ $18.8B ~ 86% ~ 4.7% ~ 3.2% $1,105M - $1,125M $8.80 - $9.00 Total Revenue Medical Care Ratio (“MCR”)(2) Pre-Tax Margin After-Tax Margin(3) EBITDA(4) EPS (1)

Profit Improvement Opportunity
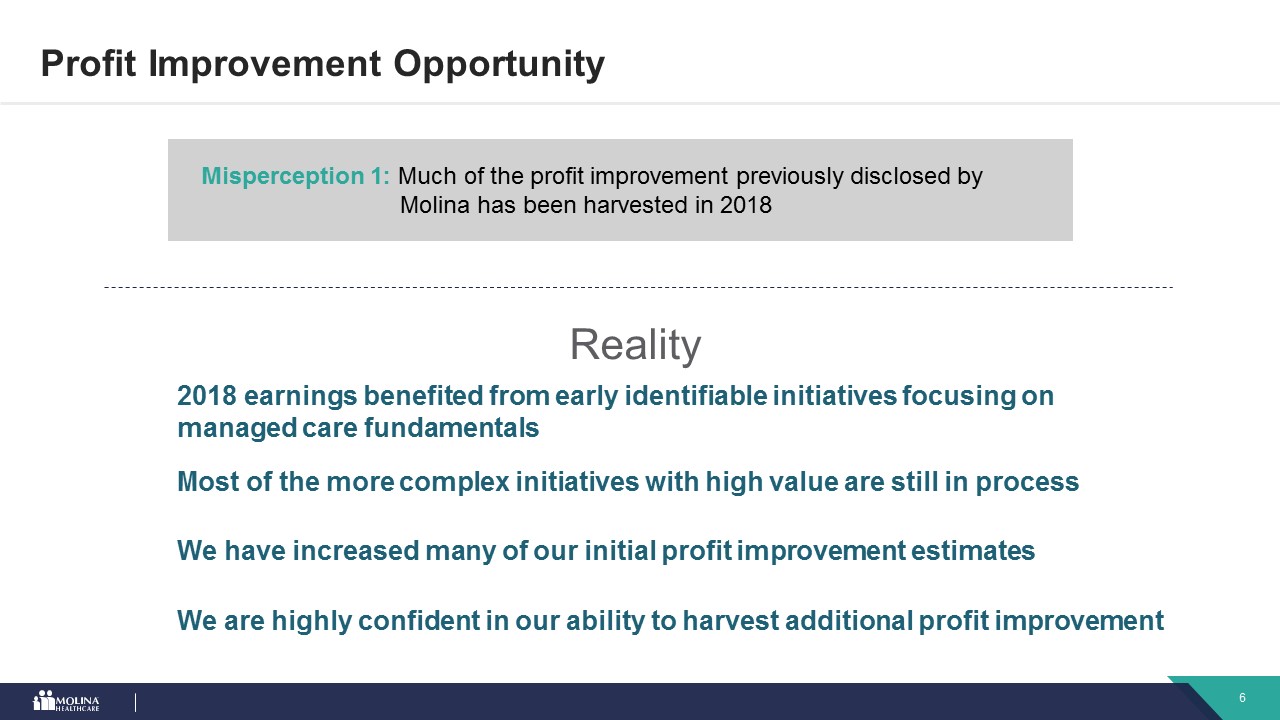
Profit Improvement Opportunity Reality Misperception 1: Much of the profit improvement previously disclosed by Molina has been harvested in 2018 2018 earnings benefited from early identifiable initiatives focusing on managed care fundamentals Most of the more complex initiatives with high value are still in process We have increased many of our initial profit improvement estimates We are highly confident in our ability to harvest additional profit improvement
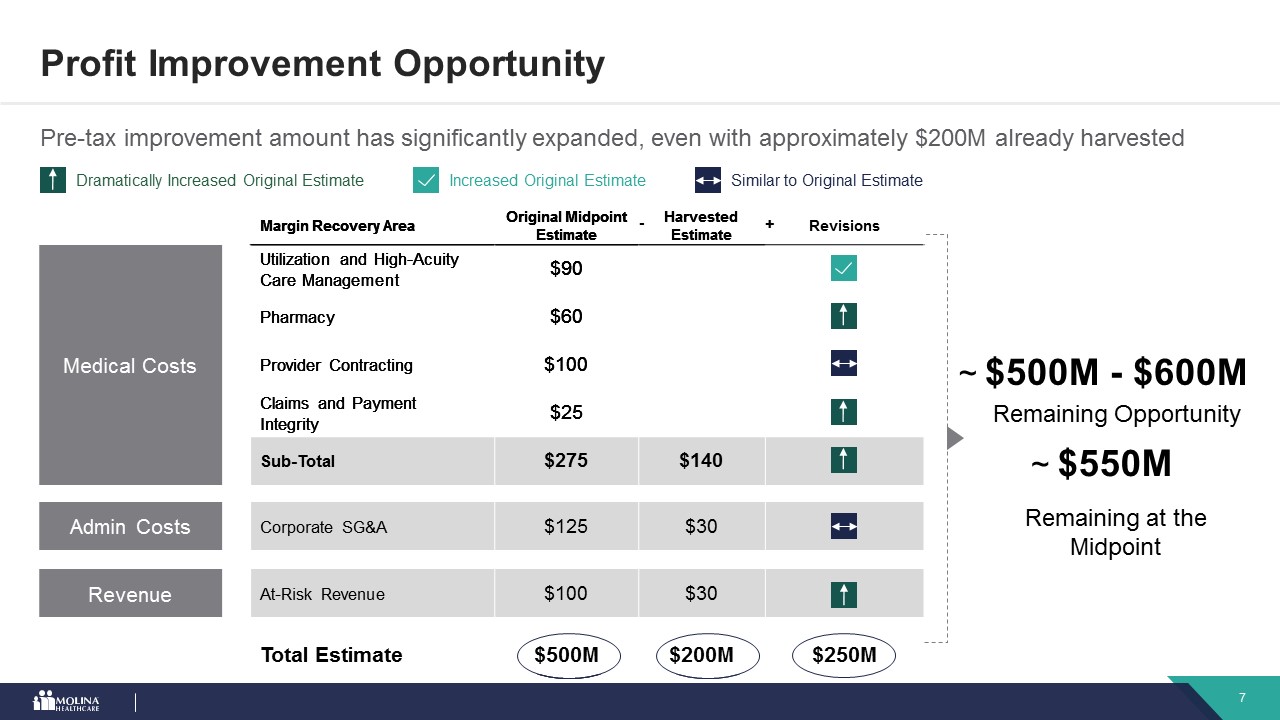
Profit Improvement Opportunity Margin Recovery Area Original MidpointEstimate Medical Costs Utilization and High-Acuity Care Management $90 Pharmacy $60 Provider Contracting $100 Claims and Payment Integrity $25 Sub-Total $275 Admin Costs Corporate SG&A $125 Revenue At-Risk Revenue $100 Total Estimate $500M Margin Recovery Area Original MidpointEstimate HarvestedEstimate Medical Costs Utilization and High-Acuity Care Management $90 Pharmacy $60 Provider Contracting $100 Claims and Payment Integrity $25 Sub-Total $275 $140 Admin Costs Corporate SG&A $125 $30 Revenue At-Risk Revenue $100 $30 Total Estimate $500M $200M - Pre-tax improvement amount has significantly expanded, even with approximately $200M already harvested Margin Recovery Area Original MidpointEstimate HarvestedEstimate Revisions Medical Costs Utilization and High-Acuity Care Management $90 Pharmacy $60 Provider Contracting $100 Claims and Payment Integrity $25 Sub-Total $275 $140 Admin Costs Corporate SG&A $125 $30 Revenue At-Risk Revenue $100 $30 Total Estimate $500M $200M $250M - + Increased Original Estimate Dramatically Increased Original Estimate $550M Remaining at the Midpoint ~ Similar to Original Estimate $500M - $600M Remaining Opportunity ~

After-Tax MedicaidMargins Can Improve
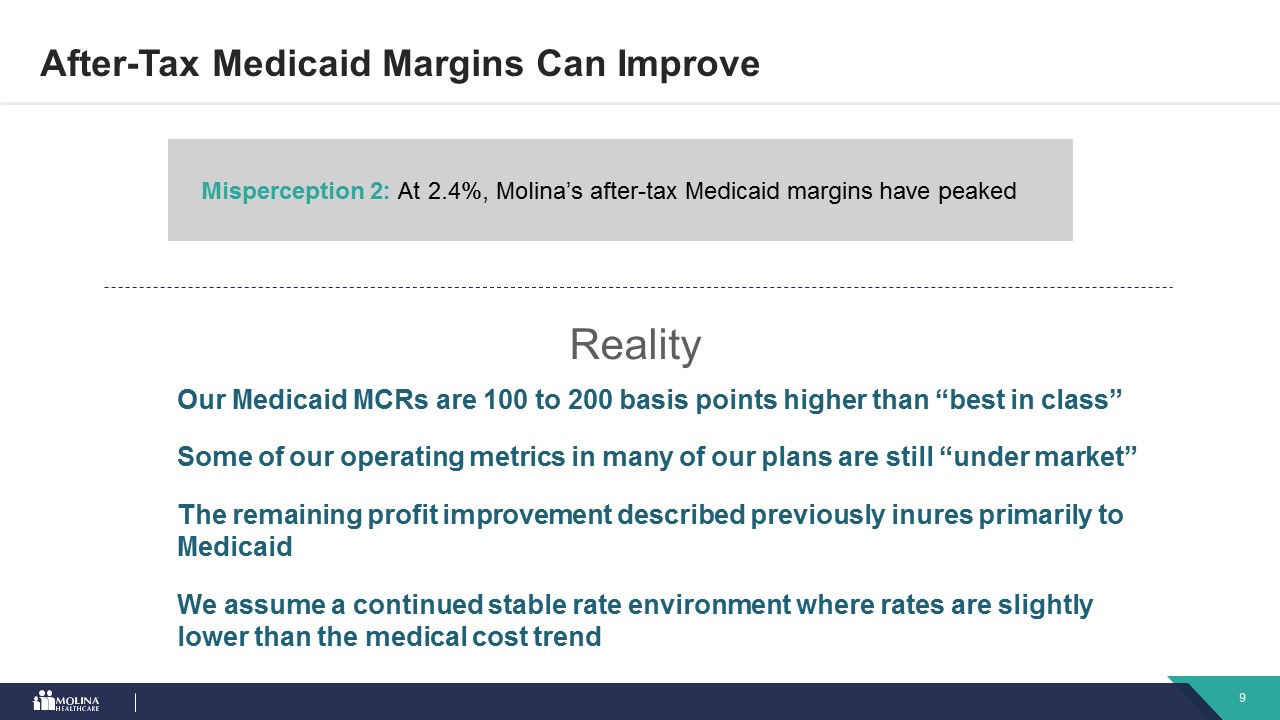
Reality Misperception 2: At 2.4%, Molina’s after-tax Medicaid margins have peaked Our Medicaid MCRs are 100 to 200 basis points higher than “best in class” Some of our operating metrics in many of our plans are still “under market” The remaining profit improvement described previously inures primarily to Medicaid We assume a continued stable rate environment where rates are slightly lower than the medical cost trend After-Tax Medicaid Margins Can Improve
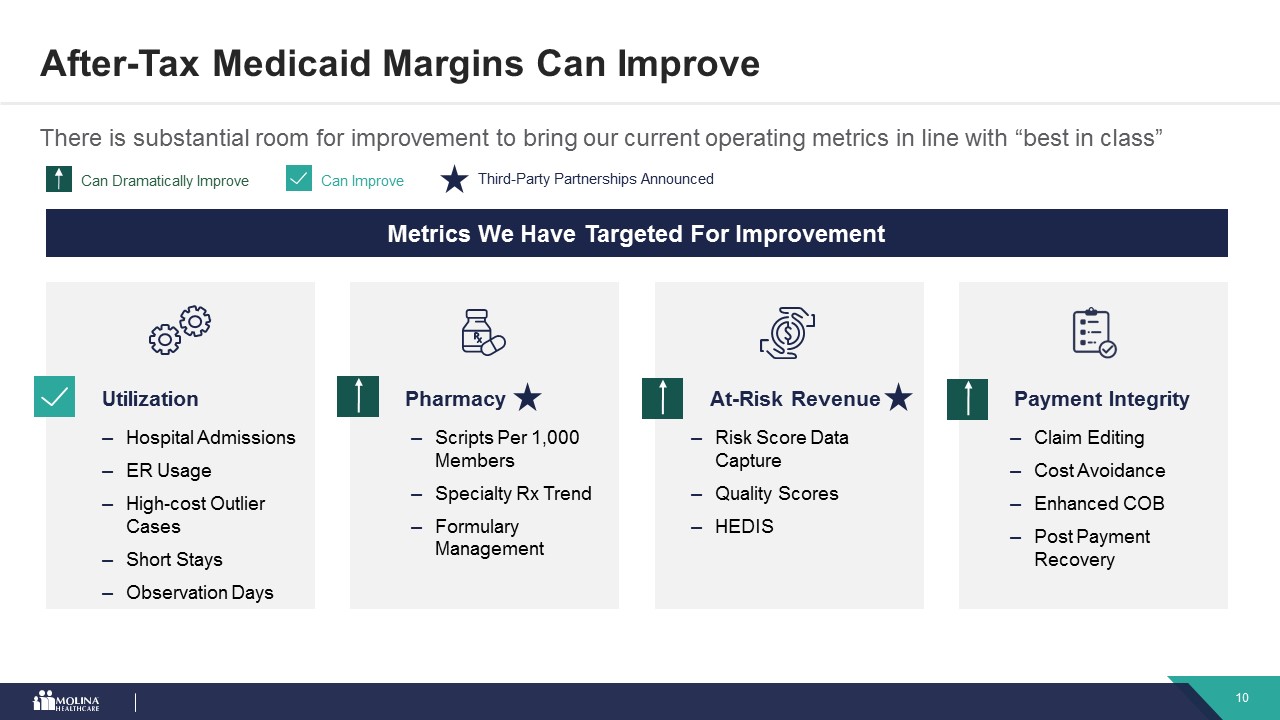
After-Tax Medicaid Margins Can Improve There is substantial room for improvement to bring our current operating metrics in line with “best in class” Metrics We Have Targeted For Improvement Utilization Hospital AdmissionsER UsageHigh-cost Outlier CasesShort StaysObservation Days Pharmacy Scripts Per 1,000 MembersSpecialty Rx TrendFormulary Management Can Dramatically Improve Can Improve Payment Integrity Claim EditingCost Avoidance Enhanced COBPost Payment Recovery At-Risk Revenue Risk Score Data CaptureQuality ScoresHEDIS Third-Party Partnerships Announced

After-Tax Medicaid Margins Can Improve By approaching “best in class” operating metrics, Molina’s Medicaid MCR can improve by 100 - 200 basis points Pure performance excludes the impact of the retroactive California risk corridor adjustment MCR and After-Tax Margin Opportunity Year to Date Pure Performance(1) 88-89%Medical Care Ratio 2.8->3.0%Medicaid After-Tax Margin 89.9%Medical Care Ratio 2.4%Medicaid After-Tax Margin with Upside ~$550M Profit Improvement ~75% Medicaid Portion Tax Rate ~25% Trend/Yield Deficit ~1.5% - ~2.5% Incremental After-Tax Impact Up To ~40 - ~100 bps Illustrative Model

Marketplace ProfitDollars Can Grow
Company perspective following the ruling Recent ACA Court Ruling ACA will remain in effect for 2019, and we expect that through appeals process ACA will remain in effect in its present form thereafter Given strong consensus that recent ruling will not survive on appeal, it is premature to comment on potential impacts to our businessThe ruling does not change our previously outlined strategy
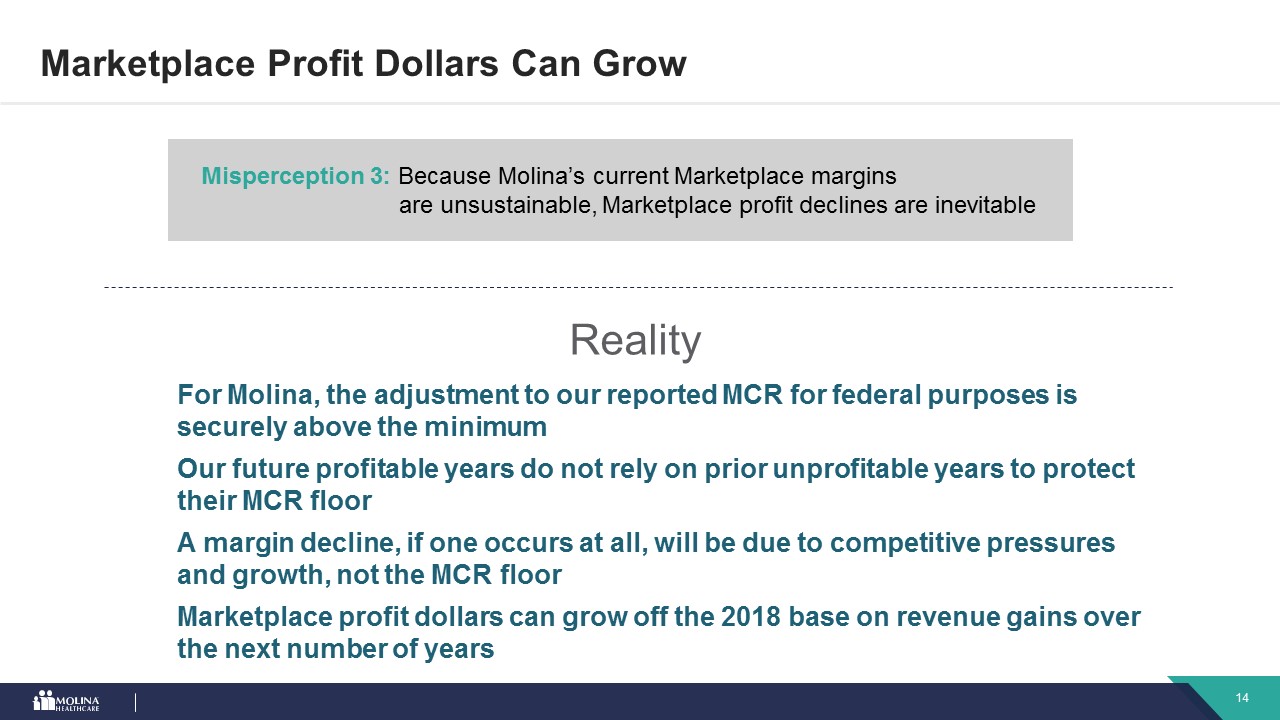
Reality Misperception 3: Because Molina’s current Marketplace margins are unsustainable, Marketplace profit declines are inevitable For Molina, the adjustment to our reported MCR for federal purposes is securely above the minimum Our future profitable years do not rely on prior unprofitable years to protect their MCR floor A margin decline, if one occurs at all, will be due to competitive pressures and growth, not the MCR floor Marketplace profit dollars can grow off the 2018 base on revenue gains over the next number of years Marketplace Profit Dollars Can Grow
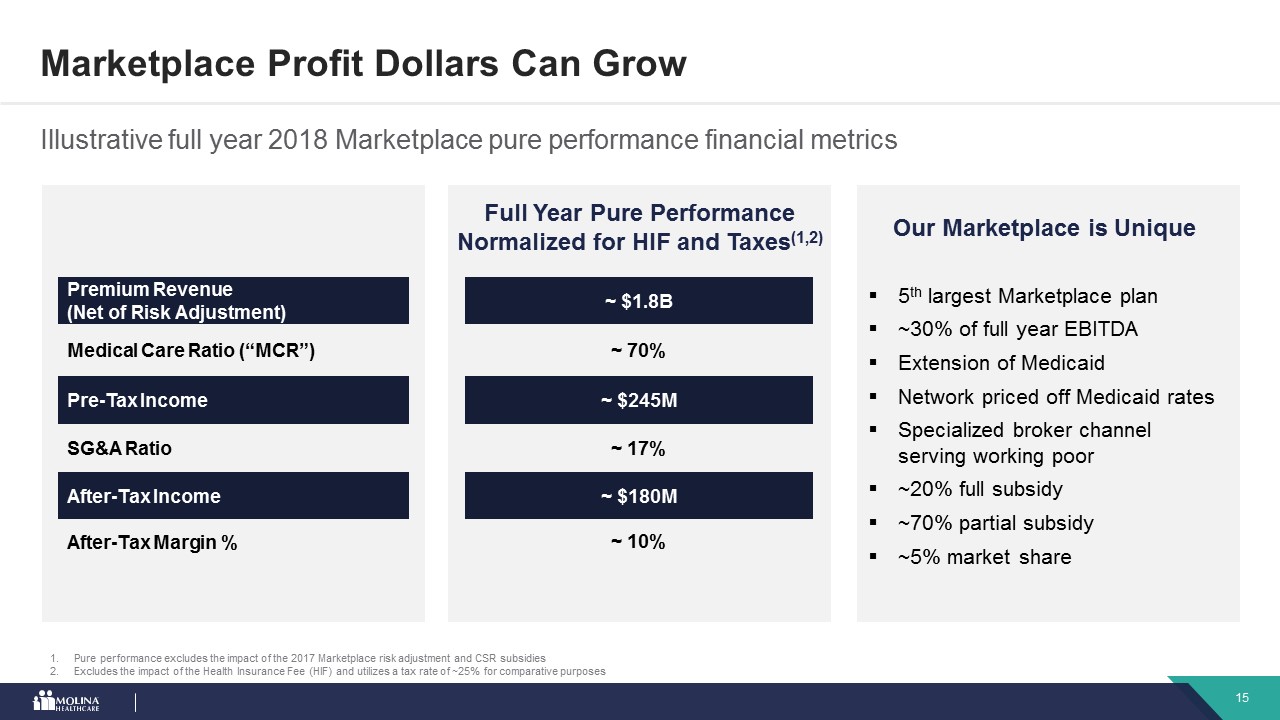
Marketplace Profit Dollars Can Grow Illustrative full year 2018 Marketplace pure performance financial metrics Pure performance excludes the impact of the 2017 Marketplace risk adjustment and CSR subsidiesExcludes the impact of the Health Insurance Fee (HIF) and utilizes a tax rate of ~25% for comparative purposes Full Year Pure PerformanceNormalized for HIF and Taxes(1,2) ~ $1.8B ~ 70% ~ $245M ~ 17% ~ $180M ~ 10% Premium Revenue (Net of Risk Adjustment) Medical Care Ratio (“MCR”) Pre-Tax Income SG&A Ratio After-Tax Income After-Tax Margin % 5th largest Marketplace plan~30% of full year EBITDAExtension of MedicaidNetwork priced off Medicaid ratesSpecialized broker channel serving working poor~20% full subsidy~70% partial subsidy~5% market share Our Marketplace is Unique
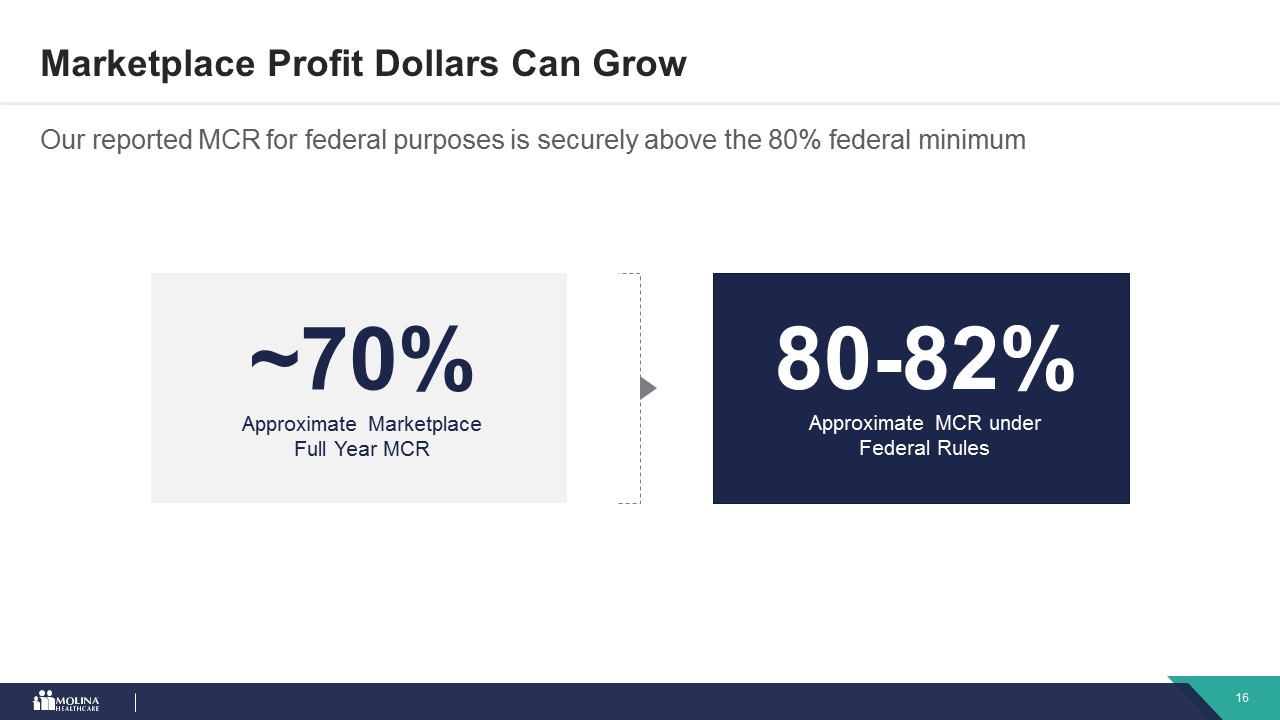
Marketplace Profit Dollars Can Grow Our reported MCR for federal purposes is securely above the 80% federal minimum ~70% Approximate Marketplace Full Year MCR 80-82% Approximate MCR under Federal Rules
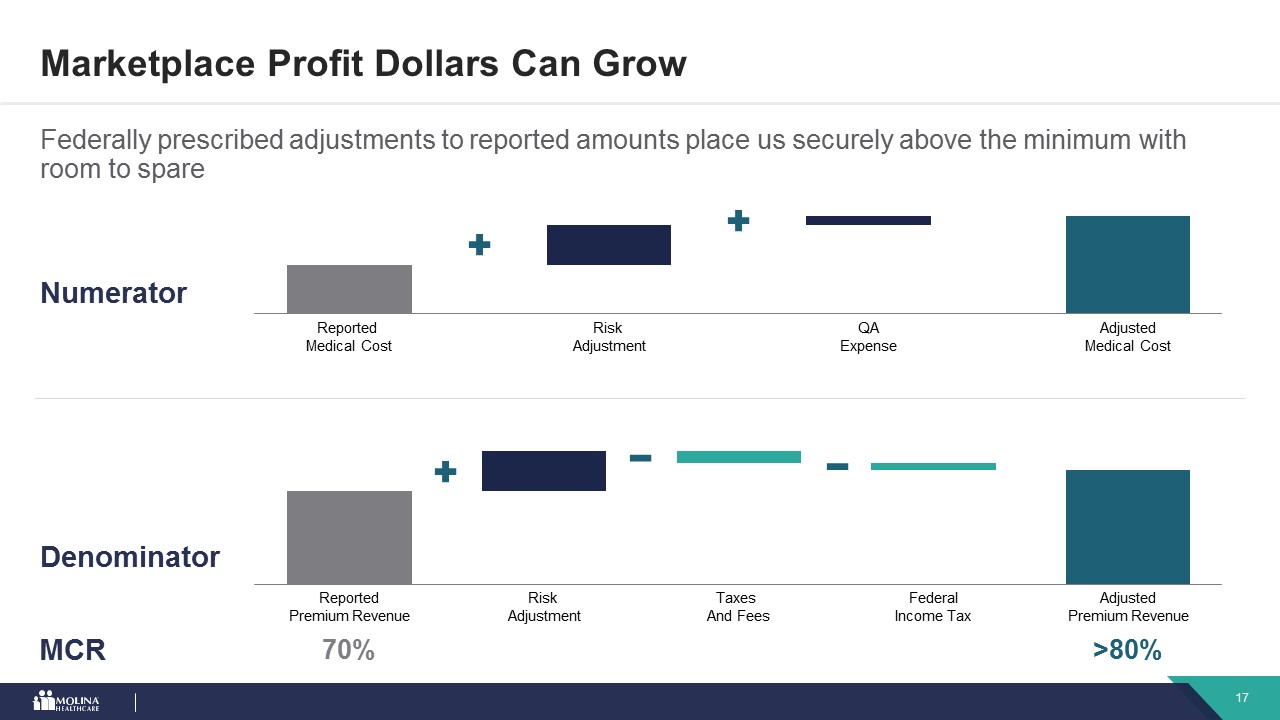
Marketplace Profit Dollars Can Grow Federally prescribed adjustments to reported amounts place us securely above the minimum with room to spare Numerator Reported Medical Cost Risk Adjustment QAExpense AdjustedMedical Cost Denominator ReportedPremium Revenue Taxes And Fees FederalIncome Tax AdjustedPremium Revenue Risk Adjustment 70% >80% MCR
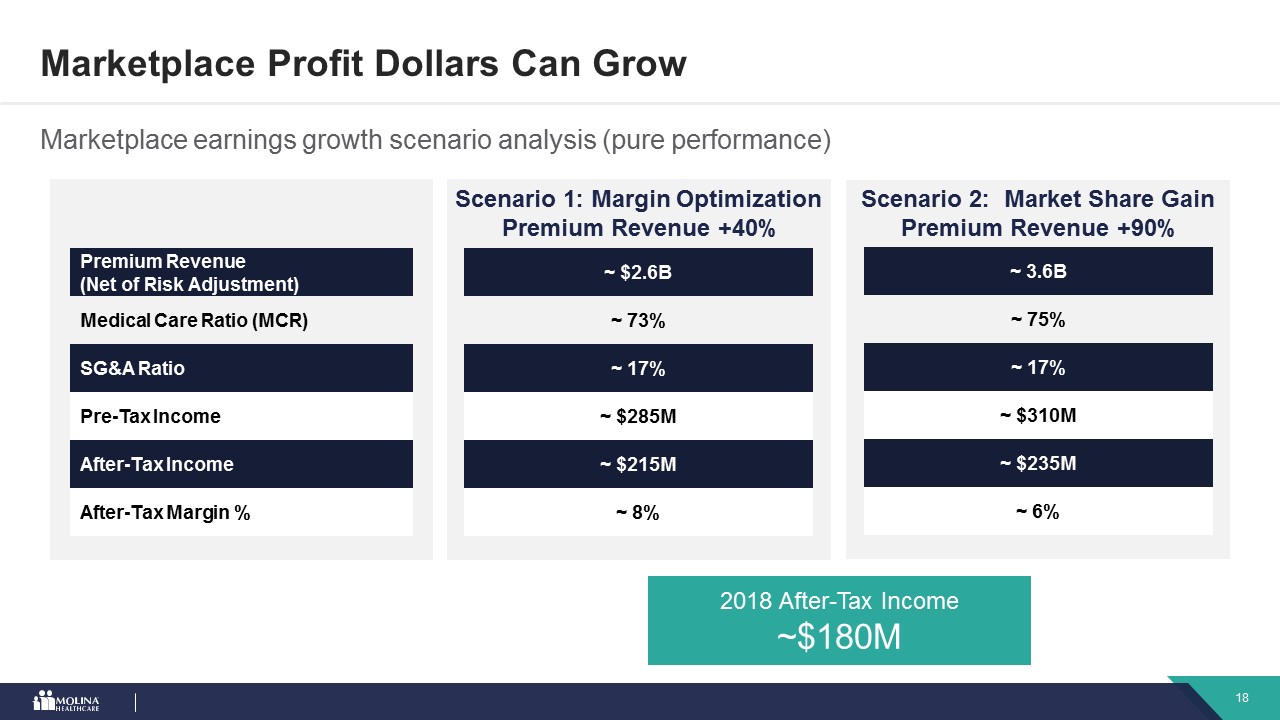
Marketplace Profit Dollars Can Grow Marketplace earnings growth scenario analysis (pure performance) Scenario 1: Margin OptimizationPremium Revenue +40% ~ $2.6B ~ 73% ~ 17% ~ $285M ~ $215M ~ 8% Scenario 2: Market Share Gain Premium Revenue +90% ~ 3.6B ~ 75% ~ 17% ~ $310M ~ $235M ~ 6% Premium Revenue(Net of Risk Adjustment) Medical Care Ratio (MCR) SG&A Ratio Pre-Tax Income After-Tax Income After-Tax Margin % 2018 After-Tax Income~$180M
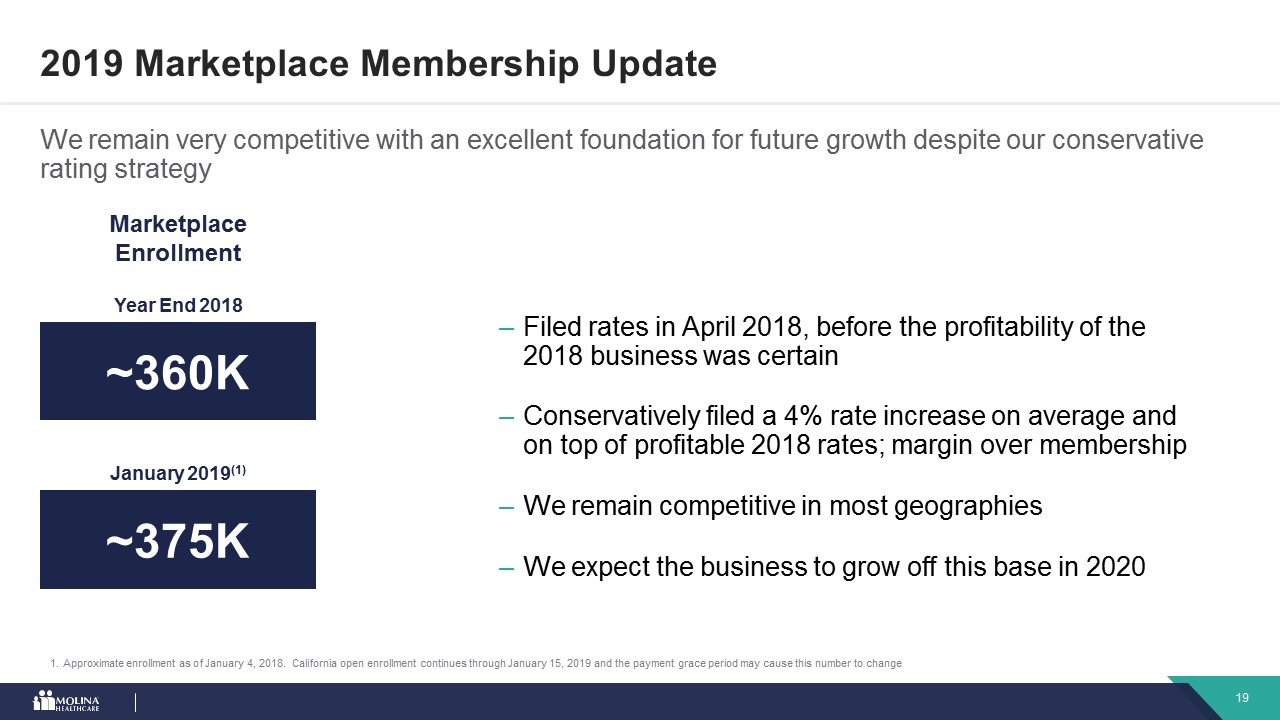
We remain very competitive with an excellent foundation for future growth despite our conservative rating strategy 2019 Marketplace Membership Update Marketplace Enrollment ~360K ~375K Filed rates in April 2018, before the profitability of the 2018 business was certainConservatively filed a 4% rate increase on average and on top of profitable 2018 rates; margin over membershipWe remain competitive in most geographiesWe expect the business to grow off this base in 2020 January 2019(1) Year End 2018 Approximate enrollment as of January 4, 2018. California open enrollment continues through January 15, 2019 and the payment grace period may cause this number to change

Molina Can GrowRevenues
Reality Misperception 4: Once Molina’s margins are restored and sustained, the company will be challenged to grow revenues The existing business portfolio is ripe with near term revenue opportunities ready to harvest The longer term growth engine is currently being built The new management team has bid successfully in the last three procurements Molina Can Grow Revenues The growth potential in our product segments is significant and we have the ability to maintain and expand market share
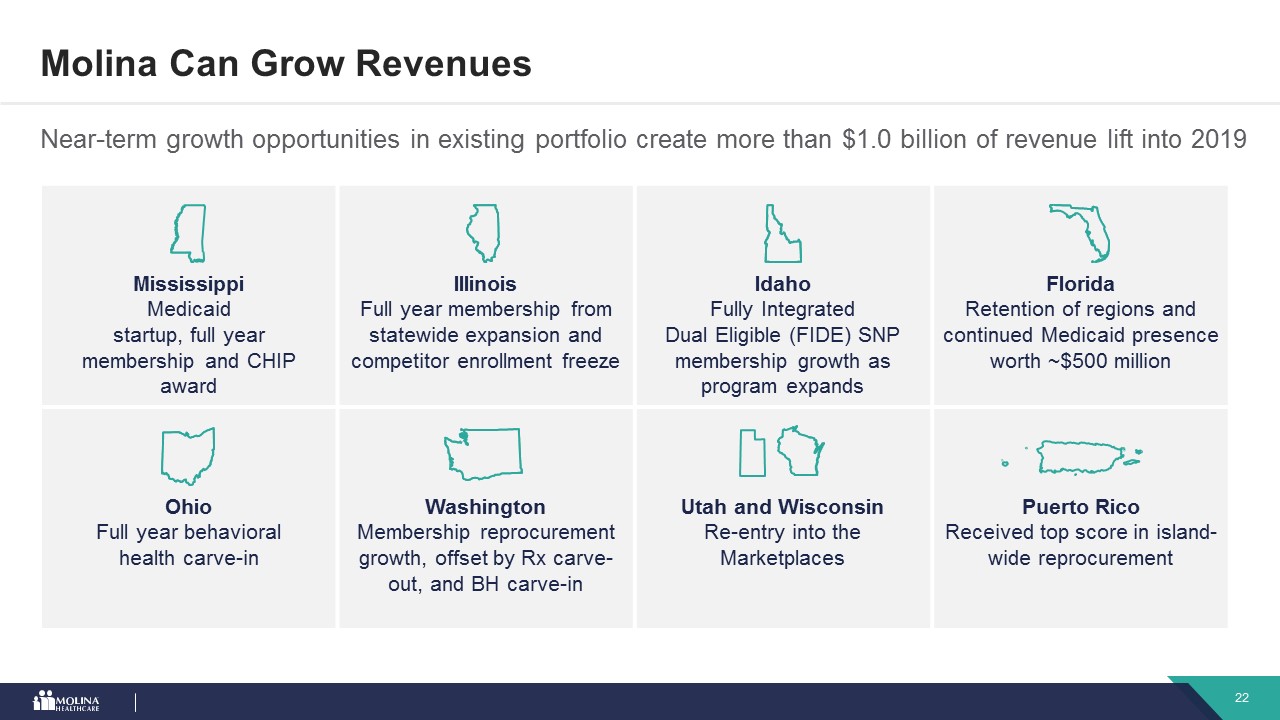
Molina Can Grow Revenues Near-term growth opportunities in existing portfolio create more than $1.0 billion of revenue lift into 2019 Mississippi Medicaidstartup, full yearmembership and CHIP award IllinoisFull year membership fromstatewide expansion and competitor enrollment freeze IdahoFully IntegratedDual Eligible (FIDE) SNP membership growth as program expands FloridaRetention of regions and continued Medicaid presence worth ~$500 million OhioFull year behavioralhealth carve-in WashingtonMembership reprocurement growth, offset by Rx carve-out, and BH carve-in Utah and WisconsinRe-entry into theMarketplaces Puerto RicoReceived top score in island-wide reprocurement
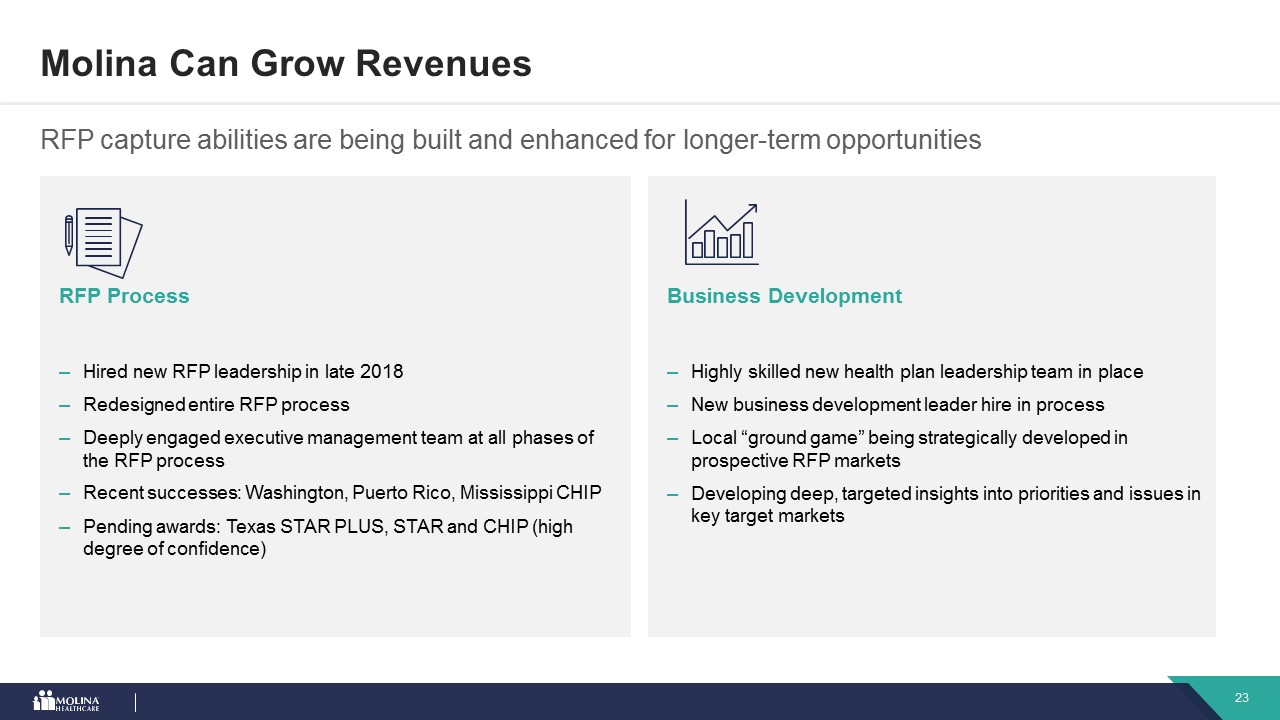
RFP Process Hired new RFP leadership in late 2018Redesigned entire RFP process Deeply engaged executive management team at all phases of the RFP processRecent successes: Washington, Puerto Rico, Mississippi CHIPPending awards: Texas STAR PLUS, STAR and CHIP (high degree of confidence) Business DevelopmentHighly skilled new health plan leadership team in placeNew business development leader hire in processLocal “ground game” being strategically developed in prospective RFP marketsDeveloping deep, targeted insights into priorities and issues in key target markets Molina Can Grow Revenues RFP capture abilities are being built and enhanced for longer-term opportunities
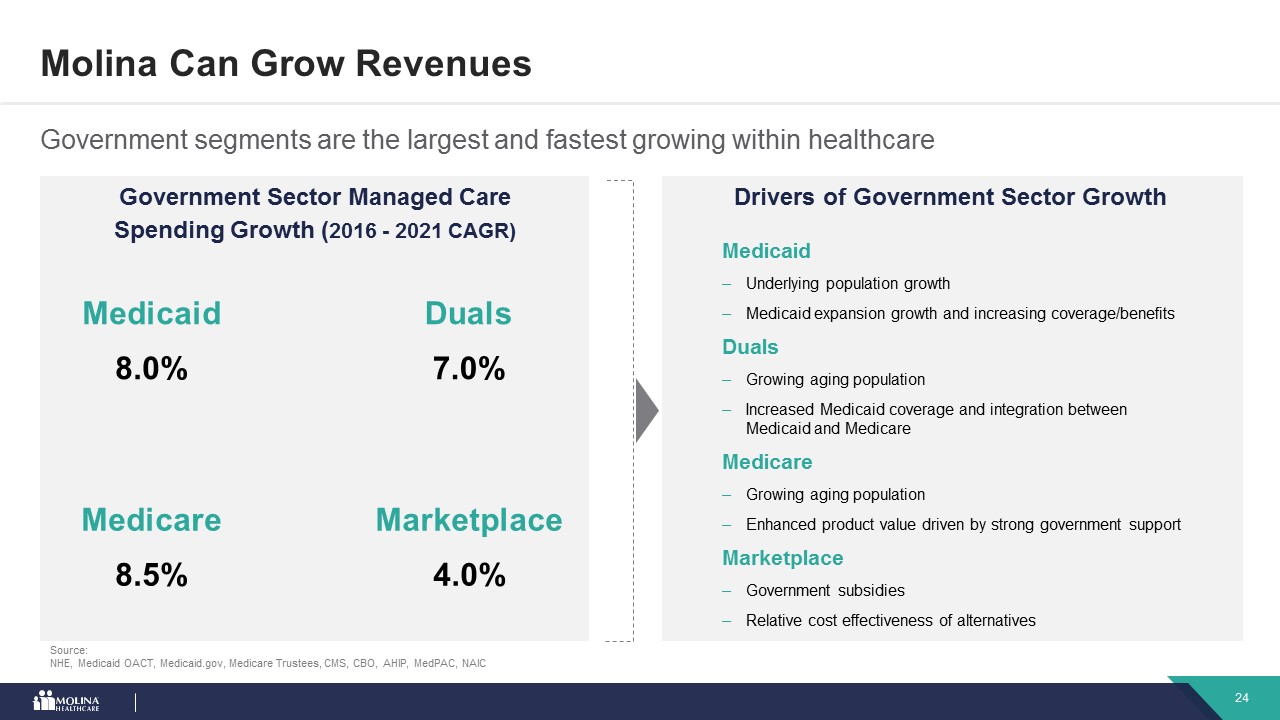
Drivers of Government Sector Growth Molina Can Grow Revenues Government segments are the largest and fastest growing within healthcare MedicaidUnderlying population growthMedicaid expansion growth and increasing coverage/benefitsDualsGrowing aging populationIncreased Medicaid coverage and integration between Medicaid and MedicareMedicareGrowing aging populationEnhanced product value driven by strong government supportMarketplaceGovernment subsidiesRelative cost effectiveness of alternatives Government Sector Managed CareSpending Growth (2016 - 2021 CAGR) Source: NHE, Medicaid OACT, Medicaid.gov, Medicare Trustees, CMS, CBO, AHIP, MedPAC, NAIC Medicaid8.0% Duals7.0% Medicare8.5% Marketplace4.0%
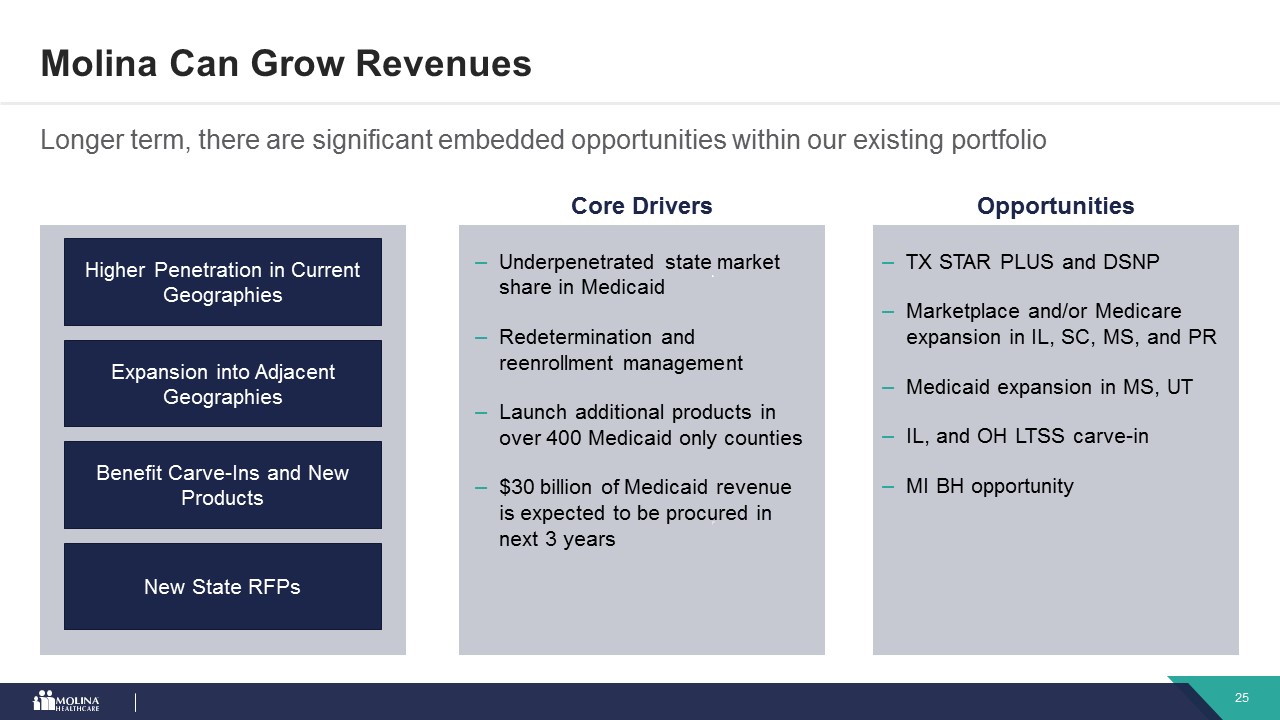
Longer term, there are significant embedded opportunities within our existing portfolio Molina Can Grow Revenues Core Drivers TX STAR PLUS and DSNPMarketplace and/or Medicare expansion in IL, SC, MS, and PRMedicaid expansion in MS, UTIL, and OH LTSS carve-inMI BH opportunity Higher Penetration in Current Geographies Expansion into Adjacent Geographies Benefit Carve-Ins and New Products New State RFPs Opportunities Underpenetrated state market share in MedicaidRedetermination and reenrollment managementLaunch additional products in over 400 Medicaid only counties$30 billion of Medicaid revenue is expected to be procured in next 3 years
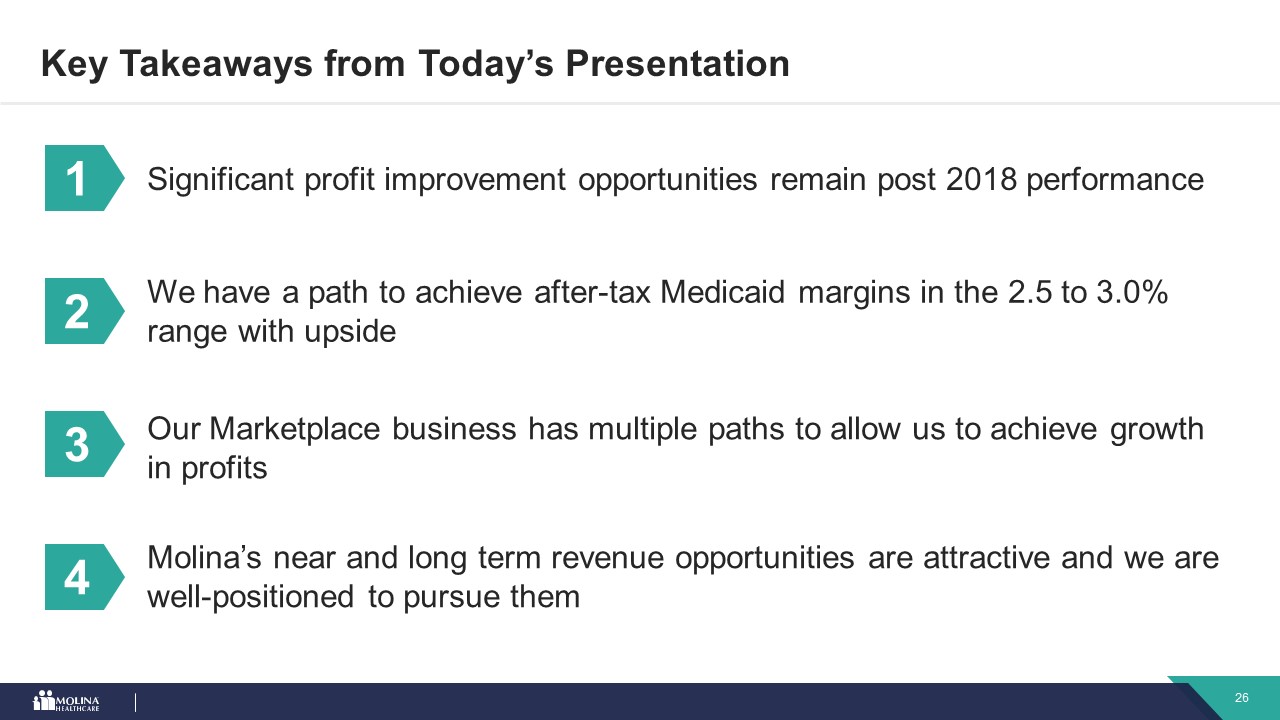
Key Takeaways from Today’s Presentation 3 Our Marketplace business has multiple paths to allow us to achieve growth in profits 4 Molina’s near and long term revenue opportunities are attractive and we are well-positioned to pursue them 1 Significant profit improvement opportunities remain post 2018 performance 2 We have a path to achieve after-tax Medicaid margins in the 2.5 to 3.0% range with upside

Thank you

Appendix
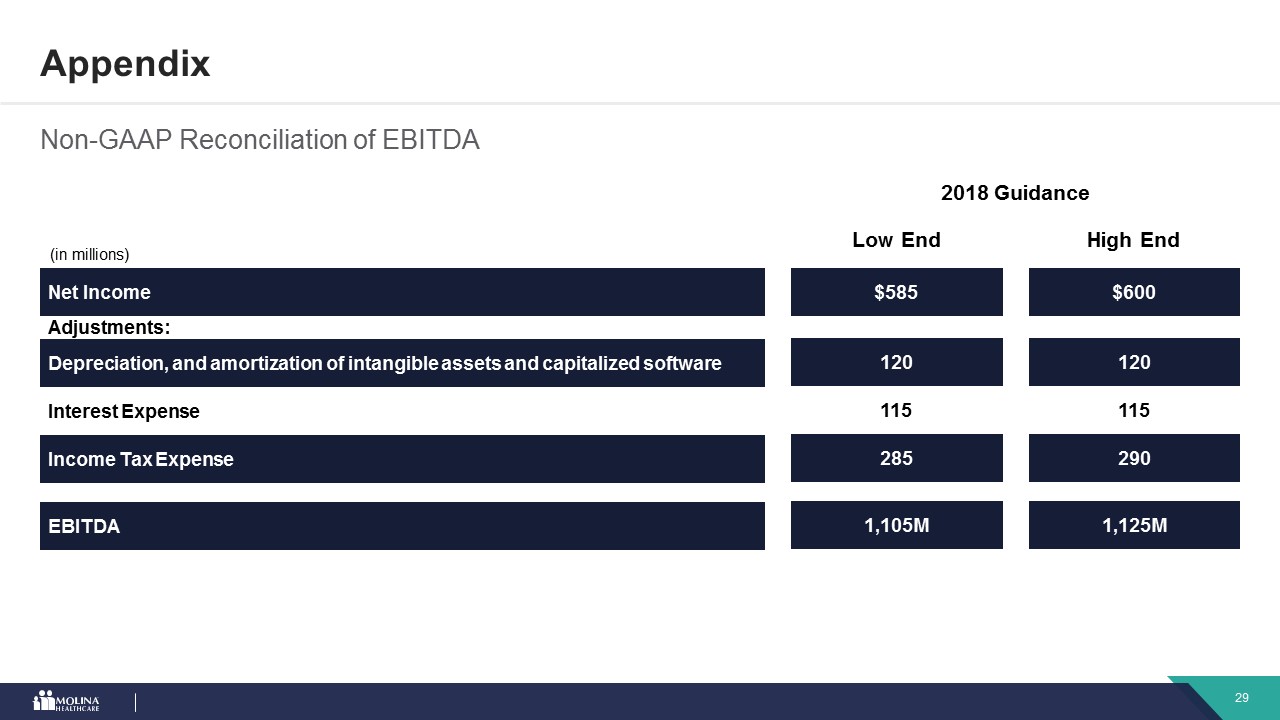
Non-GAAP Reconciliation of EBITDA Appendix $585 120 115 285 1,105M Net Income Adjustments: Depreciation, and amortization of intangible assets and capitalized software Interest Expense Income Tax Expense EBITDA $600 120 115 290 1,125M (in millions) Low End High End 2018 Guidance