Cautionary Statement Safe Harbor Statement under the Private Securities Litigation Reform Act of 1995: This slide presentation and our accompanying oral remarks contain forward-looking statements regarding, without limitation, our business, operations, turnaround, plans, guidance, projections and longer-term outlook within the meaning of Section 27A of the Securities Act of 1933, or Securities Act, and Section 21E of the Securities Exchange Act of 1934, or Securities Exchange Act. We intend such forward-looking statements to be covered by the safe harbor provisions for forward-looking statements contained in the Private Securities Litigation Reform Act of 1995, and we are including this statement for purposes of complying with such safe harbor provisions. All statements, other than statements of historical facts, included in this presentation may be deemed to be forward-looking statements for purposes of the Securities Act and the Securities Exchange Act. Without limiting the foregoing, we use the word “anticipate(s),”, “believe(s),” “estimate(s),” “guidance,” intend(s),” “may,” “outlook,” “plan(s),” “project(s)” or “projection(s),” “will,” “would,” “could,” “should,” and similar expressions to identify forward-looking statements, although not all forward-looking statements contain these identifying words. We cannot guarantee that we will actually achieve the plans, intentions, outlook, or expectations disclosed in our forward-looking statements and, accordingly, you should not place undue reliance on our forward-looking statements. Forward-looking statements are based on current expectations and projections about future events, and are subject to certain risks, assumptions and uncertainties that could cause actual events and results to differ materially from those discussed herein, including the risk factors and cautionary statements found under Item 1A in our Form 10-K annual report, as well as the risk factors and cautionary statements in our quarterly reports and in our other reports and filings with the Securities and Exchange Commission and available for viewing on its website as sec.gov. Except to the extent otherwise required by federal or state securities laws, we caution you that we do not undertake any obligation to update forward-looking statements made by us. 2
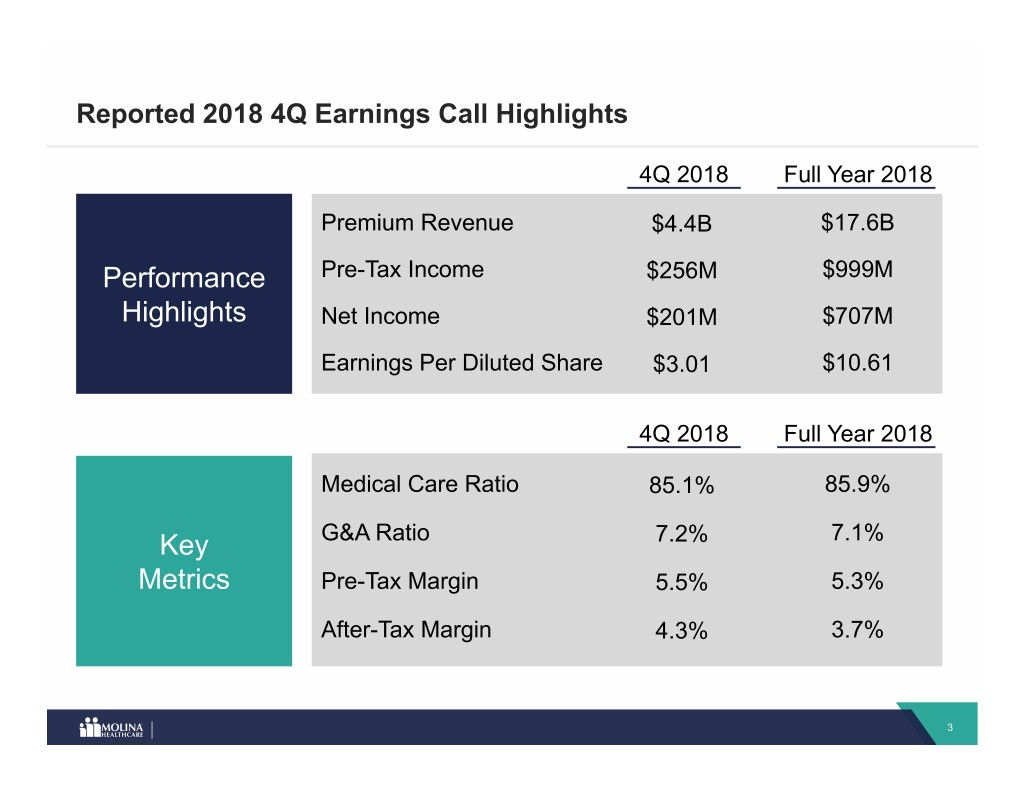
Reported 2018 4Q Earnings Call Highlights 4Q 2018 Full Year 2018 Premium Revenue $4.4B $17.6B Performance Pre-Tax Income $256M $999M Highlights Net Income $201M $707M Earnings Per Diluted Share $3.01 $10.61 4Q 2018 Full Year 2018 Medical Care Ratio 85.1% 85.9% Key G&A Ratio 7.2% 7.1% Metrics Pre-Tax Margin 5.5% 5.3% After-Tax Margin 4.3% 3.7% 3
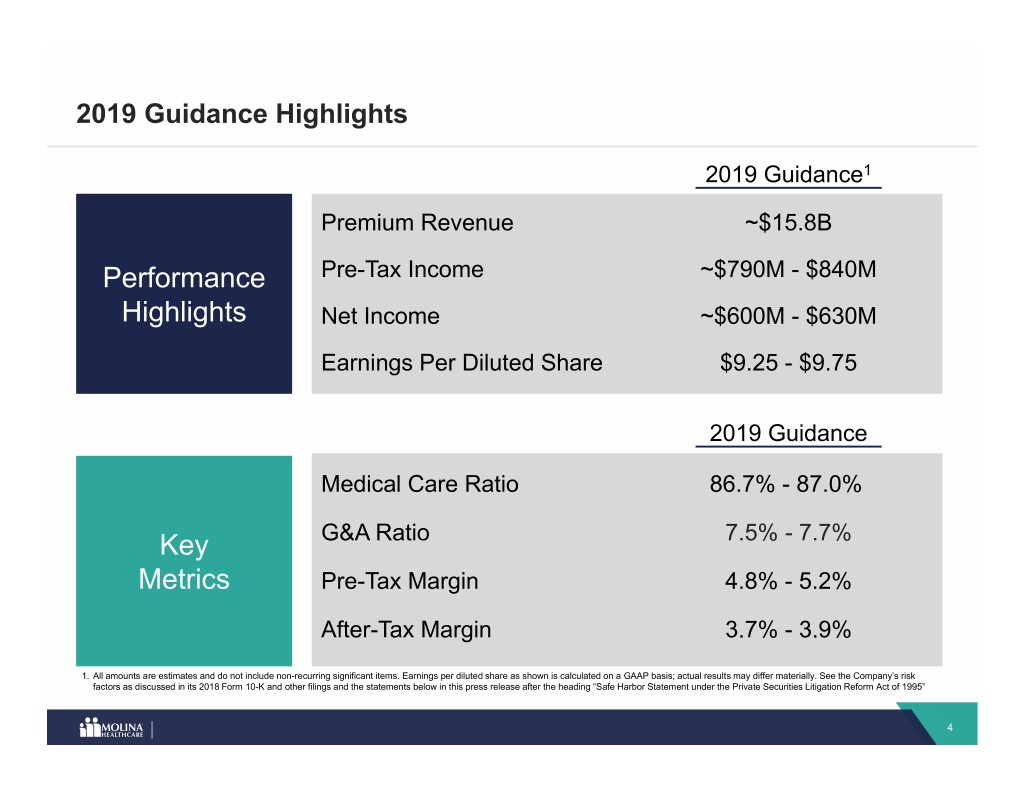
2019 Guidance Highlights 2019 Guidance1 Premium Revenue ~$15.8B Performance Pre-Tax Income ~$790M - $840M Highlights Net Income ~$600M - $630M Earnings Per Diluted Share $9.25 - $9.75 2019 Guidance Medical Care Ratio 86.7% - 87.0% Key G&A Ratio 7.5% - 7.7% Metrics Pre-Tax Margin 4.8% - 5.2% After-Tax Margin 3.7% - 3.9% 1. All amounts are estimates and do not include non-recurring significant items. Earnings per diluted share as shown is calculated on a GAAP basis; actual results may differ materially. See the Company’s risk factors as discussed in its 2018 Form 10-K and other filings and the statements below in this press release after the heading “Safe Harbor Statement under the Private Securities Litigation Reform Act of 1995” 4
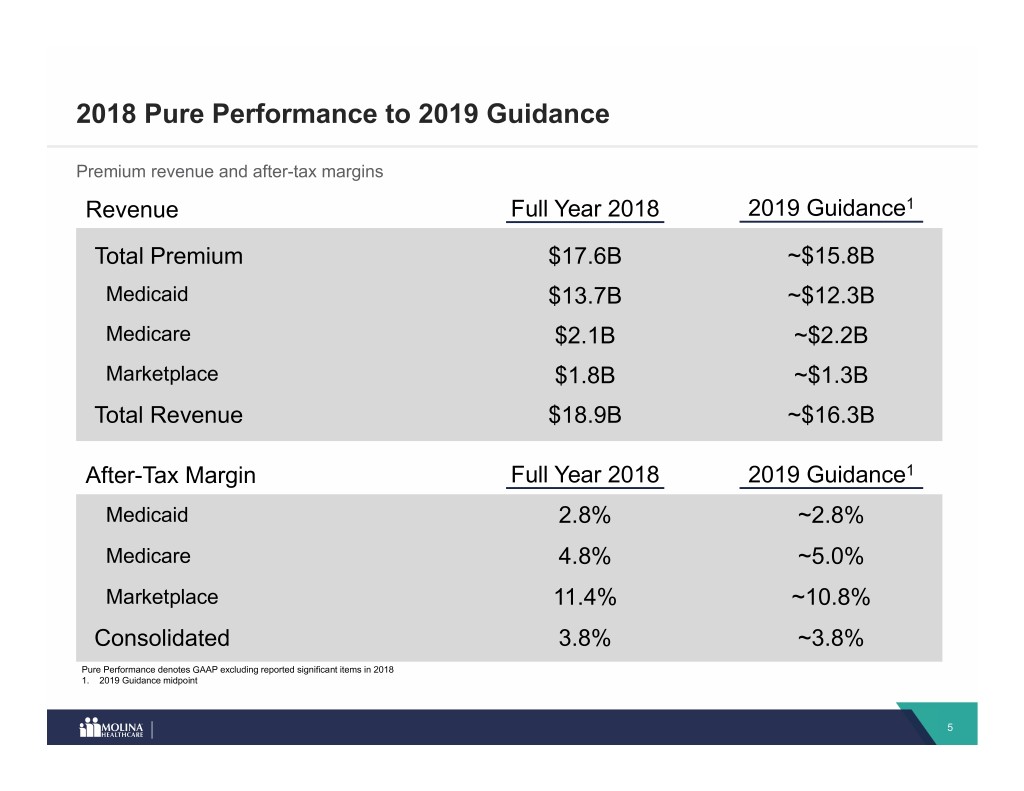
2018 Pure Performance to 2019 Guidance Premium revenue and after-tax margins Revenue Full Year 2018 2019 Guidance1 Total Premium $17.6B ~$15.8B Medicaid $13.7B ~$12.3B Medicare $2.1B ~$2.2B Marketplace $1.8B ~$1.3B Total Revenue $18.9B ~$16.3B After-Tax Margin Full Year 2018 2019 Guidance1 Medicaid 2.8% ~2.8% Medicare 4.8% ~5.0% Marketplace 11.4% ~10.8% Consolidated 3.8% ~3.8% Pure Performance denotes GAAP excluding reported significant items in 2018 1. 2019 Guidance midpoint 5

2019 Guidance Assumptions 1 Excludes restructuring or one-time significant items 2 Assumes no prior period development A portion of the $550 million of remaining profit improvement 3 opportunity is manifested in 2019 earnings Earnings per diluted share exclude any adjustments related to 4 the amortization of intangible assets 6

2019 Guidance Bridge: Revenue $ in Billions $18.9 ($2.2) $0.9 ($0.4) ($0.4) ($0.5) $16.3 2018 Pure FL/NM Marketplace Organic HIF Divested 2019 Guidance Performance excl. HIF Growth Service Revenue and Other1 1. Divested Service Revenue and Other primarily relate to Molina Medicaid Solutions and Pathways 7


