 2007 Investor Day January 18, 2007 New York, NY Molina Healthcare, Inc. Exhibit 99.2 |
 2 Cautionary Statement “Safe Harbor” Statement under the Private Securities Litigation Reform Act of 1995: This presentation contains "forward-looking statements". All of the Company's forward-looking statements are subject to numerous known and unknown risks, uncertainties, and other factors that could cause our actual results to differ materially. Anyone viewing or listening to this presentation is expected to have read Molina’s Form 10-K for the year ended December 31, 2005, and its Forms 10-Q for the quarters ended March 31, 2006, June 30, 2006, and September 30, 2006. All forward- looking statements should be considered in connection with the risk factors and cautionary statements contained in our reports and filings with the Securities and Exchange Commission. Unless otherwise indicated, all forward-looking statements represent our judgment as of January 18, 2007, and we disclaim any obligation to update such statements. Important Note: Unless otherwise indicated, statements regarding the Company’s results as of December 31, 2006 are annualized based on the Company’s results as of September 30, 2006, and do not represent actual fourth-quarter or 2006 year-end results. |
 Molina Healthcare, Inc. 2007 Investor Day January 18, 2007 New York, NY J. Mario Molina, MD President & Chief Executive Officer Molina Healthcare, Inc. |
 4 Competitive Advantage Operational Efficiency Membership Growth Medical Management |
 5 About Us Our goal is to be the industry leader with a reputation for excellence and sustainable financial performance. Revenues $2.0 Billion* Over one million members 1,950 employees NCQA Accredited 1 Billion in Market Cap 28 million shares outstanding Founded over 25 years ago *Annualized figure based on September 30, 2006 results. ~ ~ ~ ~ |
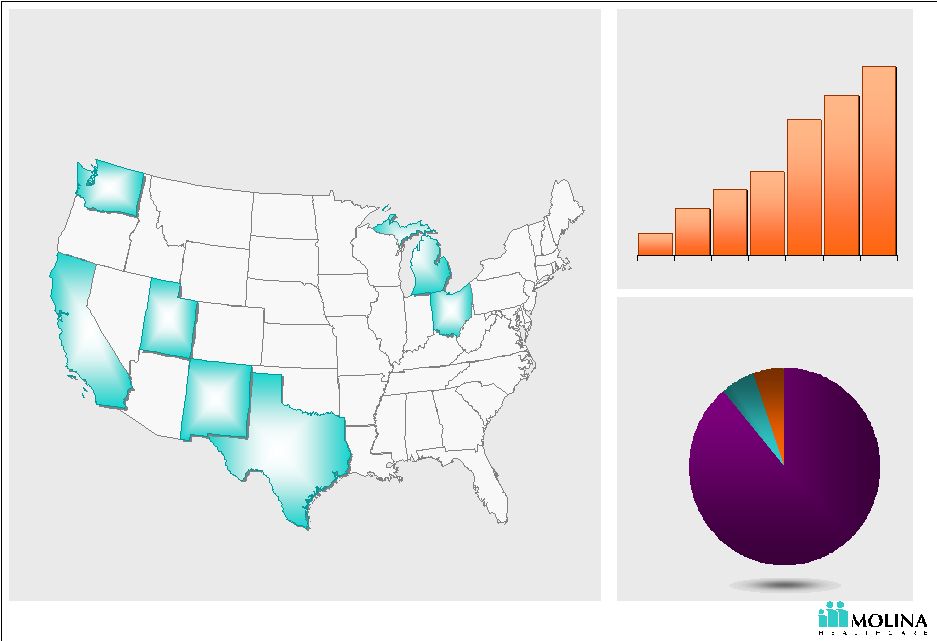 6 Business Snapshot 405 489 788 893 564 1,020 298 '00 '01 '02 '03 '04 '05 '06 Washington 281,000 California 300,000 New Mexico 64,000 Utah 52,000 Michigan 228,000 Ohio 76,000 Texas 19,000 Membership growth Markets and members served TANF 89% ABD 5% SCHIP 6% MASNP <1% Our members 1 1. Estimated membership December 31, 2006. Excludes discontinued operation in Indiana. 1 |
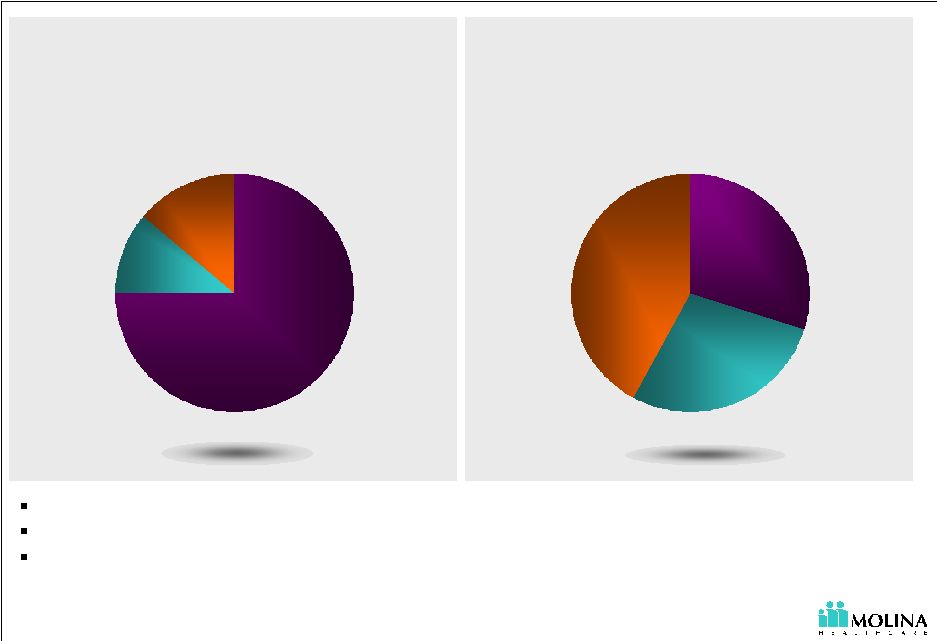 7 Sizeable Market with Continued Opportunities for Growth TANF 75% Aged 11% Disabled 14% Medicaid Eligibles: 45.6 M 1. Urban Institute estimates based on data from MSIS, Kaiser Commission on Medicaid and the Uninsured 2005, CMS, & Company Estimates Managed care is an alternative to state’s rising Medicaid costs Migration of new populations to managed care Growing diversity and complexity of social and healthcare needs Medicaid Expenditures: $300B 1 TANF 30% Aged 28% Disabled 42% 1 ~ ~ ~ ~ |
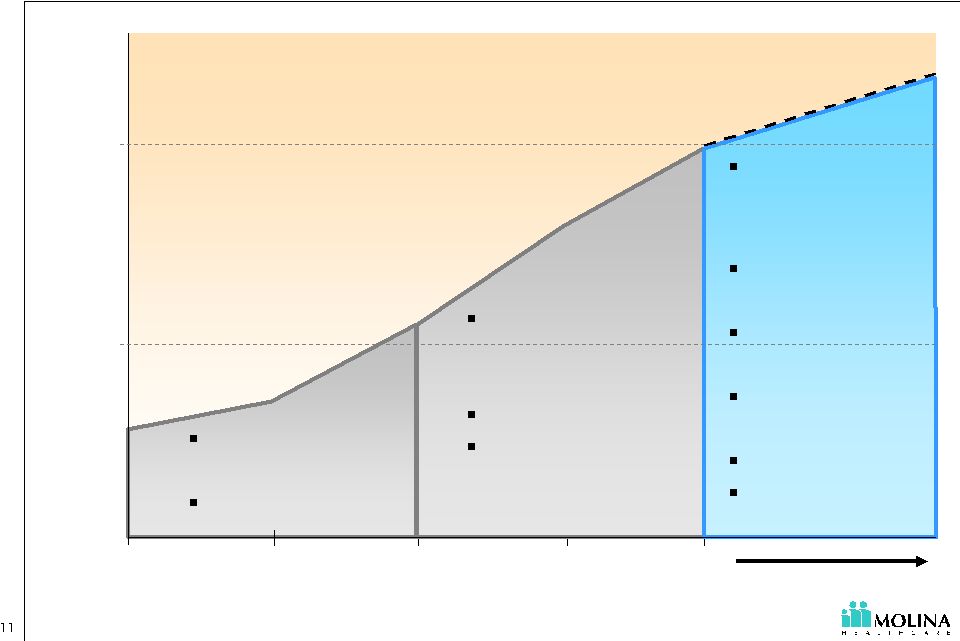
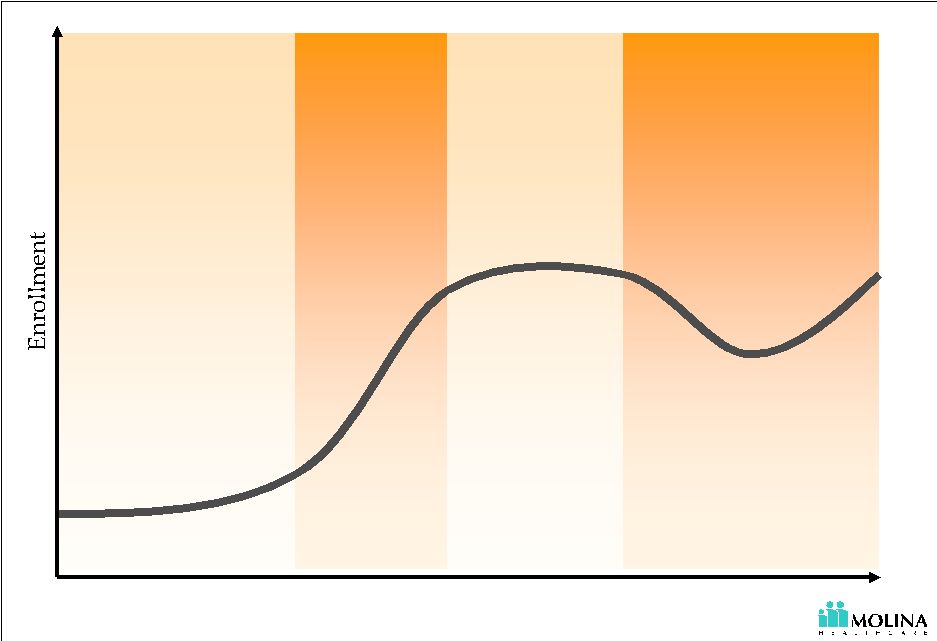 8 Membership Growth: Managed Care Expansions Time Choice Default Steady State Re-Certifications Expansion Stages |
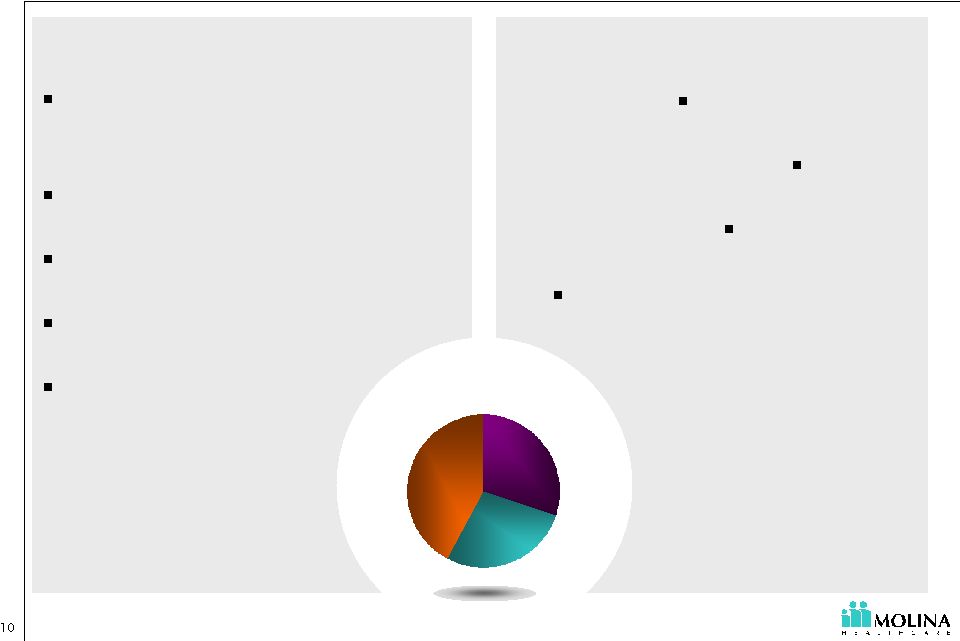
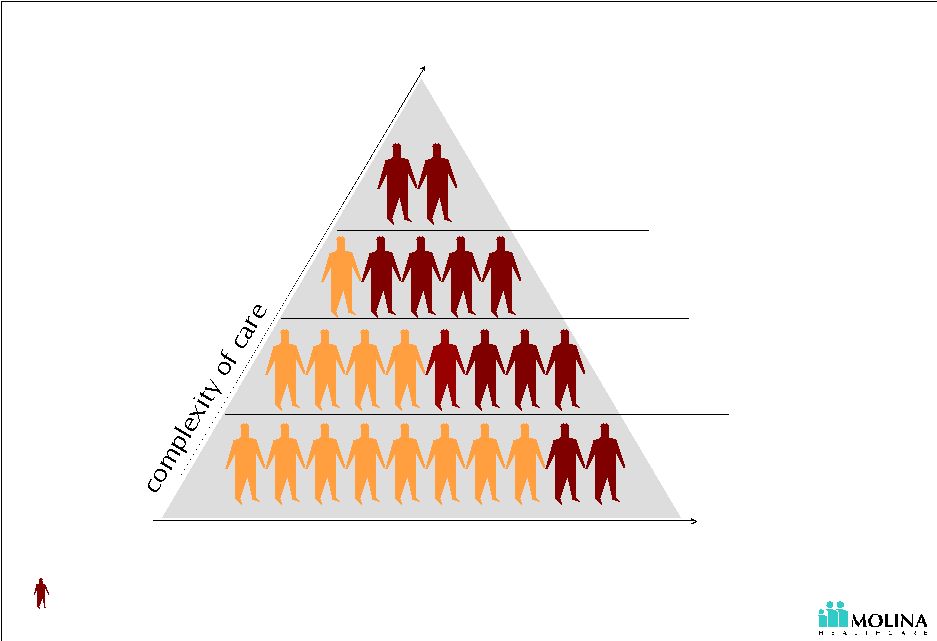 9 Membership Growth: Segmentation LTC Duals ABD TANF = patients in need of more complex care; for illustrative purposes only not an actual percentage number of potential enrollees |
 25+ years of Medicaid experience & provider roots NCQA accredited in 5 states Management team Administrative efficiency Cultural & linguistic services Sizeable market with continued opportunities for growth Medicaid Expenditures: $300B Competencies Other Opportunities Staff model offices Medicare Long term care Molina Healthcare Insurance TANF 30% Aged 28% Disabled 42% ~ ~ |
 Growth & Focus 2003 2004 2005 2006 $2.0 FY 2002 Revenues (billions) maintain prior years initiatives + case & disease mgmt administrative leverage margin expansion differentiation diversification medical mgmt - UM - unit costs Start-ups new populations - ABD, Duals TANF platform consolidation acquisitions $1.0 |
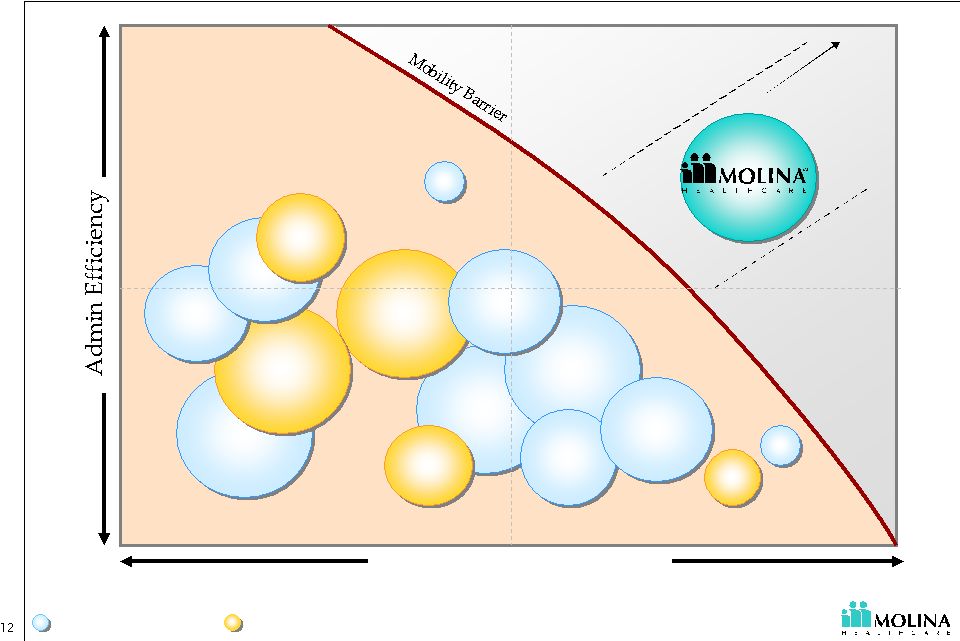 Strategic Positioning Investment in Quality Standard Superior Low High Commercial HMOs Medicaid HMOs © 2007 Molina Healthcare, Inc. |
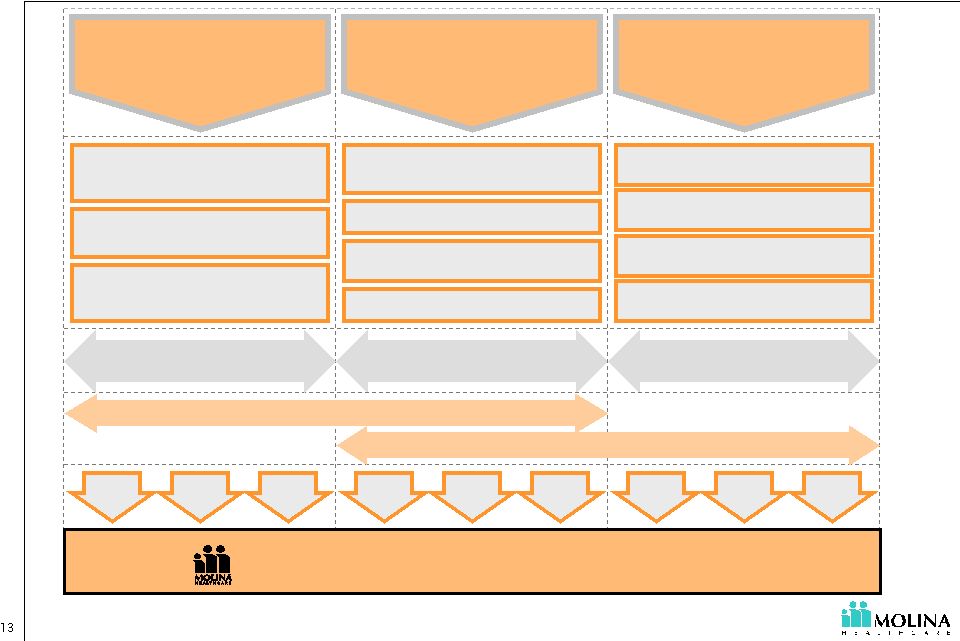 Business Strategy Network & Contract Mgmt. Case & Health Mgmt. Utilization Mgmt. Claims Payout Mgmt. Standardized Policies & Procedures Leveraging Technology Management Depth New Populations Acquisitions Organic Growth Appropriate Quality Care Cost Advantage Long-Term Profitable Growth 1 Membership Growth 2 3 Operational Efficiency Medical Management © 2007 Molina Healthcare, Inc. Top Line Growth Scale Economies Stakeholders Corporate Culture |
 Recognized for Quality, Innovation, and Success All of Molina’s eligible health plans named among the nation’s Top 50 Medicaid health plans by US News & World Report Recognized for innovation in multi- cultural healthcare by The Robert Wood Johnson Foundation, NCQA and CHCS A Fortune 1000 Company Ranked among Forbes 400 Best Big Company’s in America |
 Molina Healthcare, Inc. 2007 Investor Day January 18, 2007 New York, NY Terry P. Bayer Chief Operating Officer Molina Healthcare, Inc. Health Plan Executive Panel |
 Health Plan Executive Panel Stephen T. O’Dell President Molina Healthcare of California Ann O. Wehr President Molina Healthcare of New Mexico Jesse L. Thomas President Molina Healthcare of Ohio |
 Molina Healthcare, Inc. 2007 Investor Day January 18, 2007 New York, NY Stephen T. O’Dell President Molina Healthcare of California California Update |
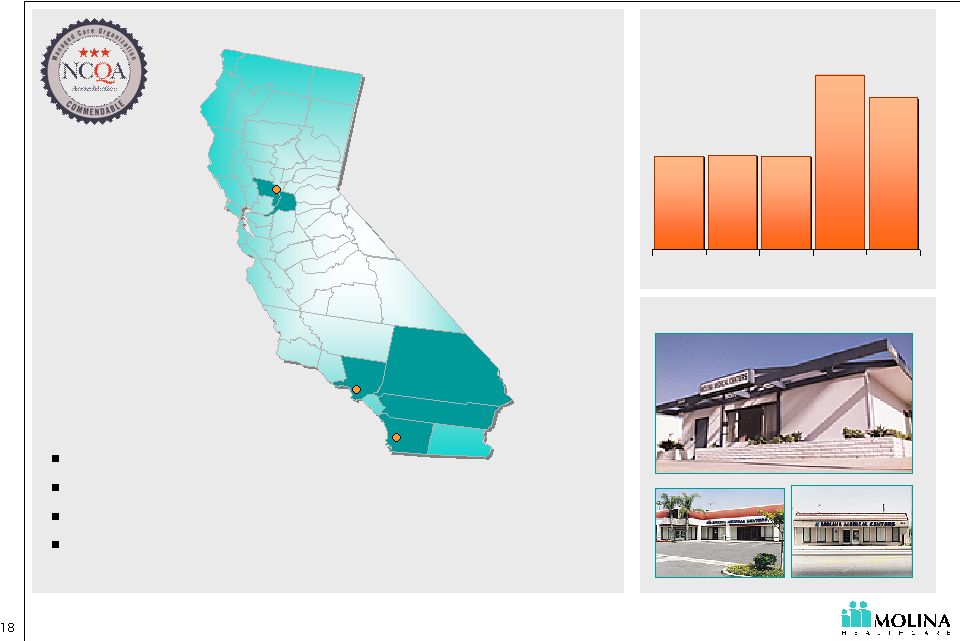 About Molina Healthcare of California 254,000 253,000 302,000 321,000 253,000 '02 '03 '04 '05 '06 Membership history 1 1. Estimated membership December 31, 2006 First company health plan Serves 6 counties Multiple government contracts Acquired Medicaid business from Sharp and Universal Care in San Diego County in 2005 Staff model presence Sacramento Sacramento San Diego San Diego Los Angeles Los Angeles |
 California Topics Short Term Profitability Priorities 2007 Initiatives Prospects for Coverage Expansion in California |
 California Priorities Decrease Medical Care Costs with focus on San Diego Increase Revenue by negotiating rate increases Membership Stabilization |
 Case Study: Reducing Costs in San Diego Savings Contract Termination $0.8M Medical Management $0.3M Contract Re-Negotiation $1.7M $2.8M Annually $2.8M Annually ~ ~ |
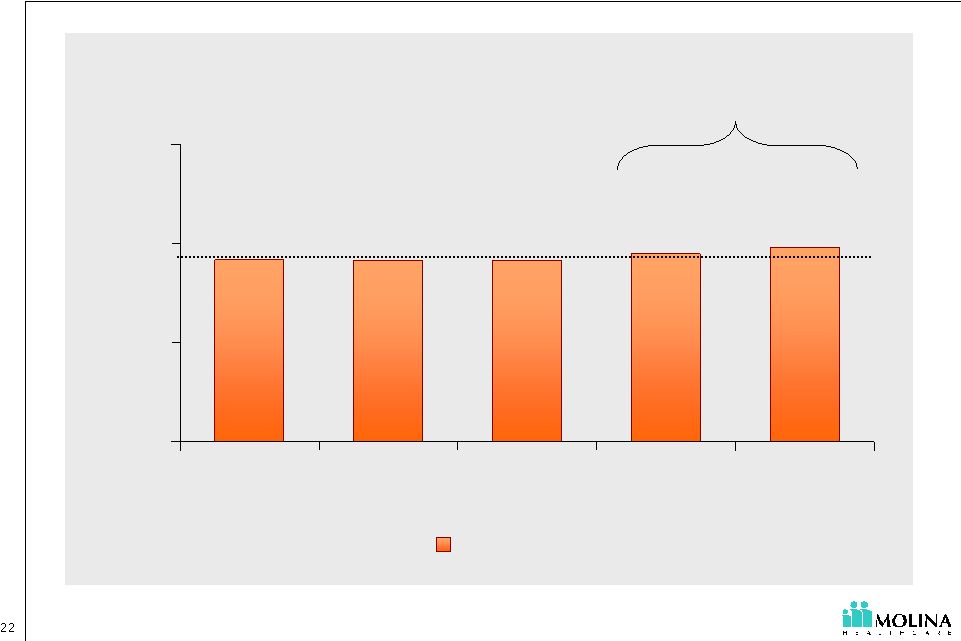 Medi-Cal Revenue PMPM $98.07 $94.68 $91.21 $91.23 $91.95 $0 $50 $100 $150 2002 2003 2004 2005 YTD 3Q06 Revenue PMPM Quality Improvement Fee (QIF) Effective July 2005 1 1. Excludes Diego operations acquired June 2005; From Molina Healthcare of California PMPM |
 2007 Initiatives Profitable growth in membership SCHIP Staff Model Offices Medicare Provider network strategic partnerships Achieve operational competence leading to excellence Establish position as best plan in the counties we serve |
 Prospects for Coverage Expansion Governor Schwarzenegger’s coverage expansion proposal Increasing Medi-Cal rates significantly Requiring individual coverage Guaranteeing coverage Encouraging personal responsibility for health and wellness Providing low-income individuals affordable coverage Improving insurer and hospital efficiency Enhancing tax breaks for purchasing coverage Contributing to the cost of coverage |
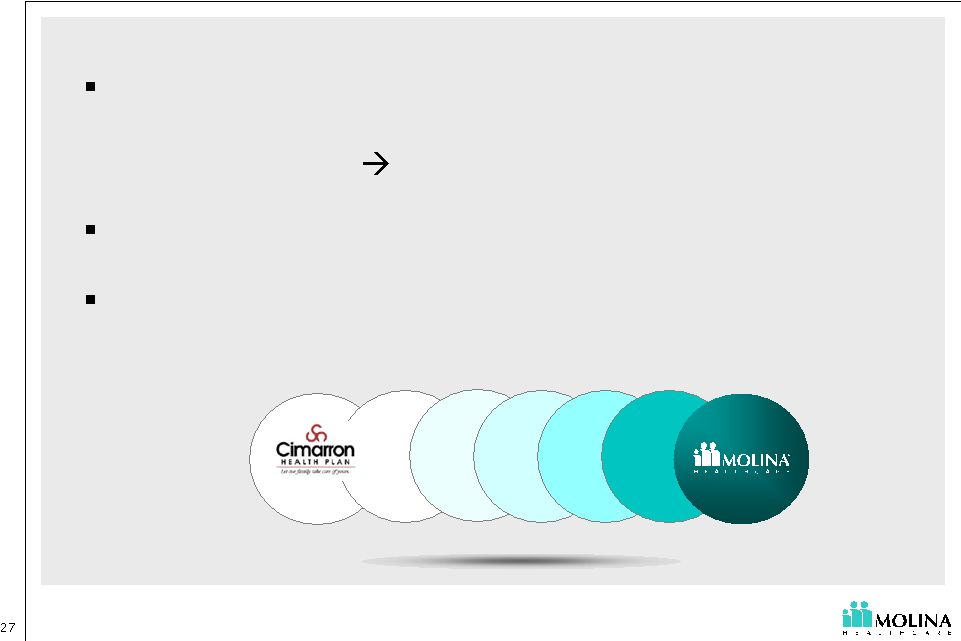
 Molina Healthcare, Inc. 2007 Investor Day January 18, 2007 New York, NY Ann O. Wehr, MD President Molina Healthcare of New Mexico New Mexico: Acquisition & Integration |
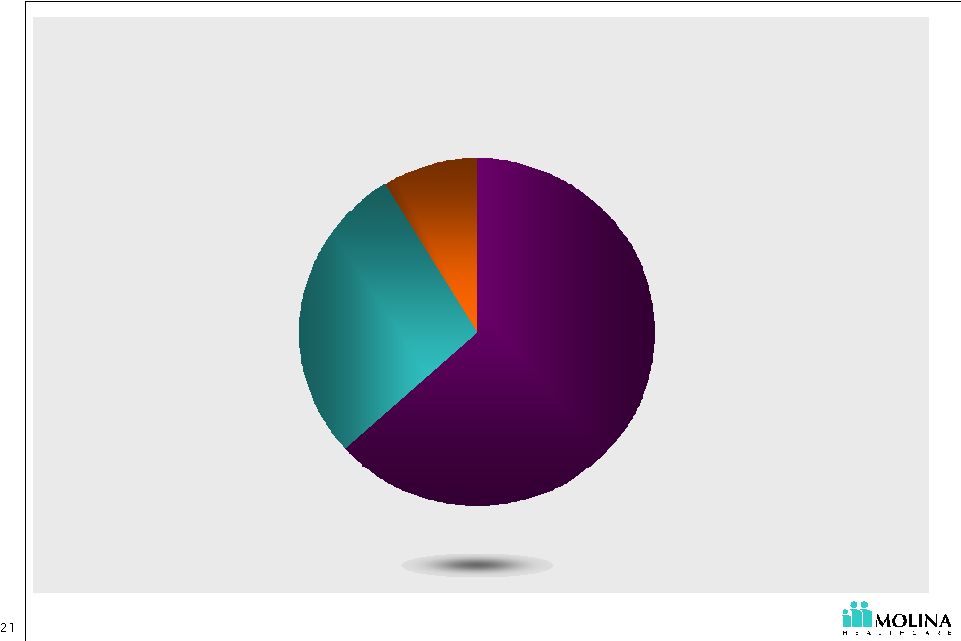
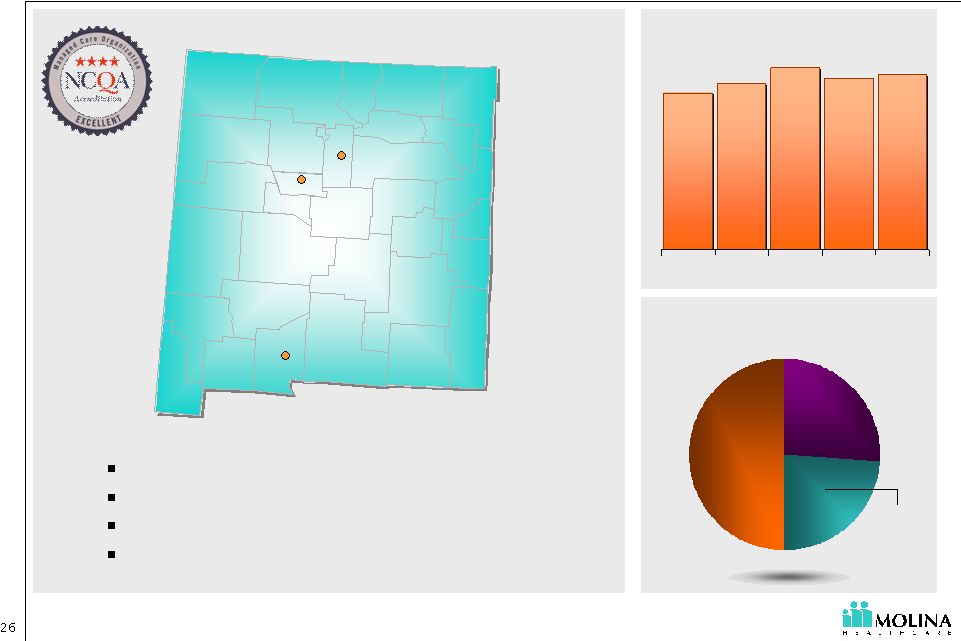 About Molina Healthcare of New Mexico 62,249 65,381 64,000 63,262 60,401 '02 '03 '04 '05 '06 Membership history Presbyterian 50% Lovelace 26% Molina 24% Market Share 1 1. Estimated membership as of December 31, 2006 Santa Fe Santa Fe Albuquerque Albuquerque Las Cruces Las Cruces Health plan acquired by Molina in 2004 3:1 Federal to State match Statewide service area including ABD 11% of membership are ABD members |
 Refocusing on Medicaid Change of contract structure Commercial Medicaid Network Alignment Administrative Resource Realignment |
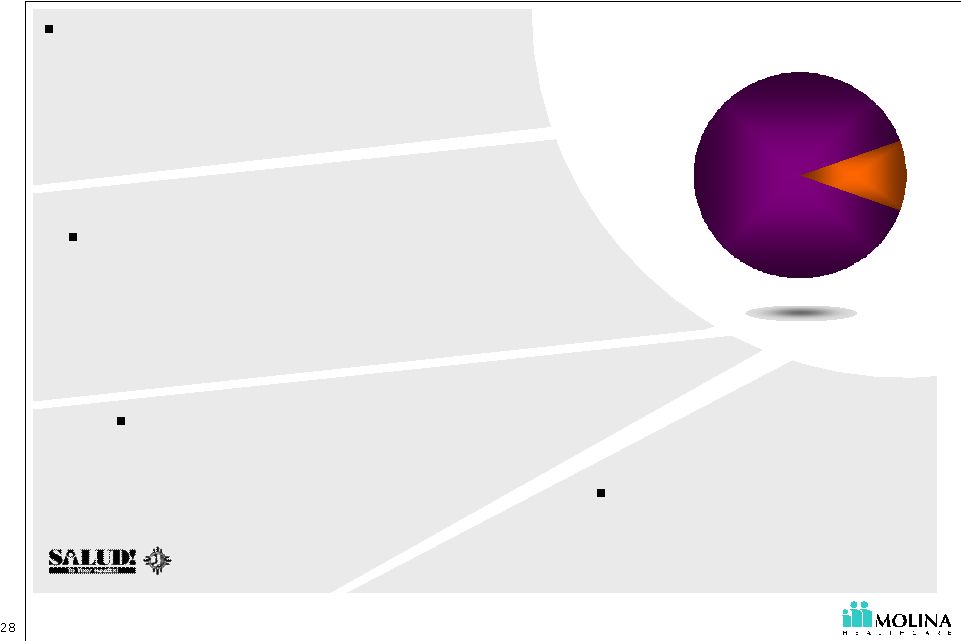 Serving Elderly & Disabled Medicaid Members \ TANF 89% ABD 11% ABD 11% Caring for the ABD population since inception of Medicaid Managed Care (Salud!) in NM in July 1, 1997 LTC, Native American, and Duals are only populations excluded from NM managed care. Care of these members is integrated into that of entire membership All Diagnosis included in managed care (except behavioral health carve out effective July 1, 2005) Molina Healthcare of New Mexico Membership Profile |
 Appropriate Management of Medicaid ABD Population Utilization Management Utilization Management Medical Case Management Medical Case Management Care Coordination Care Coordination Disease Management Disease Management Provider Contracting Provider Contracting Staff Selection Staff Selection 1. Identification of High Risk Members 2. Managing their conditions TANF EPISODIC CARE TANF Common Conditions* Pregnancy Perinatal complications Respiratory Illness Injury & poisoning ABD CHRONIC CARE ABD Common Conditions * Circulatory System Diseases Respiratory System Diseases Digestive System Diseases Neoplasm Injury & poisoning * Based on New Mexico FFS Claims for 12 months ended 9/2006 |
 How you do identify High Risk Members? Identify members through a variety of methodologies: Prior authorization request, concurrent review, specific drug utilization, etc Claims reports Risk Stratification Software Referrals from employees, providers, and vendors Enrollment surveys Welcome calls |
 Management of TANF vs. ABD Specialty Contracting Behavioral Health Contracting LTC Co-ordinations Hospital Contracting Home Health I.V. Therapy Durable Medical Equipment (DME) PCP contracting, Pediatric contracting Episodic, Acute Hospital Admission Pregnancy related conditions and providers (OB-GYNs) Provider Contracting Cardiac Diabetes Pregnancy, Motherhood Matters Asthma, Breathe with Ease Disease Management Aggressive Concurrent Review Level of Care Management Behavioral Health Conditions Episodic, Acute, Pregnancy- related conditions Utilization Management Chronic Complex Conditions Behavioral Health Coordination Pharmacy Emergency Room Episodic, Acute, Pregnancy- related condition Care Coordination ABD TANF Medical Management Levers |
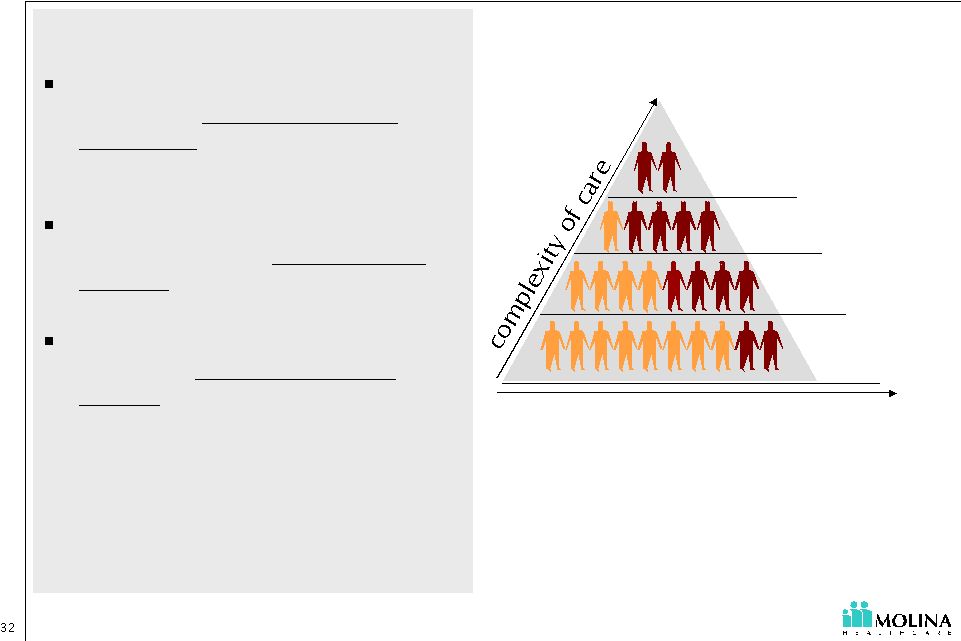 Summary Caring for the ABD population requires a broader range of staff skills than the traditional Medicaid population Programmatic differences will have an impact: Benefits vary by state Successful coordination of care results in positive financial impact for the company and more efficient use of healthcare resources LTC Duals ABD TANF Number of potential enrollees |
 Molina Healthcare, Inc. 2007 Investor Day January 18, 2007 New York, NY Jesse L. Thomas President Molina Healthcare of Ohio Story of a Start-up |
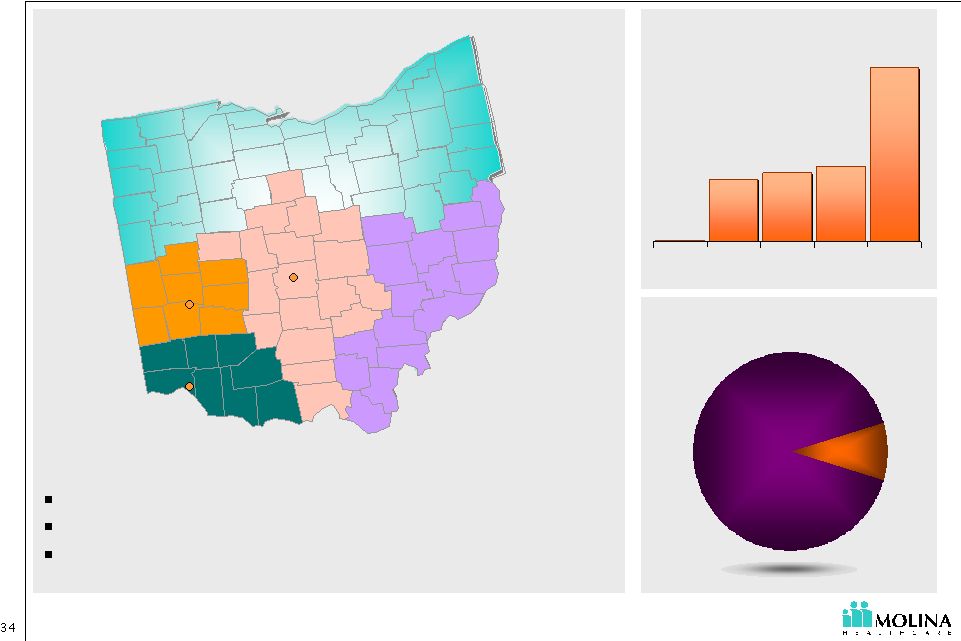 About Molina Healthcare of Ohio 27,000 30,000 76,000 33,000 250 4Q05 1Q06 2Q06 3Q06 4Q06 Membership history 1 1. Estimated membership as of December 31, 2006 Began discussions with the State in 2004 Selected to serve 4 regions for TANF & ABD population Began operations in December 2005 \ TANF 90% ABD 10% ABD 10% Eligibles in four (awarded) regions: 682K Cincinnati Cincinnati Columbus Columbus Dayton Dayton ~ ~ |
 Expansion Timeline 2004 2005 2006 2007 Initial county-specific Covered Families and Children (CFC) Request for application (RFA) submitted March Entered ODJFS Readiness Review Phase June Opened permanent office November Provider Agreement effective for Montgomery and Clark counties December Provider Agreement effective for Franklin County February Submitted application for Regional CFC RFA August Provider Agreement effective for West Central and Southwest CFC regions Submitted response to Regional Aged, Blind, and Disabled (ABD) RFA September Provider Agreement effective for Southeast region October Received Approval for ABD regional expansion December Provider Agreement effective for Central CFC region January Provider Agreement effective for Southwest ABD region |
 Vulnerable Without Care Management Growing case loads Uncontrolled spending Geographically dispersed population Poor access to care Pent up demand for services Over utilization of Emergency Room (ER) |
 Improved Health and Quality of Life with Care Management Quality of care Improved access to care Cost savings Case management Disease management Pharmacy management Medical home Quality of care Transition of care Understanding my condition Psycho-social Fostering patient family/provider relationships |
 Lessons Learned from a Start-Up Transition Contracting challenges Expansion time frame Lack of claims experience |
 Lessons Learned Molina Transition to Molina from former company Culture Difficult to enter market; membership now supports re-contracting Membership permitted re-contracting effort Provider Contracting 100% Medicaid focus Exit of commercial business Product Focus Transition from development to operations Transition from multiple products to Medicaid only Management Ohio Start-Up NM Acquisition Lessons Learned |
 Executive Panel 1 Q&A |
 Break Next: Guest Speaker |
 Molina Healthcare, Inc. 2007 Investor Day January 18, 2007 New York, NY Terry P. Bayer Chief Operating Officer Molina Healthcare, Inc. Increasing Administrative Efficiency |
 “You can manage your medical costs, but you can control your administrative costs.” - C. David Molina, MD, MPH |
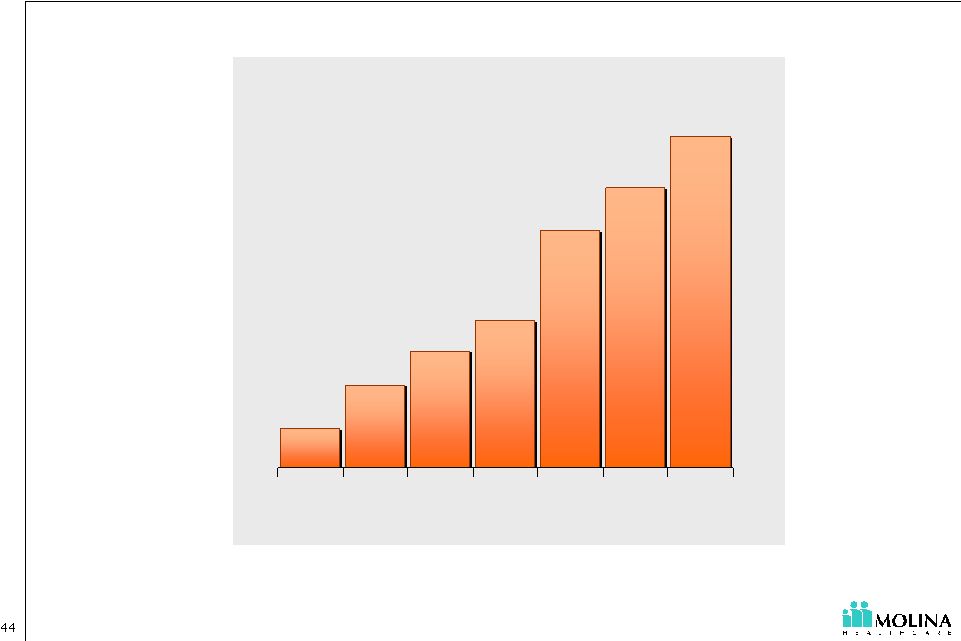 Membership & Infrastructure Growth 405 489 788 893 564 1,020 298 '00 '01 '02 '03 '04 '05 '06 Membership 1. Estimated membership December 31, 2006. Excludes discontinued Indiana operation. 1 |
 Provider Contracting Efficiency Why? Unit cost reduction Network expansion How? Contract templates Language library Contract management tracking software Contract modeling software Negotiation training |
 Reducing the “Hassle” Factor Why? Strengthening relationships with providers & members Reducing cost in provider offices and at Molina How? Electronic Access via ePortal Eligibility inquiry Claims submission and status inquiry Authorization submission and status inquiry Member ID cards |
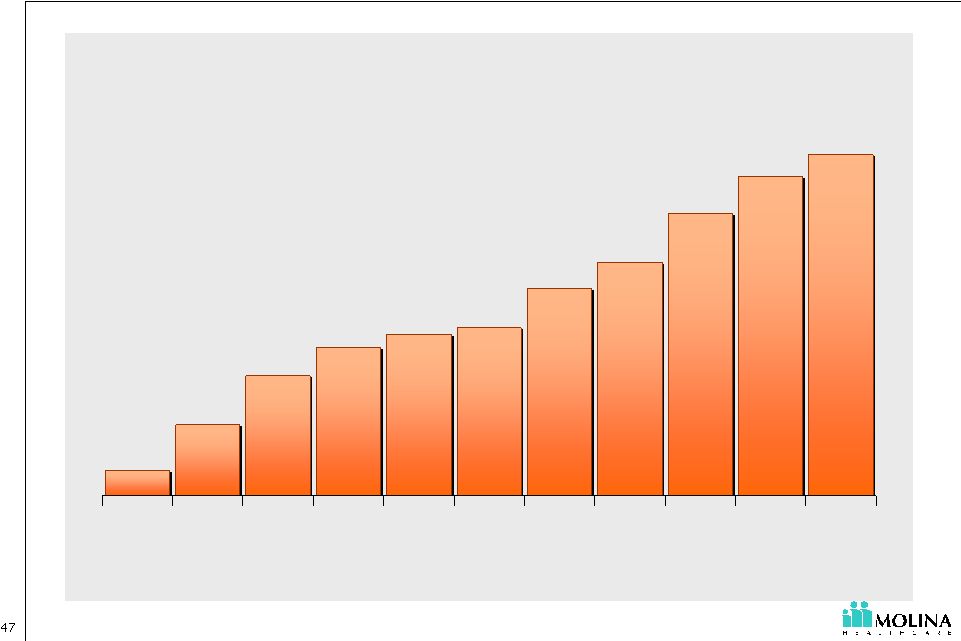 ePortal: Providers Total Provider Enrollment 1,736 2,951 3,965 4,146 5,745 6,952 7,850 8,394 3,657 1,020 619 Feb Mar Apr May Jun Jul Aug Sep Oct Nov Dec |
 Provider Payment Efficiency Why? Reduce labor cost & increase accuracy How? Reduce paper claims submission Increasing EDI Reducing vendor costs to scan paper Contract standardization System configuration Pre-adjudication logic Provider match Member match Auto-Adjudication of Claims |
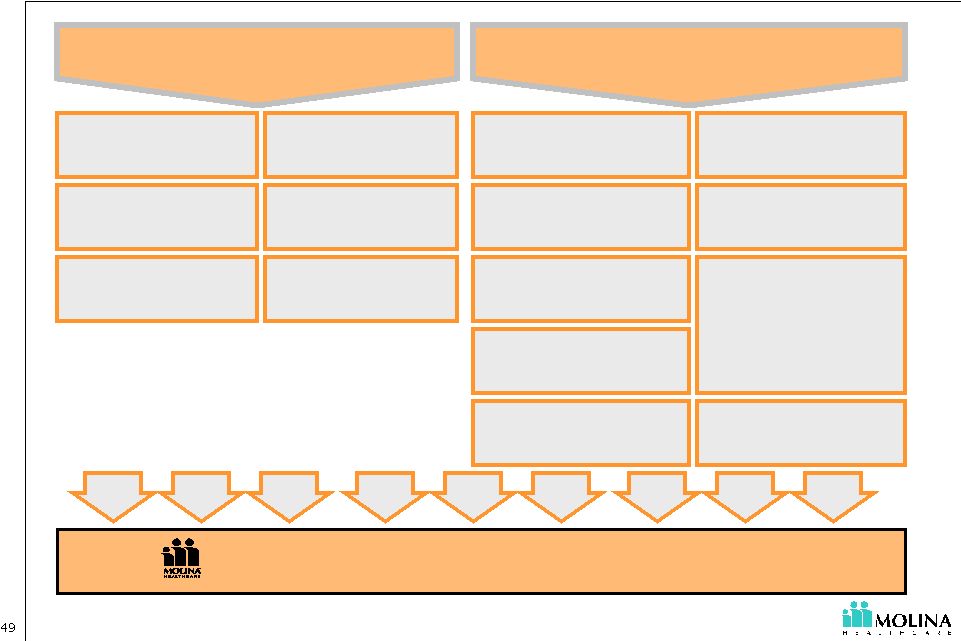 Operational Efficiency Administrative Expense Leverage © 2007 Molina Healthcare, Inc. Standard Policies & Procedures Core Systems Standardization Infrastructure Optimization Intelligent EDI Gateway Encounter Engine VoIP Expansion Customer Relations Management (CRM) Self Service Portal for Providers and Members Standardized contract templates Standardized configuration models Centralization of Key Functions Consistent Processing of input Automated claims workflow Contract modeling Contract library Document Composition Leveraging Technology |
 Molina Healthcare, Inc. 2007 Investor Day January 18, 2007 New York, NY Enabling Administrative Efficiency Amir Desai Vice President, Core Systems Molina Healthcare, Inc. |
 IT Focus Adopting Next Generation Technology Extending our Application Footprint Enhancing Organizational Efficiency Services oriented technology Virtualization Enterprise Capabilities - Workflow - Document composition - Customer Relationship Management - Encounters engine - Self-Service portal - Intelligent EDI Architectural governance Portfolio management ITIL® |
 Next Generation of Technology Services Oriented Architecture (SOA) - Creating abstracted logic that can be leveraged multiple times across the organization to speed development and reduce costs. - Ensuring scalability to keep up with growth. Virtualization - Deploying virtualization technology to decrease hardware costs. |
 Claims Medical Management Enterprise Utilities Document Generation Intelligent EDI Workflow Customer Relationship Management Encounter Engine Reusable technology assets to be leveraged across Molina health plans Reusable technology assets to be leveraged across Molina health plans Extending Our Application Footprint ePortal Risk-adjustment Analytics Community Outreach Medicare Sales New features to promote Self-Service Medical Management Claims Member Services Pre-Adjudication Logic Trading Partner Management |
 Enhancing IT Organization Efficiency Architectural Governance Portfolio Management Adoption of IT Infrastructure Library (ITIL®) |
 Molina Healthcare, Inc. 2007 Investor Day January 18, 2007 New York, NY Joseph W. White Chief Accounting Officer Molina Healthcare, Inc. Leveraging Administrative Efficiency |
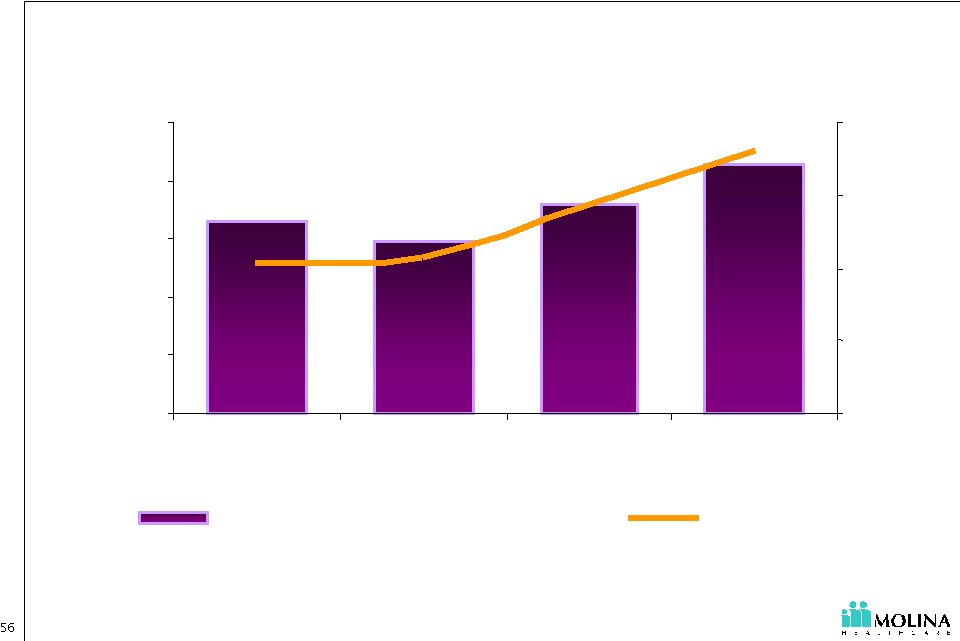 Continued Investment in our Infrastructure Growth related investments as well as strengthening our existing operational efficiency 1. Core Admin as a percentage of revenue is admin expenses excluding premium taxes as a percentage of total revenue 6.6% 5.9% 7.2% 8.6% 0.0% 2.0% 4.0% 6.0% 8.0% 10.0% 2003 2004 2005 3Q06YTD $0 $4 $8 $12 $16 Core Admin- %of Total Revenue Core Admin PM PM |
 Administrative Expense Leverage Long-Ter m Profitable Growth © 2007 Molina Healthcare, Inc. Lower Capex Lower depreciation Reduced software fees Reduced integration costs Reduced telecom costs Reduced EDI transaction costs Reduced staffing costs/more consistent processing Reduced IT staff intervention % costs Flexible deployment of staff Easier system contract configuration Reduced training costs More accurate & timely initial processing Reduced re-work costs Leveraging Technology Standardized Policies and Procedures Increased member & provider satisfaction |
 Executive Panel 2: Q&A |
 Break: Lunch Next: Financial Review |
 Molina Healthcare, Inc. 2007 Investor Day January 18, 2007 New York, NY John C. Molina Chief Financial Officer Molina Healthcare, Inc. Financial Review |
 Molina Healthcare, Inc. 2007 Investor Day January 18, 2007 New York, NY John C. Molina Chief Financial Officer Molina Healthcare, Inc. Outlook for 2007 |
 2 See cautionary language regarding the Company’s guidance and other forward-looking statements. Safe Harbor Statement under the Private Securities Litigation Reform Act of 1995: This presentation contains numerous "forward-looking statements" regarding the Company’s 2007 earnings guidance. Any statements that refer to guidance, projections, expectations, strategies, challenges, and opportunities, or their underlying assumptions, or other characterizations of future events or circumstances, are forward-looking statements. All of the Company's forward-looking statements are subject to numerous known and unknown risks, uncertainties, and other factors that could cause our actual results to differ materially. Such factors include, without limitation, risks related to: the achievement of a decrease in the medical care ratio of our start-up health plans in Ohio and Texas; the achievement of projected savings from a decrease in the medical care ratio of our California health plan; an increase in enrollment in our Ohio and Texas health plans and in our dually eligible population consistent with our expectations; the Company's ability to reduce administrative costs in the event enrollment or revenue is lower than expected; higher than expected costs associated with the addition of new member in Ohio or Texas or dually eligible members and risks related to the Company’s lack of experience with such members; the Company's ability to accurately estimate incurred but not reported medical costs; the securing of premium rate increases consistent with our expectations; costs associated with the non-renewal of the Medicaid contract of the Company's Indiana health plan; the successful renewal and continuation of the government contracts of the Company's health plans; the availability of adequate financing to fund and/or capitalize the Company's acquisitions and start-up activities; membership eligibility processes and methodologies; unexpected changes in member utilization patterns, healthcare practices, or healthcare technologies; changes in federal or state laws or regulations or in their interpretation; failure to maintain effective and efficient information systems and claims processing technology; and other risks and uncertainties as detailed in the Company's reports and filings with the Securities and Exchange Commission and available on its website at www.sec.gov. All forward- looking statements in this presentation represent the Company's judgment as of January 18, 2007. The Company disclaims any obligation to update any forward-looking statement to conform the statement to actual results or changes in the Company's expectations. |
 3 See cautionary language regarding the Company’s guidance and other forward-looking statements. $2.6B 86.2% 10.3% 7.0% $50.5M - $54.9M $1.75 - $1.90 28.9M 38.4% Revenue Medical Care Ratio G&A Ratio Core G&A Net Income Diluted EPS Diluted Shares Outstanding Effective Tax Rate 2007 Earnings Guidance $470K pre tax equals $0.01 diluted EPS ~ ~ ~ ~ ~ ~ ~ ~ ~ ~ ~ ~ ~ ~ ~ ~ |
 4 See cautionary language regarding the Company’s guidance and other forward-looking statements. What will change in 2007? •Higher invested balances off setting lower interest rates $25.0M Investment Income Interest Expense Core SG&A Medical Care Ratio Revenue •Borrowing to fund capital infusions into OH, IN, TX and CA $7.0M •Higher premium revenue •Core SG&A flat PMPM 7.0% •OH and TX expansions •Dual eligible expansion •Pent up demand in OH and TX •CA Improvement 86.2% •Full Year of CAPE •OH and TX expansions •Dual eligible expansion •Loss of IN contract $2.6B Drivers 2007 Guidance |
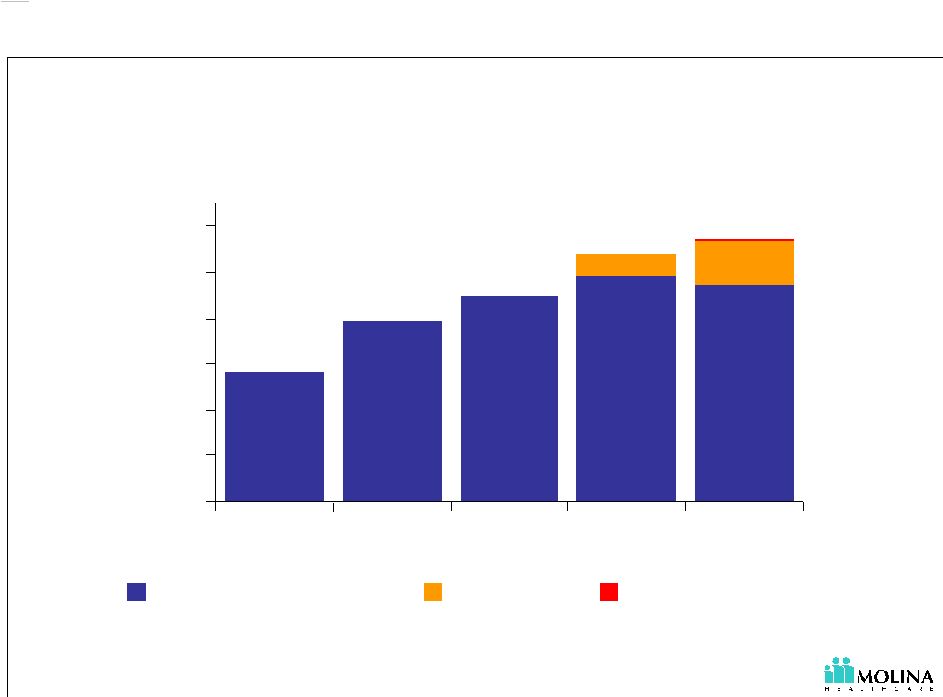 5 See cautionary language regarding the Company’s guidance and other forward-looking statements. How will we grow in 2007? Membership (in thousands) Membership growth will come from Ohio, Texas and Dual Eligibles 564K 1,145K 1,075K 788K 893K 1. “E” represents estimated 2. Legacy health plans include California, Indiana, Michigan, New Mexico, Utah and Washington. Indiana operations terminated 12/31/2006. 3. “Start-Ups” health plans include Ohio and Texas. 1 - 200 400 600 800 1,000 1,200 2003 2004 2005 2006 E 2007 E Legacy Health Plans Start-Ups Dual Eligibles 2 3 |
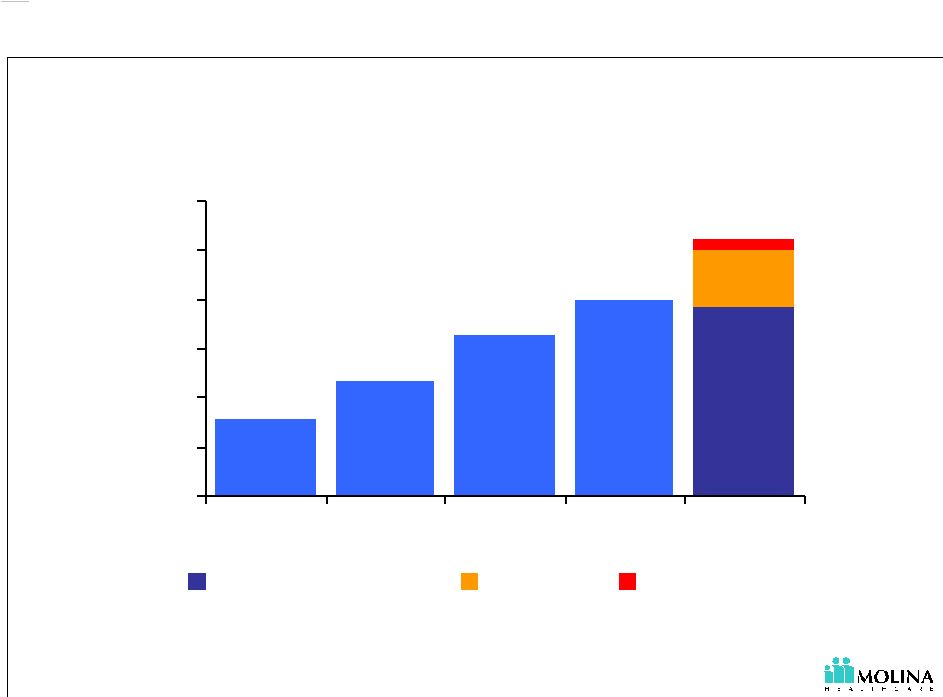 6 See cautionary language regarding the Company’s guidance and other forward-looking statements. How will we grow in 2007? Premium Revenue (dollars in millions) Premium revenue growth will come from Ohio, Texas and Dual Eligibles 1 $1,640M $2,000M $2,600M $1,171M $792M 1. “E” represents estimated 2. Legacy health plans include California, Indiana, Michigan, New Mexico, Utah and Washington. Indiana operations terminated 12/31/2006. 3. “Start-Ups” health plans include Ohio and Texas. $0 $500 $1000 $1500 $2000 $2500 $3000 2003 2004 2005 2006 E 2007 E Legacy Health Plans Start-Ups Dual Eligibles 3 2 |
 7 See cautionary language regarding the Company’s guidance and other forward-looking statements. 93.5% 90.4% 70% 80% 90% 100% 3Q06 YTD 2007 E 83.1% 84.1% 86.9% 84.4% 86.2% 75% 80% 85% 90% 2003 2004 2005 3Q06 YTD 2007 E Medical Care Ratio Our guidance assumes a decrease in our Start-Ups’ medical care ratios. 1. “Start-Ups” include operations in Ohio and Texas. 2. “E” represents estimated Consolidated Medical Care Ratio Start-Up¹ Medical Care Ratio 2 |
 8 See cautionary language regarding the Company’s guidance and other forward-looking statements. Continued Investment in our Infrastructure Investing in growth and strengthening our existing operational efficiency Core Admin is administrative expenses excluding premium taxes. “E” represents estimated. 7.0% 6.6% 5.9% 7.2% 8.6% 0.0% 2.0% 4.0% 6.0% 8.0% 10.0% 2003 2004 2005 3Q06YTD 2007 E $0 $4 $8 $12 $16 Core Admin - %of Total Revenue Core Admin PM PM |
 9 See cautionary language regarding the Company’s guidance and other forward-looking statements. Selected Health Plan Outlook |
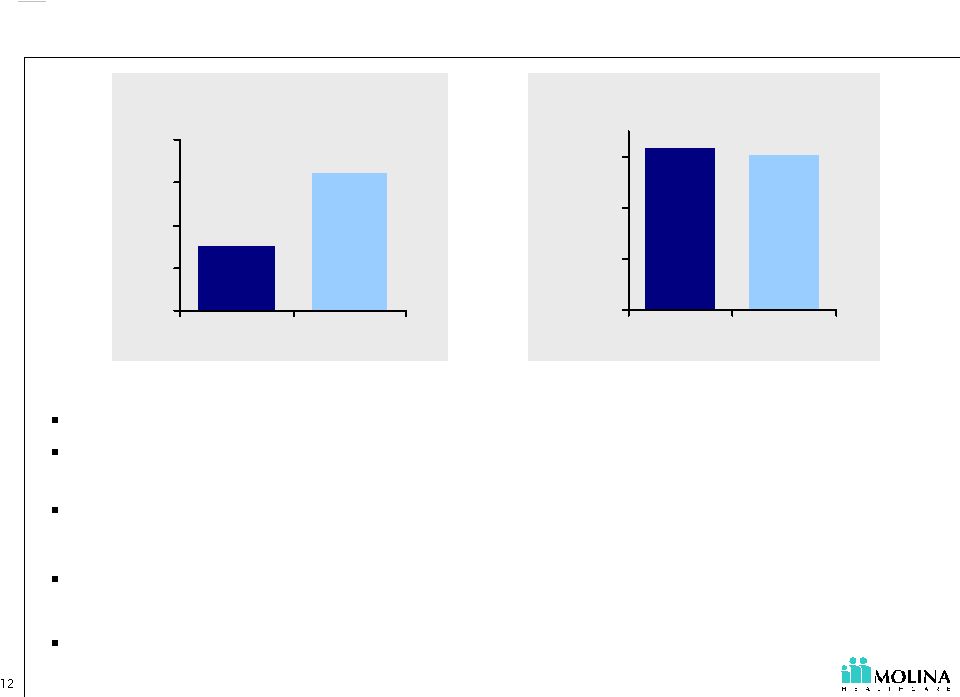
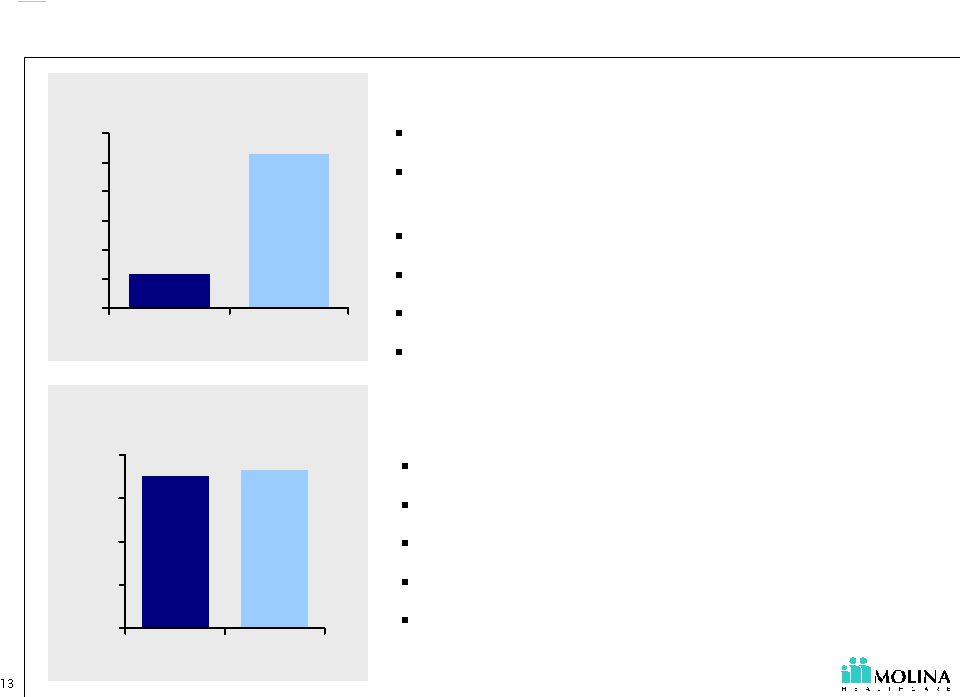
 See cautionary language regarding the Company’s guidance and other forward-looking statements. 300K 300K 321K 253K 0 100 200 300 400 '04 '05 '06 E '07 E 84.2% 88.0% 86.2% 83.7% 50% 69% 88% 107% '04 '05 3Q06 YTD '07 E California excluding Dual Eligibles Membership (in thousands) Opportunities: In 2007 a one percent change in the MCR changes medical costs by $3.6M ( $0.07 -$0.08 EPS). Guidance includes only a 1.75% rate increase. Utilization is well managed. Re-contracting efforts have shown success in the second half of 2006. Excess clinic capacity can reduce capitation expense. Challenges: Termination of certain contracts may decrease enrollment. Guidance assumes savings of $7.4M ( $0.16 EPS) as the MCR drops from anticipated 2006 levels to approximately 84.2%. Most savings will need to come from contracting. Projected decrease in MCR may be difficult to achieve with limited premium increases. Medical Care Ratio ~ ~ ~ ~ |
 See cautionary language regarding the Company’s guidance and other forward-looking statements. 93.2% 90.6% 30% 50% 70% 90% 3Q06 YTD '07 E 160K 76K 0 50 100 150 200 '06 E '07 E Ohio Membership (in thousands) Opportunities: Large TANF and ABD populations. Ohio PMPM revenue is higher than Company average. TANF rate increase for 2007 is minimal (1.0%); but ABD members will increase blended PMPM by 35%. Management of ABD population may yield savings. In 2007 a one percent change in the MCR changes medical costs by $5.2M ( $0.11 EPS) Medical Care Ratio ~ ~ |
 See cautionary language regarding the Company’s guidance and other forward-looking statements. 93.2% 90.6% 30% 50% 70% 90% 3Q06 YTD '07 E 160K 76K 0 50 100 150 200 '06 E '07 E Ohio Membership (in thousands) Medical Care Ratio Challenges: Guidance assumes 31% TANF penetration. Each 1% of TANF penetration equates to approximately $16.0M of revenue on an annualized basis. Guidance projects improved medical costs due to re-contracting and lower costs in new regions. Guidance assumes savings of $3.5M ( $0.07-$0.08 EPS) as the MCR drops from anticipated 2006 levels to approximately 90.6%. Guidance assumes a decreasing MCR through the year. Delays in re-contracting and membership rollout may delay improvements in the MCR. ~ ~ |
 See cautionary language regarding the Company’s guidance and other forward-looking statements. 86.6% 85.1% 50% 60% 70% 80% 90% 3Q06 YTD '07 E 2K 11K 0 2 4 6 8 10 12 '06 E '07 E Dual Eligibles Membership (in thousands) Opportunities: High per member per month revenue. Each 1,000 additional members add $14M in annualized premium revenue (Revenue PMPM is $1,100 - $1,200). Large populations in CA and MI. Providers have extensive managed care experience. Medical costs in UT have been better than expected. In 2007 a one percent change in the MCR changes medical costs by $1.0M. ( $0.02 EPS) Challenges: Members are acquired one at a time. High member acquisition cost. Limited Company experience with product. Limited cost data to set rate bids and claims reserves. FY 2007 costs will depend heavily on two new markets (CA and MI). Medical Care Ratio ~ ~ |
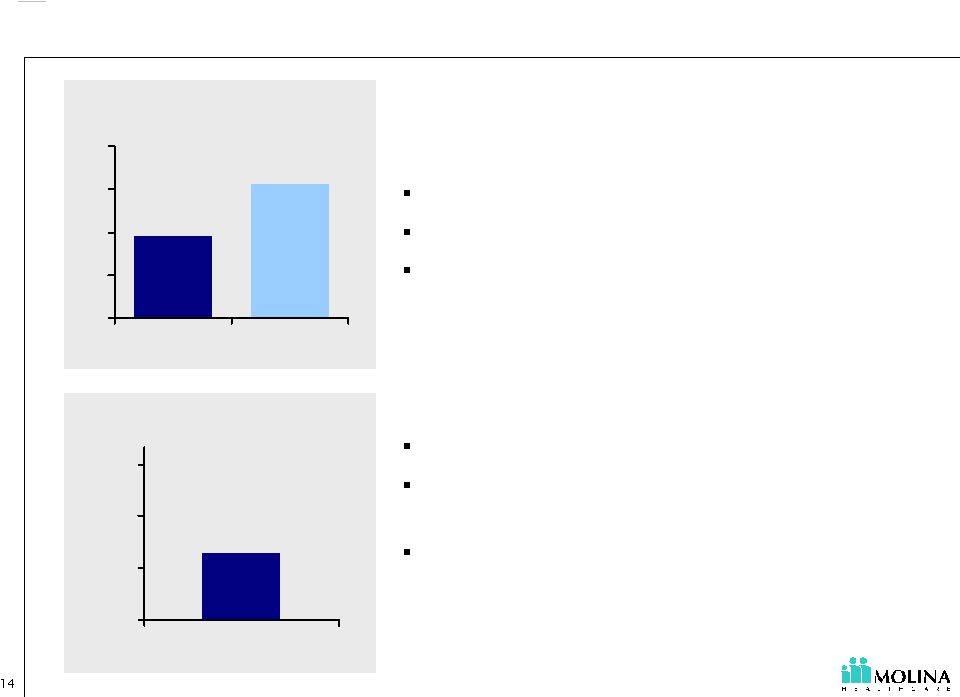 See cautionary language regarding the Company’s guidance and other forward-looking statements. 31K 19K 0 10 20 30 40 '06 E '07 E Texas Membership (in thousands) 89.0% 50% 80% 110% 140% '07E Medical Care Ratio Opportunities: LTC benefit for STAR Plus. TX PMPM revenue is higher than Company average. Guidance includes no TANF or SCHIP rates increase. Challenges: Guidance assumes improved medical care ratio. In 2007 a one percent change in the MCR is expected to change medical costs by $0.8M ( $0.02 EPS). There may be delays in the roll out of membership. ~ ~ |
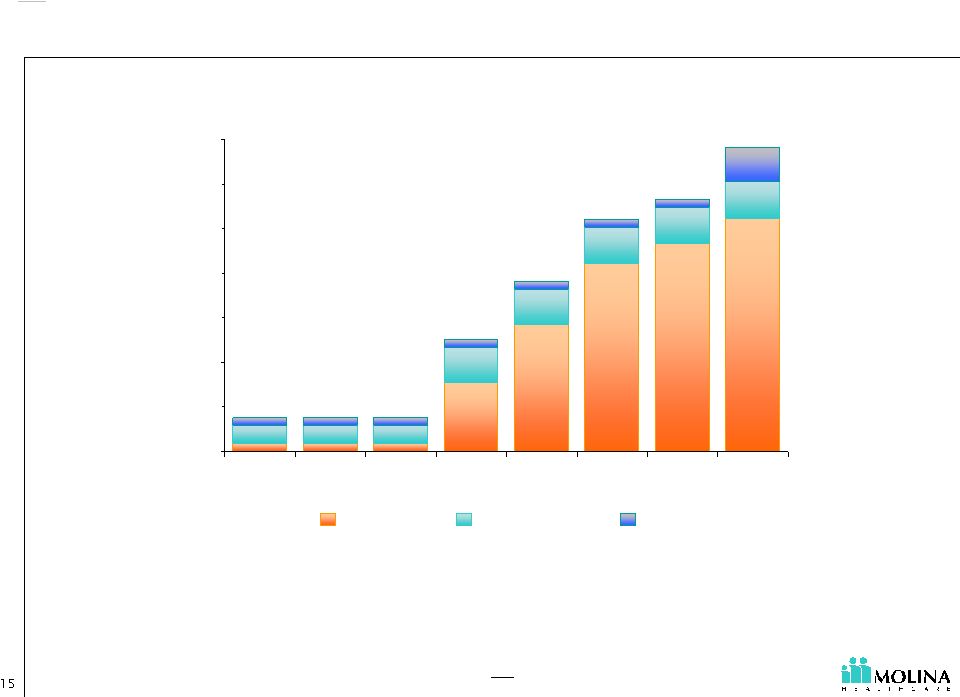 See cautionary language regarding the Company’s guidance and other forward-looking statements. Investing in Growth 1Q06 2Q06 3Q06 4Q06 E 1Q07 E 2Q07 E 3Q07 E 4Q07 E Ohio Indiana Texas “Start-Up” Net Worth Requirement Start-Ups require statutory and contractual capital commitments 1. For the purpose of this slide Start-Up health plans include Ohio, Texas and Indiana. 2. “E” represents estimated. $7.5M $56.4M $25.0M $51.9M $7.5M $38.1M $68.3M $7.5M By December 31, 2007, we project we will have drawn approximately $75M on our credit facility, principally to fund the capital requirements of our California and Start-Up health plans. Increased interest expense is expected to exceed increased interest income. 1 |
 See cautionary language regarding the Company’s guidance and other forward-looking statements. Risks and Opportunities Reducing Interest Costs Start-Up Capital Requirements Utah Savings Sharing SNP Growth Admin Leverage California Medical Costs Start-Up Medical Costs including SNP Start-Up Enrollment New Mexico Contract Amendment Start-Up Medical Costs Opportunities Risks |
 See cautionary language regarding the Company’s guidance and other forward-looking statements. EPS Build Out: Illustrative Example Based on Guidance Mid-Point $1.21 $0.40 ($0.11) $1.50 $0.21 $0.18 $0.12 $0.09 ($0.09) ($0.19) $1.82 1 1 1. IMPORTANT DISCLAIMER; these figure represents our annualized earnings per share (based 9/30/06 results) for illustrative purposes only and are NOT to be construed or interpreted as our actual fourth quarter or 2006 year end results. (All figures and estimates are approximate) Earnings per diluted share for nine months ended September 30, 2006 Additional Increment required to annualize net income for nine months ended September 30, 2006 Exclude 2006 positive prior period development Starting Point Expected Incremental changes in 2007: Ohio Enrollment & Lower Medical Costs Lower Medical Cost in California Texas Enrollment & Lower Medical Costs Termination of Indiana Contract Additional Corporate Interest Expense, Net of Investment Income Net Changes in Other Plans 2007 Guidance Mid-Point Diluted EPS |
 See cautionary language regarding the Company’s guidance and other forward-looking statements. Q&A |