 Investor Day 2012B September 19, 2012 New York, New York Exhibit 99.1 |
 © 2012 Molina Healthcare, Inc. Cautionary Statement 2 Safe Harbor Statement under the Private Securities Litigation Reform Act of 1995: This slide presentation and our accompanying oral remarks contain numerous “forward looking statements” regarding our cost control initiatives in Texas and Wisconsin; our expansion into the dual eligible markets in California, Texas, Michigan, and Ohio; growth in the Medicaid membership of our health plans as a result of the Affordable Care Act and otherwise; our planned participation in health insurance exchanges; requests for proposals in Florida and New Mexico; the rates paid to our health plans and the estimated effect of those rates on plan revenues; our capital needs and capital planning; and other various matters. All of our forward-looking statements are subject to numerous risks, uncertainties, and other factors that could cause our actual results to differ materially. Anyone viewing or listening to this presentation is urged to read the risk factors and cautionary statements found under Item 1A in our annual report on Form 10-K, as well as the risk factors and cautionary statements in our quarterly reports and in our other reports and filings with the Securities and Exchange Commission and available for viewing on its website at www.sec.gov. Except to the extent otherwise required by federal securities laws, we do not undertake to address or update forward-looking statements in future filings or communications regarding our business or operating results. |
 © 2012 Molina Healthcare, Inc. Agenda Approx. Time Topic Speaker 12:30pm-12:35pm Opening Remarks Juan José Orellana, VP Investor Relations 12:35pm-1:10pm Operations Review Terry Bayer, Chief Operating Officer 1:10pm-1:45pm Business Overview Dr. J. Mario Molina, Chief Executive Officer 1:45pm-2:00pm Q&A 2:00pm-2:15pm Break 2:15pm-2:45pm Long-Term Growth John Molina, Chief Financial Officer Joseph White, Chief Accounting Officer 2:45pm-3:05pm Q&A 3:05pm-3:50pm Funding Our Growth John Molina, Chief Financial Officer 3:50pm-4:30pm Q&A 4:30pm End of Program 3 |
 Operations Review Terry Bayer Chief Operations Officer September 19, 2012 New York, New York |
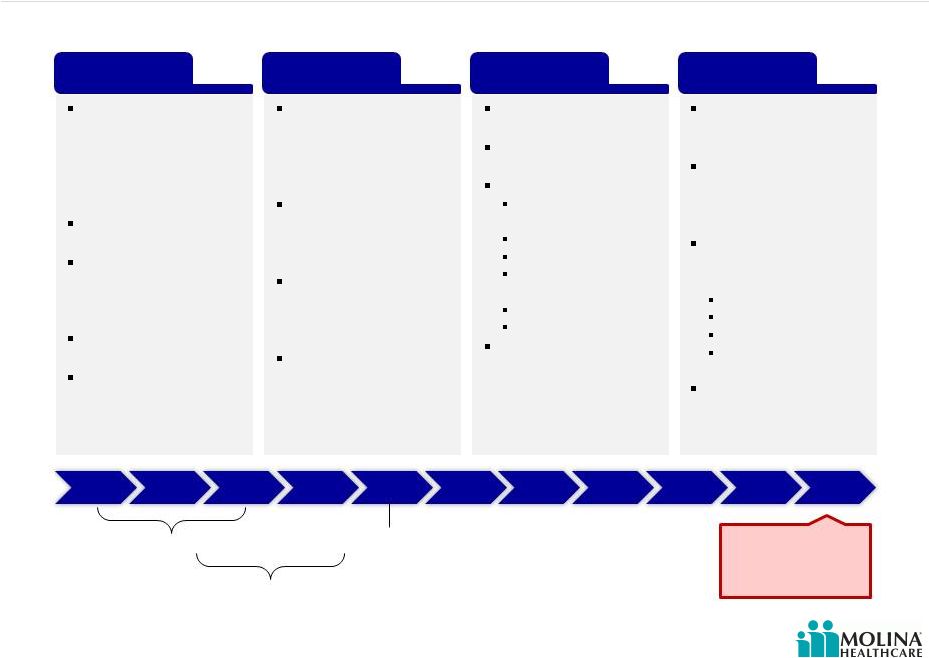
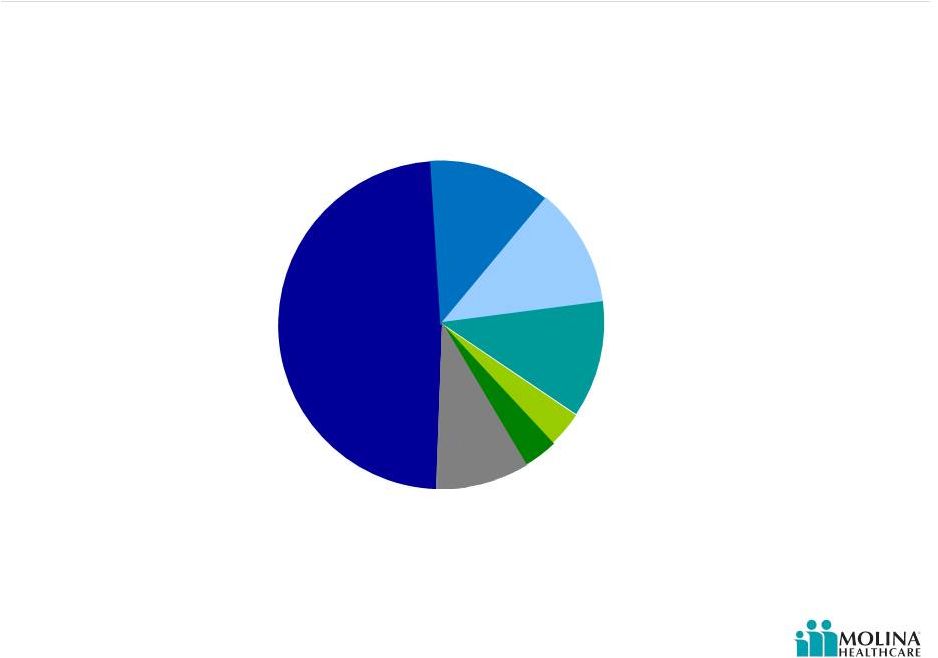
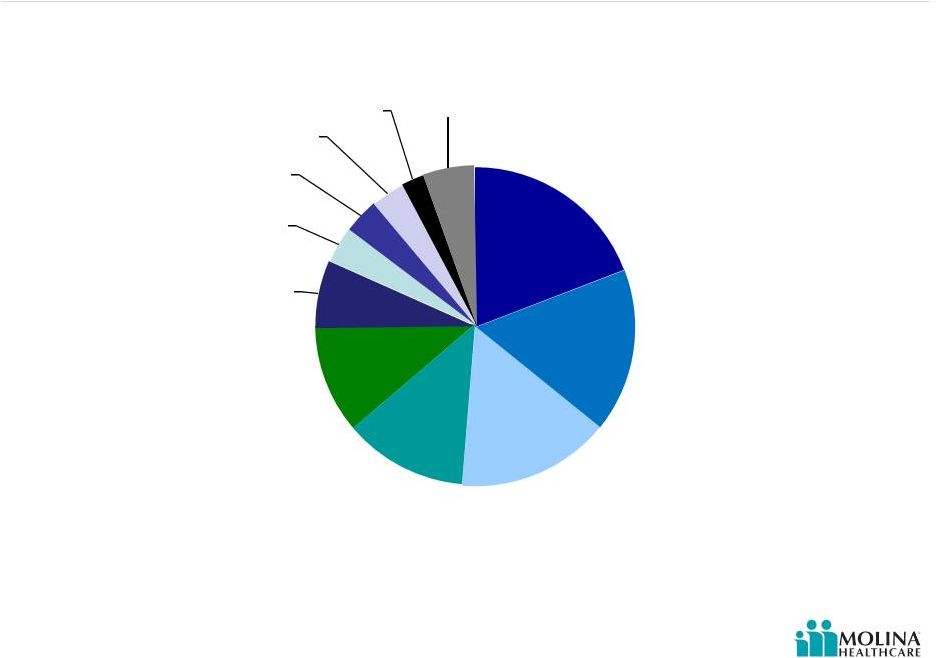
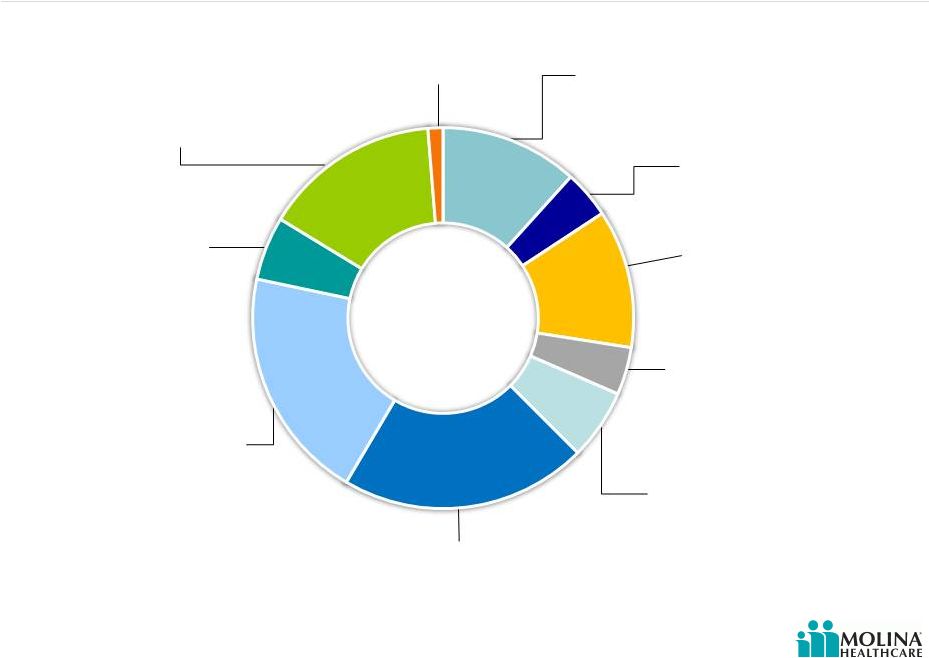 © 2012 Molina Healthcare, Inc. Revenue Contribution by State 5 Washington 15% Began serving ABD population 7/1/2012 Utah 5% RX carve-in effective 1/2013 Texas 20% Medical management initiatives implemented Ohio 21% Dual eligible contract in 3 regions effective 2013; statewide expansion effective 1/2013 Missouri 4% Contract ended June 30, 2012 Michigan 12% CSHCS effective 10/1/2012 Florida 4% Submitted Long-Term Care contract RFP California 12% Dual eligible contract in 4 counties effective 2013 Wisconsin 1% PDR taken 2Q 2012 Please refer to the Company’s cautionary statements. New Mexico 6% RFP effective 1/2014 1H 2012 |
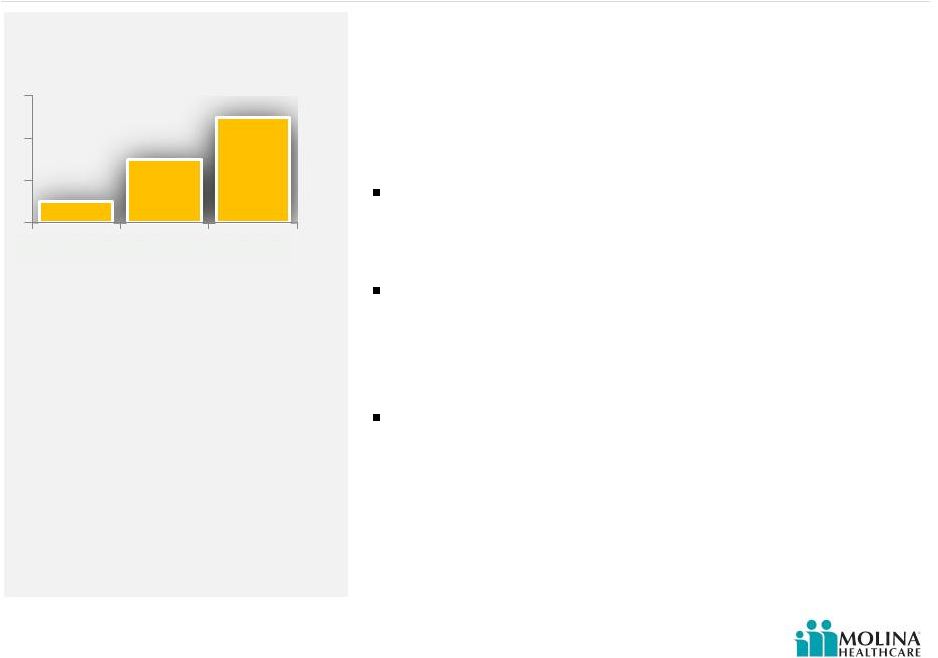
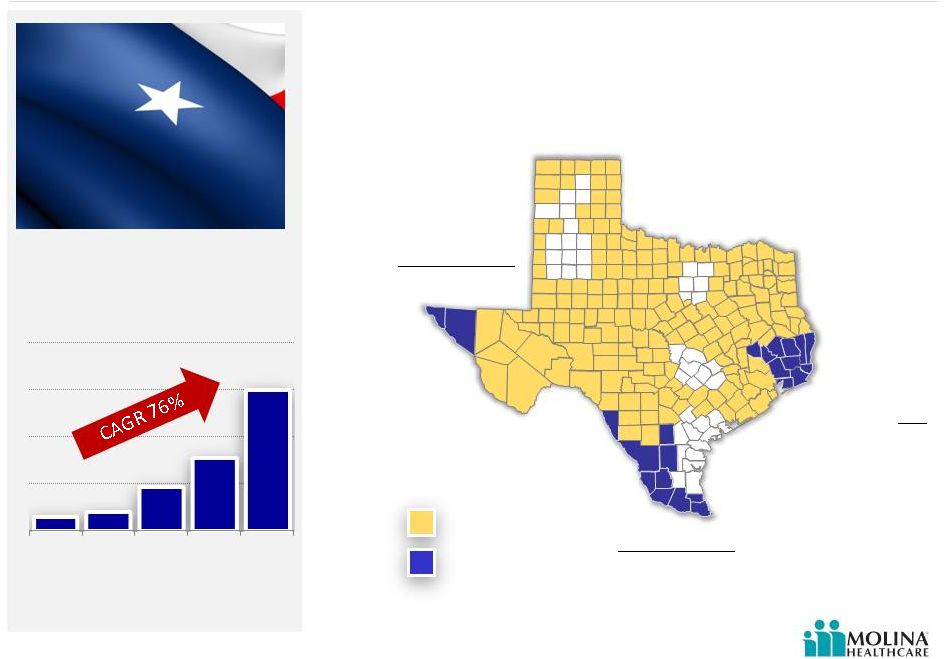 Texas Existing Molina footprint 6 Molina new SDAs effective 3/1/2012 Effective March 1, 2012, Molina added three new service delivery areas (SDAs). Molina New SDAs (effective 3/1/2012) El Paso Service Area STAR & STAR+PLUS El Paso and Hudspeth Counties Hidalgo Service Area STAR & STAR+PLUS Cameron, Duval, Hidalgo, Jim Hogg, Maverick, McMullen, Starr, Webb, Willacy, and Zapata counties Jefferson Service Area CHIP Chambers, Hardin, Jasper, Jefferson, Liberty, Newton, Orange, Polk, San Jacinto, Tyler and Walker counties Texas Health Plan Enrollment Source: Texas Health and Human Services Commission 301K 155K 94K 40K 31K 2008 2009 2010 2011 1H 2012 © 2012 Molina Healthcare, Inc. |
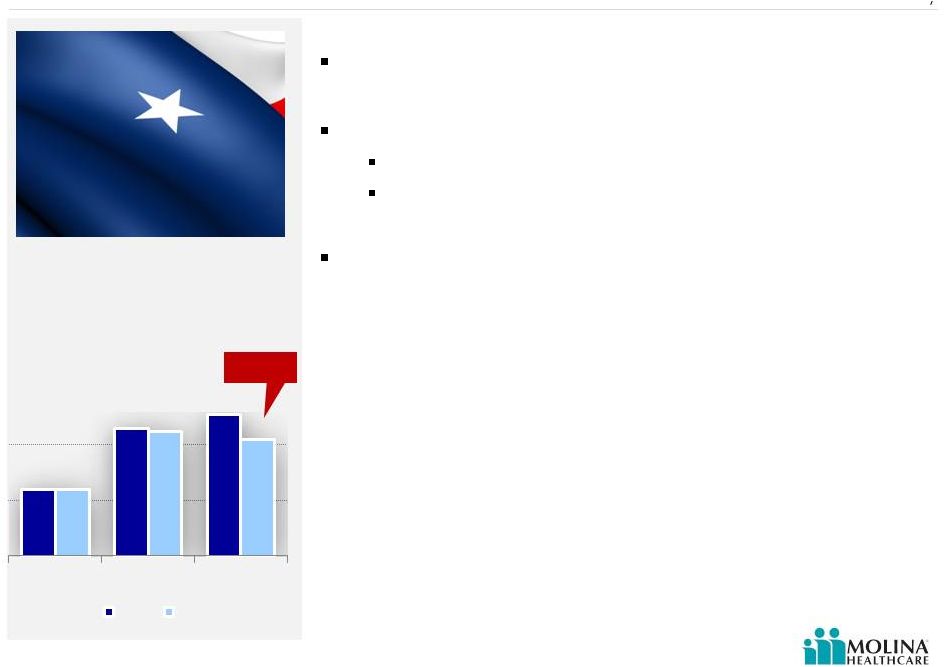 © 2012 Molina Healthcare, Inc. Texas Overview 7 Remediation activities Blended rate increase of 4% effective 9/1 Provider contract changes Re-contracted at lower unit costs Implementation of state required fee schedules New President & Management Team Enrollment at September 1 st was 291,000; ABD declined 8.1% from June 30th Source: Molina Healthcare, Inc. 2Q 2012 earnings release and company data. 84K 106K 111K 84K 105K 102K CHIP TANF ABD Jun 30 Sep 1 (8.1%) |
 © 2012 Molina Healthcare, Inc. Wisconsin Premium rates low in relation to benefits United Healthcare exit regions 1 Remediation activities Terminated certain high-cost providers Utilization Management New leadership 8 (http//www.jsonline.com) 1. Milwaukee Wisconsin Journal Sentinel, “UnitedHealthcare ends BadgerCare Plus contract with state” August 19, 2012. |
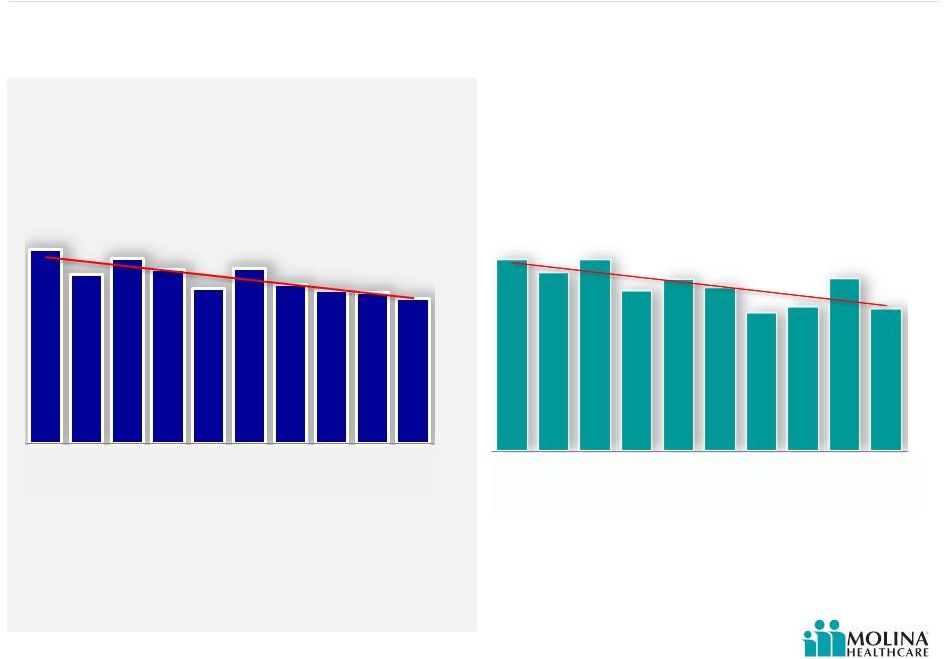
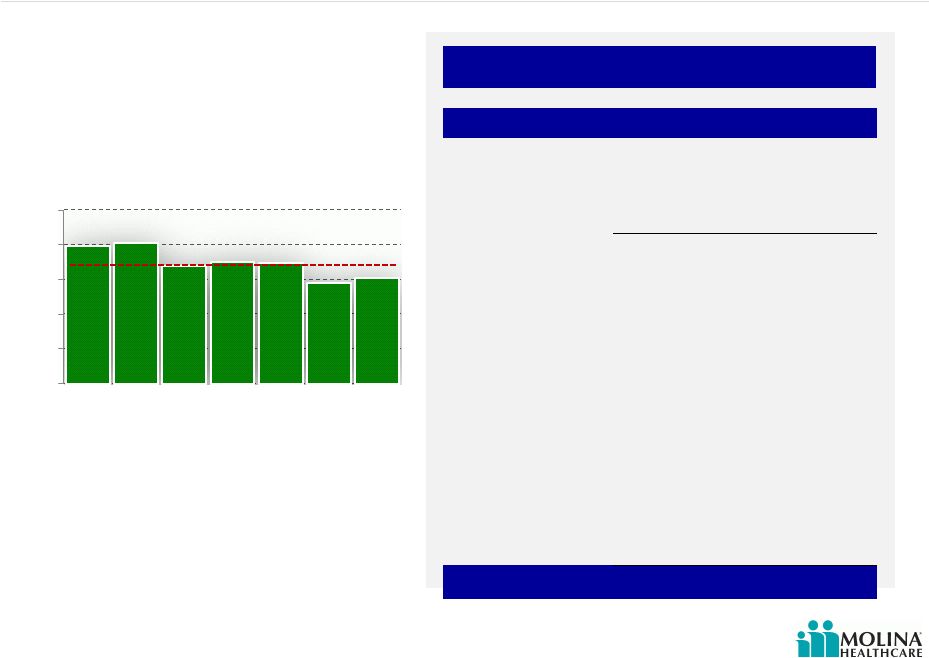
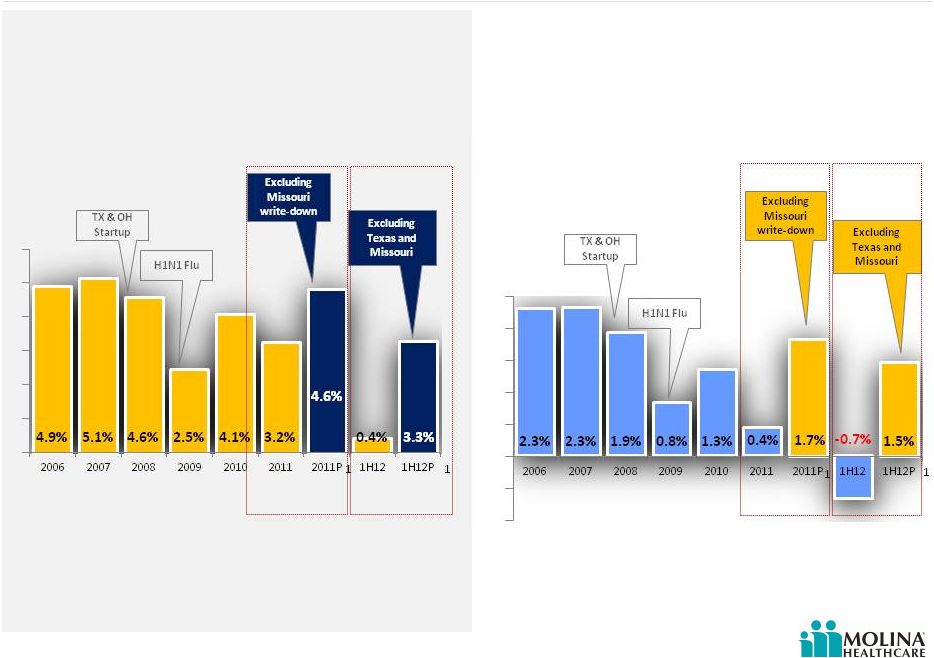
 Earnings Margin 2006-1H2012 9 AFTER TAX MARGIN Please refer to the Company’s cautionary statements. 1. P denotes results excluding Missouri write-down in 2011, and Texas and Missouri operations in 2012 1 1 H1N1 Flu Excluding Texas and Missouri Excluding Missouri write-down TX & OH Startup H1N1 Flu Excluding Texas and Missouri Excluding Missouri write-down TX & OH Startup EBITDA MARGIN 1 1 © 2012 Molina Healthcare, Inc. 4.9% 5.1% 4.6% 2.5% 4.1% 3.2% 4.6% 0.4% 3.3% 2.3% 2.3% 1.9% 0.8% 1.3% 0.4% 1.7% - 0.7% 1.5% |
 © 2012 Molina Healthcare, Inc. California’s Coordinated Care Initiative (CCI) Health plans must have an existing Medicaid contract The CCI will impact Molina Healthcare of California as follows: 1. Mandatory managed care enrollment of dual eligibles for the Medicaid portion of the benefit 2. Passive Medicare enrollment with opt-out option 3. A carve in for the long term support services (LTSS), which will become the MCOs’ responsibility » Long-term nursing facility care » Personal care » Adult day care » Other support services 10 Three Party Agreement between the health plans, the State, and CMS, which will provide funding for Medicare and Long-Term Care services on the Medicaid side for California’s dual eligibles. |
 © 2012 Molina Healthcare, Inc. California’s Coordinated Care Initiative (CCI) 11 Health Plan Readiness Membership Eligible populations defined for duals enrollment and mandatory Medicaid managed care enrollment Passive enrollment with opt-out (Medicare) Rolling enrollment based on birth month Unknown: Auto-assignment methodology Opt-out rate Rates Benefits Network Two payments for dual members with Medicare and Medicaid portions determined by CMS and DHCS, respectively Some level of risk adjustment for both Medicare and Medicaid payments Withholds for quality measures Unknown: Specific rate methodology All Medicare Parts A, B, and D All current Medicaid managed care benefits Medicaid LTSS Nursing facility long term care Personal care (IHSS) Adult day health (CBAS) Non-medical assistive services (MSSP) Case management Transition management Coordination with Medicaid behavioral health Leverage current Medicaid and Medicare networks Direct contracts with LTSS providers (not delegated and subcapitated to groups) Contracts with county agencies and LTSS providers Counties for IHSS CBAS providers MSSP providers Case management vendors Legislatively mandated payment provisions for certain providers Expected 6/1/13 Plans begin to enroll duals into demonstration Expected plan rates released 12/15/12 Deadline for CMS/DHCS/Plan 3-way contracts Plan readiness review by CMS and DHCS Aug Sep Oct Nov Dec Jan Feb Mar Apr May Jun |
 © 2012 Molina Healthcare, Inc. Utilization Decreases With Length of Enrollment 12 As length of enrollment increases for our ABD populations, utilization decreases. Admits per K (manageable) by enrollment month Days per K (manageable) by enrollment month Please refer to the Company’s cautionary statements. Month Month Source: Molina CA ABD Length of Enrollment 289 252 276 259 231 261 237 229 225 215 1,239 1,154 1,238 1,044 1,113 1,060 902 939 1,119 926 1 2 3 4 5 6 7 8 9 10 1 2 3 4 5 6 7 8 9 10 |
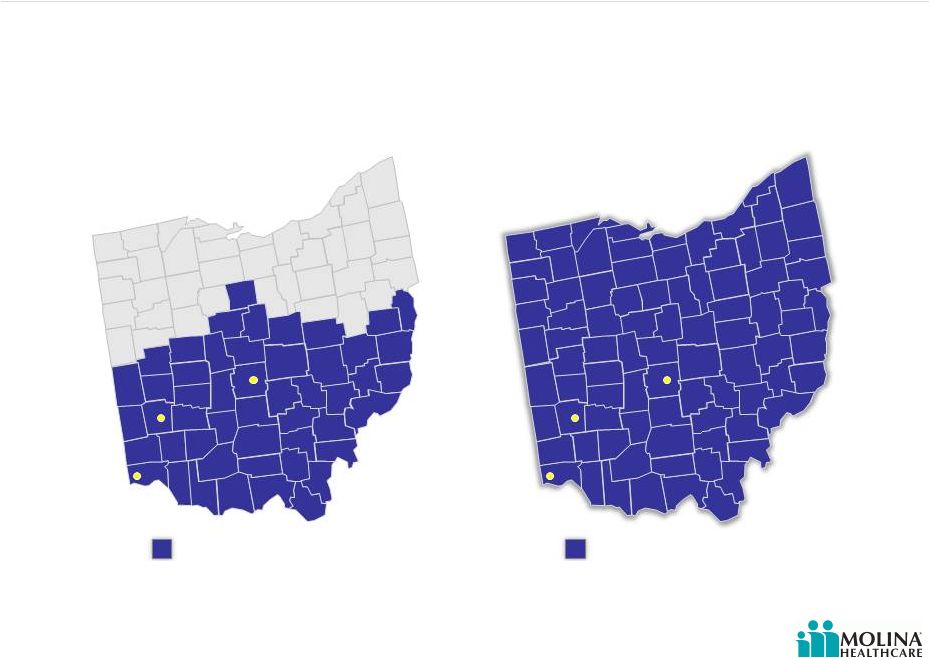 © 2012 Molina Healthcare, Inc. Post-2012 RFA Ohio Managed Care Regions 1.6M Eligibles Ohio (TANF & ABD) Source: Ohio Department of Job and Family Services http://jfs.ohio.gov/rfp/JFSR1213078019/JFSR1213078019.stm http://jfs.ohio.gov/ohp/bmhc/documents/reports/December2011_CFC_Penetration-Enrollment.pdf 13 Pre-2012 RFA Current Molina Service Area Effective June 1, 2013 Molina Healthcare will expand into 38 new counties. Dayton Cincinnati Columbus Dayton Cincinnati Columbus Current Molina service area New Molina service area |
 © 2012 Molina Healthcare, Inc. Molina Selected To Serve Duals in Max Regions Allowed 14 The state of Ohio chose Molina to participate in the 3-year demonstration program in the Southwest, West Central, and Central regions. Implementation expected to begin June 1, 2013. Current Molina Service Area 260,000 members (TANF+ABD) Molina Integrated Care Coordination Program Regions 45,000 dual eligibles Dayton Cincinnati Columbus Dayton Cincinnati Columbus Central Region: 16,000 eligibles South West Region: 17,000 eligibles West Central Region: 12,000 eligibles |
 © 2012 Molina Healthcare, Inc. Washington 15 Successfully defended Washington Medicaid contract in 34 counties and added one additional county, effective 7/1/12 On September 1, enrollment was 410,000, including 19,000 ABD members Established provider relationships Molina was only health plan in Washington participating in the Washington Medicaid Integration Program (WMIP) No Long Term Care benefits for new Aged, Blind, or Disabled (ABD) members |
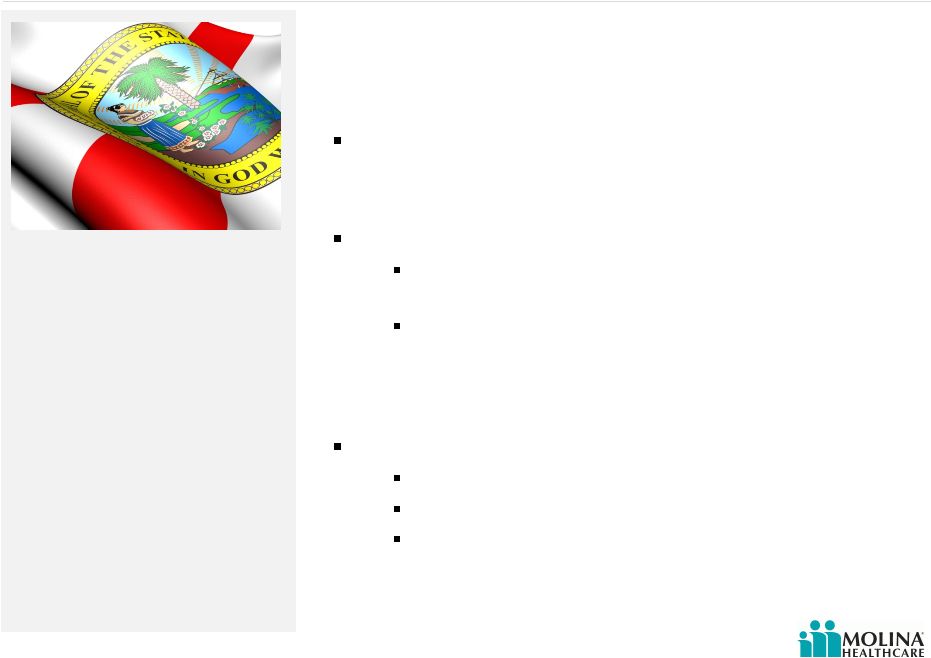 © 2012 Molina Healthcare, Inc. New Opportunities in Florida – Long Term Care Program Molina has bid in 8 of 11 regions (30 counties) with 90,000 beneficiaries to be shared by awarded MCOs Molina Florida Experience Nursing Home Diversion Program in Pinellas and Hillsborough counties (Tampa area) Waiver focused on intensive case management and home and community based services vs. nursing home placement Timeline: 8/28/12 Bids Submitted 1/15/13 Anticipated Awards announced 8/1/13 Effective for first region awarded (Region #7); other regions will “roll in” each month through 3/2014 16 Florida is gradually moving toward statewide Medicaid managed care, Molina is competing for contracts to provide long term care for seniors. The program involves nursing home, hospice, and home and community-based services in 11 regions. The State of Florida is expected to select 2-5 plans per region. 1. Regions: Pensacola, Tallahassee, Gainesville, Jacksonville, St. Petersburg, Tampa, Orlando, Sarasota, Palm Beach, Ft. Lauderdale, Miami 1 |
 © 2012 Molina Healthcare, Inc. New Opportunities in New Mexico – Centennial Care Overview: Integrates medical, behavioral health, and long term care services 680,000 beneficiaries Plans must be statewide Special Needs Plan (SNP) or Medicare Advantage plan Reduces 7 MCOs to 5 Timeline: 11/20/12 Bids Due 1/7/13 Awards announced 1/1/14 Effective 17 Managed Care Organizations will provide medical, behavioral health, and long term care services which were previously procured as separate contracts |
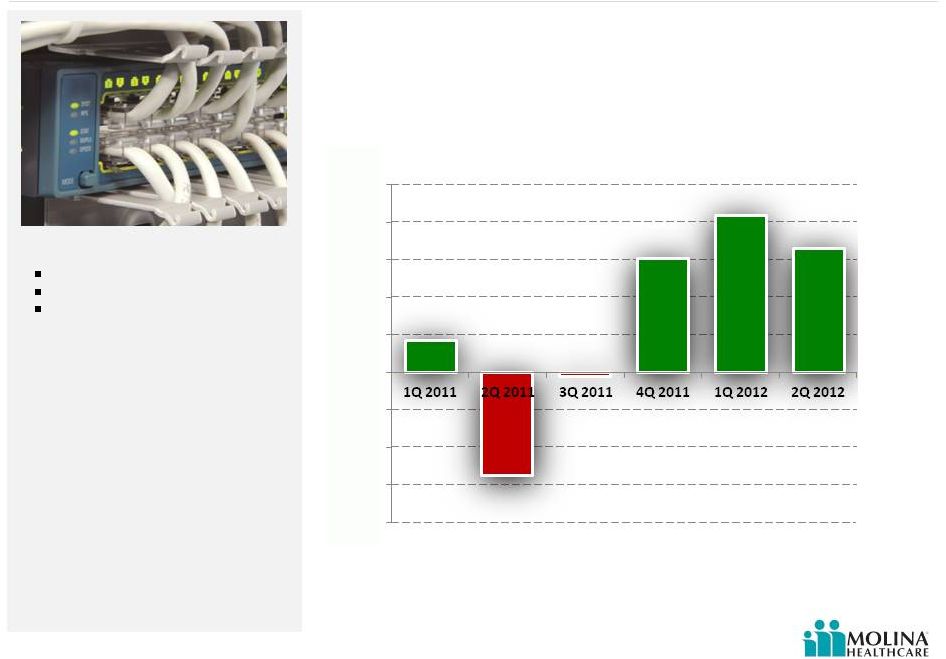 © 2012 Molina Healthcare, Inc. MMS Comes of Age 18 MMS Operating Income by Quarter Please refer to the Company’s cautionary statements. The year over year improvement due to CMS certifications in Idaho and Maine. Diversifying profit stream Generating cash flow Serving 2.5M beneficiaries ($5.5M) ($0.2M) ($8M) ($6M) ($4M) ($2M) $0M $2M $4M $6M $8M $10M $1.7M $6.1M $8.4M $6.6M © 2012 Molina Healthcare, Inc. |
 Business Overview J. Mario Molina, MD Chief Executive Officer September 19, 2012 New York, New York |
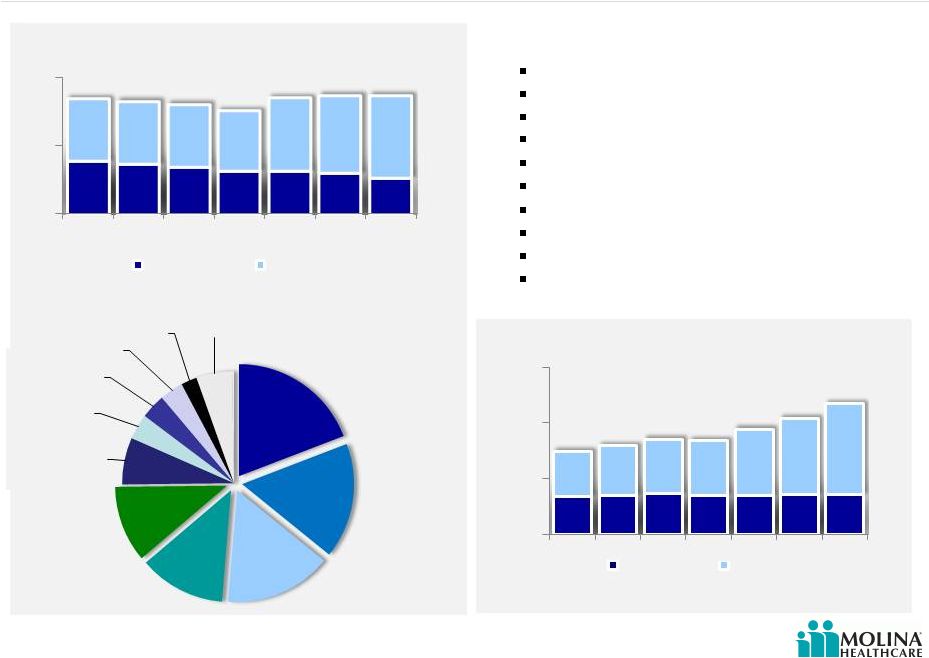
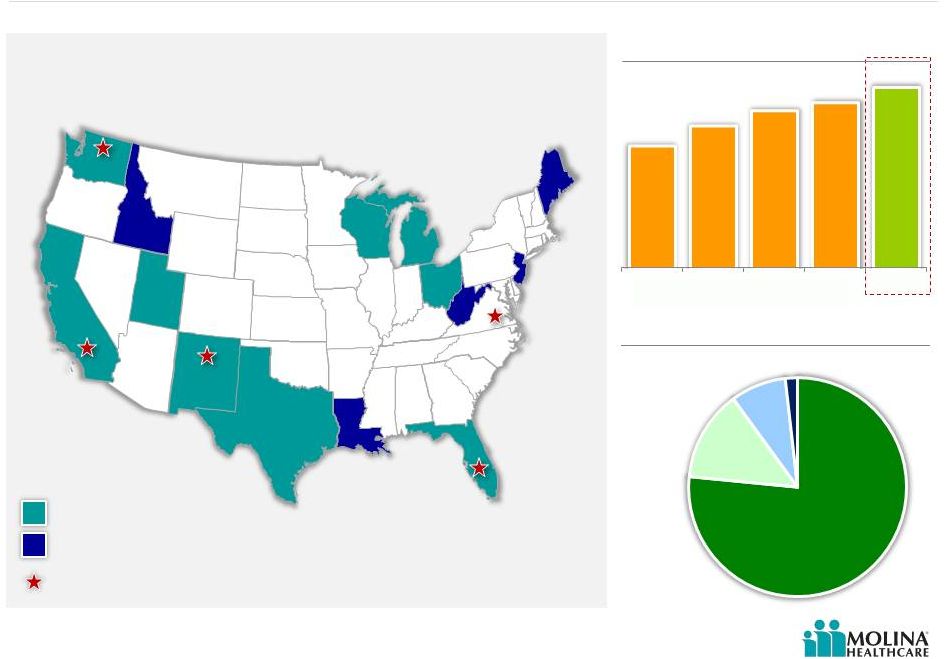 © 2012 Molina Healthcare, Inc. Business Snapshot Markets and members served – 2Q 2012 Washington 356,000 California 350,000 New Mexico 89,000 Utah 86,000 Texas 301,000 Michigan 220,000 Ohio 260,000 Florida 2 70,000 Health plan enrollment growth Health plan membership profile (in thousands) Molina Healthcare Health Plans Molina Medicaid Solutions Idaho Maine Louisiana West Virginia New Jersey 1. 2. 3. Virginia 1 Wisconsin 42,000 AGED, BLIND OR DISABLED MEDICARE 2% 76% TANF 14% CHIP 8% 20 Molina Direct Delivery 3 (1 clinic) (17 clinics) (2 clinics) (1 clinic) (3 clinics) 1,256 1,455 1,613 1,697 1,853 '08 '09 '10 '11 2Q 2012 Note: Map does not include Missouri since the contract ended June 30, 2012. However the enrollment chart does. Virginia clinics provide Direct Delivery, operated by Molina and owned by Fairfax County. Florida has a managed care program as well as a Pharmacy Rebate Program. Company owned and operated primary care clinics. |
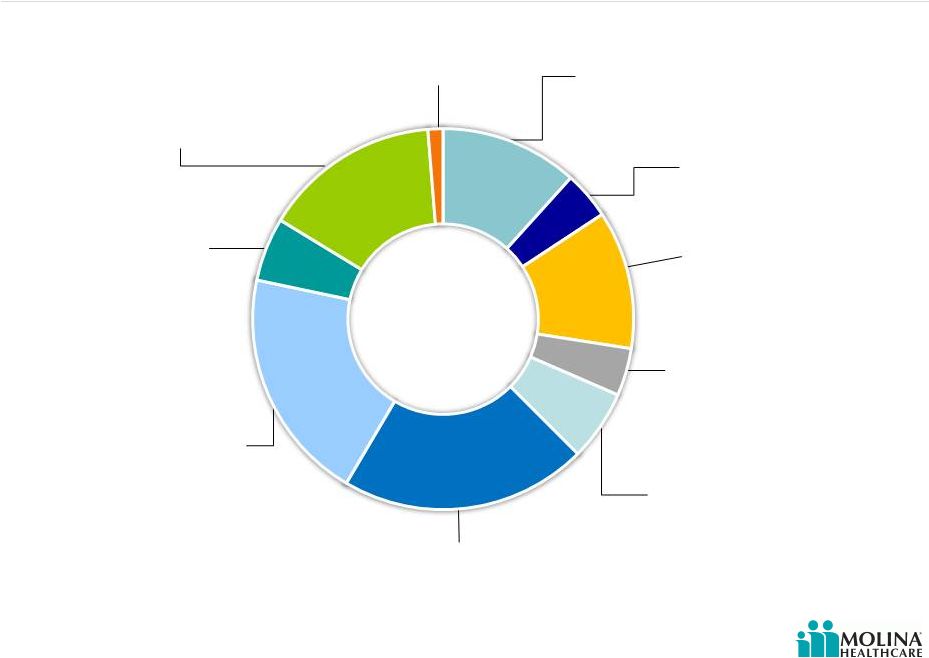 © 2012 Molina Healthcare, Inc. Revenue Contribution by State 21 Washington 15% Began serving ABD population 7/1/2012 Utah 5% RX carve-in effective 1/2013 Texas 20% Medical management initiatives implemented Ohio 21% Dual eligible contract in 3 regions effective 2013; statewide expansion effective 1/2013 Missouri 4% Contract ended June 30, 2012 Michigan 12% CSHCS effective 10/1/2012 Florida 4% Submitted Long-Term Care contract RFP California 12% Dual eligible contract in 4 counties effective 2013 Wisconsin 1% PDR taken 2Q 2012 Please refer to the Company’s cautionary statements. New Mexico 6% RFP effective 1/2014 1H 2012 |
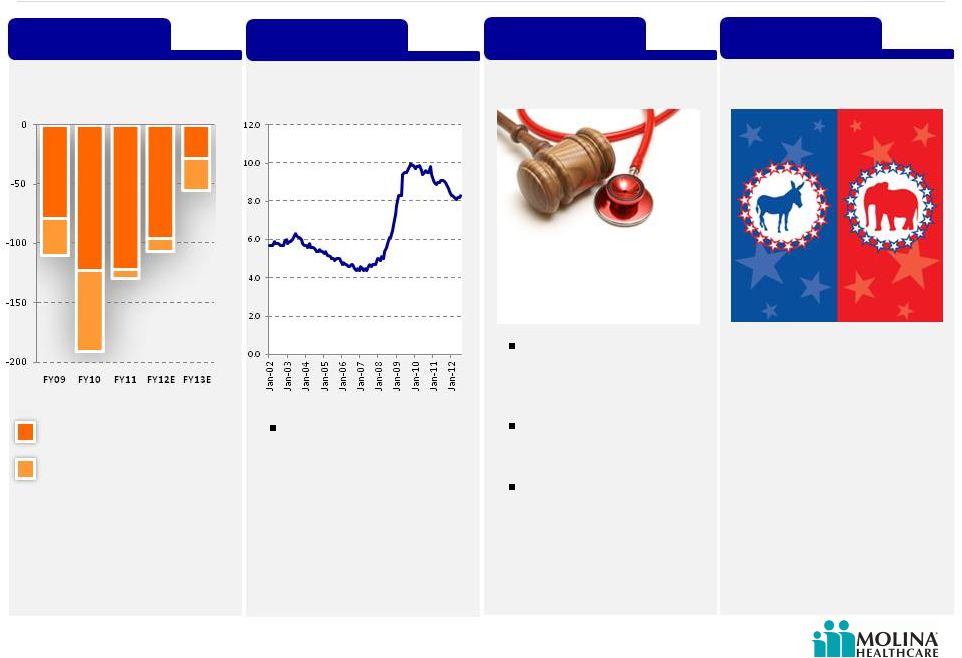 © 2012 Molina Healthcare, Inc. Market Dynamics State Budget Shortfalls *Reported to Date Source: Center on Budget and Policy Priorities. Analysis using data from U.S. Department of Health and Human Services, U.S. Department of Education, Congressional Budget Office, and state budget documents. June 2012. Budget gaps offset by Recovery Act and extension Remaining budget gaps after Recovery Act and extension State Budget Unemployment ACA Makes Medicaid expansion optional for states 11 million additional Medicaid beneficiaries Federal government incurs 100% of the cost of expansion for the first 3 years 2012 Elections Budget shortfalls in billions Unemployment Nationwide through July 2012 22 Joblessness and slow economic recovery -$110 -$191 -$130 -$107 -$55* Supreme Court Decision 2012 Elections |
 © 2012 Molina Healthcare, Inc. 23 A History of Adapting to Constant Change 1980 Opened 3 Primary Care Clinics in California 1997 Established Utah operation, the first venture outside of California 2006 Launched Medicare SNP product 2003 Completed successful Initial Public Offering 2010 Acquired the Health Information Management business from Unisys, now Molina Medicaid Solutions 2013+ Medicaid Expansion & the dual eligible 1994 First Medicaid Managed Care contract (California) 2000 First CHIP Managed Care contract (California) C. David Molina, MD Founder Molina Healthcare, Founded 1980 |
 © 2012 Molina Healthcare, Inc. Long-Term Incremental Growth Drivers 24 Estimated additional revenue by 2015 as a result of duals and Medicaid expansion 4 Estimated 2015 run rate Duals 1 Current Health Plan Business ACA 2 Total 1. Duals denote revenue potential for dual eligibles in CA, MI, OH and TX. 2. ACA denotes revenue potential as a result of Medicaid expansion in CA, MI, OH, NM, UT, WA, WI; and exchanges in CA, FL, MI, NM, OH, TX, UT, WA, WI. 3. Other includes FL, MI, NM, TX, UT, WI. 4. Figures may not add up due to rounding. Please refer to the Company’s cautionary statements. 2012 2015 ~$6B ~$4B ~$12B CA: $1.2B OH: $0.5B TX: $1.5B MI: $0.9B OH: $0.5B WA: $0.3B CA: $0.3B Other: $1.0B 3 ~$2B |
 © 2012 Molina Healthcare, Inc. U.S. Medicaid Coverage Estimates Updated for the Supreme Court Decision 25 * Source: Congressional Budget Office, “Estimates for the Insurance Coverage Provisions of the Affordable Care Act Updated for the Recent Supreme Court Decision.” July 2012. 1. The change in employment-based coverage is the net result of increases in and losses of offers of health insurance from employers and changes in enrollment by workers and their families. 2. Other includes Medicare; the effects of the ACA are almost entirely on nongroup coverage .. Medicaid & CHIP Exchanges Employer Nongroup & Other Uninsured Estimated Changes in Insurance Coverage by 2022* 1 2 March 2012 Baseline July 2012 Estimate Incorporating SCOTUS Decision |
 © 2012 Molina Healthcare, Inc. Two Ends of the Continuum 26 Duals TANF More continuous eligibility Chronic illnesses Behavioral health More likely to have greater limitations in activities of daily living (ADL) Require more focused care including home care More likely to have a usual source of care and less likely to delay care due to cost Breaks in eligibility Episodic care Pregnancy Greater ethnic diversity Larger support system at clinic visits Under Age 65 38% Over Age 65 62% Under Age 65 75% Over Age 65 25% TANF ABDs Duals Demographics Source: 1. KFF.org TANF Duals 1 |
 © 2012 Molina Healthcare, Inc. Most Common Diagnoses 27 TANF Diagnoses ABD Diagnoses Dual Eligibles Diagnoses Inpatient Services Delivery Affective psychoses Affective psychoses Complications of delivery Septicemia Septicemia Other maternal complications Schizophrenic disorders Care involving use of rehabilitation procedures Prolonged pregnancy Chronic bronchitis Pneumonia Other OB Pneumonia Chronic bronchitis Outpatient Services Well Child care Respiratory & other chest Essential hypertension Acute upper respiratory infection Fever and fatigue Respiratory and other chest Respiratory & other chest Diabetes mellitus Diabetes mellitus Fever and fatigue Back disorders Fever and fatigue Ear infection Joint disorders Joint disorders |
 © 2012 Molina Healthcare, Inc. Specific Benefits for Duals 28 Medicaid Benefits* Medicare Benefits Hospital Insurance (Part A) Blood, home health care, hospice care, hospital inpatient stay, mental health inpatient stay, skilled nursing facility stay Medical Insurance (Part B) Blood, clinical laboratory services, home health services, medical and other services, outpatient mental health services, outpatient hospital services, other covered services Medicare Prescription Drug Coverage (Part D) Copayments for Medicare services Long Term Care Institutional HCBS (Home & Community Based Services) Personal Care Adult Day Care Home modifications Meals Paramedical/nursing services Physical, speech, and occupational therapies Behavioral health *Subject to state carve-outs Sources: KFF.org, “Proposed Models to Integrate Medicare and Medicaid Benefits for Dual Eligibles: A Look at the 15 State Design Contracts Funded By CMS” and Medicare.gov, “Medicare costs at a glance” |
 © 2012 Molina Healthcare, Inc. We Currently Manage Many Dual Benefits Benefits California (SPD Duals) Washington (WMIP) Texas (STAR+PLUS) Personal Care X X Nursing Home Adult Day Care X X X Behavioral Health X X Paramedical/Nursing Services X X Meals X X Physical, Speech, and Occupational Therapies X X X Home Modifications X X 29 |
 © 2012 Molina Healthcare, Inc. CMS Rate Setting Process Guidance 30 Savings targets may differ among States with low historic Medicare spending, low utilization of institutional long- term care services, or a high penetration of Medicaid managed care. Sample Aggregate Savings Targets Under the Demonstrations Aggregate Savings would be applied to Medicare A/B and Medicaid components of the rate Both payers proportionally share in the contribution to the capitation rate and in the savings achieved Savings targets not applied to the Part D component of the rate 1 1.0% 3.0% 5.0% Year 1 Year 2 Year 3 1. CMS Joint Rate Setting Process Under the Capitated Financial Alignment Initiative |
 © 2012 Molina Healthcare, Inc. Opt Out Impact On Dual Premium 31 Auto Assignment Opt-Out of Medicare Managed Care ? Medicaid Benefit Only Medicaid + Medicare Integrated Benefits Yes State/County/Region Dual Eligible Population No Partial Dual Full Dual D-SNP* Parts A, B, D Illustrative Example for California *Specific to California example |
 © 2012 Molina Healthcare, Inc. Strategic Priorities 32 Mission Priorities Quality Care Current Portfolio Health plan business MMS Direct delivery Growth Organic growth Medicaid expansion Dual eligible population Acquisitions RFPs Margin Expansion Long-Term EBITDA target: 4% - 5% EBITDA margin 1.5%-2% after tax margin Our mission is to provide quality health services to financially vulnerable families and individuals covered by government programs. |
 © 2012 Molina Healthcare, Inc. Q&A 33 |
 Long-Term Growth September 19, 2012 New York, New York John Molina, Chief Financial Officer Joseph White, Chief Accounting Officer |
 © 2012 Molina Healthcare, Inc. Long-Term Incremental Growth Drivers 35 Estimated additional revenue by 2015 as a result of duals and Medicaid expansion 4 Estimated 2015 run rate Duals Current Health Plan Business ~$6B ~$4B ACA ~$12B CA: $1.2B OH: $0.5B MI: $0.9B Total 1. Duals denote revenue potential for dual eligibles in CA, MI, OH and TX. 2. ACA denotes revenue potential as a result of Medicaid expansion in CA, MI, OH, NM, UT, WA, WI; and exchanges in CA, FL, MI, NM, OH, TX, UT, WA, WI. 3. Other includes FL, MI, NM, TX, UT, WI. 4. Figures may not add due to rounding. Please refer to the Company’s cautionary statements. OH: $0.5B WA: $0.3B CA: $0.3B Other: $1.0B ~$2B 2012 2015 1 TX: $1.5B 3 2 |
 © 2012 Molina Healthcare, Inc. Estimating Dual Revenue PMPM 36 Two Molina programs could help us estimate dual eligible premiums Please refer to the Company’s cautionary statements. 1. 2. Program Medicaid & Medicare LTC Total Texas SNP $1,900 $700 $2,600 WMIP $1,700 $700 $2,400 Our expectation for Dual Eligible premium (Medicare & Medicaid – No opt-out) $2,500 PMPM Note: LTC based on Florida LTC RFP Region 11 Assumes 15% of Integrated Dual population would be institutionalized LTC 1 2 |
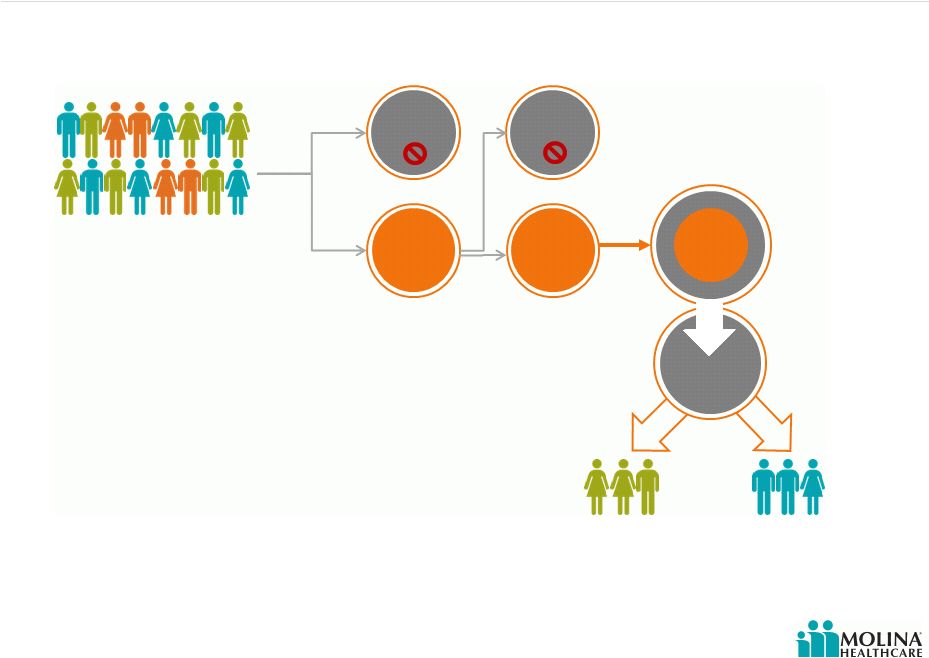
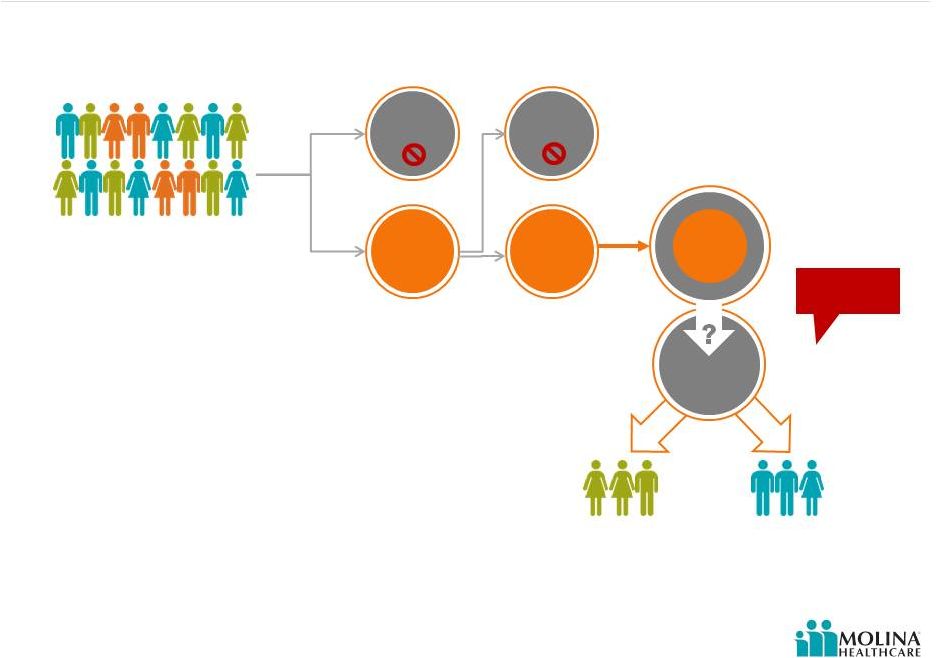 © 2012 Molina Healthcare, Inc. Opt Out Impact On Dual Premiums 37 Auto Assignment Opt-Out of Medicare Managed Care ? Medicaid Benefit Only Medicaid + Medicare Integrated Benefits Yes State/County/Region Dual Eligible Population No Partial Dual Full Dual Parts A, B, D Illustrative Example for California 10% 90% Substantial Uncertainty ~50% 10% 80% Please refer to the Company’s cautionary statements. *Specific to California example D-SNP* |
 © 2012 Molina Healthcare, Inc. Dual Market Opportunity State Estimated Number of Participating Duals in Molina markets Opt-Out Rate Potential Range Molina’s Estimated Dual Enrollment Annualized Premium Revenues California 430K 20% - 80% 50K $0.9B - $1.4B Michigan 160K 20% - 80% 40K $0.7B - $1.0B Ohio 50K 20% - 80% 25K $0.4B – $0.7B Texas 215K 20% - 80% 60K $1.1B - $1.6B Total 855K 175K $3.1B - $4.7B 38 Source: Company estimates; figures may not add due to rounding. Please refer to the Company’s cautionary statements. |
 © 2012 Molina Healthcare, Inc. Medicaid Expansion Opportunity State Expansion Eligibles in Medicaid Managed Care Molina’s Estimated Enrollment Estimated Premium 1 PMPM Annualized Premium Revenues California 1M 100K $100 $120M Florida not included not included not included not included Michigan 500K 100K $125 $150M New Mexico 100K 25K $200 $60M Ohio 500K 125K $250 $375M Texas not included not included not included not included Utah 125K 40K $200 $95M Washington 250K 125K $175 $260M Wisconsin 125K 15K $125 $20M Total 2.6M 530K $ 1.1B 39 Source: 1. Based on Molina’s current TANF premium Company estimates, figures may not add due to rounding. |
 © 2012 Molina Healthcare, Inc. Exchange Opportunity State Number of Exchange Members in Molina Markets Molina’s Estimated Exchange Enrollment Estimated Premium 1 PMPM Annualized Premium Revenues California 2.2M 180K $100 $ 215M Florida 1.0M 80K $150 $145M Michigan 400K 35K $125 $50M New Mexico 100K 10K $200 $25M Ohio 500K 40K $250 $120M Texas 1.6M 125K $225 $340M Utah 200K 15K $200 $40M Washington 300K 30K $175 $60M Wisconsin 300K 20K $125 $30M Total 6.6M 535K $1.0B 40 1. Source: Company estimates, figures may not add due to rounding. Based on Molina’s current TANF premium |
 © 2012 Molina Healthcare, Inc. Premium Rate Changes 41 1. Denotes announced rate changes. Please refer to the Company’s cautionary statements. Health Plan Effective Date Revenue Change California 10/1/2012 unknown Florida 9/1/2012 unknown Michigan 10/1/2012 unknown New Mexico 7/1/2012 (1) Ohio 1/1/2012 (1) Texas 9/1/2012 (1) Utah 7/1/2012 (1) Washington 7/1/2012 (1) Wisconsin 1/1/2012 1% (1) ( 0.5%) ( 2%) 4% ( 2%) ( 2%) |
 Leveraging Administrative Costs Two types of administrative costs: Activities that improve healthcare outcomes General & administrative costs (G&A) 42 Please refer to the Company’s cautionary statements. © 2012 Molina Healthcare, Inc. |
 © 2012 Molina Healthcare, Inc. 43 As a % of Total Revenue Per Member Per Month (PMPM) Cost by Category – YTD 2012 2.6% Please refer to the Company’s cautionary statements. Activities That Improve Healthcare Outcomes $5 Utilization Management Quality Mgmt Medical Affairs Service Coordination Health Education Nurse Advice Line Other Utilization Management Quality Management Coordination of Medical Management Coordination of Care, CM & DM Health Education Nurse Advice Line Include the following services: |
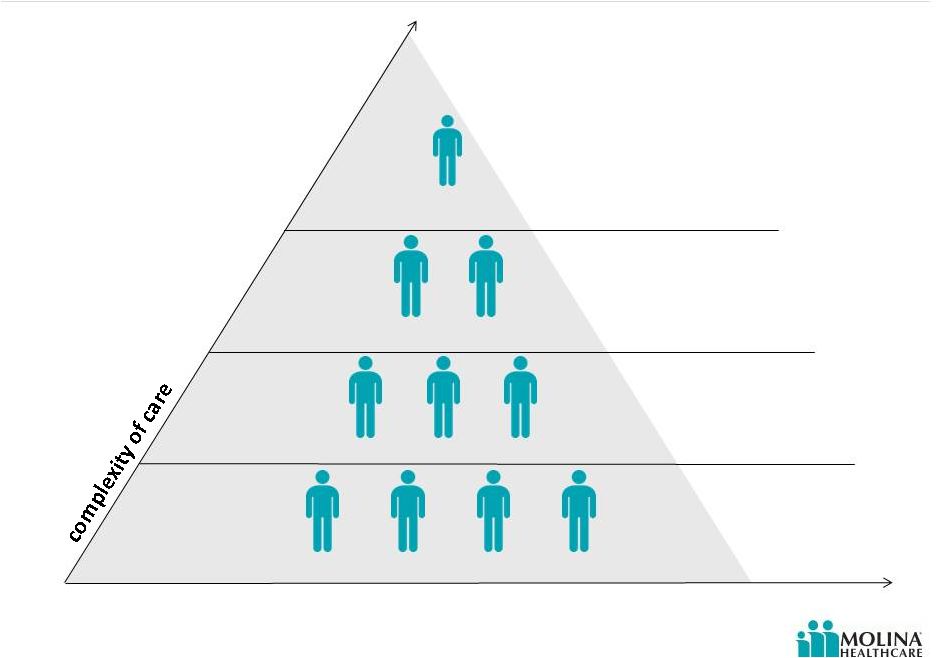 Dual Eligibles – Level of Care Level IV Level III Level II Level I % of potential enrollees 10% 20% 30% 40% At High Risk For Institutionalization Critical Event or Diagnosis Requiring Extensive Medical Care Medium-Risk Chronic Illness Episodic Care – No or Low Risk Factors 44 Please refer to the Company’s cautionary statements. © 2012 Molina Healthcare, Inc. |
 Dual Eligibles Level of Care – Financial Impact Greater portion of duals are categorized as care Level III and Level IV Require home visits Require in-home care manager assessments and visits Increased medical staffing especially for: Care Managers (CM) & Nurse Practitioners (NP) Community Connectors (CC) Services of Medical Directors and Pharmacy Directors also required 45 Please refer to the Company’s cautionary statements. © 2012 Molina Healthcare, Inc. |
 Not All Activities That Improve Healthcare Outcomes Are Equal 46 Fixed Costs Variable Costs Please refer to the Company’s cautionary statements. Utilization Management Quality Mgmt Medical Affairs Service Coordination Nurse Advice Line Other © 2012 Molina Healthcare, Inc. Health Education |
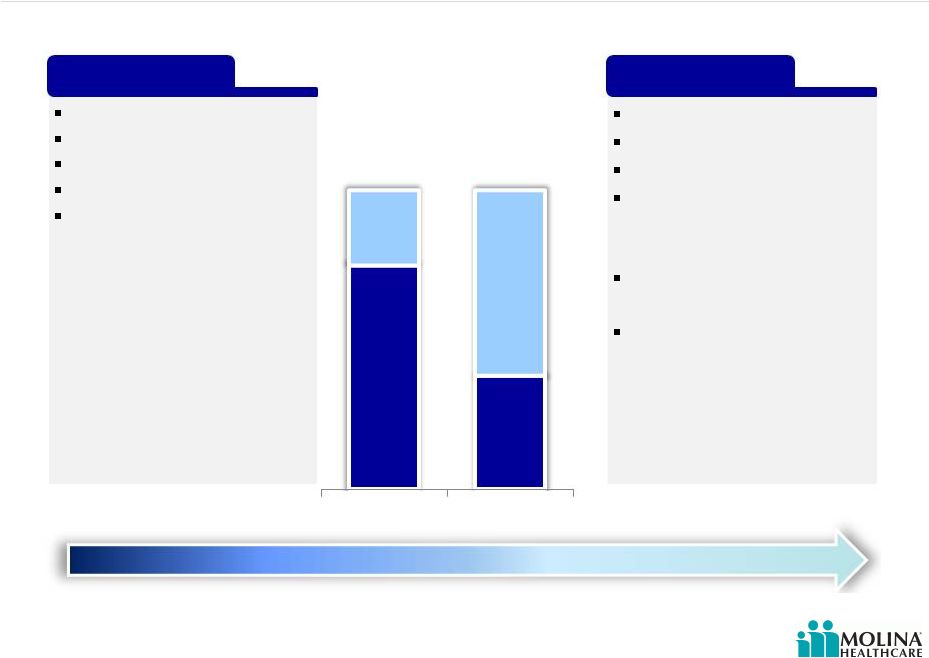
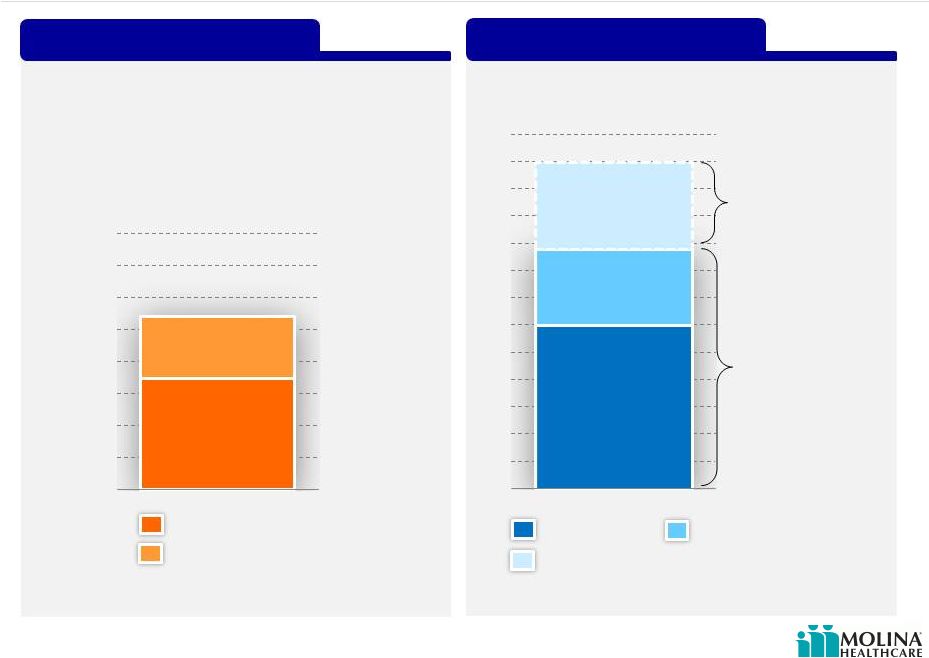
 Estimated Costs of Activities That Improve Healthcare Outcomes 47 As a % of Premium Revenue Per Member Per Month Current Cost Incremental Cost of Dual Eligibles (Model Care) @ $2,500 premium Estimated @ $260 premium as of June 30, 2012 Please refer to the Company’s cautionary statements. $50 $6 2.2% 2.0% Current Dual Eligibles Current Dual Eligibles © 2012 Molina Healthcare, Inc. |
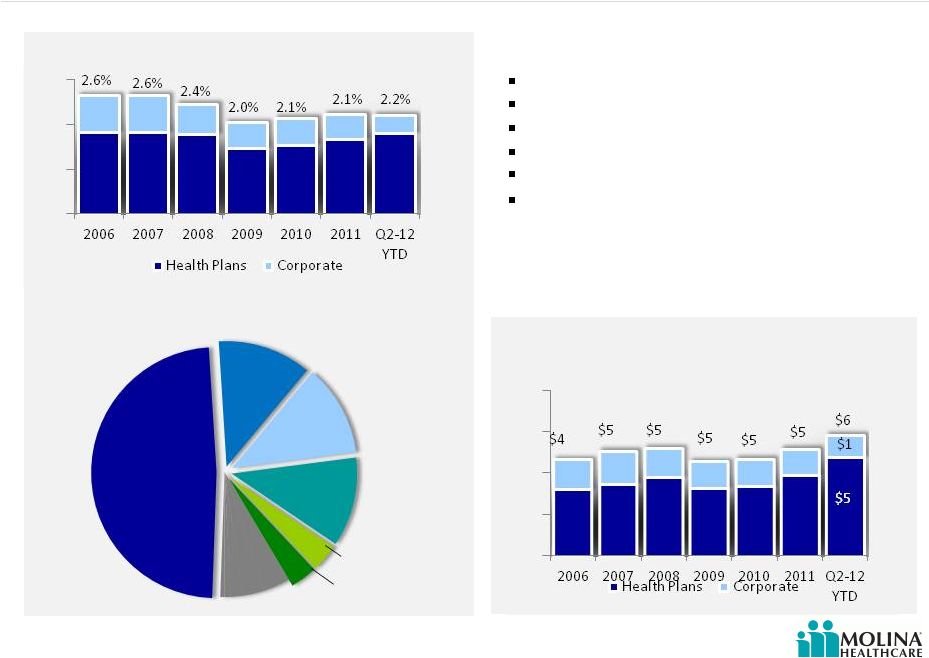
 © 2012 Molina Healthcare, Inc. General & Administrative Costs 48 As a % of Total Revenue Include the following: Per Member Per Month (PMPM) 8.7% 8.6% Cost by Category – YTD 2012 Please refer to the Company’s cautionary statements. $16 $7 IT Claims Executive Finance Provider Services Legal HR Marketing Sales Other Operations 2006 2007 2008 2009 2010 2011 Q2- 12 YTD Health Plans Corporate 8.4% 8.2% 8.0% 7.5% 8.5% 2006 2007 2008 2009 2010 2011 Q2- 12 YTD Health Plans Corporate $14 $16 $17 $17 $19 $21 $23 Claims Information Technology Finance Operations Marketing Provider Services Legal HR Marketing Medicare Sales |
 Not All General & Administrative Costs Are Equal 49 Please refer to the Company’s cautionary statements. IT Claims Executive Finance Provider Services Legal HR Marketing Sales Other Operations Fixed Costs Variable Costs © 2012 Molina Healthcare, Inc. |
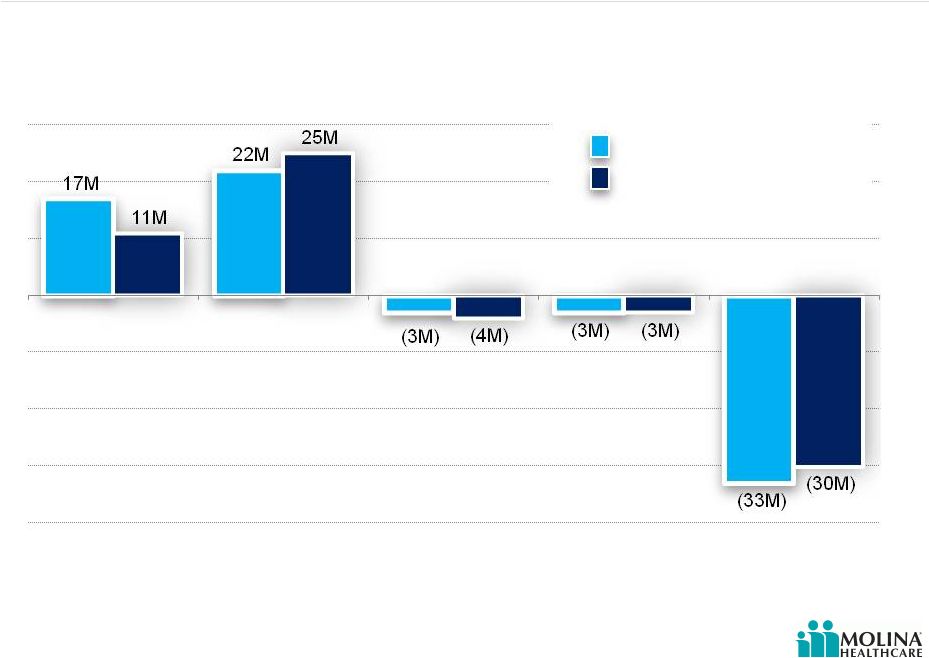
 © 2012 Molina Healthcare, Inc. Long-Term Admin Ratio Goal Below 8% 50 $23 $17 $25 $95 Corporate Subsidiaries G&A Ratio G&A PMPM Corporate Subsidiaries $16 $70 $10 $17 $7 $25 $7 $8 Current Duals ACA Consolidated 6.0% 3.7% 5.8% 5.2% 2.5% 1.3% 4.2% 2.3% Current Duals ACA Consolidated 8.5% 10.0% 7.5% 5.0% |
 Q&A 51 © 2012 Molina Healthcare, Inc. |
 Funding Our Growth John Molina Chief Financial Officer September 19, 2012 New York, New York |
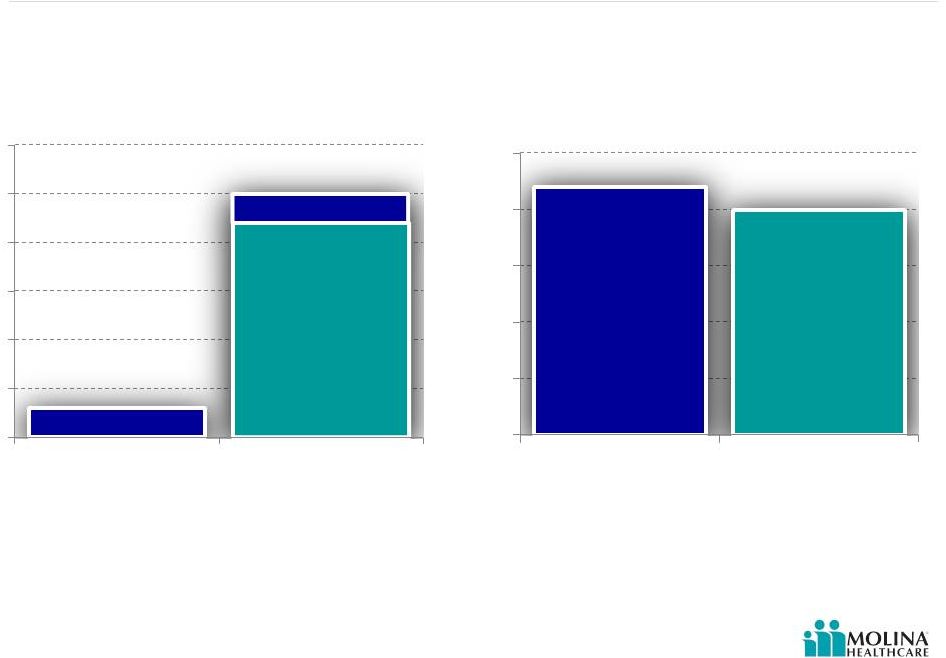
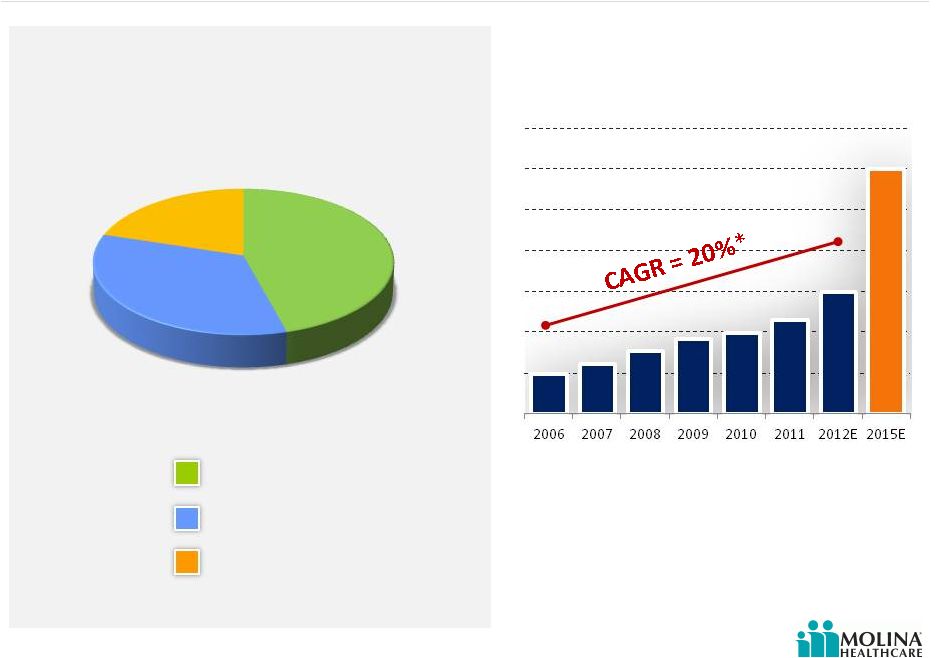 © 2012 Molina Healthcare, Inc. Molina Earnings Have Funded Past Growth 53 Sources of Capital 2006 through 2Q2012 Common Equity Convertible Debt Net Income Source(s): SEC Filings *CAGR calculated from 2006 to 2012E. Please refer to the Company’s cautionary statements. Total Premium Revenue 2006-2011 20% 46% 34% $12B $5B $6B $4B $4B $3B $2B $2B |
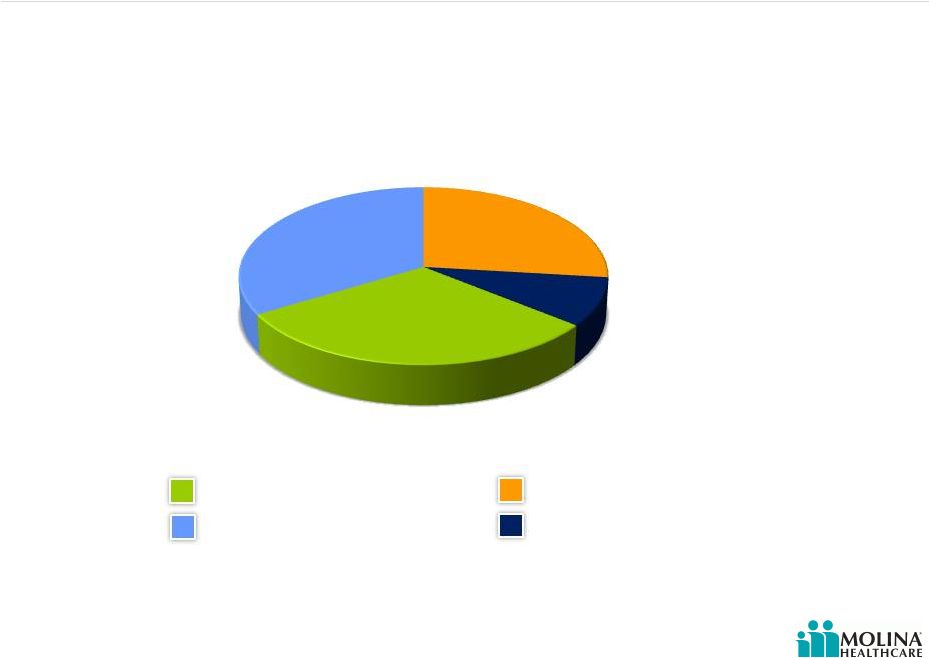 © 2012 Molina Healthcare, Inc. Molina Has Invested to Grow Its Business 54 Cash Paid for Acquisitions Contributions to Subsidiaries Capital Expenditures Share Repurchases Source(s): SEC Filings and Company Data Please refer to the Company’s cautionary statements. Capital Deployment 2006 through 2Q2012 27% 9% 31% 33% |
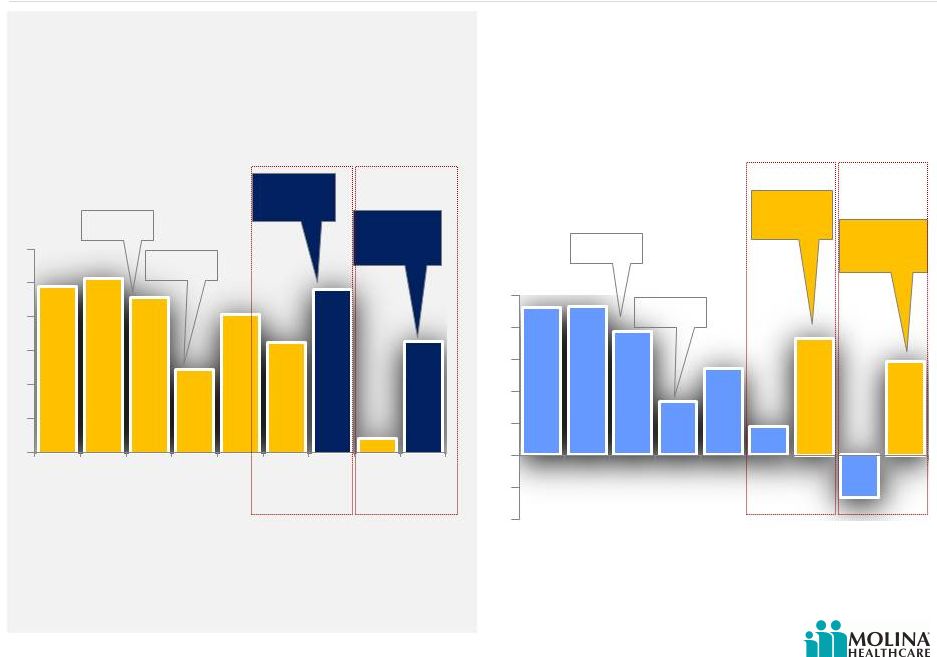 © 2012 Molina Healthcare, Inc. Earnings Margin 2006-1H2012 55 EBITDA MARGIN AFTER TAX MARGIN Please refer to the Company’s cautionary statements. 1. P denotes results excluding Missouri write-down in 2011, and Texas and Missouri operations in 2012 1 1 1 1 2.3% 2.3% 1.9% 0.8% 1.3% 0.4% 1.7% -0.7% 1.5% Excluding Missouri write-down Excluding Missouri write-down Excluding Texas and Missouri Excluding Texas and Missouri H1N1 Flu TX & OH Startup H1N1 Flu TX & OH Startup 4.9% 5.1% 4.6% 2.5% 4.1% 3.2% 4.6% 0.4% 3.3% 2006 2007 2008 2009 2010 2011 2011P 1H12 1H12P 2006 2007 2008 2009 2010 2011 2011P 1H12 1H12P |
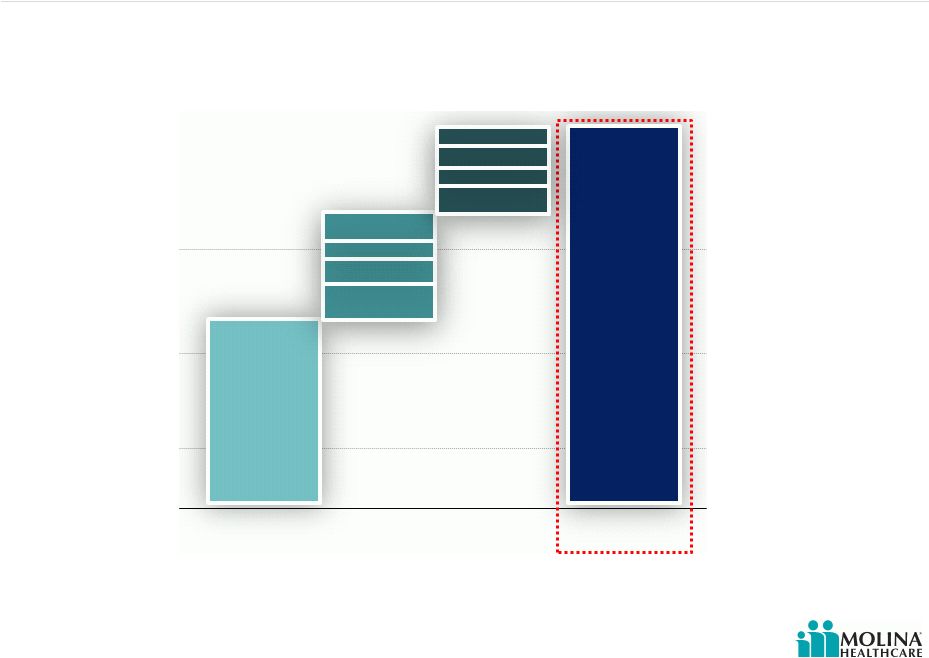
 © 2012 Molina Healthcare, Inc. Estimated regulatory capital at 12/31/12 approximately $0.5B; compared to a requirement of approximately $0.3B. 1. Denotes estimated required regulatory capital for 12.31.12 2. Excess assumes actual regulatory capital as of 6.30.2012 Regulatory Capital Preparing for Growth $0.3B Surplus regulatory capital would contribute to funding growth Current Revenue Growth Capacity with Existing Growth Capacity $0.2B Excess Regulatory Capital Required Regulatory Capital $0.5B Estimated Revenues Requiring additional Regulatory Capital 1. Assumes estimated required regulatory capital for 12.31.12 and actual regulatory capital as of 6.30.2012. Please refer to the Company’s cautionary statements. $6B $2.8B $3.2B Additional regulatory capital ($0.2B); to fund up to $12B of revenue Existing regulatory capital ($0.5B); funds up to $8.8B of revenue $12B 56 2 1 1 1 Regulatory Capital |
 © 2012 Molina Healthcare, Inc. 57 Potential Capital Needs Please refer to the Company’s cautionary statements. Average 7% Required Equity as % of Premium Revenue 2006 - 2Q2012* *Denotes estimated required regulatory capital for 12.31.12 as a percentage of annualized revenue for the six months ended 6.30.12. Source(s): Company Data 2Q2012* Est. Incremental Capital Sensitivity Low Med High Base Revenue $6B $6B $6B Incremental Revenue $3B $4.5B $6B Total Revenue $9B $10.5B $12B After Tax Margin 1.5% 1.5% 1.5% Avg. Incremental Cap Requirement (%) 7.0% 7.0% 7.0% Incremental Cap Requirement ($) ($210M) ($315M) ($420M) Pro-forma Net Income @ 1.5% $135M $158M $180M Estimated 2012 Excess Capacity $200M $200M $200M Capital Need $0M $0M $40M 7.9% 8.1% 6.8% 7.0% 7.0% 5.8% 6.1% 0% 2% 4% 6% 8% 10% 2011 2010 2009 2008 2007 2006 |
 © 2012 Molina Healthcare, Inc. Earnings Margin 2006-1H2012 58 EBITDA MARGIN AFTER TAX MARGIN Please refer to the Company’s cautionary statements. 1. P denotes results excluding Missouri write-down in 2011, and Texas and Missouri operations in 2012 |
 Why We Might Want To Raise Capital? Acquisitions Convertible debt repayment in 2014 Capital expenditures Variability in profitability Timing New benefits Growth above expectations Desire for capital cushion (e.g. debt covenant and rating agencies) Excluded duals in WA and potential FL & TX ACA Medicaid expansion Regulatory capital in excess of minimum requirements Regulatory requirements in advance of premium receipts 59 Please refer to the Company’s cautionary statements. © 2012 Molina Healthcare, Inc. |
 Investment Highlights 60 Attractive sector growth prospects driven by government policies and economic conditions Proven flexible health care services portfolio (risk- based, fee-based and direct delivery) Diversified geographic exposure with significant presence in high growth regions Focus on government-sponsored health care programs Seasoned management team with strong track record of delivering earnings growth Over 30 years of experience Please refer to the Company’s cautionary statements. © 2012 Molina Healthcare, Inc. |
 Q&A 61 © 2012 Molina Healthcare, Inc. |