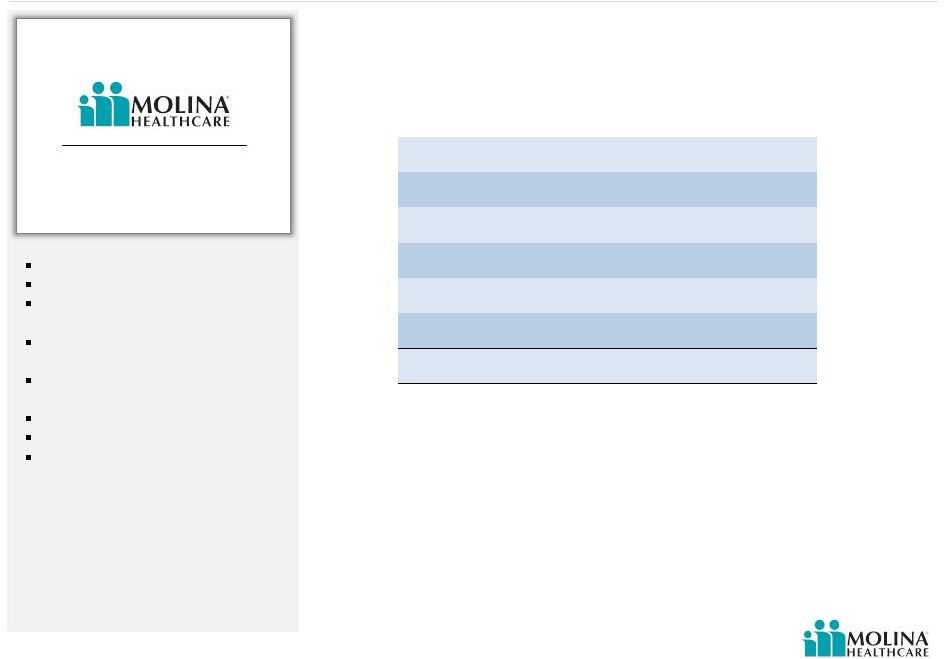
Free signup for more
- Track your favorite companies
- Receive email alerts for new filings
- Personalized dashboard of news and more
- Access all data and search results
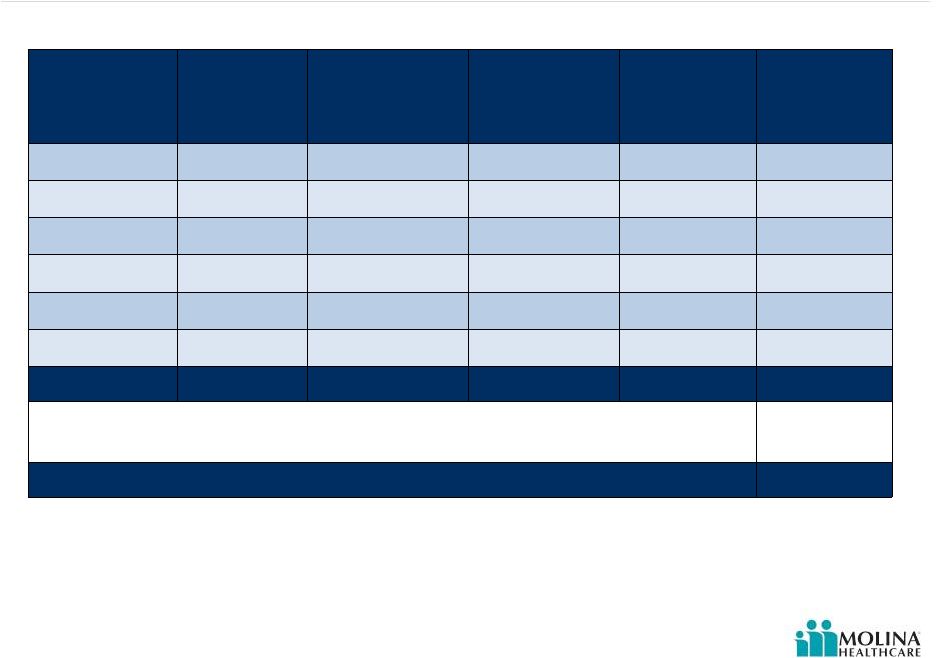
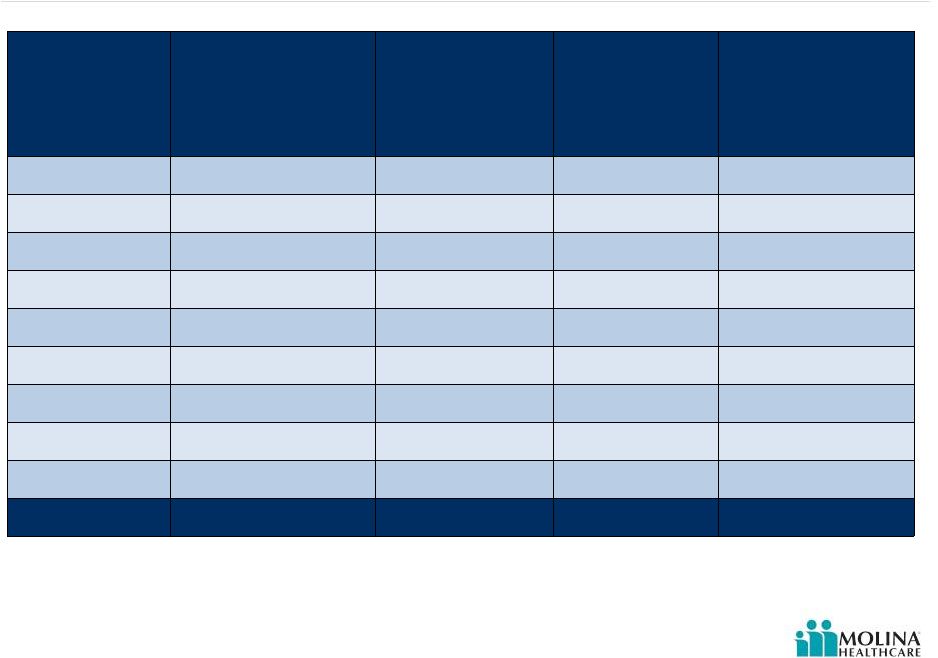
Filing tables
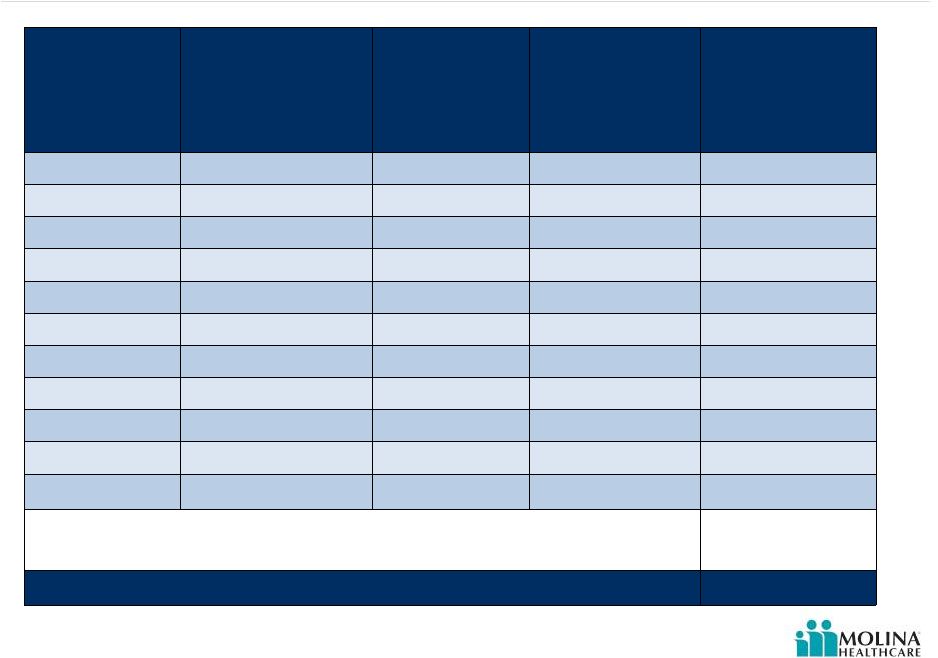
Filing exhibits
MOH similar filings
- 6 May 13 Submission of Matters to a Vote of Security Holders
- 25 Apr 13 Results of Operations and Financial Condition
- 11 Mar 13 Departure of Directors or Certain Officers
- 21 Feb 13 Molina Healthcare Updates Fiscal Year 2013 Guidance
- 15 Feb 13 Entry into a Material Definitive Agreement
- 12 Feb 13 Molina Healthcare, Inc. Announces Pricing of
- 11 Feb 13 Molina Healthcare of New Mexico
Filing view
External links