Q4 FY19 Earnings Call August 6, 2019

Safe Harbor FORWARD LOOKING STATEMENTS This presentation contains forward-looking statements within the meaning of the Private Securities Litigation Report Act of 1995, which are provided under the protection of the safe harbor for forward-looking statements provided by that Act. For example, statements in this presentation regarding CSI’s growth, future financial measurements, product development and introductions (including the timing thereof), clinical trials (including the timing thereof), international expansion, the timing of manufacturing transfer of the WIRION system, product benefits, and market opportunities, are forward-looking statements. These statements involve risks and uncertainties that could cause results differ materially from those projected, including, but not limited to, those described in CSI’s filings with the Securities and Exchange Commission, including its most recent annual report on Form 10-K and subsequent quarterly and annual reports. CSI encourages you to consider all of these risks, uncertainties and other factors carefully in evaluating the forward-looking statements contained in this presentation. As a result of these matters, changes in facts, assumptions not being realized or other circumstances, CSI’s actual results may differ materially from the expected results discussed in the forward-looking statements contained in this presentation. The forward-looking statements contained in this presentation are made only as of the date of this presentation, and CSI undertakes no obligation to update them to reflect subsequent events or circumstances. FINANCIAL INFORMATION This presentation includes calculations or figures that have been prepared internally and have not been reviewed or audited by CSI’s independent registered accounting firm. Use of different methods for preparing, calculating or presenting information may lead to differences, which may be material. In addition, this presentation also includes certain non-GAAP financial measures, such as Adjusted EBITDA. Reconciliations of the non-GAAP financial measures used in this presentation to the most comparable U.S. GAAP measures for the respective periods can be found in tables in the appendix to this presentation. Non-GAAP financial measures have limitations as analytical tools and should not be considered in isolation or as a substitute for CSI's financial results prepared in accordance with GAAP.

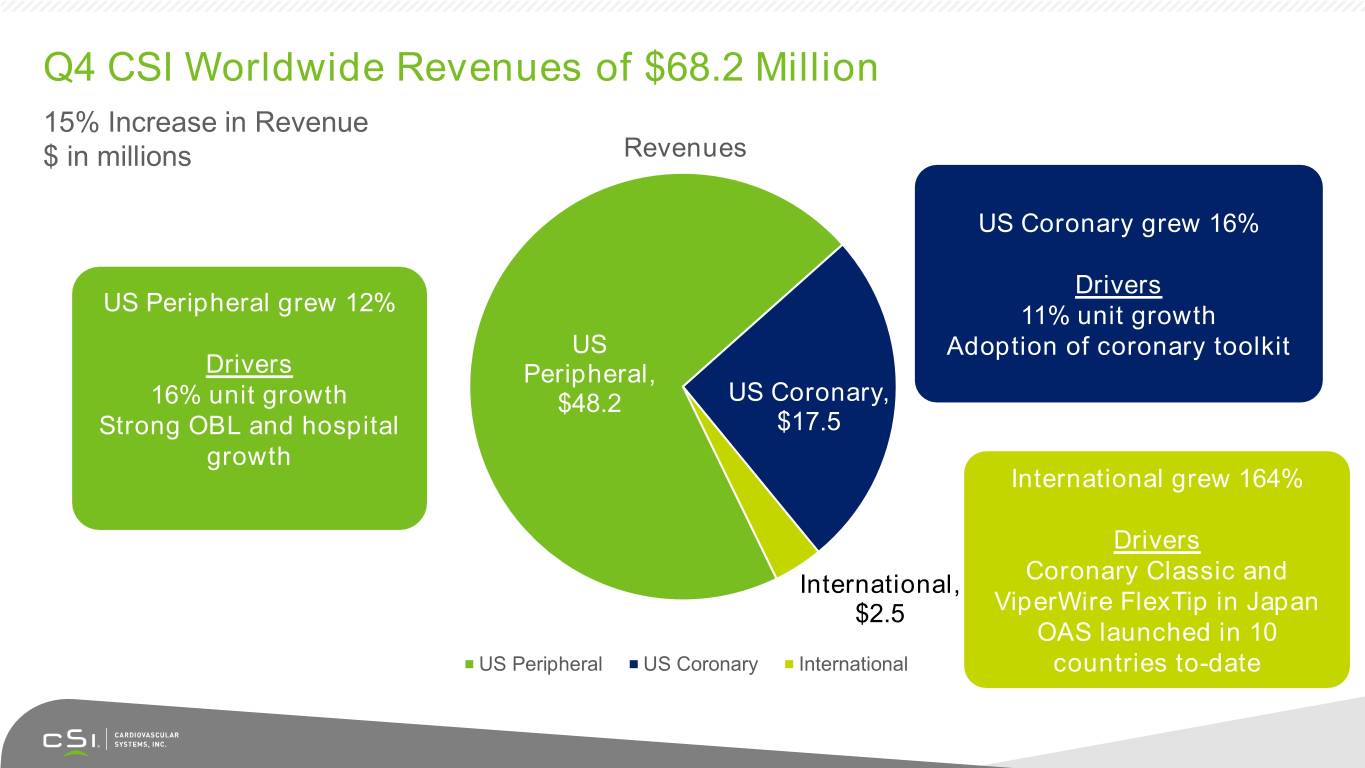
Q4 CSI Worldwide Revenues of $68.2 Million 15% Increase in Revenue $ in millions Revenues US Coronary grew 16% Drivers US Peripheral grew 12% 11% unit growth US Adoption of coronary toolkit Drivers Peripheral, 16% unit growth $48.2 US Coronary, Strong OBL and hospital $17.5 growth International grew 164% Drivers Coronary Classic and International, $2.5 ViperWire FlexTip in Japan OAS launched in 10 US Peripheral US Coronary International countries to-date

Q4 FY19 Financial Results ($ in millions) Worldwide Peripheral Revenue Worldwide Coronary Revenue $48.3 $45.2 $20.0 $43.1 $44.2 $41.2 $18.2 $16.1 $16.0 $15.0 Q4 FY18 Q1 FY19 Q2 FY19 Q3 FY19 Q4 FY19 Q4 FY18 Q1 FY19 Q2 FY19 Q3 FY19 Q4 FY19 Gross Margin Cash and Marketable Securities 81.7% 81.2% 80.9% 80.8% 80.3% $122.7 $116.8 $113.9 $119.2 $115.7 Q4 FY18 Q1 FY19 Q2 FY19 Q3 FY19 Q4 FY19 Q4 FY18 Q1 FY19 Q2 FY19 Q3 FY19 Q4 FY19

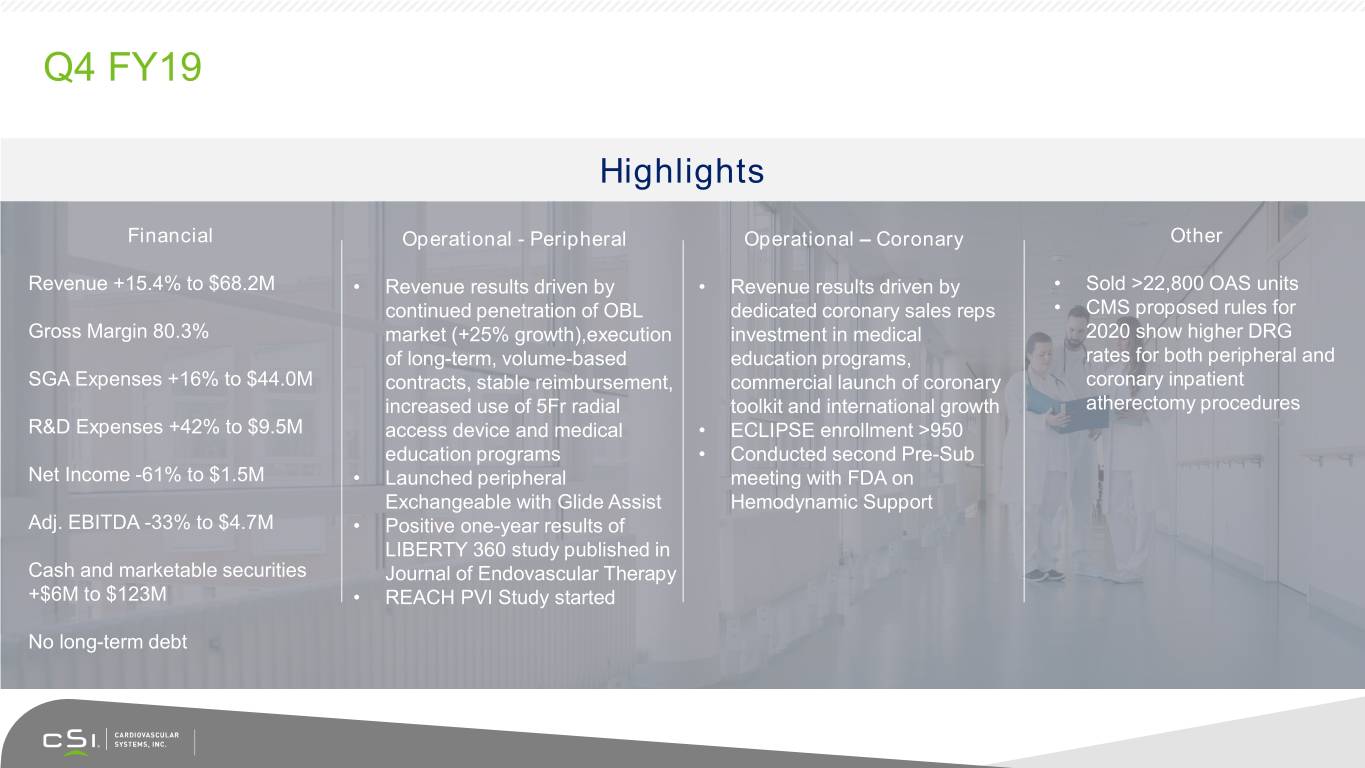
Q4 FY19 Highlights Financial Operational - Peripheral Operational – Coronary Other Revenue +15.4% to $68.2M • Revenue results driven by • Revenue results driven by • Sold >22,800 OAS units continued penetration of OBL dedicated coronary sales reps • CMS proposed rules for Gross Margin 80.3% market (+25% growth),execution investment in medical 2020 show higher DRG of long-term, volume-based education programs, rates for both peripheral and SGA Expenses +16% to $44.0M contracts, stable reimbursement, commercial launch of coronary coronary inpatient increased use of 5Fr radial toolkit and international growth atherectomy procedures R&D Expenses +42% to $9.5M access device and medical • ECLIPSE enrollment >950 education programs • Conducted second Pre-Sub Net Income -61% to $1.5M • Launched peripheral meeting with FDA on Exchangeable with Glide Assist Hemodynamic Support Adj. EBITDA -33% to $4.7M • Positive one-year results of LIBERTY 360 study published in Cash and marketable securities Journal of Endovascular Therapy +$6M to $123M • REACH PVI Study started No long-term debt

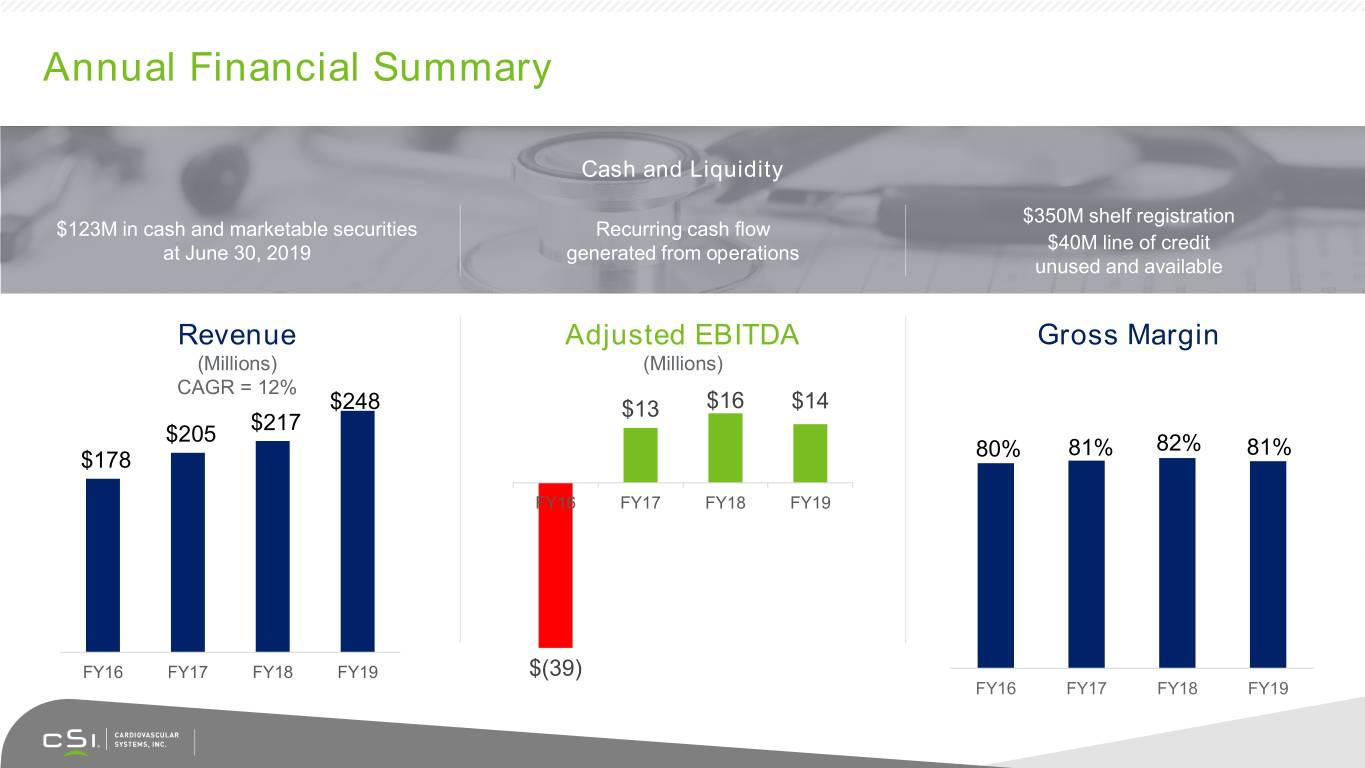
Annual Financial Summary Cash and Liquidity $350M shelf registration $123M in cash and marketable securities Recurring cash flow $40M line of credit at June 30, 2019 generated from operations unused and available Revenue Adjusted EBITDA Gross Margin (Millions) (Millions) CAGR = 12% $248 $13 $16 $14 $217 $205 81% 82% 81% $178 80% FY16 FY17 FY18 FY19 FY16 FY17 FY18 FY19 $(39) FY16 FY17 FY18 FY19

Key Events & Milestones FY19A FY20E FY21E Sold 80,650 OAS WIRION acquisition • Hemodynamic support - First in Human International revenue = $7.9M • LIBERTY 360 3-Year Data • International revenue = $15-$17.5M Launched OAS in SE Asia, Europe • Launch OAS in up to 10 new countries • Launch OAS in Canada and other and Middle East • Certify >120 international physicians countries Certified 120 OUS physicians • International revenue = $10M-$11M • Japan peripheral first enrollment Launched Classic Crown and • New product launches: • ECLIPSE enrollment complete ViperWire FlexTip in Japan • PAD Exchangeable full market release • REACH PVI data release New product revenue = $3.9 million • PAD Next Gen OAS with GlideAssist • US IDE Small Vessel first enrollment Launched Teleport Microcatheter • PAD JADE angioplasty balloons • Manufacturing transfer of WIRION Launched ViperCath XC • PAD radial guidewire • WIRION launch in U.S. Launched Peripheral Viperwire with • PAD radial sheath • CAD ScoreFlex NC in U.S. FlexTip • CAD Nitinol ViperWire FlexTip Radial full market release • Sapphire 1.0mm over-the-wire Exchangeable limited market release • Sapphire NC Plus 4.5-5.0mm 81% consolidated gross margin • REACH PVI enrollment completion Enrolled first patient in REACH PVI • ECLIPSE enrollment reaches 1500 Enrollment of ECLIPSE passes 950 Pre-submission meetings with FDA for hemodynamic support Completed $350M shelf filing

WIRIONTM Embolic Protection System Acquisition • WIRION has CE Mark and FDA clearance as a distal embolic protection filter used to protect a patient’s lower extremities from distal embolization that can occur during PVI • WISE LE showed the device is safe and non-inferior to the pre-specified performance goal in capturing debris in the vast majority of patients with a low adverse event rate • WIRION is significantly easier to use and more versatile than competing EPDs with clearance for use with any peripheral atherectomy device and any .014” guidewire • Reimbursement is included within existing atherectomy codes

FY20 Guidance For fiscal 2020 ending June 30, 2020, CSI anticipates: • Revenue in a range of $278 million to $283 million • Gross profit margin of 79% to 80%; • Net income (loss) of approximately breakeven*; and • Positive Adjusted EBITDA * Excluding intangible asset amortization and direct expenses associated with the WIRION acquisition

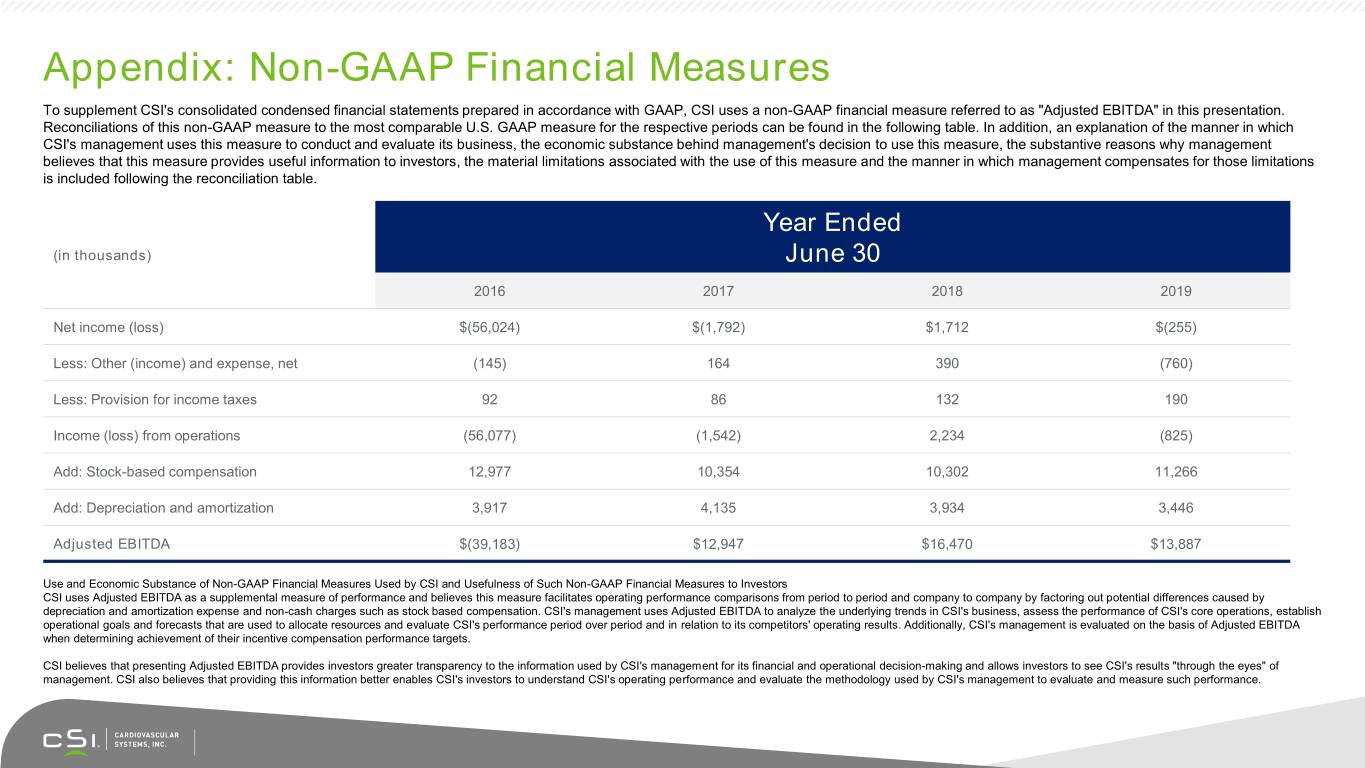
Appendix: Non-GAAP Financial Measures To supplement CSI's consolidated condensed financial statements prepared in accordance with GAAP, CSI uses a non-GAAP financial measure referred to as "Adjusted EBITDA" in this presentation. Reconciliations of this non-GAAP measure to the most comparable U.S. GAAP measure for the respective periods can be found in the following table. In addition, an explanation of the manner in which CSI's management uses this measure to conduct and evaluate its business, the economic substance behind management's decision to use this measure, the substantive reasons why management believes that this measure provides useful information to investors, the material limitations associated with the use of this measure and the manner in which management compensates for those limitations is included following the reconciliation table. Year Ended (in thousands) June 30 2016 2017 2018 2019 Net income (loss) $(56,024) $(1,792) $1,712 $(255) Less: Other (income) and expense, net (145) 164 390 (760) Less: Provision for income taxes 92 86 132 190 Income (loss) from operations (56,077) (1,542) 2,234 (825) Add: Stock-based compensation 12,977 10,354 10,302 11,266 Add: Depreciation and amortization 3,917 4,135 3,934 3,446 Adjusted EBITDA $(39,183) $12,947 $16,470 $13,887 Use and Economic Substance of Non-GAAP Financial Measures Used by CSI and Usefulness of Such Non-GAAP Financial Measures to Investors CSI uses Adjusted EBITDA as a supplemental measure of performance and believes this measure facilitates operating performance comparisons from period to period and company to company by factoring out potential differences caused by depreciation and amortization expense and non-cash charges such as stock based compensation. CSI's management uses Adjusted EBITDA to analyze the underlying trends in CSI's business, assess the performance of CSI's core operations, establish operational goals and forecasts that are used to allocate resources and evaluate CSI's performance period over period and in relation to its competitors' operating results. Additionally, CSI's management is evaluated on the basis of Adjusted EBITDA when determining achievement of their incentive compensation performance targets. CSI believes that presenting Adjusted EBITDA provides investors greater transparency to the information used by CSI's management for its financial and operational decision-making and allows investors to see CSI's results "through the eyes" of management. CSI also believes that providing this information better enables CSI's investors to understand CSI's operating performance and evaluate the methodology used by CSI's management to evaluate and measure such performance.

Appendix: Non-GAAP Financial Measures The following is an explanation of each of the items that management excluded from Adjusted EBITDA and the reasons for excluding each of these individual items: -- Stock-based compensation. CSI excludes stock-based compensation expense from its non-GAAP financial measures primarily because such expense, while constituting an ongoing and recurring expense, is not an expense that requires cash settlement. CSI's management also believes that excluding this item from CSI's non-GAAP results is useful to investors to understand the application of stock- based compensation guidance and its impact on CSI's operational performance, liquidity and its ability to make additional investments in the company, and it allows for greater transparency to certain line items in CSI's financial statements. -- Depreciation and amortization expense. CSI excludes depreciation and amortization expense from its non-GAAP financial measures primarily because such expenses, while constituting ongoing and recurring expenses, are not expenses that require cash settlement and are not used by CSI's management to assess the core profitability of CSI's business operations. CSI's management also believes that excluding these items from CSI's non-GAAP results is useful to investors to understand CSI's operational performance, liquidity and its ability to make additional investments in the company. Material Limitations Associated with the Use of Non-GAAP Financial Measures and Manner in which CSI Compensates for these Limitations Non-GAAP financial measures have limitations as analytical tools and should not be considered in isolation or as a substitute for CSI's financial results prepared in accordance with GAAP. Some of the limitations associated with CSI's use of these non-GAAP financial measures are: -- Items such as stock-based compensation do not directly affect CSI's cash flow position; however, such items reflect economic costs to CSI and are not reflected in CSI's "Adjusted EBITDA" and therefore these non-GAAP measures do not reflect the full economic effect of these items. -- Non-GAAP financial measures are not based on any comprehensive set of accounting rules or principles and therefore other companies may calculate similarly titled non-GAAP financial measures differently than CSI, limiting the usefulness of those measures for comparative purposes. -- CSI's management exercises judgment in determining which types of charges or other items should be excluded from the non-GAAP financial measures CSI uses. CSI compensates for these limitations by relying primarily upon its GAAP results and using non-GAAP financial measures only supplementally. CSI provides full disclosure of each non-GAAP financial measure. -- CSI uses and detailed reconciliations of each non-GAAP measure to its most directly comparable GAAP measure. CSI encourages investors to review these reconciliations. CSI qualifies its use of non- GAAP financial measures with cautionary statements as set forth above.

NASDAQ: CSII Investor Contact: Jack Nielsen 651-202-4919 j.nielsen@csi360.com CSI®, Diamondback®, Diamondback 360®, GlideAssist®, ViperWire® and ViperWire Advance® are trademarks of Cardiovascular Systems, Inc. © 2019 Cardiovascular Systems, Inc. Sapphire® and OrbusNeich® are trademarks of OrbusNeich Medical, Inc. www.csi360.com


