UNITED STATES
SECURITIES AND EXCHANGE COMMISSION
Washington, D.C. 20549
FORM N-CSR
CERTIFIED SHAREHOLDER REPORT OF REGISTERED MANAGEMENT INVESTMENT COMPANIES
Investment Company Act file number: 811-21184
Name of Fund: BlackRock Florida Municipal 2020 Term Trust (BFO)
Fund Address: 100 Bellevue Parkway, Wilmington, DE 19809
Name and address of agent for service: John M. Perlowski, Chief Executive Officer, BlackRock Florida Municipal 2020 Term Trust, 55 East 52nd Street, New York, NY 10055
Registrant’s telephone number, including area code: (800) 882-0052, Option 4
Date of fiscal year end: 07/31/2014
Date of reporting period: 07/31/2014
Item 1 – Report to Stockholders
| ANNUAL REPORT |  |
Not FDIC Insured • May Lose Value • No Bank Guarantee |
Table of Contents
| Page | ||||||
Shareholder Letter | 3 | |||||
Annual Report: | ||||||
Municipal Market Overview | 4 | |||||
The Benefits and Risks of Leveraging | 5 | |||||
Derivative Financial Instruments | 5 | |||||
Trust Summaries | 6 | |||||
Financial Statements: | ||||||
Schedules of Investments | 18 | |||||
Statements of Assets and Liabilities | 46 | |||||
Statements of Operations | 47 | |||||
Statements of Changes in Net Assets | 48 | |||||
Statements of Cash Flows | 50 | |||||
Financial Highlights | 51 | |||||
Notes to Financial Statements | 57 | |||||
Report of Independent Registered Public Accounting Firm | 71 | |||||
Disclosure of Investment Advisory Agreements | 72 | |||||
Automatic Dividend Reinvestment Plans | 76 | |||||
Officers and Trustees | 77 | |||||
Additional Information | 80 |
| 2 | ANNUAL REPORT | JULY 31, 2014 |
| Shareholder Letter |
Dear Shareholder,
The latter part of 2013 was a strong period for equities and other risk assets such as high yield bonds, despite the mixed tone of economic and financial news and uncertainty as to when and by how much the U.S. Federal Reserve would begin to gradually reduce (or “taper”) its asset purchase programs. Stock markets rallied in September when the Fed defied investors’ expectations with its decision to delay tapering. The momentum was disrupted temporarily, however, when the U.S. debt ceiling debate led to a partial government shutdown, roiling financial markets globally until a compromise was struck in mid-October. The remainder of 2013 was generally positive for developed market stocks, while fixed income and emerging market investments struggled as Fed tapering became increasingly imminent. When the central bank ultimately announced its tapering plans in mid-December, equity investors reacted positively, as this action signaled the Fed’s perception of real improvement in the economy.
Most asset classes continued to move higher in 2014 despite the pull back in Fed stimulus. The year got off to a rocky start, however. A number of emerging economies showed signs of financial stress while facing the broader headwind of diminishing global liquidity. These risks, combined with disappointing U.S. economic data, caused equities to decline in January while bond markets found renewed strength from investors seeking relatively safer assets.
Although these headwinds persisted, equities were back on the rise in February as investors were encouraged by a one-year extension of the U.S. debt ceiling and market-friendly comments from the new Fed Chairwoman, Janet Yellen. While it was clear that U.S. economic data had softened, investors were assuaged by increasing evidence that the trend was temporary and weather-related, and continued to take on risk given expectations that growth would pick up later in the year.
In the months that followed, interest rates trended lower and bond prices climbed higher in the modest growth environment. Financial markets exhibited a remarkably low level of volatility despite rising geopolitical risks and mixed global economic news. Tensions in Russia and Ukraine and signs of decelerating growth in China caused some turbulence, but markets were resilient as investors focused on signs of improvement in the U.S. recovery, stronger corporate earnings and increased merger-and-acquisition activity. Importantly, investors were comforted by comments from the Fed offering reassurance that no changes to short-term interest rates were on the horizon.
In the low-rate environment, investors looked to equities as a source of yield, pushing major indices to record highs. As stock prices moved higher, investors soon became wary of stretched valuations and a new theme emerged in the markets. Stocks that had experienced significant price appreciation in 2013, particularly growth and momentum names, broadly declined as investors fled to stocks with cheaper valuations. This rotation resulted in the strongest performers of 2013 struggling most in 2014, and vice versa. Especially hard hit were U.S. small cap and European stocks where earnings growth had not kept pace with recent market gains. In contrast, emerging market stocks benefited from the trend. As a number of developing countries took steps to stabilize their finances, investors looked past political risks — hardly batting an eye at a military coup in Thailand — and poured back into these attractively priced investments.
Asset prices tend to be more vulnerable to bad news when investors believe valuations are stretched. Consequently, markets came under pressure in July as geopolitical tensions intensified with the tragic downing of a Malaysian civilian airliner over Ukraine, the continued fragmentation of Iraq and a ground war between Israel and Hamas in Gaza. As the period came to a close, financial troubles in Argentina and Portugal as well as new U.S. and European sanctions on Russia were additional headwinds for the markets.
Despite a host of challenges, most asset classes generated solid returns for the six- and 12-month periods ended July 31, 2014, with equities generally outperforming fixed income. Emerging market equities delivered impressive gains. Developed markets also performed well, although small cap stocks lagged due to relatively higher valuations. Most fixed income assets produced positive returns even as the Fed reduced its open-market purchases. Tax-exempt municipal bonds benefited from a favorable supply-and-demand environment. Short-term interest rates remained near zero, keeping yields on money market securities close to historic lows.
At BlackRock, we believe investors need to think globally, extend their scope across a broad array of asset classes and be prepared to move freely as market conditions change over time. We encourage you to talk with your financial advisor and visit blackrock.com for further insight about investing in today’s world.
Sincerely,

President, BlackRock Advisors, LLC
 |
| Asset prices pushed higher over the period despite modest global growth, geopolitical risks and a shift toward tighter U.S. monetary policy. |
President, BlackRock Advisors, LLC
Total Returns as of July 31, 2014
| 6-month | 12-month | |||||||
U.S. large cap equities (S&P 500® Index) | 9.44 | % | 16.94 | % | ||||
U.S. small cap equities (Russell 2000® Index) | (0.30 | ) | 8.56 | |||||
| International equities (MSCI Europe, Australasia, Far East Index) | 7.03 | 15.07 | ||||||
| Emerging market equities (MSCI Emerging Markets Index) | 15.70 | 15.32 | ||||||
| 3-month Treasury bill (BofA Merrill Lynch 3-Month U.S. Treasury Bill Index) | 0.02 | 0.05 | ||||||
| U.S. Treasury securities (BofA Merrill Lynch 10-Year U.S. Treasury Index) | 2.71 | 3.50 | ||||||
| U.S. investment grade bonds (Barclays U.S. Aggregate Bond Index) | 2.16 | 3.97 | ||||||
| Tax-exempt municipal bonds (S&P Municipal Bond Index) | 4.11 | 7.38 | ||||||
| U.S. high yield bonds (Barclays U.S. Corporate High Yield 2% Issuer Capped Index) | 3.33 | 8.18 | ||||||
THIS PAGE NOT PART OF YOUR FUND REPORT | 3 |
| Municipal Market Overview |
For the Reporting Period Ended July 31, 2014
High levels of interest rate volatility in the latter half of 2013, particularly on the long-end of the curve, resulted in a curtailment of tax-exempt issuance during the period. However, from a historical perspective, total new issuance for the 12 months ended July 31 remained relatively strong at $303 billion (but meaningfully lower than the $364 billion issued in the prior 12-month period). A noteworthy portion of new supply during this period was attributable to refinancing activity (roughly 40%) as issuers took advantage of lower interest rates to reduce their borrowing costs. | S&P Municipal Bond Index Total Returns as of July 31, 2014 | |
| 6 months: | 4.11% | |
| 12 months: | 7.38% | |

| 4 | ANNUAL REPORT | JULY 31, 2014 |
| The Benefits and Risks of Leveraging | |
| ANNUAL REPORT | JULY 31, 2014 | 5 |
| Trust Summary as of July 31, 2014 | BlackRock California Municipal Income Trust |
Trust Overview
Performance
• | For the 12-month period ended July 31, 2014, the Trust returned 12.80% based on market price and 16.48% based on NAV. For the same period, the closed-end Lipper California Municipal Debt Funds category posted an average return of 15.36% based on market price and 15.42% based on NAV. All returns reflect reinvestment of dividends. The Trust’s discount to NAV, which widened during the period, accounts for the difference between performance based on price and performance based on NAV. The following discussion relates to performance based on NAV. |
• | Tax-exempt rates declined during the period, supporting generally positive performance for municipal bonds. (Bond prices rise when rates fall.) Municipal bonds with longer durations (and greater sensitivity to interest rate movements) tended to provide the strongest returns. In this environment, the Trust’s exposure to the long end of the yield curve had a positive impact on performance. Security selection also helped performance, particularly with respect to the Trust’s holdings of high quality school district issues, which performed well amid the improvement in the State of California’s finances. The Trust’s holdings in the health care, transportation and utilities sectors also added to returns. The Trust’s use of tender option bonds amplified the positive effect of falling rates on performance. |
• | The Trust’s cash reserves were generally maintained at a minimal level. However, to the extent reserves were held, the cash holdings added little in the form of additional yield and provided no price appreciation in a generally positive period for the municipal market. |
| The views expressed reflect the opinions of BlackRock as of the date of this report and are subject to change based on changes in market, economic or other conditions. These views are not intended to be a forecast of future events and are no guarantee of future results. |
Trust Information
Symbol on New York Stock Exchange (“NYSE”) | BFZ | |||||
Initial Offering Date | July 27, 2001 | |||||
Yield on Closing Market Price as of July 31, 2014 ($14.41)1 | 6.01% | |||||
Tax Equivalent Yield2 | 12.25% | |||||
Current Monthly Distribution per Common Share3 | $0.0722 | |||||
Current Annualized Distribution per Common Share3 | $0.8664 | |||||
Economic Leverage as of July 31, 20144 | 36% | |||||
| 1 | Yield on closing market price is calculated by dividing the current annualized distribution per share by the closing market price. Past performance does not guarantee future results. |
| 2 | Tax equivalent yield assumes the maximum marginal federal and state tax rate of 50.93%, which includes the 3.8% Medicare tax. Actual tax rates will vary based on income, exemptions and deductions. Lower taxes will result in lower tax equivalent yields. |
| 3 | The distribution rate is not constant and is subject to change. |
| 4 | Represents VMTP Shares and TOBs as a percentage of total managed assets, which is the total assets of the Trust, including any assets attributable to VMTP Shares and TOBs, minus the sum of accrued liabilities. For a discussion of leveraging techniques utilized by the Trust, please see The Benefits and Risks of Leveraging on page 5. |
| 6 | ANNUAL REPORT | JULY 31, 2014 |
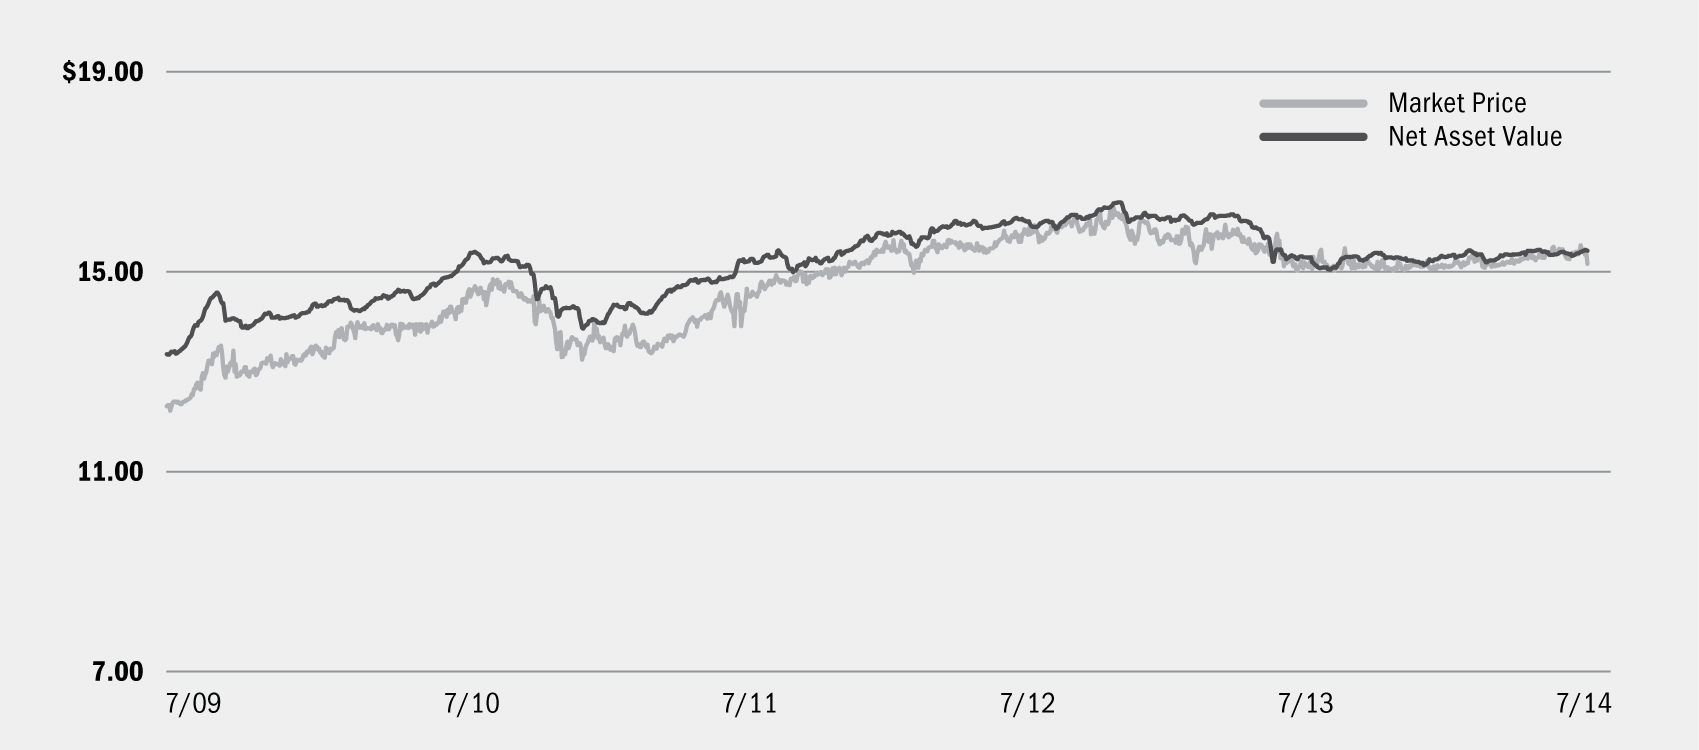
| BlackRock California Municipal Income Trust |
Market Price and Net Asset Value Per Share Summary
| | 7/31/14 | | 7/31/13 | | Change | | High | | Low | |||||||||||||
Market Price | $ | 14.41 | $ | 13.63 | 5.72 | % | $ | 15.18 | $ | 13.02 | ||||||||||||
Net Asset Value | $ | 15.83 | $ | 14.50 | 9.17 | % | $ | 15.92 | $ | 13.94 | ||||||||||||
Market Price and Net Asset Value History For the Past Five Years |

Overview of the Trust’s Long-Term Investments
| Sector Allocation | | 7/31/14 | | 7/31/13 | ||||||
County/City/Special District/School District | 33 | % | 35 | % | ||||||
Utilities | 31 | 29 | ||||||||
Health | 11 | 11 | ||||||||
State | 8 | 5 | ||||||||
Education | 8 | 10 | ||||||||
Transportation | 7 | 9 | ||||||||
Housing | 1 | 1 | ||||||||
Corporate | 1 | — | ||||||||
| For Trust compliance purposes, the Trust’s sector classifications refer to any one or more of the sector sub-classifications used by one or more widely recognized market indexes or rating group indexes, and/or as defined by the investment advisor. These definitions may not apply for purposes of this report, which may combine such sector sub-classifications for reporting ease. |
| Call/Maturity Schedule3 | ||||||||
Calendar Year Ended December 31, | ||||||||
2014 | 1 | % | ||||||
2015 | 2 | |||||||
2016 | 3 | |||||||
2017 | 10 | |||||||
2018 | 20 | |||||||
| 3 | Scheduled maturity dates and/or bonds that are subject to potential calls by issuers over the next five years. |
| Credit Quality Allocation1 | | 7/31/14 | | 7/31/13 | ||||||
AAA/Aaa | 11 | % | 9 | % | ||||||
AA/Aa | 71 | 72 | ||||||||
A | 18 | 19 | ||||||||
BBB/Baa | — | 2 | — | |||||||
| 1 | For financial reporting purposes, credit quality ratings shown above reflect the highest rating assigned by either Standard & Poor’s (“S&P”) or Moody’s Investors Service (“Moody’s”) if ratings differ. These rating agencies are independent, nationally recognized statistical rating organizations and are widely used. Investment grade ratings are credit ratings of BBB/Baa or higher. Below investment grade ratings are credit ratings of BB/Ba or lower. Investments designated N/R are not rated by either rating agency. Unrated investments do not necessarily indicate low credit quality. Credit quality ratings are subject to change. |
| 2 | Representing less than 1% of the Trust’s long-term investments. |
| ANNUAL REPORT | JULY 31, 2014 | 7 |
| Trust Summary as of July 31, 2014 | BlackRock Florida Municipal 2020 Term Trust |
Trust Overview
Performance
• | For the 12-month period ended July 31, 2014, the Trust returned 4.36% based on market price and 4.84% based on NAV. For the same period, the closed-end Lipper Other States Municipal Debt Funds category posted an average return of 12.67% based on market price and 12.42% based on NAV. All returns reflect reinvestment of dividends. The Trust’s discount to NAV, which widened during the period, accounts for the difference between performance based on price and performance based on NAV. The following discussion relates to performance based on NAV. |
• | Tax-exempt rates declined during the period, supporting generally positive performance for municipal bonds. (Bond prices rise when rates fall.) The municipal yield curve flattened, meaning that longer-dated yields declined more than shorter-maturity yields. In this environment, the Fund’s duration exposure (sensitivity to interest rate movements) had a positive impact on performance. |
• | There were no detractors from performance on an absolute basis as all areas of the Trust’s investment universe appreciated during the period. |
• | The Trust is scheduled to mature on or about December 31, 2020, and it therefore holds securities that will mature close to that date. Given that rates declined more for bonds on the long end of the yield curve, the Trust’s shorter maturity profile was a disadvantage in comparison to its Lipper category peers, which typically hold longer-dated issues. |
| The views expressed reflect the opinions of BlackRock as of the date of this report and are subject to change based on changes in market, economic or other conditions. These views are not intended to be a forecast of future events and are no guarantee of future results. |
Trust Information
Symbol on NYSE | BFO | |||||
Initial Offering Date | September 30, 2003 | |||||
Termination Date (on or about) | December 31, 2020 | |||||
Yield on Closing Market Price as of July 31, 2014 ($15.16)1 | 3.98% | |||||
Tax Equivalent Yield2 | 7.03% | |||||
Current Monthly Distribution per Common Share3 | $0.05025 | |||||
Current Annualized Distribution per Common Share3 | $0.60300 | |||||
Economic Leverage as of July 31, 20144 | 1% | |||||
| 1 | Yield on closing market price is calculated by dividing the current annualized distribution per share by the closing market price. Past performance does not guarantee future results. |
| 2 | Tax equivalent yield assumes the maximum marginal federal tax rate of 43.4%, which includes the 3.8% Medicare tax. Actual tax rates will vary based on income, exemptions and deductions. Lower taxes will result in lower tax equivalent yields. |
| 3 | The monthly distribution per Common Share, declared on August 1, 2014, was decreased to $0.0347 per share. The yield on closing market price, current monthly distribution per Common Share and current annualized distribution per Common Share do not reflect the new distribution rate. The new distribution rate is not constant and is subject to change in the future. |
| 4 | Represents AMPS and TOBs as a percentage of total managed assets, which is the total assets of the Trust, including any assets attributable to AMPS and TOBs, minus the sum of accrued liabilities. For a discussion of leveraging techniques utilized by the Trust, please see The Benefits and Risks of Leveraging on page 5. |
| 8 | ANNUAL REPORT | JULY 31, 2014 |
| BlackRock Florida Municipal 2020 Term Trust |
Market Price and Net Asset Value Per Share Summary
| | 7/31/14 | | 7/31/13 | | Change | | High | | Low | |||||||||||||
Market Price | $ | 15.16 | $ | 15.12 | 0.26 | % | $ | 15.83 | $ | 14.88 | ||||||||||||
Net Asset Value | $ | 15.42 | $ | 15.31 | 0.72 | % | $ | 15.44 | $ | 15.04 | ||||||||||||
Market Price and Net Asset Value History For the Past Five Years |
Overview of the Trust’s Long-Term Investments
| Sector Allocation | 7/31/14 | 7/31/13 | |||||
County/City/Special District/School District | 32 | % | 30 | % | |||
Transportation | 20 | 17 | |||||
Health | 16 | 13 | |||||
State | 14 | 12 | |||||
Utilities | 10 | 20 | |||||
Corporate | 4 | 4 | |||||
Education | 3 | 2 | |||||
Housing | 1 | 2 | |||||
| For Trust compliance purposes, the Trust’s sector classifications refer to any one or more of the sector sub-classifications used by one or more widely recognized market indexes or rating group indexes, and/or as defined by the investment advisor. These definitions may not apply for purposes of this report, which may combine such sector sub-classifications for reporting ease. |
| Call/Maturity Schedule3 | ||||||||
Calendar Year Ended December 31, | ||||||||
2014 | 10 | % | ||||||
2015 | — | |||||||
2016 | — | |||||||
2017 | 15 | |||||||
2018 | 11 | |||||||
| 3 | Scheduled maturity dates and/or bonds that are subject to potential calls by issuers over the next five years. |
| Credit Quality Allocation1 | | 7/31/14 | | 7/31/13 | ||||||
AAA/Aaa | 2 | % | 2 | % | ||||||
AA/Aa | 47 | 49 | ||||||||
A | 32 | 31 | ||||||||
BBB/Baa | 9 | 8 | ||||||||
N/R2 | 10 | 10 | ||||||||
| 1 | For financial reporting purposes, credit quality ratings shown above reflect the highest rating assigned by either S&P or Moody’s if ratings differ. These rating agencies are independent, nationally recognized statistical rating organizations and are widely used. Investment grade ratings are credit ratings of BBB/Baa or higher. Below investment grade ratings are credit ratings of BB/Ba or lower. Investments designated N/R are not rated by either rating agency. Unrated investments do not necessarily indicate low credit quality. Credit quality ratings are subject to change. |
| 2 | The investment advisor evaluates the credit quality of unrated investments based upon certain factors including, but not limited to, credit ratings for similar investments and financial analysis of sectors and individual investments. Using this approach, the investment advisor has deemed certain of these unrated securities as investment grade quality. As of July 31, 2014 and July 31, 2013, the market value of unrated securities deemed by the investment advisor to be investment grade was $1,703,400, representing 2%, and $3,035,830, representing 3%, respectively, of the Trust’s long-term investments. |
| ANNUAL REPORT | JULY 31, 2014 | 9 |
| Trust Summary as of July 31, 2014 | BlackRock Municipal Income Investment Trust |
Trust Overview
Performance
• | For the 12-month period ended July 31, 2014, the Trust returned 15.49% based on market price and 16.06% based on NAV. For the same period, the closed-end Lipper General & Insured Municipal Debt Funds (Leveraged) category posted an average return of 14.52% based on market price and 14.95% based on NAV. All returns reflect reinvestment of dividends. The Trust’s discount to NAV, which widened during the period, accounts for the difference between performance based on price and performance based on NAV. The following discussion relates to performance based on NAV. |
• | Tax-exempt rates declined during the period, supporting generally positive performance for municipal bonds. (Bond prices rise when rates fall.) The municipal yield curve flattened, meaning that longer-dated yields declined more than shorter-maturity yields. In this environment, the Trust’s duration exposure (sensitivity to interest rate movements) had a positive impact on performance. The Trust’s longer-dated holdings in the health care, education and transportation sectors experienced strong market appreciation, aiding performance. The Trust also benefited from its holdings in the State of California, as the continued improvement in the State’s economy was a catalyst for price appreciation during the period. |
• | The Trust’s modest exposure to Puerto Rico government-related credits in the earlier part of the period detracted from results, as credit spreads on these bonds widened materially due to investors’ lack of confidence and the weak local economy. The Trust sold its exposure to these securities early in the period. |
| The views expressed reflect the opinions of BlackRock as of the date of this report and are subject to change based on changes in market, economic or other conditions. These views are not intended to be a forecast of future events and are no guarantee of future results. |
Trust Information
Symbol on NYSE | BBF | |||||
Initial Offering Date | July 27, 2001 | |||||
Yield on Closing Market Price as of July 31, 2014 ($13.48)1 | 6.44% | |||||
Tax Equivalent Yield2 | 11.38% | |||||
Current Monthly Distribution per Common Share3 | $0.072375 | |||||
Current Annualized Distribution per Common Share3 | $0.868500 | |||||
Economic Leverage as of July 31, 20144 | 39% | |||||
| 1 | Yield on closing market price is calculated by dividing the current annualized distribution per share by the closing market price. Past performance does not guarantee future results. |
| 2 | Tax equivalent yield assumes the maximum marginal federal tax rate of 43.4%, which includes the 3.8% Medicare tax. Actual tax rates will vary based on income, exemptions and deductions. Lower taxes will result in lower tax equivalent yields. |
| 3 | The distribution rate is not constant and is subject to change. |
| 4 | Represents VRDP Shares and TOBs as a percentage of total managed assets, which is the total assets of the Trust, including any assets attributable to VRDP Shares and TOBs, minus the sum of accrued liabilities. For a discussion of leveraging techniques utilized by the Trust, please see The Benefits and Risks of Leveraging on page 5. |
| 10 | ANNUAL REPORT | JULY 31, 2014 |
| BlackRock Municipal Income Investment Trust |
Market Price and Net Asset Value Per Share Summary
| | 7/31/14 | | 7/31/13 | | Change | | High | | Low | |||||||||||||
Market Price | $ | 13.48 | $ | 12.47 | 8.10 | % | $ | 14.06 | $ | 11.89 | ||||||||||||
Net Asset Value | $ | 15.09 | $ | 13.89 | 8.64 | % | $ | 15.19 | $ | 13.26 | ||||||||||||
Market Price and Net Asset Value History For the Past Five Years |

Overview of the Trust’s Long-Term Investments
| Sector Allocation | 7/31/14 | 7/31/13 | |||||
County/City/Special District/School District | 26 | % | 26 | % | |||
Transportation | 21 | 14 | |||||
Utilities | 16 | 19 | |||||
Health | 15 | 16 | |||||
State | 11 | 11 | |||||
Education | 8 | 10 | |||||
Tobacco | 1 | 2 | |||||
Corporate | 1 | 1 | |||||
Housing | 1 | 1 | |||||
| For Trust compliance purposes, the Trust’s sector classifications refer to any one or more of the sector sub-classifications used by one or more widely recognized market indexes or rating group indexes, and/or as defined by the investment advisor. These definitions may not apply for purposes of this report, which may combine such sector sub-classifications for reporting ease. |
| Call/Maturity Schedule4 | ||||||||
Calendar Year Ended December 31, | ||||||||
2014 | 1 | % | ||||||
2015 | — | |||||||
2016 | 2 | |||||||
2017 | 1 | |||||||
2018 | 17 | |||||||
| 4 | Scheduled maturity dates and/or bonds that are subject to potential calls by issuers over the next five years. |
| Credit Quality Allocation1 | | 7/31/14 | | 7/31/13 | ||||||
AAA/Aaa | 10 | % | 10 | % | ||||||
AA/Aa | 56 | 57 | ||||||||
A | 26 | 28 | ||||||||
BBB/Baa | 6 | 4 | ||||||||
BB/Ba | 1 | — | ||||||||
B | — | 2 | — | |||||||
N/R | 1 | 1 | 3 | |||||||
| 1 | For financial reporting purposes, credit quality ratings shown above reflect the highest rating assigned by either S&P or Moody’s if ratings differ. These rating agencies are independent, nationally recognized statistical rating organizations and are widely used. Investment grade ratings are credit ratings of BBB/Baa or higher. Below investment grade ratings are credit ratings of BB/Ba or lower. Investments designated N/R are not rated by either rating agency. Unrated investments do not necessarily indicate low credit quality. Credit quality ratings are subject to change. |
| 2 | Representing less than 1% of the Trust’s long-term investments. |
| 3 | The investment advisor evaluates the credit quality of unrated investments based upon certain factors including, but not limited to, credit ratings for similar investments and financial analysis of sectors and individual investments. Using this approach, the investment advisor has deemed certain of these unrated securities as investment grade quality. As of July 31, 2013, the market value of unrated securities deemed by the investment advisor to be investment grade was $240,299, representing less than 1% of the Trust’s long-term investments. |
| ANNUAL REPORT | JULY 31, 2014 | 11 |
| Trust Summary as of July 31, 2014 | BlackRock Municipal Target Term Trust |
Trust Overview
Performance
• | For the 12-month period ended July 31, 2014, the Trust returned 12.78% based on market price and 24.50% based on NAV. For the same period, the closed-end Lipper General & Insured Municipal Debt Funds (Leveraged) category posted an average return of 14.52% based on market price and 14.95% based on NAV. All returns reflect reinvestment of dividends. The Trust’s discount to NAV, which widened during the period, accounts for the difference between performance based on price and performance based on NAV. The following discussion relates to performance based on NAV. |
• | The Trust’s duration exposure (sensitivity to interest rate movements) contributed positively to performance as interest rates declined during the period. (Bond prices rise when rates fall.) Exposure to bonds maturing near the Trust’s maturity date in 2030 benefited performance given that the yield curve flattened, with rates falling more significantly in maturities of 20 years and longer. The income generated from coupon payments on the Trust’s portfolio of municipal bonds also contributed to performance. |
• | The Trust’s modest exposure to Puerto Rico government-related credits detracted from results. Credit spreads on these bonds widened materially due to investors’ lack of confidence and the weak local economy. The Trust sold its exposure to these securities early in the period. |
| The views expressed reflect the opinions of BlackRock as of the date of this report and are subject to change based on changes in market, economic or other conditions. These views are not intended to be a forecast of future events and are no guarantee of future results. |
Trust Information
Symbol on NYSE | BTT | |||||
Initial Offering Date | August 30, 2012 | |||||
Termination Date (on or about) | December 31, 2030 | |||||
Current Distribution Rate on Closing Market Price as of July 31, 2014 ($19.57)1 | 4.91% | |||||
Tax Equivalent Rate2 | 8.67% | |||||
Current Monthly Distribution per Common Share3 | $0.093750 | |||||
Current Annualized Distribution per Common Share3 | $0.96 | |||||
Economic Leverage as of July 31, 20144 | 38% | |||||
| 1 | Current Distribution Rate on closing market price is calculated by dividing the current annualized distribution per share by the closing market price. The current distribution rate may consist of income, net realized gains and/or a return of capital. See the financial highlights for the actual sources and character of distributions. Past performance does not guarantee future results. |
| 2 | Tax equivalent yield assumes the maximum marginal federal tax rate of 43.4%, which includes the 3.8% Medicare tax. Actual tax rates will vary based on income, exemptions and deductions. Lower taxes will result in lower tax equivalent yields. |
| 3 | The monthly distribution per Common Share, declared on August 1, 2014, was decreased to $0.08 per share. The yield on closing market price, current monthly distribution per Common Share and current annualized distribution per Common Share do not reflect the new distribution rate. The new distribution rate is not constant and is subject to change in the future. A portion of the distribution may be deemed a return of capital or net realized gain at fiscal year end. |
| 4 | Represents RVMTP Shares and TOBs as a percentage of total managed assets, which is the total assets of the Trust, including any assets attributable to RVMTP Shares and TOBs, minus the sum of accrued liabilities. For a discussion of leveraging techniques utilized by the Trust, please see The Benefits and Risks of Leveraging on page 5. |
| 12 | ANNUAL REPORT | JULY 31, 2014 |
| BlackRock Municipal Target Term Trust |
Market Price and Net Asset Value Per Share Summary
| | 7/31/14 | | 7/31/13 | | Change | | High | | Low | |||||||||||||
Market Price | $ | 19.57 | $ | 18.42 | 6.24 | % | $ | 20.49 | $ | 16.47 | ||||||||||||
Net Asset Value | $ | 21.99 | $ | 18.75 | 17.28 | % | $ | 22.15 | $ | 17.45 | ||||||||||||
Market Price and Net Asset Value History Since Inception |
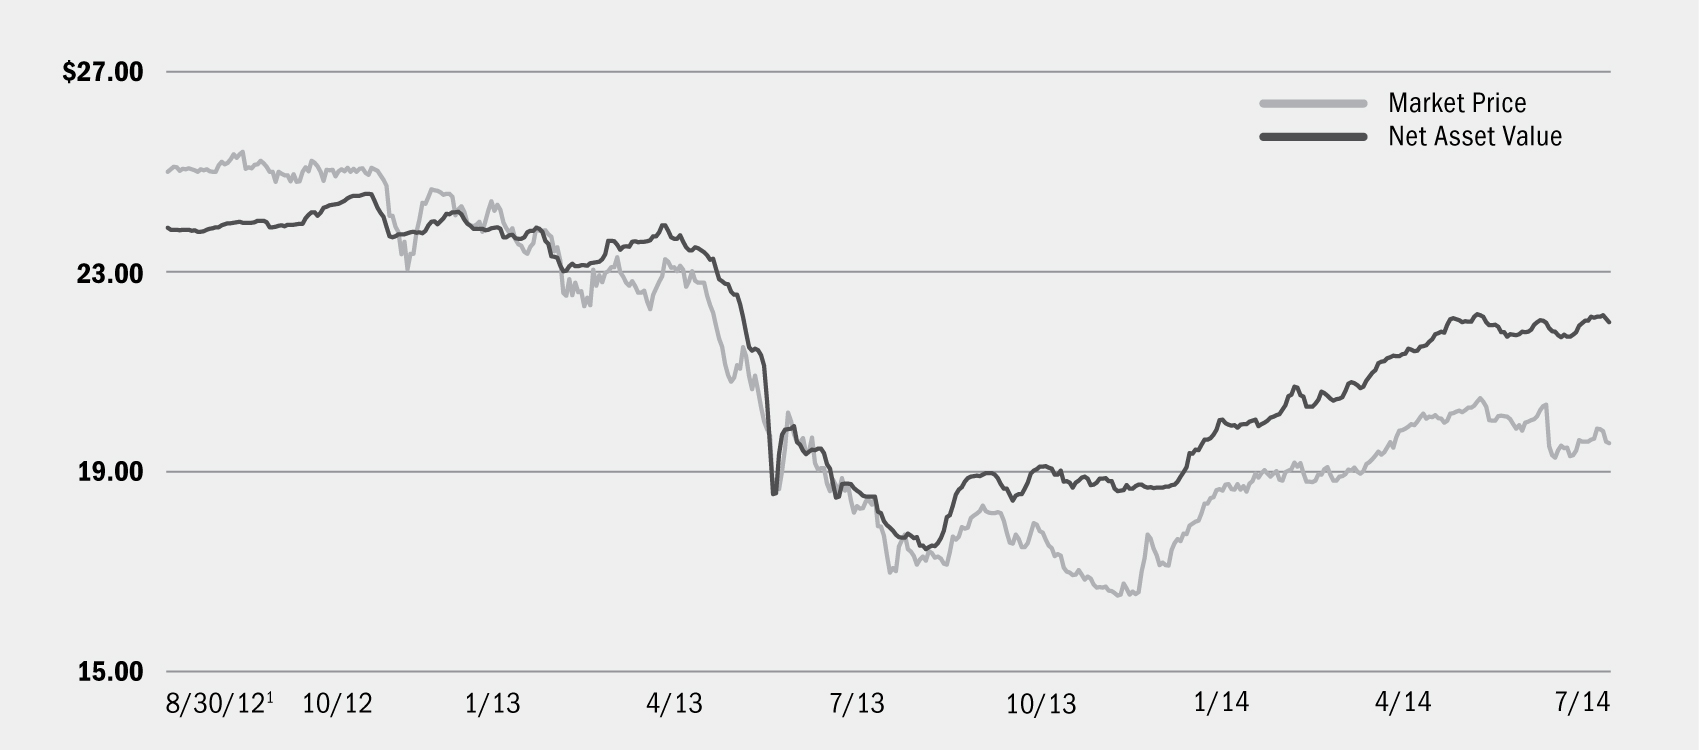
| 1 | Commencement of operations. |
Overview of the Trust’s Long-Term Investments
| Sector Allocation | 7/31/14 | 7/31/13 | |||||
Transportation | 22 | % | 22 | % | |||
Health | 17 | 17 | |||||
County/City/Special District/School District | 13 | 12 | |||||
Education | 12 | 13 | |||||
Corporate | 11 | 9 | |||||
Housing | 9 | 9 | |||||
Utilities | 8 | 9 | |||||
State | 6 | 7 | |||||
Tobacco | 2 | 2 | |||||
| For Trust compliance purposes, the Trust’s sector classifications refer to any one or more of the sector sub-classifications used by one or more widely recognized market indexes or rating group indexes, and/or as defined by the investment advisor. These definitions may not apply for purposes of this report, which may combine such sector sub-classifications for reporting ease. |
| Call/Maturity Schedule4 | ||||||||
Calendar Year Ended December 31, | ||||||||
2014 | 1 | % | ||||||
2015 | — | |||||||
2016 | 1 | |||||||
2017 | 2 | |||||||
2018 | 1 | |||||||
| 4 | Scheduled maturity dates and/or bonds that are subject to potential calls by issuers over the next five years. |
| Credit Quality Allocation2 | | 7/31/14 | | 7/31/13 | ||||||
AAA/Aaa | 4 | % | 3 | % | ||||||
AA/Aa | 31 | 32 | ||||||||
A | 42 | 43 | ||||||||
BBB/Baa | 12 | 11 | ||||||||
BB/Ba | 3 | 3 | ||||||||
B | 2 | 3 | ||||||||
N/R3 | 6 | 5 | ||||||||
| 2 | For financial reporting purposes, credit quality ratings shown above reflect the highest rating assigned by either S&P or Moody’s if ratings differ. These rating agencies are independent, nationally recognized statistical rating organizations and are widely used. Investment grade ratings are credit ratings of BBB/Baa or higher. Below investment grade ratings are credit ratings of BB/Ba or lower. Investments designated N/R are not rated by either rating agency. Unrated investments do not necessarily indicate low credit quality. Credit quality ratings are subject to change. |
| 3 | The investment advisor evaluates the credit quality of unrated investments based upon certain factors including, but not limited to, credit ratings for similar investments and financial analysis of sectors and individual investments. Using this approach, the investment advisor has deemed certain of these unrated securities as investment grade quality. As of July 31, 2014 and July 31, 2013, the market value of unrated securities deemed by the investment advisor to be investment grade was $483,970, representing less than 1%, and $38,601,602, representing 2%, respectively, of the Trust’s long-term investments. |
| ANNUAL REPORT | JULY 31, 2014 | 13 |
| Trust Summary as of July 31, 2014 | BlackRock New Jersey Municipal Income Trust |
Trust Overview
Performance
• | For the 12-month period ended July 31, 2014, the Trust returned 14.60% based on market price and 16.01% based on NAV. For the same period, the closed-end Lipper New Jersey Municipal Debt Funds category posted an average return of 12.38% based on market price and 13.86% based on NAV. All returns reflect reinvestment of dividends. The Trust’s discount to NAV, which widened during the period, accounts for the difference between performance based on price and performance based on NAV. The following discussion relates to performance based on NAV. |
• | Tax-exempt rates declined during the period, supporting generally positive performance for municipal bonds. (Bond prices rise when rates fall.) The municipal yield curve flattened, meaning that longer-dated yields declined more than shorter-maturity yields. In this environment, the Trust’s duration exposure (sensitivity to interest rate movements) had a positive impact on performance. The Trust’s longer-dated holdings in the health care, education and transportation sectors experienced strong market appreciation, aiding performance. |
• | The Trust’s modest exposure to Puerto Rico government-related credits in the earlier part of the period detracted from results, as credit spreads on these bonds widened materially due to investors’ lack of confidence and the weak local economy. The Trust sold its exposure to these securities early in the period. |
| The views expressed reflect the opinions of BlackRock as of the date of this report and are subject to change based on changes in market, economic or other conditions. These views are not intended to be a forecast of future events and are no guarantee of future results. |
Trust Information
Symbol on NYSE | BNJ | |||||
Initial Offering Date | July 27, 2001 | |||||
Yield on Closing Market Price as of July 31, 2014 ($14.68)1 | 6.14% | |||||
Tax Equivalent Yield2 | 11.92% | |||||
Current Monthly Distribution per Common Share3 | $0.0751 | |||||
Current Annualized Distribution per Common Share3 | $0.9012 | |||||
Economic Leverage as of July 31, 20144 | 39% | |||||
| 1 | Yield on closing market price is calculated by dividing the current annualized distribution per share by the closing market price. Past performance does not guarantee future results. |
| 2 | Tax equivalent yield assumes the maximum marginal federal and state tax rate of 48.48%, which includes the 3.8% Medicare tax. Actual tax rates will vary based on income, exemptions and deductions. Lower taxes will result in lower tax equivalent yields. |
| 3 | The distribution rate is not constant and is subject to change. |
| 4 | Represents VMTP Shares and TOBs as a percentage of total managed assets, which is the total assets of the Trust, including any assets attributable to VMTP Shares and TOBs, minus the sum of accrued liabilities. For a discussion of leveraging techniques utilized by the Trust, please see The Benefits and Risks of Leveraging on page 5. |
| 14 | ANNUAL REPORT | JULY 31, 2014 |
| BlackRock New Jersey Municipal Income Trust |
Market Price and Net Asset Value Per Share Summary
| | 7/31/14 | | 7/31/13 | | Change | | High | | Low | |||||||||||||
Market Price | $ | 14.68 | $ | 13.67 | 7.39 | % | $ | 15.47 | $ | 12.74 | ||||||||||||
Net Asset Value | $ | 15.61 | $ | 14.36 | 8.70 | % | $ | 15.69 | $ | 13.77 | ||||||||||||
Market Price and Net Asset Value History For the Past Five Years |

Overview of the Trust’s Long-Term Investments
| Sector Allocation | | 7/31/14 | | 7/31/13 | ||||||
Transportation | 33 | % | 25 | % | ||||||
Education | 17 | 12 | ||||||||
State | 15 | 26 | ||||||||
County/City/Special District/School District | 13 | 13 | ||||||||
Health | 8 | 11 | ||||||||
Corporate | 8 | 6 | ||||||||
Housing | 6 | 7 | ||||||||
| For Trust compliance purposes, the Trust’s sector classifications refer to any one or more of the sector sub-classifications used by one or more widely recognized market indexes or rating group indexes, and/or as defined by the investment advisor. These definitions may not apply for purposes of this report, which may combine such sector sub-classifications for reporting ease. |
| Call/Maturity Schedule3 | ||||||||
Calendar Year Ended December 31, | ||||||||
2014 | 8 | % | ||||||
2015 | — | |||||||
2016 | 1 | |||||||
2017 | 3 | |||||||
2018 | 13 | |||||||
| 3 | Scheduled maturity dates and/or bonds that are subject to potential calls by issuers over the next five years. |
| Credit Quality Allocation1 | | 7/31/14 | | 7/31/13 | ||||||
AAA/Aaa | 2 | % | 2 | % | ||||||
AA/Aa | 40 | 35 | ||||||||
A | 35 | 40 | ||||||||
BBB/Baa | 9 | 9 | ||||||||
BB/Ba | 4 | 5 | ||||||||
B | 3 | 3 | ||||||||
N/R2 | 7 | 6 | ||||||||
| 1 | For financial reporting purposes, credit quality ratings shown above reflect the highest rating assigned by either S&P or Moody’s if ratings differ. These rating agencies are independent, nationally recognized statistical rating organizations and are widely used. Investment grade ratings are credit ratings of BBB/Baa or higher. Below investment grade ratings are credit ratings of BB/Ba or lower. Investments designated N/R are not rated by either rating agency. Unrated investments do not necessarily indicate low credit quality. Credit quality ratings are subject to change. |
| 2 | The investment advisor evaluates the credit quality of unrated investments based upon certain factors including, but not limited to, credit ratings for similar investments and financial analysis of sectors and individual investments. Using this approach, the investment advisor has deemed certain of these unrated securities as investment grade quality. As of July 31, 2014 and July 31, 2013, the market value of unrated securities deemed by the investment advisor to be investment grade was $10,254,522, representing 5%, and $8,401,509, representing 4%, respectively, of the Trust’s long-term investments. |
| ANNUAL REPORT | JULY 31, 2014 | 15 |
| Trust Summary as of July 31, 2014 | BlackRock New York Municipal Income Trust |
Trust Overview
Performance
• | For the 12-month period ended July 31, 2014, the Trust returned 11.51% based on market price and 15.98% based on NAV. For the same period, the closed-end Lipper New York Municipal Debt Funds category posted an average return of 12.03% based on market price and 12.89% based on NAV. All returns reflect reinvestment of dividends. The Trust’s discount to NAV, which widened during the period, accounts for the difference between performance based on price and performance based on NAV. The following discussion relates to performance based on NAV. |
• | Tax-exempt rates declined during the period, supporting generally positive performance for municipal bonds. (Bond prices rise when rates fall.) Municipal bonds with longer durations (and greater sensitivity to interest rate movements) tended to provide the strongest returns. In this environment, the Trust’s exposure to lower coupon and zero coupon bonds — which experienced strong price performance due to their relatively long durations for their respective maturities —contributed positively to results. The Trust’s exposure to the long end of the yield curve also was a significant contributor to total return, as longer-dated yields declined more than shorter-maturity yields. This positioning allowed the Trust to maximize its income and also benefit from the flattening of the yield curve. |
• | The Trust’s holdings in the health care, corporate and transportation sectors — the better performing areas of the market — were particularly beneficial. The Trust’s significant exposure to high-quality (A-rated) issues had a positive impact on results as the market’s strong performance during the period was concentrated in this credit quality tier. Additionally, the Trust benefited from income generated from coupon payments on its portfolio of municipal bond holdings. The use of leverage allowed the Trust to maximize its income. |
• | The Trust’s modest exposure to Puerto Rico government-related credits in the earlier part of the period detracted from results, as credit spreads on these bonds widened materially due to investors’ lack of confidence and a weak local economy. The Trust sold its exposure to these securities early in the period. |
| The views expressed reflect the opinions of BlackRock as of the date of this report and are subject to change based on changes in market, economic or other conditions. These views are not intended to be a forecast of future events and are no guarantee of future results. |
Trust Information
Symbol on NYSE | BNY | |||||
Initial Offering Date | July 27, 2001 | |||||
Yield on Closing Market Price as of July 31, 2014 ($13.79)1 | 6.00% | |||||
Tax Equivalent Yield2 | 12.14% | |||||
Current Monthly Distribution per Common Share3 | $0.069 | |||||
Current Annualized Distribution per Common Share3 | $0.828 | |||||
Economic Leverage as of July 31, 20144 | 39% | |||||
| 1 | Yield on closing market price is calculated by dividing the current annualized distribution per share by the closing market price. Past performance does not guarantee future results. |
| 2 | Tax equivalent yield assumes the maximum marginal federal and state tax rate of 50.59%, which includes the 3.8% Medicare tax. Actual tax rates will vary based on income, exemptions and deductions. Lower taxes will result in lower tax equivalent yields. |
| 3 | The distribution rate is not constant and is subject to change. |
| 4 | Represents VMTP Shares and TOBs as a percentage of total managed assets, which is the total assets of the Trust, including any assets attributable to VMTP Shares and TOBs, minus the sum of accrued liabilities. For a discussion of leveraging techniques utilized by the Trust, please see The Benefits and Risks of Leveraging on page 5. |
| 16 | ANNUAL REPORT | JULY 31, 2014 |
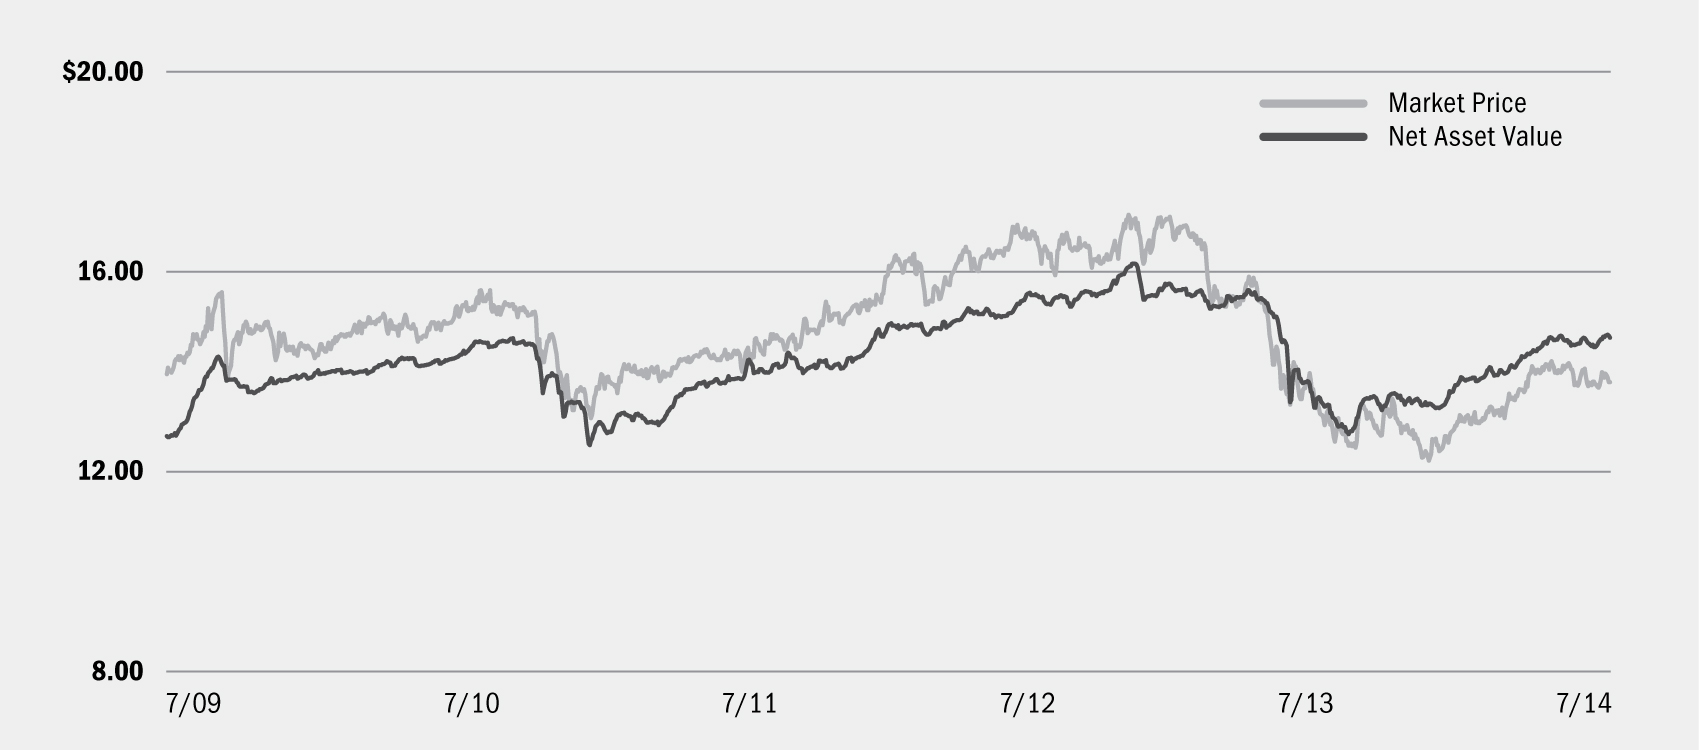
| BlackRock New York Municipal Income Trust |
Market Price and Net Asset Value Per Share Summary
| | 7/31/14 | | 7/31/13 | | Change | | High | | Low | |||||||||||||
Market Price | $ | 13.79 | $ | 13.16 | 4.79 | % | $ | 14.37 | $ | 12.17 | ||||||||||||
Net Asset Value | $ | 14.68 | $ | 13.47 | 8.98 | % | $ | 14.74 | $ | 12.75 | ||||||||||||
Market Price and Net Asset Value History For the Past Five Years |
Overview of the Trust’s Long-Term Investments
| Sector Allocation | | 7/31/14 | | 7/31/13 | ||||||
County/City/Special District/School District | 24 | % | 23 | % | ||||||
Education | 19 | 16 | ||||||||
Transportation | 14 | 14 | ||||||||
Utilities | 13 | 11 | ||||||||
Health | 10 | 10 | ||||||||
State | 9 | 9 | ||||||||
Corporate | 9 | 10 | ||||||||
Housing | 2 | 7 | ||||||||
| For Trust compliance purposes, the Trust’s sector classifications refer to any one or more of the sector sub-classifications used by one or more widely recognized market indexes or rating group indexes, and/or as defined by the investment advisor. These definitions may not apply for purposes of this report, which may combine such sector sub-classifications for reporting ease. |
| Call/Maturity Schedule3 | ||||||||
Calendar Year Ended December 31, | ||||||||
2014 | 5 | % | ||||||
2015 | 5 | |||||||
2016 | 4 | |||||||
2017 | 12 | |||||||
2018 | 3 | |||||||
| 3 | Scheduled maturity dates and/or bonds that are subject to potential calls by issuers over the next five years. |
| Credit Quality Allocation1 | | 7/31/14 | | 7/31/13 | ||||||
AAA/Aaa | 16 | % | 13 | % | ||||||
AA/Aa | 39 | 34 | ||||||||
A | 29 | 35 | ||||||||
BBB/Baa | 6 | 8 | ||||||||
BB/Ba | 4 | 3 | ||||||||
N/R2 | 6 | 7 | ||||||||
| 1 | For financial reporting purposes, credit quality ratings shown above reflect the highest rating assigned by either S&P or Moody’s if ratings differ. These rating agencies are independent, nationally recognized statistical rating organizations and are widely used. Investment grade ratings are credit ratings of BBB/Baa or higher. Below investment grade ratings are credit ratings of BB/Ba or lower. Investments designated N/R are not rated by either rating agency. Unrated investments do not necessarily indicate low credit quality. Credit quality ratings are subject to change. |
| 2 | The investment advisor evaluates the credit quality of unrated investments based upon certain factors including, but not limited to, credit ratings for similar investments and financial analysis of sectors and individual investments. Using this approach, the investment advisor has deemed certain of these unrated securities as investment grade quality. As of July 31, 2014 and July 31, 2013, the market value of unrated securities deemed by the investment advisor to be investment grade was $2,704,682, representing 1%, and $2,500,000, representing 1%, respectively, of the Trust’s long-term investments. |
| ANNUAL REPORT | JULY 31, 2014 | 17 |
| Schedule of Investments July 31, 2014 | BlackRock California Municipal Income Trust (BFZ) (Percentages shown are based on Net Assets) |
| Municipal Bonds | Par (000) | Value | |||||||||
California — 107.3% | |||||||||||
Corporate — 0.7% | |||||||||||
City of Chula Vista California, Refunding RB, San Diego Gas & Electric: | |||||||||||
Series A, 5.88%, 2/15/34 | $ | 680 | $ | 783,659 | |||||||
Series D, 5.88%, 1/01/34 | 2,500 | 2,881,100 | |||||||||
| 3,664,759 | |||||||||||
County/City/Special District/School District — 34.5% | |||||||||||
Butte-Glenn Community College District, GO, Election of 2002, Series C, 5.50%, 8/01/30 | 8,425 | 9,508,876 | |||||||||
Centinela Valley Union High School District, GO, Refunding, Election of 2008, Series B, 5.75%, 8/01/33 | 1,250 | 1,478,238 | |||||||||
Cerritos Community College District, GO, Election of 2004, Series C, 5.25%, 8/01/31 | 3,000 | 3,437,130 | |||||||||
City of San Jose California Hotel Tax, RB, Convention Center Expansion & Renovation Project: | |||||||||||
6.13%, 5/01/31 | 500 | 583,830 | |||||||||
6.50%, 5/01/36 | 1,210 | 1,432,059 | |||||||||
6.50%, 5/01/42 | 2,225 | 2,628,926 | |||||||||
County of Kern California, COP, Capital Improvements Projects, Series A (AGC), 6.00%, 8/01/35 | 2,000 | 2,328,560 | |||||||||
County of Orange California Water District, COP, Refunding, 5.25%, 8/15/34 | 2,000 | 2,293,080 | |||||||||
County of San Joaquin California Transportation Authority, Refunding RB, Limited Tax, Measure K, Series A: | |||||||||||
6.00%, 3/01/36 | 2,880 | 3,459,024 | |||||||||
5.50%, 3/01/41 | 5,265 | 5,938,604 | |||||||||
County of Santa Clara California Financing Authority, Refunding LRB, Series L, 5.25%, 5/15/36 | 20,000 | 22,127,000 | |||||||||
Evergreen Elementary School District, GO, Election of 2006, Series B (AGC), 5.13%, 8/01/33 | 2,500 | 2,849,550 | |||||||||
Grossmont Healthcare District, GO, Election of 2006, Series B: | |||||||||||
6.00%, 7/15/34 | 3,260 | 3,849,636 | |||||||||
6.13%, 7/15/40 | 2,000 | 2,348,900 | |||||||||
Long Beach Unified School District California, GO, Refunding, Election of 2008, Series A, 5.75%, 8/01/33 | 4,135 | 4,865,034 | |||||||||
Los Alamitos Unified School District California, GO, School Facilities Improvement District No. 1, 5.50%, 8/01/33 | 6,300 | 7,235,550 | |||||||||
Los Angeles Community College District California, GO, Election of 2003, Series F-1, 5.00%, 8/01/33 | 5,000 | 5,615,700 | |||||||||
Los Angeles Municipal Improvement Corp., Refunding RB, Real Property, Series B (AGC), 5.50%, 4/01/30 | 5,065 | 5,821,762 | |||||||||
Modesto Irrigation District, COP, Capital Improvements, Series A, 5.75%, 10/01/29 | 3,015 | 3,475,632 | |||||||||
| Municipal Bonds | Par (000) | Value | |||||||||
California (continued) | |||||||||||
County/City/Special District/School District (concluded) | |||||||||||
Oak Grove School District California, GO, Election of 2008, Series A, 5.50%, 8/01/33 | $ | 6,000 | $ | 6,951,180 | |||||||
Pico Rivera Public Financing Authority, RB, 5.75%, 9/01/39 | 2,000 | 2,204,900 | |||||||||
Pittsburg Unified School District, GO, Election of 2006, Series B (AGM), 5.50%, 8/01/34 | 2,000 | 2,264,040 | |||||||||
Sacramento Area Flood Control Agency, Special Assessment Bonds, Consolidated Capital Assessment District, 5.25%, 10/01/32 | 4,865 | 5,637,757 | |||||||||
San Diego Community College District California, GO, Election of 2002, 5.25%, 8/01/33 | 1,500 | 1,727,790 | |||||||||
San Diego Regional Building Authority, RB, County Operations Center & Annex, Series A, 5.38%, 2/01/36 | 5,500 | 6,274,620 | |||||||||
San Joaquin Delta Community College District, GO, Election of 2004, Series C, 5.00%, 8/01/39 (b) | 2,505 | 2,763,291 | |||||||||
San Jose California Financing Authority, Refunding LRB, Civic Center Project, Series A, 5.00%, 6/01/32 | 3,375 | 3,770,246 | |||||||||
San Leandro California Unified School District, GO, Election of 2010, Series A, 5.75%, 8/01/41 | 3,060 | 3,463,889 | |||||||||
San Mateo County Community College District, GO, Election of 2005, Series B, 5.00%, 9/01/31 | 8,630 | 9,258,178 | |||||||||
Santa Ana Unified School District, GO, Election of 2008, Series A: | |||||||||||
5.50%, 8/01/30 | 6,455 | 7,382,003 | |||||||||
5.13%, 8/01/33 | 10,000 | 11,250,600 | |||||||||
Snowline Joint Unified School District, COP, Refunding, Refining Project (AGC), 5.75%, 9/01/38 | 2,250 | 2,617,987 | |||||||||
Torrance Unified School District California, GO, Election of 2008, Measure Z, 6.00%, 8/01/33 | 4,000 | 4,757,720 | |||||||||
Tustin Unified School District, GO, Election of 2008, Series B, 5.25%, 8/01/31 | 3,445 | 3,907,870 | |||||||||
West Contra Costa California Unified School District, GO, Series A: | |||||||||||
Election of 2010 (AGM), 5.25%, 8/01/32 | 4,925 | 5,627,453 | |||||||||
Election of 2012, 5.50%, 8/01/39 | 2,500 | 2,827,500 | |||||||||
| 173,964,115 | |||||||||||
Education — 3.3% | |||||||||||
California Educational Facilities Authority, Refunding RB, San Francisco University, 6.13%, 10/01/36 | 6,280 | 7,470,437 | |||||||||
California Municipal Finance Authority, RB, Emerson College, 5.75%, 1/01/33 | 2,500 | 2,840,100 | |||||||||
University of California, RB, Series O, 5.38%, 5/15/34 | 490 | 562,392 | |||||||||
University of California, Refunding RB, Limited Project, Series G, 5.00%, 5/15/37 | 5,500 | 6,050,055 | |||||||||
| 16,922,984 | |||||||||||
Portfolio Abbreviations
ACA AGC AGM AMBAC AMT ARB BARB BHAC CAB CIFG | American Capital Access Corp. Assured Guarantee Corp. Assured Guaranty Municipal Corp. American Municipal Bond Assurance Corp. Alternative Minimum Tax (subject to) Airport Revenue Bonds Building Aid Revenue Bonds Berkshire Hathaway Assurance Corp. Capital Appreciation Bonds CDC IXIS Financial Guaranty | COP EDA EDC ERB FHA GARB GO HDA HFA IDA | Certificates of Participation Economic Development Authority Economic Development Corp. Education Revenue Bonds Federal Housing Administration General Airport Revenue Bonds General Obligation Bonds Housing Development Authority Housing Finance Agency Industrial Development Authority | IDB ISD LRB M/F MRB NPFGC PILOT RB S/F SONYMA | Industrial Development Board Independent School District Lease Revenue Bonds Multi-Family Mortgage Revenue Bonds National Public Finance Guarantee Corp. Payment in Lieu of Taxes Revenue Bonds Single-Family State of New York Mortgage Agency |
| 18 | ANNUAL REPORT | JULY 31, 2014 |
| Schedule of Investments (continued) | BlackRock California Municipal Income Trust (BFZ) (Percentages shown are based on Net Assets) |
| Municipal Bonds | Par (000) | Value | |||||||||
California (continued) | |||||||||||
Health — 17.5% | |||||||||||
ABAG Finance Authority for Nonprofit Corps., Refunding RB, Sharp Healthcare: | |||||||||||
6.38%, 8/01/14 (c) | $ | 3,095 | $ | 3,095,000 | |||||||
Series A, 6.00%, 8/01/30 | 2,300 | 2,778,814 | |||||||||
Series B, 6.25%, 8/01/39 | 4,960 | 5,730,734 | |||||||||
California Health Facilities Financing Authority, RB: | |||||||||||
Adventist Health System West, Series A, 5.75%, 9/01/39 | 6,700 | 7,721,683 | |||||||||
Catholic Healthcare West, Series J, 5.63%, 7/01/32 | 9,750 | 9,958,942 | |||||||||
Children’s Hospital, Series A, 5.25%, 11/01/41 | 9,165 | 9,903,241 | |||||||||
St. Joseph Health System, Series A, 5.75%, 7/01/39 | 325 | 376,188 | |||||||||
Sutter Health, Series A, 5.25%, 11/15/46 | 5,195 | 5,502,752 | |||||||||
Sutter Health, Series B, 6.00%, 8/15/42 | 6,015 | 7,199,353 | |||||||||
California Health Facilities Financing Authority, Refunding RB: | |||||||||||
Catholic Healthcare West, Series A, 6.00%, 7/01/29 | 1,000 | 1,147,980 | |||||||||
Catholic Healthcare West, Series A, 6.00%, 7/01/34 | 4,470 | 5,048,105 | |||||||||
Catholic Healthcare West, Series A, 6.00%, 7/01/39 | 5,550 | 6,158,336 | |||||||||
Providence Health and Services, Series B, 5.00%, 10/01/44 (b) | 6,000 | 6,644,880 | |||||||||
California Statewide Communities Development Authority, RB, Kaiser Permanente, Series B, 5.25%, 3/01/45 | 2,000 | 2,061,180 | |||||||||
California Statewide Communities Development Authority, Refunding RB: | |||||||||||
Catholic Healthcare West, Series B, 5.50%, 7/01/30 | 2,920 | 3,192,465 | |||||||||
Catholic Healthcare West, Series E, 5.50%, 7/01/31 | 5,065 | 5,531,588 | |||||||||
Trinity Health Credit Group Composite Issue, 5.00%, 12/01/41 | 4,000 | 4,288,640 | |||||||||
Washington Township Health Care District, GO, Series B, 5.50%, 8/01/38 | 1,625 | 1,901,721 | |||||||||
| 88,241,602 | |||||||||||
State — 12.7% | |||||||||||
State of California, GO, Various Purposes: | |||||||||||
6.00%, 3/01/33 | 2,000 | 2,399,540 | |||||||||
6.50%, 4/01/33 | 1,250 | 1,520,563 | |||||||||
6.00%, 4/01/38 | 12,670 | 14,910,689 | |||||||||
State of California Public Works Board, RB: | |||||||||||
Correctional Facility Improvements, Series A, 5.00%, 9/01/39 | 17,055 | 18,800,579 | |||||||||
Department of Corrections & Rehabilitation, Series F, 5.25%, 9/01/33 | 3,335 | 3,813,573 | |||||||||
Department of Education, Riverside Campus Project, Series B, 6.50%, 4/01/34 | 9,000 | 10,711,710 | |||||||||
Various Capital Projects, Series I, 5.50%, 11/01/33 | 4,940 | 5,839,327 | |||||||||
Various Capital Projects, Sub-Series I-1, 6.38%, 11/01/34 | 5,025 | 6,059,547 | |||||||||
| 64,055,528 | |||||||||||
Transportation — 10.7% | |||||||||||
City & County of San Francisco California Airports Commission, ARB, Series E, 6.00%, 5/01/39 | 6,750 | 8,001,247 | |||||||||
City & County of San Francisco California Airports Commission, Refunding ARB, 2nd Series A, AMT, 5.25%, 5/01/33 | 1,440 | 1,594,109 | |||||||||
| Municipal Bonds | Par (000) | Value | |||||||||
California (continued) | |||||||||||
Transportation (concluded) | |||||||||||
City of Los Angeles California Department of Airports, Refunding ARB, Los Angeles International Airport: | |||||||||||
Senior Series A, 5.00%, 5/15/34 | $ | 6,650 | $ | 7,494,218 | |||||||
Senior Series A, 5.00%, 5/15/40 | 3,750 | 4,106,925 | |||||||||
Sub-Series C, 5.25%, 5/15/38 | 1,950 | 2,168,166 | |||||||||
City of San Jose California, Refunding ARB, Series A-1, AMT: | |||||||||||
5.75%, 3/01/34 | 2,870 | 3,214,716 | |||||||||
6.25%, 3/01/34 | 2,650 | 3,065,255 | |||||||||
County of Orange California, ARB, Series B, 5.75%, 7/01/34 | 8,000 | 8,983,760 | |||||||||
County of Sacramento California, ARB: | |||||||||||
PFC/Grant, Sub-Series D, 6.00%, 7/01/35 | 3,000 | 3,446,820 | |||||||||
Senior Series B, 5.75%, 7/01/39 | 1,850 | 2,110,462 | |||||||||
Senior Series B, AMT (AGM), 5.25%, 7/01/33 | 3,015 | 3,198,523 | |||||||||
Los Angeles Harbor Department, RB, Series B, 5.25%, 8/01/34 | 5,580 | 6,384,524 | |||||||||
| 53,768,725 | |||||||||||
Utilities — 27.9% | |||||||||||
Anaheim Public Financing Authority, RB, Electric System Distribution Facilities, Series A, 5.38%, 10/01/36 | 7,690 | 8,815,431 | |||||||||
California Infrastructure & Economic Development Bank, RB, California Independent System Operator, Series A, 6.25%, 2/01/15 (c) | 4,500 | 4,637,160 | |||||||||
Calleguas-Las Virgenes Public Financing Authority California, RB, Calleguas Municipal Water District Project, Series A (NPFGC), 5.13%, 7/01/16 (c) | 4,000 | 4,366,960 | |||||||||
City of Chula Vista California, Refunding RB, San Diego Gas & Electric: | |||||||||||
Series B, 5.88%, 2/15/34 | 525 | 605,031 | |||||||||
Series D, 5.88%, 1/01/34 | 6,555 | 7,554,244 | |||||||||
City of Los Angeles California Department of Water & Power, Refunding RB, Series A, 5.25%, 7/01/39 | 4,000 | 4,442,760 | |||||||||
City of Los Angeles California Wastewater System, Refunding RB, Series A, 5.00%, 6/01/39 | 2,000 | 2,205,780 | |||||||||
City of Petaluma California Wastewater, Refunding RB, 6.00%, 5/01/36 | 5,625 | 6,592,669 | |||||||||
City of San Francisco California Public Utilities Commission Water Revenue, RB, Series A: | |||||||||||
5.00%, 11/01/35 | 10,625 | �� | 11,827,325 | ||||||||
5.00%, 11/01/37 | 10,000 | 11,084,500 | |||||||||
County of San Diego California Water Authority, COP, Refunding, Series A (AGM), 5.00%, 5/01/33 | 4,250 | 4,709,467 | |||||||||
Cucamonga Valley Water District, Refunding RB, Series A (AGM), 5.25%, 9/01/31 | 4,270 | 4,983,859 | |||||||||
Dublin-San Ramon Services District, Refunding RB, 6.00%, 8/01/41 | 2,425 | 2,934,517 | |||||||||
East Bay California Municipal Utility District Water System Revenue, RB, Series A (NPFGC), 5.00%, 6/01/35 | 820 | 845,510 | |||||||||
East Bay California Municipal Utility District Water System Revenue, Refunding RB, Series A, 5.00%, 6/01/36 | 6,615 | 7,509,348 | |||||||||
El Dorado Irrigation District / El Dorado County Water Agency, Refunding RB, Series A (AGM), 5.25%, 3/01/39 | 10,000 | 11,344,400 | |||||||||
Los Angeles Department of Water & Power, RB: | |||||||||||
Power System, Sub-Series A-1, 5.25%, 7/01/38 | 9,000 | 10,098,450 | |||||||||
Series A, 5.38%, 7/01/34 | 3,250 | 3,693,723 | |||||||||
Water Utility Improvement, Sub-Series A-2 (AGM), 5.00%, 7/01/35 | 2,000 | 2,143,160 | |||||||||
Metropolitan Water District of Southern California, RB, Series A, 5.00%, 7/01/37 | 4,000 | 4,376,440 | |||||||||
Sacramento County Sanitation Districts Financing Authority, Refunding RB, Series A, 5.00%, 12/01/44 | 6,000 | 6,748,380 | |||||||||
| ANNUAL REPORT | JULY 31, 2014 | 19 |
| Schedule of Investments (continued) | BlackRock California Municipal Income Trust (BFZ) (Percentages shown are based on Net Assets) |
| Municipal Bonds | Par (000) | Value | |||||||||
California (concluded) | |||||||||||
Utilities (concluded) | |||||||||||
San Diego Public Facilities Financing Authority Sewer, Refunding RB, Senior Series A, 5.25%, 5/15/34 | $ | 11,020 | $ | 12,574,812 | |||||||
State of California Department of Water Resources, Refunding RB, Central Valley Project, Series A-E, 5.00%, 12/01/29 | 6,000 | 6,830,880 | |||||||||
| 140,924,806 | |||||||||||
Total Municipal Bonds in California | 541,542,519 | ||||||||||
Multi-State — 1.6% | |||||||||||
Housing — 1.6% | |||||||||||
Centerline Equity Issuer Trust (d)(e): | |||||||||||
Series A-4-1, 5.75%, 5/15/15 | 500 | 517,275 | |||||||||
Series A-4-2, 6.00%, 5/15/19 | 1,000 | 1,154,110 | |||||||||
Series B-2, 7.20%, 11/15/14 | 3,500 | 3,552,780 | |||||||||
Series B-3-1, 6.00%, 5/15/15 | 1,500 | 1,552,050 | |||||||||
Series B-3-2, 6.30%, 5/15/19 | 1,000 | 1,166,030 | |||||||||
Total Municipal Bonds in Multi-State | 7,942,245 | ||||||||||
Total Municipal Bonds — 108.9% | 549,484,764 | ||||||||||
Municipal Bonds Transferred to Tender Option Bond Trusts (f) | |||||||||||
California — 45.1% | |||||||||||
County/City/Special District/School District — 16.2% | |||||||||||
Los Angeles Community College District California, GO, Series A: | |||||||||||
Election of 2001 (AGM), 5.00%, 8/01/32 | 8,000 | 8,843,280 | |||||||||
Election of 2008, Series C, 5.25%, 8/01/39 (g) | 12,900 | 14,809,716 | |||||||||
Los Angeles Community College District California, GO, Refunding, Election of 2008, Series C, 6.00%, 8/01/33 | 20,131 | 24,039,930 | |||||||||
Los Angeles Unified School District California, GO, Series I, 5.00%, 1/01/34 | 5,000 | 5,612,650 | |||||||||
San Diego Community College District California, GO, Election of 2002, 5.25%, 8/01/33 | 10,484 | 12,076,628 | |||||||||
San Jose Unified School District Santa Clara County California, GO, Election of 2002, Series D, 5.00%, 8/01/32 | 14,625 | 16,383,888 | |||||||||
| 81,766,092 | |||||||||||
| Municipal Bonds Transferred to Tender Option Bond Trusts (f) | Par (000) | Value | |||||||||
California (concluded) | |||||||||||
Education — 8.5% | |||||||||||
California Educational Facilities Authority, RB, University of Southern California, Series B, 5.25%, 10/01/39 (g) | $10,395 | $ | 11,726,599 | ||||||||
Grossmont Union High School District, GO, Election of 2004, 5.00%, 8/01/33 | 13,095 | 13,994,704 | |||||||||
University of California, RB: | |||||||||||
Limited Project, Series D (AGM), 5.00%, 5/15/41 | 2,600 | 2,800,018 | |||||||||
Series O, 5.75%, 5/15/34 | 12,300 | 14,400,061 | |||||||||
| 42,921,382 | |||||||||||
Utilities — 20.4% | |||||||||||
County of Orange California Sanitation District, COP, Series B (AGM), 5.00%, 2/01/37 | 14,700 | 15,950,235 | |||||||||
County of Orange California Water District, COP, Refunding, 5.00%, 8/15/39 | 10,480 | 11,753,530 | |||||||||
County of San Diego California Water Authority, COP, Refunding, Series A (AGM), 5.00%, 5/01/33 | 10,040 | 11,125,424 | |||||||||
Eastern Municipal Water District, COP, Series H, 5.00%, 7/01/33 | 18,002 | 20,132,388 | |||||||||
Los Angeles Department of Water & Power, RB, Power System, Sub-Series A-1 (AMBAC), 5.00%, 7/01/37 | 15,998 | 17,488,904 | |||||||||
Metropolitan Water District of Southern California, RB, Series A, 5.00%, 7/01/37 | 11,180 | 12,232,150 | |||||||||
San Diego Public Facilities Financing Authority Sewer, Refunding RB, Senior Series A, 5.25%, 5/15/39 | 12,457 | 14,124,669 | |||||||||
| 102,807,300 | |||||||||||
Total Municipal Bonds Transferred to Tender Option Bond Trusts — 45.1% | 227,494,774 | ||||||||||
Total Long-Term Investments (Cost — $704,601,238) — 154.0% | 776,979,538 | ||||||||||
Short-Term Securities | Shares | ||||||||||
BIF California Municipal Money Fund, 0.00% (a)(h) | 540,673 | 540,673 | |||||||||
| Par (000) | |||||||||||
California School Cash Reserve Program Authority, RB, Series G, 2.00%, 2/27/15 (a) | $ | 1,665 | 1,679,688 | ||||||||
Total Short-Term Securities (Cost — $2,220,361) — 0.4% | 2,220,361 | ||||||||||
Total Investments (Cost — $706,821,599) — 154.4% | 779,199,899 | ||||||||||
Other Assets Less Liabilities — 0.7% | 3,353,460 | ||||||||||
Liability for TOB Trust Certificates, Including Interest Expense and Fees Payable — (21.1%) | (106,722,227 | ) | |||||||||
VMTP Shares, at Liquidation Value — (34.0%) | (171,300,000 | ) | |||||||||
Net Assets Applicable to Common Shares — 100.0% | $ | 504,531,132 | |||||||||
Notes to Schedule of Investments
| (a) | Represents the current yield as of report date. | |||
| (b) | When-issued security. Unsettled when-issued transactions were as follows: |
| Counterparty | Value | Unrealized Appreciation/ (Depreciation) | ||||||||
Merrill Lynch, Pierce, Fenner & Smith Inc. | $ | 5,659,223 | $ | 101,189 | ||||||
Morgan Stanley & Co. LLC | 985,657 | (9,750 | ) | |||||||
RBC Capital Markets, LLC | 2,763,291 | — | ||||||||
| (c) | U.S. government securities, held in escrow, are used to pay interest on this security, as well as to retire the bond in full at the date indicated, typically at a premium to par. |
| 20 | ANNUAL REPORT | JULY 31, 2014 |
| Schedule of Investments (continued) | BlackRock California Municipal Income Trust (BFZ) |
| (d) | Security exempt from registration pursuant to Rule 144A under the Securities Act of 1933, as amended. These securities may be resold in transactions exempt from registration to qualified institutional investors. | |||
| (e) | Represents a beneficial interest in a trust. The collateral deposited into the trust is federally tax-exempt revenue bonds issued by various state or local governments, or their respective agencies or authorities. The security is subject to remarketing prior to its stated maturity. | |||
| (f) | Represent bonds transferred to a TOB. In exchange for which the Trust received cash and residual interest certificates. These bonds serve as collateral in a financing transaction. See Note 3 of the Notes to Financial Statements for details of municipal bonds transferred to TOBs. | |||
| (g) | All or a portion of security is subject to a recourse agreement, which may require the Trust to pay the liquidity provider in the event there is a shortfall between the TOB trust certificates and proceeds received from the sale of the security contributed to the TOB trust. In the case of a shortfall, the aggregate maximum potential amount the Trust could ultimately be required to pay under the agreements, which expire from October 1, 2016 to August 1, 2018 is $14,008,480. | |||
| (h) | Investments in issuers considered to be an affiliate of the Trust during the year ended July 31, 2014, for purposes of Section 2(a)(3) of the 1940 Act, were as follows: |
| Affiliate | Shares Held at July 31, 2013 | Net Activity | Shares Held at July 31, 2014 | Income | ||||||
BIF California Municipal Money Fund | 1,269,184 | (728,511) | 540,673 | — |
| • | Financial futures contracts outstanding as of July 31, 2014 were as follows: |
| Contracts Sold | Issue | Exchange | Expiration | Notional Value | Unrealized Appreciation | |||||||
(319) | 10-Year U.S. Treasury Note | Chicago Board of Trade | September 2014 | $39,750,391 | $76,811 |
| • | For Trust compliance purposes, the Trust’s sector classifications refer to any one or more of the sector sub-classifications used by one or more widely recognized market indexes or rating group indexes, and/or as defined by the investment advisor. These definitions may not apply for purposes of this report, which may combine such sector sub-classifications for reporting ease. | |||
| • | Fair Value Measurements – Various inputs are used in determining the fair value of investments and derivative financial instruments. These inputs to valuation techniques are categorized into a disclosure hierarchy consisting of three broad levels for financial statement purposes as follows: |
| • | Level 1 – unadjusted price quotations in active markets/exchanges for identical assets or liabilities that the Trust has the ability to access | ||||
| • | Level 2 – other observable inputs (including, but not limited to, quoted prices for similar assets or liabilities in markets that are active, quoted prices for identical or similar assets or liabilities in markets that are not active, inputs other than quoted prices that are observable for the assets or liabilities (such as interest rates, yield curves, volatilities, prepayment speeds, loss severities, credit risks and default rates) or other market-corroborated inputs) | ||||
| • | Level 3 – unobservable inputs based on the best information available in the circumstances, to the extent observable inputs are not available (including the Trust’s own assumptions used in determining the fair value of investments and derivative financial instruments) |
The hierarchy gives the highest priority to unadjusted quoted prices in active markets for identical assets or liabilities (Level 1 measurements) and the lowest priority to unobservable inputs (Level 3 measurements). Accordingly, the degree of judgment exercised in determining fair value is greatest for instruments categorized in Level 3. The inputs used to measure fair value may fall into different levels of the fair value hierarchy. In such cases, for disclosure purposes, the fair value hierarchy classification is determined based on the lowest level input that is significant to the fair value measurement in its entirety. | ||||
Changes in valuation techniques may result in transfers into or out of an assigned level within the disclosure hierarchy. In accordance with the Trust’s policy, transfers between different levels of the fair value disclosure hierarchy are deemed to have occurred as of the beginning of the reporting period. The categorization of a value determined for investments and derivative financial instruments is based on the pricing transparency of the investment and derivative financial instrument and is not necessarily an indication of the risks associated with investing in those securities. For information about the Trust’s policy regarding valuation of investments and derivative financial instruments, please refer to Note 2 of the Notes to Financial Statements. | ||||
The following tables summarize the Trust’s investments and derivative financial instruments categorized in the disclosure hierarchy as of July 31, 2014: |
| Level 1 | Level 2 | Level 3 | Total | |||||||||||||||
Assets: | ||||||||||||||||||
Investments: | ||||||||||||||||||
Long-Term Investments1 | — | $ | 776,979,538 | — | $ | 776,979,538 | ||||||||||||
Short-Term Securities | $ | 540,673 | 1,679,688 | — | 2,220,361 | |||||||||||||
Total | $ | 540,673 | $ | 778,659,226 | — | $ | 779,199,899 | |||||||||||
| 1 | See above Schedule of Investments for values in each sector. |
| Level 1 | Level 2 | Level 3 | Total | |||||||||||||||
Derivative Financial Instruments2 | ||||||||||||||||||
Assets: | ||||||||||||||||||
Interest rate contracts | $ | 76,811 | — | — | $ | 76,811 | ||||||||||||
| 2 | Derivative financial instruments are financial futures contracts, which are valued at the unrealized appreciation/depreciation on the instrument. |
| ANNUAL REPORT | JULY 31, 2014 | 21 |
| Schedule of Investments (concluded) | BlackRock California Municipal Income Trust (BFZ) |
The Trust may hold assets and/or liabilities in which the fair value approximates the carrying amount for financial statement purposes. As of July 31, 2014, such assets and/or liabilities are categorized within the disclosure hierarchy as follows: |
| Level 1 | Level 2 | Level 3 | Total | |||||||||||||||
Assets: | ||||||||||||||||||
Cash pledged for financial futures contracts | $ | 436,000 | — | — | $ | 436,000 | ||||||||||||
Liabilities: | ||||||||||||||||||
TOB trust certificates | — | $ | (106,697,554 | ) | — | (106,697,554 | ) | |||||||||||
VMTP Shares | — | (171,300,000 | ) | — | (171,300,000 | ) | ||||||||||||
Total | $ | 436,000 | $ | (277,997,554 | ) | — | $ | (277,561,554 | ) | |||||||||
There were no transfers between levels during the year ended July 31, 2014. |
| 22 | ANNUAL REPORT | JULY 31, 2014 |
| Schedule of Investments July 31, 2014 | BlackRock Florida Municipal 2020 Term Trust (BFO) (Percentages shown are based on Net Assets) |
| Municipal Bonds | Par (000) | Value | |||||||||
Florida — 98.9% | |||||||||||
Corporate — 4.1% | |||||||||||
County of Hillsborough Florida IDA, Refunding RB, Tampa Electric Co. Project, Series A, 5.65%, 5/15/18 | $ | 1,000 | $ | 1,151,820 | |||||||
County of Palm Beach Florida Solid Waste Authority, Refunding RB, 5.00%, 10/01/20 | 2,000 | 2,365,500 | |||||||||
| 3,517,320 | |||||||||||
County/City/Special District/School District — 31.6% | |||||||||||
City of Jacksonville Florida, Refunding RB, Better Jacksonville Sales Tax, 5.00%, 10/01/20 | 4,000 | 4,736,120 | |||||||||
County of Broward Florida School Board, COP, Refunding, Series A, 5.00%, 7/01/20 | 2,000 | 2,325,960 | |||||||||
County of Broward Florida School Board, COP, Series A (AGM), 5.25%, 7/01/22 | 2,500 | 2,841,400 | |||||||||
County of Hillsborough Florida, RB, (AMBAC), 5.00%, 11/01/20 | 5,545 | 6,214,337 | |||||||||
County of Miami-Dade Florida School Board, COP, Refunding, Series B (AGC), 5.25%, 5/01/21 | 4,000 | 4,538,560 | |||||||||
County of Northern Palm Beach Florida Improvement District, Refunding, Special Assessment Bonds, Water Control & Improvement District No. 43, Series B (ACA), 4.50%, 8/01/22 | 1,000 | 1,008,370 | |||||||||
Florida State Board of Education, GO, Refunding, Capital Outlay, Series B, 5.00%, 6/01/20 | 485 | 573,930 | |||||||||
Sterling Hill Community Development District, Refunding, Special Assessment Bonds, Series A, 6.10%, 5/01/23 | 3,015 | 2,304,214 | |||||||||
Stevens Plantation Florida Imports Project Dependent Special District, RB, 6.38%, 12/31/49 (a)(b) | 2,425 | 1,809,195 | |||||||||
Watergrass Community Development District Florida, Special Assessment Bonds, Series B, 5.13%, 11/01/14 | 800 | 771,072 | |||||||||
| 27,123,158 | |||||||||||
Education — 2.9% | |||||||||||
County of Orange Florida Educational Facilities Authority, RB, Rollins College Project (AMBAC), 5.25%, 12/01/22 | 725 | 821,410 | |||||||||
Florida State Board of Governors, Refunding RB, University of Central Florida, Series A, 5.00%, 7/01/18 | 500 | 568,980 | |||||||||
Florida State Higher Educational Facilities Financial Authority, Refunding RB, University of Tampa Project, Series A, 5.00%, 4/01/20 | 1,000 | 1,123,990 | |||||||||
| 2,514,380 | |||||||||||
Health — 15.7% | |||||||||||
County of Highlands Florida Health Facilities Authority, Refunding RB, Hospital, Adventist Health, Series I, 5.00%, 11/15/20 | 2,155 | 2,517,665 | |||||||||
County of Hillsborough Florida IDA, RB, H. Lee Moffitt Cancer Center Project, Series A, 5.25%, 7/01/22 | 1,500 | 1,610,940 | |||||||||
County of Marion Florida Hospital District, Refunding RB, Health System, Munroe Regional, 5.00%, 10/01/17 (c) | 1,500 | 1,703,400 | |||||||||
County of Orange Florida Health Facilities Authority, Refunding RB, Mayflower Retirement Center: | |||||||||||
3.00%, 6/01/15 | �� | 200 | 203,046 | ||||||||
3.00%, 6/01/16 | 140 | 142,925 | |||||||||
3.00%, 6/01/17 | 190 | 196,747 | |||||||||
3.25%, 6/01/18 | 195 | 203,580 | |||||||||
3.50%, 6/01/19 | 200 | 209,326 | |||||||||
County of Palm Beach Florida Health Facilities Authority, Refunding RB: | |||||||||||
Acts Retirement-Life Communities, Inc., 5.00%, 11/15/22 | 4,735 | 5,209,447 | |||||||||
| Municipal Bonds | Par (000) | Value | |||||||||
Florida (concluded) | |||||||||||
Health (concluded) | |||||||||||
County of Palm Beach Florida Health Facilities Authority, Refunding RB (concluded): | |||||||||||
Bethesda Healthcare System Project, Series A (AGM), 5.00%, 7/01/20 | $ | 1,285 | $ | 1,490,150 | |||||||
| 13,487,226 | |||||||||||
Housing — 0.9% | |||||||||||
County of Manatee Florida Housing Finance Authority, RB, S/F Housing, Series A, AMT (Ginnie Mae, Fannie Mae & Freddie Mac), 5.90%, 9/01/40 | 220 | 224,365 | |||||||||
Florida Housing Finance Corp., RB, Homeowner Mortgage, Series 2, AMT (Ginnie Mae, Fannie Mae & Freddie Mac), 4.70%, 7/01/22 | 445 | 457,081 | |||||||||
Jacksonville Housing Finance Authority, Refunding RB, Series A-1, AMT (Ginnie Mae, Fannie Mae & Freddie Mac), 5.63%, 10/01/39 | 130 | 131,222 | |||||||||
| 812,668 | |||||||||||
State — 13.8% | |||||||||||
Florida Municipal Loan Council, RB, Series D (AGM): | |||||||||||
5.00%, 10/01/19 | 1,050 | 1,212,771 | |||||||||
4.00%, 10/01/20 | 1,105 | 1,215,390 | |||||||||
4.00%, 10/01/21 | 500 | 545,830 | |||||||||
Florida Municipal Loan Council, Refunding RB: | |||||||||||
CAB, Series A (NPFGC), 0.00%, 4/01/20 (d) | 4,000 | 3,380,840 | |||||||||
Series B-2 (AGM), 4.00%, 10/01/20 | 655 | 716,190 | |||||||||
State of Florida Board of Education, GO, Refunding, Capital Outlay, Series B, 5.00%, 6/01/20 | 1,000 | 1,189,750 | |||||||||
State of Florida Department of Environmental Protection, Refunding RB, Series A, 5.00%, 7/01/20 | 3,000 | 3,536,520 | |||||||||
| 11,797,291 | |||||||||||
Transportation — 20.5% | |||||||||||
County of Broward Florida, Refunding ARB, Series P-1, AMT, 5.00%, 10/01/20 | 2,500 | 2,925,475 | |||||||||
County of Broward Florida Fuel System, RB, Lauderdale Fuel Facilities, Series A (AGM), AMT, 5.00%, 4/01/20 | 160 | 180,219 | |||||||||
County of Broward Florida Port Facilities, Refunding RB, Series B, AMT, 5.00%, 9/01/20 | 2,500 | 2,897,950 | |||||||||
County of Lee Florida Transportation Facilities, Refunding RB, Series B (AMBAC): | |||||||||||
5.00%, 10/01/20 | 2,250 | 2,265,638 | |||||||||
5.00%, 10/01/22 | 3,000 | 3,019,800 | |||||||||
County of Miami-Dade Florida, Refunding RB, Series A, AMT, 5.00%, 10/01/20 | 1,375 | 1,604,240 | |||||||||
County of Miami-Dade Florida Expressway Authority, Refunding RB, Toll System, Series A, 5.00%, 7/01/20 | 1,500 | 1,763,190 | |||||||||
County of Miami-Dade Florida Transit System Sales Surtax, Refunding RB, 5.00%, 7/01/20 | 550 | 647,686 | |||||||||
Greater Orlando Aviation Authority, Refunding RB, Series C, 5.00%, 10/01/20 | 1,130 | 1,335,061 | |||||||||
Jacksonville Florida Port Authority, Refunding RB, AMT, 4.00%, 11/01/20 | 865 | 922,626 | |||||||||
| 17,561,885 | |||||||||||
Utilities — 9.4% | |||||||||||
City of North Miami Florida Beach Water Revenue, RB, 5.00%, 8/01/20 | 1,200 | 1,392,408 | |||||||||
County of Miami-Dade Florida Water & Sewer System, Refunding RB, Series B (AGM), 5.25%, 10/01/19 | 4,000 | 4,731,960 | |||||||||
Florida Governmental Utility Authority, RB, Golden Gate Utility System (AGM), 5.00%, 7/01/19 | 510 | 581,813 | |||||||||
Florida Governmental Utility Authority, Refunding RB, Lehigh Utility (AGM), 5.00%, 10/01/20 | 635 | 731,151 | |||||||||
Town of Davie Florida, Refunding RB, Nova Southeastern University Project, Series B, 5.00%, 4/01/20 | 530 | 598,471 | |||||||||
| 8,035,803 | |||||||||||
Total Municipal Bonds in Florida | 84,849,731 | ||||||||||
| ANNUAL REPORT | JULY 31, 2014 | 23 |
| Schedule of Investments (continued) | BlackRock Florida Municipal 2020 Term Trust (BFO) (Percentages shown are based on Net Assets) |
| Municipal Bonds | Par (000) | Value | |||||||||
Guam — 0.6% | |||||||||||
Utilities — 0.6% | |||||||||||
Guam Government Waterworks Authority, RB, 5.25%, 7/01/20 | $ | 100 | $ | 114,475 | |||||||
Guam Power Authority, Refunding RB, Series A (AGM), 5.00%, 10/01/20 | 310 | 359,740 | |||||||||
Total Municipal Bonds in Guam | 474,215 | ||||||||||
Total Municipal Bonds — 99.5% | 85,323,946 | ||||||||||
Municipal Bonds Transferred to Tender Option Bond Trusts (e) | |||||||||||
Florida — 0.3% | |||||||||||
Housing — 0.3% | |||||||||||
County of Lee Florida Housing Finance Authority, RB, S/F Housing, Multi-County Program, Series A-2, AMT (Ginnie Mae), 6.00%, 9/01/40 | 285 | 294,758 | |||||||||
Total Long-Term Investments (Cost — $81,817,798) — 99.8% | 85,618,704 | ||||||||||
| Short-Term Securities | Shares | Value | ||||||||
FFI Institutional Tax-Exempt Fund, 0.03% (f)(g) | 123,907 | $ | 123,907 | |||||||
Total Short-Term Securities (Cost — $123,907) — 0.2% | 123,907 | |||||||||
Total Investments (Cost — $81,941,705) — 100.0% | 85,742,611 | |||||||||
Other Assets Less Liabilities — 0.9% | 820,927 | |||||||||
Liability for TOB Trust Certificates, Including Interest Expense and Fees Payable — (0.2%) | (190,095 | ) | ||||||||
AMPS, at Redemption Value — (0.7%) | (625,000 | ) | ||||||||
Net Assets Applicable to Common Shares — 100.0% | $ | 85,748,443 | ||||||||
Notes to Schedule of Investments
| (a) | Non-income producing security. | |||
| (b) | Issuer filed for bankruptcy and/or is in default of principal and/or interest payments. | |||
| (c) | U.S. government securities, held in escrow, are used to pay interest on this security, as well as to retire the bond in full at the date indicated, typically at a premium to par. | |||
| (d) | Zero-coupon bond. | |||
| (e) | Represent bonds transferred to a TOB. In exchange for which the Trust received cash and residual interest certificates. These bonds serve as collateral in a financing transaction. See Note 3 of the Notes to Financial Statements for details of municipal bonds transferred to TOBs. | |||
| (f) | Investments in issuers considered to be an affiliate of the Trust during the year ended July 31, 2014, for purposes of Section 2(a)(3) of the 1940 Act, were as follows: |
| Affiliate | Shares Held at July 31, 2013 | Net Activity | Shares Held at July 31, 2014 | Income | ||||||
FFI Institutional Tax-Exempt Fund | 2,293,772 | (2,169,865) | 123,907 | $857 |
| (g) | Represents the current yield as of report date. | |||
| • | For Trust compliance purposes, the Trust’s sector classifications refer to any one or more of the sector sub-classifications used by one or more widely recognized market indexes or rating group indexes, and/or as defined by the investment advisor. These definitions may not apply for purposes of this report, which may combine such sector sub-classifications for reporting ease. | |||
| • | Fair Value Measurements – Various inputs are used in determining the fair value of investments. These inputs to valuation techniques are categorized into a disclosure hierarchy consisting of three broad levels for financial statement purposes as follows: |
| • | Level 1 – unadjusted price quotations in active markets/exchanges for identical assets or liabilities that the Trust has the ability to access | |||
| • | Level 2 – other observable inputs (including, but not limited to, quoted prices for similar assets or liabilities in markets that are active, quoted prices for identical or similar assets or liabilities in markets that are not active, inputs other than quoted prices that are observable for the assets or liabilities (such as interest rates, yield curves, volatilities, prepayment speeds, loss severities, credit risks and default rates) or other market-corroborated inputs) | |||
| • | Level 3 – unobservable inputs based on the best information available in the circumstances, to the extent observable inputs are not available (including the Trust’s own assumptions used in determining the fair value of investments) |
The hierarchy gives the highest priority to unadjusted quoted prices in active markets for identical assets or liabilities (Level 1 measurements) and the lowest priority to unobservable inputs (Level 3 measurements). Accordingly, the degree of judgment exercised in determining fair value is greatest for instruments categorized in Level 3. The inputs used to measure fair value may fall into different levels of the fair value hierarchy. In such cases, for disclosure purposes, the fair value hierarchy classification is determined based on the lowest level input that is significant to the fair value measurement in its entirety. |
| 24 | ANNUAL REPORT | JULY 31, 2014 |
| Schedule of Investments (concluded) | BlackRock Florida Municipal 2020 Term Trust (BFO) |
Changes in valuation techniques may result in transfers into or out of an assigned level within the disclosure hierarchy. In accordance with the Trust’s policy, transfers between different levels of the fair value disclosure hierarchy are deemed to have occurred as of the beginning of the reporting period. The categorization of a value determined for investments is based on the pricing transparency of the investment and is not necessarily an indication of the risks associated with investing in those securities. For information about the Trust’s policy regarding valuation of investments, please refer to Note 2 of the Notes to Financial Statements. | ||||
The following table summarizes the Trust’s investments categorized in the disclosure hierarchy as of July 31, 2014: |
| Level 1 | Level 2 | Level 3 | Total | |||||||||||||||
Assets: | ||||||||||||||||||
Investments: | ||||||||||||||||||
Long-Term Investments1 | — | $ | 85,618,704 | — | $ | 85,618,704 | ||||||||||||
Short-Term Securities | $ | 123,907 | — | — | 123,907 | |||||||||||||
| Total | ||||||||||||||||||
| 1 | See above Schedule of Investments for values in each sector. |
The Trust may hold liabilities in which the fair value approximates the carrying amount for financial statement purposes. As of July 31, 2014, TOB trust certificates of $190,000 is categorized as Level 2 within the disclosure hierarchy. | ||||
There were no transfers between levels during the year ended July 31, 2014. |
| ANNUAL REPORT | JULY 31, 2014 | 25 |
| Schedule of Investments July 31, 2014 | BlackRock Municipal Income Investment Trust (BBF) (Percentages shown are based on Net Assets) |
| Municipal Bonds | Par (000) | Value | ||||||||
Alabama — 0.3% | ||||||||||
City of Selma Alabama IDB, RB, Gulf Opportunity Zone, International Paper Co. Project, Series A, 5.38%, 12/01/35 | $ | 275 | $ | 300,548 | ||||||
Alaska — 0.2% | ||||||||||
Northern Tobacco Securitization Corp., Refunding RB, Tobacco Settlement, Asset-Backed, Series A, 5.00%, 6/01/46 | 330 | 244,880 | ||||||||
California — 15.0% | ||||||||||
California Educational Facilities Authority, RB, University of Southern California, Series A, 5.25%, 10/01/38 | 1,315 | 1,483,452 | ||||||||
California Health Facilities Financing Authority, Refunding RB, Catholic Healthcare West, Series A, 6.00%, 7/01/39 | 890 | 987,553 | ||||||||
Kern Community College District, GO, Safety, Repair & Improvement, Election of 2002, Series C, 5.50%, 11/01/33 | 775 | 914,663 | ||||||||
Los Angeles Department of Water & Power, RB, Power System, Sub-Series A-1, 5.25%, 7/01/38 | 1,750 | 1,963,587 | ||||||||
San Diego Regional Building Authority, RB, County Operations Center & Annex, Series A, 5.38%, 2/01/36 | 1,600 | 1,825,344 | ||||||||
State of California, GO, Various Purposes, 6.00%, 3/01/33 | 1,275 | 1,529,707 | ||||||||
State of California Public Works Board, RB: | ||||||||||
Department of Corrections & Rehabilitation, Series F, 5.25%, 9/01/33 | 400 | 457,400 | ||||||||
Various Capital Projects, Series I, 5.50%, 11/01/31 | 1,600 | 1,889,888 | ||||||||
Various Capital Projects, Series I, 5.50%, 11/01/33 | 1,500 | 1,773,075 | ||||||||
Township of Washington California Health Care District, GO, Election of 2004, Series B, 5.50%, 8/01/40 | 300 | 349,431 | ||||||||
University of California, Refunding RB, Medical Center Regents, Series J, 5.25%, 5/15/38 | 1,780 | 2,016,704 | ||||||||
| 15,190,804 | ||||||||||
Colorado — 2.3% | ||||||||||
City & County of Denver Colorado Airport System, ARB, Sub-System, Series B, 5.25%, 11/15/32 | 1,000 | 1,118,350 | ||||||||
Colorado Health Facilities Authority, Refunding RB, Catholic Health Initiative, Series A, 5.50%, 7/01/34 | 1,095 | 1,247,172 | ||||||||
| 2,365,522 | ||||||||||
Florida — 6.0% | ||||||||||
City of Jacksonville Florida, Refunding RB, Series A, 5.25%, 10/01/33 | 265 | 297,547 | ||||||||
County of Miami-Dade Florida, RB, Seaport, Series A, 6.00%, 10/01/38 | 3,800 | 4,356,206 | ||||||||
Reedy Creek Improvement District, GO, Series A, 5.25%, 6/01/32 | 570 | 639,221 | ||||||||
Watergrass Community Development District Florida, Special Assessment Bonds, Series B, 5.13%, 11/01/14 | 800 | 771,072 | ||||||||
| 6,064,046 | ||||||||||
Georgia — 1.8% | ||||||||||
Municipal Electric Authority of Georgia, Refunding RB, Project One, Sub-Series D, 6.00%, 1/01/23 | 1,565 | 1,845,902 | ||||||||
Illinois — 22.8% | ||||||||||
City of Chicago Illinois, GARB, O’Hare International Airport, 3rd Lien, Series C, 6.50%, 1/01/41 | 2,955 | 3,535,362 | ||||||||
City of Chicago Illinois, Refunding RB, Series A: | ||||||||||
Sales Tax, 5.25%, 1/01/38 | 500 | 535,445 | ||||||||
Waterworks, 2nd Lien (AMBAC), 5.00%, 11/01/36 | 1,000 | 1,031,250 | ||||||||
City of Chicago Illinois Transit Authority, RB: | ||||||||||
5.25%, 12/01/31 | 1,060 | 1,165,343 | ||||||||
Sales Tax Receipts, 5.25%, 12/01/36 | 1,000 | 1,087,990 | ||||||||
Sales Tax Receipts, 5.25%, 12/01/40 | 1,000 | 1,083,340 | ||||||||
| Municipal Bonds | Par (000) | Value | ||||||||
Illinois (concluded) | ||||||||||
City of Chicago Illinois Transit Authority, RB (concluded): | ||||||||||
Sales Tax Receipts, 5.00%, 12/01/44 | $ | 600 | $ | 641,430 | ||||||
County of Cook Illinois Community College District No. 508, GO, City College of Chicago: | ||||||||||
5.50%, 12/01/38 | 1,000 | 1,117,480 | ||||||||
5.25%, 12/01/43 | 3,500 | 3,781,155 | ||||||||
Illinois Finance Authority, RB: | ||||||||||
Carle Foundation, Series A, 6.00%, 8/15/41 | 1,000 | 1,134,080 | ||||||||
Rush University Medical Center, Series B, 7.25%, 11/01/30 | 1,600 | 1,909,536 | ||||||||
Illinois Finance Authority, Refunding RB, Northwestern Memorial Hospital, Series A, 6.00%, 8/15/39 | 1,900 | 2,193,512 | ||||||||
Railsplitter Tobacco Settlement Authority, RB: | ||||||||||
5.50%, 6/01/23 | 690 | 802,677 | ||||||||
6.00%, 6/01/28 | 195 | 226,964 | ||||||||
State of Illinois, GO: | ||||||||||
5.25%, 2/01/31 | 475 | 500,042 | ||||||||
5.25%, 2/01/32 | 1,000 | 1,047,220 | ||||||||
5.50%, 7/01/33 | 1,000 | 1,068,200 | ||||||||
5.50%, 7/01/38 | 210 | 222,428 | ||||||||
| 23,083,454 | ||||||||||
Indiana — 2.5% | ||||||||||
Indiana Municipal Power Agency, RB, Series B, 6.00%, 1/01/39 | 2,210 | 2,496,924 | ||||||||
Kansas — 1.8% | ||||||||||
Kansas Development Finance Authority, Refunding RB, Adventist Health System/Sunbelt Obligated Group, Series C, 5.50%, 11/15/29 | 1,600 | 1,802,544 | ||||||||
Kentucky — 0.6% | ||||||||||
County of Louisville & Jefferson Kentucky Metropolitan Government Parking Authority, RB, Series A, 5.75%, 12/01/34 | 500 | 591,055 | ||||||||
Louisiana — 1.5% | ||||||||||
Louisiana Local Government Environmental Facilities & Community Development Authority, RB, Westlake Chemical Corp. Project, Series A-1, 6.50%, 11/01/35 | 715 | 820,806 | ||||||||
Tobacco Settlement Financing Corp., Refunding RB, Asset-Backed, Series A, 5.50%, 5/15/29 | 600 | 656,328 | ||||||||
| 1,477,134 | ||||||||||
Maine — 1.5% | ||||||||||
Maine Health & Higher Educational Facilities Authority, RB, Maine General Medical Center, 7.50%, 7/01/32 | 1,270 | 1,466,494 | ||||||||
Massachusetts — 1.1% | ||||||||||
Massachusetts Health & Educational Facilities Authority, RB, Tufts University, Series O, 5.38%, 8/15/38 | 1,000 | 1,132,780 | ||||||||
Michigan — 3.5% | ||||||||||
City of Lansing Michigan, RB, Board of Water & Light Utilities System, Series A, 5.50%, 7/01/41 | 915 | 1,062,480 | ||||||||
Michigan State Building Authority, Refunding RB, Facilities Program, Series I, 6.00%, 10/15/38 | 1,000 | 1,147,790 | ||||||||
Royal Oak Hospital Finance Authority Michigan, Refunding RB, William Beaumont Hospital, Series V, 8.25%, 9/01/18 (a) | 995 | 1,283,341 | ||||||||
| 3,493,611 | ||||||||||
Mississippi — 2.4% | ||||||||||
Mississippi Development Bank, RB, Jackson Water & Sewer System Project (AGM), 6.88%, 12/01/40 | 1,000 | 1,300,080 | ||||||||
Mississippi State University Educational Building Corp., Refunding RB, Mississippi State University Improvement Project, 5.25%, 8/01/38 | 1,000 | 1,133,280 | ||||||||
| 2,433,360 | ||||||||||
Nevada — 5.0% | ||||||||||
City of Las Vegas Nevada, GO, Limited Tax, Performing Arts Center, 6.00%, 4/01/34 | 1,600 | 1,858,192 | ||||||||
| 26 | ANNUAL REPORT | JULY 31, 2014 |
| Schedule of Investments (continued) | BlackRock Municipal Income Investment Trust (BBF) (Percentages shown are based on Net Assets) |
| Municipal Bonds | Par (000) | Value | ||||||||
Nevada (concluded) | ||||||||||
County of Clark Nevada, GO, Limited Tax, 5.00%, 6/01/38 | $ | 1,000 | $ | 1,081,780 | ||||||
County of Clark Nevada Airport System, ARB, Series B, 5.75%, 7/01/42 | 1,825 | 2,114,883 | ||||||||
| 5,054,855 | ||||||||||
New Jersey — 4.3% | ||||||||||
New Jersey Housing & Mortgage Finance Agency, RB, S/F Housing, Series CC, 5.25%, 10/01/29 | 1,140 | 1,216,049 | ||||||||
New Jersey Transportation Trust Fund Authority, RB, Transportation System: | ||||||||||
Series A, 5.88%, 12/15/38 | 1,295 | 1,504,971 | ||||||||
Series AA, 5.50%, 6/15/39 | 1,485 | 1,641,742 | ||||||||
| 4,362,762 | ||||||||||
New York — 5.8% | ||||||||||
Hudson Yards Infrastructure Corp., RB, Senior, Fiscal 2012, Series A, 5.75%, 2/15/47 | 1,000 | 1,137,630 | ||||||||
New York Liberty Development Corp., Refunding RB, 2nd Priority, Bank of America Tower at One Bryant Park Project, Class 3, 6.38%, 7/15/49 | 980 | 1,078,931 | ||||||||
State of New York Dormitory Authority, ERB, Series B, 5.25%, 3/15/38 | 3,250 | 3,679,618 | ||||||||
| 5,896,179 | ||||||||||
Ohio — 3.5% | ||||||||||
County of Allen Ohio Hospital Facilities, Refunding RB, Catholic Healthcare Partners, Series A, 5.25%, 6/01/38 | 1,565 | 1,683,502 | ||||||||
State of Ohio Turnpike Commission, RB, Junior Lien, Infrastructure Projects, Series A-1: | ||||||||||
5.25%, 2/15/30 | 790 | 894,391 | ||||||||
5.25%, 2/15/31 | 885 | 996,359 | ||||||||
| 3,574,252 | ||||||||||
Pennsylvania — 5.0% | ||||||||||
Pennsylvania Economic Development Financing Authority, RB, American Water Co. Project, 6.20%, 4/01/39 | 500 | 573,165 | ||||||||
Pennsylvania Turnpike Commission, RB, Sub-Series A: | ||||||||||
5.63%, 12/01/31 | 1,250 | 1,392,150 | ||||||||
6.00%, 12/01/41 | 1,500 | 1,634,625 | ||||||||
State of Pennsylvania Turnpike Commission, RB, Series A, 5.00%, 12/01/44 | 360 | 394,358 | ||||||||
Township of Bristol Pennsylvania School District, GO, 5.25%, 6/01/37 | 1,000 | 1,107,100 | ||||||||
| 5,101,398 | ||||||||||
South Carolina — 1.4% | ||||||||||
County of Charleston South Carolina, RB, Special Source, 5.25%, 12/01/38 | 1,190 | 1,368,857 | ||||||||
Texas — 12.5% | ||||||||||
Central Texas Regional Mobility Authority, Refunding RB, Senior Lien, 6.00%, 1/01/41 | 1,670 | 1,860,814 | ||||||||
City of Beaumont Texas, GO, Certificates of Obligation, 5.25%, 3/01/37 | 745 | 846,834 | ||||||||
Conroe Texas ISD, GO, School Building, Series A, 5.75%, 2/15/35 | 890 | 1,017,697 | ||||||||
County of Tarrant Texas Cultural Education Facilities Finance Corp., RB, Scott & White Healthcare, 6.00%, 8/15/45 | 1,905 | 2,278,913 | ||||||||
Lower Colorado River Authority, Refunding RB: | ||||||||||
5.50%, 5/15/19 (a) | 90 | 107,231 | ||||||||
5.50%, 5/15/33 | 1,910 | 2,097,295 | ||||||||
North Texas Tollway Authority, RB, Special Projects, Series A, 5.50%, 9/01/41 | 1,000 | 1,137,920 | ||||||||
North Texas Tollway Authority, Refunding RB, 1st Tier System, Series K-1 (AGC), 5.75%, 1/01/38 | 1,000 | 1,139,120 | ||||||||
Red River Education Financing Corp., RB, Texas Christian University Project, 5.25%, 3/15/38 | 340 | 385,567 | ||||||||
| Municipal Bonds | Par (000) | Value | |||||||||
Texas (concluded) | |||||||||||
Texas Private Activity Bond Surface Transportation Corp., RB, Senior Lien, NTE Mobility Partners LLC, North Tarrant Express Managed Lanes Project, 6.88%, 12/31/39 | $ | 1,505 | $ | 1,766,735 | |||||||
| 12,638,126 | |||||||||||
Virginia — 1.5% | |||||||||||
City of Lexington Virginia IDA, RB, Washington & Lee University, 5.00%, 1/01/43 | 280 | 308,372 | |||||||||
Virginia Public School Authority, RB, Fluvanna County School Financing, 6.50%, 12/01/18 (a) | 1,000 | 1,233,120 | |||||||||
| 1,541,492 | |||||||||||
Wisconsin — 1.8% | |||||||||||
Wisconsin Health & Educational Facilities Authority, Refunding RB, Froedtert & Community Health, Inc., Series C, 5.25%, 4/01/39 | 1,675 | 1,785,986 | |||||||||
Total Municipal Bonds — 104.1% | 105,312,965 | ||||||||||
Municipal Bonds Transferred to Tender Option Bond Trusts (b) | |||||||||||
California — 19.4% | |||||||||||
California Educational Facilities Authority, RB, University of Southern California, Series B, 5.25%, 10/01/39 (c) | 1,995 | 2,250,560 | |||||||||
Grossmont Union High School District, GO, Election of 2008, Series B, 5.00%, 8/01/40 | 2,400 | 2,596,008 | |||||||||
Los Angeles Community College District California, GO, Election of 2008, Series C, 5.25%, 8/01/39 (c) | 2,630 | 3,019,345 | |||||||||
Los Angeles Community College District California, GO, Refunding, Election of 2008, Series A, 6.00%, 8/01/33 | 3,898 | 4,655,200 | |||||||||
Los Angeles Unified School District California, GO, Series I, 5.00%, 1/01/34 | 400 | 449,012 | |||||||||
San Diego Public Facilities Financing Authority Water, RB, Series B, 5.50%, 8/01/39 | 4,214 | 4,894,642 | |||||||||
University of California, RB, Series O, 5.75%, 5/15/34 | 1,500 | 1,756,105 | |||||||||
| 19,620,872 | |||||||||||
District of Columbia — 3.6% | |||||||||||
District of Columbia, RB, Series A, 5.50%, 12/01/30 (c) | 1,395 | 1,639,632 | |||||||||
District of Columbia Water & Sewer Authority, Refunding RB, Senior Lien, Series A, 5.50%, 10/01/39 | 1,799 | 2,027,813 | |||||||||
| 3,667,445 | |||||||||||
Illinois — 3.2% | |||||||||||
State of Illinois Finance Authority, RB, University of Chicago, Series B, 6.25%, 7/01/18 (a) | 2,800 | 3,219,860 | |||||||||
Nevada — 5.2% | |||||||||||
County of Clark Nevada Water Reclamation District, GO: | |||||||||||
Limited Tax, 6.00%, 7/01/38 | 2,500 | 2,902,050 | |||||||||
Series B, 5.50%, 7/01/29 | 1,994 | 2,337,151 | |||||||||
| 5,239,201 | |||||||||||
New Hampshire — 1.2% | |||||||||||
New Hampshire Health & Education Facilities Authority, RB, Dartmouth College, 5.25%, 6/01/39 (c) | 1,094 | 1,243,496 | |||||||||
New Jersey — 3.9% | |||||||||||
New Jersey Transportation Trust Fund Authority, RB, Transportation System: | |||||||||||
Series A (AMBAC), 5.00%, 12/15/32 | 2,000 | 2,201,220 | |||||||||
Series B, 5.25%, 6/15/36 (c) | 1,640 | 1,783,977 | |||||||||
| 3,985,197 | |||||||||||
New York — 13.2% | |||||||||||
City of New York New York Municipal Water Finance Authority, RB, Fiscal 2009, Series A, 5.75%, 6/15/40 | 1,410 | 1,613,109 | |||||||||
| ANNUAL REPORT | JULY 31, 2014 | 27 |
| Schedule of Investments (continued) | BlackRock Municipal Income Investment Trust (BBF) (Percentages shown are based on Net Assets) |
| Municipal Bonds Transferred to Tender Option Bond Trusts (b) | Par (000) | Value | ||||||||
New York (concluded) | ||||||||||
City of New York New York Municipal Water Finance Authority, Refunding RB, Water & Sewer System, 2nd General Resolution: | ||||||||||
Series FF, 5.00%, 6/15/45 | $ | 1,500 | $ | 1,632,610 | ||||||
Series FF-2, 5.50%, 6/15/40 | 1,995 | 2,281,907 | ||||||||
City of New York New York Transitional Finance Authority, BARB, Fiscal 2009, Series S-3, 5.25%, 1/15/39 | 1,500 | 1,678,946 | ||||||||
New York Liberty Development Corp., RB, 1 World Trade Center Port Authority Consolidated, 5.25%, 12/15/43 | 2,205 | 2,429,645 | ||||||||
New York Liberty Development Corp., Refunding RB, 4 World Trade Center Project, 5.75%, 11/15/51 (c) | 1,300 | 1,457,352 | ||||||||
New York State Dormitory Authority, ERB, Personal Income Tax, Series B, 5.25%, 3/15/38 | 2,000 | 2,264,380 | ||||||||
| 13,357,949 | ||||||||||
Texas — 5.4% | ||||||||||
City of San Antonio Texas Public Service Board, Refunding RB, Series A, 5.25%, 2/01/31 (c) | 2,025 | 2,296,065 | ||||||||
County of Harris Texas Cultural Education Facilities Finance Corp., RB, Texas Children’s Hospital Project, 5.50%, 10/01/39 | 2,750 | 3,151,748 | ||||||||
| 5,447,813 | ||||||||||
| Municipal Bonds | Par (000) | Value | |||||||||
Virginia — 1.0% | |||||||||||
County of Fairfax Virginia IDA, Refunding RB, Health Care, Inova Health System, Series A, 5.50%, 5/15/35 | $ | 899 | $ | 998,956 | |||||||
Total Municipal Bonds Transferred to Tender Option Bond Trusts — 56.1% | 56,780,789 | ||||||||||
Total Long-Term Investments (Cost — $145,583,866) — 160.2% | 162,093,754 | ||||||||||
Short-Term Securities | Shares | ||||||||||
FFI Institutional Tax-Exempt Fund, 0.03% (d)(e) | 1,298,709 | 1,298,709 | |||||||||
Total Short-Term Securities (Cost — $1,298,709) — 1.3% | 1,298,709 | ||||||||||
Total Investments (Cost — $146,882,575) — 161.5% | 163,392,463 | ||||||||||
Other Assets Less Liabilities — 1.6% | 1,658,663 | ||||||||||
Liability for TOB Trust Certificates, Including Interest Expense and Fees Payable — (29.3%) | (29,688,361 | ) | |||||||||
VRDP Shares, at Liquidation Value — (33.8%) | (34,200,000 | ) | |||||||||
Net Assets Applicable to Common Shares — 100.0% | $ | 101,162,765 | |||||||||
Notes to Schedule of Investments
| (a) | U.S. government securities, held in escrow, are used to pay interest on this security, as well as to retire the bond in full at the date indicated, typically at a premium to par. | |||
| (b) | Represent bonds transferred to a TOB. In exchange for which the Trust received cash and residual interest certificates. These bonds serve as collateral in a financing transaction. See Note 3 of the Notes to Financial Statements for details of municipal bonds transferred to TOBs. | |||
| (c) | All or a portion of security is subject to a recourse agreement, which may require the Trust to pay the liquidity provider in the event there is a shortfall between the TOB trust certificates and proceeds received from the sale of the security contributed to the TOB trust. In the case of a shortfall, the aggregate maximum potential amount the Trust could ultimately be required to pay under the agreements, which expire from October 1, 2016 to November 15, 2019 is $7,865,394. | |||
| (d) | Investments in issuers considered to be an affiliate of the Trust during the year ended July 31, 2014, for purposes of Section 2(a)(3) of the 1940 Act, were as follows: |
| Affiliate | Shares Held at July 31, 2013 | Net Activity | Shares Held at July 31, 2014 | Income | ||||||||||||||
FFI Institutional Tax-Exempt Fund | 4,710,703 | (3,411,994) | 1,298,709 | $626 | ||||||||||||||
| (e) | Represents the current yield as of report date. | |||
| • | Financial futures contracts outstanding as of July 31, 2014 were as follows: |
| Contracts Sold | Issue | Exchange | Expiration | Notional Value | Unrealized Appreciation | |||||||
(64) | 10-Year U.S. Treasury Note | Chicago Board of Trade | September 2014 | $7,975,000 | $27,410 |
| • | Fair Value Measurements – Various inputs are used in determining the fair value of investments and derivative financial instruments. These inputs to valuation techniques are categorized into a disclosure hierarchy consisting of three broad levels for financial statement purposes as follows: |
| • | Level 1 – unadjusted price quotations in active markets/exchanges for identical assets or liabilities that the Trust has the ability to access | |||
| • | Level 2 – other observable inputs (including, but not limited to, quoted prices for similar assets or liabilities in markets that are active, quoted prices for identical or similar assets or liabilities in markets that are not active, inputs other than quoted prices that are observable for the assets or liabilities (such as interest rates, yield curves, volatilities, prepayment speeds, loss severities, credit risks and default rates) or other market-corroborated inputs) | |||
| • | Level 3 – unobservable inputs based on the best information available in the circumstances, to the extent observable inputs are not available (including the Trust’s own assumptions used in determining the fair value of investments and derivative financial instruments) |
The hierarchy gives the highest priority to unadjusted quoted prices in active markets for identical assets or liabilities (Level 1 measurements) and the lowest priority to unobservable inputs (Level 3 measurements). Accordingly, the degree of judgment exercised in determining fair value is greatest for instruments categorized in Level 3. The inputs used to measure fair value may fall into different levels of the fair value hierarchy. In such cases, for disclosure purposes, the fair value hierarchy classification is determined based on the lowest level input that is significant to the fair value measurement in its entirety. | ||||
Changes in valuation techniques may result in transfers into or out of an assigned level within the disclosure hierarchy. In accordance with the Trust’s policy, transfers between different levels of the fair value disclosure hierarchy are deemed to have occurred as of the beginning of the reporting period. The categorization of a value determined for investments and derivative financial instruments is based on the pricing transparency of the investment and derivative financial instrument and is not necessarily an indication of the risks associated with investing in those securities. For information about the Trust’s policy regarding valuation of investments and derivative financial instruments, please refer to Note 2 of the Notes to Financial Statements. |
| 28 | ANNUAL REPORT | JULY 31, 2014 |
| Schedule of Investments (concluded) | BlackRock Municipal Income Investment Trust (BBF) |
The following tables summarize the Trust’s investments and derivative financial instruments categorized in the disclosure hierarchy as of July 31, 2014: |
| Level 1 | Level 2 | Level 3 | Total | |||||||||||||||
Assets: | ||||||||||||||||||
Investments: | ||||||||||||||||||
Long-Term Investments1 | — | $ | 162,093,754 | — | $ | 162,093,754 | ||||||||||||
Short-Term Securities | $ | 1,298,709 | — | — | 1,298,709 | |||||||||||||
Total | $ | 1,298,709 | $ | 162,093,754 | — | $ | 163,392,463 | |||||||||||
| 1 | See above Schedule of Investments for values in each state or political subdivision. |
| Level 1 | Level 2 | Level 3 | Total | |||||||||||||||
Derivative Financial Instruments2 | ||||||||||||||||||
Assets: | ||||||||||||||||||
Interest rate contracts | $ | 27,410 | — | — | $ | 27,410 | ||||||||||||
| 2 | Derivative financial instruments are financial futures contracts, which are valued at the unrealized appreciation/depreciation on the instrument. |
The Trust may hold assets and/or liabilities in which the fair value approximates the carrying amount for financial statement purposes. As of July 31, 2014, such assets and/or liabilities are categorized within the disclosure hierarchy as follows: |
| Level 1 | Level 2 | Level 3 | Total | |||||||||||||||
Assets: | ||||||||||||||||||
Cash pledged for financial futures contracts | $ | 88,000 | — | — | $ | 88,000 | ||||||||||||
Liabilities: | ||||||||||||||||||
TOB trust certificates | — | $ | (29,682,276 | ) | — | (29,682,276 | ) | |||||||||||
VRDP Shares | — | (34,200,000 | ) | — | (34,200,000 | ) | ||||||||||||
Total | $ | 88,000 | $ | (63,882,276 | ) | — | $ | (63,794,276 | ) | |||||||||
There were no transfers between levels during the year ended July 31, 2014. |
| ANNUAL REPORT | JULY 31, 2014 | 29 |
| Schedule of Investments July 31, 2014 | BlackRock Municipal Target Term Trust (BTT) (Percentages shown are based on Net Assets) |
| Municipal Bonds | Par (000) | Value | ||||||||
Alabama — 0.6% | ||||||||||
City of Phenix Alabama IDB, Refunding RB, Meadwestvaco Coated Board Project, Series A, 3.63%, 5/15/30 | $ | 5,850 | �� | $ | 5,440,617 | |||||
County of Jefferson Alabama, RB, Limited Obligation School, Series A: | ||||||||||
5.25%, 1/01/19 | 1,000 | 1,008,900 | ||||||||
5.25%, 1/01/20 | 1,000 | 1,008,900 | ||||||||
5.50%, 1/01/21 | 1,200 | 1,210,680 | ||||||||
5.50%, 1/01/22 | 1,105 | 1,114,834 | ||||||||
| 9,783,931 | ||||||||||
Alaska — 0.5% | ||||||||||
Northern Tobacco Securitization Corp., Refunding RB, Tobacco Settlement, Asset-Backed, Series A, 4.63%, 6/01/23 | 8,160 | 7,610,914 | ||||||||
Arizona — 1.1% | ||||||||||
Arizona Health Facilities Authority, Refunding RB, Phoenix Children’s Hospital: | ||||||||||
Series A, 5.00%, 2/01/34 | 6,340 | 6,764,273 | ||||||||
Series B, 5.00%, 2/01/33 | 1,810 | 1,933,967 | ||||||||
City of Phoenix Arizona IDA, RB, Facility: | ||||||||||
Candeo Schools, Inc. Project, 6.00%, 7/01/23 | 700 | 752,962 | ||||||||
Eagle College Preparatory Project, Series A, 4.50%, 7/01/22 | 735 | 726,305 | ||||||||
Eagle College Preparatory Project, Series A, 5.00%, 7/01/33 | 1,000 | 929,400 | ||||||||
Legacy Traditional Schools Project, Series A, 5.75%, 7/01/24 (a) | 750 | 791,122 | ||||||||
County of Pima Arizona IDA, Refunding RB, Tucson Electric Power Co. Project, Series A, 4.00%, 9/01/29 | 6,000 | 5,999,820 | ||||||||
| 17,897,849 | ||||||||||
California — 23.3% | ||||||||||
ABAG Finance Authority for Nonprofit Corps., Refunding RB, Odd Fellows Home California, Series A, 5.00%, 4/01/32 | 4,500 | 4,993,560 | ||||||||
Alameda Corridor Transportation Authority, Refunding RB, CAB, Sub Lien, Series A (AMBAC), 0.00%, 10/01/30 (b) | 10,530 | 4,761,561 | ||||||||
Anaheim California Public Financing Authority, Refunding RB, Electric Distribution System, Series A, 4.00%, 10/01/31 | 17,080 | 17,595,645 | ||||||||
California Health Facilities Financing Authority, Refunding RB, Adventist Health System/West, Series A: | ||||||||||
4.00%, 3/01/27 | 4,270 | 4,420,603 | ||||||||
4.00%, 3/01/28 | 8,490 | 8,726,022 | ||||||||
4.00%, 3/01/33 | 61,485 | 61,164,048 | ||||||||
California HFA, RB, S/F Housing, Home Mortgage, Series I, AMT, 4.70%, 8/01/26 | 10,000 | 10,123,800 | ||||||||
California Municipal Finance Authority, RB, Biola University: | ||||||||||
4.00%, 10/01/27 | 750 | 756,570 | ||||||||
5.00%, 10/01/29 | 660 | 718,654 | ||||||||
5.00%, 8/15/30 | 1,000 | 1,098,490 | ||||||||
5.00%, 10/01/30 | 500 | 540,820 | ||||||||
4.00%, 10/01/33 | 2,500 | 2,406,675 | ||||||||
California Pollution Control Financing Authority, RB, Poseidon Resources Desalination Project, AMT, 5.00%, 7/01/30 (a) | 18,845 | 19,637,998 | ||||||||
California State Public Works Board, RB: | ||||||||||
Judicial Council Projects, Series A, 5.00%, 3/01/31 | 5,000 | 5,591,100 | ||||||||
Judicial Council Projects, Series A, 5.00%, 3/01/32 | 5,000 | 5,579,250 | ||||||||
Judicial Council Projects, Series A, 5.00%, 3/01/33 | 5,220 | 5,796,027 | ||||||||
Series D, 5.00%, 9/01/29 | 2,850 | 3,206,278 | ||||||||
Series D, 5.00%, 9/01/30 | 2,620 | 2,927,771 | ||||||||
| Municipal Bonds | Par (000) | Value | ||||||||
California (continued) | ||||||||||
California State Public Works Board, RB (concluded): | ||||||||||
Series D, 5.00%, 9/01/31 | $ | 2,905 | $ | 3,224,521 | ||||||
Series D, 5.00%, 9/01/32 | 6,060 | 6,703,996 | ||||||||
Series E, 5.00%, 9/01/29 | 2,355 | 2,649,399 | ||||||||
Series E, 5.00%, 9/01/30 | 2,475 | 2,765,738 | ||||||||
Series E, 5.00%, 9/01/31 | 2,600 | 2,885,974 | ||||||||
Series E, 5.00%, 9/01/32 | 2,280 | 2,522,296 | ||||||||
California Statewide Communities Development Authority, RB, American Baptist Homes of the West, Series A: | ||||||||||
5.00%, 10/01/23 | 1,500 | 1,627,200 | ||||||||
5.00%, 10/01/28 | 650 | 687,902 | ||||||||
5.00%, 10/01/33 | 2,275 | 2,337,790 | ||||||||
California Statewide Communities Development Authority, Refunding RB: | ||||||||||
Episcopal Communities & Services, 5.00%, 5/15/27 | 500 | 536,830 | ||||||||
Episcopal Communities & Services, 5.00%, 5/15/32 | 1,000 | 1,057,380 | ||||||||
Eskaton Properties, Inc., 5.25%, 11/15/34 | 2,500 | 2,610,775 | ||||||||
Chabot-Las Positas Community College District, GO, Refunding, 2016 Crossover, 5.00%, 8/01/29 | 18,500 | 21,179,540 | ||||||||
City & County of San Francisco California Redevelopment Agency, Refunding, Special Tax Bonds, No. 6 Mission Bay South Public Improvements, Series A: | ||||||||||
5.00%, 8/01/28 | 1,000 | 1,093,170 | ||||||||
5.00%, 8/01/29 | 1,300 | 1,415,245 | ||||||||
5.00%, 8/01/33 | 1,335 | 1,434,938 | ||||||||
Corona-Norco Unified School District, Refunding, Special Tax Bonds, Senior Lien, Series A, 5.00%, 9/01/32 | 1,250 | 1,321,925 | ||||||||
County of Los Angeles California Public Works Financing Authority, Refunding RB, Multiple Capital Projects II: | ||||||||||
5.00%, 8/01/30 | 2,500 | 2,781,825 | ||||||||
5.00%, 8/01/31 | 3,000 | 3,320,460 | ||||||||
5.00%, 8/01/32 | 3,000 | 3,305,040 | ||||||||
5.00%, 8/01/33 | 2,500 | 2,745,050 | ||||||||
County of Ventura California Public Financing Authority, Refunding RB, Series A: | ||||||||||
5.00%, 11/01/30 | 1,200 | 1,367,604 | ||||||||
5.00%, 11/01/31 | 1,500 | 1,697,835 | ||||||||
5.00%, 11/01/32 | 1,500 | 1,689,705 | ||||||||
5.00%, 11/01/33 | 1,200 | 1,346,232 | ||||||||
El Camino Community College District, GO, CAB, Election of 2002, Series C (b): | ||||||||||
0.00%, 8/01/30 | 9,090 | 4,778,249 | ||||||||
0.00%, 8/01/31 | 12,465 | 6,210,936 | ||||||||
0.00%, 8/01/32 | 17,435 | 8,309,172 | ||||||||
Escondido Union High School District, GO, CAB, Election of 2008, Series A (AGC) (b): | ||||||||||
0.00%, 8/01/32 | 1,675 | 767,920 | ||||||||
0.00%, 8/01/33 | 2,865 | 1,227,767 | ||||||||
Golden State Tobacco Securitization Corp., Refunding RB, Series A, 5.00%, 6/01/30 | 1,500 | 1,652,850 | ||||||||
Grossmont Union High School District, GO, CAB, Election of 2004, 0.00%, 8/01/32 (b) | 29,015 | 12,864,381 | ||||||||
Los Angeles Regional Airports Improvement Corp., Refunding RB, LAXFUEL Corp., Los Angeles International, AMT: | ||||||||||
4.50%, 1/01/27 | 5,000 | 5,297,200 | ||||||||
5.00%, 1/01/32 | 4,110 | 4,360,546 | ||||||||
M-S-R Energy Authority, RB, Series C, 6.13%, 11/01/29 | 2,500 | 3,072,825 | ||||||||
| 30 | ANNUAL REPORT | JULY 31, 2014 |
| Schedule of Investments (continued) | BlackRock Municipal Target Term Trust (BTT) (Percentages shown are based on Net Assets) |
| Municipal Bonds | Par (000) | Value | ||||||||
California (concluded) | ||||||||||
Poway Unified School District, GO, CAB, Election of 2008, Series A (b): | ||||||||||
0.00%, 8/01/27 | $ | 10,000 | $ | 5,958,100 | ||||||
0.00%, 8/01/30 | 10,000 | 5,070,500 | ||||||||
0.00%, 8/01/32 | 12,500 | 5,720,625 | ||||||||
Poway Unified School District Public Financing Authority, Refunding, Special Tax Bonds: | ||||||||||
5.00%, 9/15/26 | 935 | 1,052,511 | ||||||||
5.00%, 9/15/29 | 1,205 | 1,333,164 | ||||||||
5.00%, 9/15/32 | 995 | 1,076,709 | ||||||||
Riverside Public Financing Authority, Tax Allocation Bonds, University Corridor/Sycamore Canyon Merged Redevelopment Project, Series C (NPFGC), 4.50%, 8/01/30 | 10,000 | 10,069,700 | ||||||||
Sacramento County Sanitation Districts Financing Authority, Refunding RB, Series A, 5.00%, 12/01/30 | 2,000 | 2,340,220 | ||||||||
San Bernardino Community College District, GO, Refunding, Series A: | ||||||||||
4.00%, 8/01/31 | 15,660 | 16,150,001 | ||||||||
4.00%, 8/01/32 | 17,010 | 17,450,049 | ||||||||
4.00%, 8/01/33 | 5,665 | 5,789,743 | ||||||||
San Diego Community College District, GO, Election of 2006, 0.00%, 8/01/30 (b) | 5,000 | 2,371,750 | ||||||||
Westlands California Water District, Refunding RB, Series A (AGM): | ||||||||||
5.00%, 9/01/30 | 1,000 | 1,115,970 | ||||||||
5.00%, 9/01/31 | 1,000 | 1,107,010 | ||||||||
5.00%, 9/01/32 | 1,000 | 1,101,830 | ||||||||
| 360,602,970 | ||||||||||
Colorado — 6.0% | ||||||||||
Central Platte Valley Metropolitan District, GO, Series A: | ||||||||||
5.13%, 12/01/29 | 700 | 771,694 | ||||||||
5.50%, 12/01/29 | 750 | 849,990 | ||||||||
5.38%, 12/01/33 | 1,500 | 1,669,755 | ||||||||
City & County of Denver Colorado Airport System Revenue, Refunding RB, Series B, 4.00%, 11/15/31 | 37,090 | 37,743,526 | ||||||||
City of Commerce Colorado-Northern Infrastructure General Improvement District, GO, Refunding, Improvement (AGM): | ||||||||||
5.00%, 12/01/26 | 2,770 | 3,111,929 | ||||||||
5.00%, 12/01/28 | 1,560 | 1,734,954 | ||||||||
5.00%, 12/01/29 | 1,070 | 1,182,649 | ||||||||
5.00%, 12/01/31 | 500 | 552,260 | ||||||||
5.00%, 12/01/32 | 800 | 880,584 | ||||||||
City of Lakewood Colorado Plaza Metropolitan District No. 1, Refunding, Tax Allocation Bonds, 4.00%, 12/01/23 | 1,000 | 987,680 | ||||||||
Colorado Educational & Cultural Facilities Authority, Refunding RB, 5.00%, 8/15/30 | 1,000 | 1,086,310 | ||||||||
Colorado Health Facilities Authority, Refunding RB, Covenant Retirement Communities, Series A: | ||||||||||
4.50%, 12/01/33 | 4,595 | 4,388,868 | ||||||||
5.00%, 12/01/33 | 3,000 | 3,107,310 | ||||||||
Denver West Metropolitan District, GO, Refunding, Series A (AGM), 4.00%, 12/01/32 | 6,250 | 6,347,250 | ||||||||
Plaza Metropolitan District No. 1, Refunding, Tax Allocation Bonds: | ||||||||||
4.10%, 12/01/24 | 5,080 | 4,991,557 | ||||||||
4.20%, 12/01/25 | 5,280 | 5,195,520 | ||||||||
4.50%, 12/01/30 | 4,305 | 4,241,114 | ||||||||
State of Colorado, COP, Refunding, Fitzsimons Academic Projects, 4.00%, 11/01/30 | 12,675 | 13,050,180 | ||||||||
Tallyns Reach Metropolitan District No. 3, GO, Refunding, 5.00%, 12/01/33 | 505 | 507,212 | ||||||||
| 92,400,342 | ||||||||||
| Municipal Bonds | Par (000) | Value | ||||||||
Connecticut — 1.4% | ||||||||||
City of Hartford Connecticut, GO, Refunding, Series A: | ||||||||||
4.00%, 4/01/29 | $ | 8,390 | $ | 8,625,004 | ||||||
4.00%, 4/01/32 | 1,500 | 1,515,285 | ||||||||
Connecticut HFA, Refunding RB, M/F Housing Mortgage Finance Program, Sub-Series F-1, 3.00%, 11/15/32 | 12,020 | 11,181,965 | ||||||||
| 21,322,254 | ||||||||||
District of Columbia — 0.1% | ||||||||||
District of Columbia, Refunding RB, Kipp Charter School, 6.00%, 7/01/33 | 1,700 | 1,943,236 | ||||||||
Florida — 10.4% | ||||||||||
City of North Miami Beach Florida, Refunding RB: | ||||||||||
4.00%, 8/01/27 | 3,325 | 3,485,298 | ||||||||
5.00%, 8/01/29 | 3,650 | 4,026,461 | ||||||||
5.00%, 8/01/30 | 4,020 | 4,414,040 | ||||||||
5.00%, 8/01/31 | 4,235 | 4,625,509 | ||||||||
5.00%, 8/01/32 | 4,445 | 4,832,382 | ||||||||
City of Tampa Florida, Refunding RB, Series A: | ||||||||||
County of Hillsborough Florida Expressway Authority, 4.00%, 7/01/29 | 6,000 | 6,168,060 | ||||||||
County of Hillsborough Florida Expressway Authority, 4.00%, 7/01/30 | 6,395 | 6,538,696 | ||||||||
H Lee Moffitt Cancer Center Project, 4.00%, 9/01/33 | 10,000 | 9,973,200 | ||||||||
County of Alachua Florida Health Facilities Authority, RB, East Ridge Retirement Village, Inc., 6.00%, 11/15/29 | 5,000 | 5,286,550 | ||||||||
County of Broward Florida, RB, Fort Lauderdale Fuel System Revenue, AMT: | ||||||||||
5.00%, 4/01/30 | 600 | 639,024 | ||||||||
5.00%, 4/01/33 | 740 | 783,697 | ||||||||
County of Hillsborough Florida IDA, RB, National Gypsum Co., Series A, AMT, 7.13%, 4/01/30 | 7,300 | 7,315,111 | ||||||||
County of Martin Florida IDA, Refunding RB, Indiantown Cogeneration, L.P. Project, AMT, 4.20%, 12/15/25 | 5,250 | 5,283,758 | ||||||||
County of Miami-Dade Florida Educational Facilities Authority, RB, University of Miami, Series A: | ||||||||||
4.00%, 4/01/31 | 2,930 | 2,955,550 | ||||||||
4.00%, 4/01/32 | 1,000 | 1,004,330 | ||||||||
County of Miami-Dade Florida Educational Facilities Authority, Refunding RB, Sub-Series B, 5.00%, 10/01/32 | 10,000 | 10,967,700 | ||||||||
County of Miami-Dade Florida Expressway Authority, Refunding RB, Series A: | ||||||||||
5.00%, 7/01/30 | 5,530 | 6,107,111 | ||||||||
5.00%, 7/01/31 | 5,000 | 5,489,150 | ||||||||
County of Miami-Dade Florida School Board, COP, Refunding, Series A, 5.00%, 5/01/32 | 10,000 | 10,816,000 | ||||||||
County of St. Johns Florida Water & Sewer Revenue, Refunding RB, CAB, Series B (b): | ||||||||||
0.00%, 6/01/25 | 2,155 | 1,533,757 | ||||||||
0.00%, 6/01/26 | 2,655 | 1,793,240 | ||||||||
0.00%, 6/01/27 | 3,095 | 1,963,035 | ||||||||
0.00%, 6/01/28 | 3,795 | 2,286,601 | ||||||||
0.00%, 6/01/29 | 3,795 | 2,169,981 | ||||||||
0.00%, 6/01/30 | 2,000 | 1,060,700 | ||||||||
0.00%, 6/01/31 | 1,295 | 648,989 | ||||||||
0.00%, 6/01/32 | 2,495 | 1,186,847 | ||||||||
Double Branch Community Development District, Refunding, Special Assessment Bonds, Senior Lien, Series A-1, 4.13%, 5/01/31 | 1,200 | 1,185,888 | ||||||||
Greater Orlando Aviation Authority, Refunding RB, Jet Blue Airways Corp. Project, AMT, 5.00%, 11/15/26 | 2,000 | 1,976,360 | ||||||||
| ANNUAL REPORT | JULY 31, 2014 | 31 |
| Schedule of Investments (continued) | BlackRock Municipal Target Term Trust (BTT) (Percentages shown are based on Net Assets) |
| Municipal Bonds | Par (000) | Value | ||||||||
Florida (concluded) | ||||||||||
Jacksonville Florida Port Authority, Refunding RB, AMT: | ||||||||||
4.50%, 11/01/29 | $ | 4,685 | $ | 4,778,606 | ||||||
4.50%, 11/01/30 | 2,895 | 2,940,712 | ||||||||
4.50%, 11/01/31 | 3,200 | 3,223,936 | ||||||||
4.50%, 11/01/32 | 2,300 | 2,307,728 | ||||||||
4.50%, 11/01/33 | 2,080 | 2,084,139 | ||||||||
Reedy Creek Improvement District, GO, Series A, 5.25%, 6/01/30 | 3,825 | 4,360,844 | ||||||||
Village Community Development District No. 5, Refunding, Special Assessment Bonds, Phase I: | ||||||||||
3.50%, 5/01/28 | 6,185 | 6,006,872 | ||||||||
4.00%, 5/01/33 | 1,235 | 1,223,675 | ||||||||
4.00%, 5/01/34 | 2,590 | 2,548,146 | ||||||||
Village Community Development District No. 10, Special Assessment Bonds, Sumter County: | ||||||||||
4.50%, 5/01/23 | 3,555 | 3,603,561 | ||||||||
5.00%, 5/01/32 | 5,985 | 5,946,277 | ||||||||
Village Community Development District No. 6, Refunding, Special Assessment Bonds, Sumter County, 4.00%, 5/01/29 | 6,400 | 6,412,416 | ||||||||
| 161,953,937 | ||||||||||
Georgia — 0.8% | ||||||||||
Georgia Housing & Finance Authority, RB, S/F Housing, Series A, 3.45%, 12/01/32 | 12,050 | 11,856,236 | ||||||||
Guam — 0.7% | ||||||||||
Guam Power Authority, Refunding RB, Series A (AGM), 5.00%, 10/01/30 | 10,000 | 11,072,000 | ||||||||
Idaho — 0.7% | ||||||||||
Idaho Housing & Finance Association, RB, Series A, 4.00%, 7/15/30 | 10,000 | 10,246,600 | ||||||||
Illinois — 14.2% | ||||||||||
Chicago Midway International Airport, Refunding RB, AMT, Series A, 5.00%, 1/01/33 | 5,000 | 5,292,350 | ||||||||
City of Chicago Illinois Motor Fuel Tax Revenue, Refunding RB: | ||||||||||
5.00%, 1/01/30 | 2,730 | 2,964,698 | ||||||||
5.00%, 1/01/32 | 2,000 | 2,155,580 | ||||||||
City of Chicago Illinois, GO: | ||||||||||
CAB (NPFGC), 0.00%, 1/01/27 (b) | 5,000 | 2,818,600 | ||||||||
Project, Series A, 5.00%, 1/01/33 | 10,000 | 10,185,600 | ||||||||
City of Chicago Illinois, Refunding RB, GO, Series A, 5.25%, 1/01/30 | 6,000 | 6,332,640 | ||||||||
City of Chicago Illinois, RB, Wastewater Transmission, 2nd Lien: | ||||||||||
4.00%, 1/01/31 | 10,375 | 10,166,566 | ||||||||
4.00%, 1/01/32 | 10,790 | 10,511,942 | ||||||||
4.00%, 1/01/33 | 11,220 | 10,808,338 | ||||||||
4.00%, 1/01/35 | 9,135 | 8,681,265 | ||||||||
City of Chicago Illinois, Refunding ARB, O’Hare International Airport Passenger Facility Charge, Series B, AMT: | ||||||||||
4.00%, 1/01/27 | 5,000 | 4,988,050 | ||||||||
4.00%, 1/01/29 | 28,425 | 27,699,878 | ||||||||
City of St. Charles Illinois, GO, Refunding, Corporate Purpose: | ||||||||||
4.00%, 12/01/30 | 1,620 | 1,679,227 | ||||||||
4.00%, 12/01/31 | 1,715 | 1,766,433 | ||||||||
4.00%, 12/01/32 | 1,800 | 1,843,542 | ||||||||
County of Cook Illinois, GO, Refunding, Series C, 4.00%, 11/15/29 | 19,750 | 20,055,730 | ||||||||
County of Will Illinois Community High School District No. 210 Lincoln-Way, GO, CAB, Refunding, Series B (b): | ||||||||||
0.00%, 1/01/29 | 6,920 | 3,674,105 | ||||||||
0.00%, 1/01/30 | 5,680 | 2,826,084 | ||||||||
0.00%, 1/01/31 | 13,330 | 6,412,796 | ||||||||
0.00%, 1/01/32 | 16,500 | 7,258,185 | ||||||||
| Municipal Bonds | Par (000) | Value | ||||||||
Illinois (concluded) | ||||||||||
County of Will Illinois Community High School District No. 210 Lincoln-Way, GO, Refunding, Series A, 5.00%, 1/01/31 | $ | 16,300 | $ | 17,894,140 | ||||||
Illinois Finance Authority, RB, 6.00%, 9/01/32 | 1,620 | 1,765,427 | ||||||||
Illinois Finance Authority, Refunding RB: | ||||||||||
Lutheran Home & Services Obligated Group, 5.00%, 5/15/22 | 4,835 | 5,053,445 | ||||||||
Lutheran Home & Services Obligated Group, 5.50%, 5/15/27 | 4,350 | 4,514,126 | ||||||||
Lutheran Home & Services Obligated Group, 5.50%, 5/15/30 | 4,900 | 5,005,350 | ||||||||
Northwestern Memorial Healthcare, 4.00%, 8/15/33 | 7,665 | 7,791,473 | ||||||||
The Peoples Gas Light & Coke Company Project, 4.00%, 2/01/33 | 11,000 | 11,031,570 | ||||||||
Winnebago & Boone Counties School District No. 205 Rockford, GO: | ||||||||||
4.00%, 2/01/29 | 9,305 | 9,527,483 | ||||||||
4.00%, 2/01/30 | 9,835 | 10,005,342 | ||||||||
| 220,709,965 | ||||||||||
Indiana — 2.9% | ||||||||||
Carmel Redevelopment Authority, Refunding RB, Multipurpose, Series A, 4.00%, 8/01/33 | 8,500 | 8,788,320 | ||||||||
City of Valparaiso Indiana, RB, Exempt Facilities, Pratt Paper LLC Project, AMT, 5.88%, 1/01/24 | 2,250 | 2,489,265 | ||||||||
Indiana Finance Authority, Refunding RB: | ||||||||||
Community Health Network Project, Series A, 4.00%, 5/01/35 | 23,565 | 22,167,360 | ||||||||
Earlham College Project, 5.00%, 10/01/32 | 11,255 | 11,776,557 | ||||||||
| 45,221,502 | ||||||||||
Iowa — 2.2% | ||||||||||
Iowa Finance Authority, Refunding RB, Midwestern Disaster Area, Iowa Fertilizer Co. Project: | ||||||||||
5.50%, 12/01/22 | 18,500 | 19,289,950 | ||||||||
5.25%, 12/01/25 | 14,345 | 15,118,626 | ||||||||
| 34,408,576 | ||||||||||
Kentucky — 0.1% | ||||||||||
Kentucky Public Transportation Infrastructure Authority, RB, Convertible CAB-1st Tier-DownTown Crossing Project, Series C, 0.00%, 7/01/33 (c) | 1,500 | 995,640 | ||||||||
Kentucky Public Transportation Infrastructure Authority, RB, CAB-1st Tier-DownTown Crossing Project, Series B, 0.00%, 7/01/30 (b) | 1,230 | 499,774 | ||||||||
| 1,495,414 | ||||||||||
Louisiana — 3.2% | ||||||||||
City of New Orleans Louisiana, Refunding RB: | ||||||||||
5.00%, 12/01/27 | 1,500 | 1,666,575 | ||||||||
5.00%, 12/01/29 | 1,000 | 1,097,230 | ||||||||
Louisiana Stadium & Exposition District, Refunding RB, Senior, Series A: | ||||||||||
5.00%, 7/01/27 | 3,770 | 4,227,489 | ||||||||
5.00%, 7/01/28 | 4,420 | 4,916,764 | ||||||||
5.00%, 7/01/29 | 3,000 | 3,305,790 | ||||||||
5.00%, 7/01/30 | 5,000 | 5,493,700 | ||||||||
5.00%, 7/01/31 | 5,105 | 5,568,534 | ||||||||
5.00%, 7/01/32 | 3,000 | 3,277,140 | ||||||||
Port New Orleans Board of Commissioners, Refunding RB, Series B, AMT: | ||||||||||
5.00%, 4/01/31 | 300 | 314,601 | ||||||||
5.00%, 4/01/32 | 1,000 | 1,044,250 | ||||||||
5.00%, 4/01/33 | 1,575 | 1,641,245 | ||||||||
Terrebonne Levee & Conservation District, RB, Sales Tax, 5.00%, 7/01/29 | 1,925 | 2,121,215 | ||||||||
| 32 | ANNUAL REPORT | JULY 31, 2014 |
| Schedule of Investments (continued) | BlackRock Municipal Target Term Trust (BTT) (Percentages shown are based on Net Assets) |
| Municipal Bonds | Par (000) | Value | ||||||||
Louisiana (concluded) | ||||||||||
Tobacco Settlement Financing Corp., Refunding RB, Asset-Backed, Series A: | ||||||||||
5.25%, 5/15/31 | $ | 3,425 | $ | 3,675,025 | ||||||
5.25%, 5/15/32 | 4,375 | 4,650,319 | ||||||||
5.25%, 5/15/33 | 4,750 | 5,026,355 | ||||||||
5.25%, 5/15/35 | 1,500 | 1,594,020 | ||||||||
| 49,620,252 | ||||||||||
Maine — 1.4% | ||||||||||
Maine Health & Higher Educational Facilities Authority, RB, Eastern Maine Medical Center Obligation: | ||||||||||
5.00%, 7/01/25 | 1,250 | 1,399,650 | ||||||||
5.00%, 7/01/26 | 1,000 | 1,105,550 | ||||||||
5.00%, 7/01/27 | 1,000 | 1,093,170 | ||||||||
3.75%, 7/01/28 | 1,000 | 976,620 | ||||||||
5.00%, 7/01/33 | 5,000 | 5,302,400 | ||||||||
Maine State Housing Authority, Refunding RB, S/F Housing, Series B, 3.45%, 11/15/32 | 12,000 | 11,744,160 | ||||||||
| 21,621,550 | ||||||||||
Maryland — 0.4% | ||||||||||
Maryland EDC, Refunding RB: | ||||||||||
CNX Marine Terminals, Inc., 5.75%, 9/01/25 | 5,000 | 5,458,300 | ||||||||
Salisbury University Project, 5.00%, 6/01/34 | 500 | 526,220 | ||||||||
| 5,984,520 | ||||||||||
Massachusetts — 1.4% | ||||||||||
Massachusetts Educational Financing Authority, Refunding RB, Series K, AMT, 5.25%, 7/01/29 | 10,000 | 10,791,400 | ||||||||
Massachusetts HFA, Refunding RB, S/F Housing, Series 163, AMT, 4.00%, 12/01/33 | 11,425 | 10,919,672 | ||||||||
| 21,711,072 | ||||||||||
Michigan — 0.9% | ||||||||||
Michigan Finance Authority, Refunding RB: | ||||||||||
Holland Community Hospital, Series A, 5.00%, 1/01/33 | 750 | 796,515 | ||||||||
Oakwood Obligation Group, 5.00%, 8/15/30 | 4,105 | 4,472,233 | ||||||||
Michigan State Hospital Finance Authority, Refunding RB, Trinity Health Credit Group, Series C, 4.00%, 12/01/32 | 9,195 | 9,281,433 | ||||||||
| 14,550,181 | ||||||||||
Missouri — 0.3% | ||||||||||
Missouri State Health & Educational Facilities Authority, Refunding RB: | ||||||||||
CoxHealth, Series A, 4.00%, 11/15/33 | 2,010 | 1,959,710 | ||||||||
St. Lewis College of Pharmacy Project, 5.00%, 5/01/30 | 3,000 | 3,196,650 | ||||||||
| 5,156,360 | ||||||||||
Nebraska — 1.2% | ||||||||||
Central Plains Nebraska Energy Project, RB: | ||||||||||
Energy Project No. 3, 5.00%, 9/01/27 | 7,010 | 7,734,133 | ||||||||
Gas Project No. 3, 5.00%, 9/01/32 | 9,500 | 10,191,030 | ||||||||
| 17,925,163 | ||||||||||
New Hampshire — 1.0% | ||||||||||
New Hampshire Health & Education Facilities Authority, Refunding RB, Concord Hospital, Series A: | ||||||||||
5.00%, 10/01/26 | 1,075 | 1,190,648 | ||||||||
5.00%, 10/01/27 | 1,180 | 1,299,440 | ||||||||
4.00%, 10/01/33 | 3,500 | 3,485,930 | ||||||||
New Hampshire State Turnpike System, RB, Series C: | ||||||||||
4.00%, 8/01/33 | 4,350 | 4,476,106 | ||||||||
4.00%, 8/01/35 | 4,745 | 4,836,199 | ||||||||
| 15,288,323 | ||||||||||
New Jersey — 11.5% | ||||||||||
County of Gloucester New Jersey Pollution Control Financing Authority, Refunding RB, AMT, 5.00%, 12/01/24 | 1,500 | 1,640,355 | ||||||||
| Municipal Bonds | Par (000) | Value | ||||||||
New Jersey (concluded) | ||||||||||
New Jersey EDA, RB, AMT: | ||||||||||
Continental Airlines, Inc. Project, 5.25%, 9/15/29 | $ | 12,230 | $ | 12,600,569 | ||||||
Continental Airlines, Inc. Project, Series A, 5.63%, 11/15/30 | 1,740 | 1,842,469 | ||||||||
Continental Airlines, Inc. Project, Series B, 5.63%, 11/15/30 | 1,315 | 1,396,911 | ||||||||
Private Activity Bond, The Goethals Bridge Replacement Project, 5.00%, 1/01/28 | 4,705 | 5,161,950 | ||||||||
New Jersey EDA, Refunding RB: | ||||||||||
4.25%, 6/15/27 | 16,500 | 16,879,500 | ||||||||
Cigarette Tax, 5.00%, 6/15/26 | 10,610 | 11,675,562 | ||||||||
Continental Airlines, Inc. Project, AMT, 5.75%, 9/15/27 | 6,200 | 6,564,126 | ||||||||
New Jersey EDA, Refunding, Special Assessment Bonds, Kapkowski Road Landfill Project, 5.75%, 4/01/31 | 5,000 | 5,423,250 | ||||||||
New Jersey Health Care Facilities Financing Authority, Refunding RB, St. Barnabas Health, Series A, 4.00%, 7/01/26 | 3,000 | 3,102,900 | ||||||||
New Jersey Housing & Mortgage Finance Agency, Refunding RB, M/F Housing, Series 2, AMT: | ||||||||||
4.10%, 11/01/28 | 15,800 | 15,966,532 | ||||||||
4.35%, 11/01/33 | 7,315 | 7,370,082 | ||||||||
New Jersey Transportation Trust Fund Authority, RB, Transportation System: | ||||||||||
CAB, Series A, 0.00%, 12/15/28 (b) | 66,000 | 34,766,820 | ||||||||
CAB, Series A, 0.00%, 12/15/29 (b) | 18,000 | 8,892,900 | ||||||||
Series AA, 4.00%, 6/15/30 | 13,315 | 13,467,057 | ||||||||
Newark Housing Authority, Refunding RB, Newark Redevelopment Project (NPFGC), 5.25%, 1/01/27 | 5,000 | 5,744,300 | ||||||||
Tobacco Settlement Financing Corp. New Jersey, Refunding RB, Series 1A: | ||||||||||
4.50%, 6/01/23 | 6,950 | 6,816,074 | ||||||||
4.63%, 6/01/26 | 22,460 | 19,403,643 | ||||||||
| 178,715,000 | ||||||||||
New Mexico — 1.1% | ||||||||||
New Mexico Educational Assistance Foundation, RB, AMT: | ||||||||||
Education Loan Series A-1, 3.75%, 9/01/31 | 6,250 | 6,042,750 | ||||||||
Education Loan Series A-2, 3.80%, 11/01/32 | 5,850 | 5,660,869 | ||||||||
Education Loan Series A-2, 3.80%, 9/01/33 | 5,000 | 4,840,000 | ||||||||
| 16,543,619 | ||||||||||
New York — 7.2% | ||||||||||
Build NYC Resource Corp., RB, Bronx Charter School for International Cultures & The Arts Project, Series A, 5.00%, 4/15/33 | 3,530 | 3,213,641 | ||||||||
Housing Development Corp., RB, M/F Housing, Series K-1: | ||||||||||
3.40%, 11/01/30 | 8,070 | 7,882,130 | ||||||||
3.50%, 11/01/32 | 5,865 | 5,702,540 | ||||||||
Housing Development Corp., Refunding RB, M/F Housing: | ||||||||||
Series L-1, 3.40%, 11/01/30 | 1,580 | 1,543,218 | ||||||||
Series L-1, 3.50%, 11/01/32 | 1,160 | 1,127,868 | ||||||||
Series L-2-A, 3.60%, 11/01/33 | 11,000 | 10,745,240 | ||||||||
Metropolitan Transportation Authority, Refunding RB, Series F, 5.00%, 11/15/30 | 25,000 | 27,982,000 | ||||||||
New York Mortgage Agency, Refunding RB, Series 48, 3.45%, 10/01/33 | 3,500 | 3,436,230 | ||||||||
New York State HFA, RB, M/F Affordable Housing (SONYMA), Series F: | ||||||||||
3.05%, 11/01/27 | 4,020 | 3,861,733 | ||||||||
3.45%, 11/01/32 | 5,235 | 5,082,557 | ||||||||
Niagara Area Development Corp., Refunding RB, Solid Waste Disposal Facility, Covanta Energy Project, Series B, 4.00%, 11/01/24 | 3,000 | 3,022,140 | ||||||||
| ANNUAL REPORT | JULY 31, 2014 | 33 |
| Schedule of Investments (continued) | BlackRock Municipal Target Term Trust (BTT) (Percentages shown are based on Net Assets) |
| Municipal Bonds | Par (000) | Value | ||||||||
New York (concluded) | ||||||||||
Onondaga Civic Development Corp., Refunding RB, St. Joseph’s Hospital Health Center Project, 4.50%, 7/01/32 | $ | 9,215 | $ | 8,842,161 | ||||||
Triborough Bridge & Tunnel Authority, Refunding RB, CAB, Series A (b): | ||||||||||
0.00%, 11/15/29 | 17,810 | 9,893,989 | ||||||||
0.00%, 11/15/30 | 25,215 | 13,329,405 | ||||||||
0.00%, 11/15/31 | 5,000 | 2,501,550 | ||||||||
TSASC Inc., Refunding RB, 5.00%, 6/01/26 | 4,000 | 3,721,960 | ||||||||
| 111,888,362 | ||||||||||
North Carolina — 1.2% | ||||||||||
City of Charlotte North Carolina, Refunding RB, Charlotte-Douglas International Airport, Special Facilities Revenue, US Airways, Inc. Project, AMT, 5.60%, 7/01/27 | 15,000 | 15,004,650 | ||||||||
North Carolina Medical Care Commission, RB, Mission Health Combined Group, 4.63%, 10/01/30 | 2,000 | 2,092,900 | ||||||||
North Carolina Medical Care Commission, Refunding RB, 1st Mortgage, Retirement Facilities Whitestone Project, Series A, 7.75%, 3/01/31 | 1,665 | 1,870,927 | ||||||||
| 18,968,477 | ||||||||||
North Dakota — 0.1% | ||||||||||
North Dakota HFA, RB, M/F Housing, Series A, 3.60%, 7/01/32 | 2,330 | 2,372,336 | ||||||||
Ohio — 0.4% | ||||||||||
County of Franklin Ohio, RB, Health Care Facilities Improvement, OPRS Communities, Series A: | ||||||||||
5.25%, 7/01/28 | 500 | 521,505 | ||||||||
5.63%, 7/01/32 | 1,000 | 1,043,710 | ||||||||
Ohio State University, RB, General Receipts Special Purpose, Series A, 4.00%, 6/01/31 | 4,220 | 4,382,217 | ||||||||
| 5,947,432 | ||||||||||
Oklahoma — 0.2% | ||||||||||
County of Oklahoma Oklahoma Finance Authority, Refunding RB, Epworth Villa Project, Series A: | ||||||||||
5.00%, 4/01/23 | 1,050 | 941,000 | ||||||||
5.00%, 4/01/29 | 1,500 | 1,296,840 | ||||||||
5.00%, 4/01/33 | 1,050 | 882,021 | ||||||||
| 3,119,861 | ||||||||||
Pennsylvania — 9.4% | ||||||||||
Allentown Neighborhood Improvement Zone Development Authority, Refunding RB, Series A: | ||||||||||
5.00%, 5/01/27 | 6,750 | 7,195,567 | ||||||||
5.00%, 5/01/28 | 5,000 | 5,289,100 | ||||||||
5.00%, 5/01/29 | 3,745 | 3,941,201 | ||||||||
5.00%, 5/01/30 | 5,300 | 5,549,100 | ||||||||
Beaver County Industrial Development Authority, Refunding RB, Series B, 3.50%, 12/01/35 (d) | 4,540 | 4,594,889 | ||||||||
County of Cumberland Pennsylvania Municipal Authority, Refunding RB, Asbury Pennsylvania Obligated Group: | ||||||||||
5.00%, 1/01/22 | 750 | 792,765 | ||||||||
5.25%, 1/01/27 | 1,275 | 1,316,017 | ||||||||
5.25%, 1/01/32 | 3,350 | 3,387,788 | ||||||||
County of Lehigh Pennsylvania, Refunding RB, Lehigh Valley Health Network, 4.00%, 7/01/33 | 27,535 | 27,589,795 | ||||||||
County of Montgomery Pennsylvania Higher Education & Health Authority, Refunding RB, Abington Memorial Hospital Obligated Group, 5.00%, 6/01/31 | 5,000 | 5,392,400 | ||||||||
County of Montgomery Pennsylvania IDA, Refunding RB, Acts Retirement-Life Communities, Inc. Obligated Group, 5.00%, 11/15/26 | 2,500 | 2,680,675 | ||||||||
County of Northampton Pennsylvania General Purpose Authority, RB, St. Luke’s Hospital of Bethlehem, Series A, 5.00%, 8/15/33 | 13,250 | 13,887,722 | ||||||||
| Municipal Bonds | Par (000) | Value | ||||||||
Pennsylvania (concluded) | ||||||||||
Pennsylvania Economic Development Financing Authority, RB, National Gypsum Co., AMT: | ||||||||||
Series A, 6.25%, 11/01/27 | $ | 6,520 | $ | 6,522,412 | ||||||
Series B, 6.13%, 11/01/27 | 3,000 | 3,000,780 | ||||||||
Pennsylvania HFA, RB, S/F Housing, Series 114, 3.30%, 10/01/32 | 20,500 | 19,369,630 | ||||||||
Pennsylvania Higher Educational Facilities Authority, RB, Shippensburg University Student Services, 5.00%, 10/01/30 | 5,250 | 5,412,960 | ||||||||
Pennsylvania Higher Educational Facilities Authority, Refunding RB, La Salle University, 4.00%, 5/01/32 | 3,000 | 2,858,190 | ||||||||
State Public School Building Authority, RB, School District of Philadelphia Project: | ||||||||||
5.00%, 4/01/27 | 4,130 | 4,510,580 | ||||||||
5.00%, 4/01/28 | 8,000 | 8,682,720 | ||||||||
5.00%, 4/01/29 | 6,000 | 6,470,520 | ||||||||
5.00%, 4/01/30 | 5,500 | 5,908,595 | ||||||||
Township of East Hempfield Pennsylvania IDA, RB, Student Services Incorporate Student Housing, 5.00%, 7/01/30 | 1,280 | 1,339,942 | ||||||||
| 145,693,348 | ||||||||||
South Carolina — 0.1% | ||||||||||
South Carolina Jobs EDA, Refunding RB, Bon Secours Health System, Inc., 5.00%, 5/01/28 | 2,000 | 2,032,440 | ||||||||
South Dakota — 0.0% | ||||||||||
Educational Enhancement Funding Corp., Refunding RB, Series B, 5.00%, 6/01/27 | 650 | 708,799 | ||||||||
Tennessee — 0.1% | ||||||||||
Chattanooga Health Educational & Housing Facility Board, RB, Catholic Health Initiatives, Series A, 5.00%, 1/01/33 | 1,500 | 1,610,685 | ||||||||
Texas — 16.1% | ||||||||||
Central Texas Regional Mobility Authority, Refunding RB, Senior Lien, Series A, 5.00%, 1/01/33 | 1,260 | 1,334,012 | ||||||||
City of Brownsville Texas Utilities System Revenue, Refunding RB, Series A: | ||||||||||
4.00%, 9/01/30 | 11,170 | 11,478,404 | ||||||||
4.00%, 9/01/31 | 11,220 | 11,459,996 | ||||||||
City of Houston Texas Airport System, Refunding RB, United Airlines, Inc. Terminal E Project, AMT: | ||||||||||
4.75%, 7/01/24 | 3,335 | 3,430,848 | ||||||||
5.00%, 7/01/29 | 2,665 | 2,689,598 | ||||||||
Clifton Higher Education Finance Corp., RB, Idea Public Schools, 6.00%, 8/15/33 | 1,650 | 1,915,881 | ||||||||
Clifton Higher Education Finance Corp., Refunding RB, Uplift Education, Series A: | ||||||||||
3.10%, 12/01/22 | 1,050 | 994,277 | ||||||||
3.95%, 12/01/32 | 1,800 | 1,624,950 | ||||||||
County of Harris Texas, Refunding RB, Toll Road Senior Lien, Series C, 4.00%, 8/15/33 | 12,325 | 12,502,727 | ||||||||
County of Harris Texas Cultural Education Facilities Finance Corp., RB, 1st Mortgage, Brazos Presbyterian Homes, Inc. Project, Series B: | ||||||||||
5.75%, 1/01/28 | 500 | 555,950 | ||||||||
6.38%, 1/01/33 | 460 | 511,005 | ||||||||
County of Harris Texas Cultural Education Facilities Finance Corp., Refunding RB, Series A: | ||||||||||
Brazos Presbyterian Homes, Inc. Project, 5.00%, 1/01/33 | 1,090 | 1,068,113 | ||||||||
Memorial Hermann Health System, 4.00%, 12/01/31 | 20,000 | 20,282,600 | ||||||||
YMCA of the Greater Houston Area, 5.00%, 6/01/28 | 1,500 | 1,621,050 | ||||||||
YMCA of the Greater Houston Area, 5.00%, 6/01/33 | 3,000 | 3,159,570 | ||||||||
| 34 | ANNUAL REPORT | JULY 31, 2014 |
| Schedule of Investments (continued) | BlackRock Municipal Target Term Trust (BTT) (Percentages shown are based on Net Assets) |
| Municipal Bonds | Par (000) | Value | ||||||||
Texas (concluded) | ||||||||||
County of Matagorda Texas Navigation District No. 1, Refunding RB: | ||||||||||
Series A (AMBAC), 4.40%, 5/01/30 | $ | 31,120 | $ | 32,355,464 | ||||||
Series B (AMBAC), AMT, 4.55%, 5/01/30 | 10,000 | 10,285,600 | ||||||||
Series B-2, 4.00%, 6/01/30 | 12,895 | 12,789,777 | ||||||||
County of Midland Texas Fresh Water Supply District No. 1, RB, City of Midland Project, Series A: | ||||||||||
CAB, 0.00%, 9/15/31 (b) | 6,235 | 3,001,404 | ||||||||
CAB, 0.00%, 9/15/32 (b) | 15,135 | 6,856,760 | ||||||||
5.00%, 9/15/31 | 2,435 | 2,749,943 | ||||||||
County of Tarrant Texas Cultural Education Facilities Finance Corp., RB, Baylor Health Care System Project, Series A: | ||||||||||
4.00%, 11/15/31 | 5,500 | 5,540,315 | ||||||||
4.00%, 11/15/32 | 15,420 | 15,443,438 | ||||||||
County of Tarrant Texas Cultural Education Facilities Finance Corp., Refunding RB, Scott & White Healthcare, 5.00%, 8/15/33 | 5,000 | 5,523,750 | ||||||||
Love Field Airport Modernization Corp., RB, Southwest Airlines Co. Project, AMT, 5.00%, 11/01/28 | 5,750 | 6,028,760 | ||||||||
Lower Colorado River Authority, Refunding RB, LCRA Transmission Services: | ||||||||||
4.00%, 5/15/31 | 9,970 | 10,123,040 | ||||||||
4.00%, 5/15/32 | 10,635 | 10,733,799 | ||||||||
New Hope Cultural Education Facilities Corp., RB: | ||||||||||
5.00%, 4/01/29 | 1,290 | 1,402,217 | ||||||||
5.00%, 4/01/29 | 725 | 780,803 | ||||||||
Stephenville LLC Tarleton State University Project, Series A, 5.38%, 4/01/28 | 1,150 | 1,248,992 | ||||||||
New Hope Cultural Education Facilities Corp., Refunding RB, 1st Mortgage, Morningside Ministries Project, 6.25%, 1/01/33 | 1,600 | 1,709,888 | ||||||||
Red River Health Facilities Development Corp., RB, Wichita Falls Retirement Foundation Project: | ||||||||||
4.70%, 1/01/22 | 955 | 954,608 | ||||||||
5.50%, 1/01/32 | 1,000 | 1,008,430 | ||||||||
Texas Municipal Gas Acquisition & Supply Corp. III, RB: | ||||||||||
5.00%, 12/15/31 | 25,000 | 26,507,000 | ||||||||
Natural Gas Utility Improvements, 5.00%, 12/15/30 | 18,000 | 19,255,860 | ||||||||
| 248,928,829 | ||||||||||
US Virgin Islands — 0.7% | ||||||||||
Virgin Islands Public Finance Authority, Refunding RB, Gross Receipts Taxes Loan Note, Series A, 5.00%, 10/01/32 | 10,000 | 10,726,300 | ||||||||
Utah — 0.8% | ||||||||||
County of Salt Lake Utah Housing Authority, RB, M/F Housing, Liberty Village Apartments Project (Freddie Mac), 3.38%, 8/01/28 | 12,000 | 12,025,680 | ||||||||
Vermont — 0.2% | ||||||||||
Vermont EDA, Refunding, MRB, Wake Robin Corp. Project, 5.40%, 5/01/33 | 2,400 | 2,453,736 | ||||||||
Virginia — 4.9% | ||||||||||
County of Fairfax Virginia EDA, RB, Vinson Hall LLC, Series A: | ||||||||||
4.00%, 12/01/22 | 505 | 509,616 | ||||||||
4.50%, 12/01/32 | 2,840 | 2,760,338 | ||||||||
5.00%, 12/01/32 | 2,000 | 2,046,300 | ||||||||
County of Fairfax Virginia IDA, Refunding RB, Inova Health System, Series D, 4.00%, 5/15/29 | 5,325 | 5,590,185 | ||||||||
County of Hanover Virginia EDA, Refunding RB, Covenant Woods, Series A: | ||||||||||
4.50%, 7/01/30 | 3,000 | 2,811,510 | ||||||||
4.50%, 7/01/32 | 1,100 | 1,013,320 | ||||||||
| Municipal Bonds | Par (000) | Value | |||||||||
Virginia (concluded) | |||||||||||
County of Prince William Virginia IDA, Refunding RB, Novant Health Obligation Group, Series B, 4.00%, 11/01/33 | $ | 15,445 | $ | 15,595,743 | |||||||
Dulles Town Center Community Development Authority, Refunding, Special Assessment, Dulles Town Center Project, 4.25%, 3/01/26 | 500 | 483,970 | |||||||||
Virginia HDA, RB, Remarketing: | |||||||||||
M/F Housing, Sub-Series C-2, 3.00%, 4/01/31 | 23,175 | 21,525,635 | |||||||||
S/F Housing, Sub-Series C-3, 3.25%, 4/01/31 | 21,500 | 19,502,435 | |||||||||
Virginia Small Business Financing Authority, RB, Senior Lien, Express Lanes LLC, AMT, 5.00%, 7/01/34 | 3,940 | 4,042,913 | |||||||||
| 75,881,965 | |||||||||||
Washington — 3.2% | |||||||||||
Greater Wenatchee Regional Events Center Public Facilities District, Refunding RB, Series A: | |||||||||||
3.50%, 9/01/18 | 1,025 | 1,034,123 | |||||||||
5.00%, 9/01/27 | 1,000 | 1,002,920 | |||||||||
5.25%, 9/01/32 | 1,850 | 1,874,216 | |||||||||
Port of Seattle Industrial Development Corp., Refunding RB, Special Facilities, Delta Airline, Inc. Project, AMT, 5.00%, 4/01/30 | 5,000 | 5,004,550 | |||||||||
Spokane Public Facilities District, Refunding RB, Series B: | |||||||||||
4.50%, 12/01/30 | 5,370 | 5,612,670 | |||||||||
5.00%, 12/01/32 | 5,895 | 6,379,923 | |||||||||
5.00%, 9/01/33 | 4,665 | 5,034,235 | |||||||||
State of Washington, COP, State and Local Agency Real and Personal Property, Series B: | |||||||||||
4.00%, 7/01/29 | 3,605 | 3,764,125 | |||||||||
4.00%, 7/01/30 | 4,290 | 4,455,165 | |||||||||
4.00%, 7/01/31 | 4,470 | 4,620,147 | |||||||||
4.00%, 7/01/32 | 4,590 | 4,721,779 | |||||||||
Washington State Housing Finance Commission, Refunding RB: | |||||||||||
Emerald Heights Project, 5.00%, 7/01/28 | 1,000 | 1,066,620 | |||||||||
Emerald Heights Project, 5.00%, 7/01/33 | 1,100 | 1,162,337 | |||||||||
Series 1N (Ginnie Mae) (Fannie Mae) (Freddie Mac), 3.50%, 12/01/33 | 4,035 | 4,029,230 | |||||||||
| 49,762,040 | |||||||||||
Wisconsin — 1.0% | |||||||||||
Public Finance Authority, Refunding RB, Wisconsin Airport Facilities, Senior Obligated Group, Series B, AMT, 5.25%, 7/01/28 | 2,250 | 2,378,903 | |||||||||
Wisconsin Health & Educational Facilities Authority, Refunding RB: | |||||||||||
Aspirus, Inc., Obligated Group, 5.00%, 8/15/28 | 3,510 | 3,906,279 | |||||||||
Aspirus, Inc., Obligated Group, 5.00%, 8/15/29 | 3,685 | 4,065,034 | |||||||||
Marquette University, 4.00%, 10/01/32 | 4,520 | 4,621,067 | |||||||||
| 14,971,283 | |||||||||||
Wyoming — 1.1% | |||||||||||
Wyoming Community Development Authority, Refunding RB, Series 2 & 3, 3.75%, 12/01/32 | 16,790 | 16,873,110 | |||||||||
Total Municipal Bonds — 134.1% | 2,079,606,449 | ||||||||||
Municipal Bonds Transferred to Tender Option Bond Trusts (e) | |||||||||||
Colorado — 5.2% | |||||||||||
City & County of Denver Colorado, Refunding ARB, Department of Aviation, Series A, AMT: | |||||||||||
4.25%, 11/15/29 | 33,820 | 34,399,373 | |||||||||
4.25%, 11/15/30 (f) | 35,210 | 35,813,186 | |||||||||
4.25%, 11/15/31 | 8,085 | 8,223,505 | |||||||||
4.25%, 11/15/32 | 2,230 | 2,268,202 | |||||||||
| 80,704,266 | |||||||||||
| ANNUAL REPORT | JULY 31, 2014 | 35 |
| Schedule of Investments (continued) | BlackRock Municipal Target Term Trust (BTT) (Percentages shown are based on Net Assets) |
| Municipal Bonds Transferred to Tender Option Bond Trusts (e) | Par (000) | Value | ||||||||
Florida — 6.1% | ||||||||||
County of Broward Florida, ARB, Series Q-1: | ||||||||||
4.00%, 10/01/29 | $ | 17,200 | $ | 17,344,900 | ||||||
4.00%, 10/01/30 | 18,095 | 18,247,439 | ||||||||
4.00%, 10/01/31 | 18,820 | 18,978,547 | ||||||||
4.00%, 10/01/32 | 19,575 | 19,739,907 | ||||||||
4.00%, 10/01/33 (f) | 20,355 | 20,526,478 | ||||||||
| 94,837,271 | ||||||||||
Iowa — 2.9% | ||||||||||
Iowa State Board of Regents, RB, University of Iowa Hospitals and Clinics: | ||||||||||
4.00%, 9/01/28 | 3,375 | 3,519,804 | ||||||||
4.00%, 9/01/29 | 6,525 | 6,804,955 | ||||||||
4.00%, 9/01/30 | 6,325 | 6,596,374 | ||||||||
4.00%, 9/01/31 | 8,650 | 9,021,128 | ||||||||
4.00%, 9/01/32 | 7,750 | 8,082,514 | ||||||||
4.00%, 9/01/33 | 9,375 | 9,777,235 | ||||||||
| 43,802,010 | ||||||||||
Texas — 10.2% | ||||||||||
City of San Antonio Texas Public Facilities Corp., Refunding LRB, Convention Center Refinancing and Expansion Project: | ||||||||||
4.00%, 9/15/30 | 15,000 | 15,418,623 | ||||||||
4.00%, 9/15/31 | 19,475 | 20,018,512 | ||||||||
4.00%, 9/15/32 | 18,075 | 18,579,441 | ||||||||
4.00%, 9/15/33 | 11,000 | 11,306,990 | ||||||||
4.00%, 9/15/34 | 11,885 | 12,216,689 | ||||||||
4.00%, 9/15/35 | 4,500 | 4,625,587 | ||||||||
| Municipal Bonds Transferred to Tender Option Bond Trusts (e) | Par (000) | Value | |||||||||
Texas (concluded) | |||||||||||
Dallas/Fort Worth International Airport, Refunding RB, AMT: | |||||||||||
Series E, 4.00%, 11/01/32 | $ | 6,915 | $ | 7,238,530 | |||||||
Series E, 4.13%, 11/01/35 | 10,435 | 10,923,219 | |||||||||
Series F, 5.00%, 11/01/29 | 12,820 | 13,419,806 | |||||||||
Series F, 5.00%, 11/01/30 | 15,565 | 16,293,235 | |||||||||
Series F, 5.00%, 11/01/31 | 10,000 | 10,467,867 | |||||||||
Series F, 5.00%, 11/01/32 (f) | 17,170 | 17,973,328 | |||||||||
| 158,481,827 | |||||||||||
Total Municipal Bonds Transferred to Tender Option Bond Trusts — 24.4% | 377,825,374 | ||||||||||
Total Long-Term Investments (Cost — $2,487,344,304) — 158.5% | 2,457,431,823 | ||||||||||
Short-Term Securities | Shares | ||||||||||
FFI Institutional Tax-Exempt Fund, 0.03% (g)(h) | 5,417,254 | 5,417,254 | |||||||||
Total Short-Term Securities (Cost — $5,417,254) — 0.4% | 5,417,254 | ||||||||||
Total Investments (Cost — $2,492,761,558) — 158.9% | 2,462,849,077 | ||||||||||
Other Assets Less Liabilities — 1.4% | 21,697,524 | ||||||||||
Liability for TOB Trust Certificates, Including Interest Expense and Fees Payable — (11.9%) | (184,170,986 | ) | |||||||||
RVMTP Shares, at Liquidation Value — (48.4%) | (750,000,000 | ) | |||||||||
Net Assets Applicable to Common Shares — 100.0% | $ | 1,550,375,615 | |||||||||
Notes to Schedule of Investments
| (a) | Security exempt from registration pursuant to Rule 144A under the Securities Act of 1933, as amended. These securities may be resold in transactions exempt from registration to qualified institutional investors. | |||
| (b) | Zero-coupon bond. | |||
| (c) | Represents a step-up bond that pays an initial coupon rate for the first period and then a higher coupon rate for the following periods. Rate shown is as of report date. | |||
| (d) | Variable rate security. Rate shown is as of report date. | |||
| (e) | Represent bonds transferred to a TOB. In exchange for which the Trust received cash and residual interest certificates. These bonds serve as collateral in a financing transaction. See Note 3 of the Notes to Financial Statements for details of municipal bonds transferred to TOBs. | |||
| (f) | All or a portion of security is subject to a recourse agreement, which may require the Trust to pay the liquidity provider in the event there is a shortfall between the TOB trust certificates and proceeds received from the sale of the security contributed to the TOB trust. In the case of a shortfall, the aggregate maximum potential amount the Trust could ultimately be required to pay under the agreements, which expire from November 1, 2018 to November 15, 2020 is $128,606,839. | |||
| (g) | Investments in issuers considered to be an affiliate of the Trust during the year ended July 31, 2014, for purposes of Section 2(a)(3) of the 1940 Act, were as follows: |
| Affiliate | Shares Held at July 31, 2013 | Net Activity | Shares Held at July 31, 2014 | Income | ||||||||||||||
FFI Institutional Tax-Exempt Fund | 55,145,313 | (49,728,059) | 5,417,254 | $2,893 | ||||||||||||||
| (h) | Represents the current yield as of report date. | |||
| • | Financial futures contracts outstanding as of July 31, 2014 were as follows: |
| Contracts Sold | Issue | Exchange | Expiration | Notional Value | Unrealized Appreciation | |||||||
(1,280) | 10-Year U.S. Treasury Note | Chicago Board of Trade | September 2014 | $159,500,000 | $27,566 | |||||||
(325) | U.S. Treasury Long Bond | Chicago Board of Trade | September 2014 | $ 44,657,031 | 19,939 | |||||||
Total | $47,505 | |||||||||||
| 36 | ANNUAL REPORT | JULY 31, 2014 |
| Schedule of Investments (concluded) | BlackRock Municipal Target Term Trust (BTT) |
| • | Fair Value Measurements – Various inputs are used in determining the fair value of investments and derivative financial instruments. These inputs to valuation techniques are categorized into a disclosure hierarchy consisting of three broad levels for financial statement purposes as follows: |
| • | Level 1 – unadjusted price quotations in active markets/exchanges for identical assets or liabilities that the Trust has the ability to access | |||
| • | Level 2 – other observable inputs (including, but not limited to, quoted prices for similar assets or liabilities in markets that are active, quoted prices for identical or similar assets or liabilities in markets that are not active, inputs other than quoted prices that are observable for the assets or liabilities (such as interest rates, yield curves, volatilities, prepayment speeds, loss severities, credit risks and default rates) or other market-corroborated inputs) | |||
| • | Level 3 – unobservable inputs based on the best information available in the circumstances, to the extent observable inputs are not available (including the Trust’s own assumptions used in determining the fair value of investments and derivative financial instruments) |
The hierarchy gives the highest priority to unadjusted quoted prices in active markets for identical assets or liabilities (Level 1 measurements) and the lowest priority to unobservable inputs (Level 3 measurements). Accordingly, the degree of judgment exercised in determining fair value is greatest for instruments categorized in Level 3. The inputs used to measure fair value may fall into different levels of the fair value hierarchy. In such cases, for disclosure purposes, the fair value hierarchy classification is determined based on the lowest level input that is significant to the fair value measurement in its entirety. | ||||
Changes in valuation techniques may result in transfers into or out of an assigned level within the disclosure hierarchy. In accordance with the Trust’s policy, transfers between different levels of the fair value disclosure hierarchy are deemed to have occurred as of the beginning of the reporting period. The categorization of a value determined for investments and derivative financial instruments is based on the pricing transparency of the investment and derivative financial instrument and is not necessarily an indication of the risks associated with investing in those securities. For information about the Trust’s policy regarding valuation of investments and derivative financial instruments, please refer to Note 2 of the Notes to Financial Statements. | ||||
The following tables summarize the Trust’s investments and derivative financial instruments categorized in the disclosure hierarchy as of July 31, 2014: |
| Level 1 | Level 2 | Level 3 | Total | |||||||||||||||
Assets: | ||||||||||||||||||
Investments: | ||||||||||||||||||
Long-Term Investments1 | — | $ | 2,457,431,823 | — | $ | 2,457,431,823 | ||||||||||||
Short-Term Securities | $ | 5,417,254 | — | — | 5,417,254 | |||||||||||||
Total | $ | 5,417,254 | $ | 2,457,431,823 | — | $ | 2,462,849,077 | |||||||||||
| 1 | See above Schedule of Investments for values in each state or political subdivision. |
| Level 1 | Level 2 | Level 3 | Total | |||||||||||||||
Derivative Financial Instruments2 | ||||||||||||||||||
Assets: | ||||||||||||||||||
Interest rate contracts | $ | 47,505 | — | — | $ | 47,505 | ||||||||||||
| 2 | Derivative financial instruments are financial futures contracts, which are valued at the unrealized appreciation/depreciation on the instrument. |
The Trust may hold assets and/or liabilities in which the fair value approximates the carrying amount for financial statement purposes. As of July 31, 2014, such assets and/or liabilities are categorized within the disclosure hierarchy as follows: |
| Level 1 | Level 2 | Level 3 | Total | |||||||||||||||
Assets: | ||||||||||||||||||
Cash pledged for financial futures contracts | $ | 2,377,002 | — | — | $ | 2,377,002 | ||||||||||||
Liabilities: | ||||||||||||||||||
TOB trust certificates | — | $ | (184,119,974 | ) | — | (184,119,974 | ) | |||||||||||
RVMTP Shares | — | (750,000,000 | ) | — | (750,000,000 | ) | ||||||||||||
Total | $ | 2,377,002 | $ | (934,119,974 | ) | — | $ | (931,742,972 | ) | |||||||||
There were no transfers between levels during the year ended July 31, 2014. |
| ANNUAL REPORT | JULY 31, 2014 | 37 |
| Schedule of Investments July 31, 2014 | BlackRock New Jersey Municipal Income Trust (BNJ) (Percentages shown are based on Net Assets) |
| Municipal Bonds | Par (000) | Value | |||||||||
New Jersey — 136.5% | |||||||||||
Corporate — 10.5% | |||||||||||
County of Middlesex New Jersey Improvement Authority, RB, Heldrich Center Hotel, Sub-Series B, 6.25%, 1/01/37 (a)(b) | $ | 1,790 | $ | 91,290 | |||||||
County of Salem New Jersey Pollution Control Financing Authority, Refunding RB, Series A: | |||||||||||
Atlantic City Electric, 4.88%, 6/01/29 | 2,400 | 2,551,488 | |||||||||
Chambers Project, AMT, 5.00%, 12/01/23 | 1,275 | 1,410,698 | |||||||||
New Jersey EDA, RB, Continental Airlines, Inc. Project, Series B, AMT, 5.63%, 11/15/30 | 5,160 | 5,481,417 | |||||||||
New Jersey EDA, Refunding RB, New Jersey American Water Co., Inc. Project, AMT: | |||||||||||
Series A, 5.70%, 10/01/39 | 1,500 | 1,643,670 | |||||||||
Series B, 5.60%, 11/01/34 | 1,275 | 1,401,327 | |||||||||
| 12,579,890 | |||||||||||
County/City/Special District/School District — 15.6% | |||||||||||
City of Margate New Jersey, GO, Refunding, Improvement, 5.00%, 1/15/28 | 1,085 | 1,184,842 | |||||||||
City of Perth Amboy New Jersey, GO, CAB, Refunding (AGM): | 175 | 181,426 | |||||||||
5.00%, 7/01/35 | |||||||||||
5.00%, 7/01/34 | 1,075 | 1,117,495 | |||||||||
County of Essex New Jersey Improvement Authority, Refunding RB, Project Consolidation (NPFGC): | |||||||||||
5.50%, 10/01/28 | 1,440 | 1,828,512 | |||||||||
5.50%, 10/01/29 | 2,630 | 3,344,939 | |||||||||
County of Hudson New Jersey Improvement Authority, RB, Harrison Parking Facility Project, Series C (AGC): | |||||||||||
5.25%, 1/01/39 | 2,000 | 2,140,320 | |||||||||
5.38%, 1/01/44 | 2,400 | 2,571,432 | |||||||||
County of Union New Jersey Improvement Authority, LRB, Guaranteed Lease, Family Court Building Project, 5.00%, 5/01/42 | 890 | 986,894 | |||||||||
County of Union New Jersey Utilities Authority, Refunding RB, Solid Waste System, County Deficiency Agreement, Series A, 5.00%, 6/15/41 | 2,185 | 2,378,001 | |||||||||
New Jersey EDA, Refunding RB, Special Assessment, Kapkowski Road Landfill Project, 6.50%, 4/01/28 | 2,500 | 2,923,550 | |||||||||
| 18,657,411 | |||||||||||
Education — 28.5% | |||||||||||
New Jersey EDA, RB: | |||||||||||
(AGC), School Facilities Construction, 5.50%, 12/15/18 (c) | 1,935 | 2,312,112 | |||||||||
(AGC), School Facilities Construction, 5.50%, 12/15/34 | 1,065 | 1,204,334 | |||||||||
MSU Student Housing Project Provide, 5.88%, 6/01/42 | 1,500 | 1,636,800 | |||||||||
The Team Academy Charter School Project, 6.00%, 10/01/33 | 1,490 | 1,652,708 | |||||||||
New Jersey EDA, Refunding RB, School Facilities Construction, 5.00%, 6/15/33 | 1,875 | 2,026,612 | |||||||||
New Jersey Educational Facilities Authority, RB: | |||||||||||
Higher Educational Capital Improvement Fund, Series A, 5.00%, 9/01/32 | 2,070 | 2,281,864 | |||||||||
Montclair State University, Series J, 5.25%, 7/01/38 | 580 | 643,156 | |||||||||
New Jersey Educational Facilities Authority, Refunding RB: | |||||||||||
College of New Jersey, Series D (AGM), 5.00%, 7/01/35 | 3,230 | 3,558,620 | |||||||||
Georgian Court University, Series D, 5.00%, 7/01/33 | 250 | 255,843 | |||||||||
Kean University, Series A, 5.50%, 9/01/36 | 2,060 | 2,336,988 | |||||||||
| Municipal Bonds | Par (000) | Value | |||||||||
New Jersey (continued) | |||||||||||
Education (concluded): | |||||||||||
New Jersey Educational Facilities Authority, Refunding RB (concluded): | |||||||||||
Montclaire State University, Series A, 5.00%, 7/01/44 | $ | 4,570 | $ | 5,067,262 | |||||||
New Jersey Institute of Technology, Series H, 5.00%, 7/01/31 | 660 | 723,459 | |||||||||
Ramapo College, Series B, 5.00%, 7/01/42 | 265 | 285,617 | |||||||||
University of Medicine & Dentistry, Series B, 7.50%, 6/01/19 (c) | 1,450 | 1,874,125 | |||||||||
New Jersey Higher Education Student Assistance Authority, Refunding RB: | |||||||||||
Series 1, AMT, 5.75%, 12/01/29 | 2,055 | 2,292,558 | |||||||||
Series 1A, 5.00%, 12/01/25 | 445 | 470,859 | |||||||||
Series 1A, 5.00%, 12/01/26 | 290 | 306,440 | |||||||||
Series 1A, 5.25%, 12/01/32 | 500 | 539,180 | |||||||||
New Jersey Institute of Technology, RB, Series A, 5.00%, 7/01/42 | 970 | 1,044,787 | |||||||||
Rutgers — The State University of New Jersey, Refunding RB, Series L, 5.00%, 5/01/43 | 3,145 | 3,490,258 | |||||||||
| 34,003,582 | |||||||||||
Health — 13.7% | |||||||||||
New Jersey EDA, Refunding RB: | |||||||||||
1st Mortgage, Winchester, Series A, 5.75%, 11/01/24 | 4,050 | 4,061,988 | |||||||||
Seabrook Village, Inc. Facility, 5.25%, 11/15/26 | 1,790 | 1,835,609 | |||||||||
New Jersey Health Care Facilities Financing Authority, RB: | |||||||||||
Meridian Health System Obligated Group, Series I (AGC), 5.00%, 7/01/38 | 720 | 755,424 | |||||||||
Robert Wood Johnson University Hospital, Series A, 5.50%, 7/01/43 | 750 | 832,755 | |||||||||
Virtua Health, Series A (AGC), 5.50%, 7/01/38 | 1,250 | 1,347,350 | |||||||||
New Jersey Health Care Facilities Financing Authority, Refunding RB: | |||||||||||
AHS Hospital Corp., 6.00%, 7/01/37 | 900 | 1,042,515 | |||||||||
AHS Hospital Corp., 6.00%, 7/01/41 | 1,045 | 1,209,786 | |||||||||
Meridian Health System Obligated Group, 5.00%, 7/01/26 | 970 | 1,076,205 | |||||||||
St. Barnabas Health Care System, Series A, 5.00%, 7/01/29 | 1,745 | 1,794,890 | |||||||||
St. Barnabas Health Care System, Series A, 5.63%, 7/01/32 | 580 | 634,972 | |||||||||
St. Barnabas Health Care System, Series A, 5.63%, 7/01/37 | 1,605 | 1,742,998 | |||||||||
| 16,334,492 | |||||||||||
Housing — 9.7% | |||||||||||
County of Middlesex New Jersey Improvement Authority, RB, AMT (Fannie Mae): | |||||||||||
Administration Building Residential Project, 5.35%, 7/01/34 | 1,400 | 1,400,490 | |||||||||
New Brunswick Apartments Rental Housing, 5.30%, 8/01/35 | 4,315 | 4,318,409 | |||||||||
New Jersey Housing & Mortgage Finance Agency, RB: | |||||||||||
M/F Housing, Series A, 4.75%, 11/01/29 | 1,185 | 1,240,932 | |||||||||
S/F Housing, Series AA, 6.38%, 10/01/28 | 645 | 671,897 | |||||||||
S/F Housing, Series AA, 6.50%, 10/01/38 | 685 | 705,495 | |||||||||
S/F Housing, Series CC, 5.00%, 10/01/34 | 995 | 1,044,262 | |||||||||
Newark Housing Authority, RB, M/F Housing, Series A, 5.00%, 12/01/30 | 2,000 | 2,223,540 | |||||||||
| 11,605,025 | |||||||||||
State — 18.5% | |||||||||||
Garden State Preservation Trust, RB, CAB, Series B (AGM), 0.00%, 11/01/26 (d) | 6,000 | 4,131,840 | |||||||||
| 38 | ANNUAL REPORT | JULY 31, 2014 |
| Schedule of Investments (continued) | BlackRock New Jersey Municipal Income Trust (BNJ) (Percentages shown are based on Net Assets) |
| Municipal Bonds | Par (000) | Value | |||||||||
New Jersey (continued) | |||||||||||
State (concluded) | |||||||||||
New Jersey EDA, RB: | |||||||||||
Kapkowski Road Landfill Project, Series B, AMT, 6.50%, 4/01/31 | $ | 5,000 | $ | 5,813,050 | |||||||
Motor Vehicle Surcharge, Series A (NPFGC), 5.25%, 7/01/25 | 1,365 | 1,625,974 | |||||||||
School Facilities Construction, Series CC-2, 5.00%, 12/15/31 | 1,525 | 1,654,686 | |||||||||
New Jersey EDA, Refunding RB: | |||||||||||
Lions Gate Project, 5.25%, 1/01/44 | 430 | 430,138 | |||||||||
Cigarette Tax, 5.00%, 6/15/26 | 810 | 891,348 | |||||||||
Cigarette Tax, 5.00%, 6/15/29 | 1,000 | 1,081,650 | |||||||||
Cigarette Tax (AGM), 5.00%, 6/15/22 | 2,940 | 3,368,241 | |||||||||
New Jersey Health Care Facilities Financing Authority, RB, Hospital Asset Transformation Program, Series A, 5.25%, 10/01/38 | 2,350 | 2,473,563 | |||||||||
State of New Jersey, COP, Equipment Lease Purchase, Series A, 5.25%, 6/15/28 | 600 | 657,330 | |||||||||
| 22,127,820 | |||||||||||
Transportation — 39.3% | |||||||||||
Delaware River Port Authority of Pennsylvania & New Jersey, RB: | |||||||||||
5.00%, 1/01/40 | 1,380 | 1,504,310 | |||||||||
Series D, 5.00%, 1/01/40 | 800 | 849,792 | |||||||||
New Jersey EDA, RB, Private Activity Bond, The Goethals Bridge Replacement Project, AMT, 5.38%, 1/01/43 | 4,500 | 4,773,825 | |||||||||
New Jersey State Turnpike Authority, RB: | |||||||||||
Series A, 5.00%, 1/01/38 | 4,000 | 4,342,480 | |||||||||
Series E, 5.25%, 1/01/40 | 1,970 | 2,182,740 | |||||||||
New Jersey Transportation Trust Fund Authority, RB, Transportation System: | |||||||||||
CAB, Series C (AGM), 0.00%, 12/15/32 (d) | 4,000 | 1,688,440 | |||||||||
6.00%, 12/15/38 | 945 | 1,100,991 | |||||||||
Series A, 6.00%, 6/15/35 | 4,135 | 4,949,761 | |||||||||
Series A, 5.88%, 12/15/38 | 1,770 | 2,056,988 | |||||||||
Series A, 5.50%, 6/15/41 | 2,000 | 2,215,320 | |||||||||
Series A (AGC), 5.50%, 12/15/38 | 1,000 | 1,144,710 | |||||||||
Series AA, 5.25%, 6/15/33 | 3,110 | 3,451,758 | |||||||||
Series AA, 5.50%, 6/15/39 | 2,260 | 2,498,543 | |||||||||
Port Authority of New York & New Jersey, RB, JFK International Air Terminal, Special Project: | |||||||||||
Series 6, AMT (NPFGC), 5.75%, 12/01/22 | 6,000 | 6,036,060 | |||||||||
Series 8, 6.00%, 12/01/42 | 1,430 | 1,640,610 | |||||||||
Port Authority of New York & New Jersey, Refunding ARB, Consolidated: | |||||||||||
166th Series, 5.25%, 7/15/36 | 4,000 | 4,492,120 | |||||||||
152nd Series, AMT, 5.75%, 11/01/30 | 1,750 | 1,980,720 | |||||||||
| 46,909,168 | |||||||||||
Utility — 0.7% | |||||||||||
Rahway Valley Sewerage Authority, RB, CAB, Series A (NPFGC), 0.00%, 9/01/33 (d) | 2,000 | 878,200 | |||||||||
Total Municipal Bonds — 136.5% | 163,095,588 | ||||||||||
| Municipal Bonds Transferred to Tender Option Bond Trusts (e) | Par (000) | Value | |||||||||
New Jersey — 25.4% | |||||||||||
County/City/Special District/School District — 5.1% | |||||||||||
County of Union New Jersey Utilities Authority, Refunding LRB, Resource Recovery Facility, Covanta Union, Inc., Series A, AMT, 5.25%, 12/01/31 | $ | 5,710 | $ | 6,166,971 | |||||||
Education — 1.4% | |||||||||||
Rutgers — The State University of New Jersey, RB, Series F, 5.00%, 5/01/39 | 1,499 | 1,665,380 | |||||||||
State — 5.5% | |||||||||||
New Jersey EDA, RB, School Facilities Construction (AGC): | |||||||||||
6.00%, 12/15/18 (c) | 987 | 1,162,450 | |||||||||
6.00%, 12/15/34 | 2,013 | 2,370,485 | |||||||||
New Jersey EDA, Refunding RB, 5.00%, 3/01/29 (f) | 2,787 | 3,049,410 | |||||||||
| 6,582,345 | |||||||||||
Transportation — 13.4% | |||||||||||
New Jersey State Turnpike Authority, RB, Series A, 5.00%, 1/01/38 (f) | 4,700 | 5,102,414 | |||||||||
New Jersey Transportation Trust Fund Authority, RB, Transportation System: | |||||||||||
Series A (AMBAC), 5.00%, 12/15/32 | 2,000 | 2,201,220 | |||||||||
Series B, 5.25%, 6/15/36 (f) | 2,501 | 2,719,477 | |||||||||
Port Authority of New York & New Jersey, RB, Consolidated, 169th Series, AMT, 5.00%, 10/15/41 | 3,495 | 3,766,631 | |||||||||
Port Authority of New York & New Jersey, Refunding RB, Consolidated, 152nd Series, AMT, 5.25%, 11/01/35 | 2,039 | 2,226,419 | |||||||||
| 16,016,161 | |||||||||||
Total Municipal Bonds Transferred to Tender Option Bond Trusts — 25.4% | 30,430,857 | ||||||||||
Total Long-Term Investments (Cost — $181,869,860) — 161.9% | 193,526,445 | ||||||||||
Short-Term Securities | Shares | ||||||||||
BIF New Jersey Municipal Money Fund, 0.00% (g)(h) | 1,307,069 | $ | 1,307,069 | ||||||||
Total Short-Term Securities (Cost — $1,307,069) — 1.1% | 1,307,069 | ||||||||||
Total Investments (Cost — $183,176,929) — 163.0% | 194,833,514 | ||||||||||
Other Assets Less Liabilities — 1.0% | 1,080,339 | ||||||||||
Liability for TOB Trust Certificates, Including Interest Expense and Fees Payable — (14.5%) | (17,305,052 | ) | |||||||||
VMTP Shares, at Liquidation Value — (49.5%) | (59,100,000 | ) | |||||||||
Net Assets Applicable to Common Shares — 100.0% | $ | 119,508,801 | |||||||||
Notes to Schedule of Investments
| (a) | Issuer filed for bankruptcy and/or is in default of principal and/or interest payments. | |||
| (b) | Non-income producing security. | |||
| (c) | U.S. government securities, held in escrow, are used to pay interest on this security, as well as to retire the bond in full at the date indicated, typically at a premium to par. | |||
| (d) | Zero-coupon bond. | |||
| (e) | Represent bonds transferred to a TOB. In exchange for which the Trust received cash and residual interest certificates. These bonds serve as collateral in a financing transaction. See Note 3 of the Notes to Financial Statements for details of municipal bonds transferred to TOBs. |
| ANNUAL REPORT | JULY 31, 2014 | 39 |
| Schedule of Investments (concluded) | BlackRock New Jersey Municipal Income Trust (BNJ) |
| (f) | All or a portion of security is subject to a recourse agreement, which may require the Trust to pay the liquidity provider in the event there is a shortfall between the TOB trust certificates and proceeds received from the sale of the security contributed to the TOB trust. In the case of a shortfall, the aggregate maximum potential amount the Trust could ultimately be required to pay under the agreements, which expire from June 15, 2019 to September 1, 2020 is $7,517,578. | |||
| (g) | Investments in issuers considered to be an affiliate of the Trust during the year ended July 31, 2014, for purposes of Section 2(a)(3) of the 1940 Act, were as follows: |
| Affiliate | Shares Held at July 31, 2013 | Net Activity | Shares Held at July 31, 2014 | Income | ||||||||||||||
BIF New Jersey Municipal Money Fund | 4,818,896 | (3,511,827) | 1,307,069 | $13 | ||||||||||||||
| (h) | Represents the current yield as of report date. | |||||
| • | Financial futures contracts outstanding as of July 31, 2014 were as follows: | |||||
| Contracts Sold | Issue | Exchange | Expiration | Notional Value | Unrealized Appreciation | |||||||
(72) | 10-Year U.S. Treasury Note | Chicago Board of Trade | September 2014 | $8,971,875 | $30,837 |
| • | For Trust compliance purposes, the Trust’s sector classifications refer to any one or more of the sector sub-classifications used by one or more widely recognized market indexes or rating group indexes, and/or as defined by the investment advisor. These definitions may not apply for purposes of this report, which may combine such sector sub-classifications for reporting ease. | |||
| • | Fair Value Measurements – Various inputs are used in determining the fair value of investments and derivative financial instruments. These inputs to valuation techniques are categorized into a disclosure hierarchy consisting of three broad levels for financial statement purposes as follows: |
| • | Level 1 – unadjusted price quotations in active markets/exchanges for identical assets or liabilities that the Trust has the ability to access | |||
| • | Level 2 – other observable inputs (including, but not limited to, quoted prices for similar assets or liabilities in markets that are active, quoted prices for identical or similar assets or liabilities in markets that are not active, inputs other than quoted prices that are observable for the assets or liabilities (such as interest rates, yield curves, volatilities, prepayment speeds, loss severities, credit risks and default rates) or other market-corroborated inputs) | |||
| • | Level 3 – unobservable inputs based on the best information available in the circumstances, to the extent observable inputs are not available (including the Trust’s own assumptions used in determining the fair value of investments and derivative financial instruments) |
The hierarchy gives the highest priority to unadjusted quoted prices in active markets for identical assets or liabilities (Level 1 measurements) and the lowest priority to unobservable inputs (Level 3 measurements). Accordingly, the degree of judgment exercised in determining fair value is greatest for instruments categorized in Level 3. The inputs used to measure fair value may fall into different levels of the fair value hierarchy. In such cases, for disclosure purposes, the fair value hierarchy classification is determined based on the lowest level input that is significant to the fair value measurement in its entirety. | ||||
Changes in valuation techniques may result in transfers into or out of an assigned level within the disclosure hierarchy. In accordance with the Trust’s policy, transfers between different levels of the fair value disclosure hierarchy are deemed to have occurred as of the beginning of the reporting period. The categorization of a value determined for investments and derivative financial instruments is based on the pricing transparency of the investment and derivative financial instrument and is not necessarily an indication of the risks associated with investing in those securities. For information about the Trust’s policy regarding valuation of investments and derivative financial instruments, please refer to Note 2 of the Notes to Financial Statements. | ||||
The following tables summarize the Trust’s investments and derivative financial instruments categorized in the disclosure hierarchy as of July 31, 2014: |
| Level 1 | Level 2 | Level 3 | Total | |||||||||||||||
Assets: | ||||||||||||||||||
Investments: | ||||||||||||||||||
Long-Term Investments1 | — | $ | 193,526,445 | — | $ | 193,526,445 | ||||||||||||
Short-Term Securities | $ | 1,307,069 | — | — | 1,307,069 | |||||||||||||
Total | $ | 1,307,069 | $ | 193,526,445 | — | $ | 194,833,514 | |||||||||||
| 1 | See above Schedule of Investments for values in each sector. |
| Level 1 | Level 2 | Level 3 | Total | |||||||||||||||
Derivative Financial Instruments2 | ||||||||||||||||||
Assets: | ||||||||||||||||||
Interest rate contracts | $ | 30,837 | — | — | $ | 30,837 | ||||||||||||
| 2 | Derivative financial instruments are financial futures contracts, which are valued at the unrealized appreciation/depreciation on the instrument. |
The Trust may hold assets and/or liabilities in which the fair value approximates the carrying amount for financial statement purposes. As of July 31, 2014, such assets and/or liabilities are categorized within the disclosure hierarchy as follows: |
| Level 1 | Level 2 | Level 3 | Total | |||||||||||||||
Assets: | ||||||||||||||||||
Cash pledged for financial futures contracts | $ | 99,000 | — | — | $ | 99,000 | ||||||||||||
Liabilities: | ||||||||||||||||||
TOB trust certificates | — | $ | (17,301,282 | ) | — | (17,301,282 | ) | |||||||||||
VMTP Shares | — | (59,100,000 | ) | — | (59,100,000 | ) | ||||||||||||
Total | $ | 99,000 | $ | (76,401,282 | ) | — | $ | (76,302,282 | ) | |||||||||
There were no transfers between levels during the year ended July 31, 2014. |
| 40 | ANNUAL REPORT | JULY 31, 2014 |
| Schedule of Investments July 31, 2014 | BlackRock New York Municipal Income Trust (BNY) (Percentages shown are based on Net Assets) |
| Municipal Bonds | Par (000) | Value | |||||||||
New York — 134.8% | |||||||||||
Corporate — 14.5% | |||||||||||
City of New York New York Industrial Development Agency, ARB, American Airlines, Inc., JFK International Airport, AMT (a): | |||||||||||
7.63%, 8/01/25 | $ | 3,200 | $ | 3,513,088 | |||||||
7.75%, 8/01/31 | 4,000 | 4,415,560 | |||||||||
City of New York New York Industrial Development Agency, Refunding RB, Transportation Infrastructure Properties LLC, Series A, AMT, 5.00%, 7/01/28 | 795 | 848,186 | |||||||||
County of Chautauqua New York Industrial Development Agency, RB, NRG Dunkirk Power Project, 5.88%, 4/01/42 | 1,000 | 1,085,080 | |||||||||
County of Essex New York Industrial Development Agency, RB, International Paper Co. Project, Series A, AMT, 6.63%, 9/01/32 | 550 | 615,626 | |||||||||
County of Suffolk New York Industrial Development Agency, RB, KeySpan Generation LLC, Port Jefferson, AMT, 5.25%, 6/01/27 | 6,000 | 6,030,240 | |||||||||
New York Liberty Development Corp., RB, Goldman Sachs Headquarters, 5.25%, 10/01/35 | 5,350 | 6,181,550 | |||||||||
Niagara Area Development Corp., Refunding RB, Solid Waste Disposal Facility, Covanta Energy Project, Series A, AMT, 5.25%, 11/01/42 | 1,500 | 1,517,055 | |||||||||
Port Authority of New York & New Jersey, ARB, Continental Airlines, Inc. & Eastern Air Lines, Inc. Project, LaGuardia, AMT, 9.13%, 12/01/15 | 3,285 | 3,351,850 | |||||||||
| 27,558,235 | |||||||||||
County/City/Special District/School District — 32.5% | |||||||||||
City of New York New York, GO: | |||||||||||
Fiscal 2014, Sub-Series D-1, 5.00%, 8/01/31 | 690 | 778,403 | |||||||||
Series A-1, 5.00%, 8/01/35 | 1,000 | 1,103,500 | |||||||||
Series A-1, Fiscal 2009, 4.75%, 8/15/25 | 750 | 841,890 | |||||||||
Series D, 5.38%, 6/01/32 | 25 | 25,101 | |||||||||
Sub-Series G-1, 5.00%, 4/01/28 | 630 | 720,336 | |||||||||
Sub-Series G-1, 5.00%, 4/01/29 | 750 | 852,570 | |||||||||
Sub-Series G-1, 6.25%, 12/15/31 | 500 | 589,805 | |||||||||
Sub-Series I-1, 5.38%, 4/01/36 | 1,750 | 1,998,465 | |||||||||
City of New York New York, GO, Refunding: | |||||||||||
Series E, 5.50%, 8/01/25 | 1,280 | 1,570,509 | |||||||||
Series E, 5.00%, 8/01/30 | 1,000 | 1,131,440 | |||||||||
Series I, 5.00%, 8/01/30 | 1,000 | 1,134,470 | |||||||||
City of New York New York Convention Center Development Corp., RB, Hotel Unit Fee Secured (AMBAC): | |||||||||||
5.00%, 11/15/35 | 250 | 260,330 | |||||||||
5.00%, 11/15/44 | 6,495 | 6,743,239 | |||||||||
4.75%, 11/15/45 | 500 | 504,450 | |||||||||
City of New York New York Housing Development Corp., RB, Fund Grant Program, New York City Housing Authority Program, Series B1: | |||||||||||
5.25%, 7/01/32 | 1,140 | 1,287,915 | |||||||||
5.00%, 7/01/33 | 500 | 548,970 | |||||||||
City of New York New York Industrial Development Agency, RB, PILOT: | |||||||||||
CAB, Yankee Stadium Project, Series A (AGC), 0.00%, 3/01/42 (b) | 1,960 | 498,840 | |||||||||
CAB, Yankee Stadium Project, Series A (AGC), 0.00%, 3/01/45 (b) | 1,500 | 319,365 | |||||||||
Queens Baseball Stadium (AGC), 6.38%, 1/01/39 | 150 | 174,090 | |||||||||
Queens Baseball Stadium (AMBAC), 5.00%, 1/01/39 | 3,000 | 3,046,230 | |||||||||
Yankee Stadium Project (NPFGC), 4.75%, 3/01/46 | 480 | 485,861 | |||||||||
City of New York New York Industrial Development Agency, Refunding ARB, Transportation Infrastructure Properties LLC, Series A, AMT, 5.00%, 7/01/22 | 650 | 715,949 | |||||||||
| Municipal Bonds | Par (000) | Value | |||||||||
New York (continued) | |||||||||||
County/City/Special District/School District (concluded) | |||||||||||
City of New York New York Transitional Finance Authority, RB, Future Tax Secured, Fiscal 2012, Sub-Series E-1, 5.00%, 2/01/42 | $ | 2,500 | $ | 2,726,550 | |||||||
Hudson Yards Infrastructure Corp., RB, Series A: | |||||||||||
Senior, Fiscal 2012, 5.75%, 2/15/47 | 200 | 227,526 | |||||||||
5.00%, 2/15/47 | 5,485 | 5,679,663 | |||||||||
(AGC), 5.00%, 2/15/47 | 1,000 | 1,036,720 | |||||||||
(AGM), 5.00%, 2/15/47 | 1,000 | 1,036,720 | |||||||||
(NPFGC), 4.50%, 2/15/47 | 4,500 | 4,570,515 | |||||||||
Metropolitan Transportation Authority, Refunding RB, Transportation, Series D, 5.00%, 11/15/34 | 800 | 864,360 | |||||||||
New York Liberty Development Corp., Refunding RB: | |||||||||||
2nd Priority, Bank of America Tower at One Bryant Park Project, Class 2, 5.63%, 7/15/47 | 2,000 | 2,190,660 | |||||||||
2nd Priority, Bank of America Tower at One Bryant Park Project, Class 3, 6.38%, 7/15/49 | 1,200 | 1,321,140 | |||||||||
4 World Trade Center Project, 5.00%, 11/15/31 | 860 | 938,269 | |||||||||
4 World Trade Center Project, 5.00%, 11/15/44 | 7,655 | 8,219,480 | |||||||||
4 World Trade Center Project, 5.75%, 11/15/51 | 1,340 | 1,502,193 | |||||||||
7 World Trade Center Project, Class 1, 4.00%, 9/15/35 | 1,935 | 2,005,743 | |||||||||
7 World Trade Center Project, Class 2, 5.00%, 9/15/43 | 1,670 | 1,799,174 | |||||||||
7 World Trade Center Project, Class 3, 5.00%, 3/15/44 | 2,070 | 2,172,837 | |||||||||
| 61,623,278 | |||||||||||
Education — 29.6% | |||||||||||
Albany Industrial Development Agency, RB, New Covenant Charter School Project, Series A (c)(d): | |||||||||||
7.00%, 5/01/25 | 910 | 136,555 | |||||||||
7.00%, 5/01/35 | 590 | 88,535 | |||||||||
Amherst Development Corp., Refunding RB, University at Buffalo Foundation Faculty-Student Housing Corp., Series A (AGM), 4.63%, 10/01/40 | 1,100 | 1,147,883 | |||||||||
Build NYC Resource Corp., RB, Series A: | |||||||||||
Bronx Charter School for Excellence Project, 5.50%, 4/01/43 | 900 | 930,627 | |||||||||
Bronx Charter School for International Cultures & The Arts Project, 5.00%, 4/15/33 | 900 | 819,342 | |||||||||
City of New York New York Trust for Cultural Resources, RB, Juilliard School, Series A, 5.00%, 1/01/39 | 750 | 837,367 | |||||||||
City of New York New York Trust for Cultural Resources, Refunding RB: | |||||||||||
American Museum of National History, Series A (NPFGC), 5.00%, 7/01/37 | 225 | 254,477 | |||||||||
Carnegie Hall, Series A, 4.75%, 12/01/39 | 2,000 | 2,078,120 | |||||||||
Museum of Modern Art, Series 1A, 5.00%, 4/01/31 | 1,000 | 1,119,870 | |||||||||
City of Troy New York Capital Resource Corp., Refunding RB, Rensselaer Polytechnic Institute Project, Series A, 5.13%, 9/01/40 | 3,135 | 3,362,131 | |||||||||
City of Yonkers New York Industrial Development Agency, RB, Sarah Lawrence College Project, Series A, 6.00%, 6/01/41 | 625 | 684,000 | |||||||||
County of Cattaraugus New York, RB, 5.00%, 5/01/34 | 170 | 178,279 | |||||||||
County of Dutchess New York Industrial Development Agency, RB, Bard College Civic Facility, Series A-2, 4.50%, 8/01/36 | 6,100 | 5,642,134 | |||||||||
County of Madison New York Capital Resource Corp., Refunding RB, Colgate University Project, Series A, 4.50%, 7/01/39 | 135 | 144,193 | |||||||||
County of Madison New York Industrial Development Agency New York, RB, Commons II LLC, Student Housing, Series A (CIFG), 5.00%, 6/01/33 | 275 | 280,745 | |||||||||
County of Monroe New York Industrial Development Corp., RB, University of Rochester Project, Series A, 5.00%, 7/01/31 | 1,900 | 2,111,888 | |||||||||
| ANNUAL REPORT | JULY 31, 2014 | 41 |
| Schedule of Investments (continued) | BlackRock New York Municipal Income Trust (BNY) (Percentages shown are based on Net Assets) |
| Municipal Bonds | Par (000) | Value | |||||||||
New York (continued) | |||||||||||
Education (concluded) | |||||||||||
County of Monroe New York Industrial Development Corp., Refunding RB, University of Rochester Project, Series A, 5.00%, 7/01/38 | $ | 320 | $ | 352,106 | |||||||
County of Nassau New York Industrial Development Agency, Refunding RB, New York Institute of Technology Project, Series A, 4.75%, 3/01/26 | 1,165 | 1,218,800 | |||||||||
County of Orange New York Funding Corp., Refunding RB, Mount St. Mary College Project, Series A: | |||||||||||
5.00%, 7/01/37 | 360 | 374,051 | |||||||||
5.00%, 7/01/42 | 220 | 226,954 | |||||||||
County of St. Lawrence New York Industrial Development Agency, RB, Clarkson University Project, 5.38%, 9/01/41 | 750 | 826,402 | |||||||||
County of Tompkins New York Development Corp., RB, Ithaca College Project (AGM), 5.50%, 7/01/33 | 700 | 774,732 | |||||||||
Geneva Development Corp., Refunding RB, Hobart and William Smith Colleges, 5.25%, 9/01/44 | 500 | 552,810 | |||||||||
State of New York Dormitory Authority, RB: | |||||||||||
Convent of the Sacred Heart (AGM), 5.25%, 11/01/24 | 155 | 180,098 | |||||||||
Convent of the Sacred Heart (AGM), 5.63%, 11/01/32 | 750 | 845,992 | |||||||||
Convent of the Sacred Heart (AGM), 5.75%, 11/01/40 | 210 | 234,696 | |||||||||
Mount Sinai School of Medicine, 5.13%, 7/01/39 | 2,000 | 2,105,840 | |||||||||
New York University, Series 1 (AMBAC), 5.50%, 7/01/40 | 1,440 | 1,805,558 | |||||||||
New York University, Series A (AMBAC), 5.00%, 7/01/37 | 1,000 | 1,097,710 | |||||||||
New York University, Series B, 5.00%, 7/01/37 | 1,250 | 1,390,512 | |||||||||
State University Dormitory Facilities, Series A, 5.00%, 7/01/39 | 750 | 800,040 | |||||||||
State University Dormitory Facilities, Series A, 5.00%, 7/01/41 | 2,000 | 2,172,580 | |||||||||
Teachers College, Series B, 5.00%, 7/01/42 | 3,225 | 3,475,905 | |||||||||
University of Rochester, Series A, 5.13%, 7/01/39 | 850 | 950,963 | |||||||||
University of Rochester, Series A, 5.75%, 7/01/39 | 650 | 746,837 | |||||||||
University of Rochester, Series B, 5.00%, 7/01/39 | 500 | 539,640 | |||||||||
State of New York Dormitory Authority, Refunding RB: | |||||||||||
3rd General Resolution, State University Educational Facilities Issue, Series A, 5.00%, 5/15/29 | 2,000 | 2,264,040 | |||||||||
Brooklyn Law School, 5.75%, 7/01/33 | 475 | 510,435 | |||||||||
Cornell University, Series A, 5.00%, 7/01/40 | 1,000 | 1,132,420 | |||||||||
Culinary Institute of America, 5.00%, 7/01/42 | 300 | 312,318 | |||||||||
Fordham University, 4.00%, 7/01/30 | 555 | 568,620 | |||||||||
Fordham University, 5.00%, 7/01/44 | 850 | 934,337 | |||||||||
New York University, Series A, 5.00%, 7/01/37 | 1,790 | 1,991,214 | |||||||||
Rochester Institute of Technology, 5.00%, 7/01/42 | 1,790 | 1,938,158 | |||||||||
Rockefeller University, Series B, 4.00%, 7/01/38 | 775 | 800,490 | |||||||||
Skidmore College, Series A, 5.00%, 7/01/27 | 190 | 214,651 | |||||||||
Skidmore College, Series A, 5.00%, 7/01/28 | 75 | 84,007 | |||||||||
Skidmore College, Series A, 5.25%, 7/01/29 | 85 | 96,240 | |||||||||
State University Dormitory Facilities, Series A, 5.25%, 7/01/30 | 2,355 | 2,687,620 | |||||||||
State University Dormitory Facilities, Series A, 5.25%, 7/01/32 | 445 | 500,928 | |||||||||
State University Dormitory Facilities, Series A, 5.00%, 7/01/42 | 895 | 976,114 | |||||||||
Teachers College, 5.50%, 3/01/39 | 450 | 494,464 | |||||||||
| 55,994,428 | |||||||||||
Health — 15.6% | |||||||||||
County of Dutchess New York Local Development Corp., Refunding RB, Health Quest System, Inc., Series A, 5.75%, 7/01/40 | 300 | 330,225 | |||||||||
| Municipal Bonds | Par (000) | Value | |||||||||
New York (continued) | |||||||||||
Health (concluded) | |||||||||||
County of Genesee New York Industrial Development Agency, Refunding RB, United Memorial Medical Center Project, 5.00%, 12/01/27 | $ | 500 | $ | 500,085 | |||||||
County of Monroe New York Industrial Development Corp., RB, Rochester General Hospital Project, Series A, 5.00%, 12/01/32 | 240 | 258,439 | |||||||||
County of Monroe New York Industrial Development Corp., Refunding RB, Unity Hospital of Rochester Project (FHA), 5.50%, 8/15/40 | 1,650 | 1,887,699 | |||||||||
County of Nassau New York Local Economic Assistance Corp., Refunding RB, Winthrop University Hospital Association Project, 5.00%, 7/01/42 | 2,750 | 2,844,325 | |||||||||
County of Suffolk New York Industrial Development Agency, Refunding RB, Jefferson’s Ferry Project, 5.00%, 11/01/28 | 1,175 | 1,212,494 | |||||||||
County of Westchester New York Healthcare Corp., Refunding RB, Senior Lien: | |||||||||||
Remarketing, Series A, 5.00%, 11/01/30 | 3,500 | 3,729,530 | |||||||||
Series B, 6.00%, 11/01/30 | 500 | 566,895 | |||||||||
County of Westchester New York Local Development Corp., Refunding RB, Kendal On Hudson Project: | |||||||||||
4.00%, 1/01/23 | 650 | 673,992 | |||||||||
5.00%, 1/01/28 | 675 | 715,878 | |||||||||
5.00%, 1/01/34 | 1,250 | 1,314,813 | |||||||||
State of New York Dormitory Authority, RB: | |||||||||||
Hudson Valley Hospital (BHAC) 5.00%, 8/15/36 | 750 | 818,648 | |||||||||
Mental Health Services Facility, Series B (AMBAC), 5.00%, 2/15/15 (e) | 325 | 333,489 | |||||||||
New York State Association for Retarded Children, Inc., Series A, 6.00%, 7/01/32 | 500 | 568,940 | |||||||||
New York State Association for Retarded Children, Inc., Series B (AMBAC), 6.00%, 7/01/32 | 200 | 219,274 | |||||||||
New York University Hospitals Center, Series A, 6.00%, 7/01/40 | 500 | 557,220 | |||||||||
New York University Hospitals Center, Series B, 5.63%, 7/01/37 | 530 | 577,859 | |||||||||
North Shore-Long Island Jewish Obligated Group, Series A, 5.50%, 5/01/37 | 1,775 | 1,916,112 | |||||||||
North Shore-Long Island Jewish Obligated Group, Series D, 4.25%, 5/01/39 | 1,000 | 1,015,130 | |||||||||
State of New York Dormitory Authority, Refunding RB: | |||||||||||
Miriam Osborn Memorial Home Association, 5.00%, 7/01/29 | 290 | 307,467 | |||||||||
Mount Sinai Hospital, Series A, 5.00%, 7/01/26 | 1,385 | 1,533,735 | |||||||||
New York University Hospitals Center, Series A, 5.00%, 7/01/36 | 3,390 | 3,514,481 | |||||||||
North Shore-Long Island Jewish Obligated Group, Series A, 5.00%, 5/01/32 | 1,750 | 1,889,037 | |||||||||
North Shore-Long Island Jewish Obligated Group, Series A, 5.00%, 5/01/41 | 1,000 | 1,065,890 | |||||||||
North Shore-Long Island Jewish Obligated Group, Series E, 5.50%, 5/01/33 | 1,100 | 1,194,446 | |||||||||
| 29,546,103 | |||||||||||
Housing — 1.5% | |||||||||||
State of New York HFA, RB, M/F Housing, Highland Avenue Senior Apartments, Series A, AMT (SONYMA), 5.00%, 2/15/39 | 1,500 | 1,517,055 | |||||||||
State of New York Mortgage Agency, RB, S/F Housing, 49th Series, 4.00%, 10/01/43 | 1,000 | 1,005,500 | |||||||||
State of New York Mortgage Agency, Refunding RB, 48th Series, 3.70%, 10/01/38 | 360 | 353,768 | |||||||||
| 2,876,323 | |||||||||||
| 42 | ANNUAL REPORT | JULY 31, 2014 |
| Schedule of Investments (continued) | BlackRock New York Municipal Income Trust (BNY) (Percentages shown are based on Net Assets) |
| Municipal Bonds | Par (000) | Value | |||||||||
New York (continued) | |||||||||||
State — 13.7% | |||||||||||
City of New York New York Transitional Finance Authority, BARB, Series S-2 (NPFGC), 4.25%, 1/15/34 | $ | 1,260 | $ | 1,280,550 | |||||||
City of New York New York Transitional Finance Authority, RB, Future Tax Secured, 5.00%, 2/01/32 | 5,000 | 5,710,250 | |||||||||
State of New York Dormitory Authority, ERB, Series B, 5.75%, 3/15/36 | 600 | 695,568 | |||||||||
State of New York Dormitory Authority, RB: | |||||||||||
(AMBAC), 5.00%, 2/15/35 | 1,675 | 1,707,830 | |||||||||
General Purpose, Series B, 5.00%, 3/15/42 | 4,380 | 4,764,082 | |||||||||
General, Purpose, Series C, 5.00%, 3/15/34 | 2,185 | 2,429,414 | |||||||||
Series A, 5.25%, 1/01/34 | 800 | 869,560 | |||||||||
Series A, 5.50%, 1/01/39 | 2,000 | 2,185,280 | |||||||||
State of New York Dormitory Authority, Refunding RB: | |||||||||||
General Purpose Bonds, Series D, 5.00%, 2/15/34 | 500 | 557,730 | |||||||||
School Districts Financing Program, Series A (AGM), 5.00%, 10/01/35 | 395 | 431,992 | |||||||||
State of New York Thruway Authority, RB, Transportation, Series A, 5.00%, 3/15/32 | 320 | 362,576 | |||||||||
State of New York Thruway Authority, Refunding RB, 2nd General Highway and Bridge Trust, Series A, 5.00%, 4/01/32 | 3,500 | 3,907,505 | |||||||||
State of New York Urban Development Corp., RB, State Personal Income Tax, Series C, 5.00%, 3/15/30 | 885 | 1,011,343 | |||||||||
| 25,913,680 | |||||||||||
Transportation — 17.5% | |||||||||||
Metropolitan Transportation Authority, RB: | |||||||||||
Series A-1, 5.25%, 11/15/33 | 540 | 611,615 | |||||||||
Series C, 6.50%, 11/15/28 | 1,000 | 1,192,390 | |||||||||
Series D, 5.25%, 11/15/41 | 1,000 | 1,096,170 | |||||||||
Series E, 5.00%, 11/15/38 | 4,000 | 4,359,400 | |||||||||
Series H, 5.00%, 11/15/25 | 325 | 379,155 | |||||||||
Metropolitan Transportation Authority, Refunding RB: | |||||||||||
Series D, 5.25%, 11/15/30 | 910 | 1,050,923 | |||||||||
Series F, 5.00%, 11/15/30 | 2,000 | 2,238,560 | |||||||||
Series F (AGM), 4.00%, 11/15/30 | 1,250 | 1,285,500 | |||||||||
Port Authority of New York & New Jersey, ARB: | |||||||||||
Consolidated 183rd Series, 4.00%, 6/15/44 | 500 | 501,195 | |||||||||
JFK International Air Terminal LLC, Special Project, Series 6, AMT (NPFGC), 5.75%, 12/01/22 | 6,000 | 6,036,060 | |||||||||
JFK International Air Terminal LLC, Special Project, Series 8, AMT (NPFGC), 6.00%, 12/01/42 | 1,000 | 1,147,280 | |||||||||
Port Authority of New York & New Jersey, Refunding ARB: | |||||||||||
179th Series, 5.00%, 12/01/38 | 575 | 642,171 | |||||||||
Consolidated, 146th Series, AMT (AGM), 4.50%, 12/01/34 | 500 | 508,730 | |||||||||
Consolidated, 147th Series, AMT, 4.75%, 4/15/37 | 1,330 | 1,360,749 | |||||||||
Consolidated, 177th Series, AMT, 4.00%, 1/15/43 | 1,970 | 1,950,123 | |||||||||
Consolidated, 178th Series, AMT, 5.00%, 12/01/43 | 500 | 538,195 | |||||||||
Port Authority of New York & New Jersey, Refunding RB, 178th Series, AMT, 5.00%, 12/01/33 | 750 | 830,070 | |||||||||
State of New York Thruway Authority, Refunding RB, General, Series I: | |||||||||||
5.00%, 1/01/27 | 2,000 | 2,278,420 | |||||||||
5.00%, 1/01/37 | 2,920 | 3,197,867 | |||||||||
5.00%, 1/01/42 | 280 | 303,979 | |||||||||
Triborough Bridge & Tunnel Authority, Refunding RB, CAB (b): | |||||||||||
Sub-Series A, 0.00%, 11/15/32 | 845 | 401,671 | |||||||||
General, Series B, 0.00%, 11/15/32 | 2,500 | 1,224,725 | |||||||||
| 33,134,948 | |||||||||||
| Municipal Bonds | Par (000) | Value | |||||||||
New York (concluded) | |||||||||||
Utilities — 9.9% | |||||||||||
City of New York New York Municipal Water Finance Authority, RB, Series B, 5.00%, 6/15/36 | $ | 750 | $ | 796,912 | |||||||
City of New York New York Municipal Water Finance Authority, Refunding RB: | |||||||||||
2nd General Resolution, Series BB, 5.00%, 6/15/31 | 1,000 | 1,129,570 | |||||||||
Water & Sewer System, Series A, 4.75%, 6/15/30 | 1,500 | 1,637,940 | |||||||||
City of New York New York Water & Sewer System, Refunding RB, Series D, 5.00%, 6/15/39 | 5,000 | 5,160,500 | |||||||||
Long Island Power Authority, RB: | |||||||||||
General, Electric System, Series C (CIFG), 5.25%, 9/01/29 | 2,000 | 2,378,860 | |||||||||
Series A (AGM), 5.00%, 5/01/36 | 500 | 534,785 | |||||||||
Long Island Power Authority, Refunding RB, Electric System, Series A, 5.75%, 4/01/39 | 4,000 | 4,533,320 | |||||||||
State of New York Environmental Facilities Corp., Refunding RB, Revolving Funds New York City Municipal Water, 2nd General Resolution, Series B, 5.00%, 6/15/36 | 350 | 391,402 | |||||||||
Utility Debt Securitization Authority, Refunding RB, 5.00%, 12/15/41 | 2,000 | 2,251,480 | |||||||||
| 18,814,769 | |||||||||||
Total Municipal Bonds in New York | 255,461,764 | ||||||||||
Puerto Rico — 1.3% | |||||||||||
Housing — 1.3% | |||||||||||
Puerto Rico Housing Finance Authority, Refunding RB, M/F Housing, Subordinate, Capital Fund Modernization, 5.13%, 12/01/27 | 2,500 | 2,524,475 | |||||||||
Total Municipal Bonds — 136.1% | 257,986,239 | ||||||||||
Municipal Bonds Transferred to Tender Option Bond Trusts (f) | |||||||||||
New York — 26.8% | |||||||||||
County/City/Special District/School District — 5.5% | |||||||||||
City of New York New York, GO: | |||||||||||
Sub-Series G-1, 5.00%, 4/01/29 | 4,370 | 4,967,641 | |||||||||
Sub-Series I-1, 5.00%, 3/01/36 | 1,500 | 1,671,465 | |||||||||
City of New York New York Transitional Finance Authority, RB, Future Tax Secured, Sub-Series D-1, 5.00%, 11/01/38 | 825 | 915,296 | |||||||||
New York Liberty Development Corp., Refunding RB, 7 World Trade Center Project, Class 1, 5.00%, 9/15/40 | 2,610 | 2,869,826 | |||||||||
| 10,424,228 | |||||||||||
Education — 2.1% | |||||||||||
City of New York New York Trust for Cultural Resources, Refunding RB, Wildlife Conservation Society, Series A, 5.00%, 8/01/33 | 3,527 | 3,967,430 | |||||||||
State — 2.0% | |||||||||||
City of New York New York Transitional Finance Authority, BARB, Fiscal 2009, Series S-3, 5.25%, 1/15/39 | 660 | 738,736 | |||||||||
Hudson New York Yards Infrastructure Corp., RB, Senior Bond, Fiscal 2012, Series A, 5.75%, 2/15/47 (g) | 1,250 | 1,421,921 | |||||||||
State of New York Dormitory Authority, RB, General Purpose, Series C, 5.00%, 3/15/41 | 1,500 | 1,640,250 | |||||||||
| 3,800,907 | |||||||||||
| ANNUAL REPORT | JULY 31, 2014 | 43 |
| Schedule of Investments (continued) | BlackRock New York Municipal Income Trust (BNY) (Percentages shown are based on Net Assets) |
| Municipal Bonds Transferred to Tender Option Bond Trusts (f) | Par (000) | Value | |||||||||
New York (continued) | |||||||||||
Transportation — 5.4% | |||||||||||
New York Liberty Development Corp., RB, 1 World Trade Center Port Authority Consolidated, 5.25%, 12/15/43 | $ | 6,495 | $ | 7,156,711 | |||||||
Port Authority of New York & New Jersey, ARB, Consolidated, 169th Series, AMT, 5.00%, 10/15/26 | 1,500 | 1,699,395 | |||||||||
State of New York Thruway Authority, Refunding RB, Transportation, Personal Income Tax, Series A, 5.00%, 3/15/31 | 1,180 | 1,339,182 | |||||||||
| 10,195,288 | |||||||||||
Utilities — 11.8% | |||||||||||
City of New York New York Municipal Water Finance Authority, RB, Fiscal 2009, Series A, 5.75%, 6/15/40 | 1,200 | 1,372,858 | |||||||||
City of New York New York Municipal Water Finance Authority, Refunding RB, Water & Sewer System: | |||||||||||
2nd General Resolution, Fiscal 2011, Series HH, 5.00%, 6/15/32 | 5,310 | 5,918,207 | |||||||||
2nd General Resolution, Fiscal 2012, Series BB, 5.00%, 6/15/44 | 3,511 | 3,810,176 | |||||||||
2nd General Resolution, Series FF-2, 5.50%, 6/15/40 | 810 | 926,489 | |||||||||
Series A, 4.75%, 6/15/30 | 2,500 | 2,729,900 | |||||||||
| Municipal Bonds | Par (000) | Value | |||||||||
New York (concluded) | |||||||||||
Utilities (concluded) | |||||||||||
Utility Debt Securitization Authority, Refunding RB, 5.00%, 12/15/41 | $ | 6,868 | $ | 7,731,487 | |||||||
| 22,489,117 | |||||||||||
Total Municipal Bonds Transferred to Tender Option Bond Trusts — 26.8% | 50,876,970 | ||||||||||
Total Long-Term Investments (Cost — $293,402,648) — 162.9% | 308,863,209 | ||||||||||
Short-Term Securities | Shares | ||||||||||
BIF New York Municipal Money Fund, 0.00% (h)(i) | 874,210 | 874,210 | |||||||||
Total Short-Term Securities (Cost — $874,210) — 0.5% | 874,210 | ||||||||||
Total Investments (Cost — $294,276,858) — 163.4% | 309,737,419 | ||||||||||
Other Assets Less Liabilities — 1.5% | 2,776,692 | ||||||||||
Liability for TOB Trust Certificates, Including Interest Expense and Fees Payable — (15.0%) | (28,466,200 | ) | |||||||||
VMTP Shares, at Liquidation Value — (49.9%) | (94,500,000 | ) | |||||||||
Net Assets Applicable to Common Shares — 100.0% | $ | 189,547,911 | |||||||||
Notes to Schedule of Investments
| (a) | Variable rate security. Rate shown is as of report date. | |||
| (b) | Zero-coupon bond. | |||
| (c) | Non-income producing security. | |||
| (d) | Issuer filed for bankruptcy and/or is in default of principal and/or interest payments. | |||
| (e) | U.S. government securities, held in escrow, are used to pay interest on this security, as well as to retire the bond in full at the date indicated, typically at a premium to par. | |||
| (f) | Represent bonds transferred to a TOB. In exchange for which the Trust received cash and residual interest certificates. These bonds serve as collateral in a financing transaction. See Note 3 of the Notes to Financial Statements for details of municipal bonds transferred to TOBs. | |||
| (g) | All or a portion of security is subject to a recourse agreement, which may require the Trust to pay the liquidity provider in the event there is a shortfall between the TOB trust certificates and proceeds received from the sale of the security contributed to the TOB trust. In the case of a shortfall, the aggregate maximum potential amount the Trust could ultimately be required to pay under the agreement, which expires on February 15, 2019 is $661,835. | |||
| (h) | Investments in issuers considered to be an affiliate of the Trust during the year ended July 31, 2014, for purposes of Section 2(a)(3) of the 1940 Act, were as follows: |
| Affiliate | Shares Held at July 31, 2013 | Net Activity | Shares Held at July 31, 2014 | Income | ||||||
BIF New York Municipal Money Fund | 7,477,704 | (6,603,494) | 874,210 | $1,032 |
| (i) | Represents the current yield as of report date. | |||
| • | Financial futures contracts outstanding as of July 31, 2014 were as follows: |
| Contracts Sold | Issue | Exchange | Expiration | Notional Value | Unrealized Appreciation | |||||||
| (165) | 10-Year U.S. Treasury Note | Chicago Board of Trade | September 2014 | $20,560,547 | $64,222 |
| • | For Trust compliance purposes, the Trust’s sector classifications refer to any one or more of the sector sub-classifications used by one or more widely recognized market indexes or rating group indexes, and/or as defined by the investment advisor. These definitions may not apply for purposes of this report, which may combine such sector sub-classifications for reporting ease. |
| 44 | ANNUAL REPORT | JULY 31, 2014 |
| Schedule of Investments (concluded) | BlackRock New York Municipal Income Trust (BNY) |
| • | Fair Value Measurements – Various inputs are used in determining the fair value of investments and derivative financial instruments. These inputs to valuation techniques are categorized into a disclosure hierarchy consisting of three broad levels for financial statement purposes as follows: |
| • | Level 1 – unadjusted price quotations in active markets/exchanges for identical assets or liabilities that the Trust has the ability to access | |||
| • | Level 2 – other observable inputs (including, but not limited to, quoted prices for similar assets or liabilities in markets that are active, quoted prices for identical or similar assets or liabilities in markets that are not active, inputs other than quoted prices that are observable for the assets or liabilities (such as interest rates, yield curves, volatilities, prepayment speeds, loss severities, credit risks and default rates) or other market-corroborated inputs) | |||
| • | Level 3 – unobservable inputs based on the best information available in the circumstances, to the extent observable inputs are not available (including the Trust’s own assumptions used in determining the fair value of investments and derivative financial instruments) |
The hierarchy gives the highest priority to unadjusted quoted prices in active markets for identical assets or liabilities (Level 1 measurements) and the lowest priority to unobservable inputs (Level 3 measurements). Accordingly, the degree of judgment exercised in determining fair value is greatest for instruments categorized in Level 3. The inputs used to measure fair value may fall into different levels of the fair value hierarchy. In such cases, for disclosure purposes, the fair value hierarchy classification is determined based on the lowest level input that is significant to the fair value measurement in its entirety. | ||||
Changes in valuation techniques may result in transfers into or out of an assigned level within the disclosure hierarchy. In accordance with the Trust’s policy, transfers between different levels of the fair value disclosure hierarchy are deemed to have occurred as of the beginning of the reporting period. The categorization of a value determined for investments and derivative financial instruments is based on the pricing transparency of the investment and derivative financial instrument and is not necessarily an indication of the risks associated with investing in those securities. For information about the Trust’s policy regarding valuation of investments and derivative financial instruments, please refer to Note 2 of the Notes to Financial Statements. | ||||
The following tables summarize the Trust’s investments and derivative financial instruments categorized in the disclosure hierarchy as of July 31, 2014: |
| Level 1 | Level 2 | Level 3 | Total | |||||||||||||||
Assets: | ||||||||||||||||||
Investments: | ||||||||||||||||||
Long-Term Investments1 | — | $ | 308,863,209 | — | $ | 308,863,209 | ||||||||||||
Short-Term Securities | $ | 874,210 | — | — | 874,210 | |||||||||||||
Total | $ | 874,210 | $ | 308,863,209 | — | $ | 309,737,419 | |||||||||||
| 1 | See above Schedule of Investments for values in each sector. |
| Level 1 | Level 2 | Level 3 | Total | |||||||||||||||
Derivative Financial Instruments2 | ||||||||||||||||||
Assets: | ||||||||||||||||||
Interest rate contracts | $ | 64,222 | — | — | $ | 64,222 | ||||||||||||
| 2 | Derivative financial instruments are financial futures contracts, which are valued at the unrealized appreciation/depreciation on the instrument. |
The Trust may hold assets and/or liabilities in which the fair value approximates the carrying amount for financial statement purposes. As of July 31, 2014, such assets and/or liabilities are categorized within the disclosure hierarchy as follows: |
| Level 1 | Level 2 | Level 3 | Total | |||||||||||||||
Assets: | ||||||||||||||||||
Cash pledged for financial futures contracts | $ | 226,000 | — | — | $ | 226,000 | ||||||||||||
Liabilities: | ||||||||||||||||||
TOB trust certificates | — | $ | (28,460,581 | ) | — | (28,460,581 | ) | |||||||||||
VMTP Shares | — | (94,500,000 | ) | — | (94,500,000 | ) | ||||||||||||
Total | $ | 226,000 | $ | (122,960,581 | ) | — | $ | (122,734,581 | ) | |||||||||
There were no transfers between levels during the year ended July 31, 2014. |
| ANNUAL REPORT | JULY 31, 2014 | 45 |
| Statements of Assets and Liabilities |
| July 31, 2014 | BlackRock California Municipal Income Trust (BFZ) | BlackRock Florida Municipal 2020 Term Trust (BFO) | BlackRock Municipal Income Investment Trust (BBF) | BlackRock Municipal Target Term Trust (BTT) | BlackRock New Jersey Municipal Income Trust (BNJ) | BlackRock New York Municipal Income Trust (BNY) | |||||||||||||||||||||
Assets | |||||||||||||||||||||||||||
Investments at value — unaffiliated1 | $ | 778,659,226 | $ | 85,618,704 | $ | 162,093,754 | $ | 2,457,431,823 | $ | 193,526,445 | $ | 308,863,209 | |||||||||||||||
Investments at value — affiliated2 | 540,673 | 123,907 | 1,298,709 | 5,417,254 | 1,307,069 | 874,210 | |||||||||||||||||||||
| Cash pledged for financial futures contracts | 436,000 | — | 88,000 | 2,377,002 | 99,000 | 226,000 | |||||||||||||||||||||
| Investments sold receivable | 14,522,274 | 40,502 | 20,256 | — | — | — | |||||||||||||||||||||
| Interest receivable | 11,185,387 | 893,926 | 1,981,594 | 25,247,220 | 1,685,608 | 3,644,175 | |||||||||||||||||||||
| Deferred offering costs | 51,795 | — | 133,950 | 816,094 | 31,942 | 37,770 | |||||||||||||||||||||
| Variation margin receivable on financial futures contracts | 14,952 | — | 3,000 | 90,462 | 3,375 | 7,734 | |||||||||||||||||||||
| Prepaid expenses | 31,825 | 14,688 | 63,137 | 42,463 | 25,749 | 26,987 | |||||||||||||||||||||
| Total assets | 805,442,132 | 86,691,727 | 165,682,400 | 2,491,422,318 | 196,679,188 | 313,680,085 | |||||||||||||||||||||
Accrued Liabilities | |||||||||||||||||||||||||||
| Investments purchased payable | 20,024,967 | — | — | — | — | — | |||||||||||||||||||||
| Income dividends payable — Common Shares | 2,301,310 | 22,900 | 485,240 | 5,640,446 | 575,009 | 891,085 | |||||||||||||||||||||
| Investment advisory fees payable | 384,298 | 36,661 | 83,922 | 736,789 | 99,496 | 158,777 | |||||||||||||||||||||
| Officer’s and Trustees’ fees payable | 74,433 | 9,639 | 18,092 | 15,274 | 21,049 | 32,739 | |||||||||||||||||||||
| Interest expense and fees payable | 24,673 | 95 | 6,085 | 51,012 | 3,770 | 5,619 | |||||||||||||||||||||
| Offering costs payable | — | — | — | 286,782 | — | — | |||||||||||||||||||||
| Other accrued expenses payable | 103,765 | 58,981 | 44,020 | 196,426 | 69,781 | 83,373 | |||||||||||||||||||||
| Total accrued liabilities | 22,913,446 | 128,276 | 637,359 | 6,926,729 | 769,105 | 1,171,593 | |||||||||||||||||||||
Other Liabilities | |||||||||||||||||||||||||||
| TOB trust certificates | 106,697,554 | 190,000 | 29,682,276 | 184,119,974 | 17,301,282 | 28,460,581 | |||||||||||||||||||||
RVMTP Shares, at liquidation value of $5,000,000 per share3,4 | — | — | — | 750,000,000 | — | — | |||||||||||||||||||||
VMTP Shares, at liquidation value of $100,000 per share3,4 | 171,300,000 | — | — | — | 59,100,000 | 94,500,000 | |||||||||||||||||||||
VRDP Shares, at liquidation value of $100,000 per share3,4 | — | — | 34,200,000 | — | — | — | |||||||||||||||||||||
| Total other liabilities | 277,997,554 | 190,000 | 63,882,276 | 934,119,974 | 76,401,282 | 122,960,581 | |||||||||||||||||||||
| Total liabilities | 300,911,000 | 318,276 | 64,519,635 | 941,046,703 | 77,170,387 | 124,132,174 | |||||||||||||||||||||
AMPS at Redemption Value | |||||||||||||||||||||||||||
$25,000 per share liquidation preference, plus unpaid dividends3,4 | — | 625,008 | — | — | — | — | |||||||||||||||||||||
Net Assets Applicable to Common Shareholders | $ | 504,531,132 | $ | 85,748,443 | $ | 101,162,765 | $ | 1,550,375,615 | $ | 119,508,801 | $ | 189,547,911 | |||||||||||||||
Net Assets Applicable to Common Shareholders Consist of | |||||||||||||||||||||||||||
Paid-in capital5,6,7 | $ | 446,571,010 | $ | 80,396,516 | $ | 95,045,973 | $ | 1,671,298,896 | $ | 108,747,909 | $ | 183,140,788 | |||||||||||||||
| Undistributed (distributions in excess of) net investment income | 3,935,343 | 2,300,229 | 675,210 | (3,567,803 | ) | 1,641,707 | 3,009,264 | ||||||||||||||||||||
| Accumulated net realized loss | (18,430,332 | ) | (749,208 | ) | (11,095,716 | ) | (87,490,502 | ) | (2,568,237 | ) | (12,126,924 | ) | |||||||||||||||
| Net unrealized appreciation/depreciation | 72,455,111 | 3,800,906 | 16,537,298 | (29,864,976 | ) | 11,687,422 | 15,524,783 | ||||||||||||||||||||
Net Assets Applicable to Common Shareholders | $ | 504,531,132 | $ | 85,748,443 | $ | 101,162,765 | $ | 1,550,375,615 | $ | 119,508,801 | $ | 189,547,911 | |||||||||||||||
| Net asset value per Common Share | $ | 15.83 | $ | 15.42 | $ | 15.09 | $ | 21.99 | $ | 15.61 | $ | 14.68 | |||||||||||||||
1 Investments at cost — unaffiliated | $ | 706,280,926 | $ | 81,817,798 | $ | 145,583,866 | $ | 2,487,344,304 | $ | 181,869,860 | $ | 293,402,648 | |||||||||||||||
2 Investments at cost — affiliated | $ | 540,673 | $ | 123,907 | $ | 1,298,709 | $ | 5,417,254 | $ | 1,307,069 | $ | 874,210 | |||||||||||||||
3 Preferred Shares outstanding, par value $0.001 per share | 1,713 | 25 | 342 | 150 | 591 | 945 | |||||||||||||||||||||
4 Preferred Shares authorized | unlimited | unlimited | unlimited | unlimited | unlimited | unlimited | |||||||||||||||||||||
5 Par value per Common Share | $ | 0.001 | $ | 0.001 | $ | 0.001 | $ | 0.001 | $ | 0.001 | $ | 0.001 | |||||||||||||||
6 Common Shares outstanding | 31,874,095 | 5,562,128 | 6,704,527 | 70,505,571 | 7,656,577 | 12,914,274 | |||||||||||||||||||||
7 Common Shares authorized | unlimited | unlimited | unlimited | unlimited | unlimited | unlimited | |||||||||||||||||||||
| 46 | ANNUAL REPORT | JULY 31, 2014 |
| Statements of Operations |
| Year Ended July 31, 2014 | BlackRock California Municipal Income Trust (BFZ) | BlackRock Florida Municipal 2020 Term Trust (BFO) | BlackRock Municipal Income Investment Trust (BBF) | BlackRock Municipal Target Term Trust (BTT) | BlackRock New Jersey Municipal Income Trust (BNJ) | BlackRock New York Municipal Income Trust (BNY) | |||||||||||||||||||||
Investment Income | |||||||||||||||||||||||||||
| Interest | $ | 35,364,857 | $ | 3,224,750 | $ | 7,601,091 | $ | 95,785,816 | $ | 8,877,481 | $ | 13,764,967 | |||||||||||||||
| Income — affiliated | — | 857 | 626 | 2,893 | 13 | 1,032 | |||||||||||||||||||||
| Total income | 35,364,857 | 3,225,607 | 7,601,717 | 95,788,709 | 8,877,494 | 13,765,999 | |||||||||||||||||||||
Expenses | |||||||||||||||||||||||||||
| Investment advisory | 4,567,457 | 460,825 | 960,951 | 9,375,852 | 1,137,249 | 1,801,476 | |||||||||||||||||||||
| Professional | 100,894 | 52,343 | 44,181 | 179,197 | 48,673 | 65,296 | |||||||||||||||||||||
| Liquidity fees | — | — | 317,849 | — | — | — | |||||||||||||||||||||
| Officer and Trustees | 52,209 | 8,796 | 10,553 | 129,487 | 12,513 | 19,675 | |||||||||||||||||||||
| Transfer agent | 35,648 | 25,388 | 19,911 | 118,560 | 21,151 | 26,764 | |||||||||||||||||||||
| Custodian | 34,806 | 8,349 | 12,516 | 82,675 | 13,396 | 18,638 | |||||||||||||||||||||
| Accounting services | 31,049 | 13,443 | 23,831 | 214,454 | 28,636 | 3,938 | |||||||||||||||||||||
| Registration | 6,679 | 5,599 | 5,599 | 51,868 | 5,622 | 5,649 | |||||||||||||||||||||
| Printing | 5,719 | 6,371 | 3,916 | 30,570 | 8,153 | 9,110 | |||||||||||||||||||||
| Remarketing fees on Preferred Shares | — | 9,345 | 34,675 | — | — | — | |||||||||||||||||||||
| Miscellaneous | 85,681 | 37,377 | 63,437 | 153,377 | 60,176 | 77,664 | |||||||||||||||||||||
| Total expenses excluding interest expense, fees and amortization of offering costs | 4,920,142 | 627,836 | 1,497,419 | 10,336,040 | 1,335,569 | 2,028,210 | |||||||||||||||||||||
Interest expense, fees and amortization of offering costs1 | 2,729,431 | 1,080 | 275,387 | 6,829,937 | 806,180 | 1,228,024 | |||||||||||||||||||||
| Total expenses | 7,649,573 | 628,916 | 1,772,806 | 17,165,977 | 2,141,749 | 3,256,234 | |||||||||||||||||||||
| Less fees waived by Manager | (2,380 | ) | (1,183 | ) | (917 | ) | (183,965 | ) | (4,042 | ) | (2,840 | ) | |||||||||||||||
| Less fees paid indirectly | (32 | ) | (1 | ) | (6 | ) | (321 | ) | (3 | ) | (67 | ) | |||||||||||||||
| Total expenses after fees waived and paid indirectly | 7,647,161 | 627,732 | 1,771,883 | 16,981,691 | 2,137,704 | 3,253,327 | |||||||||||||||||||||
| Net investment income | 27,717,696 | 2,597,875 | 5,829,834 | 78,807,018 | 6,739,790 | 10,512,672 | |||||||||||||||||||||
Realized and Unrealized Gain (Loss) | |||||||||||||||||||||||||||
| Net realized gain (loss) from: | |||||||||||||||||||||||||||
| Investments | 3,029,451 | (12,643 | ) | (2,264,333 | ) | (23,637,261 | ) | (1,100,589 | ) | (5,374,968 | ) | ||||||||||||||||
| Financial futures contracts | (772,699 | ) | — | (138,637 | ) | (9,836,846 | ) | (162,458 | ) | (552,685 | ) | ||||||||||||||||
| Options written | — | — | — | (580,099 | ) | — | — | ||||||||||||||||||||
| 2,256,752 | (12,643 | ) | (2,402,970 | ) | (34,054,206 | ) | (1,263,047 | ) | (5,927,653 | ) | |||||||||||||||||
| Net change in unrealized appreciation/depreciation on: | |||||||||||||||||||||||||||
| Investments | 41,750,551 | 1,450,413 | 10,386,491 | 262,089,257 | 10,951,537 | 21,615,419 | |||||||||||||||||||||
| Financial futures contracts | 76,811 | — | 27,410 | 47,505 | 30,837 | 64,222 | |||||||||||||||||||||
| 41,827,362 | 1,450,413 | 10,413,901 | 262,136,762 | 10,982,374 | 21,679,641 | ||||||||||||||||||||||
| Net realized and unrealized gain | 44,084,114 | 1,437,770 | 8,010,931 | 228,082,556 | 9,719,327 | 15,751,988 | |||||||||||||||||||||
Dividends and Distributions to AMPS Shareholders From | |||||||||||||||||||||||||||
| Net investment income | — | (7,996 | ) | — | — | — | — | ||||||||||||||||||||
Net Increase in Net Assets Applicable to Common Shareholders Resulting from Operations | $ | 71,801,810 | $ | 4,027,649 | $ | 13,840,765 | $ | 306,889,574 | $ | 16,459,117 | $ | 26,264,660 | |||||||||||||||
| 1 | Related to TOBs, VMTP Shares, RVMTP Shares and/or VRDP Shares. |
| ANNUAL REPORT | JULY 31, 2014 | 47 |
| Statements of Changes in Net Assets |
| BlackRock California Municipal Income Trust (BFZ) | | | BlackRock Florida Municipal 2020 Term Trust (BFO) | ||||||||||||||||||||
| Year Ended July 31, | | Year Ended July 31, | |||||||||||||||||||||
| Increase (Decrease) in Net Assets Applicable to Common Shareholders: | 2014 | 2013 | 2014 | 2013 | |||||||||||||||||||
Operations | |||||||||||||||||||||||
| Net investment income | $ | 27,717,696 | $ | 28,429,898 | $ | 2,597,875 | $ | 3,765,338 | |||||||||||||||
| Net realized gain (loss) | 2,256,752 | 2,411,035 | (12,643 | ) | 74,831 | ||||||||||||||||||
| Net change in unrealized appreciation/depreciation | 41,827,362 | (59,039,937 | ) | 1,450,413 | (3,636,735 | ) | |||||||||||||||||
| Dividends and Distributions to AMPS Shareholders from net investment income | — | — | (7,996 | ) | (77,727 | ) | |||||||||||||||||
| Net increase (decrease) in net assets applicable to Common Shareholders resulting from operations | 71,801,810 | (28,199,004 | ) | �� | 4,027,649 | 125,707 | |||||||||||||||||
Dividends to Common Shareholders From1 | |||||||||||||||||||||||
| Net investment income | (29,544,099 | ) | (29,708,677 | ) | (3,417,928 | ) | (4,238,341 | ) | |||||||||||||||
Capital Share Transactions | |||||||||||||||||||||||
| Reinvestment of common dividends | — | 603,432 | — | — | |||||||||||||||||||
Net Assets Applicable to Common Shareholders | |||||||||||||||||||||||
| Total increase (decrease) in net assets applicable to Common Shareholders | 42,257,711 | (57,304,249 | ) | 609,721 | (4,112,634 | ) | |||||||||||||||||
| Beginning of year | 462,273,421 | 519,577,670 | 85,138,722 | 89,251,356 | |||||||||||||||||||
| End of year | $ | 504,531,132 | $ | 462,273,421 | $ | 85,748,443 | $ | 85,138,722 | |||||||||||||||
| Undistributed net investment income, end of year | $ | 3,935,343 | $ | 5,714,846 | $ | 2,300,229 | $ | 3,364,492 | |||||||||||||||
| 1 | Dividends for annual periods determined in accordance with federal income tax regulations. |
| BlackRock Municipal Income Investment Trust (BBF) | | | BlackRock Municipal Target Term Trust (BTT) | ||||||||||||||||||||
| Year Ended July 31, | | Year Ended July 31, 2014 | Period August 30, 20121 to July 31, 2013 | ||||||||||||||||||||
| Increase (Decrease) in Net Assets Applicable to Common Shareholders: | 2014 | 2013 | |||||||||||||||||||||
Operations | |||||||||||||||||||||||
Net investment income | $ | 5,829,834 | $ | 5,731,148 | $ | 78,807,018 | $ | 55,675,510 | |||||||||||||||
Net realized gain (loss) | (2,402,970 | ) | 788,098 | (34,054,206 | ) | (53,519,716 | ) | ||||||||||||||||
Net change in unrealized appreciation/depreciation | 10,413,901 | (14,231,581 | ) | 262,136,762 | (292,001,738 | ) | |||||||||||||||||
Net increase (decrease) in net assets applicable to Common Shareholders resulting from operations | 13,840,765 | (7,712,335 | ) | 306,889,574 | (289,845,944 | ) | |||||||||||||||||
Dividends and Distributions to Common Shareholders From2 | |||||||||||||||||||||||
Net investment income | (5,822,882 | ) | (5,822,394 | ) | (76,622,483 | ) | (61,454,151 | ) | |||||||||||||||
Return of capital | — | — | (1,726,833 | ) | (7,606,056 | ) | |||||||||||||||||
Decrease in net assets resulting from dividends and distributions to Common Shareholders | (5,822,882 | ) | (5,822,394 | ) | (78,349,316 | ) | (69,060,207 | ) | |||||||||||||||
Capital Share Transactions | |||||||||||||||||||||||
Net proceeds from the issuance of shares | — | — | — | 1,477,804,008 | |||||||||||||||||||
Net proceeds from the underwriter’s over allotment option exercised | — | — | — | 202,937,500 | |||||||||||||||||||
Reinvestment of common dividends | — | 52,510 | — | — | |||||||||||||||||||
Net increase in net assets derived from capital share transactions | — | 52,510 | — | 1,680,741,508 | |||||||||||||||||||
Net Assets Applicable to Common Shareholders | |||||||||||||||||||||||
Total increase (decrease) in net assets applicable to Common Shareholders | 8,017,883 | (13,482,219 | ) | 228,540,258 | 1,321,835,357 | ||||||||||||||||||
Beginning of period | 93,144,882 | 106,627,101 | 1,321,835,357 | — | |||||||||||||||||||
End of period | $ | 101,162,765 | $ | 93,144,882 | $ | 1,550,375,615 | $ | 1,321,835,357 | |||||||||||||||
Undistributed (distributions in excess of) net investment income | $ | 675,210 | $ | 643,833 | $ | (3,567,803 | ) | $ | (5,713,373 | ) | |||||||||||||
| 1 | Commencement of operations. |
| 2 | Dividends and distributions for annual periods determined in accordance with federal income tax regulations. |
| 48 | ANNUAL REPORT | JULY 31, 2014 |
| Statements of Changes in Net Assets |
| BlackRock New Jersey Municipal Income Trust (BNJ) | | BlackRock New York Municipal Term Trust (BNY) | |||||||||||||||||||||
| Year Ended July 31, | | Year Ended July 31, | |||||||||||||||||||||
| Increase (Decrease) in Net Assets Applicable to Common Shareholders: | 2014 | 2013 | 2014 | 2013 | |||||||||||||||||||
Operations | |||||||||||||||||||||||
Net investment income | $ | 6,739,790 | $ | 6,744,653 | $ | 10,512,672 | $ | 11,286,518 | |||||||||||||||
Net realized gain (loss) | (1,263,047 | ) | 1,157,320 | (5,927,653 | ) | 521,461 | |||||||||||||||||
Net change in unrealized appreciation/depreciation | 10,982,374 | (14,524,962 | ) | 21,679,641 | (27,196,710 | ) | |||||||||||||||||
Net increase (decrease) in net assets applicable to Common Shareholders resulting from operations | 16,459,117 | (6,622,989 | ) | 26,264,660 | (15,388,731 | ) | |||||||||||||||||
Dividends to Common Shareholders From1 | |||||||||||||||||||||||
Net investment income | (6,900,107 | ) | (7,215,408 | ) | (10,693,021 | ) | (11,222,319 | ) | |||||||||||||||
Capital Share Transactions | |||||||||||||||||||||||
Reinvestment of common dividends | — | 291,605 | — | 567,300 | |||||||||||||||||||
Net Assets Applicable to Common Shareholders | |||||||||||||||||||||||
Total increase (decrease) in net assets applicable to Common Shareholders | 9,559,010 | (13,546,792 | ) | 15,571,639 | (26,043,750 | ) | |||||||||||||||||
Beginning of year | 109,949,791 | 123,496,583 | 173,976,272 | 200,020,022 | |||||||||||||||||||
End of year | $ | 119,508,801 | $ | 109,949,791 | $ | 189,547,911 | $ | 173,976,272 | |||||||||||||||
Undistributed net investment income, end of year | $ | 1,641,707 | $ | 1,753,402 | $ | 3,009,264 | $ | 3,133,594 | |||||||||||||||
| 1 | Dividends for annual periods determined in accordance with federal income tax regulations. |
| ANNUAL REPORT | JULY 31, 2014 | 49 |
| Statements of Cash Flows |
| Year Ended July 31, 2014 | BlackRock California Municipal Income Trust (BFZ) | BlackRock Municipal Income Investment Trust (BBF) | BlackRock Municipal Target Term Trust (BTT) | BlackRock New Jersey Municipal Income Trust (BNJ) | BlackRock New York Municipal Income Trust (BNY) | ||||||||||||||||||
Cash Provided by Operating Activities | |||||||||||||||||||||||
Net increase in net assets resulting from operations, excluding dividends to AMPS Shareholders | $ | 71,801,810 | $ | 13,840,765 | $ | 306,889,574 | $ | 16,459,117 | $ | 26,264,660 | |||||||||||||
Adjustments to reconcile net increase in net assets resulting from operations to net cash provided by operating activities: | |||||||||||||||||||||||
(Increase) decrease interest receivable | 557,104 | (3,792 | ) | 609,369 | 278,559 | 59,425 | |||||||||||||||||
Increase in variation margin receivable on financial futures contracts | (14,952 | ) | (3,000 | ) | (90,462 | ) | (3,375 | ) | (7,734 | ) | |||||||||||||
Increase in prepaid expenses | (20,425 | ) | (20,742 | ) | (31,403 | ) | (21,648 | ) | (20,097 | ) | |||||||||||||
Increase in cash pledged for financial futures contracts | (436,000 | ) | (88,000 | ) | (2,377,002 | ) | (99,000 | ) | (226,000 | ) | |||||||||||||
Increase (decrease) in investment advisory fees payable | (12,805 | ) | 91 | (80,463 | ) | 3,950 | 1,893 | ||||||||||||||||
Decrease in interest expense and fees payable | (54,615 | ) | (8,090 | ) | (45,726 | ) | (2,268 | ) | (5,785 | ) | |||||||||||||
Increase (decrease) in other accrued expenses payable | (9,988 | ) | (13,076 | ) | (34,411 | ) | 8,443 | (23,785 | ) | ||||||||||||||
Increase (decrease) in Officer’s and Trustees’ fees payable | 6,224 | 1,371 | (5,771 | ) | 1,670 | 2,544 | |||||||||||||||||
Net realized gain (loss) on investments | (3,029,451 | ) | 2,264,333 | 24,217,360 | 1,100,589 | 5,374,968 | |||||||||||||||||
Net unrealized gain on investments | (41,750,551 | ) | (10,386,491 | ) | (262,089,257 | ) | (10,951,537 | ) | (21,615,419 | ) | |||||||||||||
Amortization of premium and accretion of discount on investments | 2,646,614 | 396,241 | 2,129,897 | 244,349 | 689,210 | ||||||||||||||||||
Premiums received from options written | — | — | 1,809,269 | — | — | ||||||||||||||||||
Proceeds from sales of long-term investments | 228,605,740 | 39,122,224 | 218,978,118 | 37,396,166 | 76,921,794 | ||||||||||||||||||
Purchases of long-term investments | (175,733,467 | ) | (37,299,503 | ) | (167,291,004 | ) | (40,480,529 | ) | (76,234,140 | ) | |||||||||||||
Net proceeds from sales (purchases) of short-term securities | (951,177 | ) | 3,411,994 | 49,728,059 | 3,511,827 | 6,603,494 | |||||||||||||||||
Premiums paid on closing options written | — | — | (1,229,170 | ) | — | — | |||||||||||||||||
Net cash provided by operating activities | 81,604,061 | 11,214,325 | 171,086,977 | 7,446,313 | 17,785,028 | ||||||||||||||||||
Cash Used for Financing Activities | |||||||||||||||||||||||
Proceeds from TOB trust certificates | — | — | — | — | 10,616,997 | ||||||||||||||||||
Repayments of TOB trust certificates | (51,957,794 | ) | (5,413,880 | ) | (91,559,997 | ) | (591,052 | ) | (18,711,593 | ) | |||||||||||||
Cash dividends paid to Common Shareholders | (29,719,406 | ) | (5,822,882 | ) | (79,318,767 | ) | (6,900,107 | ) | (10,693,021 | ) | |||||||||||||
Cash payments for offering costs | — | — | (208,650 | ) | — | — | |||||||||||||||||
Decrease in bank overdraft | (4,413 | ) | (3,855 | ) | (35,623 | ) | (3,933 | ) | — | ||||||||||||||
Increase in amortization of deferred offering costs | 77,552 | 26,292 | 36,060 | 48,779 | 57,170 | ||||||||||||||||||
Net cash used for financing activities | (81,604,061 | ) | (11,214,325 | ) | (171,086,977 | ) | (7,446,313 | ) | (18,730,447 | ) | |||||||||||||
Cash | |||||||||||||||||||||||
Net decrease in cash | — | — | — | — | (945,419 | ) | |||||||||||||||||
Cash at beginning of year | — | — | — | — | 945,419 | ||||||||||||||||||
Cash at end of year | — | — | — | — | — | ||||||||||||||||||
Supplemental Disclosure of Cash Flow Information | |||||||||||||||||||||||
Cash paid during the year for interest | $ | 2,706,494 | $ | 257,185 | $ | 6,839,603 | $ | 759,669 | $ | 1,176,639 | |||||||||||||
| 50 | ANNUAL REPORT | JULY 31, 2014 |
| Financial Highlights | BlackRock California Municipal Income Trust (BFZ) |
| Year Ended July 31, | | ||||||||||||||||||||||
| 2014 | 2013 | 2012 | 2011 | 2010 | |||||||||||||||||||
Per Share Operating Performance | |||||||||||||||||||||||
Net asset value, beginning of year | $ | 14.50 | $ | 16.32 | $ | 13.88 | $ | 14.28 | $ | 12.71 | |||||||||||||
Net investment income1 | 0.87 | 0.89 | 0.95 | 0.98 | 1.00 | ||||||||||||||||||
Net realized and unrealized gain (loss) | 1.39 | (1.78 | ) | 2.42 | (0.45 | ) | 1.50 | ||||||||||||||||
Dividends to AMPS shareholders from net investment income | — | — | (0.01 | ) | (0.02 | ) | (0.02 | ) | |||||||||||||||
Net increase (decrease) from investment operations | 2.26 | (0.89 | ) | 3.36 | 0.51 | 2.48 | |||||||||||||||||
Dividends to Common Shareholders from net investment income2 | (0.93 | ) | (0.93 | ) | (0.92 | ) | (0.91 | ) | (0.91 | ) | |||||||||||||
Net asset value, end of year | $ | 15.83 | $ | 14.50 | $ | 16.32 | $ | 13.88 | $ | 14.28 | |||||||||||||
Market price, end of year | $ | 14.41 | $ | 13.63 | $ | 16.64 | $ | 13.16 | $ | 14.21 | |||||||||||||
Total Return Applicable to Common Shareholders3 | |||||||||||||||||||||||
Based on net asset value | 16.48% | (5.81)% | 24.98% | 4.05% | 20.15% | ||||||||||||||||||
Based on market price | 12.80% | (13.17)% | 34.40% | (0.86)% | 22.55% | ||||||||||||||||||
Ratios to Average Net Assets Applicable to Common Shareholders | |||||||||||||||||||||||
Total expenses | 1.59% | 1.63% | 1.49% | 4 | 1.46% | 4 | 1.36% | 4 | |||||||||||||||
Total expenses after fees waived and paid indirectly | 1.59% | 1.63% | 1.46% | 4 | 1.39% | 4 | 1.27% | 4 | |||||||||||||||
Total expenses after fees waived and paid indirectly and excluding interest expense, and fees and amortization of offering costs5 | 1.03% | 1.01% | 1.07% | 4,6 | 1.12% | 4 | 1.04% | 4 | |||||||||||||||
Net investment income | 5.78% | 5.49% | 6.28% | 4 | 7.19% | 4 | 6.94% | 4 | |||||||||||||||
Dividends to AMPS Shareholders | — | — | 0.05% | 0.15% | 0.15% | ||||||||||||||||||
Net investment income to Common Shareholders | 5.78% | 5.49% | 6.23% | 7.04% | 6.79% | ||||||||||||||||||
Supplemental Data | |||||||||||||||||||||||
Net assets applicable to Common Shareholders, end of year (000) | $ | 504,531 | $ | 462,273 | $ | 519,578 | $ | 441,745 | $ | 454,299 | |||||||||||||
AMPS outstanding at $25,000 liquidation preference, end of year (000) | — | — | — | $ | 171,325 | $ | 171,325 | ||||||||||||||||
VMTP Shares outstanding at $100,000 liquidation value, end of year (000) | $ | 171,300 | $ | 171,300 | $ | 171,300 | — | — | |||||||||||||||
Portfolio turnover rate | 25% | 22% | 30% | 36% | 47% | ||||||||||||||||||
Asset coverage per AMPS at $25,000 liquidation preference, end of year (000) | — | — | — | $ | 89,460 | $ | 91,293 | ||||||||||||||||
Asset coverage per VMTP Shares at $100,000 liquidation value, end of year | $ | 394,531 | $ | 369,862 | $ | 403,314 | — | — | |||||||||||||||
| 1 | Based on average Common Shares outstanding. |
| 2 | Dividends for annual periods determined in accordance with federal income tax regulations. |
| 3 | Total returns based on market price, which can be significantly greater or less than the net asset value, may result in substantially different returns. Where applicable, excludes the effects of any sales charges and assumes the reinvestment of dividends and distributions. |
| 4 | Does not reflect the effect of dividends to AMPS Shareholders. |
| 5 | Interest expense, fees and amortization of offering costs relate to TOBS and/or VMTP Shares. See Note 3 and Note 9 of the Notes to Financial Statements for details of municipal bonds transferred to TOBs and VMTP Shares, respectively. |
| 6 | For the year ended July 31, 2012, the total expense ratio after fees waived and paid indirectly and excluding interest expense, fees, amortization of offering costs and remarketing fees was 1.04%. |
| ANNUAL REPORT | JULY 31, 2014 | 51 |
| Financial Highlights | BlackRock Florida Municipal 2020 Term Trust (BFO) |
| Year Ended July 31, | | ||||||||||||||||||||||
| 2014 | 2013 | 2012 | 2011 | 2010 | |||||||||||||||||||
Per Share Operating Performance | |||||||||||||||||||||||
Net asset value, beginning of year | $ | 15.31 | $ | 16.05 | $ | 14.94 | $ | 14.91 | $ | 13.35 | |||||||||||||
Net investment income1 | 0.47 | 0.68 | 0.85 | 0.92 | 0.95 | ||||||||||||||||||
Net realized and unrealized gain (loss) | 0.25 | (0.65 | ) | 0.98 | (0.19 | ) | 1.31 | ||||||||||||||||
Dividends to AMPS shareholders from net investment income | (0.00 | )2 | (0.01 | ) | (0.02 | ) | (0.03 | ) | (0.03 | ) | |||||||||||||
Net increase (decrease) from investment operations | 0.72 | 0.02 | 1.81 | 0.70 | 2.23 | ||||||||||||||||||
Dividends to Common Shareholders from net investment income3 | (0.61 | ) | (0.76 | ) | (0.70 | ) | (0.67 | ) | (0.67 | ) | |||||||||||||
Net asset value, end of year | $ | 15.42 | $ | 15.31 | $ | 16.05 | $ | 14.94 | $ | 14.91 | |||||||||||||
Market price, end of year | $ | 15.16 | $ | 15.12 | $ | 15.60 | $ | 13.91 | $ | 14.30 | |||||||||||||
Total Return Applicable to Common Shareholders4 | |||||||||||||||||||||||
Based on net asset value | 4.84% | 0.12% | 12.44% | 5.07% | 17.35% | ||||||||||||||||||
Based on market price | 4.36% | 1.73% | 17.38% | 2.00% | 22.05% | ||||||||||||||||||
Ratios to Average Net Assets Applicable to Common Shareholders | |||||||||||||||||||||||
Total expenses5 | 0.74% | 0.92% | 1.06% | 1.13% | 1.14% | ||||||||||||||||||
Total expenses after fees waived and paid indirectly5 | 0.74% | 0.92% | 1.06% | 1.13% | 1.13% | ||||||||||||||||||
Total expenses after fees waived and paid indirectly and excluding interest expense and fees5,6 | 0.74% | 7 | 0.92% | 7 | 1.06% | 7 | 1.09% | 1.09% | |||||||||||||||
Net investment income5 | 3.05% | 4.23% | 5.48% | 6.29% | 6.72% | ||||||||||||||||||
Dividends to AMPS Shareholders | 0.01% | 0.09% | 0.12% | 0.19% | 0.22% | ||||||||||||||||||
Net investment income to Common Shareholders | 3.04% | 4.14% | 5.36% | 6.10% | 6.50% | ||||||||||||||||||
Supplemental Data | |||||||||||||||||||||||
Net assets applicable to Common Shareholders, end of year (000) | $ | 85,748 | $ | 85,139 | $ | 89,251 | $ | 83,111 | $ | 82,929 | |||||||||||||
AMPS Shares outstanding at $25,000 liquidation preference, end of year (000) | $ | 625 | $ | 19,100 | $ | 42,900 | $ | 42,900 | $ | 42,900 | |||||||||||||
Portfolio turnover rate | 1% | 9% | 32% | 6% | 6% | ||||||||||||||||||
Asset coverage per AMPS Share at $25,000 liquidation preference, end of year (000) | $ | 3,454,938 | $ | 136,438 | $ | 77,011 | $ | 73,433 | $ | 73,329 | |||||||||||||
| 1 | Based on average Common Shares outstanding. |
| 2 | Amount is greater than $(0.005) per share. |
| 3 | Dividends for annual periods determined in accordance with federal income tax regulations. |
| 4 | Total returns based on market price, which can be significantly greater or less than the net asset value, may result in substantially different returns. Where applicable, excludes the effects of any sales charges and assumes the reinvestment of dividends and distributions. |
| 5 | Does not reflect the effect of dividends to AMPS Shareholders. |
| 6 | Interest expense and fees relate to TOBs. See Note 3 of the Notes to Financial Statements for details of municipal bonds transferred to TOBs. |
| 7 | For the years ended July 31, 2014, July 31, 2013 and July 31, 2012, the total expense ratio after fees waived and paid indirectly and excluding interest expense, fees and remarketing fees was 0.73%, 0.87% and 0.97%, respectively. |
| 52 | ANNUAL REPORT | JULY 31, 2014 |
| Financial Highlights | BlackRock Municipal Income Investment Trust (BBF) |
| Year Ended July 31, | | ||||||||||||||||||||||
| 2014 | 2013 | 2012 | 2011 | 2010 | |||||||||||||||||||
Per Share Operating Performance | |||||||||||||||||||||||
Net asset value, beginning of year | $ | 13.89 | $ | 15.91 | $ | 13.40 | $ | 13.91 | $ | 12.71 | |||||||||||||
Net investment income1 | 0.87 | 0.85 | 0.86 | 0.97 | 0.92 | ||||||||||||||||||
Net realized and unrealized gain (loss) | 1.20 | (2.00 | ) | 2.55 | (0.56 | ) | 1.20 | ||||||||||||||||
Dividends to AMPS Shareholders from net investment income | — | — | (0.00 | )2 | (0.02 | ) | (0.02 | ) | |||||||||||||||
Net increase (decrease) from investment operations | 2.07 | (1.15 | ) | 3.41 | 0.39 | 2.10 | |||||||||||||||||
Dividends to Common Shareholders from net investment income3 | (0.87 | ) | (0.87 | ) | (0.90 | ) | (0.90 | ) | (0.90 | ) | |||||||||||||
Net asset value, end of year | $ | 15.09 | $ | 13.89 | $ | 15.91 | $ | 13.40 | $ | 13.91 | |||||||||||||
Market price, end of year | $ | 13.48 | $ | 12.47 | $ | 16.25 | $ | 12.74 | $ | 13.90 | |||||||||||||
Total Return Applicable to Common Shareholders4 | |||||||||||||||||||||||
Based on net asset value | 16.06% | (7.56)% | 26.21% | 3.15% | 17.04% | ||||||||||||||||||
Based on market price | 15.49% | (18.75)% | 35.59% | (1.86)% | 19.01% | ||||||||||||||||||
Ratios to Average Net Assets Applicable to Common Shareholders | |||||||||||||||||||||||
Total expenses | 1.85% | 1.83% | 1.99% | 5 | 1.60% | 5 | 1.46% | 5 | |||||||||||||||
Total expenses after fees waived and paid indirectly | 1.85% | 1.83% | 1.99% | 5 | 1.60% | 5 | 1.37% | 5 | |||||||||||||||
Total expenses after fees waived and paid indirectly and excluding interest expense, and fees and amortization of offering costs6 | 1.56% | 7 | 1.49% | 7 | 1.61% | 5,7 | 1.33% | 5 | 1.17% | 5 | |||||||||||||
Net investment income | 6.09% | 5.41% | 5.89% | 5 | 7.35% | 5 | 6.84% | 5 | |||||||||||||||
Dividends to AMPS Shareholders | — | — | 0.02% | 0.14% | 0.16% | ||||||||||||||||||
Net investment income to Common Shareholders | 6.09% | 5.41% | 5.87% | 7.21% | 6.68% | ||||||||||||||||||
Supplemental Data | |||||||||||||||||||||||
Net assets applicable to Common Shareholders, end of year (000) | $ | 101,163 | $ | 93,145 | $ | 106,627 | $ | 89,726 | $ | 93,073 | |||||||||||||
AMPS outstanding at $25,000 liquidation preference, end of year (000) | — | — | — | $ | 34,250 | $ | 34,250 | ||||||||||||||||
VRDP Shares outstanding at $100,000 liquidation value, end of year (000) | $ | 34,200 | $ | 34,200 | $ | 34,200 | — | — | |||||||||||||||
Portfolio turnover rate | 22% | 33% | 39% | 24% | 46% | ||||||||||||||||||
Asset coverage per AMPS at $25,000 liquidation preference, end of year | — | — | — | $ | 90,493 | $ | 92,938 | ||||||||||||||||
Asset coverage per VRDP Shares at $100,000 liquidation value, end of year | $ | 395,798 | $ | 372,353 | $ | 411,775 | — | — | |||||||||||||||
| 1 | Based on average Common Shares outstanding. |
| 2 | Amount is greater than $(0.005) per share. |
| 3 | Dividends for annual periods determined in accordance with federal income tax regulations. |
| 4 | Total returns based on market price, which can be significantly greater or less than the net asset value, may result in substantially different returns. Where applicable, excludes the effects of any sales charges and assumes the reinvestment of dividends and distributions. |
| 5 | Does not reflect the effect of dividends to VRDP Shareholders. |
| 6 | Interest expense, fees and amortization of offering costs relate to TOBs and/or VRDP Shares. See Note 3 and Note 9 of the Notes to Financial Statements for details of municipal bonds transferred to TOBs and VRDP Shares, respectively. |
| 7 | For the years ended July 31, 2014, July 31, 2013 and July 31, 2012, the total expense ratio after fees waived and paid indirectly and excluding interest expense, fees, amortization of offering costs, liquidity and remarketing fees was 1.19%, 1.17% and 1.31%, respectively. |
| ANNUAL REPORT | JULY 31, 2014 | 53 |
| Financial Highlights | BlackRock Municipal Target Term Trust (BTT) |
| Year Ended July 31, 2014 | Period August 30, 20121 to July 31, 2013 | ||||||||||
Per Share Operating Performance | |||||||||||
Net asset value, beginning of period | $ | 18.75 | $ | 23.88 | 2 | ||||||
Net investment income3 | 1.12 | 0.80 | |||||||||
Net realized and unrealized gain (loss) | 3.23 | (4.95 | ) | ||||||||
Net increase (decrease) from investment operations | 4.35 | (4.15 | ) | ||||||||
Dividends and distributions from4: | |||||||||||
Net investment income | (1.09 | ) | (0.87 | ) | |||||||
Return of capital | (0.02 | ) | (0.11 | ) | |||||||
Total dividends and distributions | (1.11 | ) | (0.98 | ) | |||||||
Net asset value, end of period | $ | 21.99 | $ | 18.75 | |||||||
Market price, end of period | $ | 19.57 | $ | 18.42 | |||||||
Total Return Applicable to Common Shareholders5 | |||||||||||
Based on net asset value | 24.50% | (18.00)% | 6 | ||||||||
Based on market price | 12.78% | (23.05)% | 6 | ||||||||
Ratios to Average Net Assets Applicable to Common Shareholders | |||||||||||
Total expenses | 1.22% | 0.99% | 7 | ||||||||
Total expenses after fees waived and paid indirectly | 1.21% | 0.99% | 7 | ||||||||
Total expenses after fees waived and paid indirectly and excluding interest expense, fees and amortization of offering costs8 | 0.72% | 0.64% | 7 | ||||||||
Net investment income to Common Shareholders | 5.61% | 3.78% | 7 | ||||||||
Supplemental Data | |||||||||||
Net assets applicable to Common Shareholders, end of period (000) | $ | 1,550,376 | $ | 1,321,835 | |||||||
RVMTP Shares outstanding at $5,000,000 liquidation value, end of period (000) | $ | 750,000 | $ | 750,000 | |||||||
Portfolio turnover rate | 6% | 39% | |||||||||
Asset coverage per RVMTP Shares at $5,000,000 liquidation value, end of period | $ | 15,335,837 | $ | 13,812,236 | |||||||
| 1 | Commencement of operations. |
| 2 | Net asset value, beginning of period, reflects a deduction of $1.125 per share sales charge from the initial offering price of $25.00 per share. |
| 3 | Based on average Common Share outstanding. |
| 4 | Dividends and distributions for annual periods determined in accordance with federal income tax regulations. |
| 5 | Total returns based on market price, which can be significantly greater or less than the net asset value, may result in substantially different returns. Where applicable, excludes the effects of any sales charges and assumes the reinvestment of dividends and distributions. |
| 6 | Aggregate total return. |
| 7 | Annualized. |
| 8 | Interest expense, fees and amortization of offering cost relate to TOBs and/or RVMTP Shares. See Note 3 and Note 9 of the Notes to Financial Statements for details of municipal bonds transferred to TOBs and RVMTP Shares, respectively. |
| 54 | ANNUAL REPORT | JULY 31, 2014 |
| Financial Highlights | BlackRock New Jersey Municipal Income Trust (BNJ) |
| Year Ended July 31, | | ||||||||||||||||||||||
| 2014 | 2013 | 2012 | 2011 | 2010 | |||||||||||||||||||
Per Share Operating Performance | |||||||||||||||||||||||
Net asset value, beginning of year | $ | 14.36 | $ | 16.17 | $ | 14.07 | 14.38 | $ | 12.78 | ||||||||||||||
Net investment income1 | 0.88 | 0.88 | 0.95 | 0.98 | 1.02 | ||||||||||||||||||
Net realized and unrealized gain (loss) | 1.27 | (1.75 | ) | 2.11 | (0.32 | ) | 1.54 | ||||||||||||||||
Dividends to AMPS shareholders from net investment income | — | — | (0.01 | ) | (0.03 | ) | (0.03 | ) | |||||||||||||||
Net increase (decrease) from investment operations | 2.15 | (0.87 | ) | 3.05 | 0.63 | 2.53 | |||||||||||||||||
Dividends to Common Shareholders from net investment income2 | (0.90 | ) | (0.94 | ) | (0.95 | ) | (0.94 | ) | (0.93 | ) | |||||||||||||
Net asset value, end of year | $ | 15.61 | $ | 14.36 | $ | 16.17 | $ | 14.07 | $ | 14.38 | |||||||||||||
Market price, end of year | $ | 14.68 | $ | 13.67 | $ | 17.67 | $ | 14.10 | $ | 14.82 | |||||||||||||
Total Return Applicable to Common Shareholders3 | |||||||||||||||||||||||
Based on net asset value | 16.01% | (5.82)% | 22.25% | 4.74% | 20.22% | ||||||||||||||||||
Based on market price | 14.60% | (17.95)% | 33.30% | 1.85% | 13.11% | ||||||||||||||||||
Ratios to Average Net Assets Applicable to Common Shareholders | |||||||||||||||||||||||
Total expenses | 1.89% | 1.81% | 1.47% | 4 | 1.25% | 4 | 1.23% | 4 | |||||||||||||||
Total expenses after fees waived and paid indirectly | 1.89% | 1.81% | 1.46% | 4 | 1.24% | 4 | 1.13% | 4 | |||||||||||||||
Total expenses after fees waived and paid indirectly and excluding interest expense, fees and amortization of offering costs5 | 1.18% | 1.13% | 1.18% | 4, 6 | 1.22% | 4 | 1.12% | 4 | |||||||||||||||
Net investment income | 5.96% | 5.51% | 6.28% | 4 | 7.09% | 4 | 7.42% | 4 | |||||||||||||||
Dividends to AMPS Shareholders | — | — | 0.08% | 0.21% | 0.23% | ||||||||||||||||||
Net investment income to Common Shareholders | 5.96% | 5.51% | 6.20% | 6.88% | 7.19% | ||||||||||||||||||
Supplemental Data | |||||||||||||||||||||||
Net assets applicable to Common Shareholders, end of year (000) | $ | 119,509 | $ | 109,950 | $ | 123,497 | $ | 107,226 | $ | 109,257 | |||||||||||||
AMPS outstanding at $25,000 liquidation preference, end of year (000) | — | — | — | $ | 59,100 | $ | 59,100 | ||||||||||||||||
VMTP Shares outstanding at $100,000 liquidation value, end of year (000) | $ | 59,100 | $ | 59,100 | $ | 59,100 | — | — | |||||||||||||||
Portfolio turnover rate | 20% | 9% | 20% | 20% | 11% | ||||||||||||||||||
Asset coverage per AMPS at $25,000 liquidation preference, end of year | — | — | — | $ | 70,358 | $ | 71,218 | ||||||||||||||||
Asset coverage per VMTP Shares at $100,000 liquidation value, end of year | $ | 302,215 | $ | 286,040 | $ | 308,962 | — | — | |||||||||||||||
| 1 | Based on average common shares outstanding. |
| 2 | Dividends for annual periods determined in accordance with federal income tax regulations. |
| 3 | Total returns based on market price, which can be significantly greater or less than the net asset value, may result in substantially different returns. Where applicable, excludes the effects of any sales charges and assumes the reinvestment of dividends and distributions. |
| 4 | Do not reflect the effect of dividends to AMPS Shareholders. |
| 5 | Interest expense, fees and amortization of offering costs relate to TOBs and/or VMTP Shares. See Note 3 and Note 9 of the Notes to Financial Statements for details of municipal bonds transferred to TOBs and VMTP Shares, respectively. |
| 6 | For the year ended July 31, 2012, the total expense ratio after fees waived and paid indirectly and excluding interest expense, fees, amortization of offering costs and remarketing fees was 1.14%. |
| ANNUAL REPORT | JULY 31, 2014 | 55 |
| Financial Highlights | BlackRock New York Municipal Income Trust (BNY) |
| Year Ended July 31 | | ||||||||||||||||||||||
| 2014 | 2013 | 2012 | 2011 | 2010 | |||||||||||||||||||
Per Share Operating Performance | |||||||||||||||||||||||
Net asset value, beginning of year | $ | 13.47 | $ | 15.53 | $ | 13.87 | $ | 14.27 | $ | 12.71 | |||||||||||||
Net investment income1 | 0.81 | 0.87 | 0.93 | 1.01 | 1.04 | ||||||||||||||||||
Net realized and unrealized gain (loss) | 1.23 | (2.06 | ) | 1.73 | (0.39 | ) | 1.54 | ||||||||||||||||
Dividends to AMPS shareholders from net investment income | — | — | (0.01 | ) | (0.03 | ) | (0.03 | ) | |||||||||||||||
Net increase (decrease) from investment operations | 2.04 | (1.19 | ) | 2.65 | 0.59 | 2.55 | |||||||||||||||||
Dividends to Common Shareholders from net investment income2 | (0.83 | ) | (0.87 | ) | (0.99 | ) | (0.99 | ) | (0.99 | ) | |||||||||||||
Net asset value, end of year | $ | 14.68 | $ | 13.47 | $ | 15.53 | $ | 13.87 | $ | 14.27 | |||||||||||||
Market price, end of year | $ | 13.79 | $ | 13.16 | $ | 16.73 | $ | 14.20 | $ | 15.11 | |||||||||||||
Total Return Applicable to Common Shareholders3 | |||||||||||||||||||||||
Based on net asset value | 15.98% | (8.18)% | 19.62% | 4.39% | 20.35% | ||||||||||||||||||
Based on market price | 11.51% | (16.73)% | 25.87% | 0.94% | 16.11% | ||||||||||||||||||
Ratios to Average Net Assets Applicable to Common Shareholders | |||||||||||||||||||||||
Total expenses | 1.82% | 1.85% | 1.49% | 4 | 1.27% | 4 | 1.25% | 4 | |||||||||||||||
Total expenses after fees waived and paid indirectly | 1.82% | 1.84% | 1.49% | 4 | 1.27% | 4 | 1.16% | 4 | |||||||||||||||
Total expenses after fees waived and paid indirectly and excluding interest expense, fees and amortization of offering costs5 | 1.13% | 1.14% | 1.18% | 4,6 | 1.22% | 4 | 1.11% | 4 | |||||||||||||||
Net investment income | 5.89% | 5.71% | 6.34% | 4 | 7.35% | 4 | 7.50% | 4 | |||||||||||||||
Dividends to AMPS Shareholders | — | — | 0.08% | 0.20% | 0.22% | ||||||||||||||||||
Net investment income to Common Shareholders | 5.89% | 5.71% | 6.26% | 7.15% | 7.28% | ||||||||||||||||||
Supplemental Data | |||||||||||||||||||||||
Net assets applicable to Common Shareholders, end of year (000) | $ | 189,548 | $ | 173,976 | $ | 200,020 | $ | 177,993 | $ | 182,372 | |||||||||||||
AMPS outstanding at $25,000 liquidation preference, end of year (000) | — | — | — | $ | 94,500 | $ | 94,500 | ||||||||||||||||
VMTP Shares outstanding at $100,000 liquidation value, end of year (000) | $ | 94,500 | $ | 94,500 | $ | 94,500 | — | — | |||||||||||||||
Portfolio turnover rate | 26% | 23% | 24% | 17% | 16% | ||||||||||||||||||
Asset coverage per AMPS at $25,000 liquidation preference, end of year (000) | — | — | — | $ | 72,089 | $ | 73,248 | ||||||||||||||||
Asset coverage per VMTP Shares at $100,000 liquidation value, end of year | $ | 300,580 | $ | 284,102 | $ | 311,661 | — | — | |||||||||||||||
| 1 | Based on average Common Shares outstanding. |
| 2 | Dividends for annual periods determined in accordance with federal income tax regulations. |
| 3 | Total returns based on market price, which can significantly greater or less than the net asset value, may result in substantially different returns. Where applicable, excludes the effects of any sales charges and assumes the reinvestment of dividends and distributions. |
| 4 | Do not reflect the effect of dividends to AMPS shareholders. |
| 5 | Interest expense, fees and amortization of offering costs relate to TOBs and/or VMTP Shares. See Note 3 and Note 9 of the Notes to Financial Statements for details of municipal bonds transferred to TOBs and VMTP Shares, respectively. |
| 6 | For the year ended July 31, 2012, the total expense ratio after fees waived and paid indirectly and excluding interest expense, fees, amortization of offering costs and remarketing fees was 1.13%. |
| 56 | ANNUAL REPORT | JULY 31, 2014 |
| Notes to Financial Statements |
| ANNUAL REPORT | JULY 31, 2014 | 57 |
| Notes to Financial Statements (continued) |
| 58 | ANNUAL REPORT | JULY 31, 2014 |
| Notes to Financial Statements (continued) |
| | Underlying Municipal Bonds Transferred to TOBs | | Liability for TOB Trust Certificates | | Range of Interest Rates | |||||||
BFZ | $ | 227,494,774 | $ | 106,697,554 | 0.06% – 0.09% | |||||||
BFO | $ | 294,758 | $ | 190,000 | 0.12% | |||||||
BBF | $ | 56,780,789 | $ | 29,682,276 | 0.06% – 0.31% | |||||||
BTT | $ | 377,825,374 | $ | 184,119,974 | 0.06% – 0.15% | |||||||
BNJ | $ | 30,430,857 | $ | 17,301,282 | 0.06% – 0.31% | |||||||
BNY | $ | 50,876,970 | $ | 28,460,581 | 0.06% – 0.26% | |||||||
| | Average TOB Trust Certificates Outstanding | | Daily Weighted Average Interest Rate | |||||||
BFZ | $ | 136,317,740 | 0.61 | % | ||||||
BFO | $ | 224,767 | 0.48 | % | ||||||
BBF | $ | 30,195,257 | 0.65 | % | ||||||
BTT | $ | 187,193,709 | 0.78 | % | ||||||
BNJ | $ | 17,312,373 | 0.75 | % | ||||||
BNY | $ | 27,023,256 | 0.62 | % | ||||||
| ANNUAL REPORT | JULY 31, 2014 | 59 |
| Notes to Financial Statements (continued) |
| Calls | ||||||||||
| | Contracts | | Premiums Received | |||||||
Outstanding options, beginning of year | — | — | ||||||||
Options written | 13,000 | $ | 1,809,269 | |||||||
Options exercised | — | — | ||||||||
Options expired | (12,000 | ) | (1,591,729 | ) | ||||||
Options closed | (1,000 | ) | (217,540 | ) | ||||||
Outstanding options, end of year | — | — | ||||||||
| 60 | ANNUAL REPORT | JULY 31, 2014 |
| Notes to Financial Statements (continued) |
| Fair Values of Derivative Financial Instruments as of July 31, 2014 | ||||||||||||||||||||||
| Value | ||||||||||||||||||||||
| Derivative Assets | ||||||||||||||||||||||
| | Statements of Assets and Liabilities Location | | BFZ | | BBF | | BTT | | BNJ | | BNY | |||||||||||
Interest rate contracts | Net unrealized appreciation/depreciation1 | $ | 76,811 | $ | 27,410 | $ | 47,505 | $ | 30,837 | $ | 64,222 | |||||||||||
| 1 | Includes cumulative appreciation/depreciation on financial futures contracts as reported in the Schedules of Investments. Only current day’s variation margin is reported within the Statements of Assets and Liabilities. |
| The Effect of Derivative Financial Instruments in the Statements of Operations Year Ended July 31, 2014 | |||||||||||||||||||||||||||
| Net Realized Gain (Loss) From | Net Change in Unrealized Appreciation/ Depreciation on | ||||||||||||||||||||||||||
| | BFZ | | BBF | | BTT | BFZ | | BBF | | BTT | |||||||||||||||||
Interest rate contracts: | |||||||||||||||||||||||||||
Financial futures contracts | $ | (772,699 | ) | $ | (138,637 | ) | $ | (9,836,846 | ) | $ | 76,811 | $ | 27,410 | $ | 47,505 | ||||||||||||
Options2 | — | — | (5,219,548 | ) | — | — | — | ||||||||||||||||||||
Total | $ | (772,699 | ) | $ | (138,637 | ) | $ | (15,056,394 | ) | $ | 76,811 | $ | 27,410 | $ | 47,505 | ||||||||||||
| BNJ | | BNY | | BNJ | | BNY | | ||||||||||||||||||||
Interest rate contracts: | |||||||||||||||||||||||||||
Financial futures contracts | $ | (162,458 | ) | $ | (552,685 | ) | $ | 30,837 | $ | 64,222 | |||||||||||||||||
| 2 | Options purchased are included in the net realized gain (loss) from investments and net change in unrealized appreciation/depreciation on investments. |
| BFZ | BBF | BTT | BNJ | BNY | ||||||||||||||||||
Financial futures contracts: | ||||||||||||||||||||||
Average number of contracts purchased | — | — | 7,055 | 3 | — | — | ||||||||||||||||
Average number of contracts sold | 342 | 74 | 1,001 | 87 | 166 | |||||||||||||||||
Average notional value of contracts purchased | — | — | $ | 890,488,259 | 3 | — | — | |||||||||||||||
Average notional value of contracts sold | $ | 42,918,262 | $ | 9,249,859 | $ | 125,630,172 | $ | 10,912,547 | $ | 20,700,172 | ||||||||||||
Options: | ||||||||||||||||||||||
Average number of option contracts purchased | — | — | 4,825 | — | — | |||||||||||||||||
Average number of option contracts written | — | — | (3,250 | ) | — | — | ||||||||||||||||
Average notional amount of option contracts purchased | — | — | $ | 4,825,000 | — | — | ||||||||||||||||
Average notional amount of option contracts written | — | — | $ | (3,250,000 | ) | — | — | |||||||||||||||
| 3 | Actual amounts for the period are shown due to limited outstanding derivative financial instruments as of each quarter. |
| ANNUAL REPORT | JULY 31, 2014 | 61 |
| Notes to Financial Statements (continued) |
| | BFZ | | BFO | | BBF | | BTT | | BNJ | | BNY | |||||||||||||||
Investment advisory fee | 0.58 | % | 0.50 | % | 0.60 | % | 0.40 | % | 0.60 | % | 0.60 | % | ||||||||||||||
| | BFZ | | BFO | | BBF | | BTT | | BNJ | | BNY | |||||||||||||||
Amounts waived | $ | 2,380 | $ | 1,183 | $ | 917 | $ | 183,965 | $ | 4,042 | $ | 2,840 | ||||||||||||||
| | BFZ | | BBF | |||||||
Purchases | $ | 1,567,211 | — | |||||||
Sales | — | $ | 1,404,681 | |||||||
| | BFZ | | BFO | | BBF | | BTT | | BNJ | | BNY | |||||||||||||||
Purchases | $ | 195,758,434 | $ | 696,855 | $ | 34,015,177 | $ | 149,698,955 | $ | 40,480,529 | $ | 75,279,614 | ||||||||||||||
Sales | $ | 243,128,015 | $ | 16,906,200 | $ | 37,691,926 | $ | 214,847,666 | $ | 37,090,825 | $ | 75,610,115 | ||||||||||||||
| 62 | ANNUAL REPORT | JULY 31, 2014 |
| Notes to Financial Statements (continued) |
| | BFZ | | BFO | | BBF | | BTT | | BNJ | | BNY | |||||||||||||||
Paid-in capital | $ | (653,593 | ) | $ | 238,053 | $ | (26,292 | ) | $ | (49,527 | ) | $ | (49,839 | ) | $ | (58,866 | ) | |||||||||
Undistributed (distributions in excess of) net investment income | $ | 46,900 | $ | (236,214 | ) | $ | 24,425 | $ | (38,965 | ) | $ | 48,622 | $ | 56,019 | ||||||||||||
Accumulated net realized loss | $ | 606,693 | $ | (1,839 | ) | $ | 1,867 | $ | 88,492 | $ | 1,217 | $ | 2,847 | |||||||||||||
| | | BFZ | | BFO | | BBF | | BTT | | BNJ | | BNY | ||||||||||||||||||
Tax-exempt income1 | 7/31/14 | $ | 31,357,063 | $ | 3,425,924 | $ | 5,875,954 | $ | 81,946,044 | $ | 7,526,454 | $ | 11,694,539 | |||||||||||||||||
| 7/31/13 | $ | 31,649,406 | $ | 4,314,224 | $ | 5,909,789 | $ | 64,323,779 | $ | 7,879,321 | $ | 12,286,661 | ||||||||||||||||||
Ordinary income2 | 7/31/14 | 2,488 | — | — | — | — | — | |||||||||||||||||||||||
| 7/31/13 | — | 1,844 | 305 | 4,482 | 5,655 | 6,287 | ||||||||||||||||||||||||
Tax return of capital | 7/31/14 | — | — | — | 1,726,833 | — | — | |||||||||||||||||||||||
| 7/31/13 | — | — | — | 7,606,056 | — | — | ||||||||||||||||||||||||
Total | 7/31/14 | $ | 31,359,551 | $ | 3,425,924 | $ | 5,875,954 | $ | 83,672,877 | $ | 7,526,454 | $ | 11,694,539 | |||||||||||||||||
| 7/31/13 | $ | 31,649,406 | $ | 4,316,068 | $ | 5,910,094 | $ | 71,934,317 | $ | 7,884,976 | $ | 12,292,948 | ||||||||||||||||||
| 1 | The Trusts designate these amounts paid during the fiscal year ended July 31, 2014, as exempt-interest dividends. |
| 2 | Ordinary income consists primarily of taxable income recognized from market discount. Additionally, all ordinary income distributions are comprised of interest related dividends for non-U.S. residents and are eligible for exemption from U.S. withholding tax for nonresident aliens and foreign corporations. |
| | BFZ | | BFO | | BBF | | BTT | | BNJ | | BNY | |||||||||||||||
Undistributed tax-exempt Income | $ | 3,352,283 | $ | 2,361,172 | $ | 368,670 | — | $ | 1,341,826 | $ | 2,950,539 | |||||||||||||||
Undistributed ordinary income | — | — | — | — | 103,908 | 2,041 | ||||||||||||||||||||
Capital loss carryforwards | (17,328,812 | ) | (751,184 | ) | (10,053,284 | ) | $ | (65,058,716 | ) | (1,846,784 | ) | (10,793,148 | ) | |||||||||||||
Net unrealized gains (losses)3 | 71,936,651 | 3,750,567 | 15,988,165 | (46,465,469 | ) | 11,422,962 | 14,636,812 | |||||||||||||||||||
Qualified late-year loss4 | — | (8,628 | ) | (186,759 | ) | (9,399,096 | ) | (261,020 | ) | (389,121 | ) | |||||||||||||||
Total | $ | 57,960,122 | $ | 5,351,927 | $ | 6,116,792 | $ | (120,923,281 | ) | $ | 10,760,892 | $ | 6,407,123 | |||||||||||||
| 3 | The differences between book-basis and tax-basis net unrealized gains (losses) were attributable primarily to the tax deferral of losses on wash sales, amortization and accretion methods of premiums and discounts on fixed income securities, the accrual of income on securities in default, treatment of residual interests in TOB trusts, the deferral of compensation to Trustees and the realization for tax purposes of unrealized gains/losses on certain futures contracts. |
| 4 | The Trusts have elected to defer certain qualified late-year losses and recognize such losses in the next taxable year. |
| ANNUAL REPORT | JULY 31, 2014 | 63 |
| Notes to Financial Statements (continued) |
| Expires July 31, | | BFZ | | BFO | | BBF | | BTT | | BNJ | | BNY | ||||||||||||||
2015 | $ | 465,742 | — | — | — | — | — | |||||||||||||||||||
2016 | 186,028 | — | — | — | — | — | ||||||||||||||||||||
2017 | 3,782,470 | $ | 394,297 | — | — | — | $ | 2,408,109 | ||||||||||||||||||
2018 | 12,894,572 | 62,100 | $ | 6,208,886 | — | $ | 842,367 | 1,480,575 | ||||||||||||||||||
2019 | — | — | 651,464 | — | 27,464 | 1,982,931 | ||||||||||||||||||||
No expiration date1 | — | 294,787 | 3,192,934 | $ | 65,058,716 | 976,953 | 4,921,533 | |||||||||||||||||||
Total | $ | 17,328,812 | $ | 751,184 | $ | 10,053,284 | $ | 65,058,716 | $ | 1,846,784 | $ | 10,793,148 | ||||||||||||||
| 1 | Must be utilized prior to losses subject to expiration. |
| | BFZ | | BFO | | BBF | | BTT | | BNJ | | BNY | |||||||||||||||
Tax cost | $ | 600,496,749 | $ | 81,748,180 | $ | 117,705,021 | $ | 2,319,554,126 | $ | 166,089,479 | $ | 266,523,051 | ||||||||||||||
Gross unrealized appreciation | $ | 72,399,309 | $ | 5,189,548 | $ | 16,551,253 | $ | 18,274,611 | $ | 13,512,335 | $ | 17,702,983 | ||||||||||||||
Gross unrealized depreciation | (393,713 | ) | (1,385,117 | ) | (546,087 | ) | (59,099,634 | ) | (2,069,582 | ) | (2,949,196 | ) | ||||||||||||||
Net unrealized appreciation(depreciation) | $ | 72,005,596 | $ | 3,804,431 | $ | 16,005,166 | $ | (40,825,023 | ) | $ | 11,442,753 | $ | 14,753,787 | |||||||||||||
| 64 | ANNUAL REPORT | JULY 31, 2014 |
| Notes to Financial Statements (continued) |
| Year Ended | | BFZ | | BBF | | BNJ | | BNY | ||||||||||
July 31, 2014 | — | — | — | — | ||||||||||||||
July 31, 2013 | 36,393 | 3,273 | 17,491 | 36,314 | ||||||||||||||
| ANNUAL REPORT | JULY 31, 2014 | 65 |
| Notes to Financial Statements (continued) |
| | Issue Date | | Shares Issued | | Aggregate Principal | | Maturity Date | |||||||||||
BBF | 9/15/11 | 342 | $ | 34,200,000 | 10/01/41 | |||||||||||||
| 66 | ANNUAL REPORT | JULY 31, 2014 |
| Notes to Financial Statements (continued) |
| | Issue Date | | Shares Issued | | Aggregate Principal | | Term Date | |||||||||||
BFZ | 3/22/12 | 1,713 | $ | 171,300,000 | 4/01/15 | |||||||||||||
BNJ | 3/22/12 | 591 | $ | 59,100,000 | 4/01/15 | |||||||||||||
BNY | 3/22/12 | 945 | $ | 94,500,000 | 4/01/15 | |||||||||||||
| | BFZ | | BNJ | | BNY | |||||||||
Rate | 1.06 | % | 1.06 | % | 1.06 | % | ||||||||
| ANNUAL REPORT | JULY 31, 2014 | 67 |
| Notes to Financial Statements (continued) |
| | Issue Date | | Shares Issued | | Aggregate Principal | | Term Date | |||||||||||
BTT | 1/10/2013 | 50 | $ | 250,000,000 | 12/31/2030 | |||||||||||||
| 1/30/2013 | 50 | $ | 250,000,000 | 12/31/2030 | ||||||||||||||
| 2/20/2013 | 50 | $ | 250,000,000 | 12/31/2030 | ||||||||||||||
| 68 | ANNUAL REPORT | JULY 31, 2014 |
| Notes to Financial Statements (continued) |
| | Series | | AMPS | | Effective Yield | | Rate Frequency Days | Moody’s Rating | |||||||||||
BFO | F-7 | 25 | 0.12 | % | 7 | Aa2 | |||||||||||||
| | Series | | Low | | High | | Average | |||||||||||
BFO | F-7 | 0.07 | % | 0.23 | % | 0.11 | % | |||||||||||
| ANNUAL REPORT | JULY 31, 2014 | 69 |
| Notes to Financial Statements (concluded) |
| | Series | | Redemption Date | | Shares Redeemed | | Aggregate Principal | |||||||||||
BFO | F-7 | 9/09/13 | 80 | $ | 2,000,000 | |||||||||||||
| F-7 | 10/28/13 | 384 | $ | 9,600,000 | ||||||||||||||
| F-7 | 12/02/13 | 110 | $ | 2,750,000 | ||||||||||||||
| F-7 | 1/06/14 | 65 | $ | 1,625,000 | ||||||||||||||
| F-7 | 4/08/14 | 30 | $ | 750,000 | ||||||||||||||
| F-7 | 6/09/14 | 70 | $ | 1,750,000 | ||||||||||||||
| | Common Dividend Per Share | |||||
BFZ | $ | 0.072200 | ||||
BFO | $ | 0.034700 | ||||
BBF | $ | 0.072375 | ||||
BTT | $ | 0.080000 | ||||
BNJ | $ | 0.075100 | ||||
BNY | $ | 0.069000 | ||||
| | Preferred Shares | | Series | | Dividends Declared | |||||||
BFZ | VMTP Shares | W-7 | $ | 153,044 | ||||||||
BFO | AMPS | F-7 | $ | 55 | ||||||||
BBF | VRDP Shares | W-7 | $ | 4,123 | ||||||||
BTT | RVMTP Shares | W-7 | $ | 447,123 | ||||||||
BNJ | VMTP Shares | W-7 | $ | 52,801 | ||||||||
BNY | VMTP Shares | W-7 | $ | 84,429 | ||||||||
| 70 | ANNUAL REPORT | JULY 31, 2014 |
| Report of Independent Registered Public Accounting Firm |
BlackRock California Municipal Income Trust,
BlackRock Florida Municipal 2020 Term Trust,
BlackRock Municipal Income Investment Trust,
BlackRock New Jersey Municipal Income Trust,
BlackRock New York Municipal Income Trust, and
BlackRock Municipal Target Term Trust:
Boston, Massachusetts
September 24, 2014
| ANNUAL REPORT | JULY 31, 2014 | 71 |
| Disclosure of Investment Advisory Agreements |
| 1 | Funds are ranked by Lipper in quartiles, ranging from first to fourth, where first is the most desirable quartile position and fourth is the least desirable. |
| 72 | ANNUAL REPORT | JULY 31, 2014 |
| Disclosure of Investment Advisory Agreements (continued) |
| ANNUAL REPORT | JULY 31, 2014 | 73 |
| Disclosure of Investment Advisory Agreements (continued) |
| 74 | ANNUAL REPORT | JULY 31, 2014 |
| Disclosure of Investment Advisory Agreements (concluded) |
| ANNUAL REPORT | JULY 31, 2014 | 75 |
| Automatic Dividend Reinvestment Plans |
| 76 | ANNUAL REPORT | JULY 31, 2014 |
| Officers and Trustees |
| Name, Address1 and Year of Birth | Position(s) Held with Trusts | Length of Time Served as a Trustee3 | Principal Occupation(s) During Past Five Years | Number of BlackRock- Advised Registered Investment Companies (“RICs”) Consisting of Investment Portfolios (“Portfolios”) Overseen | Public Directorships | |||||||
| Independent Trustees2 | ||||||||||||
| Richard E. Cavanagh 1946 | Chairman of the Board and Trustee | Since 2007 | Trustee, Aircraft Finance Trust from 1999 to 2009; Director, The Guardian Life Insurance Company of America since 1998; Director, Arch Chemical (chemical and allied products) from 1999 to 2011; Trustee, Educational Testing Service from 1997 to 2009 and Chairman thereof from 2005 to 2009; Senior Advisor, The Fremont Group since 2008 and Director thereof since 1996; Faculty Member/Adjunct Lecturer, Harvard University since 2007; President and Chief Executive Officer, The Conference Board, Inc. (global business research organization) from 1995 to 2007. | 82 RICs consisting of 82 Portfolios | None | |||||||
| Karen P. Robards 1950 | Vice Chairperson of the Board, Chairperson of the Audit Committee and Trustee | Since 2007 | Partner of Robards & Company, LLC (financial advisory firm) since 1987; Co-founder and Director of the Cooke Center for Learning and Development (a not-for-profit organization) since 1987; Director of Care Investment Trust, Inc. (health care real estate investment trust) from 2007 to 2010; Investment Banker at Morgan Stanley from 1976 to 1987. | 82 RICs consisting of 82 Portfolios | AtriCure, Inc. (medical devices); Greenhill & Co., Inc. | |||||||
| Michael J. Castellano 1946 | Trustee and Member of the Audit Committee | Since 2011 | Chief Financial Officer of Lazard Group LLC from 2001 to 2011; Chief Financial Officer of Lazard Ltd from 2004 to 2011; Director, Support Our Aging Religious (non-profit) since 2009; Director, National Advisory Board of Church Management at Villanova University since 2010; Trustee, Domestic Church Media Foundation since 2012. | 82 RICs consisting of 82 Portfolios | None | |||||||
| Frank J. Fabozzi4 1948 | Trustee and Member of the Audit Committee | Since 2007 | Editor of and Consultant for The Journal of Portfolio Management since 2006; Professor of Finance, EDHEC Business School since 2011; Professor in the Practice of Finance and Becton Fellow, Yale University School of Management from 2006 to 2011; Adjunct Professor of Finance and Becton Fellow, Yale University from 1994 to 2006. | 115 RICs consisting of 237 Portfolios | None | |||||||
| Kathleen F. Feldstein 1941 | Trustee | Since 2007 | President of Economics Studies, Inc. (private economic consulting firm) since 1987; Chair, Board of Trustees, McLean Hospital from 2000 to 2008 and Trustee Emeritus thereof since 2008; Member of the Board of Partners Community Healthcare, Inc. from 2005 to 2009; Member of the Corporation of Partners HealthCare since 1995; Trustee, Museum of Fine Arts, Boston since 1992; Member of the Visiting Committee to the Harvard University Art Museum since 2003; Director, Catholic Charities of Boston since 2009. | 82 RICs consisting of 82 Portfolios | The McClatchy Company (publishing) | |||||||
| James T. Flynn 1939 | Trustee and Member of the Audit Committee | Since 2007 | Chief Financial Officer of JPMorgan & Co., Inc. from 1990 to 1995. | 82 RICs consisting of 82 Portfolios | None | |||||||
| Jerrold B. Harris 1942 | Trustee | Since 2007 | Trustee, Ursinus College since 2000; Director, Ducks Unlimited, Inc. (conservations) since 2013; Director, Troemner LLC (scientific equipment) since 2000; Director of Delta Waterfowl Foundation from 2010 to 2012; President and Chief Executive Officer, VWR Scientific Products Corporation from 1990 to 1999. | 82 RICs consisting of 82 Portfolios | BlackRock Kelso Capital Corp. (business development company) | |||||||
| R. Glenn Hubbard 1958 | Trustee | Since 2007 | Dean, Columbia Business School since 2004; Faculty member, Columbia Business School since 1988. | 82 RICs consisting of 82 Portfolios | ADP (data and information services); Metropolitan Life Insurance Company (insurance) | |||||||
| ANNUAL REPORT | JULY 31, 2014 | 77 |
| Officers and Trustees (continued) |
| Name, Address1 and Year of Birth | Position(s) Held with Trusts | Length of Time Served as a Trustee3 | Principal Occupation(s) During Past Five Years | Number of BlackRock- Advised Registered Investment Companies (“RICs”) Consisting of Investment Portfolios (“Portfolios”) Overseen | Public Directorships | |||||||
| Independent Trustees2 (concluded) | ||||||||||||
| W. Carl Kester 1951 | Trustee and Member of the Audit Committee | Since 2007 | George Fisher Baker Jr. Professor of Business Administration, Harvard Business School since 2008; Deputy Dean for Academic Affairs from 2006 to 2010; Chairman of the Finance Unit, 2005 to 2006; Senior Associate Dean and Chairman of the MBA Program from 1999 to 2005; Member of the faculty of Harvard Business School since 1981. | 82 RICs consisting of 82 Portfolios | None | |||||||
| 1 The address of each Officer and Trustee is c/o BlackRock, Inc., Park Avenue Plaza, 55 East 52nd Street, New York, NY 10055. | ||||||||||||
| 2 Independent Trustees serve until their resignation, removal or death, or until December 31 of the year in which they turn 74. The maximum age limitation may be waived as to any Trustee by action of a majority of the Trustees upon finding good cause thereof. In 2013, the Board of Trustees unanimously approved extending the mandatory retirement age for James T. Flynn by one additional year, which the Board believed would be in the best interest of shareholders. Mr. Flynn can serve until December 31 of the year in which he turns 75. Mr. Flynn turns 75 in 2014. | ||||||||||||
| 3 Date shown is the earliest date a person has served for the Trusts covered by this annual report. Following the combination of Merrill Lynch Investment Managers, L.P. (“MLIM”) and BlackRock, Inc. (“BlackRock”) in September 2006, the various legacy MLIM and legacy BlackRock fund boards were realigned and consolidated into three new fund boards in 2007. As a result, although the chart shows certain Trustees as joining the Trusts’ board in 2007, those Trustees first became members of the boards of other legacy MLIM or legacy BlackRock funds as follows: Richard E. Cavanagh, 1994; Frank J. Fabozzi, 1988; Kathleen F. Feldstein, 2005; James T. Flynn, 1996; Jerrold B. Harris, 1999; R. Glenn Hubbard, 2004; W. Carl Kester, 1995 and Karen P. Robards, 1998. | ||||||||||||
| 4 Dr. Fabozzi is also a board member of the BlackRock Equity-Liquidity Complex. | ||||||||||||
| Interested Trustees5 | ||||||||||||
| Paul L. Audet 1953 | Trustee | Since 2011 | Senior Managing Director of BlackRock and Head of U.S. Mutual Funds since 2011; Head of BlackRock’s Real Estate business from 2008 to 2011; Member of BlackRock’s Global Operating and Corporate Risk Management Committees since 2008; Head of BlackRock’s Global Cash Management business from 2005 to 2010; Acting Chief Financial Officer of BlackRock from 2007 to 2008; Chief Financial Officer of BlackRock from 1998 to 2005. | 144 RICs consisting of 334 Portfolios | None | |||||||
| Henry Gabbay 1947 | Trustee | Since 2007 | Consultant, BlackRock from 2007 to 2008; Managing Director, BlackRock from 1989 to 2007; Chief Administrative Officer, BlackRock Advisors, LLC from 1998 to 2007; President of BlackRock Funds and BlackRock Allocation Target Shares (formerly BlackRock Bond Allocation Target Shares) from 2005 to 2007; Treasurer of certain closed-end funds in the BlackRock fund complex from 1989 to 2006. | 144 RICs consisting of 334 Portfolios | None | |||||||
| 5 Mr. Audet is an “interested person,” as defined in the 1940 Act, of the Trusts based on his position with BlackRock and its affiliates as well as his ownership of BlackRock securities. Mr. Gabbay is an “interested person” of the Trusts based on his former positions with BlackRock and its affiliates as well as his ownership of BlackRock and The PNC Financial Services Group, Inc. securities. Mr. Audet and Mr. Gabbay are also Directors of two complexes of BlackRock registered open-end funds, the BlackRock Equity-Liquidity Complex and the BlackRock Equity-Bond Complex. Interested Trustees of the BlackRock Closed-End Complex serve until their resignation, removal or death, or until December 31 of the year in which they turn 72. The maximum age limitation may be waived as to any Trustee by action of a majority of the Trustees upon finding a good cause thereof. | ||||||||||||
| 78 | ANNUAL REPORT | JULY 31, 2014 |
| Officers and Trustees (concluded) |
| Name, Address1 and Year of Birth | Position(s) Held with Trusts | Length of Time Served | Principal Occupation(s) During Past Five Years | |||||
| Officers2 | ||||||||
| John M. Perlowski 1964 | President and Chief Executive Officer | Since 2011 | Managing Director of BlackRock since 2009; Global Head of BlackRock Fund Services since 2009; Managing Director and Chief Operating Officer of the Global Product Group at Goldman Sachs Asset Management, L.P. from 2003 to 2009; Treasurer of Goldman Sachs Mutual Funds from 2003 to 2009 and Senior Vice President thereof from 2007 to 2009; Director of Goldman Sachs Offshore Funds from 2002 to 2009; Director of Family Resource Network (charitable foundation) since 2009. | |||||
| Brendan Kyne 1977 | Vice President | Since 2009 | Managing Director of BlackRock, Inc. since 2010; Director of BlackRock, Inc. from 2008 to 2009; Head of Americas Product Development for BlackRock since 2013, Head of Product Development and Management for BlackRock’s U.S. Retail Group from 2009 to 2013 and Co-head thereof from 2007 to 2009; Vice President of BlackRock, Inc. from 2005 to 2008. | |||||
| Robert W. Crothers 1981 | Vice President | Since 2012 | Director of BlackRock since 2011; Vice President of BlackRock from 2008 to 2010. | |||||
| Neal Andrews 1966 | Chief Financial Officer | Since 2007 | Managing Director of BlackRock since 2006; Senior Vice President and Line of Business Head of Fund Accounting and Administration at PNC Global Investment Servicing (U.S.) Inc. from 1992 to 2006. | |||||
| Jay Fife 1970 | Treasurer | Since 2007 | Managing Director of BlackRock since 2007; Director of BlackRock in 2006; Assistant Treasurer of the MLIM and Fund Asset Management, L.P. advised funds from 2005 to 2006; Director of MLIM Fund Services Group from 2001 to 2006. | |||||
| Charles Park 1967 | Chief Compliance Officer and Anti-Money Laundering Officer | Since 2014 | Chief Compliance Officer of BlackRock Advisors, LLC and the BlackRock-advised Funds in the Equity-Bond Complex, the Equity-Liquidity Complex and the Closed-End Complex since 2014; Principal of and Chief Compliance Officer for iShares® Delaware Trust Sponsor LLC since 2012 and BlackRock Fund Advisors (“BFA”) since 2006; Chief Compliance Officer for the BFA-advised iShares exchange traded funds since 2006; Chief Compliance Officer for BlackRock Asset Management International Inc. since 2012. | |||||
| Janey Ahn 1975 | Secretary | Since 2012 | Director of BlackRock since 2009; Vice President of BlackRock from 2008 to 2009; Assistant Secretary of the Funds from 2008 to 2012. | |||||
| 1 The address of each Officer and Trustee is c/o BlackRock, Inc., Park Avenue Plaza, 55 East 52nd Street, New York, NY 10055. | ||||||||
| 2 Officers of the Trusts serve at the pleasure of the Boards. | ||||||||
| Effective June 6, 2014, Brian Kindelan resigned as Chief Compliance Officer and Anti-Money Laundering Officer of the Trusts and Charles Park became Chief Compliance Officer and Anti-Money Laundering Officer of the Trusts. |
| | ||||||||||
| Investment Advisor BlackRock Advisors, LLC Wilmington, DE 19809 Custodian State Street Bank and Trust Company Boston, MA 02110 | Transfer Agent Common Shares: Computershare Trust Company, N.A. Canton, MA 02021 AMPS Auction Agent The Bank of New York Mellon New York, NY 10289 | VRDP Tender and Paying Agent, RVMTP Tender and Paying Agent and VMTP Redemption and Paying Agent The Bank of New York Mellon New York, NY 10289 VRDP Liquidity Provider Barclays Bank PLC New York, NY 10019 | VRDP Remarketing Agent Barclays Capital, Inc. New York, NY 10019 Accounting Agent State Street Bank and Trust Company Boston, MA 02110 Independent Registered Public Accounting Firm Deloitte & Touche LLP Boston, MA 02116 | Legal Counsel Skadden, Arps, Slate, Meagher & Flom LLP New York, NY 10036 Address of the Trusts 100 Bellevue Parkway Wilmington, DE 19809 | ||||||
| ANNUAL REPORT | JULY 31, 2014 | 79 |
| Additional Information |
Proxy Results
| Paul L. Audet | Michael J. Castellano | R. Glenn Hubbard | ||||||||||||||||||||||||||||||||||||
| Votes For | | Votes Withheld | | Abstain | Votes For | | Votes Withheld | | Abstain | Votes For | | Votes Withheld | | Abstain | ||||||||||||||||||||||||
BFZ | 28,232,816 | 448,027 | 0 | 28,247,742 | 433,101 | 0 | 28,199,719 | 481,124 | 0 | |||||||||||||||||||||||||||||
BFO | 5,077,492 | 108,690 | 0 | 5,077,993 | 108,189 | 0 | 5,074,523 | 111,659 | 0 | |||||||||||||||||||||||||||||
BBF | 5,641,161 | 96,039 | 0 | 5,641,161 | 96,039 | 0 | 5,604,134 | 133,066 | 0 | |||||||||||||||||||||||||||||
BTT | 65,456,644 | 1,297,792 | 0 | 65,294,971 | 1,459,465 | 0 | 65,278,394 | 1,476,042 | 0 | |||||||||||||||||||||||||||||
BNJ | 6,286,520 | 268,462 | 0 | 6,274,327 | 280,655 | 0 | 6,280,588 | 274,394 | 0 | |||||||||||||||||||||||||||||
BNY | 11,002,524 | 608,273 | 0 | 10,988,857 | 621,939 | 0 | 11,317,080 | 293,717 | 0 | |||||||||||||||||||||||||||||
| W. Carl Kester1 | ||||||||||||||||||||||||||||||||||||||
| Votes For | | Votes Withheld | | Abstain | ||||||||||||||||||||||||||||||||||
BFZ | 1,713 | 0 | 0 | |||||||||||||||||||||||||||||||||||
BFO | 67 | 2 | 0 | |||||||||||||||||||||||||||||||||||
BBF | 342 | 0 | 0 | |||||||||||||||||||||||||||||||||||
BTT | 150 | 0 | 0 | |||||||||||||||||||||||||||||||||||
BNJ | 591 | 0 | 0 | |||||||||||||||||||||||||||||||||||
BNY | 945 | 0 | 0 | |||||||||||||||||||||||||||||||||||
| 1 | Voted on by holders of preferred shares only. |
Trust Certification
| 80 | ANNUAL REPORT | JULY 31, 2014 |
| Additional Information (continued) |
Dividend Policy
General Information
| ANNUAL REPORT | JULY 31, 2014 | 81 |
| Additional Information (continued) |
General Information (concluded)
Section 19(a) Notice
| July 31, 2014 | |||||||||||||||||||||||||||||||||||
| Total Cumulative Distributions for the Fiscal Year-to-Date | | % Breakdown of the Total Cumulative Distributions for the Fiscal Year-to-Date | |||||||||||||||||||||||||||||||||
| | Net Investment Income | | Net Realized Capital Gains | | Return of Capital | | Total Per Common Share | | Net Investment Income | | Net Realized Capital Gains | | Return of Capital | | Total Per Common Share | ||||||||||||||||||||
BTT | $1.111250 | — | — | $1.111250 | 100% | 0% | 0% | 100% | |||||||||||||||||||||||||||
Shelf Offering Program
| 82 | ANNUAL REPORT | JULY 31, 2014 |
| Additional Information (concluded) |
BlackRock Privacy Principles
| ANNUAL REPORT | JULY 31, 2014 | 83 |
 |
CEF-BK6-7/14-AR |  |
Item 2 – Code of Ethics – The registrant (or the “Fund”) has adopted a code of ethics, as of the end of the period covered by this report, applicable to the registrant’s principal executive officer, principal financial officer, principal accounting officer or controller, or persons performing similar functions. During the period covered by this report, there have been no amendments to or waivers granted under the code of ethics. A copy of the code of ethics is available without charge at www.blackrock.com.
Item 3 – Audit Committee Financial Expert – The registrant’s board of directors (the “board of directors”), has determined that (i) the registrant has the following audit committee financial experts serving on its audit committee and (ii) each audit committee financial expert is independent:
Michael Castellano
Frank J. Fabozzi
James T. Flynn
W. Carl Kester
Karen P. Robards
The registrant’s board of directors has determined that W. Carl Kester and Karen P. Robards qualify as financial experts pursuant to Item 3(c)(4) of Form N-CSR.
Prof. Kester has a thorough understanding of generally accepted accounting principles, financial statements and internal control over financial reporting as well as audit committee functions. Prof. Kester has been involved in providing valuation and other financial consulting services to corporate clients since 1978. Prof. Kester’s financial consulting services present a breadth and level of complexity of accounting issues that are generally comparable to the breadth and complexity of issues that can reasonably be expected to be raised by the registrant’s financial statements.
Ms. Robards has a thorough understanding of generally accepted accounting principles, financial statements and internal control over financial reporting as well as audit committee functions. Ms. Robards has been President of Robards & Company, a financial advisory firm, since 1987. Ms. Robards was formerly an investment banker for more than 10 years where she was responsible for evaluating and assessing the performance of companies based on their financial results. Ms. Robards has over 30 years of experience analyzing financial statements. She also is a member of the audit committee of one publicly held company and a non-profit organization.
Under applicable securities laws, a person determined to be an audit committee financial expert will not be deemed an “expert” for any purpose, including without limitation for the purposes of Section 11 of the Securities Act of 1933, as a result of being designated or identified as an audit committee financial expert. The designation or identification as an audit committee financial expert does not impose on such person any duties, obligations, or liabilities greater than the duties, obligations, and liabilities imposed on such person as a member of the audit committee and board of directors in the absence of such designation or identification. The designation or identification of a person as an audit committee financial expert does not affect the duties, obligations, or liability of any other member of the audit committee or board of directors.
| 2 |
Item 4 – Principal Accountant Fees and Services
The following table presents fees billed by Deloitte & Touche LLP (“D&T”) in each of the last two fiscal years for the services rendered to the Fund:
| (a) Audit Fees | (b) Audit-Related Fees1 | (c) Tax Fees2 | (d) All Other Fees3 | |||||
| Entity Name | Current Fiscal Year End | Previous Fiscal Year End | Current Fiscal Year End | Previous Fiscal Year End | Current Fiscal Year End | Previous Fiscal Year End | Current Fiscal Year End | Previous Fiscal Year End |
| BlackRock Florida Municipal 2020 Term Trust | $30,163 | $30,163 | $3,500 | $3,500 | $8,800 | $11,800 | $0 | $0 |
The following table presents fees billed by D&T that were required to be approved by the registrant’s audit committee (the “Committee”) for services that relate directly to the operations or financial reporting of the Fund and that are rendered on behalf of BlackRock Advisors, LLC (“Investment Adviser” or “BlackRock”) and entities controlling, controlled by, or under common control with BlackRock (not including any sub-adviser whose role is primarily portfolio management and is subcontracted with or overseen by another investment adviser) that provide ongoing services to the Fund (“Fund Service Providers”):
| Current Fiscal Year End | Previous Fiscal Year End | |
| (b) Audit-Related Fees1 | $0 | $0 |
| (c) Tax Fees2 | $0 | $0 |
| (d) All Other Fees3 | $2,555,000 | $2,865,000 |
1 The nature of the services includes assurance and related services reasonably related to the performance of the audit of financial statements not included in Audit Fees.
2 The nature of the services includes tax compliance, tax advice and tax planning.
3 Aggregate fees borne by BlackRock in connection with the review of compliance procedures and attestation thereto performed by D&T with respect to all of the registered closed-end funds and some of the registered open-end funds advised by BlackRock.
(e)(1) Audit Committee Pre-Approval Policies and Procedures:
The Committee has adopted policies and procedures with regard to the pre-approval of services. Audit, audit-related and tax compliance services provided to the registrant on an annual basis require specific pre-approval by the Committee. The Committee also must approve other non-audit services provided to the registrant and those non-audit services provided to the Investment Adviser and Fund Service Providers that relate directly to the operations and the financial reporting of the registrant. Certain of these non-audit services that the Committee believes are (a) consistent with the SEC’s auditor independence rules and (b) routine and recurring services that will not impair the independence of the independent accountants may be approved by the Committee without consideration on a specific case-by-case basis (“general pre-approval”). The term of any general pre-approval is 12 months from the date of the pre-approval, unless the Committee provides for a different period. Tax or other non-audit services provided to the registrant which have a direct impact on the operations or financial reporting of the registrant will only be deemed pre-approved provided that any individual project does not exceed $10,000 attributable to the registrant or $50,000 per project. For this purpose, multiple projects will be aggregated to determine if they exceed the previously mentioned cost levels.
Any proposed services exceeding the pre-approved cost levels will require specific pre-approval by the Committee, as will any other services not subject to general pre-approval (e.g.,
| 3 |
unanticipated but permissible services). The Committee is informed of each service approved subject to general pre-approval at the next regularly scheduled in-person board meeting. At this meeting, an analysis of such services is presented to the Committee for ratification. The Committee may delegate to the Committee Chairman the authority to approve the provision of and fees for any specific engagement of permitted non-audit services, including services exceeding pre-approved cost levels.
(e)(2) None of the services described in each of Items 4(b) through (d) were approved by the Committee pursuant to the de minimis exception in paragraph (c)(7)(i)(C) of Rule 2-01 of Regulation S-X.
(f) Not Applicable
(g) The aggregate non-audit fees paid to the accountant for services rendered by the accountant to the registrant, the Investment Adviser and the Fund Service Providers were:
| Entity Name | Current Fiscal Year End | Previous Fiscal Year End |
| BlackRock Florida Municipal 2020 Term Trust | $8,800 | $11,800 |
Additionally, SSAE 16 Review (Formerly, SAS No. 70) fees for the current and previous fiscal years of $2,555,000 and $2,865,000, respectively, were billed by D&T to the Investment Adviser.
(h) The Committee has considered and determined that the provision of non-audit services that were rendered to the Investment Adviser, and the Fund Service Providers that were not pre-approved pursuant to paragraph (c)(7)(ii) of Rule 2-01 of Regulation S-X is compatible with maintaining the principal accountant’s independence.
Item 5 – Audit Committee of Listed Registrants
(a) The following individuals are members of the registrant’s separately-designated standing audit committee established in accordance with Section 3(a)(58)(A) of the Securities Exchange Act of 1934 (15 U.S.C. 78c(a)(58)(A)):
Michael Castellano
Frank J. Fabozzi
James T. Flynn
W. Carl Kester
Karen P. Robards
(b) Not Applicable
Item 6 – Investments
(a) The registrant’s Schedule of Investments is included as part of the Report to Stockholders filed under Item 1 of this Form.
| 4 |
(b) Not Applicable due to no such divestments during the semi-annual period covered since the previous Form N-CSR filing.
Item 7 – Disclosure of Proxy Voting Policies and Procedures for Closed-End Management Investment Companies – The board of directors has delegated the voting of proxies for the Fund’s portfolio securities to the Investment Adviser pursuant to the Investment Adviser’s proxy voting guidelines. Under these guidelines, the Investment Adviser will vote proxies related to Fund securities in the best interests of the Fund and its stockholders. From time to time, a vote may present a conflict between the interests of the Fund’s stockholders, on the one hand, and those of the Investment Adviser, or any affiliated person of the Fund or the Investment Adviser, on the other. In such event, provided that the Investment Adviser’s Equity Investment Policy Oversight Committee, or a sub-committee thereof (the “Oversight Committee”) is aware of the real or potential conflict or material non-routine matter and if the Oversight Committee does not reasonably believe it is able to follow its general voting guidelines (or if the particular proxy matter is not addressed in the guidelines) and vote impartially, the Oversight Committee may retain an independent fiduciary to advise the Oversight Committee on how to vote or to cast votes on behalf of the Investment Adviser’s clients. If the Investment Adviser determines not to retain an independent fiduciary, or does not desire to follow the advice of such independent fiduciary, the Oversight Committee shall determine how to vote the proxy after consulting with the Investment Adviser’s Portfolio Management Group and/or the Investment Adviser’s Legal and Compliance Department and concluding that the vote cast is in its client’s best interest notwithstanding the conflict. A copy of the Fund’s Proxy Voting Policy and Procedures are attached as Exhibit 99.PROXYPOL. Information on how the Fund voted proxies relating to portfolio securities during the most recent 12-month period ended June 30 is available without charge, (i) at www.blackrock.com and (ii) on the SEC’s website at http://www.sec.gov.
Item 8 – Portfolio Managers of Closed-End Management Investment Companies – as of July 31, 2014.
(a)(1) The registrant is managed by a team of investment professionals comprised of Phillip Soccio, CFA, Director at BlackRock, Theodore R. Jaeckel, Jr., CFA, Managing Director at BlackRock, and Walter O’Connor, CFA, Managing Director at BlackRock. Each is a member of BlackRock’s municipal tax-exempt management group. Each is jointly responsible for the day-to-day management of the registrant’s portfolio, which includes setting the registrant’s overall investment strategy, overseeing the management of the registrant and/or selection of its investments. Messrs. Soccio, Jaeckel and O’Connor have been members of the registrant’s portfolio management team since 2011, 2006 and 2006, respectively.
| 5 |
(a)(2) As of July 31, 2014:
(ii) Number of Other Accounts Managed and Assets by Account Type | (iii) Number of Other Accounts and Assets for Which Advisory Fee is Performance-Based | ||||||
(i) Name of Portfolio Manager | Other Registered Investment Companies | Other Pooled Investment Vehicles | Other Accounts | Other Registered Investment Companies | Other Pooled Investment Vehicles | Other Accounts | |
| Phillip Soccio, CFA | 11 | 0 | 0 | 0 | 0 | 0 | |
| $3.62 Billion | $0 | $0 | $0 | $0 | $0 | ||
| Theodore R. Jaeckel, Jr., CFA | 64 | 0 | 0 | 0 | 0 | 0 | |
| $26.23 Billion | $0 | $0 | $0 | $0 | $0 | ||
| Walter O’Connor, CFA | 64 | 0 | 0 | 0 | 0 | 0 | |
| $26.23 Billion | $0 | $0 | $0 | $0 | $0 | ||
(iv) Portfolio Manager Potential Material Conflicts of Interest
BlackRock has built a professional working environment, firm-wide compliance culture and compliance procedures and systems designed to protect against potential incentives that may favor one account over another. BlackRock has adopted policies and procedures that address the allocation of investment opportunities, execution of portfolio transactions, personal trading by employees and other potential conflicts of interest that are designed to ensure that all client accounts are treated equitably over time. Nevertheless, BlackRock furnishes investment management and advisory services to numerous clients in addition to the Fund, and BlackRock may, consistent with applicable law, make investment recommendations to other clients or accounts (including accounts which are hedge funds or have performance or higher fees paid to BlackRock or in which portfolio managers have a personal interest in the receipt of such fees), which may be the same as or different from those made to the Fund. In addition, BlackRock, Inc., its affiliates and significant shareholders and any officer, director, shareholder or employee may or may not have an interest in the securities whose purchase and sale BlackRock recommends to the Fund. BlackRock, Inc. or any of its affiliates or significant shareholders, or any officer, director, shareholder, employee or any member of their families may take different actions than those recommended to the Fund by BlackRock with respect to the same securities. Moreover, BlackRock may refrain from rendering any advice or services concerning securities of companies of which any of BlackRock, Inc.’s (or its affiliates’ or significant shareholders’) officers, directors or employees are directors or officers, or companies as to which BlackRock, Inc. or any of its affiliates or significant shareholders or the officers, directors and employees of any of them has any substantial economic interest or possesses material non-public information. Certain portfolio managers also may manage accounts whose investment strategies may at times be opposed to the strategy utilized for a fund. It should also be noted that a portfolio manager may be managing hedge fund and/or long only accounts, or may be part of a team managing hedge fund and/or long only accounts, subject to incentive fees. Such portfolio managers may therefore be entitled to receive a portion of any incentive fees earned on such accounts. Currently, the portfolio managers of this fund are not entitled to receive a portion of incentive fees of other accounts.
As a fiduciary, BlackRock owes a duty of loyalty to its clients and must treat each client fairly. When BlackRock purchases or sells securities for more than one account, the trades must
| 6 |
be allocated in a manner consistent with its fiduciary duties. BlackRock attempts to allocate investments in a fair and equitable manner among client accounts, with no account receiving preferential treatment. To this end, BlackRock, Inc. has adopted policies that are intended to ensure reasonable efficiency in client transactions and provide BlackRock with sufficient flexibility to allocate investments in a manner that is consistent with the particular investment discipline and client base, as appropriate.
(a)(3) As of July 31, 2014:
Portfolio Manager Compensation Overview
The discussion below describes the portfolio managers’ compensation as of July 31, 2014.
BlackRock’s financial arrangements with its portfolio managers, its competitive compensation and its career path emphasis at all levels reflect the value senior management places on key resources. Compensation may include a variety of components and may vary from year to year based on a number of factors. The principal components of compensation include a base salary, a performance-based discretionary bonus, participation in various benefits programs and one or more of the incentive compensation programs established by BlackRock.
Base compensation. Generally, portfolio managers receive base compensation based on their position with the firm.
Discretionary Incentive Compensation
Discretionary incentive compensation is a function of several components: the performance of BlackRock, Inc., the performance of the portfolio manager’s group within BlackRock, the investment performance, including risk-adjusted returns, of the firm’s assets under management or supervision by that portfolio manager relative to predetermined benchmarks, and the individual’s performance and contribution to the overall performance of these portfolios and BlackRock. In most cases, these benchmarks are the same as the benchmark or benchmarks against which the performance of the Funds or other accounts managed by the portfolio managers are measured. Among other things, BlackRock’s Chief Investment Officers make a subjective determination with respect to each portfolio manager’s compensation based on the performance of the Funds and other accounts managed by each portfolio manager relative to the various benchmarks. Performance of fixed income funds is measured on a pre-tax and/or after-tax basis over various time periods including 1-, 3- and 5- year periods, as applicable. With respect to these portfolio managers, such benchmarks for the Fund and other accounts are: a combination of market-based indices (e.g., Standard & Poor's Municipal Bond Index), certain customized indices and certain fund industry peer groups.
Distribution of Discretionary Incentive Compensation. Discretionary incentive compensation is distributed to portfolio managers in a combination of cash and BlackRock, Inc. restricted stock units which vest ratably over a number of years. For some portfolio managers, discretionary incentive compensation is also distributed in deferred cash awards that notionally track the returns of select BlackRock investment products they manage and that vest ratably over a number of years. The BlackRock, Inc. restricted stock units, upon vesting, will be settled in
| 7 |
BlackRock, Inc. common stock. Typically, the cash portion of the discretionary incentive compensation, when combined with base salary, represents more than 60% of total compensation for the portfolio managers. Paying a portion of discretionary incentive compensation in BlackRock, Inc. stock puts compensation earned by a portfolio manager for a given year “at risk” based on BlackRock’s ability to sustain and improve its performance over future periods. Providing a portion of discretionary incentive compensation in deferred cash awards that notionally track the BlackRock investment products they manage provides direct alignment with investment product results.
Long-Term Incentive Plan Awards — From time to time long-term incentive equity awards are granted to certain key employees to aid in retention, align their interests with long-term shareholder interests and motivate performance. Equity awards are generally granted in the form of BlackRock, Inc. restricted stock units that, once vested, settle in BlackRock, Inc. common stock. Messrs. Jaeckel and O’Connor have unvested long-term incentive awards.
Deferred Compensation Program — A portion of the compensation paid to eligible United States-based BlackRock employees may be voluntarily deferred at their election for defined periods of time into an account that tracks the performance of certain of the firm’s investment products. Any portfolio manager who is either a managing director or director at BlackRock with compensation above a specified threshold is eligible to participate in the deferred compensation program.
Other Compensation Benefits. In addition to base salary and discretionary incentive compensation, portfolio managers may be eligible to receive or participate in one or more of the following:
Incentive Savings Plans — BlackRock, Inc. has created a variety of incentive savings plans in which BlackRock, Inc. employees are eligible to participate, including a 401(k) plan, the BlackRock Retirement Savings Plan (RSP), and the BlackRock Employee Stock Purchase Plan (ESPP). The employer contribution components of the RSP include a company match equal to 50% of the first 8% of eligible pay contributed to the plan capped at $5,000 per year, and a company retirement contribution equal to 3-5% of eligible compensation up to the Internal Revenue Service limit ($260,000 for 2014). The RSP offers a range of investment options, including registered investment companies and collective investment funds managed by the firm. BlackRock, Inc. contributions follow the investment direction set by participants for their own contributions or, absent participant investment direction, are invested into a target date fund that corresponds to, or is closest to, the year in which the participant attains age 65. The ESPP allows for investment in BlackRock, Inc. common stock at a 5% discount on the fair market value of the stock on the purchase date. Annual participation in the ESPP is limited to the purchase of 1,000 shares of common stock or a dollar value of $25,000 based on its fair market value on the purchase date. All of the eligible portfolio managers are eligible to participate in these plans.
(a)(4) Beneficial Ownership of Securities – As of July 31, 2014.
| Portfolio Manager | Dollar Range of Equity Securities of the Fund Beneficially Owned |
| Phillip Soccio, CFA | None |
| Theodore R. Jaeckel, Jr., CFA | None |
| Walter O’Connor, CFA | None |
| 8 |
(b) Not Applicable
Item 9 – Purchases of Equity Securities by Closed-End Management Investment Company and Affiliated Purchasers – Not Applicable due to no such purchases during the period covered by this report.
Item 10 – Submission of Matters to a Vote of Security Holders – There have been no material changes to these procedures.
Item 11 – Controls and Procedures
(a) – The registrant’s principal executive and principal financial officers, or persons performing similar functions, have concluded that the registrant’s disclosure controls and procedures (as defined in Rule 30a-3(c) under the Investment Company Act of 1940, as amended (the “1940 Act”)) are effective as of a date within 90 days of the filing of this report based on the evaluation of these controls and procedures required by Rule 30a-3(b) under the 1940 Act and Rule 13a-15(b) under the Securities Exchange Act of 1934, as amended.
(b) – There were no changes in the registrant’s internal control over financial reporting (as defined in Rule 30a-3(d) under the 1940 Act) that occurred during the second fiscal quarter of the period covered by this report that have materially affected, or are reasonably likely to materially affect, the registrant’s internal control over financial reporting.
Item 12 – Exhibits attached hereto
(a)(1) – Code of Ethics – See Item 2
(a)(2) – Certifications – Attached hereto
(a)(3) – Not Applicable
(b) – Certifications – Attached hereto
| 9 |
Pursuant to the requirements of the Securities Exchange Act of 1934 and the Investment Company Act of 1940, the registrant has duly caused this report to be signed on its behalf by the undersigned, thereunto duly authorized.
BlackRock Florida Municipal 2020 Term Trust
| By: | /s/ John M. Perlowski | |
| John M. Perlowski | ||
| Chief Executive Officer (principal executive officer) of | ||
| BlackRock Florida Municipal 2020 Term Trust |
Date: October 1, 2014
Pursuant to the requirements of the Securities Exchange Act of 1934 and the Investment Company Act of 1940, this report has been signed below by the following persons on behalf of the registrant and in the capacities and on the dates indicated.
| By: | /s/ John M. Perlowski | |
| John M. Perlowski | ||
| Chief Executive Officer (principal executive officer) of | ||
| BlackRock Florida Municipal 2020 Term Trust |
Date: October 1, 2014
| By: | /s/ Neal J. Andrews | |
| Neal J. Andrews | ||
| Chief Financial Officer (principal financial officer) of | ||
| BlackRock Florida Municipal 2020 Term Trust |
Date: October 1, 2014
| 10 |