UNITED STATES
SECURITIES AND EXCHANGE COMMISSION
Washington, D.C. 20549
FORMN-CSR
CERTIFIED SHAREHOLDER REPORT OF REGISTERED MANAGEMENT INVESTMENT COMPANIES
Investment Company Act file number811-21184
Name of Fund: BlackRock Florida Municipal 2020 Term Trust (BFO)
Fund Address: 100 Bellevue Parkway, Wilmington, DE 19809
Name and address of agent for service: John M. Perlowski, Chief Executive Officer, BlackRock Florida Municipal
2020 Term Trust, 55 East 52nd Street, New York, NY 10055
Registrant’s telephone number, including area code: (800)882-0052, Option 4
Date of fiscal year end: 12/31/2019
Date of reporting period: 06/30/2019
| Item 1 – | Report to Stockholders |
JUNE 30, 2019
| | |
SEMI-ANNUAL REPORT (UNAUDITED) | |  |
BlackRock Florida Municipal 2020 Term Trust (BFO)
BlackRock Municipal 2020 Term Trust (BKK)
Beginning on January 1, 2021, as permitted by regulations adopted by the Securities and Exchange Commission, paper copies of each Trust’s shareholder reports will no longer be sent by mail, unless you specifically request paper copies of the reports from BlackRock or from your financial intermediary, such as a broker-dealer or bank. Instead, the reports will be made available on a website, and you will be notified by mail each time a report is posted and provided with a website link to access the report.
You may elect to receive all future reports in paper free of charge. If you hold accounts directly with BlackRock, you can call Computershare at(800) 699-1236 to request that you continue receiving paper copies of your shareholder reports. If you hold accounts through a financial intermediary, you can follow the instructions included with this disclosure, if applicable, or contact your financial intermediary to request that you continue to receive paper copies of your shareholder reports. Please note that not all financial intermediaries may offer this service. Your election to receive reports in paper will apply to all funds advised by BlackRock Advisors, LLC or its affiliates, or all funds held with your financial intermediary, as applicable.
If you already elected to receive shareholder reports electronically, you will not be affected by this change and you need not take any action. You may elect to receive electronic delivery of shareholder reports and other communications by contacting your financial intermediary, if you hold accounts through a financial intermediary. Please note that not all financial intermediaries may offer this service.
|
| Not FDIC Insured • May Lose Value • No Bank Guarantee |
The Markets in Review
Dear Shareholder,
Investment performance in the 12 months ended June 30, 2019 was a tale of two markets. The first half of the reporting period was characterized by restrictive monetary policy, deteriorating economic growth, equity market volatility, and rising fear of an imminent recession. During the second half of the reporting period, stocks and bonds rebounded sharply, as restrained inflation and weak economic growth led the U.S. Federal Reserve (the “Fed”) to stop raising interest rates, which led to broad-based optimism that stimulative monetary policy could help forestall a recession.
After the dust settled, the U.S. equity and bond markets posted mixed returns while weathering significant volatility. Less volatile U.S. large cap equities and U.S. bonds advanced, while equities at the high end of the risk spectrum — emerging markets, international developed, and U.S. small cap — posted relatively flat returns.
Fixed-income securities delivered modest positive returns with relatively low volatility. Short-term U.S. Treasury yields rose, while longer-term yields declined. This led to positive returns for U.S. Treasuries and a substantial flattening of the yield curve. Investment grade and high yield corporate bonds also posted positive returns, as the credit fundamentals in corporate markets remained relatively solid.
In the U.S. equity market, volatility spiked in late 2018, as a wide range of risks were brought to bear on markets, ranging from rising interest rates and slowing global growth to heightened trade tensions and political turmoil. These risks manifested in a broad-basedsell-off in December, leading to the worst December performance on record since 1931.
Volatility also rose in emerging markets, as the rising U.S. dollar and higher interest rates in the U.S. disrupted economic growth abroad. U.S.-China trade relations and debt concerns adversely affected the Chinese stock market, particularly in mainland China, while Turkey and Argentina became embroiled in currency crises, largely due to hyperinflation in both countries. An economic slowdown in Europe led to modest performance for European equities.
As equity performance faltered and global economic growth slowed, the Fed shifted to a more patient perspective on the economy in January 2019. In its last four meetings, the Fed left interest rates unchanged and signaled a slower pace of rate hikes in response to the global economic slowdown. Similarly, the European Central Bank signaled a continuation of accommodative monetary policy, while China committed to looser credit conditions and an increase in fiscal spending.
The outpouring of global economic stimulus led to a sharp rally in risk assets throughout the world. Hopes continued to remain high thereafter, as the current economic expansion became the longest in U.S. history. Looking ahead, markets are pricing in three interest rate cuts by the Fed over the next year, as investors anticipate a steady shift toward more stimulative monetary policy.
We expect a slowing expansion with additional room to run, as opposed to an economic recession. However, escalating trade tensions and the resulting disruptions in global supply chains have become the greatest risk to the global expansion.
We believe U.S. and emerging market equities remain relatively attractive. Within U.S. equities, companies with high-quality earnings and strong balance sheets offer the most attractive risk/rewardtrade-off. For bonds, U.S. Treasuries are likely to help buffer against volatility in risk assets, while income from other types of bonds can continue to offer steady returns.
In this environment, investors need to think globally, extend their scope across a broad array of asset classes, and be nimble as market conditions change. We encourage you to talk with your financial advisor and visitblackrock.com for further insight about investing in today’s markets.
Sincerely,

Rob Kapito
President, BlackRock Advisors, LLC

Rob Kapito
President, BlackRock Advisors, LLC
| | | | |
| Total Returns as of June 30, 2019 |
| | | 6-month | | 12-month |
U.S. large cap equities
(S&P 500® Index) | | 18.54% | | 10.42% |
U.S. small cap equities
(Russell 2000® Index) | | 16.98 | | (3.31) |
International equities
(MSCI Europe, Australasia, Far East Index) | | 14.03 | | 1.08 |
Emerging market equities
(MSCI Emerging Markets Index) | | 10.58 | | 1.21 |
3-month Treasury bills
(ICE BofAML3-Month U.S. Treasury Bill Index) | | 1.24 | | 2.31 |
U.S. Treasury securities
(ICE BofAML10-Year U.S. Treasury Index) | | 7.45 | | 10.38 |
U.S. investment grade bonds
(Bloomberg Barclays U.S. Aggregate Bond Index) | | 6.11 | | 7.87 |
Tax-exempt municipal bonds
(S&P Municipal Bond Index) | | 4.94 | | 6.39 |
U.S. high yield bonds
(Bloomberg Barclays U.S. Corporate High Yield 2% Issuer Capped Index) | | 9.94 | | 7.48 |
| Past performance is no guarantee of future results. Index performance is shown for illustrative purposes only. You cannot invest directly in an index. |
| | |
| 2 | | THIS PAGEISNOT PARTOF YOUR FUND REPORT |
Table of Contents
Municipal Market Overview For the Reporting Period Ended June 30, 2019
Municipal Market Conditions
Municipal bonds posted strong total returns during the period, buoyed by rallying interest rates as the Fed turned more dovish late in 2018 on the back of slowing global growth and trade uncertainties and ultimately indicated a commitment to sustain the current economic expansion and the potential for future policy easing.
| | |
| |
| Outside of the favorable rate backdrop, municipal technicals remained incredibly supportive with strong demand outpacing moderate supply. Broadly, investors favored thetax-exempt income, diversification, quality, and value of municipal bonds given that tax reform ultimately lowered the top individual tax rate just 2.6% while eliminating deductions. During the 12 months ended June 30, 2019, municipal bond funds experienced net inflows of approximately $41.0 billion (based on data | | S&P Municipal Bond Index |
| | Total Returns as of June 30, 2019 |
| | 6 months: 4.94% |
| | 12 months: 6.39% |
|
| from the Investment Company Institute), although displayed some bouts of volatility. For the same12-month period, total new issuance underwhelmed from a historical perspective at just $321 billion (below the $374 billion issued in the prior12-month period), a direct result of the elimination of advanced refundings through the 2017 Tax Cuts and Jobs Act. This transitioned the market to a favorable net negative supply environment in which reinvestment income (coupons, calls, and maturities) largely outstripped gross issuance and provided a powerful technical tailwind. |
A Closer Look at Yields
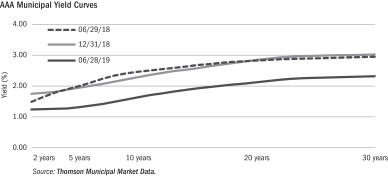
| From June 30, 2018 to June 30, 2019, yields onAAA-rated30-year municipal bonds decreased by 63 basis points (“bps”) from 2.94% to 2.31%, whileten-year rates decreased by 83 bps from 2.46% to 1.63% and five-year rates decreased by 68 bps from 1.99% to 1.31% (as measured by Thomson Municipal Market Data). As a result, the municipal yield curve flattened over the12-month period with the spread betweentwo- and30-year maturities flattening by 24 bps, led by 44 bps of flattening betweentwo- andten-year maturities. |
During the same time period,tax-exempt municipal bonds slightly underperformed U.S. Treasuries as a result of the more defensive nature of the asset class and investor apathy at low absolute yield levels and stretched relative valuations. However, we believe the impact of tax reform reset the standard formunicipal-to-Treasury ratios. Given that the corporate tax rate was lowered much more than the individual rate, institutions now have less incentive to owntax-exempt municipal bonds, while individuals are more incentivized. In a more retail-driven market, lower ratios are likely sustainable as individuals are focused on generatingtax-free income and less concerned with relative valuations. The asset class is known for its lower relative volatility and preservation of principal with an emphasis on income as tax rates rise.
Financial Conditions of Municipal Issuers
The majority of municipal credits remain strong, despite well-publicized problems among a few issuers. Four of the five states with the largest amount of debt outstanding — California, New York, Texas and Florida — continue to exhibit improved credit fundamentals. However, several states with the largest unfunded pension liabilities are faced with elevated borrowing costs and difficult budgetary decisions. Across the country on the local level, property values support credit stability. S&P Global Ratings’ decision to remove its “negative” outlook on New Mexico underscores the improvement in state finances as it was the only remaining state with the designation. Revenue bonds continue to drive performance as investors continue to seek higher yield bonds in the tobacco sector. BlackRock maintains the view that municipal bond defaults will remain minimal and in the periphery while the overall market is fundamentally sound. We continue to advocate careful credit research and believe that a thoughtful approach to structure and security selection remains imperative amid uncertainty in a modestly improving economic environment.
The opinions expressed are those of BlackRock as of June 30, 2019 and are subject to change at any time due to changes in market or economic conditions. The comments should not be construed as a recommendation of any individual holdings or market sectors. Investing involves risk including loss of principal. Bond values fluctuate in price so the value of your investment can go down depending on market conditions. Fixed income risks include interest-rate and credit risk. Typically, when interest rates rise, there is a corresponding decline in bond values. Credit risk refers to the possibility that the bond issuer will not be able to make principal and interest payments. There may be less information on the financial condition of municipal issuers than for public corporations. The market for municipal bonds may be less liquid than for taxable bonds. Some investors may be subject to Alternative Minimum Tax (“AMT”). Capital gains distributions, if any, are taxable.
The S&P Municipal Bond Index, a broad, market value-weighted index, seeks to measure the performance of the U.S. municipal bond market. All bonds in the index are exempt from U.S. federal income taxes or subject to the AMT. Past performance is no guarantee of future results. Index performance is shown for illustrative purposes only. It is not possible to invest directly in an index.
| | |
| 4 | | 2019 BLACKROCK SEMI-ANNUAL REPORTTO SHAREHOLDERS |
| | |
| Trust Summary as of June 30, 2019 | | BlackRock Florida Municipal 2020 Term Trust |
Trust Overview
BlackRock Florida Municipal 2020 Term Trust’s (BFO) (the “Trust”) investment objectives are to provide current income exempt from regular U.S. federal income tax and Florida intangible personal property tax and to return $15.00 per common share (the initial offering price per share) to holders of common shares on or about December 31, 2020. The Trust seeks to achieve its investment objectives by investing at least 80% of its assets in municipal bonds exempt from U.S. federal income taxes (except that the interest may be subject to the federal alternative minimum tax) and Florida intangible personal property tax. The Trust invests at least 80% of its assets in municipal bonds that are investment grade quality, or are considered by the Trust’s investment adviser to be of comparable quality, at the time of investment. The Trust actively manages the maturity of its bonds to seek to have a dollar-weighted average effective maturity approximately equal to the Trust’s maturity date. The Trust may invest directly in such securities or synthetically through the use of derivatives. Effective January 1, 2007, the Florida intangible personal property tax was repealed.
There is no assurance that the Trust will achieve its investment objective of returning $15.00 per share.
On June 6, 2018, the Board of Trustees approved a proposal, effective December 31, 2018, to change the Trust’s fiscal year end from July 31 to December 31.
Trust Information
| | |
Symbol on New York Stock Exchange (“NYSE”) | | BFO |
Initial Offering Date | | September 30, 2003 |
Termination Date (on or about) | | December 31, 2020 |
Yield on Closing Market Price as of June 30, 2019($14.34)(a) | | 1.67% |
Tax Equivalent Yield(b) | | 2.82% |
Current Monthly Distribution per Common Share(c) | | $0.0200 |
Current Annualized Distribution per Common Share(c) | | $0.2400 |
| | (a) | Yield on closing market price is calculated by dividing the current annualized distribution per share by the closing market price. Past performance does not guarantee future results. | |
| | (b) | Tax equivalent yield assumes the maximum marginal U.S. federal tax rate of 40.80%, which includes the 3.8% Medicare tax. Actual tax rates will vary based on income, exemptions and deductions. Lower taxes will result in lower tax equivalent yields. | |
| | (c) | The distribution rate is not constant and is subject to change. | |
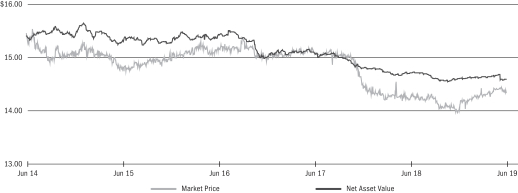
Market Price and Net Asset Value Per Share Summary
| | | | | | | | | | | | | | | | | | | | |
| | | 06/30/19 | | | 12/31/18 | | | Change | | | High | | | Low | |
Market Price | | $ | 14.34 | | | $ | 14.04 | | | | 2.14 | % | | $ | 14.44 | | | $ | 14.00 | |
Net Asset Value | | | 14.59 | | | | 14.60 | | | | (0.07 | ) | | | 14.68 | | | | 14.57 | |
Market Price and Net Asset Value History For the Past Five Years
| | |
| Trust Summary as of June 30, 2019 (continued) | | BlackRock Florida Municipal 2020 Term Trust |
Performance
Returns for thesix-month period ended June 30, 2019 were as follows:
| | | | | | | | |
| | | Returns Based On | |
| | | Market Price | | | NAV | |
BFO(a)(b) | | | 3.08 | % | | | 0.85 | % |
Lipper Other States Municipal Debt Funds(c) | | | 13.45 | | | | 6.54 | |
| | (a) | All returns reflect reinvestment of dividends and/or distributions at actual reinvestment prices. | |
| | (b) | The Trust’s discount to NAV narrowed during the period, which accounts for the difference between performance based on market price and performance based on NAV. | |
| | (c) | Average return. Returns reflect reinvestment of dividends and/or distributions at NAV on theex-dividend as calculated by Lipper. | |
Performance results may include adjustments made for financial reporting purposes in accordance with U.S. generally accepted accounting principles.
Past performance is not indicative of future results.
The following discussion relates to the Trust’s absolute performance based on NAV:
Since the Trust is scheduled to terminate on or about December 31, 2020, its holdings consist of short-term securities with minimal sensitivity to market movements. As a result, the Trust — while posting a small gain — did not keep pace with the overall municipal bond market. Because the Trust’s holdings experienced minimal price appreciation, its return was largely derived from income.
On a sector basis, utility and health care bonds made the largest contributions to returns. However, the Trust’s allocation to the development district sector lagged due to the underperformance of an individual security.
The negative amortization of the premiums on seasoned bonds was a drag on performance. (When a bond’s price trades at a premium over its face value, the difference is amortized over time. A premium occurs when the price of the bond has increased due to a decline in interest rates.)
Reinvestment had an adverse effect on the Trust’s income, as the proceeds of higher-yielding bonds that matured or were called needed to be reinvested at lower prevailing rates.
The yield curve is extremely flat within the18-month investment horizon, making variable-rate demand notes the most attractive option for reinvestment.
The views expressed reflect the opinions of BlackRock as of the date of this report and are subject to change based on changes in market, economic or other conditions. These views are not intended to be a forecast of future events and are no guarantee of future results.
Overview of the Trust’s Total Investments *
SECTOR ALLOCATION
| | | | | | | | |
| Sector | | 06/30/19 | | | 12/31/18 | |
Health | | | 29 | % | | | 31 | % |
Utilities | | | 24 | | | | 23 | |
County/City/Special District/School District | | | 12 | | | | 14 | |
Transportation | | | 15 | | | | 11 | |
State | | | 9 | | | | 10 | |
Corporate | | | 7 | | | | 7 | |
Education | | | 4 | | | | 4 | |
Housing(b) | | | — | | | | — | |
For Trust compliance purposes, the Trust’s sector classifications refer to one or more of the sector sub-classifications used by one or more widely recognized market indexes or rating group indexes, and/or as defined by the investment adviser. These definitions may not apply for purposes of this report, which may combine such sectorsub-classifications for reporting ease.
CALL/MATURITY SCHEDULE (d)
| | | | |
Calendar Year Ended December 31,
| | | | |
2019 | | | 31 | % |
2020 | | | 58 | |
2021 | | | 1 | |
2022 | | | 5 | |
| | (d) | Scheduled maturity dates and/or bonds that are subject to potential calls by issuers over the next five years. | |
| | * | Excludes short-term securities. | |
CREDIT QUALITY ALLOCATION (a)
| | | | | | | | |
| Credit Rating | | 06/30/19 | | | 12/31/18 | |
AAA/Aaa | | | 6 | % | | | 2 | % |
AA/Aa | | | 55 | | | | 61 | |
A | | | 24 | | | | 24 | |
BBB/Baa(b) | | | — | | | | — | |
BB/Ba | | | 1 | | | | — | |
B(b) | | | — | | | | — | |
N/R(c) | | | 14 | | | | 13 | |
| | (a) | For financial reporting purposes, credit quality ratings shown above reflect the highest rating assigned by either S&P Global Ratings (“S&P”) or Moody’s Investors Service (“Moody’s”) if ratings differ. These rating agencies are independent, nationally recognized statistical rating organizations and are widely used. Investment grade ratings are credit ratings of BBB/Baa or higher. Below investment grade ratings are credit ratings of BB/Ba or lower. Investments designated N/R are not rated by either rating agency. Unrated investments do not necessarily indicate low credit quality. Credit quality ratings are subject to change. | |
| | (b) | Represents less than 1% of the Trust’s total investments. | |
| | (c) | The investment adviser evaluates the credit quality of unrated investments based upon certain factors including, but not limited to, credit ratings for similar investments and financial analysis of sectors and individual investments. Using this approach, the investment adviser has deemed certain of these unrated securities as investment grade quality. As of June 30, 2019 and December 31, 2018, the market value of unrated securities deemed by the investment adviser to be investment grade each represents 2% of the Trust’s total investments. | |
| | |
| 6 | | 2019 BLACKROCK SEMI-ANNUAL REPORTTO SHAREHOLDERS |
| | |
| Trust Summary as of June 30, 2019 | | BlackRock Municipal 2020 Term Trust |
Investment Objective
BlackRock Municipal 2020 Term Trust’s (BKK) (the “Trust”) investment objectives are to provide current income exempt from regular U.S. federal income tax and to return $15.00 per Common Share (the initial public offering price per Common Share) to holders of Common Shares on or about December 31, 2020. The Trust seeks to achieve its investment objectives by investing, under normal market conditions, at least 80% of its managed assets in municipal bonds that pay interest that is exempt from U.S. federal income taxes (except that the interest may be subject to the U.S. federal alternative minimum tax). The Trust invests, under normal market conditions, at least 80% of its managed assets in municipal bonds that are investment grade, or if unrated, deemed to be of comparable quality by the investment adviser, at the time of investment. The Trust may invest directly in such securities or synthetically through the use of derivatives. No assurance can be given that the Trust will achieve its investment objectives, including its objective of returning $15.00 per Common Share.
On June 6, 2018, the Board of Trustees approved a proposal, effective December 31, 2018, to change the Trust’s fiscal year end from April 30 to December 31.
Trust Information
| | |
Symbol on NYSE | | BKK |
Initial Offering Date | | September 30, 2003 |
Termination Date (on or about) | | December 31, 2020 |
Yield on Closing Market Price as of June 30, 2019($15.05)(a) | | 2.54% |
Tax Equivalent Yield(b) | | 4.29% |
Current Monthly Distribution per Common Share(c) | | $0.0318 |
Current Annualized Distribution per Common Share(c) | | $0.3816 |
| | (a) | Yield on closing market price is calculated by dividing the current annualized distribution per share by the closing market price. Past performance does not guarantee future results. | |
| | (b) | Tax equivalent yield assumes the maximum marginal U.S. federal tax rate of 40.8%, which includes the 3.8% Medicare tax. Actual tax rates will vary based on income, exemptions and deductions. Lower taxes will result in lower tax equivalent yields. | |
| | (c) | The monthly distribution per Common Share, declared on July 1, 2019 was decreased to $0.0288 per share. The yield on closing market price, tax equivalent yield, current monthly distribution per Common Share, and current annualized distribution per Common Share do not reflect the new distribution rate. The new distribution rate is subject to change in the future. | |
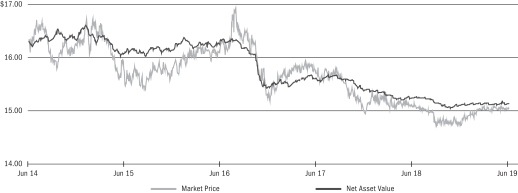
Market Price and Net Asset Value Per Share Summary
| | | | | | | | | | | | | | | | | | | | |
| | | 06/30/19 | | | 12/31/18 | | | Change | | | High | | | Low | |
Market Price | | $ | 15.05 | | | $ | 14.76 | | | | 1.96 | % | | $ | 15.12 | | | $ | 14.76 | |
Net Asset Value | | | 15.14 | | | | 15.12 | | | | 0.13 | | | | 15.19 | | | | 15.11 | |
Market Price and Net Asset Value History For the Past Five Years
| | |
| Trust Summary as of June 30, 2019 (continued) | | BlackRock Municipal 2020 Term Trust |
Performance
Returns for thesix-month period ended June 30, 2019 were as follows:
| | | | | | | | |
| | | Returns Based On | |
| | | Market Price | | | NAV | |
BKK(a)(b) | | | 3.26 | % | | | 1.41 | % |
Lipper Intermediate Municipal Debt Funds(c) | | | 9.38 | | | | 4.91 | |
| | (a) | All returns reflect reinvestment of dividends and/or distributions at actual reinvestment prices. | |
| | (b) | The Trust’s discount to NAV narrowed during the period, which accounts for the difference between performance based on market price and performance based on NAV. | |
| | (c) | Average return. Returns reflect reinvestment of dividends and/or distributions at NAV on theex-dividend as calculated by Lipper. | |
Performance results may include adjustments made for financial reporting purposes in accordance with U.S. generally accepted accounting principles.
Past performance is not indicative of future results.
The following discussion relates to the Trust’s absolute performance based on NAV:
Since the Trust is scheduled to terminate on or about December 31, 2020, its holdings consist of short-term securities with minimal sensitivity to market movements. As a result, the Trust — while posting a small gain — did not keep pace with the overall municipal bond market. Because the Trust’s holdings experienced minimal price appreciation, its return was largely derived from income.
At the sector level, positions in the statetax-backed, health care and corporate sectors bonds made the largest contributions to the Trust’s returns.
The negative amortization of the premiums on seasoned bonds was a drag on performance. (When a bond’s price trades at a premium over its face value, the difference is amortized over time. A premium occurs when the price of the bond has increased due to a decline in interest rates.)
Reinvestment had an adverse effect on the Trust’s income, as the proceeds of higher-yielding bonds that matured or were called needed to be reinvested at lower prevailing rates.
The yield curve is extremely flat within the18-month investment horizon, making variable-rate demand notes the most attractive option for reinvestment.
The views expressed reflect the opinions of BlackRock as of the date of this report and are subject to change based on changes in market, economic or other conditions. These views are not intended to be a forecast of future events and are no guarantee of future results.
Overview of the Trust’s Total Investments *
SECTOR ALLOCATION
| | | | | | | | |
| Sector | | 06/30/19 | | | 12/31/18 | |
Transportation | | | 17 | % | | | 22 | % |
Utilities | | | 17 | | | | 18 | |
State | | | 18 | | | | 15 | |
Health | | | 12 | | | | 13 | |
County/City/Special District/School District | | | 11 | | | | 11 | |
Education | | | 11 | | | | 10 | |
Corporate | | | 6 | | | | 4 | |
Tobacco | | | 4 | | | | 4 | |
Housing | | | 4 | | | | 3 | |
For Trust compliance purposes, the Trust’s sector classifications refer to one or more of the sector subclassifications used by one or more widely recognized market indexes or rating group indexes, and/or as defined by the investment adviser. These definitions may not apply for purposes of this report, which may combine such sector subclassifications for reporting ease.
CALL/MATURITY SCHEDULE (c)
| | | | |
Calendar Year Ended December 31, | | | | |
2019 | | | 19 | % |
2020 | | | 61 | |
2021 | | | 6 | |
2022 | | | 7 | |
| | (c) | Scheduled maturity dates and/or bonds that are subject to potential calls by issuers over the next five years. | |
| | * | Excludes short-term securities. | |
CREDIT QUALITY ALLOCATION (a)
| | | | | | | | |
| Credit Rating | | 06/30/19 | | | 12/31/18 | |
AAA/Aaa | | | 7 | % | | | 6 | % |
AA/Aa | | | 32 | | | | 30 | |
A | | | 32 | | | | 32 | |
BBB/Baa | | | 14 | | | | 17 | |
BB/Ba | | | 6 | | | | 5 | |
N/R(b) | | | 9 | | | | 10 | |
| | (a) | For financial reporting purposes, credit quality ratings shown above reflect the highest rating assigned by either S&P or Moody’s Investors Service (“Moody’s”) if ratings differ. These rating agencies are independent, nationally recognized statistical rating organizations and are widely used. Investment grade ratings are credit ratings of BBB/Baa or higher. Below investment grade ratings are credit ratings of BB/Ba or lower. Investments designated N/R are not rated by either rating agency. Unrated investments do not necessarily indicate low credit quality. Credit quality ratings are subject to change. | |
| | (b) | The investment adviser evaluates the credit quality of unrated investments based upon certain factors including, but not limited to, credit ratings for similar investments and financial analysis of sectors and individual investments. Using this approach, the investment adviser has deemed certain of these unrated securities as investment grade quality. As of June 30, 2019 and December 31, 2018, the market value of unrated securities deemed by the investment adviser to be investment grade each represents 1% of the Trust’s total investments. | |
| | |
| 8 | | 2019 BLACKROCK SEMI-ANNUAL REPORTTO SHAREHOLDERS |
| | |
Schedule of Investments (unaudited) June 30, 2019 | | BlackRock Florida Municipal 2020 Term Trust (BFO) (Percentages shown are based on Net Assets) |
| | | | | | | | |
| Security | | Par
(000) | | | Value | |
|
Municipal Bonds — 99.2% | |
|
Florida — 97.4% | |
|
| Corporate — 6.6% | |
Citizens Property Insurance Corp., RB, Senior Secured, SeriesA-1, 5.00%, 06/01/20 | | $ | 3,140 | | | $ | 3,243,557 | |
County of Palm Beach Florida Solid Waste Authority, Refunding RB, 5.00%, 10/01/20 | | | 2,000 | | | | 2,088,080 | |
| | | | | | | | |
| | | | | | | 5,331,637 | |
|
| County/City/Special District/School District — 12.3% | |
City of Jacksonville Florida, RB, Series B, 5.00%, 10/01/20 | | | 760 | | | | 792,870 | |
City of Jacksonville Florida, Refunding RB, Brooks Rehabilitation Project, 5.00%, 11/01/20 | | | 400 | | | | 417,816 | |
County of Broward Florida School Board, COP, Refunding, Series A, 5.00%, 07/01/20 | | | 2,000 | | | | 2,072,640 | |
Indian River County School Board, COP, Refunding, Series A, 5.00%, 07/01/20 | | | 1,000 | | | | 1,035,290 | |
Miami-Dade County School Board Foundation, Inc., COP, Refunding, Series A, 5.00%, 05/01/20 | | | 1,250 | | | | 1,287,012 | |
Palm Beach County School District, COP, Refunding Series B, 5.00%, 08/01/20 | | | 3,000 | | | | 3,119,430 | |
Stevens Plantation Florida Imports Project Dependent Special District, RB, 6.38%, 05/01/13(a)(b)(c) | | | 2,425 | | | | 1,206,438 | |
| | | | | | | | |
| | | | | | | 9,931,496 | |
|
| Education — 4.2% | |
City of Tampa Florida, Refunding RB, Florida Revenue, The University of Tampa Project, 5.00%, 04/01/20 | | | 795 | | | | 815,742 | |
Florida Atlantic University Traffic and Parking Services Revenue, Refunding RB, Series A, 5.00%, 07/01/20 | | | 1,150 | | | | 1,189,962 | |
Florida State Higher Educational Facilities Financial Authority, Refunding RB, University of Tampa Project, Series A, 5.00%, 04/01/20 | | | 1,000 | | | | 1,026,090 | |
Volusia County School Board, COP, Refunding Series A (BAM), 5.00%, 08/01/20 | | | 350 | | | | 363,717 | |
| | | | | | | | |
| | | | | | | 3,395,511 | |
|
| Health — 29.2% | |
County of Brevard Florida Health Facilities Authority, Refunding RB, 5.00%, 04/01/20 | | | 500 | | | | 513,350 | |
County of Highlands Florida Health Facilities Authority, Refunding RB, Adventist Health: | | | | | | | | |
Hospital, Series I, 5.00%, 11/15/20 | | | 2,155 | | | | 2,184,071 | |
VRDN, System, 1.85%, 11/15/33(d) | | | 3,500 | | | | 3,500,000 | |
County of Orange Florida Health Facilities Authority, RB, VRDN, SeriesC-1, 1.83%, 01/01/39(d) | | | 850 | | | | 850,000 | |
County of Palm Beach Florida Health Facilities Authority, Refunding RB: | | | | | | | | |
Acts Retirement-Life Communities, Inc., 4.00%, 11/15/20 | | | 2,000 | | | | 2,056,180 | |
Acts Retirement-Life Communities, Inc., 5.00%, 11/15/22 | | | 3,735 | | | | 4,049,524 | |
Bethesda Healthcare System Project, Series A (AGM), 5.00%, 07/01/20(f) | | | 1,285 | | | | 1,331,376 | |
County of Pinellas Health Facilities Authority, Refunding RB, VRDN, Baycare Health System Issue, Series A1 (US BANK NA LOC), 1.90%, 11/01/38(d) | | | 3,500 | | | | 3,500,000 | |
County of Sarasota Public Hospital District, Refunding RB, VRDN, Sarasota Memorial Hospital, Series B, 1.85%, 07/01/37(d) | | | 2,530 | | | | 2,530,000 | |
Halifax Hospital Medical Center, Refunding RB, 5.00%, 06/01/20 | | | 590 | | | | 607,688 | |
Miami Beach Health Facilities Authority, Refunding RB, 5.00%, 11/15/20 | | | 150 | | | | 156,744 | |
South Miami Health Facilities Authority, Refunding RB, Baptist Health South Florida Obligated Group, 5.00%, 08/15/20 | | | 2,250 | | | | 2,340,990 | |
| | | | | | | | |
| | | | | | | 23,619,923 | |
| | | | | | | | |
| Security | | Par
(000) | | | Value | |
|
| Housing — 0.1% | |
County of Lee Florida HFA, RB, S/F Housing, Multi-County Program, SeriesA-2, AMT (Ginnie Mae, Fannie Mae & Freddie Mac), 6.00%, 09/01/40 | | $ | 45 | | | $ | 46,165 | |
County of Manatee Florida HFA, RB, S/F Housing, Series A, AMT (Ginnie Mae, Fannie Mae & Freddie Mac), 5.90%, 09/01/40 | | | 55 | | | | 56,417 | |
| | | | | | | | |
| | | | | | | 102,582 | |
|
| State — 8.9% | |
Florida Municipal Loan Council, RB, : | | | | | | | | |
5.00%, 10/01/19 | | | 1,050 | | | | 1,059,460 | |
4.00%, 10/01/20 | | | 1,105 | | | | 1,140,802 | |
4.00%, 10/01/21 | | | 500 | | | | 528,640 | |
Florida Municipal Loan Council, Refunding RB: | | | | | | | | |
CAB, Series A (NPFGC), 0.00%, 04/01/20(e) | | | 730 | | | | 720,328 | |
SeriesB-2 (GTD), 4.00%, 10/01/20 | | | 655 | | | | 675,888 | |
State of Florida Department of Environmental Protection, Refunding RB, Series A, 5.00%, 07/01/20 | | | 3,000 | | | | 3,108,840 | |
| | | | | | | | |
| | | | | | | 7,233,958 | |
|
| Transportation — 14.1% | |
City of Jacksonville Florida Port Authority, Refunding RB, AMT, 4.00%, 11/01/20 | | | 865 | | | | 891,209 | |
County of Broward Florida Fuel System, RB, Lauderdale Fuel Facilities, Series A (AGM), AMT, 5.00%, 04/01/20 | | | 160 | | | | 163,450 | |
County of Broward Florida Port Facilities, Refunding RB, Series B, AMT, 5.00%, 09/01/20 | | | 2,500 | | | | 2,599,100 | |
County of Miami-Dade Florida, Refunding RB, Series A, AMT, 5.00%, 10/01/20 | | | 1,375 | | | | 1,434,262 | |
County of Miami-Dade Florida Expressway Authority, Refunding RB, Toll System, Series A, 5.00%, 07/01/20 | | | 1,500 | | | | 1,549,395 | |
County of Miami-Dade Florida Transit System Sales Surtax, Refunding RB, 5.00%, 07/01/20 | | | 550 | | | | 569,905 | |
Florida Development Finance Corp., RB, Virgin Trains USA Passenger Rail Project, AMT, 1.90%, 01/01/49(d) | | | 3,000 | | | | 3,000,033 | |
Greater Orlando Aviation Authority, Refunding RB, Series C, 5.00%, 10/01/20 | | | 1,130 | | | | 1,181,087 | |
| | | | | | | | |
| | | | | | | 11,388,441 | |
|
| Utilities — 22.0% | |
City of Fort Lauderdale Florida Water & Sewer Revenue, Refunding RB, 5.00%, 09/01/20 | | | 2,970 | | | | 3,098,245 | |
City of Gainesville Florida Utilities System Revenue, Refunding RB, VRDN, Series B, 1.95%, 10/01/42(d) | | | 3,455 | | | | 3,455,000 | |
City of Miami Beach Florida, RB, 5.00%, 09/01/20 | | | 250 | | | | 260,210 | |
City of North Miami Florida Beach Water Revenue, RB, 5.00%, 08/01/20 | | | 1,200 | | | | 1,245,684 | |
County of Miami-Dade Florida Water & Sewer System, Refunding RB, Series B (AGM), 5.25%, 10/01/19 | | | 4,000 | | | | 4,039,120 | |
Florida Governmental Utility Authority, RB, Golden Gate Utility System (AGM), 0.00%, 07/01/19 | | | 510 | | | | 510,158 | |
Florida Governmental Utility Authority, Refunding RB (AGM): | | | | | | | | |
4.00%, 10/01/20 | | | 500 | | | | 515,785 | |
Lehigh Utility, 5.00%, 10/01/20 | | | 635 | | | | 662,864 | |
Florida Municipal Power Agency, RB, 5.00%, 10/01/20 | | | 500 | | | | 522,400 | |
Orlando Florida Utilities Commission, RB, VRDN, Series 2, 1.90%, 10/01/33(d) | | | 1,700 | | | | 1,700,000 | |
Orlando Florida Utilities Commission, Refunding RB, VRDN, Series B (TD Bank NA SBPA), 1.82%, 10/01/39(d) | | | 1,300 | | | | 1,300,000 | |
Town of Davie Florida, Refunding RB, Nova Southeastern University Project, Series B, 5.00%, 04/01/20 | | | 530 | | | | 542,847 | |
| | | | | | | | |
| | | | | | | 17,852,313 | |
| | | | | | | | |
| |
Total Municipal Bonds in Florida | | | | 78,855,861 | |
| | | | | |
| | | | |
| SCHEDULES OF INVESTMENTS | | | 9 | |
| | |
Schedule of Investments (unaudited) (continued) June 30, 2019 | | BlackRock Florida Municipal 2020 Term Trust (BFO) (Percentages shown are based on Net Assets) |
| | | | | | | | |
| Security | | Par
(000) | | | Value | |
|
Georgia — 0.6% | |
|
| Utilities — 0.6% | |
Main Street Natural Gas, Inc., RB, Series A, 5.00%, 05/15/20 | | $ | 500 | | | $ | 514,095 | |
| | | | | | | | |
|
Guam — 0.5% | |
|
| Utilities — 0.5% | |
Guam Government Waterworks Authority, RB, 5.25%, 07/01/20 | | | 100 | | | | 103,031 | |
Guam Power Authority, Refunding RB, Series A (AGM), 5.00%, 10/01/20 | | | 310 | | | | 322,927 | |
| | | | | | | | |
| |
Total Municipal Bonds in Guam | | | | 425,958 | |
| | | | | |
|
Texas — 0.7% | |
|
| Transportation — 0.7% | |
City of Houston Texas Airport System Revenue, Refunding RB, SeriesB-2, AMT, 5.00%, 07/15/20 | | | 500 | | | | 515,140 | |
| | | | | | | | |
| |
Total Municipal Bonds — 99.2%
(Cost — $80,807,492) | | | | 80,311,054 | |
| | | | | |
| |
Total Investments — 99.2%
(Cost — $80,807,492) | | | | 80,311,054 | |
| |
Other Assets Less Liabilities — 0.8% | | | | 621,855 | |
| | | | | |
| |
Net Assets Applicable to Common Shares — 100.0% | | | $ | 80,932,909 | |
| | | | | |
| (a) | Issuer filed for bankruptcy and/or is in default. |
| (b) | Non-income producing security. |
| (c) | Security is valued using significant unobservable inputs and is classified as Level 3 in the fair value hierarchy. |
| (d) | Variable or floating rate security, which interest rate adjusts periodically based on changes in current interest rates and prepayments on the underlying pool of assets. Rate shown is the rate in effect as of period end. |
| (f) | Security is collateralized by municipal bonds or U.S. Treasury obligations. |
During the six months ended June 30, 2019, investments in issuers considered to be an affiliate/affiliates of the Trust for purposes of Section 2(a)(3) of the Investment Company Act of 1940, as amended, were as follows:
| | | | | | | | | | | | | | | | | | | | | | | | | | | | |
| Affiliate | | Shares
Held at
12/31/18 | | | Net
Activity | | | Shares
Held at
06/30/19 | | | Value at
06/30/19 | | | Income | | | Net
Realized
Gain (Loss) (a) | | | Change in
Unrealized
Appreciation
(Depreciation) | |
BlackRock Liquidity Funds, MuniCash, Institutional Class* | | | 591,057 | | | | (591,057 | ) | | | — | | | $ | — | | | $ | 11,339 | | | $ | (188 | ) | | $ | — | |
| | | | | | | | | | | | | | | | | | | | | | | | | | | | |
| | (a) | Includes net capital gain distributions, if applicable. | |
| | * | As of period end, the entity is no longer held by the Fund. | |
For Trust compliance purposes, the Trust’s sector classifications refer to one or more of the sectorsub-classifications used by one or more widely recognized market indexes or rating group indexes, and/or as defined by the investment adviser. These definitions may not apply for purposes of this report, which may combine such sectorsub-classifications for reporting ease.
Fair Value Hierarchy as of Period End
Various inputs are used in determining the fair value of investments. For information about the Trust’s policy regarding valuation of investments, refer to the Notes to Financial Statements.
The following table summarizes the Trust’s investments categorized in the disclosure hierarchy:
| | | | | | | | | | | | | | | | |
| | | Level 1 | | | Level 2 | | | Level 3 | | | Total | |
Assets: | | | | | | | | | | | | | | | | |
Investments: | | | | | | | | | | | | | | | | |
Long-Term Investments(a) | | $ | — | | | $ | 79,104,616 | | | $ | 1,206,438 | | | $ | 80,311,054 | |
| | | | | | | | | | | | | | | | |
| | $ | — | | | $ | 79,104,616 | | | $ | 1,206,438 | | | $ | 80,311,054 | |
| | | | | | | | | | | | | | | | |
| | (a) | See above Schedule of Investments for values in each sector. | |
The Fund’s investments that are categorized as Level 3 were valued utilizing third party pricing information without adjustment. Such valuations are based on unobservable inputs. A significant change in third party information could result in a significantly lower or higher value of such Level 3 investments.
| | |
| 10 | | 2019 BLACKROCK SEMI-ANNUAL REPORTTO SHAREHOLDERS |
| | |
Schedule of Investments (unaudited) (continued) June 30, 2019 | | BlackRock Florida Municipal 2020 Term Trust (BFO) |
A reconciliation of Level 3 investments is presented when the Fund had a significant amount of Level 3 investments at the beginning and/or end of the year in relation to net assets. The following table is a reconciliation of Level 3 investments for which significant unobservable inputs were used in determining fair value:
| | | | |
| | | Corporate
Bonds | |
Assets: | | | | |
Opening Balance, as of December 31, 2018 | | $ | — | |
Transfers into Level 3(a) | | | 1,697,500 | |
Transfers out of Level 3 | | | — | |
Accrued discounts/premiums | | | — | |
Net realized gain (loss) | | | — | |
Net change in unrealized appreciation (depreciation)(b)(c) | | | (491,062 | ) |
Purchases | | | — | |
Sales | | | — | |
| | | | |
Closing Balance as of June 30, 2019 | | $ | 1,206,438 | |
| | | | |
Net change in unrealized appreciation (depreciation) on investments held as of June 30, 2019(b) | | $ | (491,062 | ) |
| | | | |
| | (a) | As of January 1, 2019, the Fund used observable inputs in determining the value of certain investments. As of June 30, 2019, the Fund used significant unobservable inputs in determining the value of the same investments. As a result, investments at beginning of period value were transferred from Level 2 to Level 3 in the disclosure hierarchy. | |
| | (b) | Included in the related net change in unrealized appreciation (depreciation) in the Statement of Operations. | |
| | (c) | Any difference between net change in unrealized appreciation (depreciation) and net change in unrealized appreciation (depreciation) on instruments still held at June 30, 2019 is generally due to instruments no longer held or categorized as Level 3 at period end. | |
See notes to financial statements.
| | | | |
| SCHEDULES OF INVESTMENTS | | | 11 | |
| | |
Schedule of Investments (unaudited) June 30, 2019 | | BlackRock Municipal 2020 Term Trust (BKK) (Percentages shown are based on Net Assets) |
| | | | | | | | |
| Security | | Par
(000) | | | Value | |
|
Municipal Bonds — 95.9% | |
|
| Alabama — 0.4% | |
Alabama 21st Century Authority Tobacco Settlement, Refunding RB, Series A, 5.00%, 06/01/20 | | $ | 1,000 | | | $ | 1,030,040 | |
Tuscaloosa City Board of Education, RB, 5.00%, 08/01/20 | | | 225 | | | | 233,705 | |
| | | | | | | | |
| | | | | | | 1,263,745 | |
|
| Alaska — 2.0% | |
City of Valdez Alaska, Refunding RB, BP Pipelines Project: | | | | | | | | |
Series B, 5.00%, 01/01/21 | | | 3,200 | | | | 3,365,760 | |
Series C, 5.00%, 01/01/21 | | | 2,500 | | | | 2,629,450 | |
| | | | | | | | |
| | | | | | | 5,995,210 | |
|
| Arizona — 2.7% | |
City of Phoenix Arizona IDA, RB, Series A, 4.75%, 07/01/19(a) | | | 180 | | | | 180,020 | |
Phoenix Civic Improvement Corp., Refunding RB, : | | | | | | | | |
5.00%, 07/01/19(b) | | | 5,585 | | | | 5,585,000 | |
5.00%, 07/01/20 | | | 1,300 | | | | 1,348,061 | |
Salt Verde Financial Corp., RB, Senior, 5.25%, 12/01/20 | | | 1,000 | | | | 1,049,490 | |
| | | | | | | | |
| | | | | | | 8,162,571 | |
|
| California — 5.4% | |
California Health Facilities Financing Authority, RB, Sutter Health, Series B, 5.00%, 08/15/20(b) | | | 815 | | | | 850,102 | |
Los Angeles California Unified School District, GO, Series I, 5.00%, 07/01/20 | | | 3,750 | | | | 3,751,163 | |
Los Angeles Regional Airports Improvement Corp. Facilities Lease, Refunding RB, LAXFuel Corp., Los Angeles International Airport, AMT, 5.00%, 01/01/20 | | | 550 | | | | 559,460 | |
State of California, GO, Refunding, Various Purpose, 5.25%, 10/01/22 | | | 1,000 | | | | 1,129,260 | |
State of California Department of Water Resources, Refunding RB, Series L, 5.00%, 05/01/20 | | | 10,000 | | | | 10,319,600 | |
| | | | | | | | |
| | | | | | | 16,609,585 | |
|
| Colorado — 1.2% | |
Adams & Arapahoe Joint School District 28J Aurora, GO, Refunding: | | | | | | | | |
Series A, 5.00%, 12/01/20 | | | 690 | | | | 725,583 | |
Series B, 5.00%, 12/01/20 | | | 1,335 | | | | 1,403,846 | |
Centerra Metropolitan District No. 1, Tax Allocation Bonds, 2.70%, 12/01/19(a) | | | 268 | | | | 268,217 | |
Colorado Educational & Cultural Facilities Authority, Refunding RB, : | | | | | | | | |
4.00%, 08/15/19 | | | 125 | | | | 125,359 | |
4.00%, 08/15/20 | | | 150 | | | | 153,945 | |
Colorado Health Facilities Authority, Refunding RB,(c): | | | | | | | | |
4.00%, 12/01/19 | | | 555 | | | | 559,795 | |
4.00%, 12/01/20 | | | 580 | | | | 596,478 | |
| | | | | | | | |
| | | | | | | 3,833,223 | |
|
| Florida — 2.9% | |
County of Escambia Florida, RB, Gulf Power Co. Project, 1.80%, 04/01/39(d) | | | 2,500 | | | | 2,492,075 | |
County of Miami-Dade Florida, Refunding RB, Series A, AMT, 5.00%, 10/01/20 | | | 1,375 | | | | 1,434,262 | |
County of Miami-Dade Florida Expressway Authority, Refunding RB, Toll System, Series A, 5.00%, 07/01/20 | | | 500 | | | | 516,465 | |
Florida Development Finance Corp., RB, Virgin Trains USA Passenger Rail Project, Series A, AMT,
1.90%, 01/01/49(d) | | | 3,050 | | | | 3,050,034 | |
Stevens Plantation Community Development District, Special Assessment Bonds, Series B, 6.38%, 05/01/13(e)(f)(g) | | | 2,980 | | | | 1,482,550 | |
| | | | | | | | |
| | | | | | | 8,975,386 | |
| | | | | | | | |
| Security | | Par
(000) | | | Value | |
|
| Georgia — 2.2% | |
Gainesville & Hall County Development Authority, Refunding RB, Acts Retirement—Life Communities, Inc. Obligated Group, 5.00%, 11/15/22 | | $ | 6,240 | | | $ | 6,717,110 | |
| | | | | | | | |
|
| Guam — 0.5% | |
Guam Government Waterworks Authority, RB, 5.25%, 07/01/20 | | | 250 | | | | 257,578 | |
Guam Power Authority, Refunding RB, Series A (AGM), 5.00%, 10/01/20 | | | 1,190 | | | | 1,239,623 | |
| | | | | | | | |
| | | | | | | 1,497,201 | |
|
| Hawaii — 0.9% | |
State of Hawaii Department of Budget & Finance, Refunding RB, : | | | | | | | | |
5.00%, 11/15/19 | | | 1,275 | | | | 1,290,810 | |
5.00%, 11/15/20 | | | 1,440 | | | | 1,504,930 | |
| | | | | | | | |
| | | | | | | 2,795,740 | |
|
| Illinois — 12.0% | |
Chicago Transit Authority, Refunding RB, 5.00%, 06/01/20 | | | 1,000 | | | | 1,028,750 | |
City of Chicago Illinois Motor Fuel Tax Revenue, Refunding RB, 5.00%, 01/01/20 | | | 1,000 | | | | 1,011,370 | |
City of Chicago Illinois Waterworks Revenue, Refunding RB, 2nd Lien (AGM), 5.00%, 11/01/20 | | | 960 | | | | 962,035 | |
Lake Cook-Dane & McHenry Counties Community Unit School District 220 Illinois, GO, Refunding, (AGM), 5.25%, 12/01/20 | | | 1,000 | | | | 1,053,740 | |
Metropolitan Pier & Exposition Authority, Refunding RB, CAB, McCormick, Series A (NPFGC), 0.00%, 06/15/22(h) | | | 13,455 | | | | 12,550,690 | |
Railsplitter Tobacco Settlement Authority, RB, 5.25%, 06/01/20 | | | 10,000 | | | | 10,326,800 | |
State of Illinois, GO, 5.00%, 07/01/20 | | | 4,055 | | | | 4,184,476 | |
State of Illinois, RB, Series B, 5.00%, 06/15/20 | | | 1,485 | | | | 1,488,594 | |
State of Illinois Finance Authority, Refunding RB, Presence Health Network, Series C, 5.00%, 02/15/20 | | | 4,145 | | | | 4,235,485 | |
| | | | | | | | |
| | | | | | | 36,841,940 | |
|
| Indiana — 0.4% | |
Indiana Municipal Power Agency, Refunding RB, Series A, 5.00%, 01/01/21 | | | 600 | | | | 632,304 | |
Northern Indiana Commuter Transportation District, RB, 5.00%, 07/01/20 | | | 620 | | | | 641,179 | |
| | | | | | | | |
| | | | | | | 1,273,483 | |
|
| Kansas — 1.5% | |
County of Wyandotte Kansas, Kansas City Unified Government, RB, Kansas International Speedway (NPFGC), 0.00%, 12/01/20(h) | | | 2,080 | | | | 1,985,505 | |
Kansas Development Finance Authority, Refunding RB, : | | | | | | | | |
5.25%, 11/15/19(b) | | | 55 | | | | 55,785 | |
5.25%, 11/15/20 | | | 2,445 | | | | 2,478,888 | |
| | | | | | | | |
| | | | | | | 4,520,178 | |
|
| Kentucky — 1.6% | |
County of Louisville & Jefferson Kentucky, Refunding RB, : | | | | | | | | |
3.50%, 12/01/20 | | | 2,115 | | | | 2,167,981 | |
5.00%, 12/01/20 | | | 1,430 | | | | 1,495,665 | |
Kentucky Public Transportation Infrastructure Authority, RB,(h): | | | | | | | | |
0.00%, 07/01/19 | | | 255 | | | | 254,949 | |
0.00%, 07/01/20 | | | 1,000 | | | | 976,030 | |
| | | | | | | | |
| | | | | | | 4,894,625 | |
|
| Louisiana — 1.8% | |
Louisiana Public Facilities Authority, RB, VRDN, Air Products & Chemicals Project, 1.47%, 08/01/50(d) | | | 5,500 | | | | 5,500,000 | |
| | | | | | | | |
| | |
| 12 | | 2019 BLACKROCK SEMI-ANNUAL REPORTTO SHAREHOLDERS |
| | |
Schedule of Investments (unaudited) (continued) June 30, 2019 | | BlackRock Municipal 2020 Term Trust (BKK) (Percentages shown are based on Net Assets) |
| | | | | | | | |
| Security | | Par
(000) | | | Value | |
|
| Maryland — 1.4% | |
City of Baltimore Maryland, Refunding, Tax Allocation Bonds, 5.00%, 06/15/20 | | $ | 275 | | | $ | 283,635 | |
County of Anne Arundel Maryland Consolidated Special Taxing District, Refunding, : | | | | | | | | |
4.00%, 07/01/19 | | | 285 | | | | 285,063 | |
5.00%, 07/01/20 | | | 500 | | | | 518,320 | |
Maryland Economic Development Corp., RB, Transportation Facilities Project, Series A, 5.13%, 06/01/20(c) | | | 395 | | | | 407,897 | |
Maryland EDC, Refunding RB, University of Maryland, College Park Projects (AGM), 4.00%, 06/01/20 | | | 640 | | | | 654,976 | |
Maryland Health & Higher Educational Facilities Authority, Refunding RB: | | | | | | | | |
Charlestown Community, 5.50%, 01/01/21(c) | | | 1,335 | | | | 1,412,964 | |
University of Maryland, Medical System, 5.00%, 07/01/19 | | | 670 | | | | 670,201 | |
| | | | | | | | |
| | | | | | | 4,233,056 | |
|
| Massachusetts — 3.5% | |
Massachusetts Bay Transportation Authority, Refunding RB, VRDN, General Transportation System, SeriesA-1, 1.65%, 03/01/30(d) | | | 9,600 | | | | 9,600,000 | |
Massachusetts Educational Financing Authority, RB, Education Loan, Issue I, AMT, 5.00%, 01/01/20 | | | 1,000 | | | | 1,016,110 | |
| | | | | | | | |
| | | | | | | 10,616,110 | |
|
| Michigan — 4.4% | |
City of Detroit Michigan, GO, Unlimited Tax, 5.00%, 04/01/20 | | | 1,000 | | | | 1,015,270 | |
City of Royal Oak Michigan Hospital Finance Authority, Refunding RB, Series D, 2.25%, 09/01/20 | | | 1,500 | | | | 1,514,010 | |
Kalamazoo Hospital Finance Authority, Refunding RB, Bronson Methodist Hospital, 5.00%, 05/15/20 | | | 565 | | | | 581,492 | |
Lansing Board of Water & Light Utilities, RB, Series A, 3.50%, 07/01/20 | | | 1,000 | | | | 1,022,090 | |
Michigan Finance Authority, Refunding RB, : | | | | | | | | |
5.00%, 11/01/19 | | | 1,940 | | | | 1,960,389 | |
5.00%, 11/01/20 | | | 1,800 | | | | 1,874,700 | |
Saginaw Valley State University, Refunding RB, General, Series A, 5.00%, 07/01/20 | | | 1,000 | | | | 1,035,360 | |
State of Michigan Building Authority, Refunding RB, Facilities Program: | | | | | | | | |
Series1-A, 5.00%, 10/15/20 | | | 325 | | | | 340,048 | |
Series2-A, 4.00%, 10/15/20 | | | 1,205 | | | | 1,246,151 | |
State of Michigan Trunk Line Revenue, Refunding RB: | | | | | | | | |
5.00%, 11/01/20 | | | 1,000 | | | | 1,012,250 | |
5.00%, 11/01/21 | | | 2,000 | | | | 2,024,420 | |
| | | | | | | | |
| | | | | | | 13,626,180 | |
|
| Minnesota — 2.4% | |
Minnesota Housing Finance Agency, Refunding RB, VRDN, S/F, Residential Housing Finance (Ginnie Mae, Fannie Mae & Freddie Mac), 1.49%, 01/01/42(d) | | | 7,500 | | | | 7,500,000 | |
| | | | | | | | |
|
| Mississippi — 0.3% | |
Mississippi Development Bank, Refunding RB, Series A (AGM), 5.00%, 03/01/20 | | | 1,035 | | | | 1,057,749 | |
| | | | | | | | |
|
| Missouri — 1.2% | |
City of Kansas City Missouri Airport, Refunding RB, Series A, AMT, 5.00%, 09/01/20 | | | 3,000 | | | | 3,118,110 | |
State of Missouri Health & Educational Facilities Authority, Refunding RB, CoxHealth, Series A, 5.00%, 11/15/20 | | | 500 | | | | 524,340 | |
| | | | | | | | |
| | | | | | | 3,642,450 | |
|
| Nebraska — 1.2% | |
Central Plains Nebraska Energy Project, RB, Gas Project No. 3, 5.00%, 09/01/20 | | | 3,500 | | | | 3,626,630 | |
| | | | | | | | |
| | | | | | | | |
| Security | | Par
(000) | | | Value | |
|
| Nevada — 2.1% | |
County of Clark Nevada, Refunding, Special Assessment Bonds, Special Improvement District No. 142, 5.00%, 08/01/20 | | $ | 1,075 | | | $ | 1,104,616 | |
County of Clark Nevada Department of Aviation, Refunding ARB, : | | | | | | | | |
5.00%, 07/01/19 | | | 500 | | | | 500,150 | |
5.00%, 07/01/20 | | | 1,000 | | | | 1,036,250 | |
Washoe County School District, GO, School Improvement, Series C, 5.00%, 10/01/20 | | | 3,695 | | | | 3,858,356 | |
| | | | | | | | |
| | | | | | | 6,499,372 | |
|
| New Jersey — 7.3% | |
County of Atlantic New Jersey, GO, Refunding, (BAM), 3.00%, 10/01/20 | | | 2,740 | | | | 2,791,485 | |
Garden State Preservation Trust, Refunding RB, Series C (AGM), 5.25%, 11/01/20 | | | 1,500 | | | | 1,576,830 | |
New Jersey EDA, RB, AMT: | | | | | | | | |
Continental Airlines, Inc. Project, 4.88%, 09/15/19 | | | 355 | | | | 356,928 | |
Private Activity Bond, The Goethals Bridge Replacement Project, 5.00%, 07/01/20 | | | 250 | | | | 258,375 | |
New Jersey EDA, Refunding RB: | | | | | | | | |
Cigarette Tax, 5.00%, 06/15/20 | | | 2,500 | | | | 2,577,275 | |
Provident Group Montclair (AGM), 4.00%, 06/01/20 | | | 105 | | | | 107,220 | |
School Facilities, Series GG, 5.00%, 09/01/22 | | | 2,000 | | | | 2,105,680 | |
School Facilities, Series K (AGC), 5.25%, 12/15/20 | | | 3,150 | | | | 3,315,595 | |
New Jersey Educational Facilities Authority, Refunding RB, : | | | | | | | | |
5.00%, 07/01/19 | | | 1,060 | | | | 1,060,307 | |
5.00%, 07/01/20 | | | 650 | | | | 672,711 | |
New Jersey Higher Education Student Assistance Authority, RB, : | | | | | | | | |
5.00%, 12/01/19 | | | 2,565 | | | | 2,596,703 | |
5.00%, 12/01/20 | | | 2,900 | | | | 3,038,446 | |
New Jersey Transportation Trust Fund Authority, RB, 5.00%, 06/15/20 | | | 2,000 | | | | 2,061,720 | |
| | | | | | | | |
| | | | | | | 22,519,275 | |
|
| New York — 4.7% | |
Build NYC Resource Corp., Refunding RB, Pratt Paper NY, Inc. Project, AMT, 3.75%, 01/01/20(a) | | | 95 | | | | 95,916 | |
Chautauqua Tobacco Asset Securitization Corp., Refunding RB, 5.00%, 06/01/20 | | | 450 | | | | 458,167 | |
Metropolitan Transportation Authority, RB, BANS Transportation, Series A, 4.00%, 02/03/20 | | | 5,000 | | | | 5,071,150 | |
New York State Energy Research & Development Authority, Refunding RB, Electric & Gas Corp. Project, Series B, 2.00%, 02/01/29(d) | | | 3,000 | | | | 3,015,270 | |
New York State Thruway Authority, Refunding RB, General, Series I, 5.00%, 01/01/20 | | | 875 | | | | 891,800 | |
New York Transportation Development Corp., Refunding RB, American Airlines, Inc., AMT, 5.00%, 08/01/20 | | | 3,500 | | | | 3,626,560 | |
Port Authority of New York & New Jersey, ARB, JFK International Air Terminal LLC Project, Series 8, 5.00%, 12/01/20 | | | 1,040 | | | | 1,069,921 | |
TSASC, Inc., Refunding RB, Senior, Series A, 5.00%, 06/01/20 | | | 230 | | | | 236,898 | |
| | | | | | | | |
| | | | | | | 14,465,682 | |
|
| North Carolina — 1.7% | |
North Carolina Municipal Power Agency No. 1, Refunding RB, Series B, 5.00%, 01/01/20 | | | 5,000 | | | | 5,091,100 | |
| | | | | | | | |
|
| Ohio — 0.6% | |
State of Ohio, RB, : | | | | | | | | |
5.00%, 12/31/19 | | | 830 | | | | 841,686 | |
5.00%, 06/30/20 | | | 1,000 | | | | 1,027,910 | |
| | | | | | | | |
| | | | | | | 1,869,596 | |
| | | | |
| SCHEDULES OF INVESTMENTS | | | 13 | |
| | |
Schedule of Investments (unaudited) (continued) June 30, 2019 | | BlackRock Municipal 2020 Term Trust (BKK) (Percentages shown are based on Net Assets) |
| | | | | | | | |
| Security | | Par
(000) | | | Value | |
|
| Oklahoma — 0.4% | |
County of Tulsa Oklahoma Industrial Authority, RB, Broken Arrow Public School, 4.00%, 09/01/22 | | $ | 1,100 | | | $ | 1,185,998 | |
| | | | | | | | |
|
| Pennsylvania — 8.1% | |
Chester County Health & Education Facilities Authority, Refunding RB, : | | | | | | | | |
4.00%, 12/01/19 | | | 840 | | | | 844,469 | |
4.00%, 12/01/20 | | | 870 | | | | 883,024 | |
City of Philadelphia PA Airport Revenue, Refunding RB, AMT, Series B, 5.00%, 07/01/20 | | | 1,450 | | | | 1,499,605 | |
Commonwealth of Pennsylvania, GO, Refunding, First Series, 5.00%, 08/15/20 | | | 1,000 | | | | 1,040,960 | |
Cumberland County Municipal Authority, Refunding RB, Diakon Lutheran Social Project, 4.00%, 01/01/20 | | | 1,000 | | | | 1,009,270 | |
Montgomery County IDA, Refunding RB, Albert Einstein Healthcare, Series A, 5.00%, 01/15/20 | | | 1,400 | | | | 1,422,764 | |
Pennsylvania Economic Development Financing Authority, RB, Pennsylvania Rapid Bridge Replacement Project: | | | | | | | | |
5.00%, 12/31/20 | | | 3,830 | | | | 3,989,902 | |
AMT, 5.00%, 06/30/20 | | | 295 | | | | 303,148 | |
Pennsylvania Economic Development Financing Authority, Refunding RB, Amtrak Project, Series A, AMT, 4.00%, 11/01/20 | | | 2,175 | | | | 2,241,055 | |
Pennsylvania Higher Educational Facilities Authority, RB,(c): | | | | | | | | |
4.00%, 10/01/19 | | | 590 | | | | 593,823 | |
4.00%, 10/01/20 | | | 1,210 | | | | 1,241,109 | |
Pennsylvania Higher Educational Facilities Authority, Refunding RB, Series A: | | | | | | | | |
Drexel University, 5.00%, 05/01/20(c) | | | 1,480 | | | | 1,524,740 | |
Drexel University, 5.00%, 05/01/20 | | | 95 | | | | 97,479 | |
University Properties, Inc., 4.00%, 07/01/19 | | | 230 | | | | 230,021 | |
University Properties, Inc., 4.00%, 07/01/20 | | | 450 | | | | 455,058 | |
Widener University, 5.00%, 07/15/20 | | | 600 | | | | 617,346 | |
Pennsylvania Housing Finance Agency, Refunding RB, : | | | | | | | | |
2.30%, 10/01/19 | | | 460 | | | | 460,432 | |
2.55%, 04/01/20 | | | 850 | | | | 853,672 | |
2.65%, 10/01/20 | | | 865 | | | | 871,937 | |
Pennsylvania IDA, Refunding RB, Economic Development, 5.00%, 07/01/20 | | | 1,500 | | | | 1,551,885 | |
State Public School Building Authority, RB, Community College Allegheny County Project (AGM), 5.00%, 07/15/20 | | | 995 | | | | 1,029,845 | |
Swarthmore Borough Authority, Refunding RB, Swarthmore College Project, 5.00%, 09/15/20 | | | 350 | | | | 365,456 | |
Township of East Hempfield Pennsylvania IDA, RB, : | | | | | | | | |
4.00%, 07/01/19 | | | 360 | | | | 360,040 | |
4.00%, 07/01/20 | | | 465 | | | | 471,254 | |
Westmoreland County Municipal Authority, Refunding RB, : | | | | | | | | |
5.00%, 08/15/19 | | | 335 | | | | 336,437 | |
3.00%, 08/15/20 | | | 110 | | | | 111,936 | |
5.00%, 08/15/20 | | | 355 | | | | 369,104 | |
| | | | | | | | |
| | | | | | | 24,775,771 | |
|
| Rhode Island — 3.0% | |
Rhode Island Commerce Corp., Refunding RB, Rhode Island Department of Transportation, Series A, 5.00%, 06/15/20 | | | 3,465 | | | | 3,578,479 | |
Rhode Island Health & Educational Building Corp., Refunding RB, Hospital Financing, LifeSpan Obligation, 5.00%, 05/15/20 | | | 1,500 | | | | 1,540,605 | |
Rhode Island Student Loan Authority, RB, Student Loan Program, Senior Series A, AMT, 5.00%, 12/01/20 | | | 3,850 | | | | 4,023,981 | |
| | | | | | | | |
| | | | | | | 9,143,065 | |
| | | | | | | | |
| Security | | Par
(000) | | | Value | |
|
| South Carolina — 0.7% | |
South Carolina State Ports Authority, RB, 5.00%, 07/01/20(c) | | $ | 2,000 | | | $ | 2,072,620 | |
| | | | | | | | |
|
| Tennessee — 0.2% | |
Metropolitan Government Nashville & Davidson County Health & Educational Facilities Board, Refunding RB, : | | | | | | | | |
4.00%, 10/01/19 | | | 240 | | | | 241,262 | |
5.00%, 10/01/20 | | | 325 | | | | 337,360 | |
| | | | | | | | |
| | | | | | | 578,622 | |
|
| Texas — 13.3% | |
Central Texas Regional Mobility Authority, Refunding RB, : | | | | | | | | |
5.00%, 01/01/20 | | | 620 | | | | 630,583 | |
5.75%, 01/01/20 | | | 1,140 | | | | 1,162,720 | |
Central Texas Turnpike System, RB, CAB(h): | | | | | | | | |
(AMBAC), 0.00%, 08/15/21(c) | | | 1,825 | | | | 1,768,699 | |
Series A (AMBAC), 0.00%, 08/15/21 | | | 6,165 | | | | 5,976,598 | |
Central Texas Turnpike System, Refunding RB, Series A, 5.00%, 08/15/42(d) | | | 1,000 | | | | 1,024,990 | |
City of Houston Texas Airport System Revenue, Refunding RB: | | | | | | | | |
SeriesB-2, AMT, 5.00%, 07/15/20 | | | 3,000 | | | | 3,090,840 | |
Subordinate Lien, Series B, 5.00%, 07/01/20 | | | 250 | | | | 259,145 | |
United Airlines, Inc. Terminal E Project, AMT, 4.50%, 07/01/20 | | | 5,000 | | | | 5,118,250 | |
Love Field Airport Modernization Corp., RB, Southwest Airlines Co., Love Field Modernization Program Project, 5.00%, 11/01/20 | | | 3,715 | | | | 3,872,442 | |
Lower Colorado River Authority, Refunding RB, LCRA Transmission Corp. Project, Series B, 5.00%, 05/15/20 | | | 5,000 | | | | 5,159,100 | |
New Hope Cultural Education Facilities Corp., RB, : | | | | | | | | |
4.00%, 04/01/20 | | | 415 | | | | 419,200 | |
4.00%, 04/01/20 | | | 585 | | | | 590,920 | |
4.00%, 04/01/20 | | | 180 | | | | 182,068 | |
North Texas Tollway Authority, Refunding RB, : | | | | | | | | |
5.25%, 01/01/20 | | | 185 | | | | 185,546 | |
5.38%, 01/01/21 | | | 940 | | | | 942,839 | |
State of Texas, RB, 4.00%, 08/29/19 | | | 5,000 | | | | 5,018,900 | |
Texas Municipal Gas Acquisition & Supply Corp. III, RB, Natural Gas Utility Improvements, 5.00%, 12/15/20 | | | 5,000 | | | | 5,226,700 | |
| | | | | | | | |
| | | | | | | 40,629,540 | |
|
| Virginia — 1.4% | |
City of Norfolk Virginia Water Revenue, Refunding RB, 5.00%, 11/01/20 | | | 2,000 | | | | 2,096,940 | |
Roanoke EDA, Refunding RB, Carilion Clinic Obligation Group, 5.00%, 07/01/20 | | | 1,500 | | | | 1,553,700 | |
Virginia College Building Authority, Refunding RB,(a): | | | | | | | | |
5.00%, 07/01/19 | | | 425 | | | | 425,076 | |
5.00%, 07/01/20 | | | 335 | | | | 341,814 | |
| | | | | | | | |
| | | | | | | 4,417,530 | |
|
| Washington — 2.4% | |
County of Snohomish Washington Everett School District No. 2, GO, Refunding, 5.00%, 12/01/20 | | | 2,625 | | | | 2,760,187 | |
Washington Health Care Facilities Authority, Refunding RB, : | | | | | | | | |
5.00%, 10/01/20 | | | 250 | | | | 260,998 | |
5.00%, 10/01/42(d) | | | 4,000 | | | | 4,312,160 | |
| | | | | | | | |
| | | | | | | 7,333,345 | |
|
| Wisconsin — 0.1% | |
Wisconsin Health & Educational Facilities Authority, Refunding RB, ThedaCare, Inc., 5.00%, 12/15/20 | | | 250 | | | | 262,100 | |
| | | | | | | | |
| |
Total Long-Term Investments — 95.9%
(Cost — $290,427,698) | | | | 294,025,788 | |
| | | | | |
| | |
| 14 | | 2019 BLACKROCK SEMI-ANNUAL REPORTTO SHAREHOLDERS |
| | |
Schedule of Investments (unaudited) (continued) June 30, 2019 | | BlackRock Municipal 2020 Term Trust (BKK) (Percentages shown are based on Net Assets) |
| | | | | | | | |
| Security | | Shares | | | Value | |
|
| Short-Term Securities — 3.0% | |
BlackRock Liquidity Funds, MuniCash, Institutional Class, 1.65%(i)(j) | | | 9,022,841 | | | $ | 9,023,743 | |
| | | | | | | | |
| |
Total Short-Term Securities — 3.0%
(Cost — $9,024,204) | | | | 9,023,743 | |
| | | | | |
| |
Total Investments — 98.9%
(Cost — $299,451,902) | | | | 303,049,531 | |
| |
Other Assets Less Liabilities — 1.1% | | | | 3,410,969 | |
| | | | | |
| |
Net Assets — 100.0% | | | $ | 306,460,500 | |
| | | | | |
| (a) | Security exempt from registration pursuant to Rule 144A under the Securities Act of 1933, as amended. These securities may be resold in transactions exempt from registration to qualified institutional investors. |
| (b) | U.S. Government securities held in escrow, are used to pay interest on this security as well as to retire the bond in full at the date indicated, typically at a premium to par. |
| (c) | Security is collateralized by municipal bonds or U.S. Treasury obligations. |
| (d) | Variable or floating rate security, which interest rate adjusts periodically based on changes in current interest rates and prepayments on the underlying pool of assets. Rate shown is the rate in effect as of period end. |
| (e) | Issuer filed for bankruptcy and/or is in default. |
| (f) | Security is valued using significant unobservable inputs and is classified as Level 3 in the fair value hierarchy. |
| (g) | Non-income producing security. |
| (i) | Annualized7-day yield as of period end. |
| (j) | During the six months ended June 30, 2019, investments in issuers considered to be an affiliate/affiliates of the Trust for purposes of Section 2(a)(3) of the Investment Company Act of 1940, as amended, were as follows: |
| | | | | | | | | | | | | | | | | | | | | | | | | | | | |
| Affiliate | | Shares
Held at
12/31/18 | | | Net
Activity | | | Shares
Held at
06/30/19 | | | Value at
06/30/19 | | | Income | | | Net Realized
Gain (Loss) (a) | | | Change in
Unrealized
Appreciation
(Depreciation) | |
BlackRock Liquidity Funds, MuniCash, Institutional Class | | | 102,787 | | | | 8,920,054 | | | | 9,022,841 | | | $ | 9,023,743 | | | $ | 42,928 | | | $ | 713 | | | $ | (465 | ) |
| | | | | | | | | | | | | | | | | | | | | | | | | | | | |
| | (a) | Includes net capital gain distributions, if applicable. | |
Fair Value Hierarchy as of Period End
Various inputs are used in determining the fair value of investments. For information about the Trust’s policy regarding valuation of investments, refer to the Notes to Financial Statements.
The following table summarizes the Trust’s investments categorized in the disclosure hierarchy:
| | | | | | | | | | | | | | | | |
| | | Level 1 | | | Level 2 | | | Level 3 | | | Total | |
Assets: | |
Investments: | |
Long-Term Investments(a) | | $ | — | | | $ | 292,543,238 | | | $ | 1,482,550 | | | $ | 294,025,788 | |
Short-Term Securities | | | 9,023,743 | | | | — | | | | — | | | | 9,023,743 | |
| | | | | | | | | | | | | | | | |
| | $ | 9,023,743 | | | $ | 292,543,238 | | | $ | 1,482,550 | | | $ | 303,049,531 | |
| | | | | | | | | | | | | | | | |
| | (a) | See above Schedule of Investments for values in each state or political subdivision. | |
The Fund’s investments that are categorized as Level 3 were valued utilizing third party pricing information without adjustment. Such valuations are based on unobservable inputs. A significant change in third party information could result in a significantly lower or higher value of such Level 3 investments.
See notes to financial statements.
| | | | |
| SCHEDULES OF INVESTMENTS | | | 15 | |
Statements of Assets and Liabilities (unaudited)
June 30, 2019
| | | | | | | | |
| | | BFO | | | BKK | |
|
ASSETS | |
Investments at value — unaffiliated(a) | | $ | 80,311,054 | | | $ | 294,025,788 | |
Investments at value — affiliated(b) | | | — | | | | 9,023,743 | |
Receivables: | |
Investments sold | | | 1,191,350 | | | | 1,045,000 | |
Dividends — affiliated | | | 2,221 | | | | 12,431 | |
Interest — unaffiliated | | | 849,583 | | | | 3,331,744 | |
From the Manager | | | 167 | | | | — | |
Prepaid expenses | | | 5,079 | | | | — | |
| | | | | | | | |
Total assets | | | 82,359,454 | | | | 307,438,706 | |
| | | | | | | | |
|
LIABILITIES | |
Bank overdraft | | | 155,092 | | | | — | |
Payables: | |
Investments purchased | | | 1,057,930 | | | | — | |
Capital shares redeemed | | | 24,316 | | | | — | |
Income dividend distributions | | | 111,037 | | | | 643,525 | |
Investment advisory fees | | | — | | | | 125,145 | |
Trustees’ and Officer’s fees | | | 9,887 | | | | 45,435 | |
Other accrued expenses | | | 68,283 | | | | 164,101 | |
| | | | | | | | |
Total liabilities | | | 1,426,545 | | | | 978,206 | |
| | | | | | | | |
| | |
NET ASSETS | | $ | 80,932,909 | | | $ | 306,460,500 | |
| | | | | | | | |
|
NET ASSETS CONSIST OF | |
Paid-in capital(c) | | $ | 80,548,182 | | | $ | 296,901,576 | |
Accumulated earnings | | | 384,727 | | | | 9,558,924 | |
| | | | | | | | |
NET ASSETS | | $ | 80,932,909 | | | $ | 306,460,500 | |
| | | | | | | | |
| | |
Net asset value | | $ | 14.59 | | | $ | 15.14 | |
| | | | | | | | |
| | |
(a) Investments at cost — unaffiliated | | $ | 80,807,492 | | | $ | 290,427,698 | |
(b) Investments at cost — affiliated | | $ | — | | | $ | 9,024,204 | |
(c) Shares outstanding, unlimited number of shares authorized, par value $0.001 per share | | | 5,546,361 | | | | 20,236,628 | |
See notes to financial statements.
| | |
| 16 | | 2019 BLACKROCK SEMI-ANNUAL REPORTTO SHAREHOLDERS |
Statements of Operations (unaudited)
Six Months Ended June 30, 2019
| | | | | | | | |
| | | BFO | | | BKK | |
|
INVESTMENT INCOME | |
Dividends — affiliated | | $ | 11,339 | | | $ | 42,928 | |
Interest — unaffiliated | | | 960,572 | | | | 4,657,496 | |
| | | | | | | | |
Total investment income | | | 971,911 | | | | 4,700,424 | |
| | | | | | | | |
|
EXPENSES | |
Investment advisory | | | 201,597 | | | | 759,312 | |
Professional | | | 25,682 | | | | 36,449 | |
Accounting services | | | 12,117 | | | | 28,784 | |
Transfer agent | | | 7,653 | | | | 8,216 | |
Directors and Officer | | | 4,836 | | | | 16,420 | |
Registration | | | 4,533 | | | | 4,533 | |
Printing | | | 3,256 | | | | 2,332 | |
Custodian | | | 377 | | | | 1,929 | |
Miscellaneous | | | 8,078 | | | | 20,048 | |
| | | | | | | | |
Total expenses | | | 268,129 | | | | 878,023 | |
Less fees waived and/or reimbursed by the Manager | | | (202,340 | ) | | | (2,907 | ) |
| | | | | | | | |
Total expenses after fees waived and/or reimbursed | | | 65,789 | | | | 875,116 | |
| | | | | | | | |
Net investment income | | | 906,122 | | | | 3,825,308 | |
| | | | | | | | |
|
REALIZED AND UNREALIZED GAIN (LOSS) | |
Net realized gain (loss) from: | |
Investments — affiliated | | | (188 | ) | | | 713 | |
Investments — unaffiliated | | | 127,455 | | | | 13,863 | |
| | | | | | | | |
| | | 127,267 | | | | 14,576 | |
| | | | | | | | |
Net change in unrealized (depreciation) on: | | | | | | | | |
Investments — affiliated | | | — | | | | (465 | ) |
Investments — unaffiliated | | | (337,743 | ) | | | 575,741 | |
| | | | | | | | |
| | | (337,743 | ) | | | 575,276 | |
| | | | | | | | |
Net realized and unrealized gain (loss) | | | (210,476 | ) | | | 589,852 | |
| | | | | | | | |
NET INCREASE IN NET ASSETS RESULTING FROM OPERATIONS | | $ | 695,646 | | | $ | 4,415,160 | |
| | | | | | | | |
See notes to financial statements.
Statements of Changes in Net Assets
| | | | | | | | | | | | |
| | | BFO | |
| | | Six Months Ended
06/30/19
(unaudited) | | | Period from 08/01/18
to 12/31/18 | | | Year Ended 07/31/18 | |
| | | |
INCREASE (DECREASE) IN NET ASSETS | | | | | | | | | | | | |
| | | |
OPERATIONS | | | | | | | | | | | | |
Net investment income | | $ | 906,122 | | | $ | 598,578 | | | $ | 1,732,910 | |
Net realized gain (loss) | | | 127,267 | | | | 96,290 | | | | (5,962 | ) |
Net change in unrealized appreciation (depreciation) | | | (337,743 | ) | | | (582,663 | ) | | | (1,753,710 | ) |
| | | | | | | | | | | | |
Net increase (decrease) in net assets resulting from operations | | | 695,646 | | | | 112,205 | | | | (26,762 | ) |
| | | | | | | | | | | | |
| | | |
DISTRIBUTIONS TO SHAREHOLDERS(a) | | | | | | | | | | | | |
Decrease in net assets resulting from distributions to shareholders | | | (733,927 | ) | | | (723,077 | ) | | | (1,846,627 | ) |
| | | | | | | | | | | | |
| | | |
CAPITAL SHARE TRANSACTIONS | | | | | | | | | | | | |
Redemption of shares resulting from share repurchase program (including transaction costs) | | | (227,146 | ) | | | — | | | | — | |
| | | | | | | | | | | | |
| | | |
NET ASSETS | | | | | | | | | | | | |
Total decrease in net assets | | | (265,427 | ) | | | (610,872 | ) | | | (1,873,389 | ) |
Beginning of period | | | 81,198,336 | | | | 81,809,208 | | | | 83,682,597 | |
| | | | | | | | | | | | |
End of period | | $ | 80,932,909 | | | $ | 81,198,336 | | | $ | 81,809,208 | |
| | | | | | | | | | | | |
| (a) | Distributions for annual periods determined in accordance with U.S. Federal income tax regulations. |
See notes to financial statements.
| | |
| 18 | | 2019 BLACKROCK SEMI-ANNUAL REPORTTO SHAREHOLDERS |
Statements of Changes in Net Assets (continued)
| | | | | | | | | | | | |
| | | BKK | |
| | | Six Months Ended
06/30/19 (unaudited) | | | Period from 05/01/18 to 12/31/18 | | | Year Ended 04/30/18 | |
|
INCREASE (DECREASE) IN NET ASSETS | |
|
OPERATIONS | |
Net investment income | | $ | 3,825,308 | | | $ | 5,494,701 | | | $ | 8,824,400 | |
Net realized gain (loss) | | | 14,576 | | | | (45,852 | ) | | | (1,118,558 | ) |
Net change in unrealized appreciation (depreciation) | | | 575,276 | | | | (2,237,085 | ) | | | (5,373,942 | ) |
Distributions to AMPS Shareholders: | | | | | | | | | | | | |
Net investment income | | | — | | | | — | | | | (70,385 | ) |
Net realized gain | | | — | | | | — | | | | (348 | ) |
| | | | | | | | | | | | |
Net increase in net assets applicable to Common Shareholders resulting from operations | | | 4,415,160 | | | | 3,211,764 | | | | 2,261,167 | |
| | | | | | | | | | | | |
|
DISTRIBUTIONS TO SHAREHOLDERS(a) | |
Decrease in net assets resulting from distributions to shareholders | | | (3,861,149 | ) | | | (5,459,842 | ) | | | (9,866,024 | ) |
| | | | | | | | | | | | |
|
NET ASSETS APPLICABLE TO COMMON SHAREHOLDERS | |
Total increase (decrease) in net assets applicable to Common Shareholders | | | 554,011 | | | | (2,248,078 | ) | | | (7,604,857 | ) |
Beginning of period | | | 305,906,489 | | | | 308,154,567 | | | | 315,759,424 | |
| | | | | | | | | | | | |
End of period | | $ | 306,460,500 | | | $ | 305,906,489 | | | $ | 308,154,567 | |
| | | | | | | | | | | | |
| (a) | Distributions for annual periods determined in accordance with U.S. federal income tax regulations. |
See notes to financial statements.
Financial Highlights
(For a share outstanding throughout each period)
| | | | | | | | | | | | | | | | | | | | | | | | | | | | | | | | |
| | | BFO | |
| | | Six Months Ended
06/30/19
(unaudited) | | | Period from
08/01/18
to 12/31/18 | | | | | | Year Ended July 31, | |
| | | 2018 | | | 2017 | | | 2016 | | | 2015 | | | 2014 | |
| | | | | | | | | |
Net asset value, beginning of period | | $ | 14.60 | | | $ | 14.71 | | | | | | | $ | 15.05 | | | $ | 15.50 | | | $ | 15.37 | | | $ | 15.42 | | | $ | 15.31 | |
| | | | | | | | | | | | | | | | | | | | | | | | | | | | | | | | |
Net investment income(a) | | | 0.16 | | | | 0.11 | | | | | | | | 0.31 | | | | 0.37 | | | | 0.46 | | | | 0.42 | | | | 0.47 | |
Net realized and unrealized gain (loss) | | | (0.04 | ) | | | (0.09 | ) | | | | | | | (0.32 | ) | | | (0.40 | ) | | | 0.05 | | | | (0.03 | ) | | | 0.25 | |
Distributions to AMPS Shareholders from net investment income | | | — | | | | — | | | | | | | | — | | | | — | | | | — | | | | (0.00 | )(b) | | | (0.00 | )(b) |
| | | | | | | | | | | | | | | | | | | | | | | | | | | | | | | | |
Net increase (decrease) from investment operations | | | 0.12 | | | | 0.02 | | | | | | | | (0.01 | ) | | | (0.03 | ) | | | 0.51 | | | | 0.39 | | | | 0.72 | |
| | | | | | | | | | | | | | | | | | | | | | | | | | | | | | | | |
Distributions to Common Shareholders from net Investment income(c) | | | (0.13 | ) | | | (0.13 | ) | | | | | | | (0.33 | ) | | | (0.42 | ) | | | (0.38 | ) | | | (0.44 | ) | | | (0.61 | ) |
| | | | | | | | | | | | | | | | | | | | | | | | | | | | | | | | |
| | | | | | | | |
Net asset value, end of period | | $ | 14.59 | | | $ | 14.60 | | | | | | | $ | 14.71 | | | $ | 15.05 | | | $ | 15.50 | | | $ | 15.37 | | | $ | 15.42 | |
| | | | | | | | | | | | | | | | | | | | | | | | | | | | | | | | |
| | | | | | | | |
Market price, end of period | | $ | 14.34 | | | $ | 14.04 | | | | | | | $ | 14.21 | | | $ | 15.05 | | | $ | 15.21 | | | $ | 14.82 | | | $ | 15.16 | |
| | | | | | | | | | | | | | | | | | | | | | | | | | | | | | | | |
| | | | | | | | |
Total Return Applicable to Common Shareholders(d) | | | | | | | | | | | | | | | | | | | | | | | | | | | | | | | | |
Based on net asset value | | | 0.85 | %(e) | | | 0.17 | %(e) | | | | | | | (0.02 | )% | | | (0.20 | )% | | | 3.41 | % | | | 2.59 | % | | | 4.84 | % |
| | | | | | | | | | | | | | | | | | | | | | | | | | | | | | | | |
Based on market price | | | 3.08 | %(e) | | | (0.29 | )%(e) | | | | | | | (3.42 | )% | | | 1.70 | % | | | 5.24 | % | | | 0.62 | % | | | 4.36 | % |
| | | | | | | | | | | | | | | | | | | | | | | | | | | | | | | | |
| | | | | | | | |
Ratios to Average Net Assets Applicable to Common Shareholders | | | | | | | | | | | | | | | | | | | | | | | | | | | | | | | | |
Total expenses | | | 0.67 | %(f) | | | 0.63 | %(f)(g)(h) | | | | | | | 0.65 | %(g) | | | 0.64 | % | | | 0.64 | % | | | 0.68 | %(i) | | | 0.74 | %(i) |
| | | | | | | | | | | | | | | | | | | | | | | | | | | | | | | | |
Total expenses after fees waived and paid indirectly | | | 0.16 | %(f) | | | 0.63 | %(f)(g)(h) | | | | | | | 0.65 | %(g) | | | 0.64 | % | | | 0.64 | % | | | 0.68 | %(i) | | | 0.74 | %(i) |
| | | | | | | | | | | | | | | | | | | | | | | | | | | | | | | | |
Total expenses after fees waived and paid indirectly and excluding interest expense and fees, and amortization of offering costs(j)(k) | | | 0.16 | %(f) | | | 0.63 | %(f)(g)(h) | | | | | | | 0.65 | %(g) | | | 0.64 | % | | | 0.64 | % | | | 0.68 | %(i) | | | 0.74 | %(i) |
| | | | | | | | | | | | | | | | | | | | | | | | | | | | | | | | |
Net investment income | | | 2.25 | %(f) | | | 1.76 | %(f)(g) | | | | | | | 2.10 | %(g) | | | 2.43 | % | | | 3.00 | % | | | 2.69 | %(i) | | | 3.05 | %(i) |
| | | | | | | | | | | | | | | | | | | | | | | | | | | | | | | | |
Distributions to AMPS Shareholders | | | — | % | | | — | % | | | | | | | — | % | | | — | % | | | — | % | | | 0.00 | % | | | 0.01 | % |
| | | | | | | | | | | | | | | | | | | | | | | | | | | | | | | | |
Net investment income to Common Shareholders | | | 2.25 | %(f) | | | 1.76 | %(f)(g) | | | | | | | 2.10 | %(g) | | | 2.43 | % | | | 3.00 | % | | | 2.69 | % | | | 3.04 | % |
| | | | | | | | | | | | | | | | | | | | | | | | | | | | | | | | |
| | | | | | | | |
Supplemental Data | | | | | | | | | | | | | | | | | | | | | | | | | | | | | | | | |
Net assets applicable to Common Shareholders, end of period (000) | | $ | 80,933 | | | $ | 81,198 | | | | | | | $ | 81,809 | | | $ | 83,683 | | | $ | 86,209 | | | $ | 85,510 | | | $ | 85,748 | |
| | | | | | | | | | | | | | | | | | | | | | | | | | | | | | | | |
AMPS outstanding at $25,000 liquidation preference, end of period (000) | | $ | — | | | $ | — | | | | | | | $ | — | | | $ | — | | | $ | — | | | $ | — | | | $ | 625 | |
| | | | | | | | | | | | | | | | | | | | | | | | | | | | | | | | |
Asset coverage per AMPS at $25,000 liquidation preference, end of period (000) | | $ | — | | | $ | — | | | | | | | $ | — | | | $ | — | | | $ | — | | | $ | — | | | $ | 3,454,938 | |
| | | | | | | | | | | | | | | | | | | | | | | | | | | | | | | | |
Borrowings outstanding, end of period (000) | | $ | — | | | $ | — | | | | | | | $ | — | | | $ | — | | | $ | — | | | $ | 134 | | | $ | 190 | |
| | | | | | | | | | | | | | | | | | | | | | | | | | | | | | | | |
Portfolio turnover rate | | | 9 | % | | | 8 | % | | | | | | | 16 | % | | | — | % | | | 7 | % | | | 14 | % | | | 1 | % |
| | | | | | | | | | | | | | | | | | | | | | | | | | | | | | | | |
| (a) | Based on average Common Shares outstanding. |
| (b) | Amount is greater than $(0.005) per share. |
| (c) | Distributions for annual periods determined in accordance with U.S. federal income tax regulations. |
| (d) | Total returns based on market price, which can be significantly greater or less than the net asset value, may result in substantially different returns. Where applicable, excludes the effects of any sales charges and assumes the reinvestment of distributions at actual reinvestment prices. |
| (e) | Aggregate total return. |
| (g) | Excludes 0.01% of expenses incurred indirectly as a result of investments in underlying funds. |
| (h) | Audit costs were not annualized in the calculation of the expense ratios. If these expenses were annualized, the total expenses would have been 0.68%. |
| (i) | Does not reflect the effect of distributions to Auction Market Preferred Shares (“AMPS”) Shareholders. |
| (j) | Interest expense and fees related to TOB Trusts. See Note 4 of the Notes to Financial Statements for details. |
| (k) | The total expense ratio after fees waived and paid indirectly and excluding interest expense, fees, amortization of offering costs, liquidity and remarketing fees were as follows: |
| | | | | | | | | | | | | | | | | | | | | | | | | | | | | | | | | | | | | | | | | | | | | | | | | | | | | | | | | | | | |
| | | | | | Six Months Ended
06/30/19
(unaudited) | | | | | | Period from
08/01/18
to 12/31/18 | | | | | | Year Ended July 31, | |
| | | 2018 | | | | | | 2017 | | | | | | 2016 | | | | | | 2015 | | | | | | 2014 | | | | |
Expense ratios | | | | | | | 0.16 | % | | | | | | | 0.63 | % | | | | | | | 0.65 | % | | | | | | | 0.64 | % | | | | | | | 0.64 | % | | | | | | | 0.67 | % | | | | | | | 0.73 | % | | | | |
| | | | | | | | | | | | | | | | | | | | | | | | | | | | | | | | | | | | | | | | | | | | | | | | | | | | | | | | | | | | |
See notes to financial statements.
| | |
| 20 | | 2019 BLACKROCK SEMI-ANNUAL REPORTTO SHAREHOLDERS |
Financial Highlights (continued)
(For a share outstanding throughout each period)
| | | | | | | | | | | | | | | | | | | | | | | | | | | | | | | | |
| | | BKK | |
| | | Six Months Ended
06/30/19
(unaudited) | | | Period from
05/01/18
to 12/31/18 | | | | | | Year Ended April 30, | |
| | | | | | 2018 | | | 2017 | | | 2016 | | | 2015 | | | 2014 | |
| | | | | | | | | |
Net asset value, beginning of period | | $ | 15.12 | | | $ | 15.23 | | | | | | | $ | 15.60 | | | $ | 16.27 | | | $ | 16.30 | | | $ | 16.22 | | | $ | 16.85 | |
| | | | | | | | | | | | | | | | | | | | | | | | | | | | | | | | |
Net investment income(a) | | | 0.19 | | | | 0.27 | | | | | | | | 0.44 | | | | 0.55 | | | | 0.57 | | | | 0.61 | | | | 0.74 | |
Net realized and unrealized gain (loss) | | | 0.02 | | | | (0.11 | ) | | | | | | | (0.33 | ) | | | (0.66 | ) | | | (0.03 | ) | | | 0.14 | | | | (0.55 | ) |
| | | | | | | | |
| Distributions to AMPS Shareholders | | | | | | | | | | | | | | | | | | | | | | | | |
Net investment income | | | — | | | | — | | | | | | | | (0.00 | )(b) | | | (0.01 | ) | | | (0.01 | ) | | | (0.00 | )(b) | | | (0.01 | ) |
Net realized gain | | | — | | | | — | | | | | | | | (0.00 | )(b) | | | (0.00 | )(b) | | | — | | | | — | | | | — | |
| | | | | | | | | | | | | | | | | | | | | | | | | | | | | | | | |
Net increase (decrease) from investment operations | | | 0.21 | | | | 0.16 | | | | | | | | 0.11 | | | | (0.12 | ) | | | 0.53 | | | | 0.75 | | | | 0.18 | |
| | | | | | | | | | | | | | | | | | | | | | | | | | | | | | | | |
| | | | | | | | |
| Distributions to Common Shareholders(c) | | | | | | | | | | | | | | | | | | | | | | | | |
From net investment income | | | (0.19 | ) | | | (0.27 | ) | | | | | | | (0.48 | ) | | | (0.54 | ) | | | (0.56 | ) | | | (0.67 | ) | | | (0.81 | ) |
From net realized gain | | | — | | | | — | | | | | | | | (0.00 | )(b) | | | (0.01 | ) | | | (0.00 | )(b) | | | — | | | | — | |
| | | | | | | | | | | | | | | | | | | | | | | | | | | | | | | | |
Total distributions to Common Shareholders | | | (0.19 | ) | | | (0.27 | ) | | | | | | | (0.48 | ) | | | (0.55 | ) | | | (0.56 | ) | | | (0.67 | ) | | | (0.81 | ) |
| | | | | | | | | | | | | | | | | | | | | | | | | | | | | | | | |
| | | | | | | | |
Net asset value, end of period | | $ | 15.14 | | | $ | 15.12 | | | | | | | $ | 15.23 | | | $ | 15.60 | | | $ | 16.27 | | | $ | 16.30 | | | $ | 16.22 | |
| | | | | | | | | | | | | | | | | | | | | | | | | | | | | | | | |
| | | | | | | | |
Market price, end of period | | $ | 15.05 | | | $ | 14.76 | | | | | | | $ | 15.16 | | | $ | 15.73 | | | $ | 16.14 | | | $ | 16.25 | | | $ | 16.61 | |
| | | | | | | | | | | | | | | | | | | | | | | | | | | | | | | | |
| | | | | | | | |
Total Return Applicable to Common Shareholders(d) | | | | | | | | | | | | | | | | | | | | | | | | | | | | | | | | |
Based on net asset value | | | 1.41 | %(e) | | | 1.08 | %(e) | | | | | | | 0.76 | % | | | (0.78 | )% | | | 3.39 | % | | | 4.67 | % | | | 1.17 | % |
| | | | | | | | | | | | | | | | | | | | | | | | | | | | | | | | |
Based on market price | | | 3.26 | %(e) | | | (0.87 | )%(e) | | | | | | | (0.54 | )% | | | 0.85 | % | | | 2.87 | % | | | 1.90 | % | | | 4.91 | % |
| | | | | | | | | | | | | | | | | | | | | | | | | | | | | | | | |
| | | | | | | |
Ratios to Average Net Assets Applicable to Common Shareholders | | | | | | | | | | | | | | | | | | | | | | | | | | | | | |
Total expenses | | | 0.58 | %(f) | | | 0.59 | %(f)(g) | | | | | | | 0.62 | %(g) | | | 0.67 | %(h) | | | 0.69 | %(h) | | | 0.72 | %(h) | | | 0.84 | %(h) |
| | | | | | | | | | | | | | | | | | | | | | | | | | | | | | | | |
Total expenses after fees waived and/or reimbursed and paid indirectly | | | 0.58 | %(f) | | | 0.59 | %(g)(f) | | | | | | | 0.62 | %(g) | | | 0.67 | %(h) | | | 0.69 | %(h) | | | 0.72 | %(h) | | | 0.84 | %(h) |
| | | | | | | | | | | | | | | | | | | | | | | | | | | | | | | | |
Total expenses after fees waived and/or reimbursed and paid indirectly and excluding interest expense and fees, and amortization of offering costs(i)(j) | | | 0.58 | %(f) | | | 0.59 | %(f)(g) | | | | | | | 0.60 | %(g) | | | 0.65 | %(h) | | | 0.68 | %(h) | | | 0.71 | %(h) | | | 0.84 | %(h) |
| | | | | | | | | | | | | | | | | | | | | | | | | | | | | | | | |
Net investment income | | | 2.52 | %(f) | | | 2.66 | %(f) | | | | | | | 2.81 | %(g) | | | 3.43 | %(h) | | | 3.54 | %(h) | | | 3.75 | %(h) | | | 4.61 | %(h) |
| | | | | | | | | | | | | | | | | | | | | | | | | | | | | | | | |
Distributions to AMPS Shareholders | | | — | % | | | — | % | | | | | | | 0.02 | % | | | 0.08 | % | | | 0.03 | % | | | 0.02 | % | | | 0.05 | % |
| | | | | | | | | | | | | | | | | | | | | | | | | | | | | | | | |
Net investment income to Common Shareholders | | | 2.52 | %(f) | | | 2.66 | %(f) | | | | | | | 2.79 | % | | | 3.35 | % | | | 3.51 | % | | | 3.73 | % | | | 4.56 | % |
| | | | | | | | | | | | | | | | | | | | | | | | | | | | | | | | |
| | | | | | | | |
Supplemental Data | | | | | | | | | | | | | | | | | | | | | | | | | | | | | | | | |
Net assets applicable to Common Shareholders, end of period (000) | | $ | 306,461 | | | $ | 305,906 | | | | | | | $ | 308,155 | | | $ | 315,759 | | | $ | 329,241 | | | $ | 329,810 | | | $ | 328,163 | |
| | | | | | | | | | | | | | | | | | | | | | | | | | | | | | | | |
Preferred Shares outstanding at $25,000 liquidation preference, end of period (000) | | $ | — | | | $ | — | | | | | | | $ | — | | | $ | 11,328 | | | $ | 34,578 | | | $ | 53,700 | | | $ | 67,950 | |
| | | | | | | | | | | | | | | | | | | | | | | | | | | | | | | | |
Asset coverage per Preferred Share at $25,000 liquidation preference, end of period (000) | | $ | — | | | $ | — | | | | | | | $ | — | | | $ | 721,856 | | | $ | 263,065 | | | $ | 178,543 | | | $ | 145,738 | |
| | | | | | | | | | | | | | | | | | | | | | | | | | | | | | | | |
Borrowings outstanding, end of period (000) | | $ | — | | | $ | — | | | | | | | $ | — | | | $ | 3,750 | | | $ | 3,750 | | | $ | 3,750 | | | $ | 3,750 | |
| | | | | | | | | | | | | | | | | | | | | | | | | | | | | | | | |
Portfolio turnover rate | | | 5 | % | | | 8 | % | | | | | | | 9 | % | | | 8 | % | | | 4 | % | | | 11 | % | | | 8 | % |
| | | | | | | | | | | | | | | | | | | | | | | | | | | | | | | | |
| (a) | Based on average Common Shares outstanding. |
| (b) | Amount is greater than $(0.005) per share. |
| (c) | Distributions for annual periods determined in accordance with U.S. federal income tax regulations. |
| (d) | Total returns based on market price, which can be significantly greater or less than the net asset value, may result in substantially different returns. Where applicable, excludes the effects of any sales charges and assumes the reinvestment of distributions at actual reinvestment prices. |
| (e) | Aggregate total return. |
| (g) | Audit costs were not annualized in the calculation of the expense ratios. If these expenses were annualized, the total expenses would have been 0.60%. |
| (h) | Does not reflect the effect of distributions to AMPS Shareholders. |
| (i) | Interest expense and fees relate to TOB Trusts. See Note 4 of the Notes to Financial Statements for details. |
| (j) | The total expense ratio after fees waived and/or reimbursed and paid indirectly and excluding interest expense, fees, amortization of offering costs, liquidity and remarketing fees were as follows: |
| | | | | | | | | | | | | | | | | | | | | | | | | | | | | | | | | | | | | | | | | | | | | | | | | | | | | | | | |
| | | Six Months Ended
06/30/19
(unaudited) | | | | | | Period from
05/01/18
to 12/31/18 | | | | | | Year Ended April 30, | |
| | | 2018 | | | | | | 2017 | | | | | | 2016 | | | | | | 2015 | | | | | | 2014 | | | | |
Expense ratios | | | 0.58 | % | | | | | | | 0.62 | % | | | | | | | 0.62 | % | | | | | | | 0.64 | % | | | | | | | 0.66 | % | | | | | | | 0.69 | % | | | | | | | 0.79 | % | | | | |
| | | | | | | | | | | | | | | | | | | | | | | | | | | | | | | | | | | | | | | | | | | | | | | | | | | | | | | | |
See notes to financial statements.
Notes to Financial Statements (unaudited)
The following are registered under the Investment Company Act of 1940, as amended (the “1940 Act”), asclosed-end management investment companies and are referred to herein collectively as the “Trusts”, or individually as a “Trust”:
| | | | | | |
| Trust Name | | Herein Referred To As | | Organized | | Diversification
Classification |
BlackRock Florida Municipal 2020 Term Trust | | BFO | | Delaware | | Non-diversified |
BlackRock Municipal 2020 Term Trust | | BKK | | Delaware | | Diversified |
The Boards of Trustees of the Trusts are collectively referred to throughout this report as the “Board of Trustees” or the “Board,” and the trustees thereof are collectively referred to throughout this report as “Trustees”. The Trusts determine and make available for publication the net asset value (“NAV”) of their common shares (“Common Shares”) on a daily basis.
The Trusts, together with certain other registered investment companies advised by BlackRock Advisors, LLC (the “Manager”) or its affiliates, are included in a complex ofnon-index fixed-income mutual funds and all BlackRock-advisedclosed-end funds referred to as the BlackRock Fixed-Income Complex.
| 2. | SIGNIFICANT ACCOUNTING POLICIES |
The financial statements are prepared in conformity with accounting principles generally accepted in the United States of America (“U.S. GAAP”), which may require management to make estimates and assumptions that affect the reported amounts of assets and liabilities in the financial statements, disclosure of contingent assets and liabilities at the date of the financial statements and the reported amounts of increases and decreases in net assets from operations during the reporting period. Actual results could differ from those estimates. Each Trust is considered an investment company under U.S. GAAP and follows the accounting and reporting guidance applicable to investment companies. Below is a summary of significant accounting policies:
Investment Transactions and Income Recognition:For financial reporting purposes, investment transactions are recorded on the dates the transactions are executed. Realized gains and losses on investment transactions are determined on the identified cost basis. Dividend income is recorded on theex-dividend date. Interest income, including amortization and accretion of premiums and discounts on debt securities, is recognized on an accrual basis.
Distributions: Distributions from net investment income are declared monthly and paid monthly. Distributions of capital gains are recorded on theex-dividend date and made at least annually. The character and timing of distributions are determined in accordance with U.S. federal income tax regulations, which may differ from U.S. GAAP.
Deferred Compensation Plan:Under the Deferred Compensation Plan (the “Plan”) approved by each Trust’s Board, the trustees who are not “interested persons” of the Trusts, as defined in the 1940 Act (“Independent Trustees”) may defer a portion of their annual complex-wide compensation. Deferred amounts earn an approximate return as though equivalent dollar amounts had been invested in common shares of certain funds in the BlackRock Fixed-Income Complex selected by the Independent Trustees. This has the same economic effect for the Independent Trustees as if the Independent Trustees had invested the deferred amounts directly in certain funds in the BlackRock Fixed-Income Complex.
The Plan is not funded and obligations thereunder represent general unsecured claims against the general assets of each Trust, as applicable. Deferred compensation liabilities are included in the Trustees’ and Officer’s fees payable in the Statements of Assets and Liabilities and will remain as a liability of the Trusts until such amounts are distributed in accordance with the Plan.
Recent Accounting Standards: BKK has adopted Financial Accounting Standards Board Accounting Standards Update 2017-08 to amend the amortization period for certain purchased callable debt securities held at a premium. Under the new standard, the Trust has changed the amortization period for the premium on certain purchased callable debt securities with non-contingent call features to the earliest call date. In accordance with the transition provisions of the standard, the Trust applied the amendments on a modified retrospective basis beginning with the current reporting period ended June 30, 2019. The cost basis of securities at December 31, 2018 has been adjusted to $299,852,451. This change in accounting policy has been made to comply with the newly issued accounting standard and had no impact on total accumulated earnings (loss) or the NAV of the Trust.
Indemnifications:In the normal course of business, a Trust enters into contracts that contain a variety of representations that provide general indemnification. A Trust’s maximum exposure under these arrangements is unknown because it involves future potential claims against a Trust, which cannot be predicted with any certainty.
Other: Expenses directly related to a Trust are charged to that Trust. Other operating expenses shared by several funds, including other funds managed by the Manager, are prorated among those funds on the basis of relative net assets or other appropriate methods.
| 3. | INVESTMENT VALUATION AND FAIR VALUE MEASUREMENTS |
Investment Valuation Policies: The Trusts’ investments are valued at fair value (also referred to as “market value” within the financial statements) as of the close of trading on the New York Stock Exchange (“NYSE”) (generally 4:00 p.m., Eastern time) (or if the reporting date falls on a day the NYSE is closed, investments are valued at fair value as of the period end). U.S. GAAP defines fair value as the price the Trusts would receive to sell an asset or pay to transfer a liability in an orderly transaction between market participants at the measurement date. The Trusts determine the fair values of their financial instruments using various independent dealers or pricing services under policies approved by the Board. The BlackRock Global Valuation Methodologies Committee (the “Global Valuation Committee”) is the committee formed by management to develop global pricing policies and procedures and to oversee the pricing function for all financial instruments.
| | |
| 22 | | 2019 BLACKROCK SEMI-ANNUAL REPORTTO SHAREHOLDERS |
Notes to Financial Statements (unaudited) (continued)
Fair Value Inputs and Methodologies: The following methods and inputs are used to establish the fair value of each Trust’s assets and liabilities:
| | • | | Fixed-income securities for which market quotations are readily available are generally valued using the last available bid prices or current market quotations provided by independent dealers or third party pricing services. Floating rate loan interests are valued at the mean of the bid prices from one or more independent brokers or dealers as obtained from a third party pricing service. Pricing services generally value fixed-income securities assuming orderly transactions of an institutional round lot size, but a fund may hold or transact in such securities in smaller, odd lot sizes. Odd lots may trade at lower prices than institutional round lots. The pricing services may use matrix pricing or valuation models that utilize certain inputs and assumptions to derive values, including transaction data (e.g., recent representative bids and offers), credit quality information, perceived market movements, news, and other relevant information. Certain fixed-income securities, including asset-backed and mortgage related securities may be valued based on valuation models that consider the estimated cash flows of each tranche of the entity, establish a benchmark yield and develop an estimated tranche specific spread to the benchmark yield based on the unique attributes of the tranche. The amortized cost method of valuation may be used with respect to debt obligations with sixty days or less remaining to maturity unless the Manager determines such method does not represent fair value. |
| | • | | Municipal investments (including commitments to purchase such investments on a “when-issued” basis) are valued on the basis of prices provided by dealers or pricing services. In determining the value of a particular investment, pricing services may use certain information with respect to transactions in such investments, quotations from dealers, pricing matrixes, market transactions in comparable investments and information with respect to various relationships between investments. |
| | • | | Investments inopen-end U.S. mutual funds are valued at NAV each business day. |
If events (e.g., a company announcement, market volatility or a natural disaster) occur that are expected to materially affect the value of such investments, or in the event that the application of these methods of valuation results in a price for an investment that is deemed not to be representative of the market value of such investment, or if a price is not available, the investment will be valued by the Global Valuation Committee, or its delegate, in accordance with a policy approved by the Board as reflecting fair value (“Fair Valued Investments”). The fair valuation approaches that may be used by the Global Valuation Committee will include market approach, income approach and cost approach. Valuation techniques such as discounted cash flow, use of market comparables and matrix pricing are types of valuation approaches and are typically used in determining fair value. When determining the price for Fair Valued Investments, the Global Valuation Committee, or its delegate, seeks to determine the price that each Trust might reasonably expect to receive or pay from the current sale or purchase of that asset or liability in anarm’s-length transaction. Fair value determinations shall be based upon all available factors that the Global Valuation Committee, or its delegate, deems relevant and consistent with the principles of fair value measurement. The pricing of all Fair Valued Investments is subsequently reported to the Board or a committee thereof on a quarterly basis.
Fair Value Hierarchy: Various inputs are used in determining the fair value of investments. These inputs to valuation techniques are categorized into a fair value hierarchy consisting of three broad levels for financial statement purposes as follows:
| | • | | Level 1 — Unadjusted price quotations in active markets/exchanges for identical assets or liabilities that each Trust has the ability to access |
| | • | | Level 2 — Other observable inputs (including, but not limited to, quoted prices for similar assets or liabilities in markets that are active, quoted prices for identical or similar assets or liabilities in markets that are not active, inputs other than quoted prices that are observable for the assets or liabilities (such as interest rates, yield curves, volatilities, prepayment speeds, loss severities, credit risks and default rates) or other market–corroborated inputs) |
| | • | | Level 3 — Unobservable inputs based on the best information available in the circumstances, to the extent observable inputs are not available (including each Trust’s own assumptions used in determining the fair value of investments) |
The hierarchy gives the highest priority to unadjusted quoted prices in active markets for identical assets or liabilities (Level 1 measurements) and the lowest priority to unobservable inputs (Level 3 measurements). Accordingly, the degree of judgment exercised in determining fair value is greatest for instruments categorized in Level 3. The inputs used to measure fair value may fall into different levels of the fair value hierarchy. In such cases, for disclosure purposes, the fair value hierarchy classification is determined based on the lowest level input that is significant to the fair value measurement in its entirety. Investments classified within Level 3 have significant unobservable inputs used by the Global Valuation Committee in determining the price for Fair Valued Investments. Level 3 investments include equity or debt issued by privately held companies or funds. There may not be a secondary market, and/or there are a limited number of investors. The categorization of a value determined for investments is based on the pricing transparency of the investments and is not necessarily an indication of the risks associated with investing in those securities.
| 4. | SECURITIES AND OTHER INVESTMENTS |
Zero-Coupon Bonds: Zero-coupon bonds are normally issued at a significant discount from face value and do not provide for periodic interest payments. These bonds may experience greater volatility in market value than other debt obligations of similar maturity which provide for regular interest payments.
Forward Commitments, When-Issued and Delayed Delivery Securities: Certain Trusts may purchase securities on a when-issued basis and may purchase or sell securities on a forward commitment basis. Settlement of such transactions normally occurs within a month or more after the purchase or sale commitment is made. A Trust may purchase securities under such conditions with the intention of actually acquiring them, but may enter into a separate agreement to sell the securities before the settlement date. Since the value of securities purchased may fluctuate prior to settlement, a Trust may be required to pay more at settlement than the security is worth. In addition, a Trust is not entitled to any of the interest earned prior to settlement. When purchasing a security on a delayed delivery basis, a Trust assumes the rights and risks of ownership of the security, including the risk of price and yield fluctuations. In the event of default by the counterparty, a Trust’s maximum amount of loss is the unrealized appreciation of unsettled when-issued transactions.
Municipal Bonds Transferred to TOB Trusts: Certain Trusts leverage their assets through the use of “TOB Trust” transactions. The trusts transfer municipal bonds into a special purpose trust (a “TOB Trust”). A TOB Trust issues two classes of beneficial interests: short-term floating rate interests (“TOB Trust Certificates”), which are sold to third party investors, and residual inverse floating rate interests (“TOB Residuals”), which are issued to the participating trusts that contributed the municipal bonds to the
| | | | |
| NOTESTO FINANCIAL STATEMENTS | | | 23 | |
Notes to Financial Statements (unaudited) (continued)
TOB Trust. The TOB Trust Certificates have interest rates that reset weekly and their holders have the option to tender such certificates to the TOB Trust for redemption at par and any accrued interest at each reset date. The TOB Residuals held by a trust provide the trust with the right to cause the holders of a proportional share of the TOB Trust Certificates to tender their certificates to the TOB Trust at par plus accrued interest. The trusts may withdraw a corresponding share of the municipal bonds from the TOB Trust. Other trusts managed by the investment adviser may also contribute municipal bonds to a TOB Trust into which a trust has contributed bonds. If multiple BlackRock advised funds participate in the same TOB Trust, the economic rights and obligations under the TOB Residuals will be shared among the trusts ratably in proportion to their participation in the TOB Trust.
TOB Trusts are supported by a liquidity facility provided by a third party bank or other financial institution (the “Liquidity Provider”) that allows the holders of the TOB Trust Certificates to tender their certificates in exchange for payment of par plus accrued interest on any business day. The tendered TOB Trust Certificates are remarketed by a Remarketing Agent. In the event of a failed remarketing, the TOB Trust may draw upon a loan from the Liquidity Provider to purchase the tendered TOB Trust Certificates. Any loans made by the Liquidity Provider will be secured by the purchased TOB Trust Certificates held by the TOB Trust and will be subject to an increased interest rate based on number of days the loan is outstanding.
The TOB Trust may be collapsed without the consent of a trust, upon the occurrence of a termination event, as defined in the TOB Trust agreement. Upon the occurrence of a termination event, a TOB Trust would be liquidated with the proceeds applied first to any accrued fees owed to the trustee of the TOB Trust, the Remarketing Agent and the Liquidity Provider. Upon certain termination events, TOB Trust Certificates holders will be paid before the TOB Residuals holders (i.e., the Trusts) whereas in other termination events, TOB Trust Certificates holders and TOB Residuals holders will be paid pro rata.
While a trust’s investment policies and restrictions expressly permit investments in inverse floating rate securities, such as TOB Residuals, they restrict the ability of a trust to borrow money for purposes of making investments. Each Trust’s transfer of the municipal bonds to a TOB Trust is considered a secured borrowing for financial reporting purposes. The cash received by the TOB Trust from the sale of the TOB Trust Certificates, less certain transaction expenses, is paid to a trust. A trust typically invests the cash received in additional municipal bonds.
Accounting for TOB Trusts: The municipal bonds deposited into a TOB Trust are presented in a trust’s Schedules of Investments and the TOB Trust Certificates are shown in Other Liabilities in the Statements of Assets and Liabilities. Any loans drawn by the TOB Trust pursuant to the liquidity facility to purchase tendered TOB Trust Certificates are shown as Loan for TOB Trust Certificates. The carrying amount of a trust’s payable to the holder of the TOB Trust Certificates, as reported in the Statements of Assets and Liabilities as TOB Trust Certificates, approximates its fair value.
Interest income, including amortization and accretion of premiums and discounts, from the underlying municipal bonds is recorded by a trust on an accrual basis. Interest expense incurred on the TOB Trust transaction and other expenses related to remarketing, administration, trustee, liquidity and other services to a TOB Trust are shown as interest expense, fees and amortization of offering costs in the Statements of Operations. Fees paid upon creation of the TOB Trust are recorded as debt issuance costs and are amortized to interest expense, fees and amortization of offering costs in the Statements of Operations to the expected maturity of the TOB Trust. In connection with the restructurings of the TOB Trusts tonon-bank sponsored TOB Trusts, a trust incurrednon-recurring, legal and restructuring fees, which are recorded as interest expense, fees and amortization of deferred offering costs in the Statements of Operations. For the six months ended June 30, 2019, there were no amounts recorded within interest expense, fees and amortization of offering costs in the Statements of Operations.
For the six months ended June 30, 2019, the Trusts did not hold TOB Trusts.
| 5. | INVESTMENT ADVISORY AGREEMENT AND OTHER TRANSACTIONS WITH AFFILIATES |
Investment Advisory: Each Trust entered into an Investment Advisory Agreement with the Manager, the Trusts’ investment adviser and an indirect, wholly-owned subsidiary of BlackRock, Inc. (“BlackRock”) to provide investment advisory and administrative services. The Manager is responsible for the management of each Trust’s portfolio and provides the personnel, facilities, equipment and certain other services necessary to the operations of each Trust.
For such services, each Trust pays the Manager a monthly fee at an annual rate equal to 0.50% of the average weekly value of each Trust’s managed assets.
For purposes of calculating these fees, “managed assets” means the total assets of the Trust minus the sum of its accrued liabilities (other than the aggregate indebtedness constituting financial leverage).
Expense Waivers: With respect to BFO, effective January 1, 2019, the Manager voluntarily agreed to waive the entirety of its investment advisory fees. This voluntary waiver may be reduced or discontinued at any time without notice. For the six months ended June 30, 2019, the Manager waived $201,597 in investment advisory fees pursuant to this arrangement, which is included in fees waived and/or reimbursed by the Manager in the Statements of Operations.
With respect to each Trust, the Manager voluntarily agreed to waive its investment advisory fees by the amount of investment advisory fees each Trust pays to the Manager indirectly through its investment in affiliated money market funds (the “affiliated money market fund waiver”). These amounts are included in fees waived and/or reimbursed by the Manager in the Statements of Operations. For the six months ended June 30, 2019 the amounts waived were as follows:
| | | | | | | | |
| | | BFO | | | BKK | |
Amounts waived | | $ | 743 | | | $ | 2,907 | |
The Manager contractually agreed to waive its investment advisory fee with respect to any portion of each Trust’s assets invested in affiliated equity and fixed-income mutual funds and affiliated exchange-traded funds that have a contractual management fee through June 30, 2020. The agreement can be renewed for annual periods thereafter, and may be terminated on 90 days’ notice, each subject to approval by a majority of the Trusts’ Independent Trustees. For the six months ended June 30, 2019, there were no fees waived by the Manager pursuant to these arrangements.
Trustees and Officers: Certain trustees and/or officers of the Trusts are trustees and/or officers of BlackRock or its affiliates. The Trusts reimburse the Manager for a portion of the compensation paid to the Trusts’ Chief Compliance Officer, which is included in Trustees and Officer in the Statements of Operations.
| | |
| 24 | | 2019 BLACKROCK SEMI-ANNUAL REPORTTO SHAREHOLDERS |
Notes to Financial Statements (unaudited) (continued)
For the six months ended June 30, 2019, purchases and sales of investments, excluding short-term securities, were as follows:
| | | | | | | | |
| | | BFO | | | BKK | |
Purchases | | $ | 8,542,635 | | | $ | 15,647,200 | |
Sales | | | 7,295,306 | | | | 23,375,560 | |
It is each Trust’s policy to comply with the requirements of the Internal Revenue Code of 1986, as amended, applicable to regulated investment companies, and to distribute substantially all of its taxable income to its shareholders. Therefore, no U.S. federal income tax provision is required.
Each Trust files U.S. federal and various state and local tax returns. No income tax returns are currently under examination. The statute of limitations on BFO’s U.S. federal tax returns generally remains open for each of the three years ended July 31, 2018 and the period ended December 31, 2018. The statute of limitations on BKK’s U.S. federal tax returns generally remains open for each of the three years ended April 30, 2018 and the period ended December 31, 2018. The statutes of limitations on each Trust’s state and local tax returns may remain open for an additional year depending upon the jurisdiction.
Management has analyzed tax laws and regulations and their application to the Trusts as of June 30, 2019, inclusive of the open tax return years, and does not believe that there are any uncertain tax positions that require recognition of a tax liability in the Trusts’ financial statements.
As of December 31, 2018, the Trusts had capital loss carryforwards, with no expiration dates, available to offset future realized capital gains as follows:
| | | | | | | | |
| | | BFO | | | BKK | |
No expiration date | | $ | 730,142 | | | $ | 1,169,007 | |
| | | | | | | | |
As of June 30, 2019, gross unrealized appreciation and depreciation for investments based on cost for U.S. federal income tax purposes were as follows:
| | | | | | | | |
| | | BFO | | | BKK | |
Tax cost | | $ | 80,807,403 | | | $ | 299,334,611 | |
| | | | | | | | |
Gross unrealized appreciation | | $ | 750,997 | | | $ | 5,245,475 | |
Gross unrealized depreciation | | | (1,247,346 | ) | | | (1,530,555 | ) |
| | | | | | | | |
Net unrealized appreciation (depreciation) | | $ | (496,349 | ) | | $ | 3,714,920 | |
| | | | | | | | |
Many municipalities insure repayment of their bonds, which may reduce the potential for loss due to credit risk. The market value of these bonds may fluctuate for other reasons, including market perception of the value of such insurance, and there is no guarantee that the insurer will meet its obligation.
Inventories of municipal bonds held by brokers and dealers may decrease, which would lessen their ability to make a market in these securities. Such a reduction in market making capacity could potentially decrease a Trust’s ability to buy or sell bonds. As a result, a Trust may sell a security at a lower price, sell other securities to raise cash, or give up an investment opportunity, any of which could have a negative impact on performance. If a Trust needed to sell large blocks of bonds, those sales could further reduce the bonds’ prices and impact performance.
In the normal course of business, certain Trusts invest in securities or other instruments and may enter into certain transactions, and such activities subject each Trust to various risks, including among others, fluctuations in the market (market risk) or failure of an issuer to meet all of its obligations. The value of securities or other instruments may also be affected by various factors, including, without limitation: (i) the general economy; (ii) the overall market as well as local, regional or global political and/or social instability; (iii) regulation, taxation or international tax treaties between various countries; or (iv) currency, interest rate and price fluctuations.
Each Trust may be exposed to prepayment risk, which is the risk that borrowers may exercise their option to prepay principal earlier than scheduled during periods of declining interest rates, which would force each Trust to reinvest in lower yielding securities. Each Trust may also be exposed to reinvestment risk, which is the risk that income from each Trust’s portfolio will decline if each Trust invests the proceeds from matured, traded or called fixed-income securities at market interest rates that are below each Trust portfolio’s current earnings rate.
The Trusts may hold a significant amount of bonds subject to calls by the issuers at defined dates and prices. When bonds are called by issuers and the Trusts reinvest the proceeds received, such investments may be in securities with lower yields than the bonds originally held, and correspondingly, could adversely impact the yield and total return performance of a Trust.
There is no assurance that each Trust will achieve its investment objective and each Trust may return less than $15.00 per share. As each Trust approaches its scheduled termination date, it is expected that the maturity of the Trusts’ portfolio securities will shorten, which is likely to reduce the Trusts’ income and distributions to shareholders.
Counterparty Credit Risk:The Trusts may be exposed to counterparty credit risk, or the risk that an entity may fail to or be unable to perform on its commitments related to unsettled or open transactions. The Trusts manage counterparty credit risk by entering into transactions only with counterparties that the Manager believes have the financial resources to honor their obligations and by monitoring the financial stability of those counterparties. Financial assets, which potentially expose the Trusts to
| | | | |
| NOTESTO FINANCIAL STATEMENTS | | | 25 | |
Notes to Financial Statements (unaudited) (continued)
market, issuer and counterparty credit risks, consist principally of financial instruments and receivables due from counterparties. The extent of the Trusts’ exposure to market, issuer and counterparty credit risks with respect to these financial assets is approximately their value recorded in the Statements of Assets and Liabilities, less any collateral held by the Trusts.
Concentration Risk:BFO invests a substantial amount of its assets in issuers located in a single state or limited number of states. This may subject the Trust to the risk that economic, political or social issues impacting a particular state or group of states could have an adverse and disproportionate impact on the income from, or the value or liquidity of, the Trust’s portfolio. Investment percentages in specific states or U.S. territories are presented in the Schedules of Investments.
As of period end, BFO invested a significant portion of its assets in securities in the health sector. Changes in economic conditions affecting such sector would have a greater impact on the Trust and could affect the value, income and/or liquidity of positions in such securities.
Certain Trusts invest a significant portion of their assets in fixed-income securities and/or use derivatives tied to the fixed-income markets. Changes in market interest rates or economic conditions may affect the value and/or liquidity of such investments. Interest rate risk is the risk that prices of bonds and other fixed-income securities will increase as interest rates fall and decrease as interest rates rise. The Trusts may be subject to a greater risk of rising interest rates due to the current period of historically low rates.
| 9. | CAPITAL SHARE TRANSACTIONS |
Each Trust is authorized to issue an unlimited number of shares, all of which were initially classified as Common Shares. The par value for each Trust’s Common Shares is $0.001.
On April 29, 2019, the Board of Trustees authorized BFO to participate in an open market share repurchase program (the “Repurchase Program”). Under the Repurchase Program, BFO may repurchase up to 20% of its outstanding common shares, based on common shares outstanding on March 31, 2019, in open market transactions through the earlier of (i) November 30, 2020 or (ii) BFO’s adoption of a plan of termination, subject to certain conditions. There is no assurance that BFO will purchase shares in any particular amounts.
The total cost of the shares repurchased is reflected in BFO’s Statements of Changes in Net Assets. For the periods shown, shares repurchased and cost, including transaction costs were as follows:
| | | | | | | | |
| | | Shares | | | Amount | |
June 30, 2019 | | | 15,767 | | | $ | 227,146 | |
For the six months ended June 30, 2019, shares issued and outstanding remained constant for BKK. For the fiscal year ended 2018, shares issued and outstanding remained constant for BKK and BFO.
Management’s evaluation of the impact of all subsequent events on the Trusts’ financial statements were completed through the date the financial statements were issued and the following items were noted:
| | | | | | | | |
| | | Common Dividend
Per Share | |
| | | Paid | | | Declared (c) | |
BFO | | $ | 0.0200 | (a) | | $ | 0.0200 | |
BKK | | | 0.0288 | (b) | | | 0.0288 | |
| | (a) | Net investment income dividend paid on July 31, 2019, to Common Shareholders of record on July 15, 2019. | |
| | (b) | Net investment income dividend paid on August 1, 2019, to Common Shareholders of record on July 15, 2019. | |
| | (c) | Net investment income dividend declared on August 1, 2019, payable to Common Shareholders of record on August 15, 2019. | |
| | |
| 26 | | 2019 BLACKROCK SEMI-ANNUAL REPORTTO SHAREHOLDERS |
Disclosure of Investment Advisory Agreements
The Boards of Trustees (collectively, the “Board,” the members of which are referred to as “Board Members”) of BlackRock Florida Municipal 2020 Term Trust (“BFO”) and BlackRock Municipal 2020 Term Trust (“BKK” and together with BFO, the “Funds” and each, a “Fund”) met in person on May 1, 2019 (the “May Meeting”) and June5-6, 2019 (the “June Meeting”) to consider the approval of the investment advisory agreement (collectively, the “Advisory Agreements” or the “Agreements”) between each Fund and BlackRock Advisors, LLC (the “Manager” or “BlackRock”), each Fund’s investment advisor.
Activities and Composition of the Board
On the date of the June Meeting, the Board consisted of eleven individuals, nine of whom were not “interested persons” of each Fund as defined in the Investment Company Act of 1940, as amended (the “1940 Act”) (the “Independent Board Members”). The Board Members are responsible for the oversight of the operations of each Fund and perform the various duties imposed on the directors of investment companies by the 1940 Act. The Independent Board Members have retained independent legal counsel to assist them in connection with their duties. TheCo-Chairs of the Board are Independent Board Members. The Board has established five standing committees: an Audit Committee, a Governance and Nominating Committee, a Compliance Committee, a Performance Oversight Committee and an Executive Committee, each of which is chaired by an Independent Board Member and composed of Independent Board Members (except for the Executive Committee, which also has one interested Board Member).
The Agreements
Consistent with the requirements of the 1940 Act, the Board considers the continuation of the Agreements on an annual basis. The Board has four quarterly meetings per year, each typically extending for two days, and additionalin-person and telephonic meetings throughout the year, as needed. While the Board also has a fifthone-day meeting to consider specific information surrounding the renewal of the Agreements, the Board’s consideration entails a year-long deliberative process whereby the Board and its committees assess BlackRock’s services to each Fund. In particular, the Board assessed, among other things, the nature, extent and quality of the services provided to each Fund by BlackRock, BlackRock’s personnel and affiliates, including (as applicable): investment management; accounting, administrative and shareholder services; oversight of each Fund’s service providers; risk management and oversight; legal and compliance services; and ability to meet applicable legal and regulatory requirements. Throughout the year, including during the contract renewal process, the Independent Board Members were advised by independent legal counsel, and met with independent legal counsel in various executive sessions outside of the presence of management.
During the year, the Board, acting directly and through its committees, considers information that is relevant to its annual consideration of the renewal of the Agreements, including the services and support provided by BlackRock to each Fund and its shareholders. BlackRock also furnished additional information to the Board in response to specific questions from the Board. This additional information is discussed further below in the section titled “Board Considerations in Approving the Agreements.” Among the matters the Board considered were: (a) investment performance forone-year, three-year, five-year,ten-year, and/or since inception periods, as applicable, against peer funds, applicable benchmarks, and performance metrics, as applicable, as well as senior management’s and portfolio managers’ analyses of the reasons for any over-performance or underperformance relative to its peers, benchmarks, and other performance metrics, as applicable; (b) leverage management, as applicable; (c) fees, including advisory, administration, if applicable, and other amounts paid to BlackRock and its affiliates by each Fund for services; (d) Fund operating expenses and how BlackRock allocates expenses to each Fund; (e) the resources devoted to, risk oversight of, and compliance reports relating to, implementation of each Fund’s investment objective, policies and restrictions, and meeting regulatory requirements; (f) BlackRock and each Fund’s adherence to applicable compliance policies and procedures; (g) the nature, character and scope ofnon-investment management services provided by BlackRock and its affiliates and the estimated cost of such services; (h) BlackRock’s and other service providers’ internal controls and risk and compliance oversight mechanisms; (i) BlackRock’s implementation of the proxy voting policies approved by the Board; (j) execution quality of portfolio transactions; (k) BlackRock’s implementation of each Fund’s valuation and liquidity procedures; (l) an analysis of management fees for products with similar investment mandates across theopen-end fund,closed-end fund,sub-advised mutual fund, collective investment trust, and institutional separate account product channels, as applicable, and the similarities and differences between these products and the services provided as compared to each Fund; (m) BlackRock’s compensation methodology for its investment professionals and the incentives and accountability it creates, along with investment professionals’ investments in the fund(s) they manage; (n) periodic updates on BlackRock’s business; and (o) each Fund’s market discount/premium compared to peer funds.
Board Considerations in Approving the Agreements
The Approval Process: Prior to the May Meeting, the Board requested and received materials specifically relating to the Agreements. The Independent Board Members are continuously engaged in a process with their independent legal counsel and BlackRock to review the nature and scope of the information provided to better assist its deliberations. The materials provided in connection with the May Meeting included, among other things: (a) information independently compiled and prepared by Broadridge Financial Solutions, Inc. (“Broadridge”), based on Lipper classifications, regarding each Fund’s fees and expenses as compared with a peer group of funds as determined by Broadridge (“Expense Peers”), the investment performance of each Fund as compared with a peer group of funds (“Performance Peers”) and other metrics, as applicable; (b) information on the composition of the Expense Peers and Performance Peers, and a description of Broadridge’s methodology; (c) information on the estimated profits realized by BlackRock and its affiliates pursuant to the Agreements and a discussion offall-out benefits to BlackRock and its affiliates; (d) a general analysis provided by BlackRock concerning investment management fees received in connection with other types of investment products, such as institutional accounts,sub-advised mutual funds,closed-end funds, andopen-end funds, under similar investment mandates, as applicable; (e) review ofnon-management fees; (f) the existence, impact and sharing of potential economies of scale, if any, with each Fund; (g) a summary of aggregate amounts paid by each Fund to BlackRock; and (h) various additional information requested by the Board as appropriate regarding BlackRock’s and each Fund’s operations.
At the May Meeting, the Board reviewed materials relating to its consideration of the Agreements. As a result of the discussions that occurred during the May Meeting, and as a culmination of the Board’s year-long deliberative process, the Board presented BlackRock with questions and requests for additional information. BlackRock responded to these requests with additional written information in advance of the June Meeting. Topics covered included: (a) the methodology for measuring estimated fund profitability; (b) fund expenses and potential fee waivers; (c) differences in services provided and management fees betweenclosed-end funds and other product channels; and (d) BlackRock’s option overwrite strategy.
| | | | |
| DISCLOSUREOF INVESTMENT ADVISORY AGREEMENTS | | | 27 | |
Disclosure of Investment Advisory Agreements (continued)
At the June Meeting, the Board concluded its assessment of, among other things: (a) the nature, extent and quality of the services provided by BlackRock; (b) the investment performance of each Fund as compared with Performance Peers and other metrics, as applicable; (c) the advisory fee and the estimated cost of the services and estimated profits realized by BlackRock and its affiliates from their relationship with each Fund; (d) each Fund’s fees and expenses compared to Expense Peers; (e) the sharing of potential economies of scale;(f) fall-out benefits to BlackRock and its affiliates as a result of BlackRock’s relationship with each Fund; and (g) other factors deemed relevant by the Board Members.
The Board also considered other matters it deemed important to the approval process, such as other payments made to BlackRock or its affiliates relating to securities lending and cash management, and BlackRock’s services related to the valuation and pricing of Fund portfolio holdings. The Board noted the willingness of BlackRock personnel to engage in open, candid discussions with the Board. The Board did not identify any particular information as determinative, and each Board Member may have attributed different weights to the various items considered.
A. Nature, Extent and Quality of the Services Provided by BlackRock: The Board, including the Independent Board Members, reviewed the nature, extent and quality of services provided by BlackRock, including the investment advisory services and the resulting performance of each Fund. Throughout the year, the Board compared Fund performance to the performance of a comparable group ofclosed-end funds, relevant benchmarks, and performance metrics, as applicable. The Board met with BlackRock’s senior management personnel responsible for investment activities, including the senior investment officers. The Board also reviewed the materials provided by each Fund’s portfolio management team discussing each Fund’s performance and each Fund’s investment objective, strategies and outlook.
The Board considered, among other factors, with respect to BlackRock: the number, education and experience of investment personnel generally and each Fund’s portfolio management team; BlackRock’s research capabilities; investments by portfolio managers in the funds they manage; portfolio trading capabilities; use of technology; commitment to compliance; credit analysis capabilities; risk analysis and oversight capabilities; and the approach to training and retaining portfolio managers and other research, advisory and management personnel. The Board also considered BlackRock’s overall risk management program, including the continued efforts of BlackRock and its affiliates to address cybersecurity risks and the role of BlackRock’s Risk & Quantitative Analysis Group. The Board engaged in a review of BlackRock’s compensation structure with respect to each Fund’s portfolio management team and BlackRock’s ability to attract and retain high-quality talent and create performance incentives.
In addition to investment advisory services, the Board considered the nature and quality of the administrative and othernon-investment advisory services provided to each Fund. BlackRock and its affiliates provide each Fund with certain administrative, shareholder and other services (in addition to any such services provided to each Fund by third parties) and officers and other personnel as are necessary for the operations of each Fund. In particular, BlackRock and its affiliates provide each Fund with administrative services including, among others: (i) responsibility for disclosure documents, such as the prospectus and the statement of additional information in connection with the initial public offering and periodic shareholder reports; (ii) preparing communications with analysts to support secondary market trading of each Fund; (iii) oversight of daily accounting and pricing; (iv) responsibility for periodic filings with regulators and stock exchanges; (v) overseeing and coordinating the activities of other service providers including, among others, each Fund’s custodian, fund accountant, transfer agent, and auditor; (vi) organizing Board meetings and preparing the materials for such Board meetings; (vii) providing legal and compliance support; (viii) furnishing analytical and other support to assist the Board in its consideration of strategic issues such as the merger, consolidation or repurposing of certainclosed-end funds; and (ix) performing or managing administrative functions necessary for the operation of each Fund, such as tax reporting, expense management, fulfilling regulatory filing requirements, and shareholder call center and other services. The Board reviewed the structure and duties of BlackRock’s fund administration, shareholder services, and legal & compliance departments and considered BlackRock’s policies and procedures for assuring compliance with applicable laws and regulations.
B. The Investment Performance of each Fund and BlackRock: The Board, including the Independent Board Members, also reviewed and considered the performance history of each Fund. In preparation for the May Meeting, the Board was provided with reports independently prepared by Broadridge, which included a comprehensive analysis of each Fund’s performance as of December 31, 2018. The performance information is based on net asset value (NAV), and utilizes Lipper data. Lipper’s methodology calculates a fund’s total return assuming distributions are reinvested on theex-date at a fund’sex-date NAV. Broadridge ranks funds in quartiles, ranging from first to fourth, where first is the most desirable quartile position and fourth is the least desirable. In connection with its review, the Board received and reviewed information regarding the investment performance of each Fund as compared to its Performance Peers and a composite measuring a blend of total return and yield (“Composite”). The Board and its Performance Oversight Committee regularly review, and meet with Fund management to discuss, the performance of each Fund throughout the year.
In evaluating performance, the Board focused particular attention on funds with less favorable performance records. The Board also noted that while it found the data provided by Broadridge generally useful, it recognized the limitations of such data, including in particular, that notable differences may exist between a fund and the Performance Peer funds (for example, the investment objective(s) and investment strategies). Further, the Board recognized that the performance data reflects a snapshot of a period as of a particular date and that selecting a different performance period could produce significantly different results. The Board also acknowledged that long-term performance could be impacted by even one period of significant outperformance or underperformance, and that a single investment theme could have the ability to affect long-term performance disproportionately.
The Board noted that for theone-, three- and five-year periods reported, BFO ranked in the second, fourth, and fourth quartiles, respectively, against its Performance Peer Composite. The Board noted that BlackRock believes that the Composite is an appropriate performance metric for BFO, and that BlackRock has explained its rationale for this belief to the Board. The Board noted that BFO has a targeted maturity, and as such, has managed to achieve the specific maturity goal. The Performance Peers generally do not have a similar specific maturity goal.
The Board noted that for theone-, three- and five-year periods reported, BKK ranked in the second, fourth and third quartiles, respectively, against its Performance Peer Composite. The Board noted that BlackRock believes that the Composite is an appropriate performance metric for BKK, and that BlackRock has explained its rationale for this belief to the Board. The Board noted that BKK has a targeted maturity, and as such, has managed to achieve the specific maturity goal. The Performance Peers generally do not have a similar specific maturity goal.
| | |
| 28 | | 2019 BLACKROCK SEMI-ANNUAL REPORTTO SHAREHOLDERS |
Disclosure of Investment Advisory Agreements (continued)
C. Consideration of the Advisory/Management Fees and the Estimated Cost of the Services and Estimated Profits Realized by BlackRock and its Affiliates from their Relationship with each Fund: The Board, including the Independent Board Members, reviewed each Fund’s contractual management fee rate compared with those of its Expense Peers. The contractual management fee rate represents a combination of the advisory fee and any administrative fees, before taking into account any reimbursements or fee waivers. The Board also compared each Fund’s total expense ratio, as well as its actual management fee rate as a percentage of total assets, to those of its Expense Peers. The total expense ratio represents a fund’s total net operating expenses, excluding any investment related expenses. The total expense ratio gives effect to any expense reimbursements or fee waivers that benefit a fund, and the actual management fee rate gives effect to any management fee reimbursements or waivers that benefit a fund. The Board considered the services provided and the fees charged by BlackRock and its affiliates to other types of clients with similar investment mandates, as applicable, including institutional accounts andsub-advised mutual funds (including mutual funds sponsored by third parties).
The Board received and reviewed statements relating to BlackRock’s financial condition. The Board reviewed BlackRock’s profitability methodology and was also provided with an estimated profitability analysis that detailed the revenues earned and the expenses incurred by BlackRock for services provided to each Fund. The Board reviewed BlackRock’s estimated profitability with respect to each Fund and other funds the Board currently oversees for the year ended December 31, 2018 compared to available aggregate estimated profitability data provided for the prior two years. The Board reviewed BlackRock’s estimated profitability with respect to certain other U.S. fund complexes managed by the Manager and/or its affiliates. The Board reviewed BlackRock’s assumptions and methodology of allocating expenses in the estimated profitability analysis, noting the inherent limitations in allocating costs among various advisory products. The Board recognized that profitability may be affected by numerous factors including, among other things, fee waivers and expense reimbursements by the Manager, the types of funds managed, precision of expense allocations and business mix. The Board thus recognized that calculating and comparing profitability at individual fund levels is difficult.
The Board noted that, in general, individual fund or product line profitability of other advisors is not publicly available. The Board reviewed BlackRock’s overall operating margin, in general, compared to that of certain other publicly-traded asset management firms. The Board considered the differences between BlackRock and these other firms, including the contribution of technology at BlackRock, BlackRock’s expense management, and the relative product mix.
In addition, the Board considered the estimated cost of the services provided to each Fund by BlackRock, and BlackRock’s and its affiliates’ estimated profits relating to the management of each Fund and the other funds advised by BlackRock and its affiliates. As part of its analysis, the Board reviewed BlackRock’s methodology in allocating its costs of managing the Funds, to each Fund. The Board considered whether BlackRock has the financial resources necessary to attract and retain high quality investment management personnel to perform its obligations under the Agreements and to continue to provide the high quality of services that is expected by the Board. The Board further considered factors including but not limited to BlackRock’s commitment of time, assumption of risk, and liability profile in servicing each Fund, including in contrast to what is required of BlackRock with respect to other products with similar investment mandates across theopen-end fund,closed-end fund,sub-advised mutual fund, collective investment trust, and institutional separate account product channels, as applicable.
The Board noted that BFO’s contractual management fee rate ranked in the first quartile, and that the actual management fee rate and total expense ratio each ranked in the first quartile relative to the Expense Peers. The Board also noted that BlackRock and the Board agreed to voluntarily waive the entirety of BFO’s advisory fee effective January 1, 2019.
The Board noted that BKK’s contractual management fee rate ranked in the first quartile, and that the actual management fee rate and total expense ratio each ranked in the first quartile relative to the Expense Peers.
D. Economies of Scale: The Board, including the Independent Board Members, considered the extent to which economies of scale might be realized as the assets of each Fund increase. The Board also considered the extent to which each Fund benefits from such economies in a variety of ways, and whether there should be changes in the advisory fee rate or breakpoint structure in order to enable each Fund to more fully participate in these economies of scale. The Board considered each Fund’s asset levels and whether the current fee was appropriate.
Based on the Board’s review and consideration of the issue, the Board concluded that mostclosed-end funds do not have fund level breakpoints becauseclosed-end funds generally do not experience substantial growth after the initial public offering. They are typically priced at scale at a fund’s inception.
E. Other Factors Deemed Relevant by the Board Members: The Board, including the Independent Board Members, also took into account other ancillary or“fall-out” benefits that BlackRock or its affiliates may derive from BlackRock’s respective relationships with each Fund, both tangible and intangible, such as BlackRock’s ability to leverage its investment professionals who manage other portfolios and risk management personnel, an increase in BlackRock’s profile in the investment advisory community, and the engagement of BlackRock’s affiliates as service providers to each Fund, including for administrative, securities lending and cash management services. The Board also considered BlackRock’s overall operations and its efforts to expand the scale of, and improve the quality of, its operations. The Board also noted that, subject to applicable law, BlackRock may use and benefit from third party research obtained by soft dollars generated by certain registered fund transactions to assist in managing all or a number of its other client accounts.
In connection with its consideration of the Agreements, the Board also received information regarding BlackRock’s brokerage and soft dollar practices. The Board received reports from BlackRock which included information on brokerage commissions and trade execution practices throughout the year.
The Board noted the competitive nature of theclosed-end fund marketplace, and that shareholders are able to sell their Fund shares in the secondary market if they believe that each Fund’s fees and expenses are too high or if they are dissatisfied with the performance of each Fund.
The Board also considered the various notable initiatives and projects BlackRock performed in connection with itsclosed-end fund product line. These initiatives included developing equity shelf programs; efforts to eliminate product overlap with fund mergers; ongoing services to manage leverage that has become increasingly complex; periodic evaluation of share repurchases and other support initiatives for certain BlackRock funds; and continued communications efforts with shareholders, fund analysts and financial advisers. With respect to the latter, the Independent Board Members noted BlackRock’s continued commitment to supporting the secondary market for the common shares of itsclosed-end funds through a comprehensive secondary market communication program designed to raise investor and analyst awareness and understanding ofclosed-end funds. BlackRock’s support services included, among other things: sponsoring and participating in conferences; communicating with
| | | | |
| DISCLOSUREOF INVESTMENT ADVISORY AGREEMENTS | | | 29 | |
Disclosure of Investment Advisory Agreements (continued)
closed-end fund analysts covering the BlackRock funds throughout the year; providing marketing and product updates for theclosed-end funds; and maintaining and enhancing itsclosed-end fund website.
Conclusion
The Board, including the Independent Board Members, approved the continuation of the Advisory Agreements between the Manager and each Fund for aone-year term ending June 30, 2020. Based upon its evaluation of all of the aforementioned factors in their totality, as well as other information, the Board, including the Independent Board Members, was satisfied that the terms of the Agreements were fair and reasonable and in the best interest of each Fund and its shareholders. In arriving at its decision to approve the Agreements, the Board did not identify any single factor or group of factors asall-important or controlling, but considered all factors together, and different Board Members may have attributed different weights to the various factors considered. The Independent Board Members were also assisted by the advice of independent legal counsel in making this determination.
| | |
| 30 | | 2019 BLACKROCK SEMI-ANNUAL REPORTTO SHAREHOLDERS |
Trustee and Officer Information
Richard E. Cavanagh, Co-Chair of the Board and Trustee
Karen P. Robards, Co-Chair of the Board and Trustee
Michael J. Castellano, Trustee
Cynthia L. Egan, Trustee
Frank J. Fabozzi, Trustee
Henry Gabbay, Trustee
R. Glenn Hubbard, Trustee
W. Carl Kester, Trustee
Catherine A. Lynch, Trustee
Robert Fairbairn, Trustee
John M. Perlowski, Trustee, President and Chief Executive Officer
Jonathan Diorio, Vice President
Neal J. Andrews, Chief Financial Officer
Jay M. Fife, Treasurer
Charles Park, Chief Compliance Officer
Janey Ahn, Secretary
Investment Adviser
BlackRock Advisors, LLC
Wilmington, DE 19809
Accounting Agent and Custodian
State Street Bank and Trust Company
Boston, MA 02111
Transfer Agent
Computershare Trust Company, N.A.
Canton, MA 02021
Independent Registered Public Accounting Firm
Deloitte & Touche LLP
Boston, MA 02116
Legal Counsel
Willkie Farr & Gallagher LLP
New York, NY 10019
Address of the Trusts
100 Bellevue Parkway
Wilmington, DE 19809
| | | | |
| TRUSTEEAND OFFICER INFORMATION | | | 31 | |
Additional Information
Trust Certification
The Trusts are listed for trading on the NYSE and have filed with the NYSE their annual chief executive officer certification regarding compliance with the NYSE’s listing standards. The Trusts filed with the SEC the certification of its chief executive officer and chief financial officer required by section 302 of the Sarbanes-Oxley Act.
Dividend Policy
Each Trust’s dividend policy is to distribute all or a portion of its net investment income to its shareholders on a monthly basis. In order to provide shareholders with a more stable level of distributions, the Trusts may at times pay out less than the entire amount of net investment income earned in any particular month and may at times in any particular month pay out such accumulated but undistributed income in addition to net investment income earned in that month. As a result, the distributions paid by the Trusts for any particular month may be more or less than the amount of net investment income earned by the Trusts during such month. The Trusts’ current accumulated but undistributed net investment income, if any, is disclosed as accumulated earnings (loss) in the Statements of Assets and Liabilities, which comprises part of the financial information included in this report.
General Information
The Trusts do not make available copies of their Statements of Additional Information because the Trusts’ shares are not continuously offered, which means that the Statement of Additional Information of each Trust has not been updated after completion of the respective Trust’s offerings and the information contained in each Trust’s Statement of Additional Information may have become outdated.
During the period, there were no material changes in the Trusts’ investment objectives or policies or to the Trusts’ charters or by-laws that would delay or prevent a change of control of the Trusts that were not approved by the shareholders or in the principal risk factors associated with investment in the Trusts. There have been no changes in the persons who are primarily responsible for the day-to-day management of the Trusts’ portfolios.
Quarterly performance, semi-annual and annual reports, current net asset value and other information regarding the Trusts may be found on BlackRock’s website, which can be accessed athttp://www.blackrock.com. Any reference to BlackRock’s website in this report is intended to allow investors public access to information regarding the Trusts and does not, and is not intended to, incorporate BlackRock’s website in this report.
Electronic Delivery
Shareholders can sign up for e-mail notifications of quarterly statements, annual and semi-annual shareholder reports by enrolling in the electronic delivery program. Electronic copies of shareholder reports are available on BlackRock’s website.
To enroll in electronic delivery:
Shareholders Who Hold Accounts with Investment Advisers, Banks or Brokerages:
Please contact your financial advisor. Please note that not all investment advisers, banks or brokerages may offer this service.
Householding
The Trusts will mail only one copy of shareholder documents, annual and semi-annual reports and proxy statements, to shareholders with multiple accounts at the same address. This practice is commonly called “householding” and is intended to reduce expenses and eliminate duplicate mailings of shareholder documents. Mailings of your shareholder documents may be householded indefinitely unless you instruct us otherwise. If you do not want the mailing of these documents to be combined with those for other members of your household, please call the Trusts at (800) 882-0052.
Availability of Quarterly Schedule of Investments
The Trusts file their complete schedule of portfolio holdings with the SEC for the first and third quarters of each fiscal year as an exhibit to its reports onForm N-PORT, and for reporting periods ended prior to March 31, 2019, filed such information on Form N-Q. The Trusts’Forms N-PORT and N-Q are available on the SEC’s website at http://www.sec.gov. The Trusts’Forms N-PORT andN-Q may also be obtained upon request and without charge by calling (800) 882-0052.
Availability of Proxy Voting Policies and Procedures
A description of the policies and procedures that the Trusts use to determine how to vote proxies relating to portfolio securities is available upon request and without charge (1) by calling (800) 882-0052; (2) athttp://www.blackrock.com; and (3) on the SEC’s website at http://www.sec.gov.
Availability of Proxy Voting Record
Information about how the Trusts voted proxies relating to securities held in the Trusts’ portfolios during the most recent 12-month period ended June 30 is available upon request and without charge (1) athttp://www.blackrock.com; or by calling (800) 882-0052; and (2) on the SEC’s website at http://www.sec.gov.
| | |
| 32 | | 2019 BLACKROCK SEMI-ANNUAL REPORTTO SHAREHOLDERS |
Additional Information (continued)
Availability of Trust Updates
BlackRock will update performance and certain other data for the Trusts on a monthly basis on its website in the “Closed-end Funds” section ofhttp://www.blackrock.com as well as certain other material information as necessary from time to time. Investors and others are advised to check the website for updated performance information and the release of other material information about the Trusts. This reference to BlackRock’s website is intended to allow investors public access to information regarding the Trusts and does not, and is not intended to, incorporate BlackRock’s website in this report.
BlackRock Privacy Principles
BlackRock is committed to maintaining the privacy of its current and former fund investors and individual clients (collectively, “Clients”) and to safeguarding their non-public personal information. The following information is provided to help you understand what personal information BlackRock collects, how we protect that information and why in certain cases we share such information with select parties.
If you are located in a jurisdiction where specific laws, rules or regulations require BlackRock to provide you with additional or different privacy-related rights beyond what is set forth below, then BlackRock will comply with those specific laws, rules or regulations.
BlackRock obtains or verifies personal non-public information from and about you from different sources, including the following: (i) information we receive from you or, if applicable, your financial intermediary, on applications, forms or other documents; (ii) information about your transactions with us, our affiliates, or others; (iii) information we receive from a consumer reporting agency; and (iv) from visits to our websites.
BlackRock does not sell or disclose to non-affiliated third parties any non-public personal information about its Clients, except as permitted by law or as is necessary to respond to regulatory requests or to service Client accounts. These non-affiliated third parties are required to protect the confidentiality and security of this information and to use it only for its intended purpose.
We may share information with our affiliates to service your account or to provide you with information about other BlackRock products or services that may be of interest to you. In addition, BlackRock restricts access to non-public personal information about its Clients to those BlackRock employees with a legitimate business need for the information. BlackRock maintains physical, electronic and procedural safeguards that are designed to protect thenon-public personal information of its Clients, including procedures relating to the proper storage and disposal of such information.
| | | | |
| ADDITIONAL INFORMATION | | | 33 | |
Glossary of Terms Used in this Report
| | |
| Portfolio Abbreviations |
| |
AGC | | Assured Guarantee Corp. |
| |
AGM | | Assured Guaranty Municipal Corp. |
| |
AMBAC | | American Municipal Bond Assurance Corp. |
| |
AMT | | Alternative Minimum Tax (subject to) |
| |
ARB | | Airport Revenue Bonds |
| |
BAM | | Build America Mutual Assurance Co. |
| |
CAB | | Capital Appreciation Bonds |
| |
COP | | Certificates of Participation |
| |
EDA | | Economic Development Authority |
| |
EDC | | Economic Development Corp. |
| |
GO | | General Obligation Bonds |
| |
HFA | | Housing Finance Agency |
| |
IDA | | Industrial Development Authority |
| |
| LOC | | Letter of Credit |
| |
NPFGC | | National Public Finance Guarantee Corp. |
| |
RB | | Revenue Bonds |
| |
| S/F | | Single-Family |
| |
| SBPA | | Stand-by Bond Purchase Agreements |
| |
| VRDN | | Variable Rate Demand Notes |
| | |
| 34 | | 2019 BLACKROCK SEMI-ANNUAL REPORTTO SHAREHOLDERS |
This report is intended for current holders. It is not a prospectus. Past performance results shown in this report should not be considered a representation of future performance. Statements and other information herein are as dated and are subject to change.

| | |
| 2020Term-06/19-SAR | |  |
| Item 2 – | Code of Ethics – Not Applicable to this semi-annual report |
| Item 3 – | Audit Committee Financial Expert – Not Applicable to this semi-annual report |
| Item 4 – | Principal Accountant Fees and Services – Not Applicable to this semi-annual report |
| Item 5 – | Audit Committee of Listed Registrants – Not Applicable to this semi-annual report |
(a) The registrant’s Schedule of Investments is included as part of the Report to Stockholders filed under Item 1 of this Form.
(b) Not Applicable due to no such divestments during the semi-annual period covered since the previous FormN-CSR filing.
| Item 7 – | Disclosure of Proxy Voting Policies and Procedures forClosed-End Management Investment Companies – Not Applicable to this semi-annual report |
| Item 8 – | Portfolio Managers ofClosed-End Management Investment Companies |
| | (a) | Not Applicable to this semi-annual report. |
| | (b) | As of the date of this filing, there have been no changes in any of the portfolio managers identified in the most recent annual report on FormN-CSR. |
| Item 9 – | Purchases of Equity Securities byClosed-End Management Investment Company and Affiliated Purchasers |
| | | | | | | | | | | | | | | | | | | | |
| Period | | (a) Total | | (b) Average | | (c) Total Number of | | (d) Maximum Number of |
| | | Number of Shares Purchased | | Price Paid per Share | | Shares Purchased as Part of Publicly Announced Plans or Programs | | Shares that May Yet Be Purchased Under the Plans or Programs1 |
January 1 – 31, 2019 | | 0 | | 0 | | 0 | | 278,106 |
February 1 – 28, 2019 | | 0 | | 0 | | 0 | | 278,106 |
| March 1 – 31, 2019 | | 0 | | 0 | | 0 | | 278,106 |
| April 1 – 30, 2019 | | 0 | | 0 | | 0 | | 278,106 |
May 1 – 31, 2019 | | 7,682 | | $14.3955 | | 7,682 | | 270,424 |
June 1 – 30, 2019 | | 8,085 | | $14.3973 | | 8,085 | | 262,339 |
Total: | | 15,767 | | $14.3964 | | 15,767 | | 262,339 |
1The Fund announced an open market share repurchase program on April 29, 2019 pursuant to which the Fund was authorized to repurchase, through the earlier of (i) November 30, 2020 or (ii) the Fund’s adoption of a plan of termination, up to 20% of its common shares based on common shares outstanding on March 31, 2019, in open market transactions, subject to certain conditions.
| Item 10 – | Submission of Matters to a Vote of Security Holders – There have been no material changes to these procedures. |
| Item 11 – | Controls and Procedures |
2
(a) The registrant’s principal executive and principal financial officers, or persons performing similar functions, have concluded that the registrant’s disclosure controls and procedures (as defined in Rule30a-3(c) under the Investment Company Act of 1940, as amended (the “1940 Act”)) are effective as of a date within 90 days of the filing of this report based on the evaluation of these controls and procedures required by Rule30a-3(b) under the 1940 Act and Rule 13a-15(b) under the Securities Exchange Act of 1934, as amended.
(b) There were no changes in the registrant’s internal control over financial reporting (as defined in Rule30a-3(d) under the 1940 Act) that occurred during the period covered by this report that have materially affected, or are reasonably likely to materially affect, the registrant’s internal control over financial reporting.
| Item 12 – | Disclosure of Securities Lending Activities forClosed-End Management Investment Companies – Not Applicable to this semi-annual report. |
| Item 13 – | Exhibits attached hereto |
(a)(1) – Code of Ethics – Not Applicable to this semi-annual report
(a)(2) – Certifications – Attached hereto
(a)(3) – Not Applicable
(a)(4) – Not Applicable
(b) – Certifications – Attached hereto
3
Pursuant to the requirements of the Securities Exchange Act of 1934 and the Investment Company Act of 1940, the registrant has duly caused this report to be signed on its behalf by the undersigned, thereunto duly authorized.
| | |
| BlackRock Florida Municipal 2020 Term Trust |
| |
| By: | | /s/ John M. Perlowski |
| | John M. Perlowski |
| | Chief Executive Officer (principal executive officer) of
BlackRock Florida Municipal 2020 Term Trust |
Date: September 3, 2019
Pursuant to the requirements of the Securities Exchange Act of 1934 and the Investment Company Act of 1940, this report has been signed below by the following persons on behalf of the registrant and in the capacities and on the dates indicated.
| | |
| |
| By: | | /s/ John M. Perlowski |
| | John M. Perlowski |
| | Chief Executive Officer (principal executive officer) of
BlackRock Florida Municipal 2020 Term Trust |
Date: September 3, 2019
| | |
| |
| By: | | /s/ Neal J. Andrews |
| | Neal J. Andrews |
| | Chief Financial Officer (principal financial officer) of
BlackRock Florida Municipal 2020 Term Trust |
Date: September 3, 2019
4