
This presentation may include forward-looking statements (related to the
plans, beliefs and goals of CCBI and its subsidiaries), which involve certain
risks and uncertainties that could cause actual results to differ materially from
those in the forward-looking statements. Such risks and uncertainties include,
but are not limited to, the following factors: competitive pressure in the
banking industry; changes in the interest rate environment; the health of the
economy, either nationally or regionally; the deterioration of credit quality,
which would cause an increase in the provision for possible loan and lease
losses; changes in the regulatory environment; changes in business conditions,
particularly in California real estate; volatility of rate sensitive deposits;
asset/liability matching risks and liquidity r isks; and changes in the securities
markets. CCBI undertakes no obligation to revise or publicly release any
revision to these forward-looking statements.
Regulation FD

CCBI Highlights
Financial Position
Total Assets
Loans Held for Investment
Deposits
Equity
Tangible Equity
June 30, 2003
$1.4 billion
$697 million
$530 million
$91 million
$78 million
Financial Position
Net Income
Return on Average Equity
Return on Average Assets
Net Interest Margin
Efficiency Ratio
Loan Originations
Quarter Ended
06/30/2003
$4.7 million
21.08%
1.48%
3.29%
29.18%
$207 million
Quarter Ended
06/30/2002
$2.3 million
29.94%
1.54%
3.46%
33.69%
$179 million
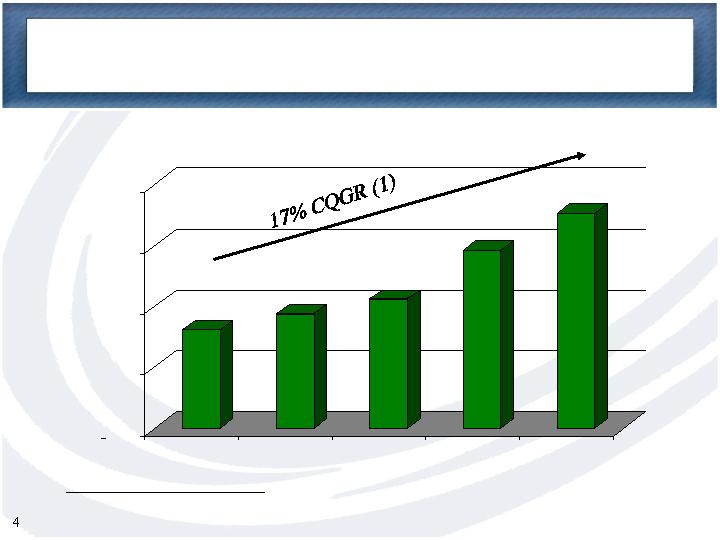
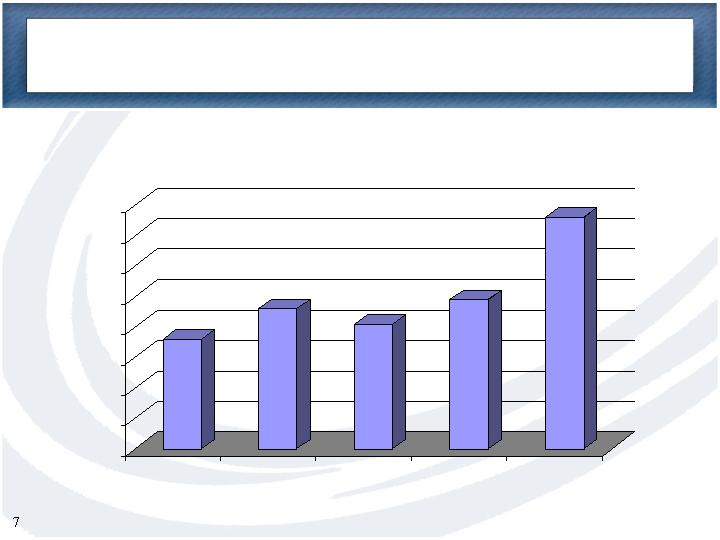
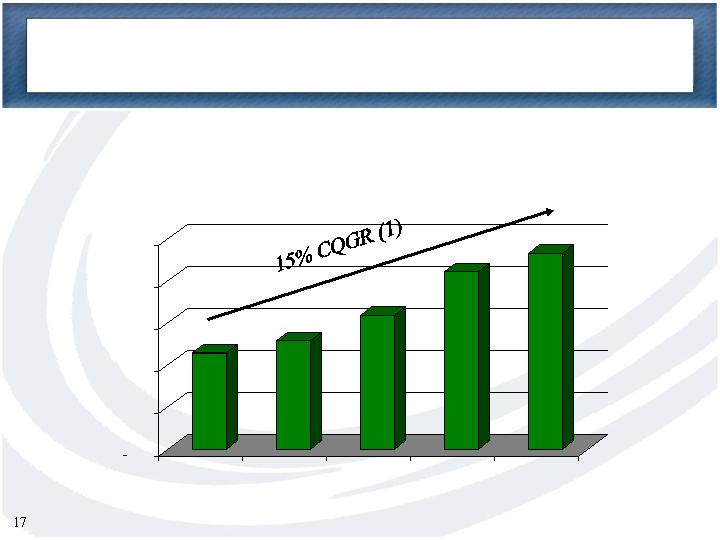
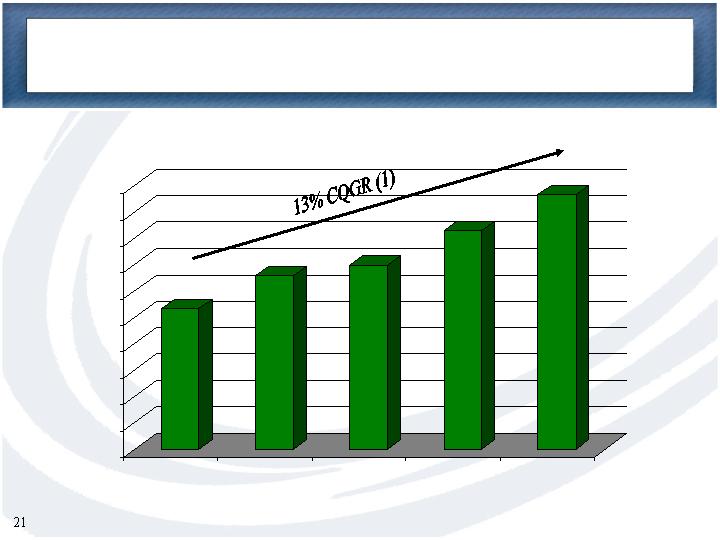
$649
$753
$849
$1,173
$1,412
$ -
$400
$800
$1,200
$1,600
6/02
9/02
12/02
3/03
6/03
Total Assets
(1) CQGR – Compound Quarterly Growth Rate: 6/02 to 6/03
($ in Millions)
CCBI Highlights
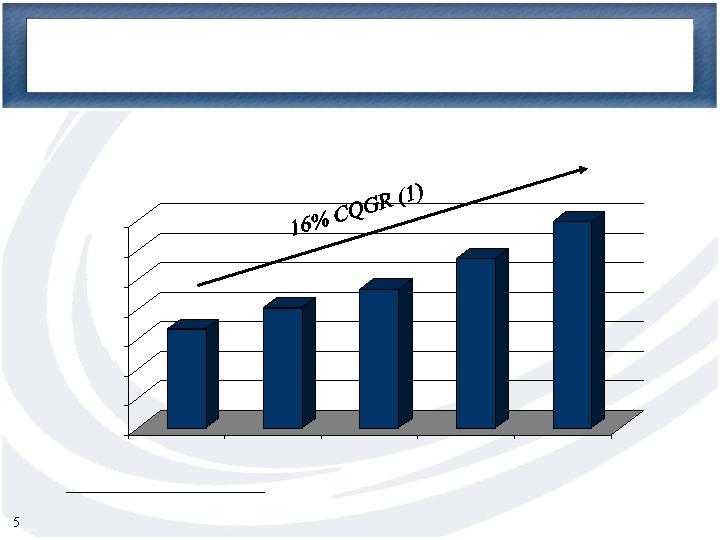
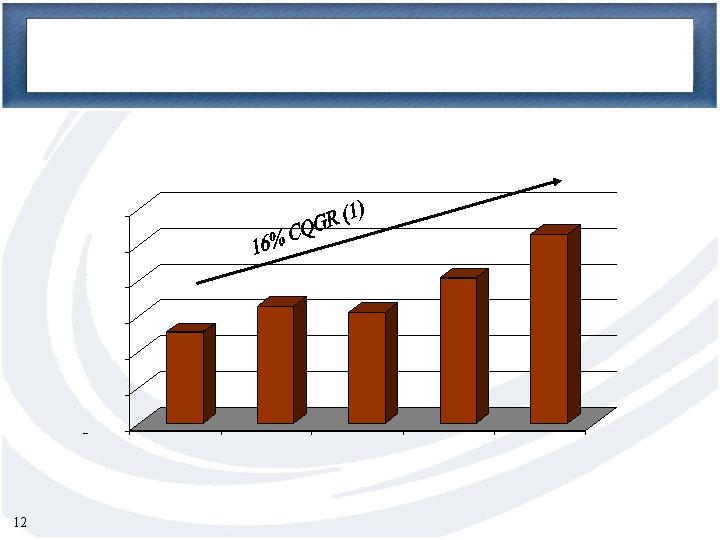
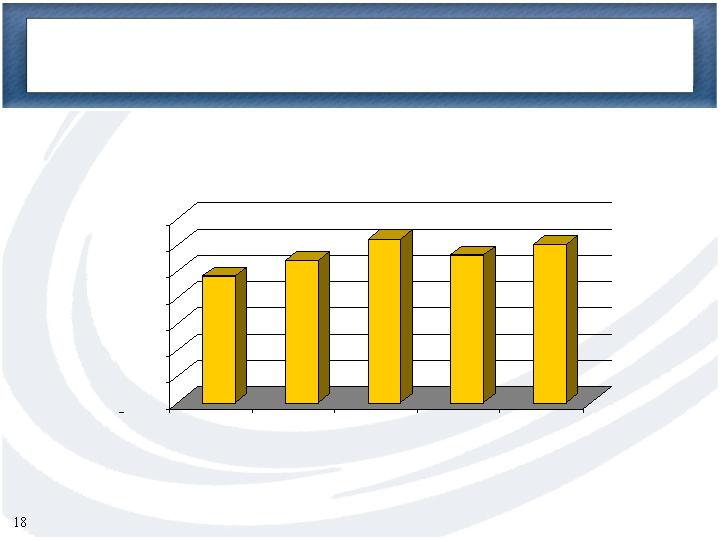
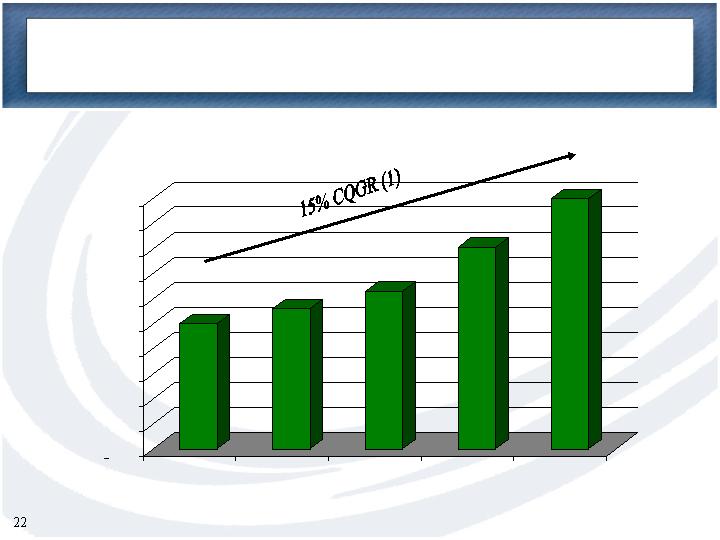
$334
$406
$469
$573
$697
$0
$100
$200
$300
$400
$500
$600
$700
6/02
9/02
12/02
3/03
6/03
Loans Held for Investment
($ in Millions)
CCBI Highlights
(1) CQGR – Compound Quarterly Growth Rate: 6/02 to 6/03
($ in Millions)
CCBI Highlights
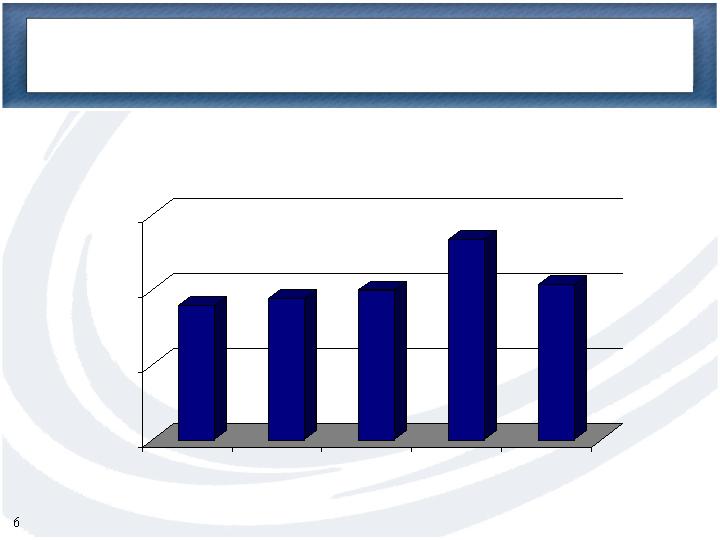
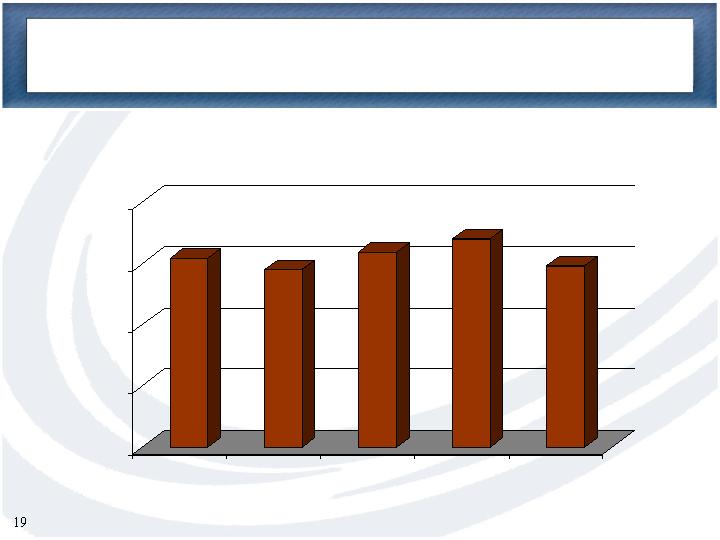
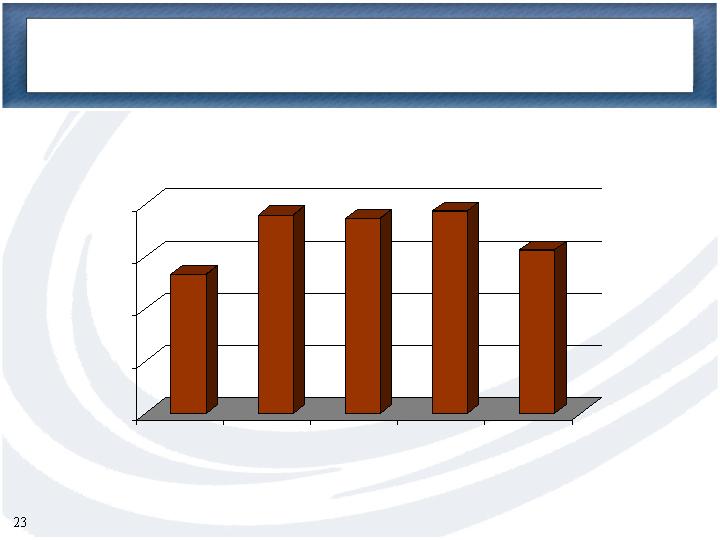
$179
$189
$200
$267
$207
$0
$100
$200
$300
6/02
9/02
12/02
3/03
6/03
Consolidated Loan Originations
CCBI Highlights
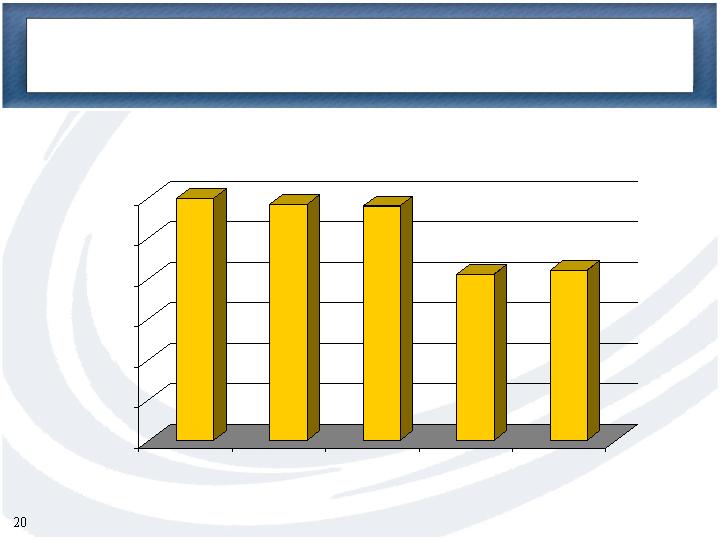
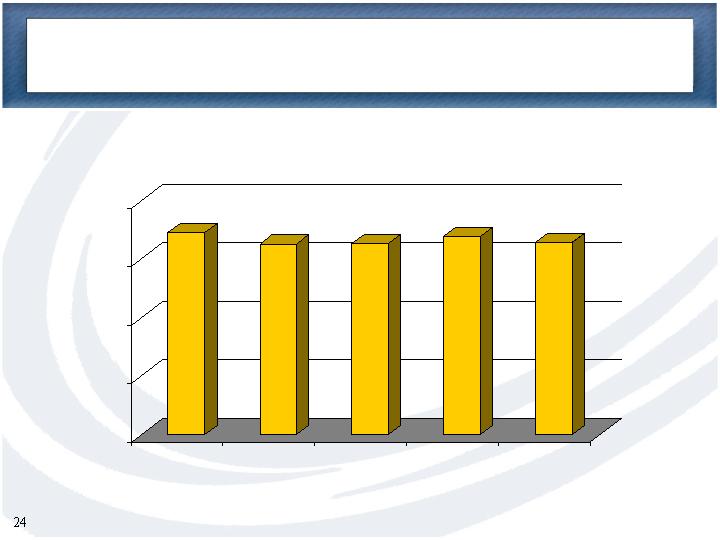
36%
46%
41%
49%
76%
0%
10%
20%
30%
40%
50%
60%
70%
80%
6/02
9/02
12/02
3/03
6/03
Loan Originations Retained
CCBI Highlights
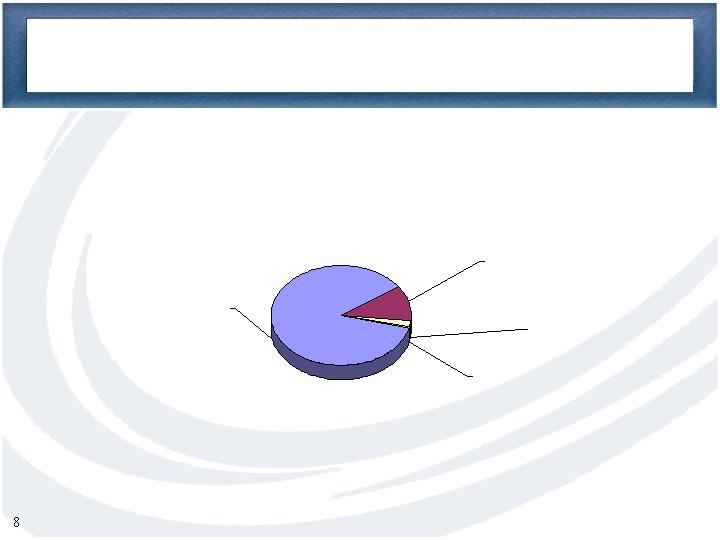
Loans Held for Investment at June 30, 2003
Multi-family
Residential
87%
Commercial
Real Estate
11%
Business
Loans
1%
Other
1%

Non-Accrual Loans/
Nationwide
Multi-family
0.15%
Single family
0.86%
Commercial Real Estate
1.26%
Construction
1.55%
Business Loans
2.10%
Consumer
0.66%
Multi-family Loans
CCBI
0.00%
Western Region Thrifts
0.08%
Nationwide Thrifts
0.15%
(1) Based upon 3/31/03 Thrift Financial Reports for nationwide savings institutions
CCBI Highlights
(1)
Total Loans

LTV and DCR of June 30, 2003 Portfolio
CCBI Highlights
Multi-Family
Loan to Value
Debt Coverage Ratio
Commercial RE
Loan to Value
Debt Coverage Ratio
Values are weighted average ratios, at origination
69.2%
1.29:1
65.6%
1.35:1
CCBI Highlights
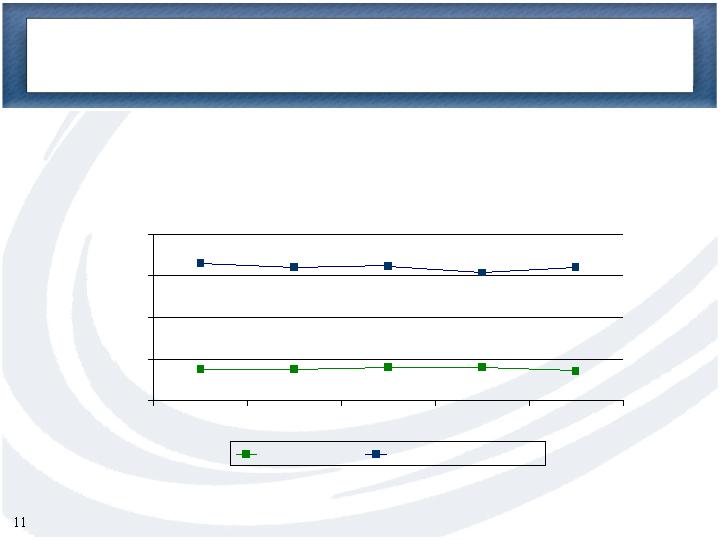
Multi-family and Commercial real estate
loan originations by average LTV & DCR
67.8%
69.7%
69.7%
68.5%
68.4%
1.30
1.27
1.31
1.30
1.33
50%
75%
100%
125%
150%
6/02
9/02
12/02
3/03
6/03
Loan to Value
Debt Coverage Ratio
$256
$328
$312
$408
$530
$ -
$100
$200
$300
$400
$500
$600
6/02
9/02
12/02
3/03
6/03
Total Deposits
($ in Millions)
(1) CQGR – Compound Quarterly Growth Rate: 6/02 to 6/03
CCBI Highlights
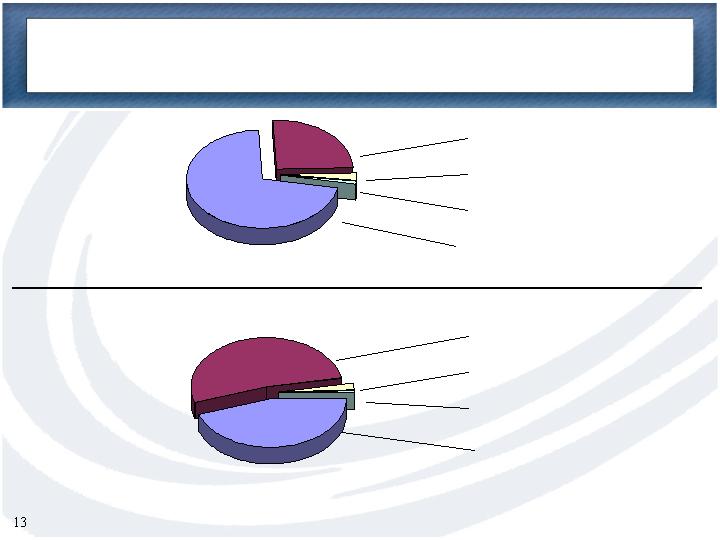
Deposit Composition
at 6/30/2002
71% Certificates of Deposits
25% Money Market
3% Demand Deposits
1% Savings Accounts
45% Certificates of Deposits
52% Money Market
2% Demand Deposits
1% Savings Accounts
CCBI Highlights
Deposit Composition
at 6/30/2003
CCBI Highlights
1.44%
1.59%
1.35%
1.36%
1.21%
0.00%
0.20%
0.40%
0.60%
0.80%
1.00%
1.20%
1.40%
1.60%
6/02
9/02
12/02
3/03
6/03
G&A to Average Assets
CCBI Highlights
33.7%
35.3%
30.6%
30.1%
29.2%
0.0%
5.0%
10.0%
15.0%
20.0%
25.0%
30.0%
35.0%
40.0%
6/02
9/02
12/02
3/03
6/03
Efficiency Ratio
CCBI Highlights
5.2%
5.1%
9.1%
7.2%
6.5%
0.0%
2.0%
4.0%
6.0%
8.0%
10.0%
6/02
9/02
12/02
3/03
6/03
Equity to Assets
3.1%
3.3%
7.6%
6.1%
5.6%
0.0%
2.0%
4.0%
6.0%
8.0%
6/02
9/02
12/02
3/03
6/03
Tangible Equity to Assets
$3.2
$4.2
$4.7
$ -
$1.0
$2.0
$3.0
$4.0
$5.0
$2.3
$2.6
6/02
9/02
12/02
3/03
6/03
Quarterly Net Income
($ in Millions)
CCBI Highlights
(1) CQGR – Compound Quarterly Growth Rate: 6/02 to 6/03
$0.24
$0.27
$0.31*
$0.30***
$ -
$0.05
$0.10
$0.15
$0.20
$0.25
$0.30
$0.35
6/02
9/02
12/02
3/03
6/03
Diluted Earnings Per Share
* 10,309,944 average diluted shares outstanding for Q4 2002
** 14,989,534 average diluted shares outstanding for Q1 2003
*** 15,435,813 average diluted shares outstanding for Q2 2003
CCBI Highlights
$0.28
**
CCBI Highlights
1.54%
1.45%
1.59%
1.70%
1.48%
0.0%
0.5%
1.0%
1.5%
2.0%
6/02
9/02
12/02
3/03
6/03
Return on Average Assets
CCBI Highlights
29.9%
29.2%
29.0%
20.6%
21.1%
0.0%
5.0%
10.0%
15.0%
20.0%
25.0%
30.0%
6/02
9/02
12/02
3/03
6/03
Return on Average Equity
$10.7
$13.2
$14.0
$16.6
$19.3
$0
$2
$4
$6
$8
$10
$12
$14
$16
$18
$20
6/02
9/02
12/02
3/03
6/03
Total Revenues
CCBI Highlights
($ in Millions)
(1) CQGR – Compound Quarterly Growth Rate: 6/02 to 6/03
$5.0
$5.6
$6.3
$8.1
$10.0
$ -
$1.0
$2.0
$3.0
$4.0
$5.0
$6.0
$7.0
$8.0
$9.0
$10.0
6/02
9/02
12/02
3/03
6/03
Net Interest Income
($ in Millions)
CCBI Highlights
(1) CQGR – Compound Quarterly Growth Rate: 6/02 to 6/03
CCBI Highlights
13.3%
19.0%
18.7%
19.4%
15.7%
0%
5%
10%
15%
20%
6/02
9/02
12/02
3/03
6/03
Noninterest Income / Total Revenue
CCBI Highlights
3.46%
3.26%
3.27%
3.39%
3.29%
0.00%
1.00%
2.00%
3.00%
4.00%
6/02
9/02
12/02
3/03
6/03
Net Interest Margin
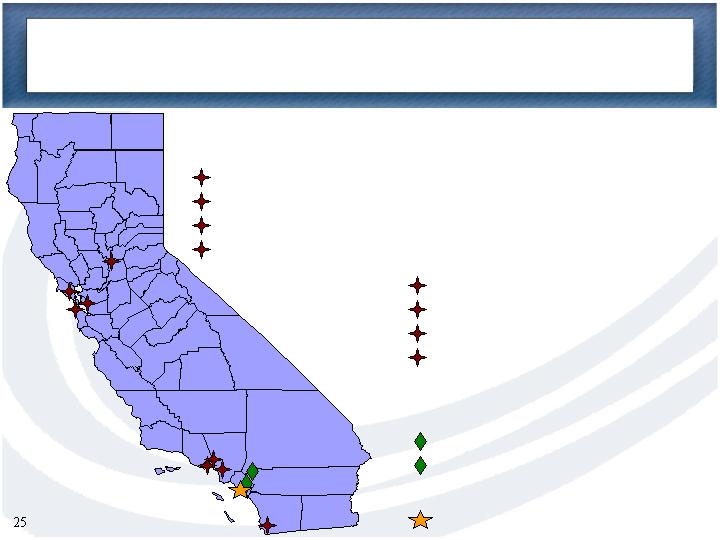
Northern California
Loan Offices
Sacramento
Corte Madera (Marin County)
Burlingame
Oakland
Southern California
Loan Offices
Woodland Hills
Encino
West Los Angeles
San Diego (will become the
La Jolla banking office - 9/03)
Banking Offices
Rancho Santa Margarita
Riverside
Banking & Loan Office
Irvine (Headquarters)
CCBI Highlights

CCB was the fastest growing bank in California over
the 36 months ended 3/31/03, (source www.fdic.gov).
3rd largest multi-family originator in CA with 2.9%
market share for the 12 months ended 3/31/03, (source:
Dataquick Information Systems).
Ranked 7th of 100 largest public thrifts in overall
financial performance by SNL Financial’s
ThriftInvestor.
CCBI Highlights
