Commercial Capital Bancorp (CCBI) Inactive
Filed: 27 Oct 03, 12:00am

This presentation may include forward-looking statements (related to the
plans, beliefs and goals of CCBI and its subsidiaries), which involve certain
risks and uncertainties that could cause actual results to differ materially from
those in the forward-looking statements. Such risks and uncertainties include,
but are not limited to, the following factors: competitive pressure in the
banking industry; changes in the interest rate environment; the health of the
economy, either nationally or regionally; the deterioration of credit quality,
which would cause an increase in the provision for possible loan and lease
losses; changes in the regulatory environment; changes in business conditions,
particularly in California real estate; volatility of rate sensitive deposits;
asset/liability matching risks and liquidity risks; and changes in the securities
markets. CCBI undertakes no obligation to revise or publicly release any
revision to these forward-looking statements.
Regulation FD
CCBI Highlights
Financial Position
September 30, 2003
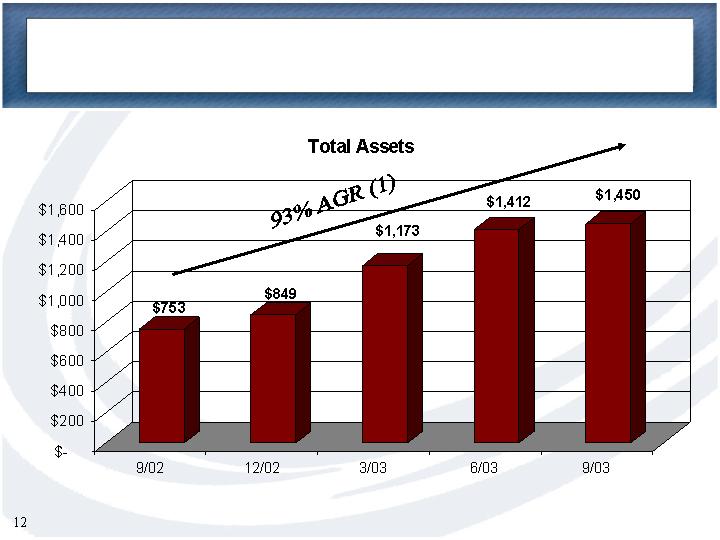
Total Assets
$1.45 billion
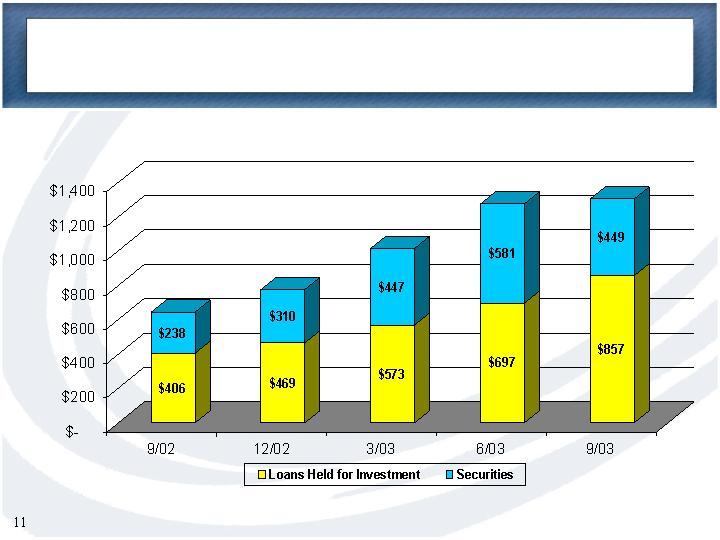
Loans Held for Investment
$857 million
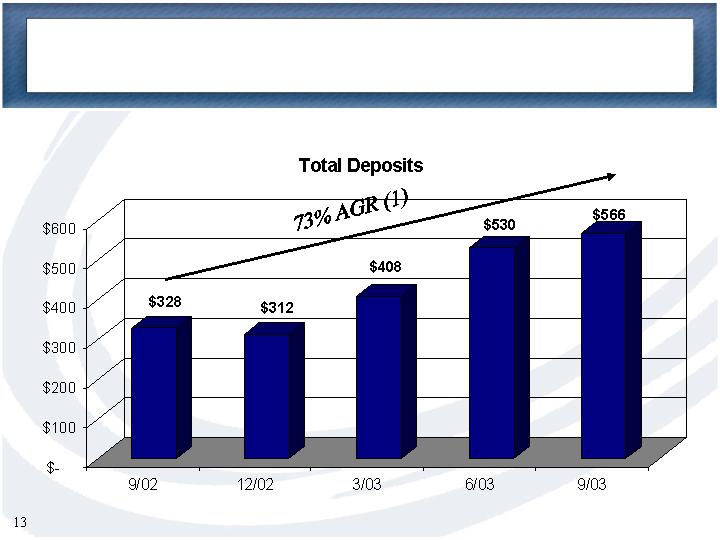
Deposits
$566 million
Equity
$96 million
Tangible Equity
$83 million
Quarter Ended
Quarter Ended
Financial Results
09/30/2003
09/30/2002
Net Income
$5.4 million
$2.6 million
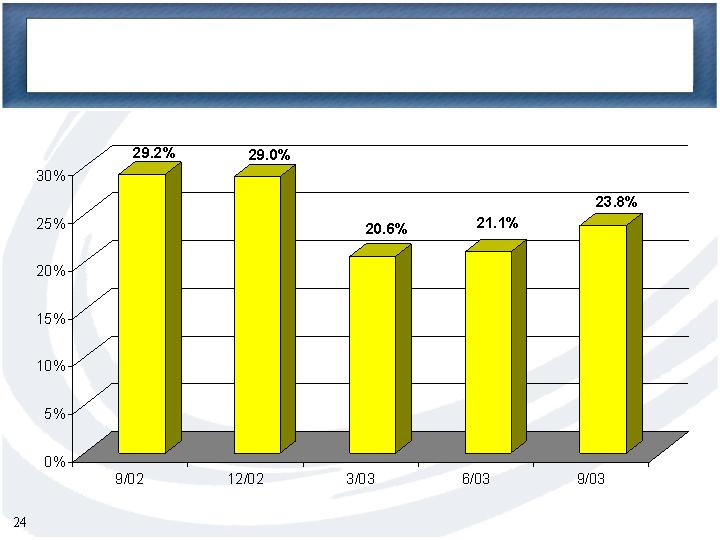
Return on Average Equity
23.84%
29.19%
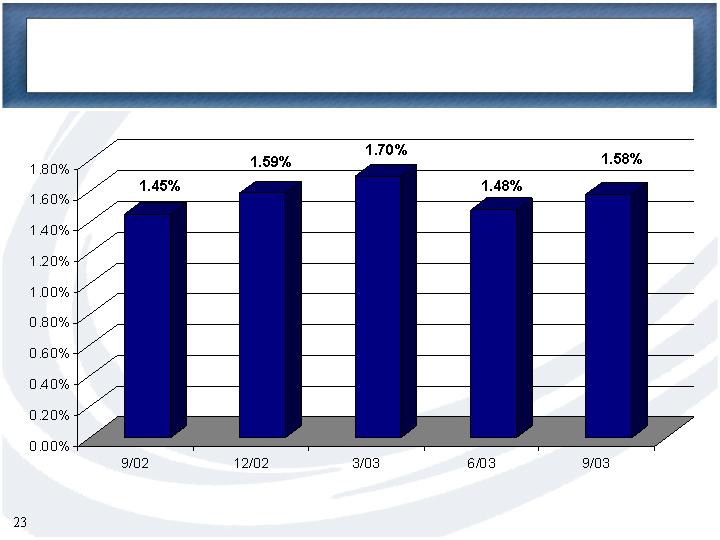
Return on Average Assets
1.58%
1.45%
Net Interest Margin
3.32%
3.26%
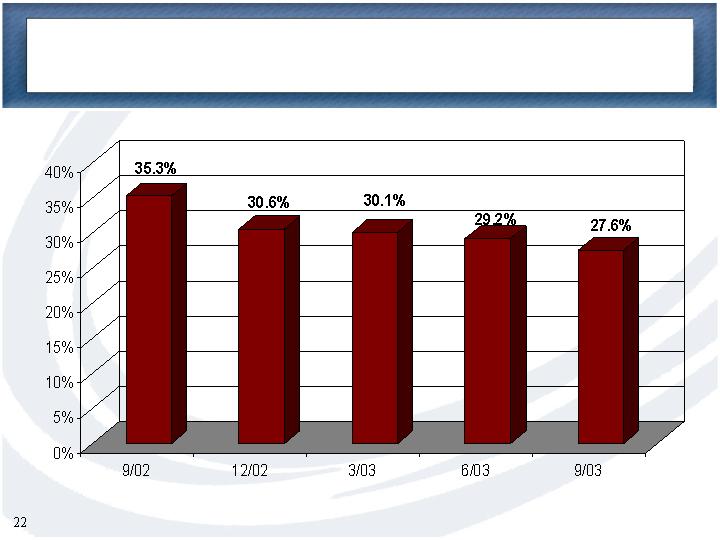
Efficiency Ratio
27.55%
35.32%
Total Loan Originations
$331 million
$189 million
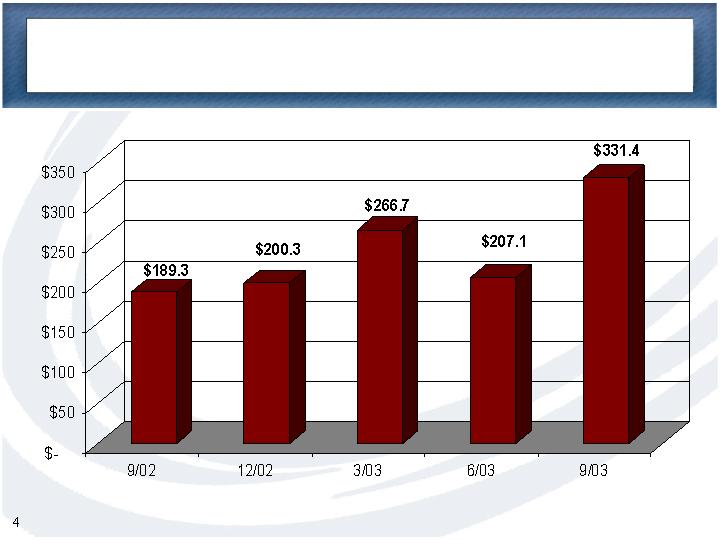
($ in millions)
Record Total Loan Originations
($ in millions)
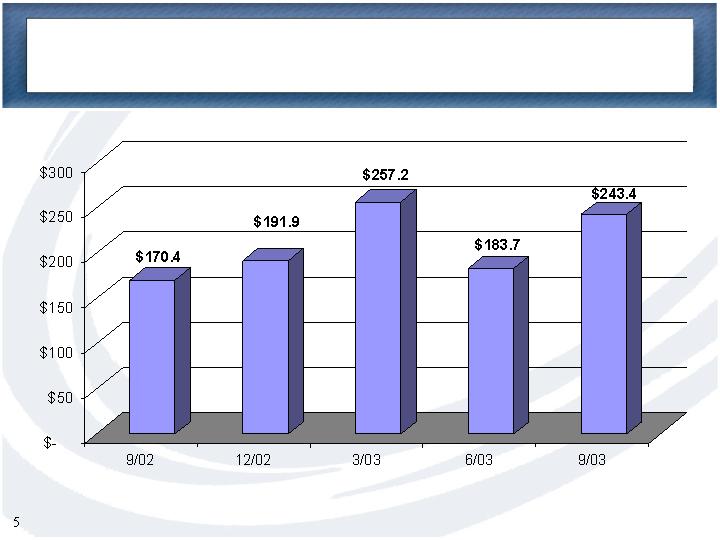
Core Loan Originations

Core Loan Originations Retained
($ in millions)
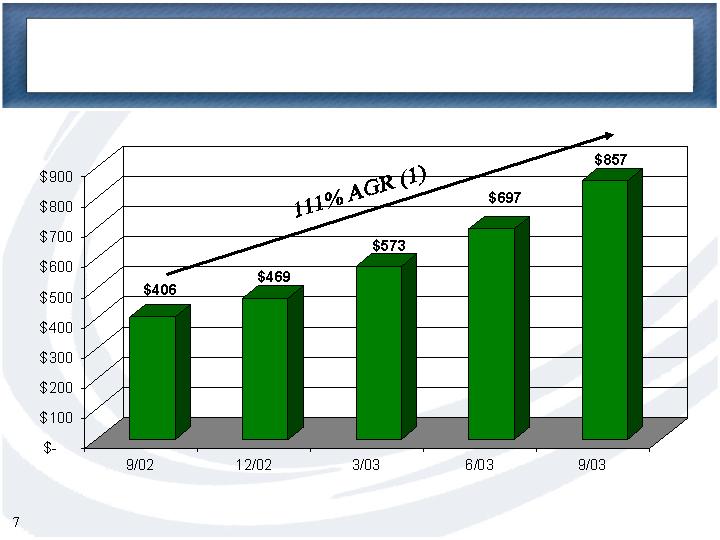
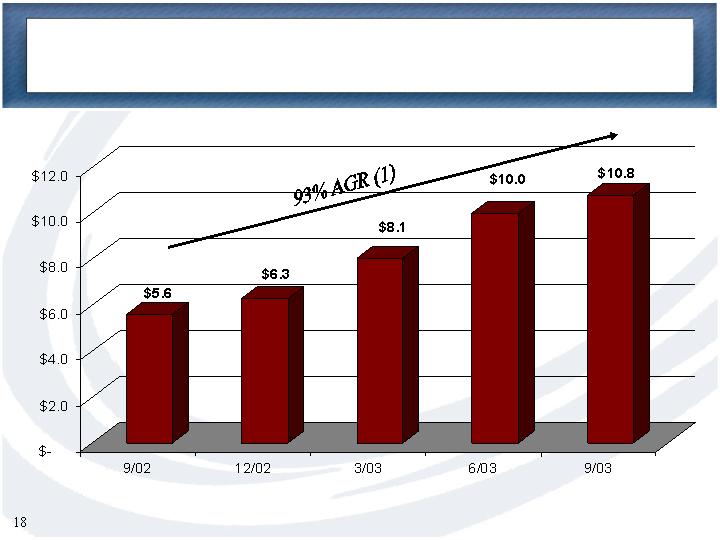
Record Growth in Loans Held for Investment
(1) AGR – Annual Growth Rate: 9/02 to 9/03
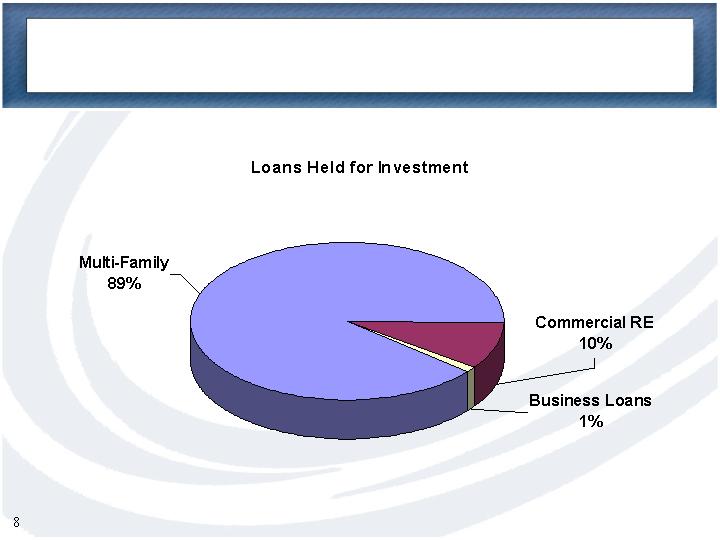
Loan Portfolio Mix
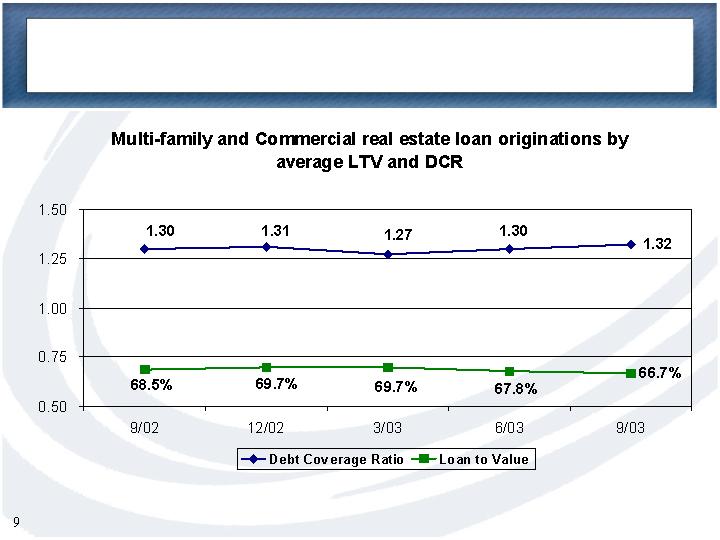
Consistent Underwriting
Asset Quality of Multi-family Loans
Non-Accrual Loans/
Nationwide
Total Loans
(1)
Multi-family
0.19%
Single family
0.84%
Commercial Real Estate
1.14%
Construction
1.15%
Business Loans
1.96%
Consumer
0.66%
Multi-family Loans
CCBI
0.00%
Western Region Thrifts
0.13%
Nationwide Thrifts
0.19%
(1) Based upon 6/30/03 Thrift Financial Reports for nationwide savings institutions
($ in millions)
Loans to Securities Mix
($ in millions)
Balance Sheet Transition
(1) AGR – Annual Growth Rate: 9/02 to 9/03
($ in millions)
(1) AGR – Annual Growth Rate: 9/02 to 9/03
Deposit Growth
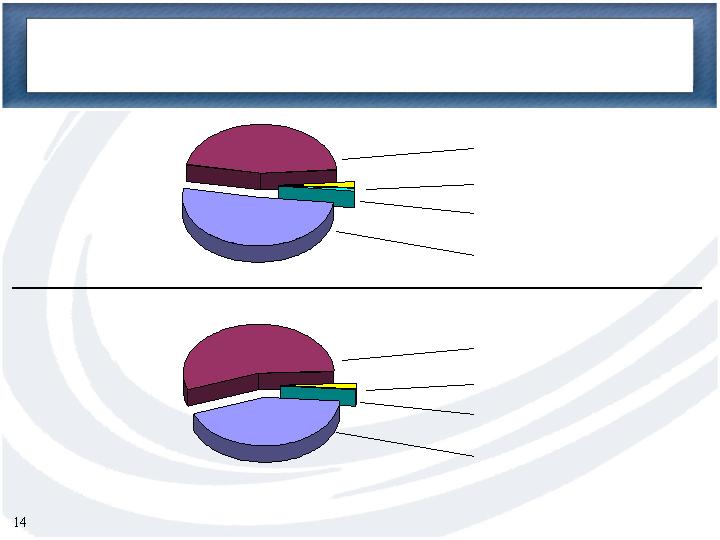
Deposit Composition
at 9/30/2002
Deposit Composition
at 9/30/2003
43% Certificates of Deposit
Maturing Deposit Mix
‹1% Savings Accounts
2% Demand Deposits
55% Money Market
51% Certificates of Deposit
1% Savings Accounts
2% Demand Deposits
46% Money Market
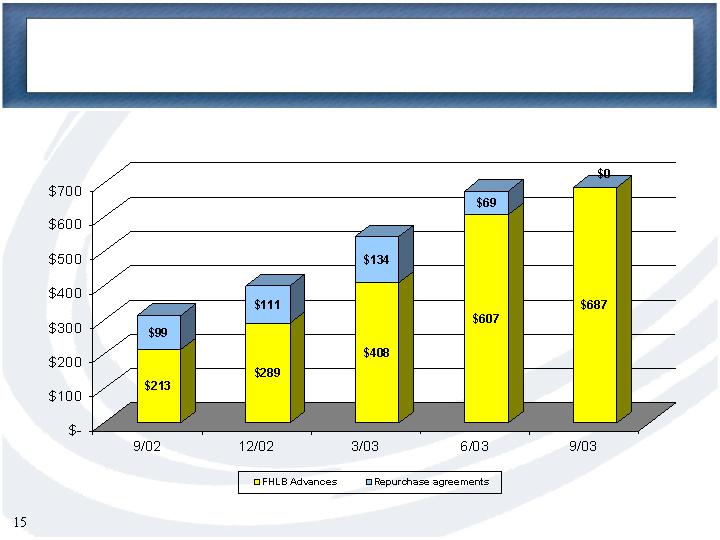
FHLB Advances to Repo Mix
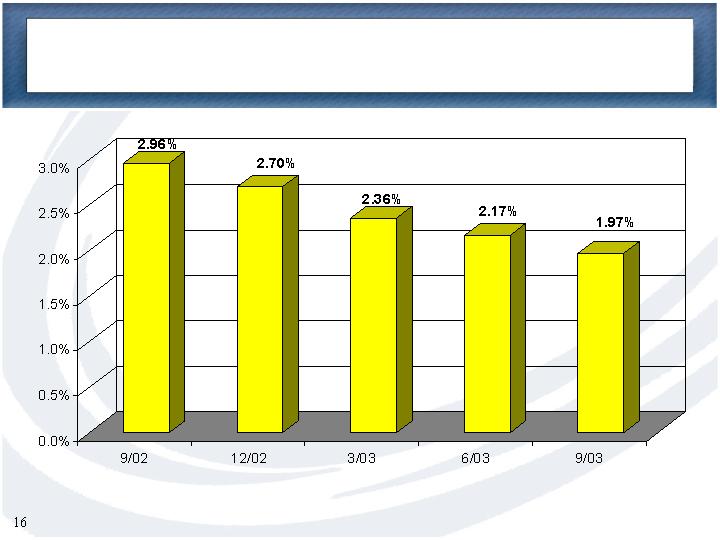
Cost of Funds
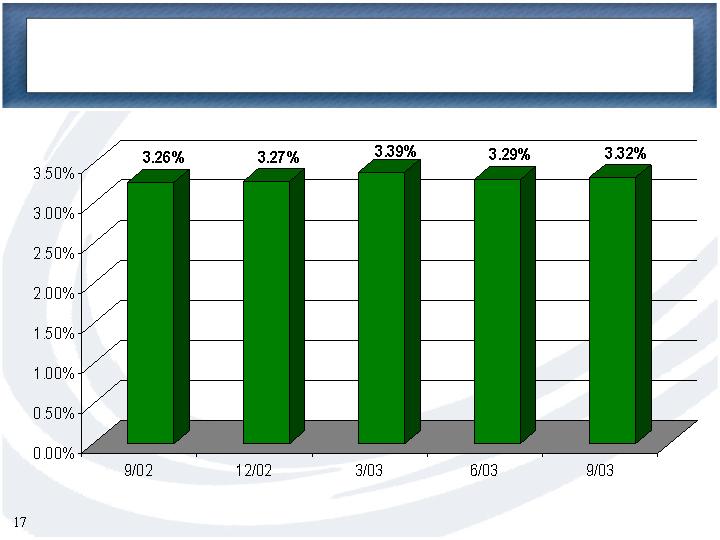
Net Interest Margin
($ in millions)
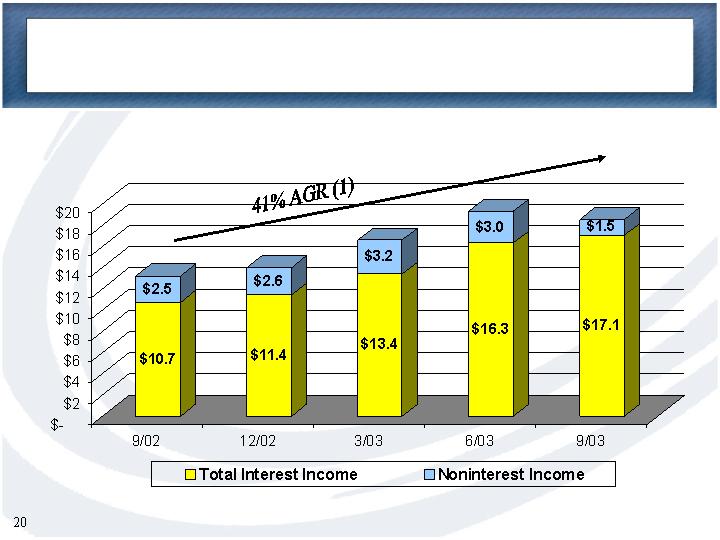
Net Interest Income
(1) AGR – Annual Growth Rate: 9/02 to 9/03
Noninterest Income to Total Revenue
Total Revenue Composition
($ in millions)
(1) AGR – Annual Growth Rate: 9/02 to 9/03
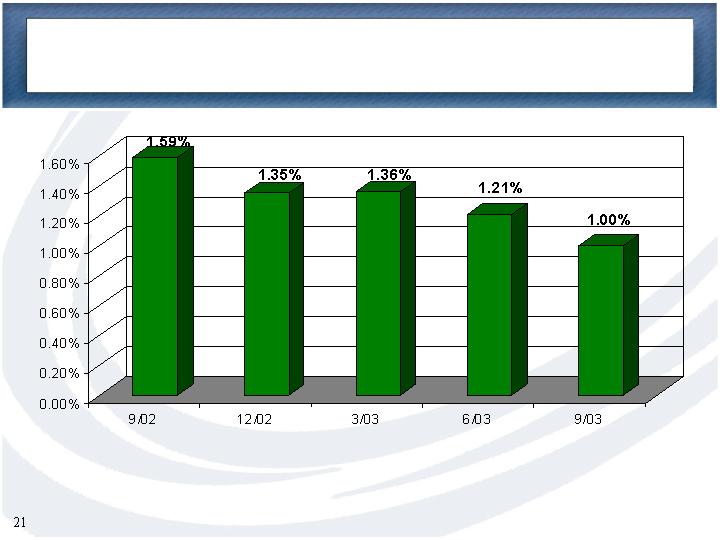
G&A to Average Assets
Efficiency Ratio
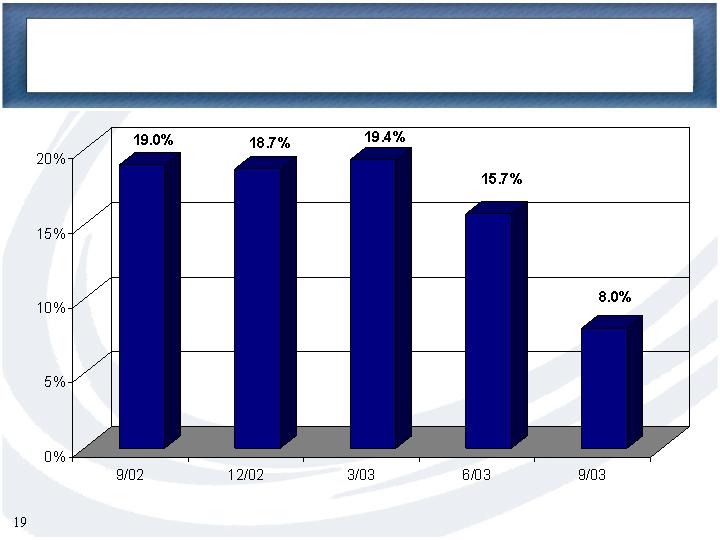
Return on Average Assets
Return on Average Equity
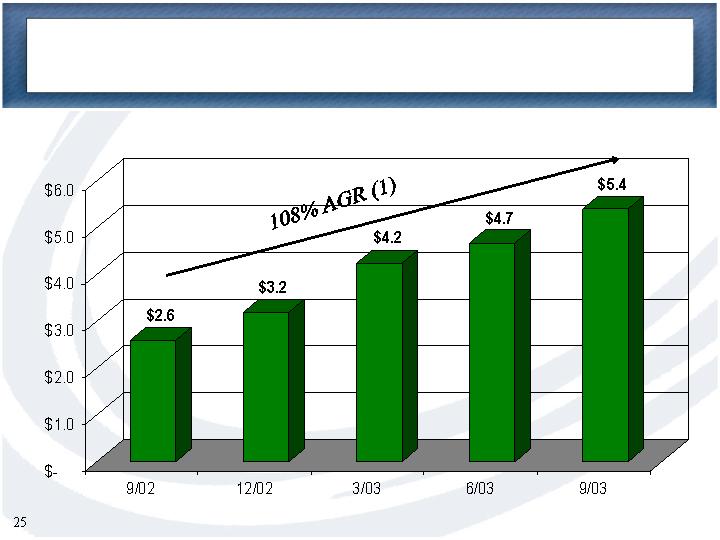
($ in millions)
Quarterly Net Income
(1) AGR – Annual Growth Rate: 9/02 to 9/03
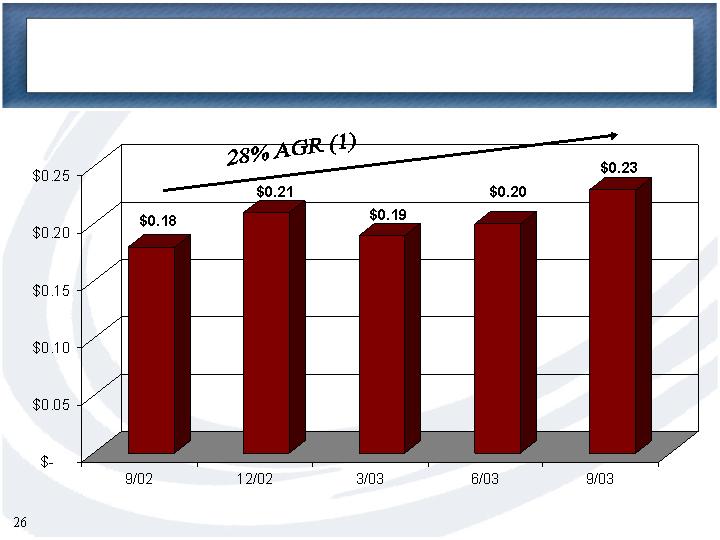
Diluted Earnings per Share
(1) AGR – Annual Growth Rate: 9/02 to 9/03
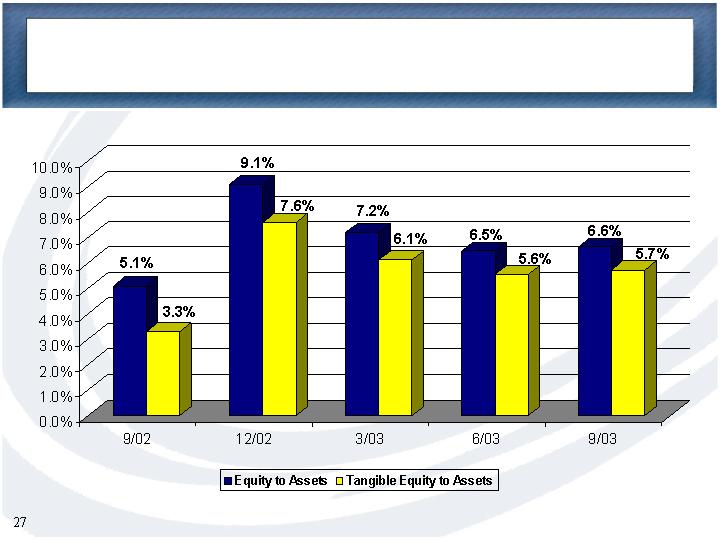
Consolidated Capital Ratios
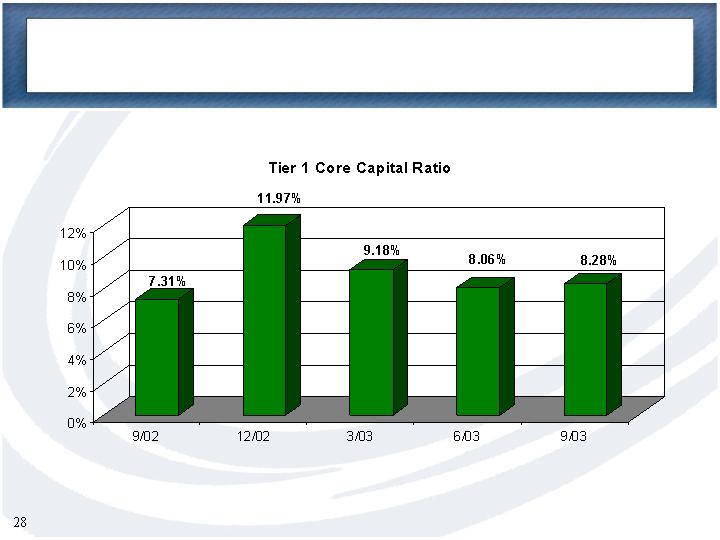
Bank Capital Ratio
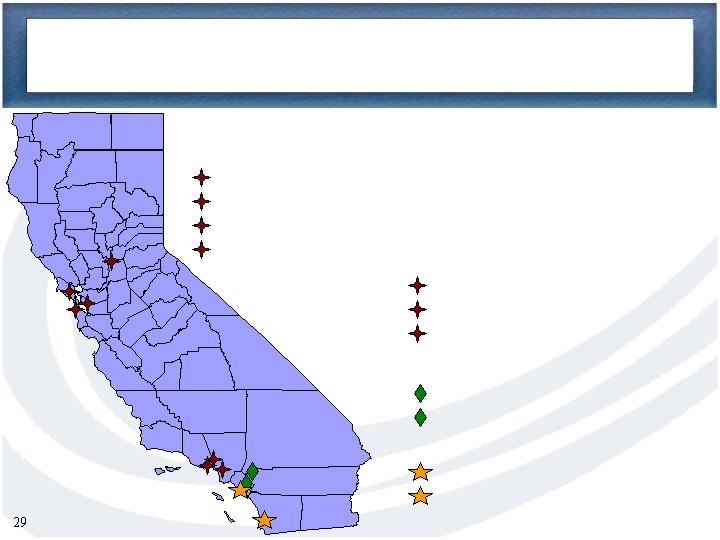
Growing Franchise Presence
Northern California
Loan Offices
Sacramento
Corte Madera (Marin County)
Burlingame
Oakland
Southern California
Loan Offices
Woodland Hills
Encino (Opened Aug. ’03)
West Los Angeles
Banking Offices
Rancho Santa Margarita
Riverside
Banking & Loan Offices
Irvine (Headquarters)
La Jolla (Opened Sept. ’03)
CCB was the fastest growing bank in California over
the 36 months ended 6/30/03, (source www.fdic.gov).
4th largest multi-family originator in CA with 2.7%
market share for the 12 months ended 6/30/03, (source:
Dataquick Information Systems).
Consistent High Quality Growth