
April 26, 2004
First Quarter 2004 Earnings Call

This presentation may include forward-looking statements related to the plans, beliefs
and goals of the Company, its subsidiaries, which involve certain risks and
uncertainties that could cause actual results to differ materially from those in the
forward-looking statements. Such risks and uncertainties include, but are not limited
to, the following factors: competitive pressure in the banking industry; changes in the
interest rate environment; the health of the economy, either nationally or regionally;
the deterioration of credit quality, which would cause an increase in the provision for
possible loan and lease losses; changes in the regulatory environment; changes in
business conditions, particularly in California real estate; volatility of rate sensitive
deposits; asset/liability matching risks and liquidity risks; changes in the securities
markets. The Company undertakes no obligation to revise or publicly release any
revision to these forward-looking statements.
Regulation FD
2

CCBI Highlights
3
Financial Position
March 31, 2004
Total Assets
$1.96 billion
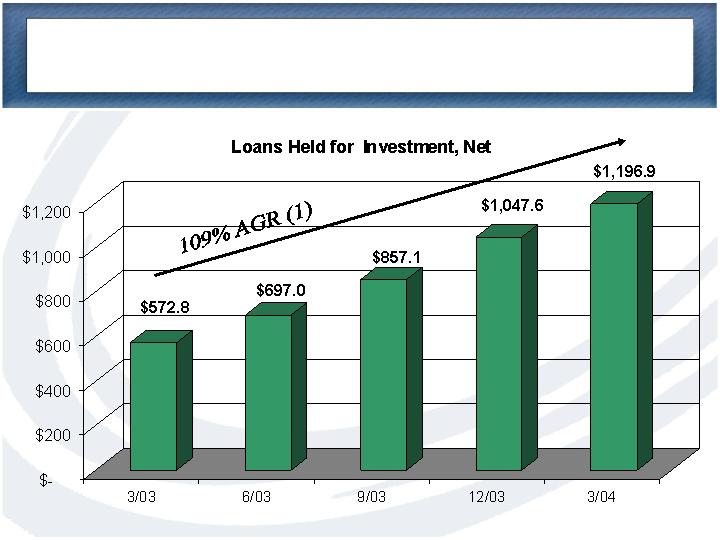
Loans Held for Investment
$1.20 billion
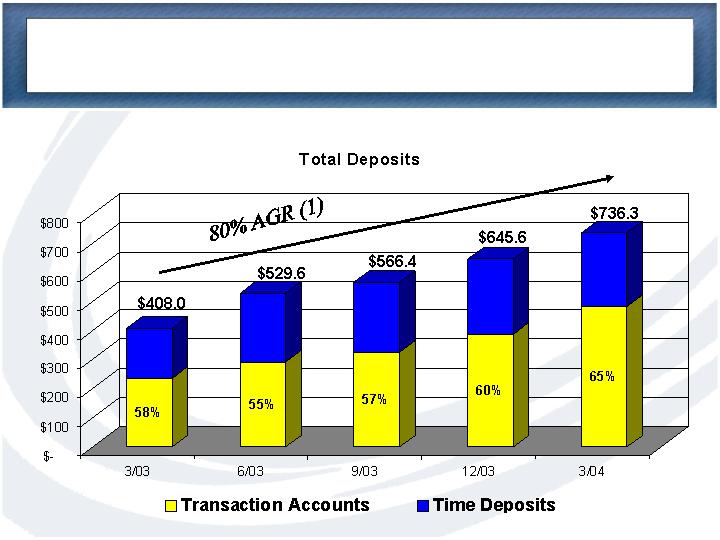
Deposits
$736 million
Equity
$114 million
Tangible Equity
$101 million
Quarter Ended
Quarter Ended
Financial Results
3/31/2004
3/31/2003
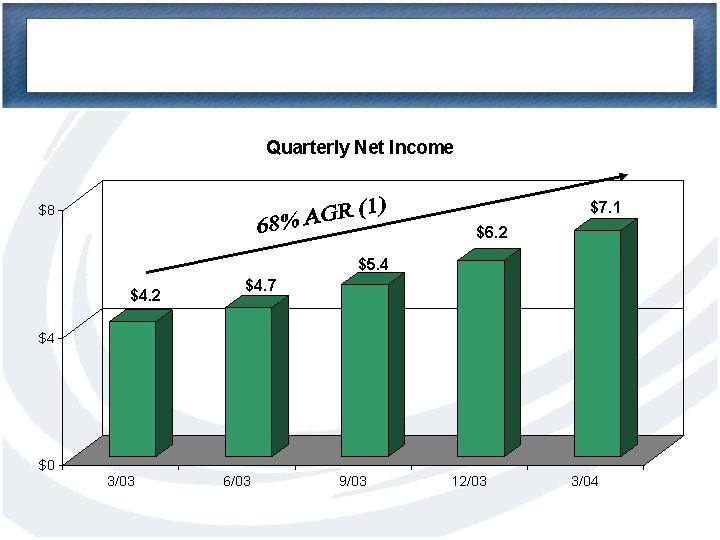
Net Income
$7.1 million
$4.2 million
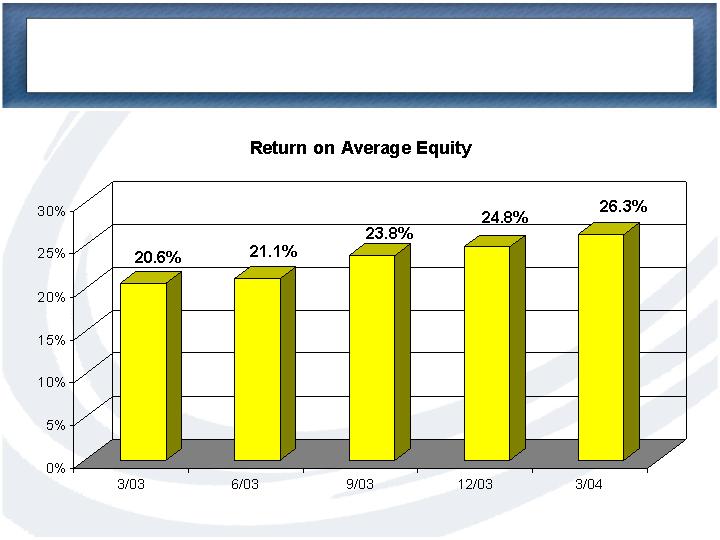
Return on Average Equity
26.30%
20.60%
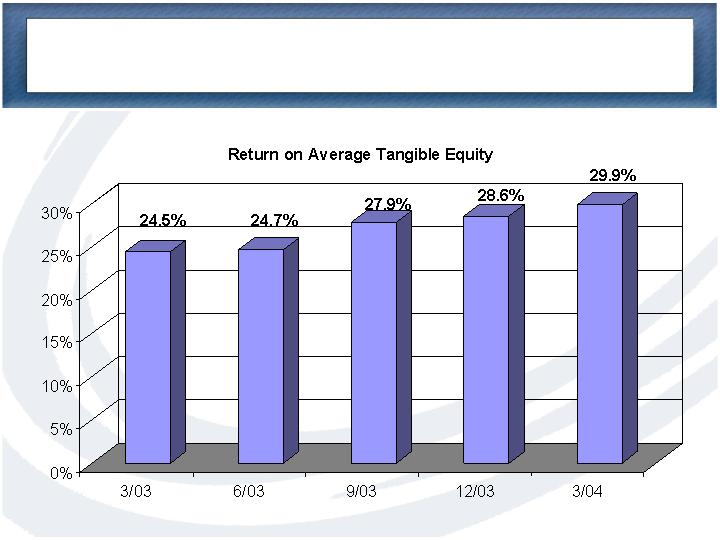
Return on Avg.Tang. Equity
29.91%
24.48%
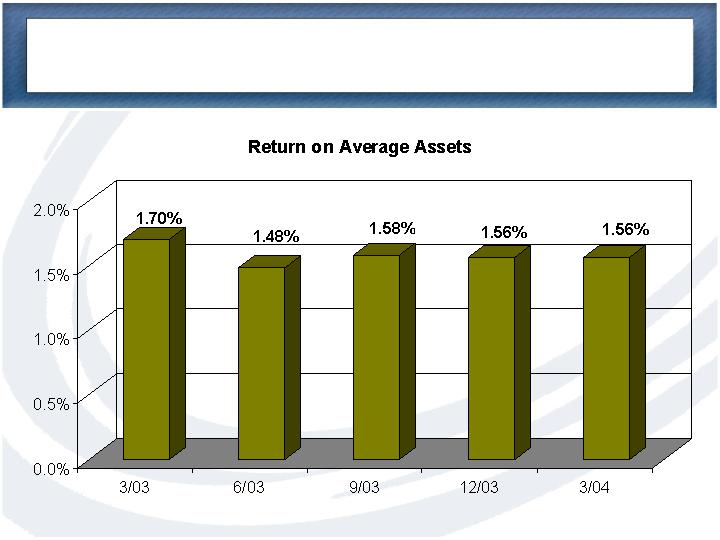
Return on Average Assets
1.56%
1.70%
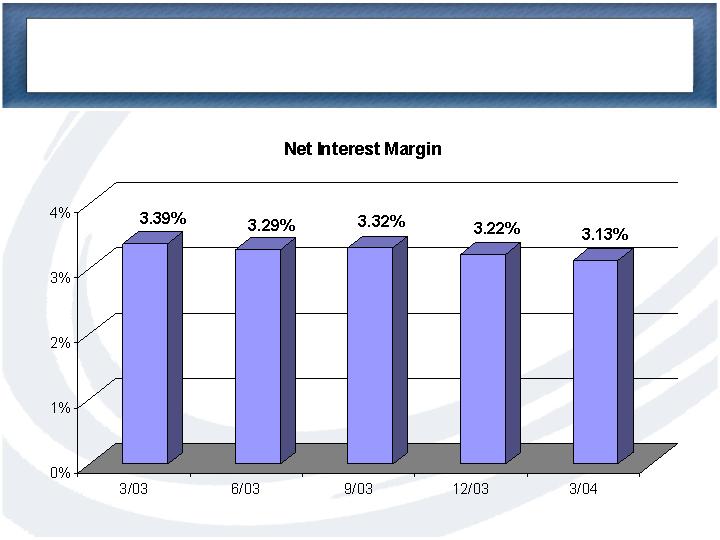
Net Interest Margin
3.13%
3.39%
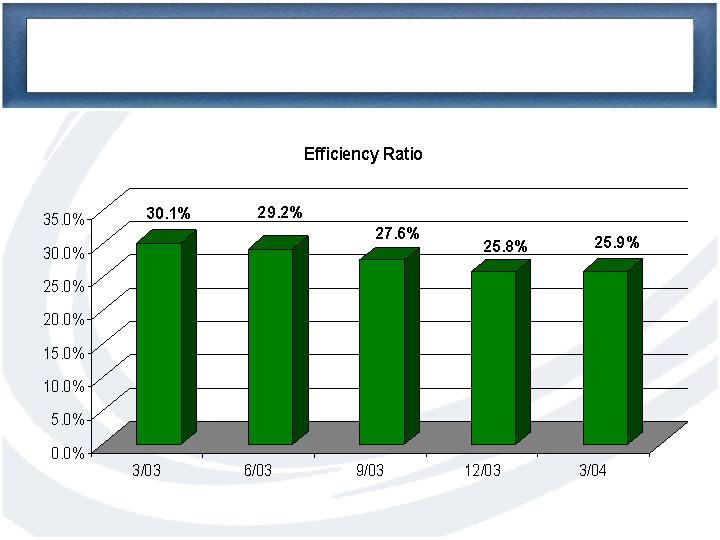
Efficiency Ratio
25.86%
30.08%
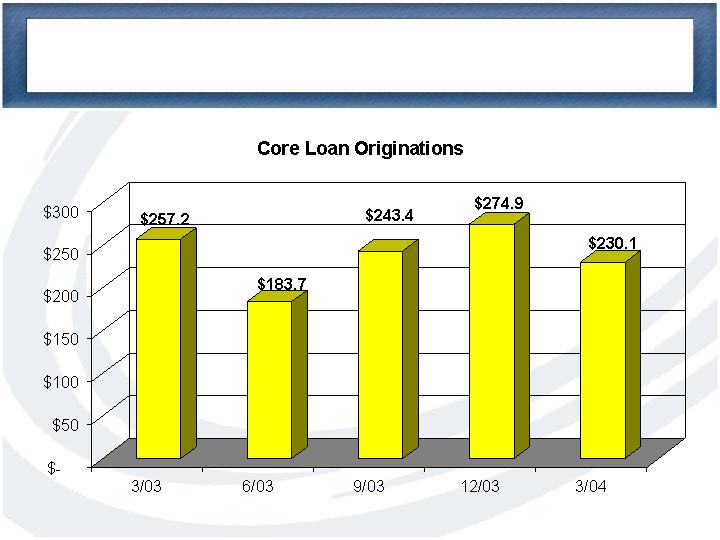
Total Loan Originations
$259 million
$267 million
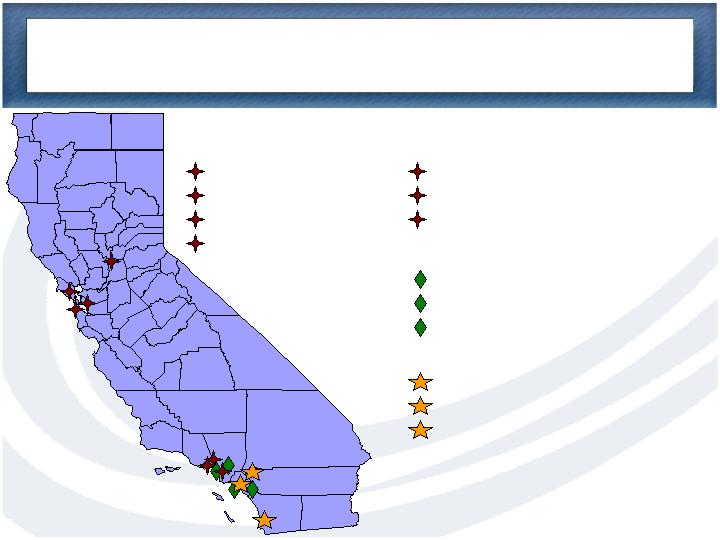
CCBI’s Growing Franchise Presence
Northern California
Loan Offices
Sacramento
Corte Madera
Burlingame
Oakland
Southern California
Loan Offices
Woodland Hills
Encino
West Los Angeles
Banking Offices
Rancho Santa Margarita
Beverly Hills (Summer 2004)
Newport Coast (2005)
Banking & Loan Offices
Irvine (Headquarters)
La Jolla
Riverside
4

Asset Quality of Multi-family Loans
Noncurrent Loans/
Nationwide
Total Loans
(1)
Multi-family
0.13%
Single family
0.84%
Commercial Real Estate
0.87%
Construction and Land Loans
0.85%
Business Loans
1.21%
Consumer
0.87%
Multi-family Loans
CCBI
0.00%
Western Region Thrifts
0.05%
Nationwide Thrifts
0.13%
(1) Based upon 12/31/03 Thrift Financial Reports for nationwide savings institutions
5

LTV and DCR of March 31, 2004 Portfolio
6
Multi-Family
Loan to Value
68%
Debt Coverage Ratio
1.29:1
Commercial RE
Loan to Value
65%
Debt Coverage Ratio
1.47:1
Values are weighted average ratios, at origination
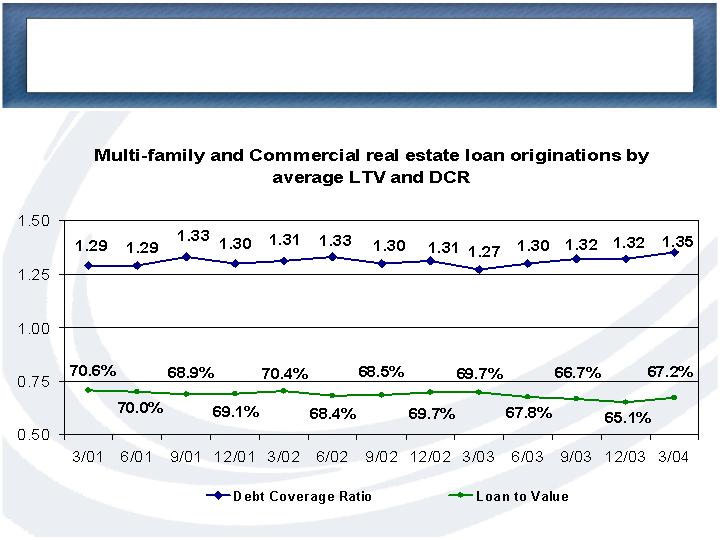
Consistent Underwriting
7
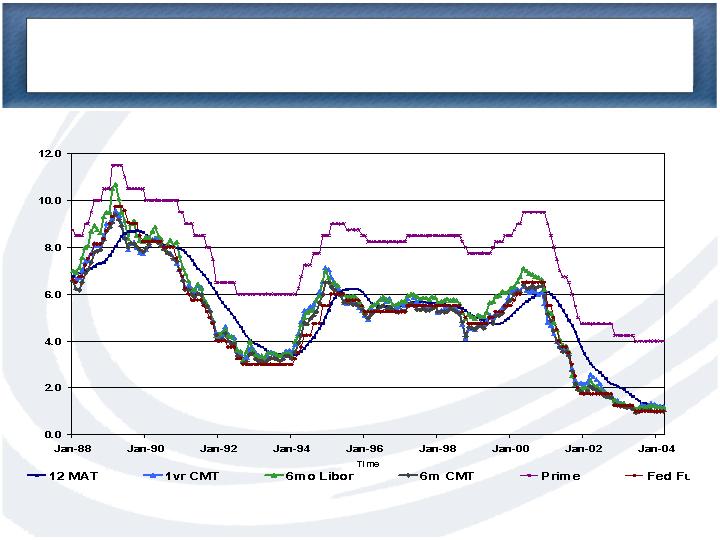
Interest Rate Comparison
(Interest Rate, in percent)
CCBI’s loan rates adjust based on 12MAT, 1yr CMT, 6mo LIBOR, 6mo CMT and Prime, plus a margin
8
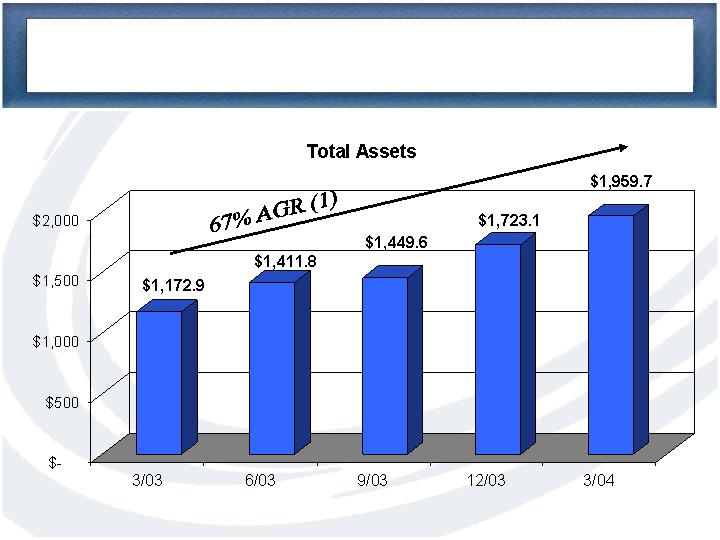
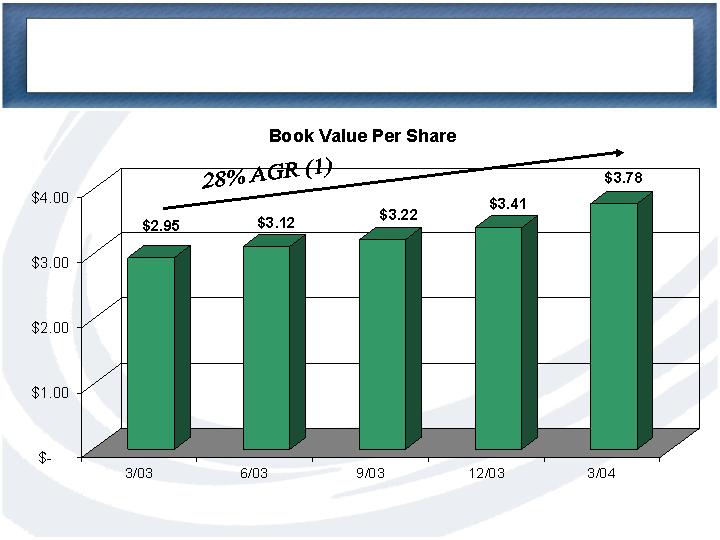
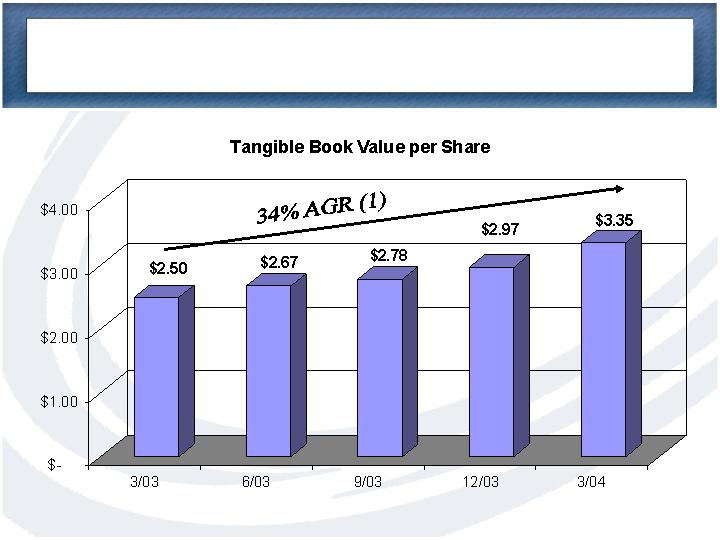
(1) AGR – Annual Growth Rate: 3/03 to 3/04
($ in millions)
Balance Sheet Growth
9
Balance Sheet Growth Generated Internally
($ in millions)
10
Historic Driver of Balance Sheet Growth
11
($ in millions)
Balance Sheet Growth
(1) AGR – Annual Growth Rate: 3/03 to 3/04
12
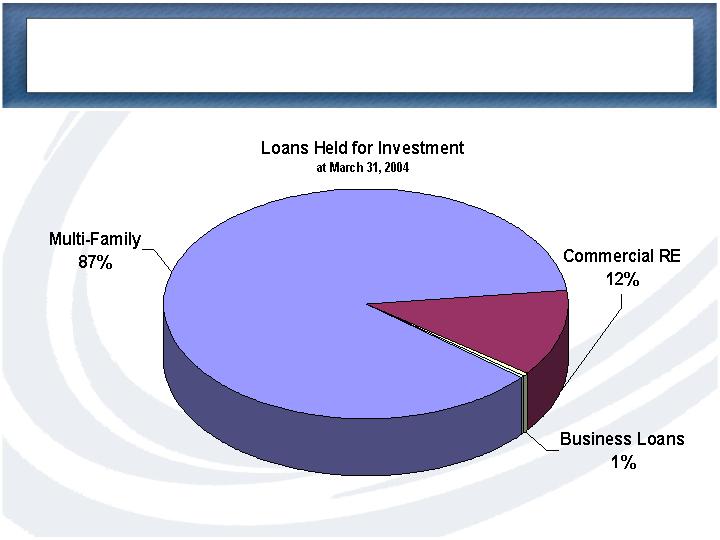
Loan Portfolio Mix
13
($ in millions)
Funding Asset Growth
(1) AGR – Annual Growth Rate: 3/03 to 3/04
14
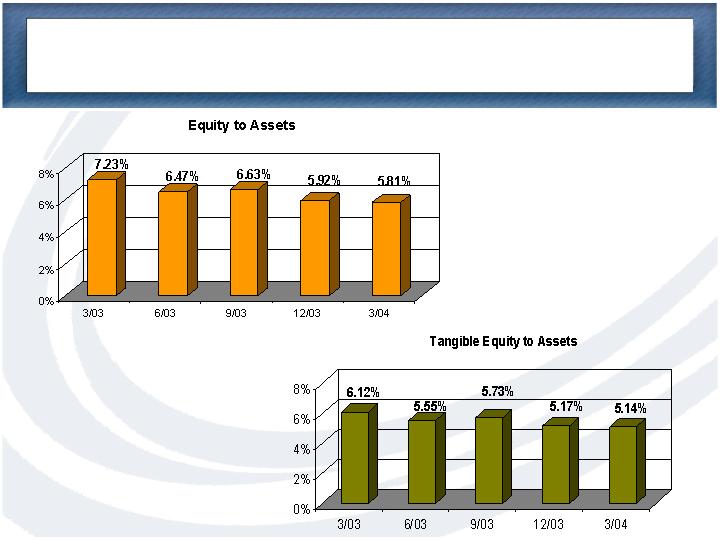
Capital Ratios
15
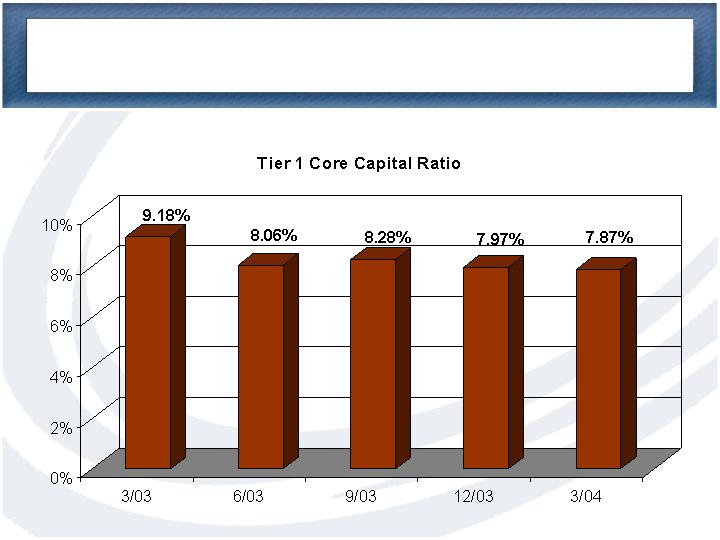
Bank Capital Ratio
16
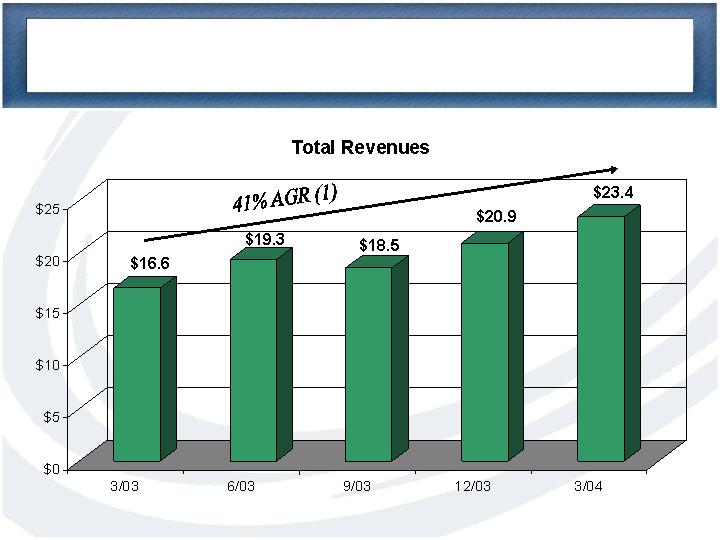
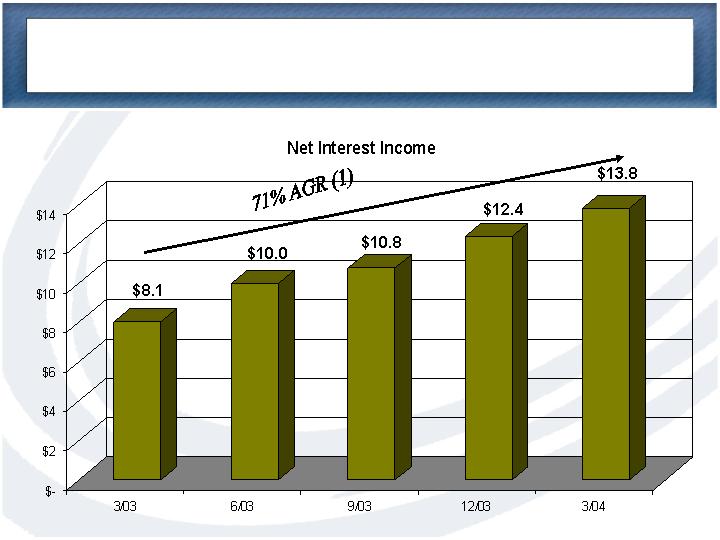
Operating Performance
($ in millions)
(1) AGR – Annual Growth Rate: 3/03 to 3/04
17
($ in millions)
Operating Performance
(1) AGR – Annual Growth Rate: 3/03 to 3/04
18
Operating Performance
19
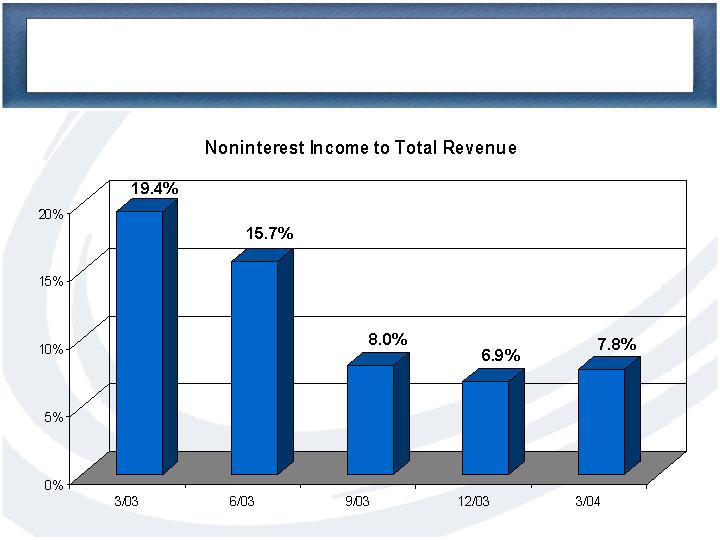
Operating Performance Ratios
20
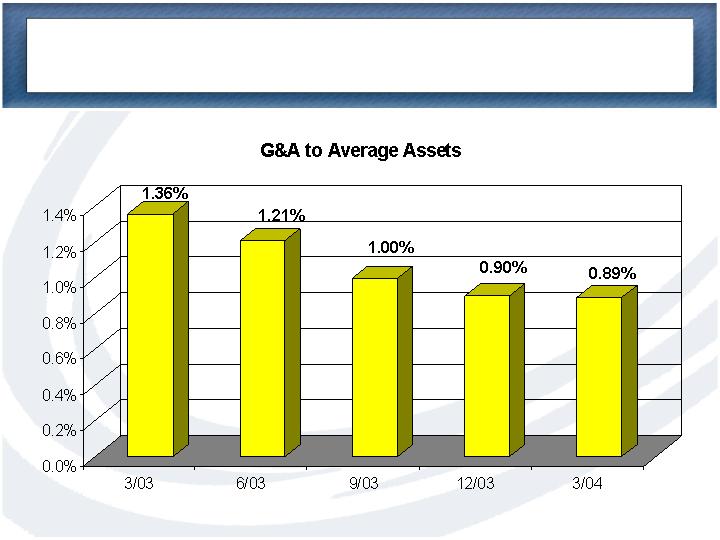
Operating Performance Ratios
21
($ in millions)
Earnings Performance
(1) AGR – Annual Growth Rate: 3/03 to 3/04.
22
Operating Performance
23
Profitability Ratios
24
Profitability Ratios
25
Profitability Ratios
26
Profitability Ratios
(1) AGR – Annual Growth Rate: 3/03 to 3/04.
27
Profitability Ratios
(1) AGR – Annual Growth Rate: 3/03 to 3/04.
28
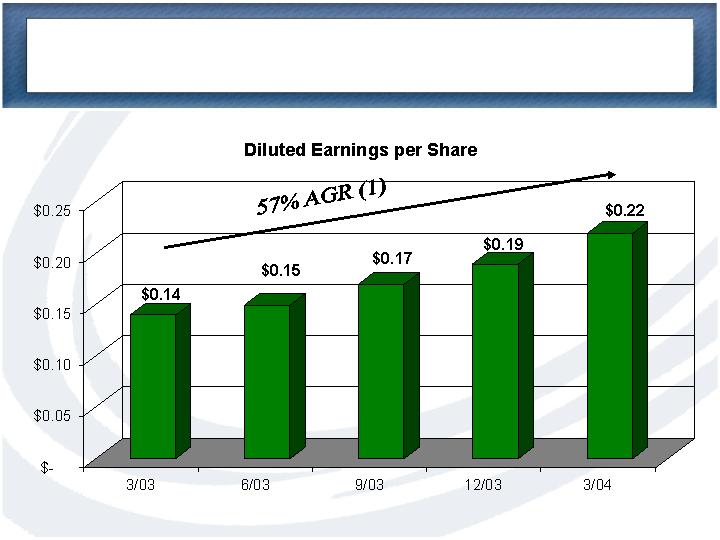
Earnings Performance
(1) AGR – Annual Growth Rate: 3/03 to 3/04.
29

CCB was the fastest growing savings institution in
California over the 36 months ended 12/31/03, (source
www.fdic.gov).
3rd largest multi-family originator in CA with 2.9%
market share for the 12 months ended 12/31/03, (source:
Dataquick Information Systems).
Leading Loan Originator & High Growth Bank
30

NASDAQ: “CCBI”
April 26, 2004