
July 26, 2004
Second Quarter 2004 Earnings Call
NASDAQ: “CCBI”

This presentation may include forward-looking statements related to the plans, beliefs
and goals of the Company, its subsidiaries, which involve certain risks and
uncertainties that could cause actual results to differ materially from those in the
forward-looking statements. Such risks and uncertainties include, but are not limited
to, the following factors: competitive pressure in the banking industry; changes in the
interest rate environment; the health of the economy, either nationally or regionally;
the deterioration of credit quality, which would cause an increase in the provision for
possible loan and lease losses; changes in the regulatory environment; changes in
business conditions, particularly in California real estate; volatility of rate sensitive
deposits; asset/liability matching risks and liquidity risks; changes in the securities
markets. The Company undertakes no obligation to revise or publicly release any
revision to these forward-looking statements.
Regulation FD
2

Leading Statewide Lender
Franchise Positioned for Strong Growth
One of California’s premier community-based retail
deposit franchises
CCB was the fastest growing savings institution in
California over the 36 months ended 3/31/04, (source
4 largest multi-family originator in CA with 2.6%
market share for the 12 months ended 3/31/04, (source:
th
www.fdic.gov).
Dataquick Information Systems).
Amongst the most efficient operations in the industry
Significant breadth and depth of talent and expertise
3

$7.1 million
26.30%
29.91%
1.56%
3.14%
25.86%
$259 million
CCBI Highlights
$10.9 million
17.66%
32.58%
1.57%
3.51%
25.34%
$467 million
$1.96 billion
$1.20 billion
$736 million
$114 million
$101 million
$4.74 billion
$3.65 billion
$2.44 billion
$583 million
$219 million
March 31, 2004
Financial Position
June 30, 2004
Quarter Ended
3/31/2004
Financial Results
Quarter Ended
6/30/2004
Total Assets
Loans Held for Investment
Deposits
Equity
Tangible Equity
Net Income
Return on Average Equity
Return on Avg.Tang. Equity
Return on Average Assets
Net Interest Margin
Efficiency Ratio
Total Loan Originations
4

(#21 opens in Beverly Hills in September 2004
#23 opens in Newport Coast in early 2005)
#22 opens in San Mateo in December 2004
Statewide Presence
12 Statewide Loan Offices
20 Southern California
Banking Offices
5
Asset Quality of Multi-family Loans
Noncurrent Loans/
Nationwide
Total Loans
(1)
Multi-family
0.21%
Single family
0.72%
Commercial Real Estate
0.93%
Construction and Land Loans
0.94%
Business Loans
1.52%
Consumer
0.70%
Multi-family Loans
CCBI
0.00%
Western Region Thrifts
0.07%
Nationwide Thrifts
0.21%
(1) Based upon 3/31/04 Thrift Financial Reports for nationwide savings institutions
6

Multi-Family
Loan to Value
Debt Coverage Ratio
Commercial RE
Loan to Value
Debt Coverage Ratio
Values are weighted average ratios, at origination
LTV and DCR of Second Quarter 2004
Originations
68%
1.28:1
66%
1.32:1
7
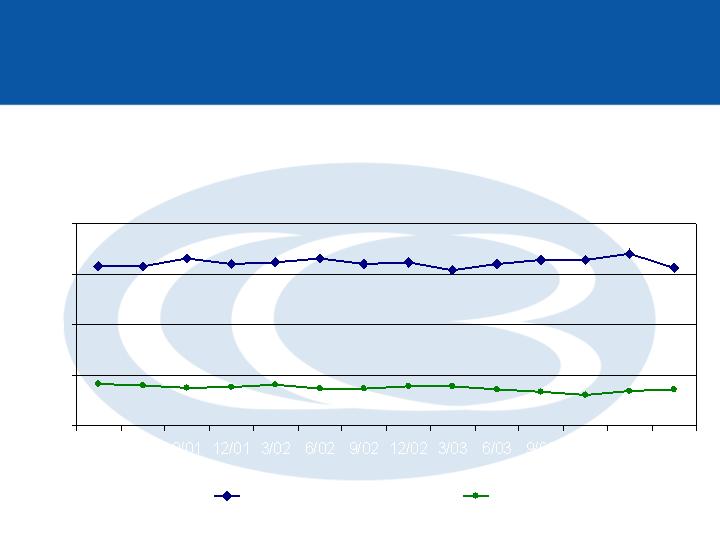
Consistent Underwriting
Multi-family and Commercial real estate loan originations by
average LTV and DCR
3/01
6/01
9/01
12/01
3/02
6/02
9/02
12/02
3/03
6/03
9/03
12/03
3/04
6/04
0.50
0.75
1.00
1.25
1.50
1.29
1.29
1.33
1.30
1.31
1.33
1.30
1.31
1.27
1.30
1.32
1.32
1.35
1.28
68.9%
70.6%
70.4%
68.5%
69.7%
66.7%
67.2%
69.1%
70.0%
68.4%
69.7%
67.8%
65.1%
67.8%
Debt Coverage Ratio
Loan to Value
8
Interest Rate Stress Analysis
12 MAT Neg/Am Product
Average Loan
$1,250,000 loan amount
2.50 % + 12 MAT (1.381%)
1.30 : 1 DCR at 5.5% stress rate
70% LTV
Due to payment caps of 7.5% per annum and 5 year recast provisions, our average 12MAT loan
continues to perform well in a rising interest rate environment.
100 bps
200 bps
300 bps
Minimum Actual DCR
1.38 : 1
1.24 : 1
1.09 : 1
DCR at Recast 5th Year
1.46 : 1
1.28 : 1
1.12 : 1
Months to Min DCR
36
48
48
Max Neg Am
N/A
100.15%
103.70%
Months to Max Loan Balance
1
36
48
MAX LTV
70%
70.11%
72.60%
Rate Shock
(2.12% 1 yr CMT)
9
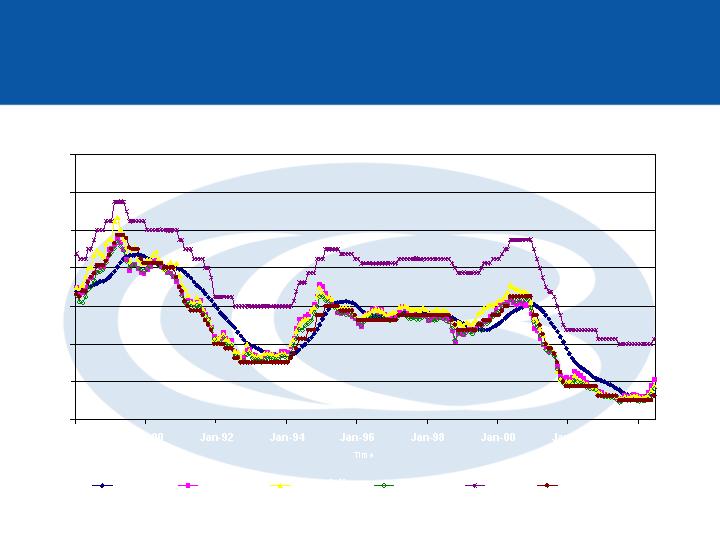
Interest Rate Comparison
(Interest Rate, in percent)
CCBI’s loan rates adjust based on 12MAT, 1yr CMT, 6mo LIBOR, 6mo CMT and Prime, plus a margin
0
2
4
6
8
10
12
14
Jan-88
Jan-90
Jan-92
Jan-94
Jan-96
Jan-98
Jan-00
Jan-02
Jan-04
Time
12 MAT
1yr CMT
6mo Libor
6m CMT
Prime
Fed Funds
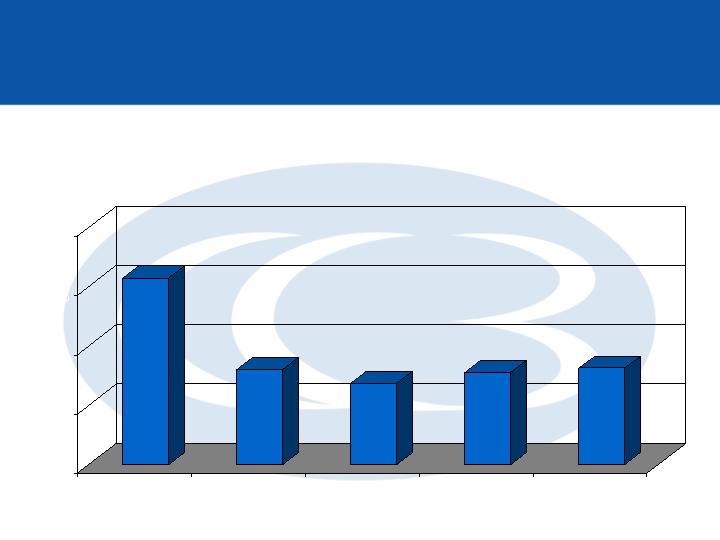
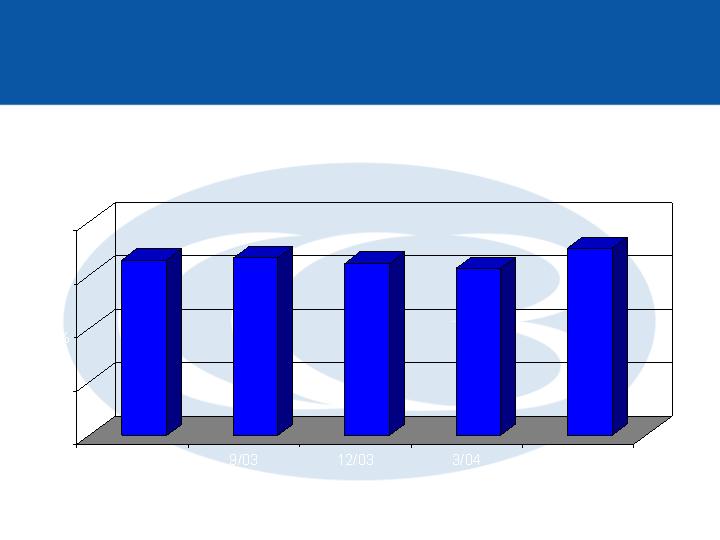
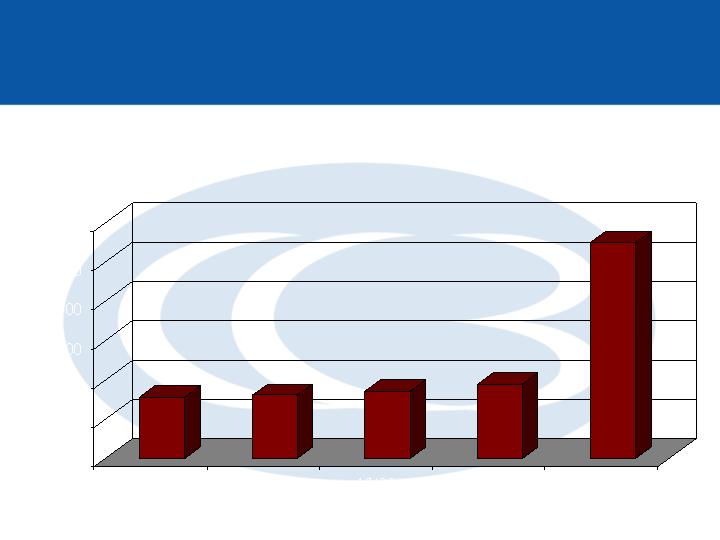
10
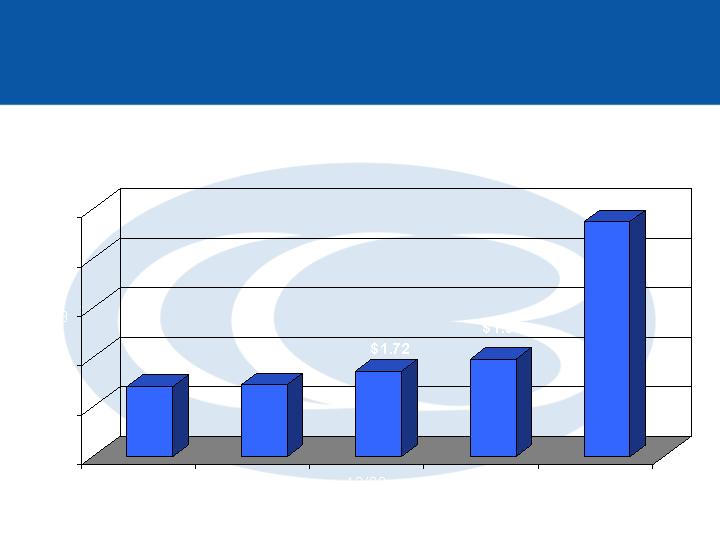
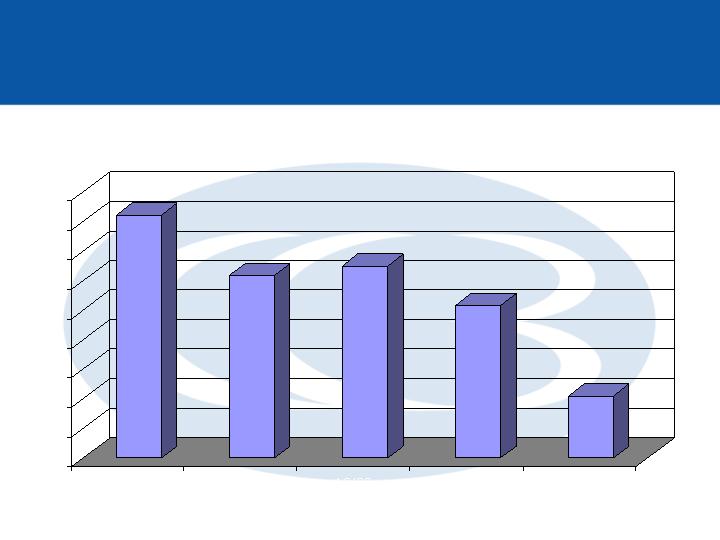
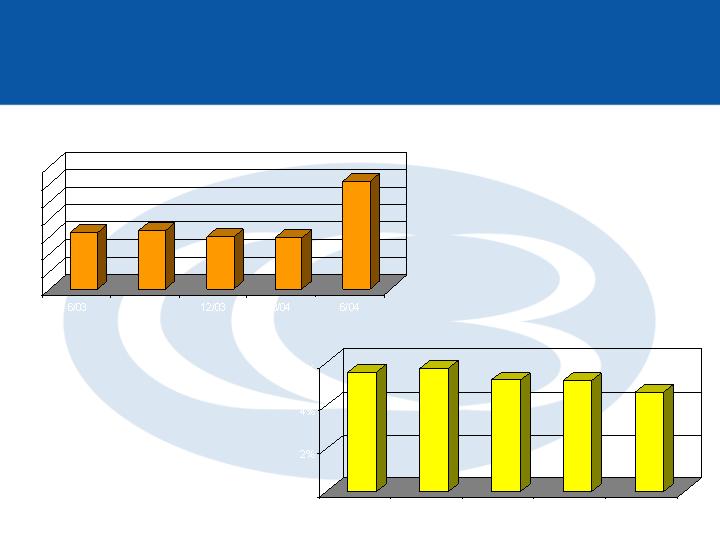
($ in billions)
Balance Sheet Growth
$1.41
$1.45
$1.72
$1.96
$4.74
$-
$1
$2
$3
$4
$5
6/03
9/03
12/03
3/04
6/04
Total Assets
11
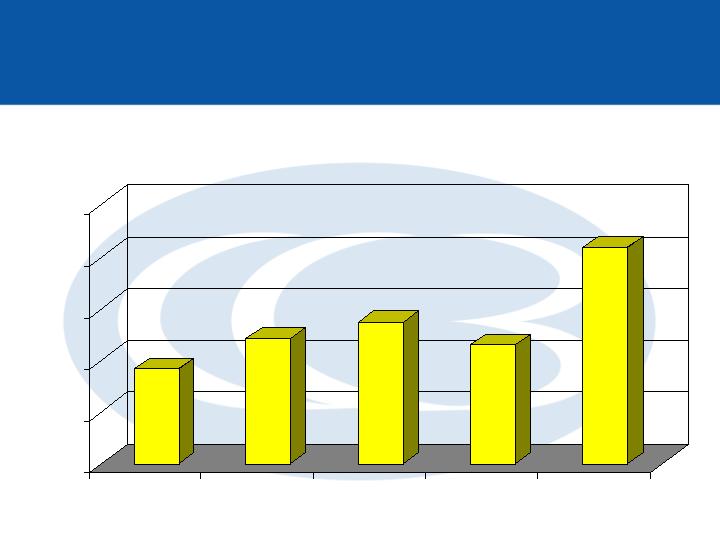
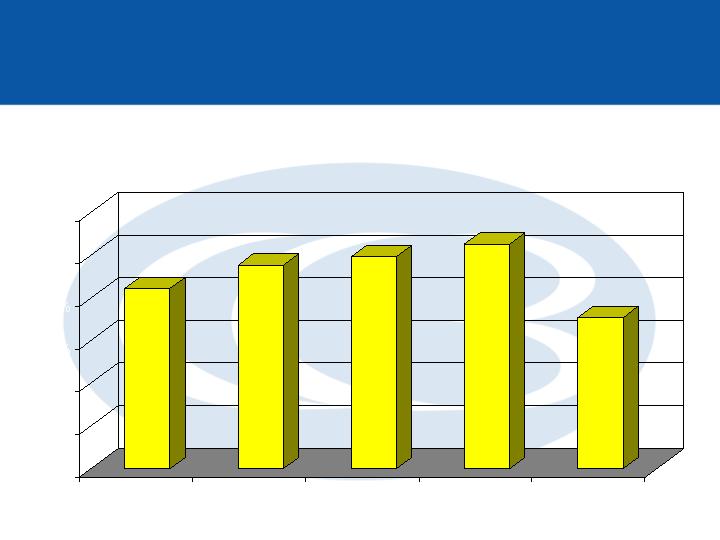
Balance Sheet Growth Generated Internally
($ in millions)
$183.7
$243.4
$274.9
$230.1
$418.9
$-
$100
$200
$300
$400
$500
6/03
9/03
12/03
3/04
6/04
Core Loan Originations
12
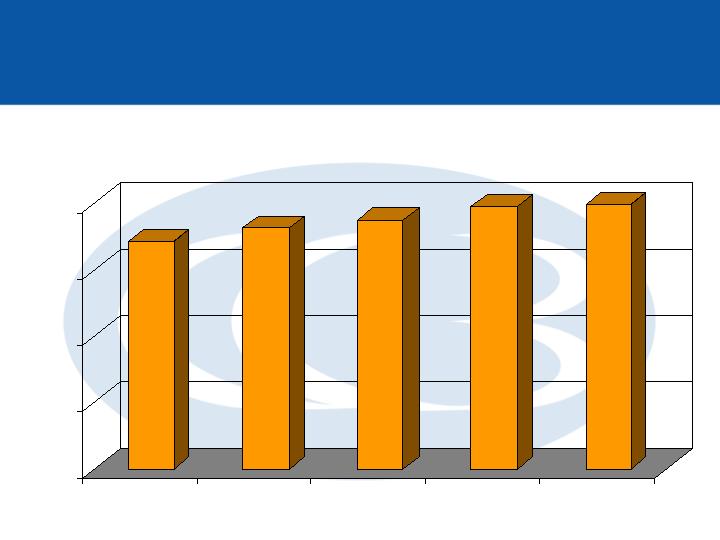
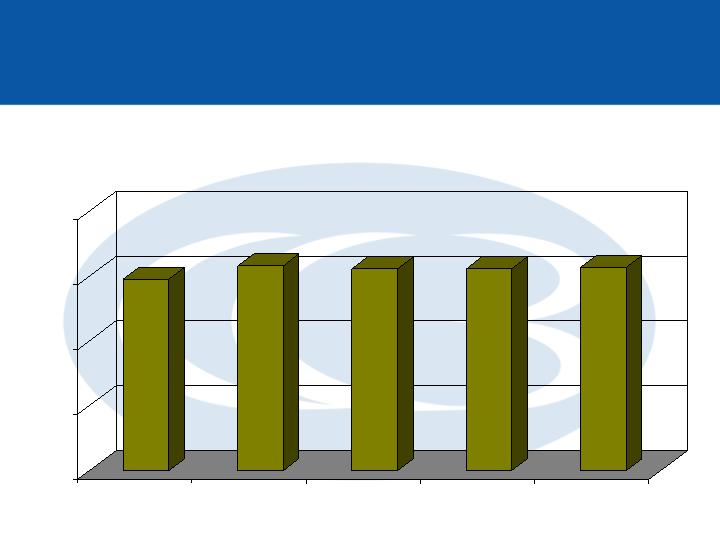
Historic Driver of Balance Sheet Growth
86%
91%
94%
99%
100%
0%
25%
50%
75%
100%
6/03
9/03
12/03
3/04
6/04
Core Loan Originations Retained
13
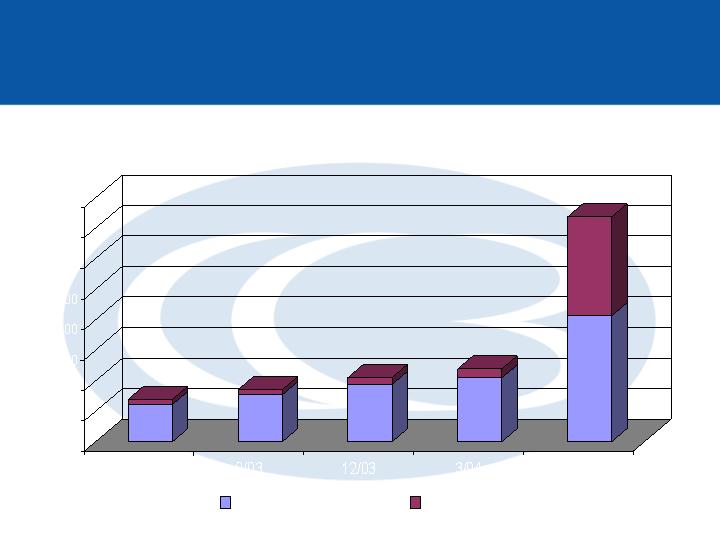
Balance Sheet Growth
87%
$701.4
89%
$861.8
89%
$1,052.5
87%
$1,202.0
56%
$3,700.0
$0
$500
$1,000
$1,500
$2,000
$2,500
$3,000
$3,500
$4,000
6/03
9/03
12/03
3/04
6/04
Total Loans Held for Investment
Multi-Family
All other loans
14
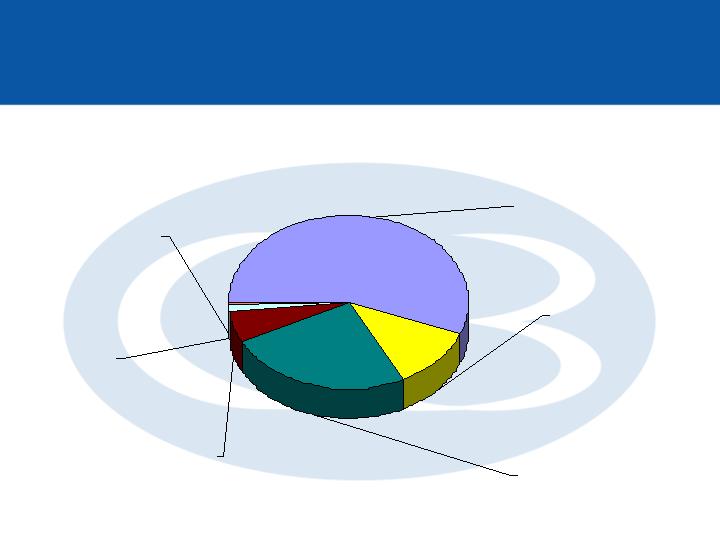
Loan Portfolio Mix
Loans Held for Investment
$13 mm
Business &
Other Loans
<1%
$924 mm
Single Family
25%
$428 mm
Commercial RE
12%
$2,066 mm
Multi-Family
56%
$217 mm
Construction
6%
$52 mm
Land
1%
15
Investment Securities
41%
31%
33%
26%
11%
0%
5%
10%
15%
20%
25%
30%
35%
40%
45%
6/03
9/03
12/03
3/04
6/04
Securities to Total Assets
16
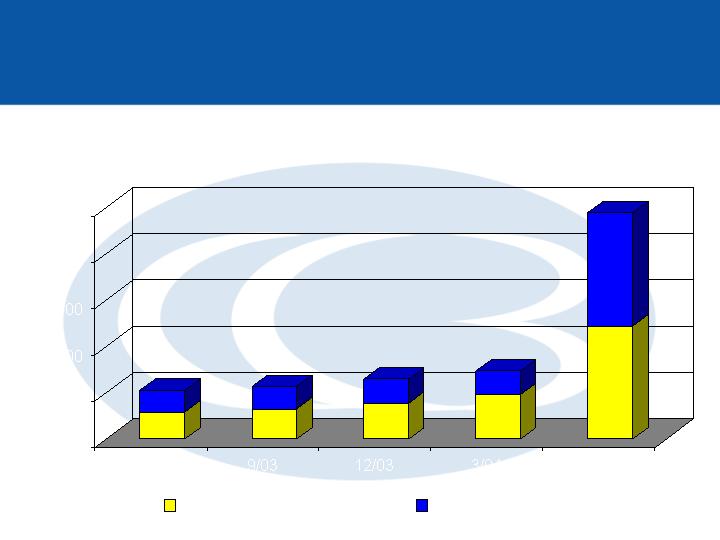
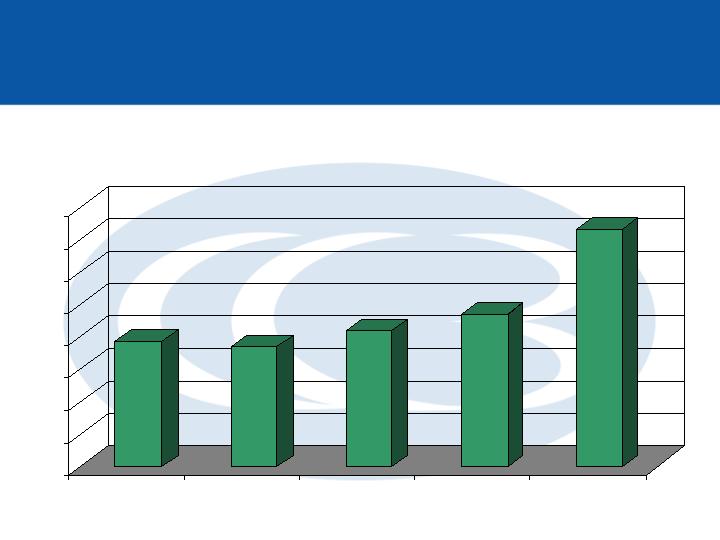
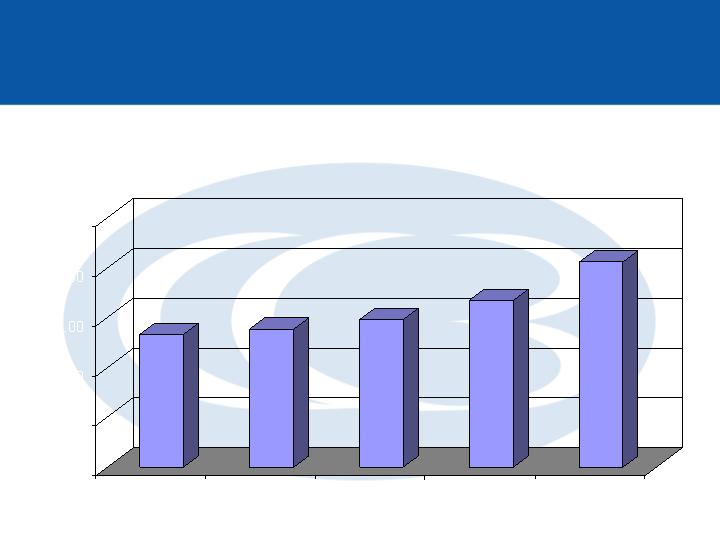
($ in millions)
Core Deposit Growth
55%
$529.6
57%
$566.4
60%
$645.6
65%
$736.3
50%
$2,443.9
$-
$500
$1,000
$1,500
$2,000
$2,500
6/03
9/03
12/03
3/04
6/04
Total Deposits
Transaction Accounts
Time Deposits
17
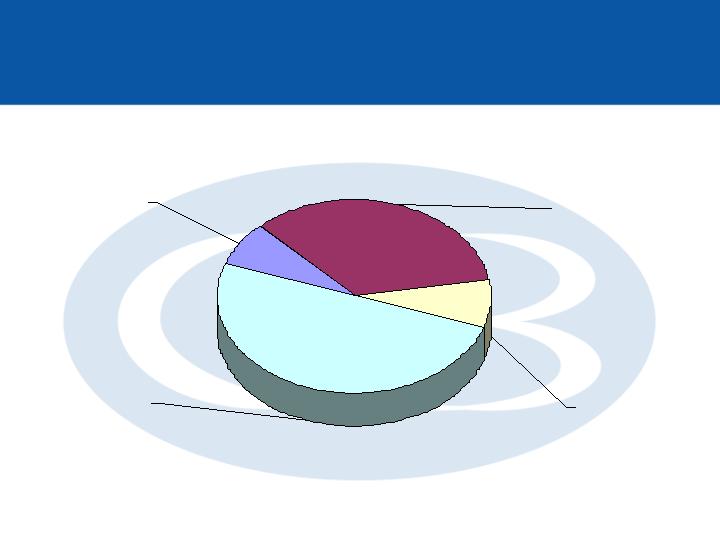
$1,227 mm
Time Deposits
50%
$198 mm
Savings
Deposits
8%
$837 mm
Money Market
Deposits
34%
$182 mm
Demand
Deposits
8%
Deposit Composition
18
Capital Ratios
6.47%
6.63%
5.92%
5.81%
12.29%
0%
2%
4%
6%
8%
10%
12%
14%
6/03
9/03
12/03
3/04
6/04
Equity to Assets
5.55%
5.73%
5.17%
5.14%
0%
2%
4%
6%
6/03
9/03
12/03
3/04
6/04
Tangible Equity to Assets
4.62%
19
Capital Ratios
5.60%
5.78%
5.20%
5.17%
5.00%
0%
2%
4%
6%
6/03
9/03
12/03
3/04
6/04
Tangible Equity to Tangible Assets
20
Bank Capital Ratio
8.06%
8.28%
7.97%
7.87%
7.58%
0%
2%
4%
6%
8%
10%
6/03
9/03
12/03
3/04
6/04
Tier 1 Core Capital Ratio
21
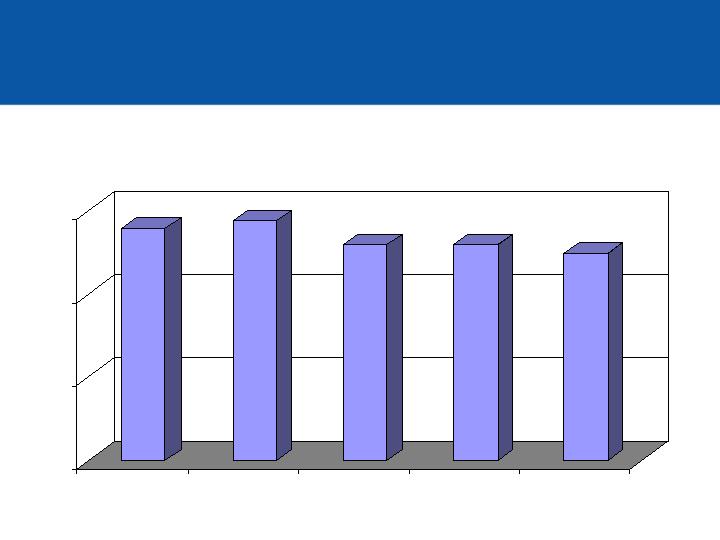
Operating Performance
($ in millions)
$19.3
$18.5
$20.9
$23.4
$36.6
$0
$5
$10
$15
$20
$25
$30
$35
$40
6/03
9/03
12/03
3/04
6/04
Total Revenues
22
($ in millions)
Operating Performance
$10.0
$10.8
$12.4
$13.8
$22.9
$-
$5
$10
$15
$20
$25
6/03
9/03
12/03
3/04
6/04
Net Interest Income
23
Operating Performance
15.7%
8.0%
6.9%
7.8%
8.1%
0%
5%
10%
15%
20%
6/03
9/03
12/03
3/04
6/04
Noninterest Income to Total Revenue
24
Operating Performance Ratios
1.21%
1.00%
0.90%
0.89%
0.94%
0.0%
0.2%
0.4%
0.6%
0.8%
1.0%
1.2%
1.4%
6/03
9/03
12/03
3/04
6/04
G&A to Average Assets
25
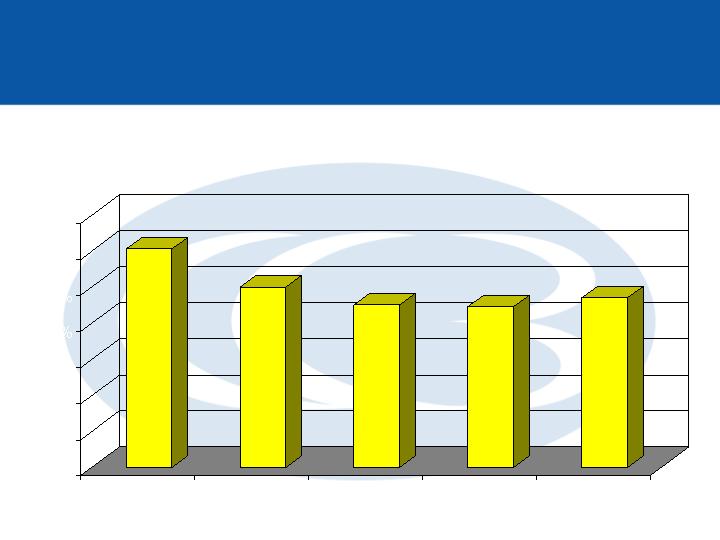
Operating Performance Ratios
29.2%
27.6%
25.8%
25.9%
25.3%
0.0%
5.0%
10.0%
15.0%
20.0%
25.0%
30.0%
6/03
9/03
12/03
3/04
6/04
Efficiency Ratio
26
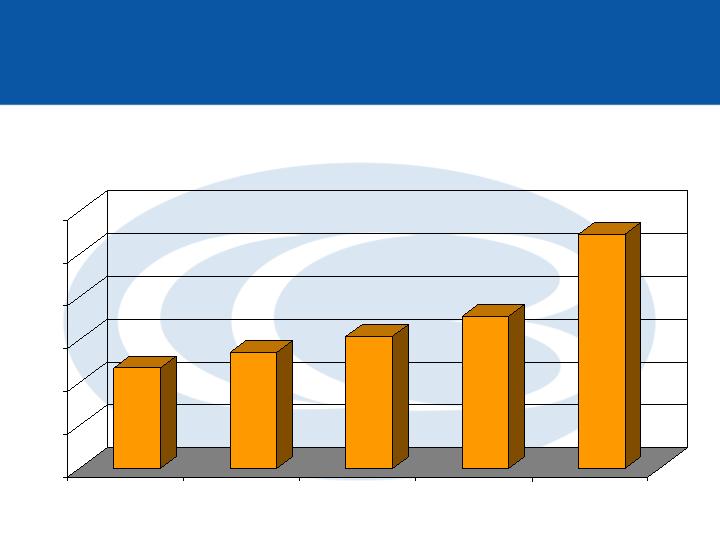
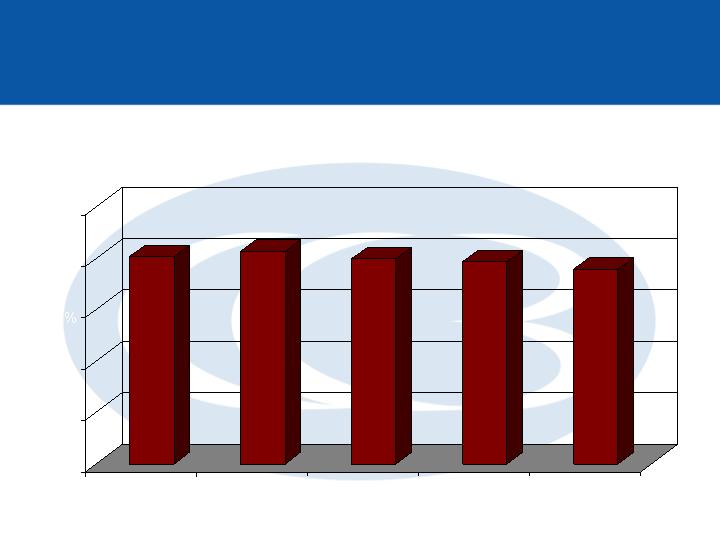
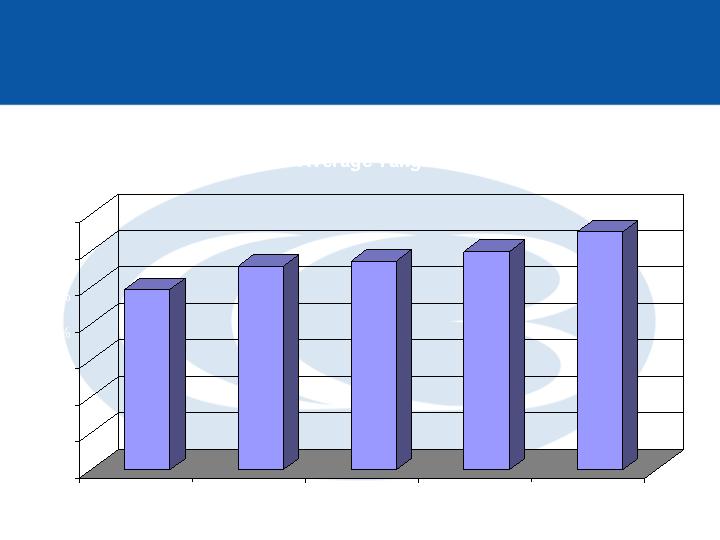
($ in millions)
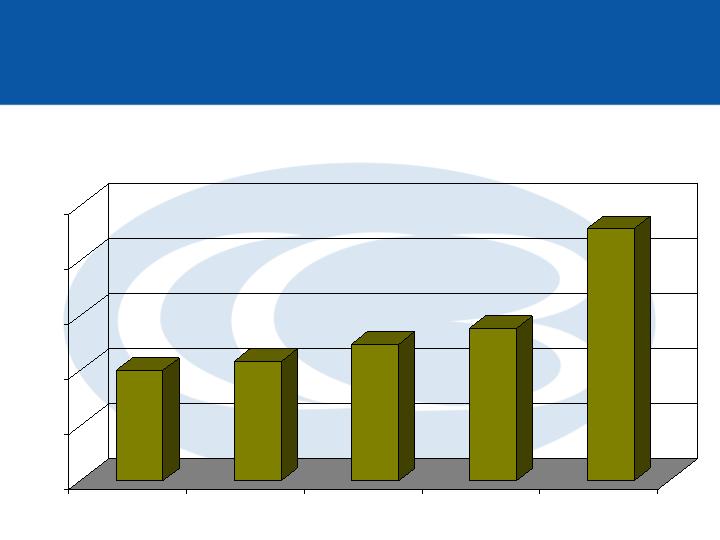
Earnings Performance
$4.7
$5.4
$6.2
$7.1
$10.9
$0
$2
$4
$6
$8
$10
$12
6/03
9/03
12/03
3/04
6/04
Quarterly Net Income
27
Operating Performance
3.30%
3.33%
3.23%
3.14%
3.51%
0%
1%
2%
3%
4%
6/03
9/03
12/03
3/04
6/04
Net Interest Margin
28
Profitability Ratios
1.48%
1.58%
1.56%
1.56%
1.57%
0.0%
0.5%
1.0%
1.5%
2.0%
6/03
9/03
12/03
3/04
6/04
Return on Average Assets
29
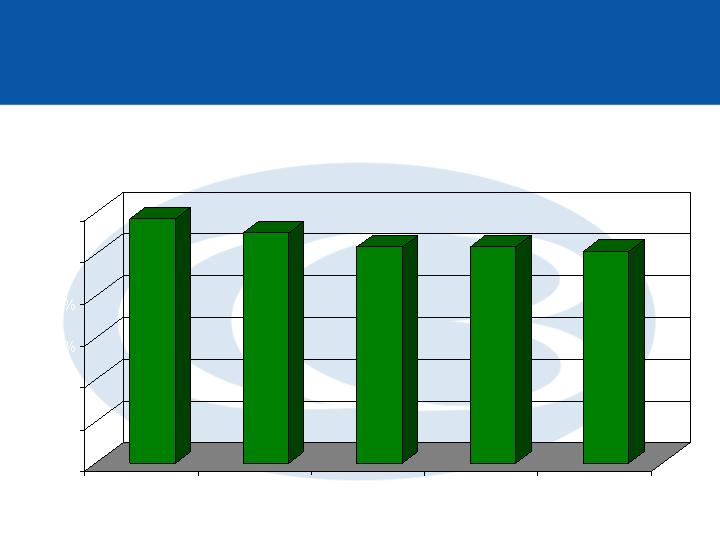
Profitability Ratios
21.1%
23.8%
24.8%
26.3%
17.7%
0%
5%
10%
15%
20%
25%
30%
6/03
9/03
12/03
3/04
6/04
Return on Average Equity
30
Profitability Ratios
24.7%
27.9%
28.6%
29.9%
32.6%
0%
5%
10%
15%
20%
25%
30%
35%
6/03
9/03
12/03
3/04
6/04
Return on Average Tangible Equity
31
Profitability Ratios
$3.12
$3.22
$3.41
$3.78
$10.97
$-
$2.00
$4.00
$6.00
$8.00
$10.00
$12.00
6/03
9/03
12/03
3/04
6/04
Book Value Per Share
32
Profitability Ratios
Tangible Book Value per Share
$-
$1.00
$2.00
$3.00
$4.00
$5.00
$2.67
$2.78
$2.97
$3.35
$4.13
6/03
9/03
12/03
3/04
6/04
33
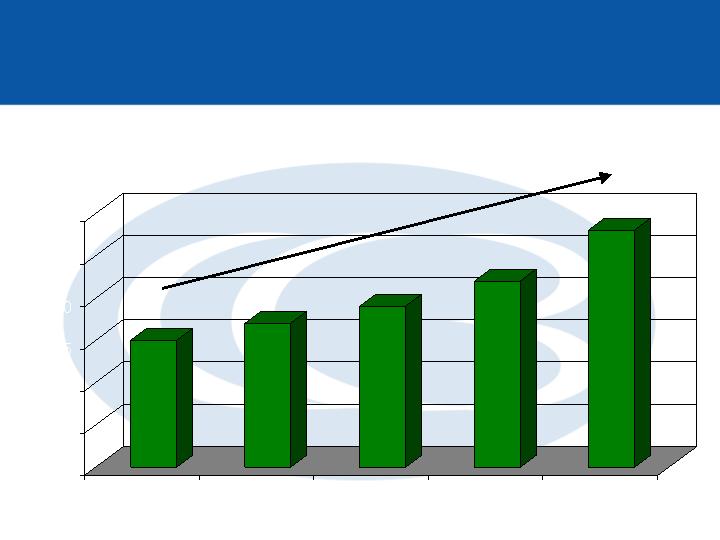
Earnings Performance
(1) AGR – Annual Growth Rate 6/03 to 6/04
$0.15
$0.17
$0.19
$0.22
$0.28
$-
$0.05
$0.10
$0.15
$0.20
$0.25
$0.30
6/03
9/03
12/03
3/04
6/04
Diluted Earnings per Share
87% AGR(1)
34
July 26, 2004
NASDAQ: “CCBI”
Second Quarter 2004 Earnings Call