Commercial Capital Bancorp (CCBI) Inactive
Filed: 24 Jan 05, 12:00am

January 24, 2005
Fourth Quarter 2004 Earnings Call
NASDAQ: “CCBI”

This presentation may include forward-looking statements related to the plans, beliefs
and goals of the Company, its subsidiaries, which involve certain risks and
uncertainties that could cause actual results to differ materially from those in the
forward-looking statements. Such risks and uncertainties include, but are not limited
to, the following factors: competitive pressure in the banking industry; changes in the
interest rate environment; the health of the economy, either nationally or regionally;
the deterioration of credit quality, which would cause an increase in the provision for
possible loan and lease losses; changes in the regulatory environment; changes in
business conditions, particularly in California real estate; volatility of rate sensitive
deposits; asset/liability matching risks and liquidity risks; changes in the securities
markets. The Company undertakes no obligation to revise or publicly release any
revision to these forward-looking statements.
Regulation FD
2

3rd largest multi-family originator in CA with 3.4%
market share for the 12 months ended 9/30/04 (source:
Franchise Positioned for Strong Growth
27th Largest Thrift in U.S., 6th Largest in CA (source: SNL
Datasource).
CCB was the fastest growing savings institution in
California over the 36 months ended 9/30/04 (source
www.fdic.gov).
Dataquick Information Systems).
One of California’s premier community-based retail
deposit franchises.
Amongst the most efficient operations in the industry.
3
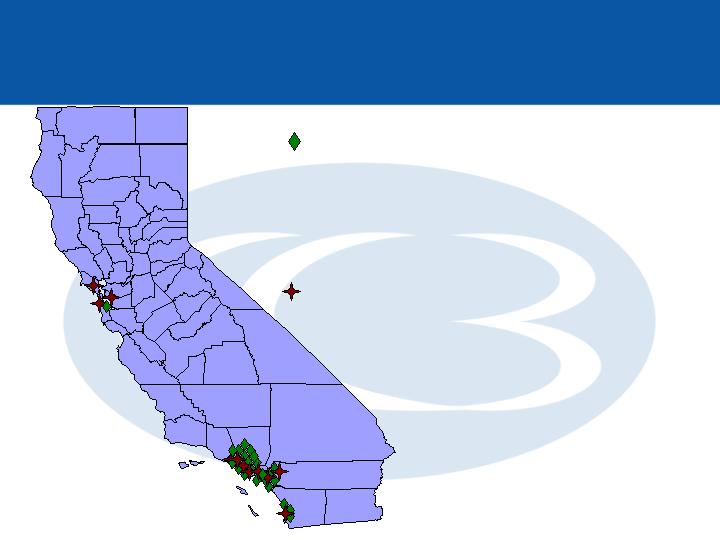
Statewide Presence
21 Southern California
Banking Offices
(#21 opened in Beverly Hills on October 4, 2004
#22 opens in San Mateo in early 2005
#23 opens in Newport Coast in mid-2005)
10 Statewide Loan Offices
4

CCBI Highlights
Financial Position
Total Assets
Loans Held for Investment, net
Deposits
Equity
Tangible Equity
Dec 31, 2004
$5.02 billion
$3.91 billion
$2.26 billion
$625 million
$262 million
Sept 30, 2004
$4.97 billion
$3.86 billion
$2.30 billion
$609 million
$245 million
Financial Results
Net Income
Return on Average Equity
Return on Avg.Tang. Equity
Return on Average Assets
Return on Avg.Tang. Assets
Net Interest Margin
Efficiency Ratio
Total Loan Originations
Quarter Ended
12/31/2004
$20.2 million
13.06%
31.55%
1.61%
1.73%
3.38%
28.13%
$541 million
Quarter Ended
9/30/2004
$18.0 million
12.02%
30.55%
1.50%
1.62%
3.49%
30.59%
$583 million
5
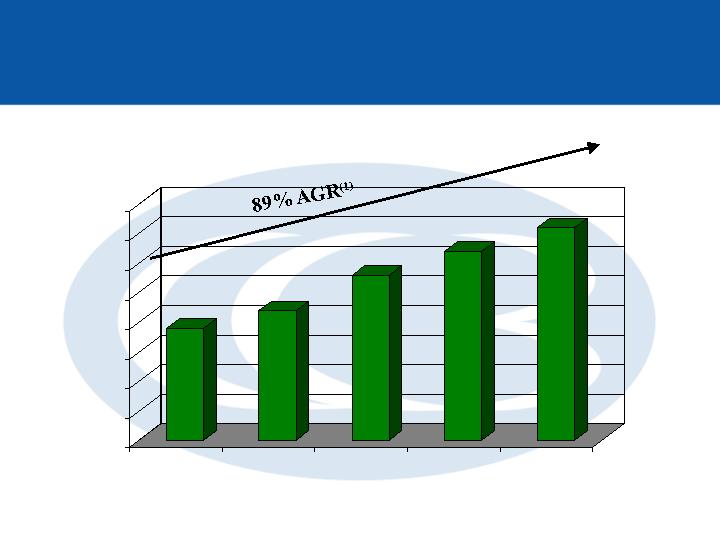
$0.19
$0.22
$0.28
$0.32
$0.36
$-
$0.05
$0.10
$0.15
$0.20
$0.25
$0.30
$0.35
$0.40
12/03
3/04
6/04
9/04
12/04
Diluted Earnings per Share
Superior Earnings Performance
(1) AGR – Annual Growth Rate 12/03 to 12/04
6
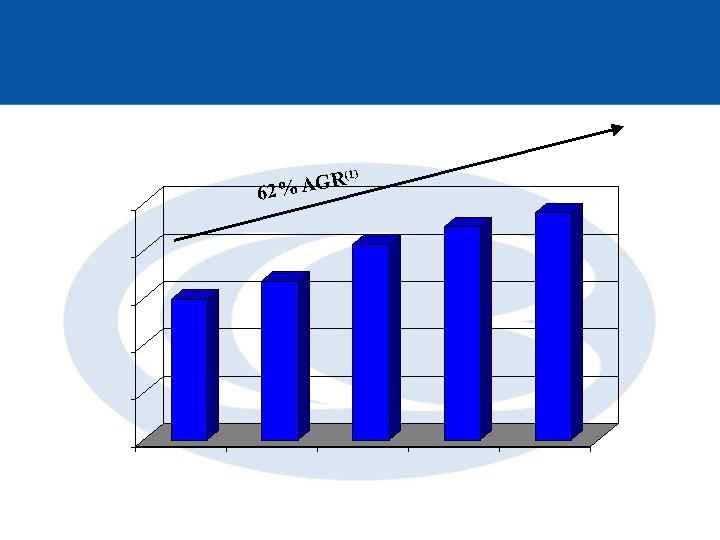
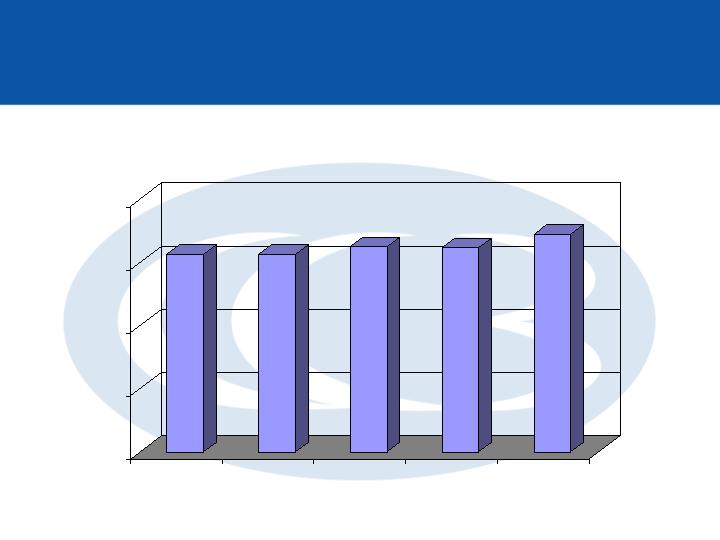
$2.97
$3.35
$4.13
$4.51
$4.80
$-
$1.00
$2.00
$3.00
$4.00
$5.00
12/03
3/04
6/04
9/04
12/04
Tangible Book Value per Share
Equity Ratios
(1) AGR – Annual Growth 12/03 to 12/04
7
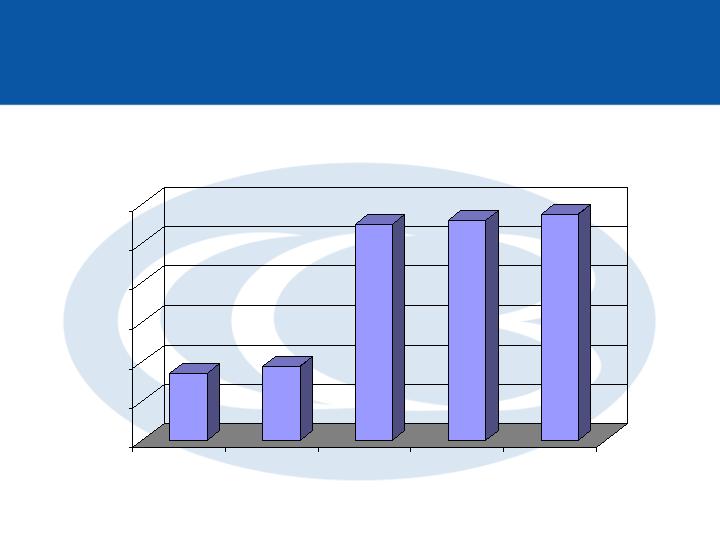
Equity Ratios
$3.41
$3.78
$10.97
$11.20
$11.47
$-
$2.00
$4.00
$6.00
$8.00
$10.00
$12.00
12/03
3/04
6/04
9/04
12/04
Book Value Per Share
8
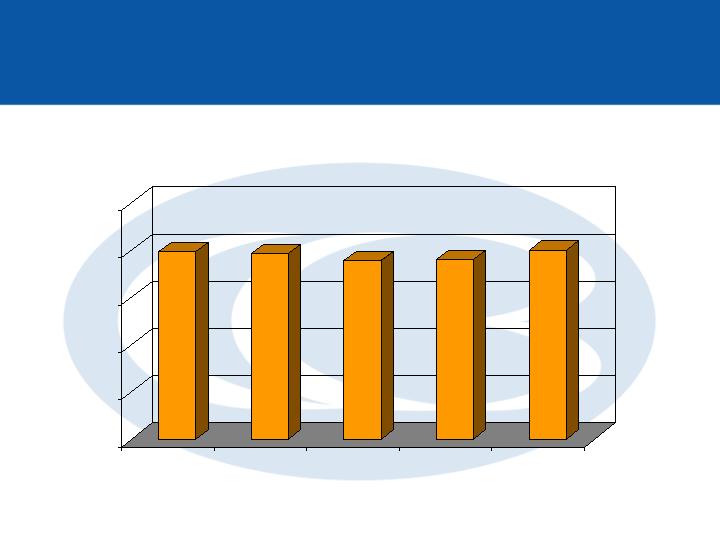
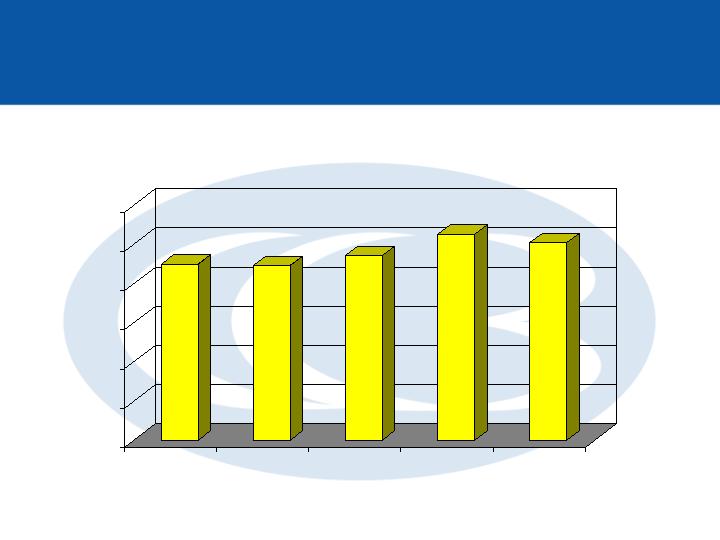
Profitability Ratios
1.56%
1.56%
1.57%
1.50%
1.61%
0.0%
0.5%
1.0%
1.5%
2.0%
12/03
3/04
6/04
9/04
12/04
Return on Average Assets
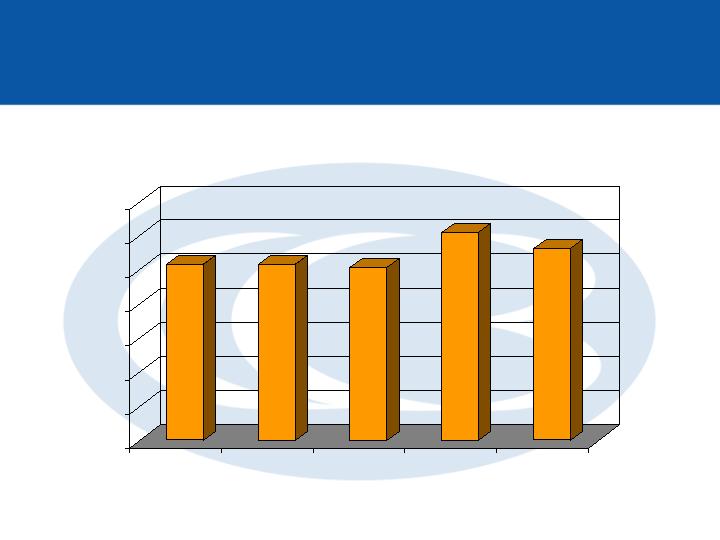
9
Profitability Ratios
1.57%
1.57%
1.63%
1.62%
1.73%
0.00%
0.50%
1.00%
1.50%
2.00%
12/03
3/04
6/04
9/04
12/04
Return on Average Tangible Assets
10
Profitability Ratios
28.6%
29.9%
32.6%
30.6%
31.6%
0%
5%
10%
15%
20%
25%
30%
35%
12/03
3/04
6/04
9/04
12/04
Return on Average Tangible Equity
11
Profitability Ratios
24.8%
26.3%
17.7%
12.0%
13.1%
0%
5%
10%
15%
20%
25%
30%
12/03
3/04
6/04
9/04
12/04
Return on Average Equity
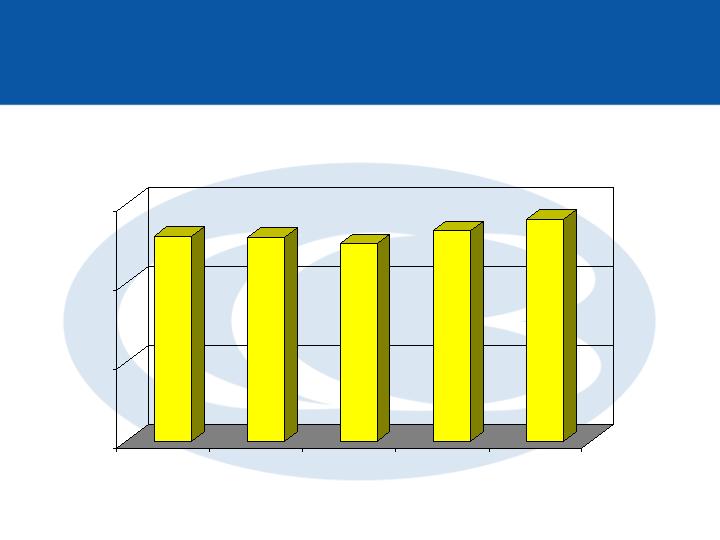
12
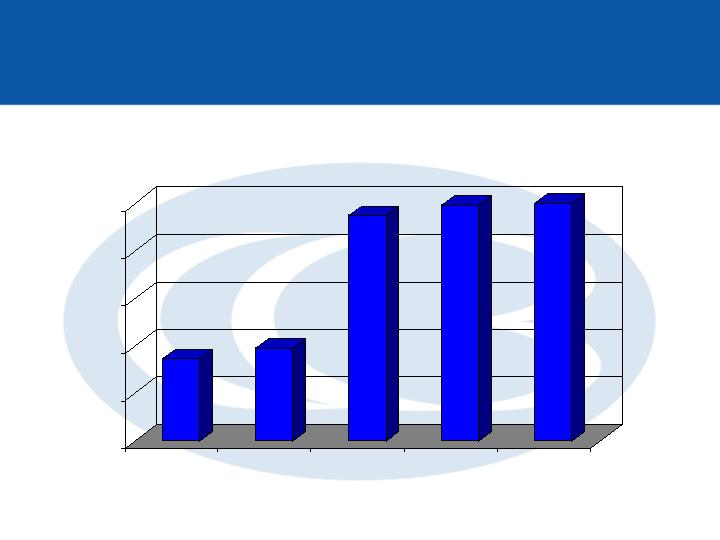
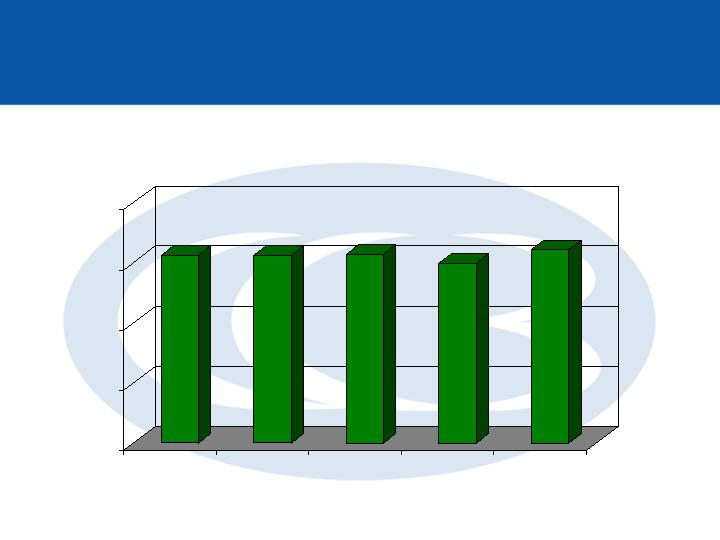
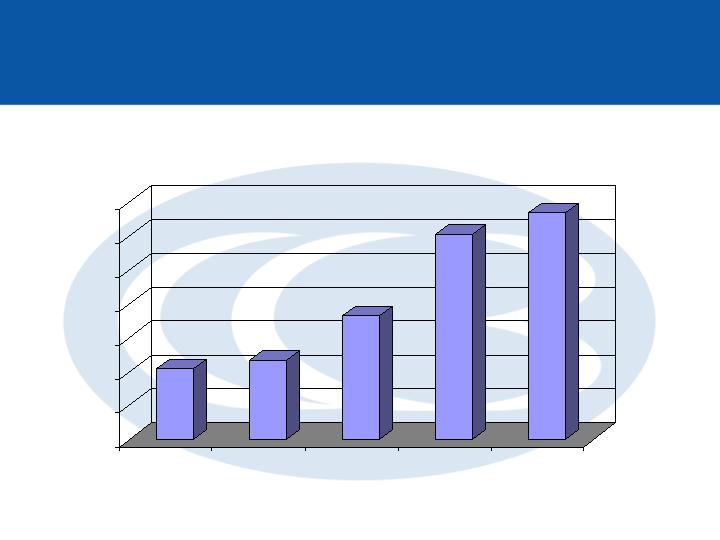
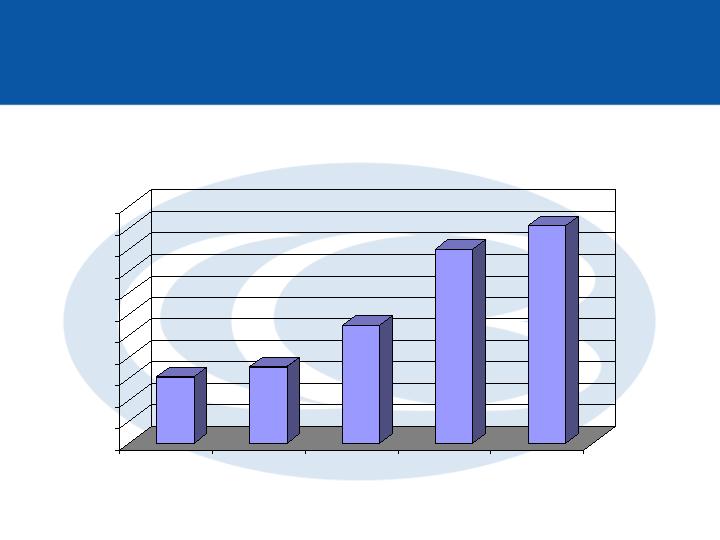
$1.72
$1.96
$4.74
$4.97
$5.02
$-
$1
$2
$3
$4
$5
12/03
3/04
6/04
9/04
12/04
Total Assets
($ in billions)
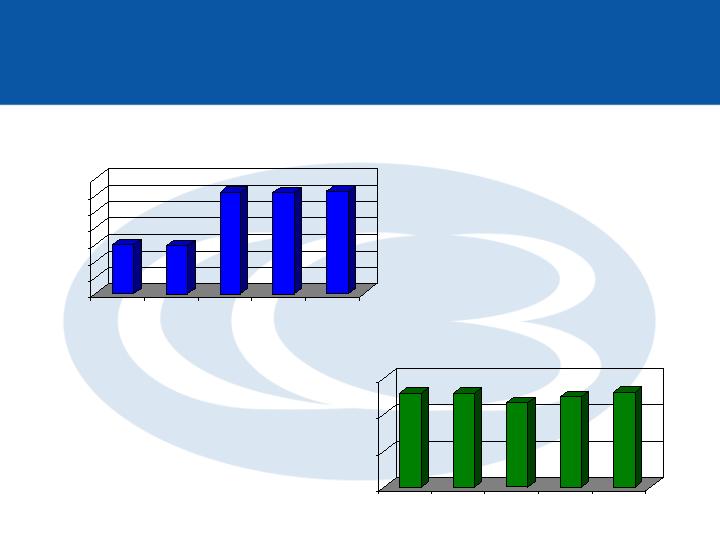
Balance Sheet Growth
13
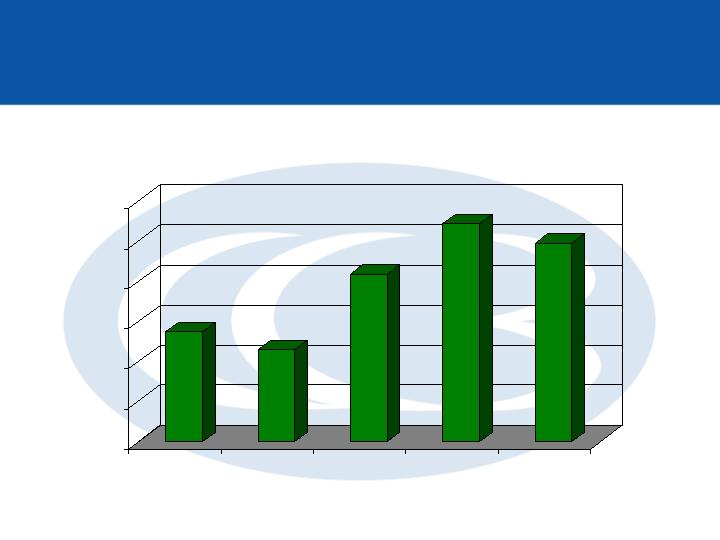
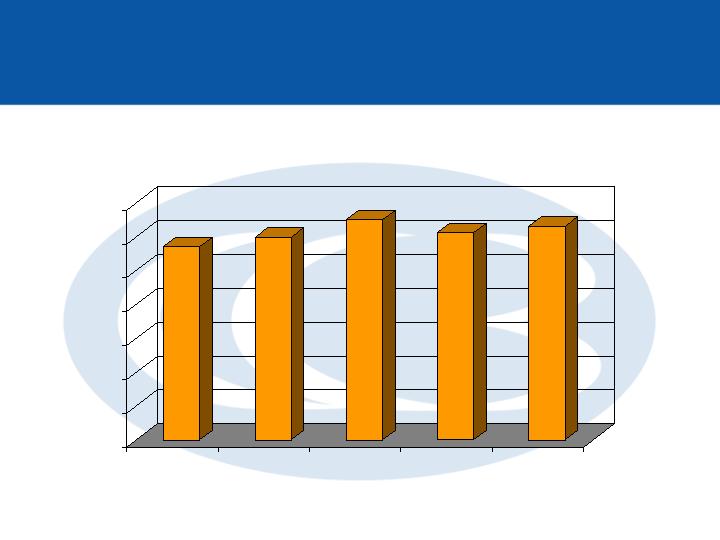
Loan Originations Support
Balance Sheet Growth
$274.9
$230.1
$418.9
$545.0
$495.7
$-
$100
$200
$300
$400
$500
$600
12/03
3/04
6/04
9/04
12/04
Core Loan Originations
14
($ in millions)
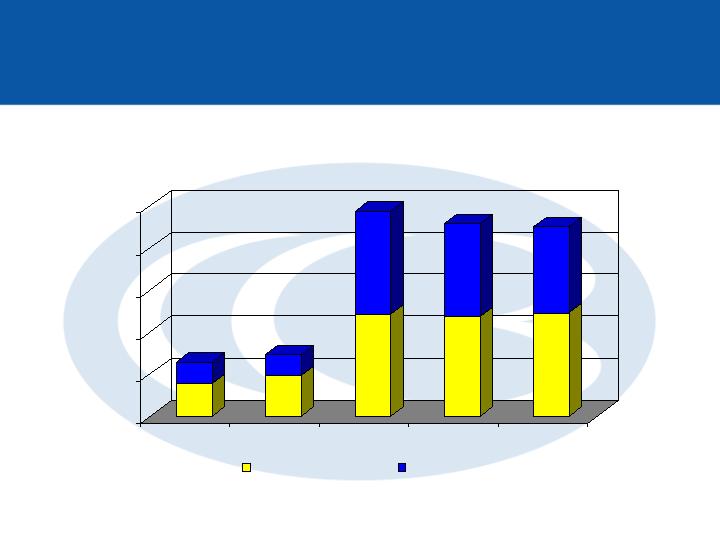
Balance Sheet Growth
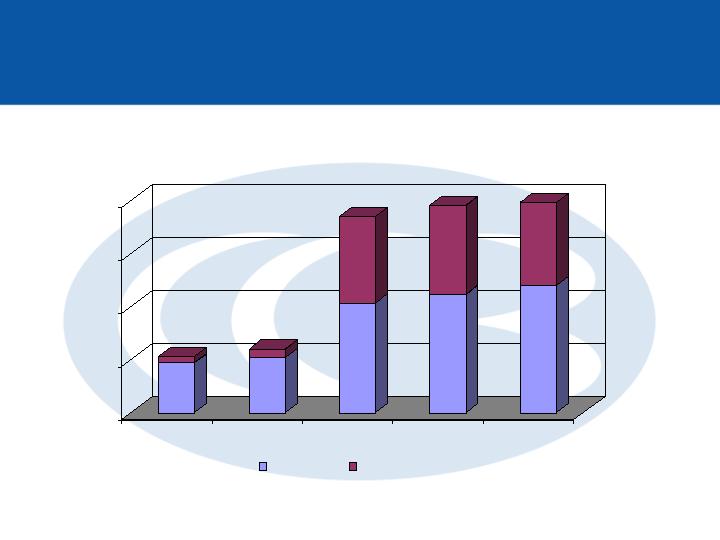
$1.05
$1.20
$3.70
$3.91
$3.96
$0
$1
$2
$3
$4
89%
87%
56%
57%
61%
12/03
3/04
6/04
9/04
12/04
Loans Held for Investment
Multi-Family
All other loans
($ in billions)
15
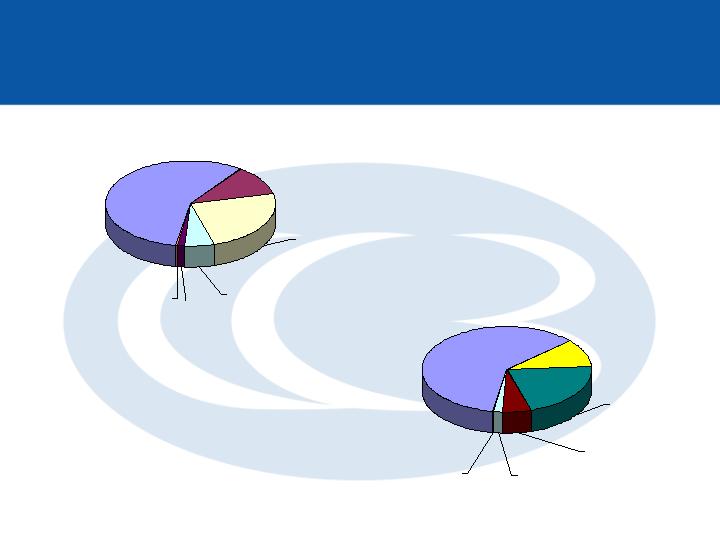
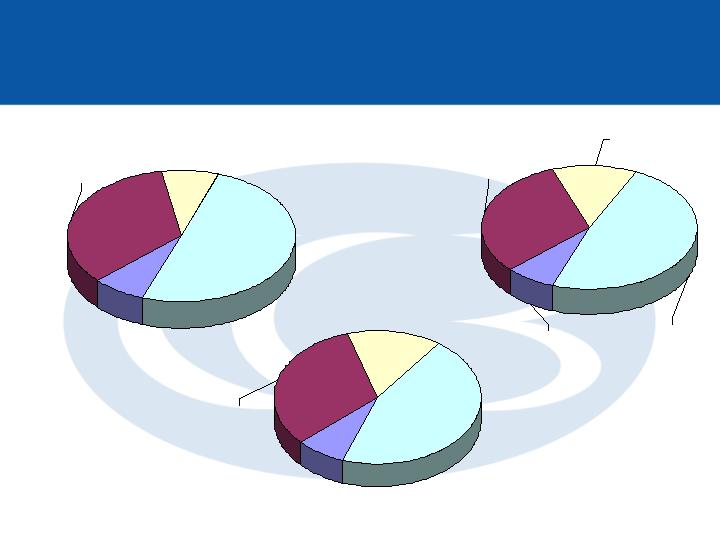
Loan Portfolio Mix
12/2004
Land
$56 mm
1%
Construction
$225 mm
6%
Multi-Family
$2,397 mm
61%
Commercial RE
$420 mm
11%
Single Family
$842 mm
21%
Business Loans
$16 mm
<1%
09/2004
Single Family
$958 mm
25%
Construction
$214 mm
5%
Land
$56 mm
1%
Business Loans
$13 mm
<1%
Multi-Family
$2,235 mm
57%
Commercial RE
$435 mm
11%
16

Nationwide
(1)
Western Region
(1)
CCBI
Multi-family
0.15%
0.06%
0.00%
Single family
0.52%
0.51%
0.03%
Commercial Real Estate
0.81%
1.08%
0.00%
Construction and Land Loans
0.77%
0.93%
0.92%
Noncurrent Loans to
Total Loans
Multi-family, Single family, Commercial Real Estate, Construction and
Land Loans account for 99.6% of the Company's total loans.
Asset Quality of Real Estate Loans
17

Multi-family
Loan to Value
Debt Coverage Ratio
Commercial RE
Loan to Value
Debt Coverage Ratio
Single Family Residential
Loan to Value
Values are weighted average ratios, at origination
LTV and DCR of Fourth Quarter 2004
Originations
67.5%
1.23:1
62.2%
1.32:1
63.5%
18
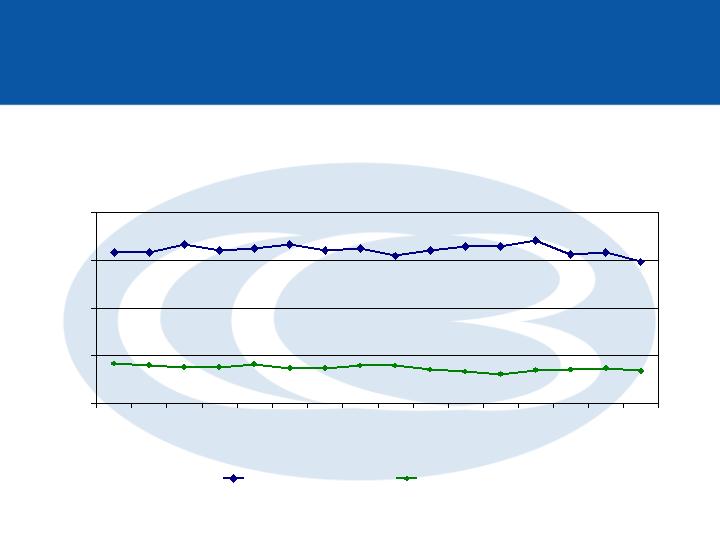
Consistent Underwriting
Multi-family and Commercial real estate loan
originations by average LTV and DCR
1.29
1.29
1.33
1.30
1.31
1.33
1.30
1.31
1.27
1.30
1.32
1.32
1.35
1.28
1.29
1.24
69.1%
68.9%
70.0%
70.6%
70.4%
68.4%
68.5%
69.7%
67.8%
66.7%
65.1%
67.2%
67.8%
68.4%
67.1%
0.50
0.75
1.00
1.25
1.50
3/01
6/01
9/01
12/01
3/02
6/02
9/02
12/02
3/03
6/03
9/03
12/03
3/04
6/04
9/04
12/04
Debt Coverage Ratio
Loan to Value
19
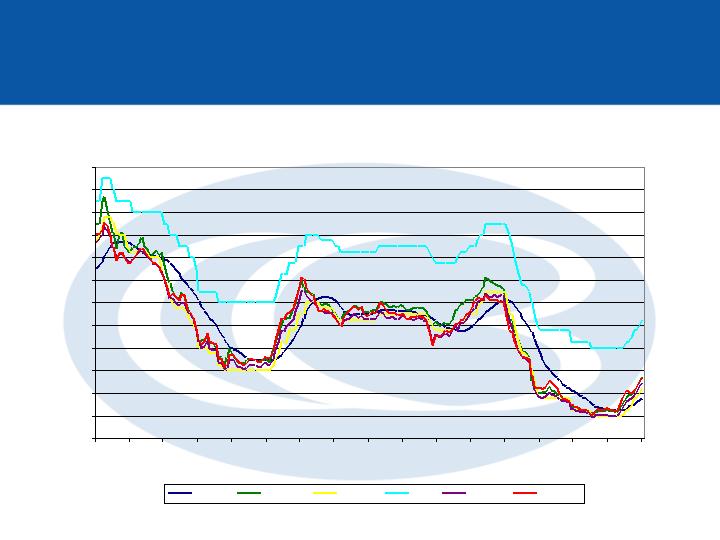
Interest Rate Comparison
(Interest Rate, in percent)
CCBI’s loan rates adjust based on 12MAT, 1yr CMT, 6mo LIBOR, 6mo CMT and Prime, plus a margin
0
1
2
3
4
5
6
7
8
9
10
11
12
Dec-
88
Dec-
89
Dec-
90
Dec-
91
Dec-
92
Dec-
93
Dec-
94
Dec-
95
Dec-
96
Dec-
97
Dec-
98
Dec-
99
Dec-
00
Dec-
01
Dec-
02
Dec-
03
Dec-
04
12 MAT
6mo Libor
Fed Funds
Prime
6m CMT
1yr CMT
20
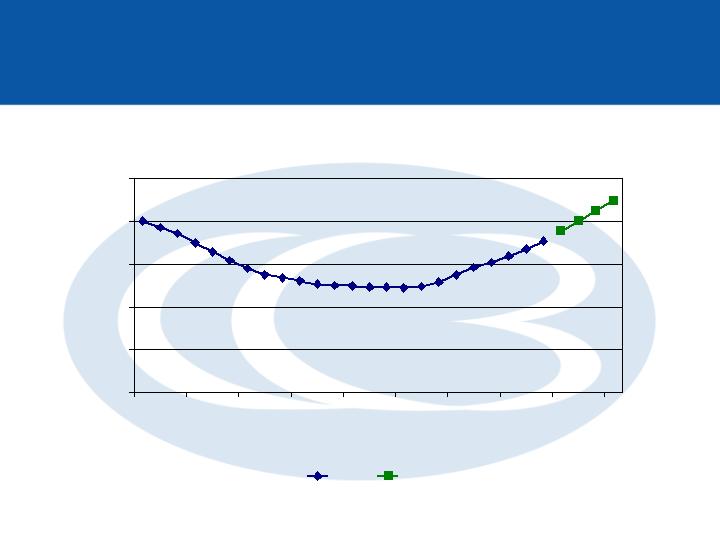
Historical and Forecasted 12MAT
(Index Rate, in percent)
0.0
0.5
1.0
1.5
2.0
2.5
Jan-03
Apr-03
Jul-03
Oct-03
Jan-04
Apr-04
Jul-04
Oct-04
Jan-05
Apr-05
Actual
Forecasted
21
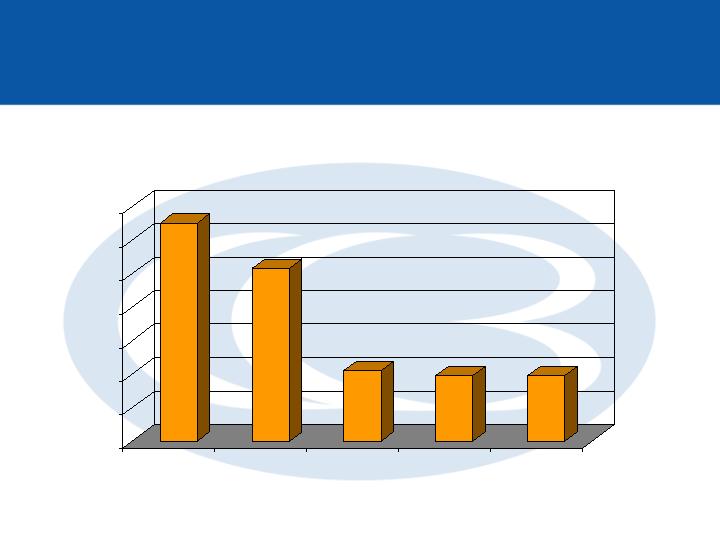
Investment Securities
33%
26%
11%
10%
10%
0%
5%
10%
15%
20%
25%
30%
35%
12/03
3/04
6/04
9/04
12/04
Securities to Total Assets
22
($ in millions)
Changing Deposit Mix
60%
$2,256.8
65%
$645.6
50%
$736.3
52%
$2,443.9
55%
$2,298.6
$-
$500
$1,000
$1,500
$2,000
$2,500
12/03
3/04
6/04
9/04
12/04
Total Deposits
Transaction Accounts
Time Deposits
23
Deposit Composition
CD
$1,227 mm
Money
Market
$837 mm
Savings
$198 mm
DDA
Checking
$182 mm
CD
$1,114 mm
Savings
$294 mm
DDA
Checking
$173 mm
Money
Market
$718 mm
CD
$1,026 mm
Savings
$336 mm
Money
Market
$719 mm
DDA
Checking
$176 mm
34%
8%
50%
8%
06/2004
31%
13%
48%
8%
09/2004
8%
32%
15%
45%
12/2004
24
Capital Ratios
5.92%
5.81%
12.29%
12.26%
12.44%
0%
2%
4%
6%
8%
10%
12%
14%
12/03
3/04
6/04
9/04
12/04
Equity to Assets
5.17%
5.14%
4.62%
4.94%
5.21%
0%
2%
4%
6%
12/03
3/04
6/04
9/04
12/04
Tangible Equity to Assets
25
Capital Ratios
5.20%
5.17%
5.00%
5.33%
5.62%
0%
2%
4%
6%
12/03
3/04
6/04
9/04
12/04
Tangible Equity to Tangible Assets
26
Bank Capital Ratio
7.97%
7.87%
7.57%
7.63%
8.01%
0%
2%
4%
6%
8%
10%
12/03
3/04
6/04
9/04
12/04
Tier 1 Core Capital Ratio
27
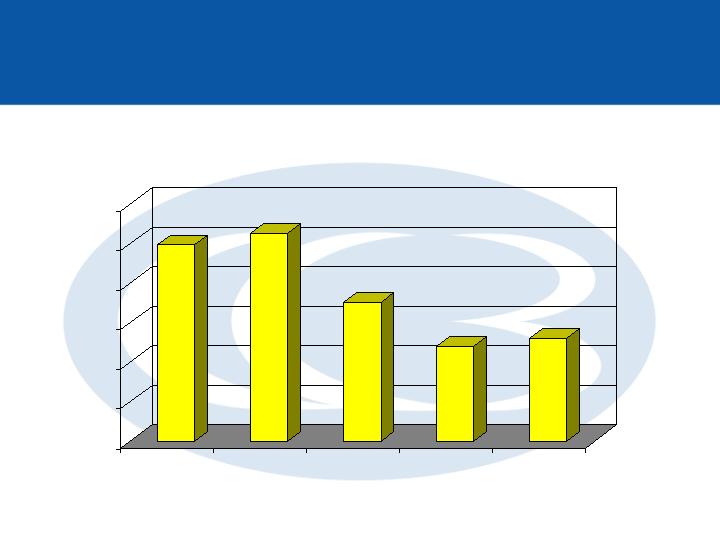
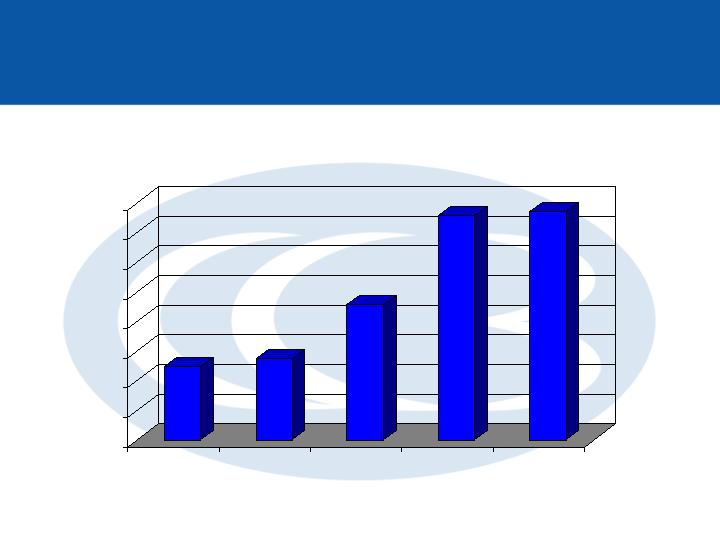
$20.9
$23.4
$36.6
$60.6
$67.1
$0
$10
$20
$30
$40
$50
$60
$70
12/03
3/04
6/04
9/04
12/04
Total Revenues
Operating Performance
($ in millions)
28
($ in millions)
Operating Performance
$12.4
$13.8
$22.9
$37.9
$38.5
$-
$5
$10
$15
$20
$25
$30
$35
$40
12/03
3/04
6/04
9/04
12/04
Net Interest Income
29

Operating Performance
3.23%
3.14%
3.51%
3.49%
3.38%
0%
1%
2%
3%
4%
12/03
3/04
6/04
9/04
12/04
Net Interest Margin
30
$1.4
$1.8
$3.0
$3.6
$6.7
$0
$1
$2
$3
$4
$5
$6
$7
12/03
3/04
6/04
9/04
12/04
Noninterest Income
Operating Performance
($ in millions)
31
Operating Performance Ratios
0.90%
0.89%
0.94%
1.05%
1.01%
0.0%
0.2%
0.4%
0.6%
0.8%
1.0%
1.2%
12/03
3/04
6/04
9/04
12/04
G&A to Average Assets
32
Operating Performance Ratios
25.8%
25.9%
25.3%
30.6%
28.1%
0.0%
5.0%
10.0%
15.0%
20.0%
25.0%
30.0%
35.0%
12/03
3/04
6/04
9/04
12/04
Efficiency Ratio
33
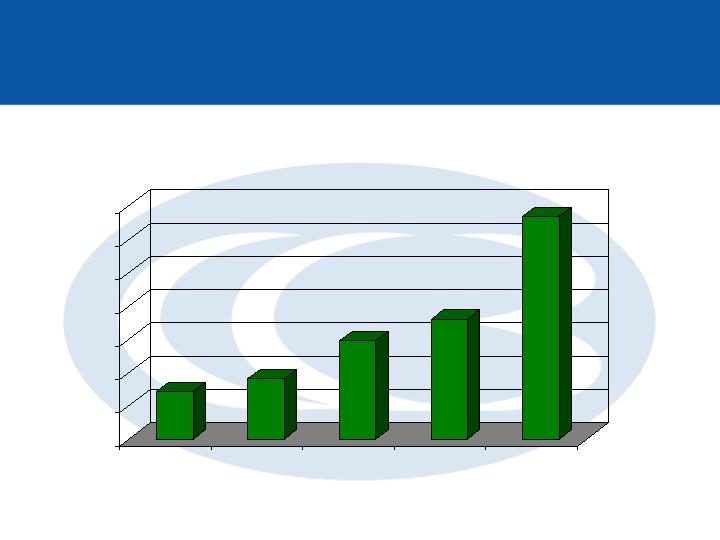
$6.2
$7.1
$10.9
$18.0
$20.2
$0
$2
$4
$6
$8
$10
$12
$14
$16
$18
$20
$22
12/03
3/04
6/04
9/04
12/04
Quarterly Net Income
($ in millions)
Earnings Performance
34

January 24, 2005
NASDAQ: “CCBI”
Fourth Quarter 2004 Earnings Call