As filed with the Securities and Exchange Commission on October 30, 2002.
SECURITIES AND EXCHANGE COMMISSION
Amendment No. 2 to Form S-1
Portfolio Recovery Associates, Inc.
| Delaware | 7322 | 75-3078675 | ||
| (State or other jurisdiction of incorporation or organization) | (Primary standard industrial classification code number) | (I.R.S. employer identification number) |
120 Corporate Boulevard
Steven D. Fredrickson
Copies to:
| Charles I. Weissman, Esq. Swidler Berlin Shereff Friedman, LLP 405 Lexington Avenue, 12th Floor New York, New York 10174 (212) 973-0111 | Jon A. Ballis, Esq. Sidley Austin Brown & Wood Bank One Plaza, 10 South Dearborn Street Chicago, Illinois 60603 (312) 853-7000 |
Approximate date of commencement of proposed sale to the public: As soon as practicable after this Registration Statement is declared effective.
If any of the securities being registered on this Form are to be offered on a delayed or continuous basis pursuant to Rule 415 under the Securities Act of 1933 check the following box: o
If this Form is filed to register additional securities for an offering pursuant to Rule 462(b) under the Securities Act, please check the following box and list the Securities Act registration statement number of the earlier effective registration statement for the same offering.
If this Form is a post-effective amendment filed pursuant to Rule 462(c) under the Securities Act, check the following box and list the Securities Act registration statement number of the earlier effective registration statement for the same offering.
If this Form is a post-effective amendment filed pursuant to Rule 462(d) under the Securities Act, check the following box and list the Securities Act registration statement number of the earlier effective registration statement for the same offering.
If delivery of the prospectus is expected to be made pursuant to Rule 434, check the following box. o
CALCULATION OF REGISTRATION FEE
| Title of Each Class of | Proposed Maximum Aggregate | |||
| Securities to be Registered | Offering Price(1)(2) | Amount of Registration Fee(3) | ||
| Common Stock, $0.01 par value | $55,867,000 | $5,290.00 | ||
| (1) | This amount represents the proposed aggregate offering price of the securities registered hereunder to be sold by the registrant and the selling stockholder. These figures are estimated solely for purposes of calculating the registration fee pursuant to Rule 457 under the Securities Act of 1933, as amended. |
| (2) | Includes 520,500 shares of common stock that the underwriters have an option to purchase solely to cover over-allotments, if any. |
(3) Previously paid.
The registrant hereby amends this Registration Statement on such date or dates as may be necessary to delay its effective date until the registrant shall file a further amendment which specifically states that this Registration Statement shall thereafter become effective in accordance with Section 8(a) of the Securities Act of 1933 or until this Registration Statement shall become effective on such date as the Commission, acting pursuant to said Section 8(a), may determine.
| The information in this prospectus is not complete and may be changed. We may not sell these securities until the registration statement filed with the Securities and Exchange Commission is effective. This prospectus is not an offer to sell these securities and it is not soliciting an offer to buy these securities in any state where the offer or sale is not permitted. |
SUBJECT TO COMPLETION, DATED OCTOBER 30, 2002

Common Stock
This is the initial public offering of 3,470,000 shares of common stock issued by Portfolio Recovery Associates, Inc.
We expect that the initial public offering price will be between $12.00 and $14.00 per share of common stock. The market price of the shares after this offering may be higher or lower than this offering price.
We have applied to have our shares of common stock approved for listing on the Nasdaq National Market under the symbol “PRAA.”
Investing in our common stock involves risks. See “Risk Factors” beginning on page 9.
Neither the Securities and Exchange Commission nor any state securities commission has approved or disapproved of these securities or determined that this prospectus is truthful or complete. Any representation to the contrary is a criminal offense.
| Per share | Total | |||||||
| Public offering price | $ | $ | ||||||
| Underwriting discount | $ | $ | ||||||
| Proceeds, before expenses, to us | $ | $ | ||||||
One of our stockholders, PRA Investments, L.L.C., has granted the underwriters the option to purchase up to an additional 520,500 shares at the public offering price, less the underwriting discount, within 30 days from the date of this prospectus to cover over-allotments. If such shares are sold, we will not receive any of the proceeds from the sale by PRA Investments, L.L.C.
| William Blair & Company | U.S. Bancorp Piper Jaffray |
The date of this prospectus is , 2002
Table of Contents
| Page | ||||
| Prospectus Summary | 1 | |||
| Risk Factors | 9 | |||
| Special Note Regarding Forward-Looking Statements | 16 | |||
| Use Of Proceeds | 17 | |||
| Dividend Policy | 17 | |||
| Reorganization | 17 | |||
| Capitalization | 18 | |||
| Dilution | 19 | |||
| Selected Consolidated Financial Data | 20 | |||
| Management’s Discussion And Analysis Of Financial Condition And Results Of Operations | 22 | |||
| Business | 37 | |||
| Management | 53 | |||
| Certain Relationships And Related Transactions | 57 | |||
| Principal And Selling Stockholders | 60 | |||
| Description Of Capital Stock | 62 | |||
| Shares Eligible For Future Sale | 65 | |||
| Underwriting | 66 | |||
| Legal Matters | 68 | |||
| Experts | 68 | |||
| Where You Can Find More Information | 69 | |||
| Index To Financial Statements | F-1 | |||
i
PROSPECTUS SUMMARY
You should read the following summary together with the more detailed information in this prospectus, including the section titled “Risk Factors” beginning on page 8 regarding our company and the common stock being sold in this offering.
Overview
We are a full-service provider of outsourced receivables management. We purchase, collect and manage portfolios of defaulted consumer receivables. Defaulted consumer receivables are the unpaid obligations of individuals to credit originators, including banks, credit unions, consumer and auto finance companies, retail merchants and other service providers. We believe that the strengths of our business are our sophisticated approach to portfolio pricing, our emphasis on collection personnel and procedures and our relationships with many of the largest consumer lenders in the United States, including 11 of the top 13 bank credit card issuers and four of the top five store credit card issuers. Our proven ability to collect defaulted consumer receivables allows us to offer credit originators a complete outsourced solution to address their defaulted consumer receivables. The defaulted consumer receivables we collect are in substantially all cases either purchased from the credit originator or are collected on behalf of clients on a commission fee basis. We intend to continue to build on our strengths and grow our business through the disciplined approach that has contributed to our success to date.
We specialize in receivables that have been charged-off by the credit originator. Since the credit originator has unsuccessfully attempted to collect these receivables, we are able to purchase them at a substantial discount to their face value. Through June 30, 2002, we have acquired 292 portfolios with a face value of $4.2 billion for $116 million, or 2.8% of face value. Our success depends on our ability to purchase portfolios of defaulted consumer receivables at appropriate valuations and to collect on those receivables effectively and efficiently. To date, we have consistently been able to collect at a rate of 2.5 to 3.0 times our purchase price for defaulted consumer receivables portfolios, as measured over a five-year period, which has enabled us to generate increasing profits and cash flow.
We were formed in March 1996 by four members of senior management that continue to lead us. Prior to our formation, members of the management team played key roles in the development of a defaulted consumer receivables acquisition and divestiture operation for Household Recovery Services, a subsidiary of Household International. Since our formation we have acquired and serviced portfolios of defaulted consumer receivables, and in March 2001 we commenced our third-party contingent fee collections operations to provide defaulted receivables management on a commission fee basis, receiving a percentage of the amounts collected on behalf of the client.
We have achieved strong financial results since our formation, with cash collections growing from $5.0 million in 1997 to $53.4 million in 2001. Cash collections represent the amount of cash we have collected on our owned portfolios of defaulted consumer receivables and commission fees received by our third-party contingent fee operations. Over the life of our owned portfolios of defaulted consumer receivables, income recognized on finance receivables equals our cash collections on our owned portfolios of defaulted consumer receivables less the cash paid for these portfolios. Excluding the impact of proceeds from occasional portfolio sales, cash collections have increased every quarter since our formation. Revenue has grown from $2.8 million in 1997 to $32.3 million in 2001, a compound annual growth rate of 84%. Similarly, pro forma net income has grown from $130,000 in 1997 to $3.5 million in 2001, a compound annual growth rate of 128%. Our solid financial performance has continued into 2002. For the six month period ended June 30, 2002, cash collections were $38.0 million, revenue was $24.9 million and pro forma net income was $4.9 million, compared to cash collections of $23.7 million, revenue of $14.7 million and pro forma net income of $2.0 million for the six month period ended June 30, 2001.
1
Industry Overview
The accounts receivable management industry is growing, driven by a number of industry trends, including the following:
| • | increasing levels of consumer debt obligations; | |
| • | increasing defaults of the underlying receivables; and | |
| • | increasing utilization of third-party providers to execute the recovery of defaulted receivables. |
According to the U.S. Federal Reserve Board, at June 30, 2002 consumer credit, which consists of non-real estate related short- and intermediate-term credit extended to individuals, has grown approximately 37% to $1.7 trillion from $1.2 trillion at December 31, 1997. According to the Consumer Bankers Association, the delinquency rate on non-mortgage consumer obligations reached its highest level in a decade at December 31, 2001, an approximately 33% increase from December 31, 2000. According to the Nilson Report, a credit card industry newsletter, credit originators outsourced an estimated $135 billion in defaulted consumer receivables for collection in 2000, nearly double the $73 billion outsourced for collection in 1990.
The accounts receivable management industry (owned portfolio and contingent fee) is highly fragmented and competitive, consisting of approximately 6,000 consumer and commercial agencies. In recent years, the accounts receivable management industry has increased its use of technology in order to operate more effectively. We expect the increasing importance of technology and the associated increased capital requirements to cause challenges for many smaller participants lacking the required capital and management resources to implement and effectively utilize such technology to compete effectively and to continue to maintain regulatory standards.
Competitive Strengths
We believe we have a number of strengths which will allow us to continue to capitalize on these industry trends, including:
| Complete Outsourced Solution for Credit Originators.We can either purchase defaulted consumer receivables from credit originators or service those receivables on their behalf for a commission fee based on a percentage of our collections. Furthermore, we can purchase or service receivables throughout the entire delinquency cycle, ranging from receivables that have only been processed for collection internally by the credit originator, to receivables that have been subject to multiple external collection efforts. | |
| Disciplined and Proprietary Underwriting Process.We use our proprietary analytical processes coupled with the experience gained through our 292 portfolio purchases to price portfolio acquisitions at levels that to date have enabled us to achieve profitable returns on our investment. | |
| Ability to Hire, Develop and Retain Productive Collectors.We place considerable focus on our ability to hire, develop and retain effective collectors who are key to our continued growth and profitability. | |
| Established Systems and Infrastructure.We have devoted significant effort to developing our systems, including statistical models, databases and reporting packages, to optimize our portfolio purchases and collection efforts. | |
| Strong Relationships with Major Credit Originators.We have done business with many of the top 25 consumer lenders in the United States, including 11 of the top 13 bank credit card issuers and four of the five largest store credit card issuers. We believe that we have earned a reputation as a reliable purchaser of defaulted consumer receivables portfolios and for collecting receivables in an effective, responsible manner, which helps to preserve the reputation of the credit originator. |
2
| Experienced Management Team.We have an experienced management team with considerable expertise in the accounts receivable management industry. |
Growth Opportunities
We have achieved significant historical growth while maintaining a conservative capital structure and ensuring that the level of our portfolio purchases of defaulted consumer receivables is matched by our ability to collect them effectively and efficiently. Our primary objective is to continue our controlled growth. We aim to achieve this objective through the following growth strategies:
| Continue to Develop and Retain Collectors.We intend to maintain our historical controlled growth in the number of collectors we add. We expect the percentage of our collectors with more than 12 months of experience will increase, which we believe will drive our productivity and profitability. | |
| Maintain Conservative Capitalization for Portfolio Acquisitions.The additional equity capital from this offering will allow us to continue to capitalize our portfolio acquisitions conservatively. | |
| Increase Share in Growing Market.We feel that our position as a well-capitalized firm offering a complete outsourced solution to credit originators across the defaulted consumer receivables spectrum will enable us to continue to grow faster than the industry overall. | |
| Leverage Expertise into Other Asset Types. We expect to continue seeking opportunities to leverage our portfolio purchasing and collections expertise in other asset types, such as auto finance, retail finance, student loans, retail oil and gas, long-distance telephone, consumer finance and small business commercial receivables. | |
| Grow Our Contingent Fee Collections Operations.The capability to perform collections on a commission fee basis allows us to offer a complete outsourced solution to credit originators while leveraging our existing infrastructure, skill set, personnel and client relationships. | |
| Leverage Existing Infrastructure and Management Team.As a result of our substantial investments in technology, infrastructure and systems, our management team is capable of acquiring and servicing substantially larger volumes of defaulted consumer receivables without incurring proportional cost increases in fixed costs. | |
| Explore Selected Acquisitions.We will evaluate opportunities to make acquisitions of companies or group hires that would add new skill sets or bring us strong credit originator relationships, collection facilities and access to skilled collectors. |
Recent Developments
| Unaudited Results for Nine Months Ended September 30, 2002.For the nine months ended September 30, 2002, cash collections increased to $59.2 million for the period, up 56% from cash collections of $38.0 million for the same period in 2001. Total revenue for the period increased to $40.2 million, up 75% from total revenue of $23.0 million for the same period in 2001. Income from operations for the period increased to $15.3 million, up 133% from income from operations of $6.6 million for the same period in 2001. Pro forma net income increased to $8.0 million for the period, up 196% from pro forma net income of $2.7 million for the same period in 2001. Acquisitions of finance receivables, at cost decreased to $26.4 million, down 3% from acquisitions of finance receivables, at cost of $27.2 million for the same period in 2001. The 2001 period included $3.5 million of acquisitions of finance receivables that were immediately resold. Through September 30, 2002 we have acquired 311 portfolios with a face value of $4.5 billion for $127 million. The financial data for the nine months ended September 30, 2002 and the nine months ended September 30, 2001 have been derived from our unaudited consolidated financial statements, not included in this prospectus. These financial statements include all adjustments, consisting only of normal recurring adjustments, which we consider necessary for a fair statement of our financial position and results of operations for these periods. Consolidated results of operations for the nine |
3
| months ended September 30, 2002 are not necessarily indicative of the results that may be expected for the full fiscal year ending December 31, 2002. | |
| Other Recent Developments.During the quarter ended September 30, 2002, we paid $542,000 to terminate an interest rate swap agreement entered into during 2001. The termination payment is classified as an interest expense in our results for operations for the quarter ended September 30, 2002. During the same period we distributed $3.4 million to our existing equityholders to pay tax liabilities incurred as owners of membership units in Portfolio Recovery Associates, L.L.C. |
We were initially formed as Portfolio Recovery Associates, L.L.C., a Delaware limited liability company, on March 20, 1996. In connection with this offering, all of the membership units of Portfolio Recovery Associates, L.L.C. were exchanged for a single class of the common stock of a newly formed Delaware corporation, which we named Portfolio Recovery Associates, Inc., which operates through several wholly owned subsidiaries and is more fully described under the caption “Reorganization” on page 17. As used in this prospectus, all references to us mean Portfolio Recovery Associates, Inc. and, prior to the Reorganization, its predecessor Portfolio Recovery Associates, L.L.C. The address of our principal executive offices is 120 Corporate Boulevard, Suite 100, Norfolk, Virginia 23502, and our telephone number is (888) 772-7326. Our web site address iswww.portfoliorecovery.com. You should not construe the information on our web site to be a part of this prospectus.
Risk Factors
An investment in our common stock involves a significant degree of risk. We urge you to carefully consider all of the information described in the section entitled “Risk Factors” beginning on page 9.
4
This Offering
Common stock offered | |||
| By us | 3,470,000 shares | ||
| Common stock outstanding after this offering | 13,470,000 shares(1) | ||
| Use of proceeds | We intend to use the net proceeds that we receive from this offering to: | ||
| • repay outstanding indebtedness under our credit facilities of $29.0 million | |||
| • establish a new call center; and | |||
| • fund working capital and other general corporate needs | |||
| Proposed Nasdaq National Market symbol | PRAA | ||
| (1) | Excludes 2,000,000 shares reserved for issuance upon the exercise of options to be granted to our directors, officers and employees in accordance with our 2002 Stock Option Plan, of which 800,000 shares will be issuable pursuant to options to be granted at the time of this offering at an exercise price per share equal to the initial public offering price. Also excludes 2,235,000 shares of our common stock reserved for issuance upon exercise of outstanding warrants at a weighted average exercise price of $4.30, of which 2,110,000 warrants will be fully exercisable at the time of this offering. |
Unless otherwise indicated, all share and per share data in this document assumes a one-for-one exchange of all of the membership units of Portfolio Recovery Associates, L.L.C. for shares of a single class of our common stock prior to this offering and the exchange of all of outstanding warrants to purchase 2,235,000 membership units of Portfolio Recovery Associates, L.L.C. for warrants to purchase 2,235,000 shares of our common stock. The only condition to the exchange of units for common stock and of the warrants is the effectiveness of the registration statement of which this prospectus is a part. See “Reorganization” on page 17. All dollar amounts less than $1.0 million have been rounded to the nearest thousand. Additionally, this prospectus assumes the underwriters do not exercise the option the selling stockholder granted to them to purchase up to an additional 520,500 shares of our common stock in this offering.
5
Summary Consolidated Financial Data
The following summary consolidated financial data for the years ended December 31, 1999, 2000 and 2001 and the six months ended June 30, 2002 and as of June 30, 2002 have been derived from our consolidated financial statements, included elsewhere in this prospectus which have been audited by PricewaterhouseCoopers LLP. The following summary consolidated financial data for the years ended December 31, 1997 and 1998 have been derived from our audited consolidated financial statements, not included in this prospectus.
The following summary consolidated financial data for the six months ended June 30, 2001 have been derived from our unaudited consolidated financial statements, included elsewhere in this prospectus. These financial statements include all adjustments, consisting only of normal recurring adjustments, which we consider necessary for a fair statement of our financial position and results of operations for this period.
Operating results for the six months ended June 30, 2002 are not necessarily indicative of results that may be expected for the year ending December 31, 2002.
| Six Months Ended | |||||||||||||||||||||||||||||
| Year Ended December 31, | June 30, | ||||||||||||||||||||||||||||
| 1997 | 1998 | 1999 | 2000 | 2001 | 2001 | 2002 | |||||||||||||||||||||||
| (Unaudited) | |||||||||||||||||||||||||||||
| (Dollars in thousands, except per share data) | |||||||||||||||||||||||||||||
| STATEMENT OF OPERATIONS DATA: | |||||||||||||||||||||||||||||
| Revenue: | |||||||||||||||||||||||||||||
| Income recognized on finance receivables | $ | 2,768 | (1) | $ | 6,815 | $ | 11,746 | $ | 18,991 | $ | 31,221 | $ | 14,407 | $ | 24,018 | ||||||||||||||
| Commissions | — | — | — | — | 214 | — | 816 | ||||||||||||||||||||||
| Net gain on cash sales of defaulted consumer receivables | — | — | 322 | 343 | 901 | 296 | 100 | ||||||||||||||||||||||
| Total revenue | 2,768 | 6,815 | 12,068 | 19,334 | 32,336 | 14,703 | 24,934 | ||||||||||||||||||||||
| Operating expenses: | |||||||||||||||||||||||||||||
| Compensation | 1,650 | 3,821 | 6,119 | 9,883 | 15,644 | 6,712 | 10,212 | ||||||||||||||||||||||
| Legal, accounting and outside fees and services | 400 | 839 | 1,493 | 2,583 | 3,627 | 1,561 | 3,242 | ||||||||||||||||||||||
| Communications | 156 | 318 | 553 | 871 | 1,645 | 666 | 929 | ||||||||||||||||||||||
| Rent and occupancy | 67 | 99 | 335 | 603 | 712 | 314 | 362 | ||||||||||||||||||||||
| Other operating expenses | 127 | 266 | 498 | 652 | 1,265 | 514 | 676 | ||||||||||||||||||||||
| Depreciation | 149 | 238 | 369 | 437 | 677 | 311 | 434 | ||||||||||||||||||||||
| Total operating expenses | 2,549 | 5,581 | 9,367 | 15,029 | 23,570 | 10,078 | 15,855 | ||||||||||||||||||||||
| Income from operations | 219 | 1,234 | 2,701 | 4,305 | 8,766 | 4,625 | 9,079 | ||||||||||||||||||||||
| Net interest expenses | 89 | 744 | 876 | 1,765 | 2,716 | 1,410 | 1,115 | ||||||||||||||||||||||
| Net income before extraordinary loss | 130 | 490 | 1,825 | 2,540 | 6,050 | (2) | 3,215 | 7,964 | |||||||||||||||||||||
| Extraordinary loss | — | — | — | — | (424 | )(3) | — | — | |||||||||||||||||||||
Net income(4) | $ | 130 | $ | 490 | $ | 1,825 | $ | 2,540 | $ | 5,626 | $ | 3,215 | $ | 7,964 | |||||||||||||||
| Pro forma net income before extraordinary loss | $ | 130 | $ | 402 | $ | 1,128 | $ | 1,639 | $ | 3,791 | $ | 2,014 | $ | 4,885 | |||||||||||||||
Pro forma net income(5) | $ | 130 | $ | 402 | $ | 1,128 | $ | 1,639 | $ | 3,526 | $ | 2,014 | $ | 4,885 | |||||||||||||||
| Pro forma earnings per share before extraordinary loss | |||||||||||||||||||||||||||||
| Basic | $ | 0.38 | $ | 0.49 | |||||||||||||||||||||||||
| Diluted | $ | 0.33 | $ | 0.43 | |||||||||||||||||||||||||
Pro forma net income per share(6) | |||||||||||||||||||||||||||||
| Basic | $ | 0.35 | $ | 0.49 | |||||||||||||||||||||||||
| Diluted | $ | 0.31 | $ | 0.43 | |||||||||||||||||||||||||
Pro forma weighted average shares(6) | |||||||||||||||||||||||||||||
| Basic | 10,000 | 10,000 | |||||||||||||||||||||||||||
| Diluted | 11,458 | (7) | 11,486 | (8) | |||||||||||||||||||||||||
6
| Six Months Ended | |||||||||||||||||||||||||||||
| Year Ended December 31, | June 30, | ||||||||||||||||||||||||||||
| 1997 | 1998 | 1999 | 2000 | 2001 | 2001 | 2002 | |||||||||||||||||||||||
| (Unaudited) | |||||||||||||||||||||||||||||
| (Dollars in thousands) | |||||||||||||||||||||||||||||
| OPERATING AND OTHER FINANCIAL DATA: | |||||||||||||||||||||||||||||
Cash collections for period(9) | $ | 4,992 | $ | 10,881 | $ | 17,362 | $ | 30,733 | $ | 53,362 | $ | 23,702 | $ | 37,997 | |||||||||||||||
| Operating expenses to cash collections | 51 | % | 51 | % | 54 | % | 49 | % | 44 | % | 43 | % | 42 | % | |||||||||||||||
| Acquisitions of finance receivables, at cost | $ | 8,223 | $ | 11,480 | $ | 19,417 | $ | 24,663 | $ | 33,381 | $ | 12,179 | $ | 16,273 | |||||||||||||||
| Acquisitions of finance receivables, at face value | $ | 137,721 | $ | 324,251 | $ | 479,778 | $ | 1,004,114 | $ | 1,592,353 | $ | 790,546 | $ | 587,971 | |||||||||||||||
| Percentage increase of acquisitions of finance receivables, at cost | N/A | 40 | % | 69 | % | 27 | % | 35 | % | 62 | % | 34 | % | ||||||||||||||||
| Percentage increase in cash collections for period | N/A | 118 | % | 60 | % | 77 | % | 74 | % | 73 | % | 60 | % | ||||||||||||||||
| Percentage increase in pro forma net income for period | N/A | 209 | % | 181 | % | 45 | % | 115 | % | 360 | % | 143 | % | ||||||||||||||||
| Employees at period end: | |||||||||||||||||||||||||||||
| Total employees | 66 | 140 | 246 | 370 | 501 | 437 | 527 | ||||||||||||||||||||||
Ratio of collection personnel to total employees(10) | 89 | % | 84 | % | 86 | % | 89 | % | 89 | % | 89 | % | 88 | % | |||||||||||||||
| As of June 30, 2002 | ||||||||||||||||||||||||||||
| As | ||||||||||||||||||||||||||||
| Actual | Adjusted(11) | |||||||||||||||||||||||||||
| (Dollars in thousands) | ||||||||||||||||||||||||||||
FINANCIAL POSITION DATA: | ||||||||||||||||||||||||||||
| Cash and cash equivalents | $ | 8,320 | $ | 24,772 | ||||||||||||||||||||||||
| Finance receivables | 51,055 | 51,055 | ||||||||||||||||||||||||||
| Total assets | 63,421 | 79,873 | ||||||||||||||||||||||||||
| Long-term debt | 1,031 | 1,031 | ||||||||||||||||||||||||||
| Total debt, including capital lease obligations | 27,141 | 2,141 | ||||||||||||||||||||||||||
| Total stockholders’ equity(12) | 33,463 | 74,915 | ||||||||||||||||||||||||||
| (1) | The financial statements for the year ended December 31, 1997 have been retroactively adjusted to reflect a change in accounting for the effects of the change in our revenue recognition method from the cost recovery method to the interest method effective January 1, 1998. Under the cost recovery method, no income was recognized until all acquisition costs associated with the investments were recovered. Since we had, and continue to have, a proven history of reasonably estimating the timing and degree of collectibility of our finance receivables, we adopted, effective January 1, 1998, the interest method of accounting with the guidance of AICPA Practice Bulletin 6, “Amortization of Discounts on Certain Acquired Loans,” and in accordance with generally accepted accounting principles. This change in revenue recognition method had the effect of increasing income recognized from finance receivables in 1997 from $352,000 to $2.8 million and was made for consistency with the amounts presented in subsequent periods. | |
| (2) | Includes operating losses associated with the formation of our contingent fee collections operations in its first year of operations of $644,000. | |
| (3) | Incurred in connection with the early extinguishment of debt. | |
| (4) | At the time of this offering we will change our parent company legal structure from a limited liability company to a corporation. See “Reorganization.” As a limited liability company we were not subject to Federal or state corporate income taxes. Therefore, net income does not give effect to taxes. | |
| (5) | For comparison purposes, we have presented pro forma net income, which reflects income taxes assuming we had been a corporation since the time of our formation and assuming tax rates equal to the rates that would have been in effect had we been required to report tax expense in such years. | |
| (6) | Pro forma net income and pro forma weighted average shares assumes completion of the reorganization (see “Reorganization”) as if the reorganization had occurred at the beginning of the period presented. | |
| (7) | Weighted average diluted shares for the year ended December 31, 2001 include 10,000,000 basic shares and 1,457,741 common share equivalents calculated according to the treasury stock method using 2,235,000 warrants outstanding and an assumed initial public offering price of $13.00. | |
| (8) | Weighted average diluted shares for the six months ended June 30, 2002 include 10,000,000 basic shares and 1,486,128 common share equivalents calculated according to the treasury stock method using 2,235,000 warrants outstanding and an assumed initial public offering price of $13.00. |
7
| (9) | Includes both cash collected on finance receivables and commission fees received during the relevant period. |
| (10) | Includes all collectors and all first-line collection supervisors. |
| (11) | Adjusted to give effect to estimated net proceeds from the sale of 3,470,000 shares of the common stock offered by us at an assumed initial public offering price of $13.00 per share and our anticipated repayment of approximately $29.0 million of indebtedness, $25.0 million of which existed as of June 30, 2002. See “Use of Proceeds.” |
| (12) | Does not give effect to $3.4 million which was distributed to our members as a tax distribution during August and September 2002. |
8
RISK FACTORS
You should carefully consider the risks described below in connection with reviewing this prospectus. If any of the events referred to below actually occur, our business, financial condition, liquidity and results of operation could suffer. In that case, the trading price of our common stock could decline and you may lose all or part of your investment. You should also refer to the other information in this prospectus, including our consolidated financial statements and the related notes.
Risks Related to Our Business
We may not be able to collect sufficient amounts on our defaulted consumer receivables to fund our operations
Our business consists of acquiring and servicing receivables that consumers have failed to pay and that the credit originator has deemed uncollectible and has charged-off. The credit originators generally make numerous attempts to recover on their defaulted consumer receivables, often using a combination of in-house recovery efforts and third-party collection agencies. These defaulted consumer receivables are difficult to collect and we may not collect a sufficient amount to cover our investment associated with purchasing the defaulted consumer receivables and the costs of running our business.
Our contingent fee collections operations have a limited operating history
Our contingent fee collections operations commenced in March 2001. These operations are in the early stages of development. Accordingly, these operations have a very limited operating history and their prospects must be considered in light of the risks and uncertainties facing early-stage companies. As of September 30, 2002, we have entered into contingent fee collection arrangements with 11 credit originators. We incurred operating pre-tax net losses of $644,000 in 2001. Although we are currently generating positive operating income for our contingent fee collections operations, our limited operating history makes prediction of future results difficult.
We may not be able to purchase defaulted consumer receivables at appropriate prices, and a decrease in our ability to purchase portfolios of receivables could adversely affect our ability to generate revenue
If one or more credit originators stops selling defaulted receivables to us and we are otherwise unable to purchase defaulted receivables from credit originators at appropriate prices, we could lose a potential source of income and our business may be harmed.
The availability of receivables portfolios at prices which generate an appropriate return on our investment depends on a number of factors both within and outside of our control, including the following:
| • | the continuation of current growth trends in the levels of consumer obligations; | |
| • | sales of receivables portfolios by credit originators; and | |
| • | competitive factors affecting potential purchasers and credit originators of receivables. |
Because of the length of time involved in collecting defaulted consumer receivables on acquired portfolios and the volatility in the timing of our collections, we may not be able to identify trends and make changes in our purchasing strategies in a timely manner.
We are currently party to one “forward flow contract.” A forward flow contract is an arrangement in which we agree to purchase defaulted consumer receivables based on specific parameters from a third-party supplier on a periodic basis at a set price over a specified time period. To the extent that we are unable to renew or replace the purchased volume represented by our forward flow contract once it expires, we could lose a potential source of income and our business may be harmed.
9
We may not be able to renegotiate or replace our existing credit facility
Although we anticipate repaying a significant portion of the amount outstanding under our existing credit facility with the proceeds from this offering, we currently intend to renegotiate or replace our existing credit facility. If we are unable to renegotiate or replace such facility, our growth could be adversely effected, which could negatively impact the price of our common stock.
We experience high employee turnover rates and we may not be able to hire and retain enough sufficiently trained employees to support our operations
The accounts receivables management industry is very labor intensive and, similar to other companies in our industry, we typically experience a high rate of employee turnover. From January 1, 1999 to June 30, 2002 our annual turnover rate, excluding those employees that do not complete our six week training program, was 34%. We compete for qualified personnel with companies in our industry and in other industries. Our growth requires that we continually hire and train new collectors. A higher turnover rate among our collectors will increase our recruiting and training costs and limit the number of experienced collection personnel available to service our defaulted consumer receivables. If this were to occur, we would not be able to service our defaulted consumer receivables effectively and this would reduce our ability to continue our growth and operate profitability.
We serve markets that are highly competitive, and we may be unable to compete with businesses that may have greater resources than we have
We face competition in both of the markets we serve — owned portfolio and contingent fee accounts receivable management — from new and existing providers of outsourced receivables management services, including other purchasers of defaulted consumer receivables portfolios, third-party contingent fee collection agencies and credit originators that manage their own defaulted consumer receivables rather than outsourcing them. The accounts receivable management industry is highly fragmented and competitive, consisting of approximately 6,000 consumer and commercial agencies, most of which compete in the contingent fee business.
We face bidding competition in our acquisition of defaulted consumer receivables and in our placement of contingent fee receivables, and we also compete on the basis of reputation, industry experience and performance. Some of our current competitors and possible new competitors may have substantially greater financial, personnel and other resources, greater adaptability to changing market needs, longer operating histories and more established relationships in our industry than we currently have. In the future, we may not have the resources or ability to compete successfully. As there are few significant barriers for entry to new providers of contingent fee receivables management services, there can be no assurance that additional competitors with greater resources than ours will not enter our market. Moreover, there can be no assurance that our existing or potential clients will continue to outsource their defaulted consumer receivables at recent levels or at all, or that we may continue to offer competitive bids for defaulted consumer receivables portfolios. If we are unable to develop and expand our business or adapt to changing market needs as well as our current or future competitors are able to do, we may experience reduced access to defaulted consumer receivables portfolios at appropriate prices and reduced profitability.
We may not be successful at acquiring receivables of new asset types or in implementing a new pricing structure
We may pursue the acquisition of receivables portfolios of asset types in which we have little current experience. We may not be successful in completing any acquisitions of receivables of these asset types and our limited experience in these asset types may impair our ability to collect on these receivables. This may cause us to pay too much for these receivables and consequently we may not generate a profit from these receivables portfolio acquisitions.
10
In addition, we may in the future provide a service to clients in which clients will place defaulted consumer receivables with us for a specific period of time for a flat fee. This fee may be based on the number of collectors assigned to the collection of these receivables, the amount of receivables placed or other bases. We may not be successful in determining and implementing the appropriate pricing for this pricing structure, which may cause us to be unable to generate a profit from this business.
Our collections may decrease if bankruptcy filings increase
During times of economic recession, the amount of defaulted consumer receivables generally increases, which contributes to an increase in the amount of personal bankruptcy filings. Under certain bankruptcy filings a debtor’s assets are sold to repay credit originators, but since the defaulted consumer receivables we service are generally unsecured we often would not be able to collect on those receivables. We cannot assure you that our collection experience would not decline with an increase in bankruptcy filings. If our actual collection experience with respect to a defaulted consumer receivables portfolio is significantly lower than we projected when we purchased the portfolio, our financial condition and results of operations could deteriorate.
We may make acquisitions that prove unsuccessful or strain or divert our resources
We intend to consider acquisitions of other companies in our industry that could complement our business, including the acquisition of entities offering greater access and expertise in other asset types and markets that we do not currently serve. We have little experience in completing acquisitions of other businesses, and we may not be able to successfully complete an acquisition. If we do acquire other businesses, we may not be able to successfully integrate these businesses with our own and we may be unable to maintain our standards, controls and policies. Further, acquisitions may place additional constraints on our resources by diverting the attention of our management from other business concerns. Through acquisitions, we may enter markets in which we have no or limited experience. Moreover, any acquisition may result in a potentially dilutive issuance of equity securities, the incurrence of additional debt and amortization of expenses related intangible assets, all of which could reduce our profitability and harm our business.
We may not be able to continually replace our defaulted consumer receivables with additional receivables portfolios sufficient to operate efficiently and profitably
To operate profitably, we must continually acquire and service a sufficient amount of defaulted consumer receivables to generate revenue that exceeds our expenses. Fixed costs such as salaries and lease or other facility costs constitute a significant portion of our overhead and, if we do not continually replace the defaulted consumer receivables portfolios we service with additional portfolios, we may have to reduce the number of our collection personnel. We would then have to rehire collection staff as we obtain additional defaulted consumer receivables portfolios. These practices could lead to:
| • | low employee morale; | |
| • | fewer experienced employees; | |
| • | higher training costs; | |
| • | disruptions in our operations; | |
| • | loss of efficiency; and | |
| • | excess costs associated with unused space in our facilities. |
Furthermore, heightened regulation of the credit card and consumer lending industry may result in decreased availability of credit to consumers, potentially leading to a future reduction in defaulted consumer receivables available for purchase from credit originators. We cannot predict how our ability to identify and purchase receivables and the quality of those receivables would be affected if there is a shift
11
We may not be able to manage our growth effectively
We have expanded significantly since our formation and intend to maintain our growth focus. However, our growth will place additional demands on our resources and we cannot be sure that we will be able to manage our growth effectively. In order to successfully manage our growth, we may need to:
| • | expand and enhance our administrative infrastructure; | |
| • | continue to improve our management, financial and information systems and controls; and | |
| • | recruit, train, manage and retain our employees effectively. |
Continued growth could place a strain on our management, operations and financial resources. We cannot assure you that our infrastructure, facilities and personnel will be adequate to support our future operations or to effectively adapt to future growth. If we cannot manage our growth effectively, our results of operations may be adversely affected.
Our operations could suffer from telecommunications or technology downtime or increased costs
Our success depends in large part on sophisticated telecommunications and computer systems. The temporary or permanent loss of our computer and telecommunications equipment and software systems, through casualty or operating malfunction, could disrupt our operations. In the normal course of our business, we must record and process significant amounts of data quickly and accurately to access, maintain and expand the databases we use for our collection activities. Any failure of our information systems or software and their backup systems would interrupt our business operations and harm our business. Our headquarters is located in a region that is susceptible to hurricane damage, which may increase the risk of disruption of information systems and telephone service for sustained periods.
Further, our business depends heavily on services provided by various local and long distance telephone companies. A significant increase in telephone service costs or any significant interruption in telephone services could reduce our profitability or disrupt our operations and harm our business.
We may not be able to successfully anticipate, manage or adopt technological advances within our industry
Our business relies on computer and telecommunications technologies and our ability to integrate these technologies into our business is essential to our competitive position and our success. Computer and telecommunications technologies are evolving rapidly and are characterized by short product life cycles. We may not be successful in anticipating, managing or adopting technological changes on a timely basis.
While we believe that our existing information systems are sufficient to meet our current demands and continued expansion, our future growth may require additional investment in these systems. We depend on having the capital resources necessary to invest in new technologies to acquire and service defaulted consumer receivables. We cannot assure you that adequate capital resources will be available to us at the appropriate time.
Our senior management team is important to our continued success and the loss of one or more members of senior management could negatively affect our operations
The loss of the services of one or more of our executive officers or key employees could disrupt our operations. We have employment agreements with Steve Fredrickson, our president, chief executive officer and chairman of our board of directors, Kevin Stevenson, our senior vice president and chief financial officer, and most of our other senior executives. We are negotiating and expect to enter into new employment agreements with all of these executives soon after the consummation of this offering. The current agreements contain, and the new agreements will contain, non-compete provisions that survive
12
Our ability to recover and enforce our defaulted consumer receivables may be limited under federal and state laws
Federal and state laws may limit our ability to recover and enforce our defaulted consumer receivables regardless of any act or omission on our part. Some laws and regulations applicable to credit card issuers may preclude us from collecting on defaulted consumer receivables we purchase if the credit card issuer previously failed to comply with applicable law in generating or servicing those receivables. Collection laws and regulations also directly apply to our business. Additional consumer protection and privacy protection laws may be enacted that would impose additional requirements on the enforcement of and collection on consumer credit card receivables. Any new laws, rules or regulations that may be adopted, as well as existing consumer protection and privacy protection laws, may adversely affect our ability to collect on our defaulted consumer receivables and may harm our business. In addition, federal and state governmental bodies are considering, and may consider in the future, other legislative proposals that would regulate the collection of our defaulted consumer receivables. Although we cannot predict if or how any future legislation would impact our business, our failure to comply with any current or future laws or regulations applicable to us could limit our ability to collect on our defaulted consumer receivables, which could reduce our profitability and harm our business.
We utilize the interest method of revenue recognition for determining our income recognized on finance receivables, which is based on an analysis of projected cash flows that may prove to be less than anticipated and could lead to reductions in future revenues or impairment charges
We utilize the interest method to determine income recognized on finance receivables. Under this method, each static pool of receivables we acquire is modeled upon its projected cash flows. A yield is then established which, when applied to the outstanding balance of the receivables, results in the recognition of income at a constant yield relative to the remaining balance in the pool of defaulted consumer receivables. Each static pool is analyzed monthly to assess the actual performance compared to that expected by the model. If differences are noted, the yield is adjusted prospectively to reflect the revised estimate of cash flows. If the accuracy of the modeling process deteriorates or there is a decline in anticipated cash flows, we would suffer reductions in future revenues or a decline in the carrying value of our receivables portfolios, which in either case would result in lower earnings in future periods and could negatively impact our stock price.
Risks Related to this Offering and Our Capital Structure
We will use a portion of the net proceeds from this offering to pursue possible acquisitions of companies and for unspecified general corporate purposes; we may use these proceeds in ways with which you disagree
We intend to use a portion of the net proceeds of this offering to pursue possible acquisitions of companies and for unspecified general corporate purposes, including working capital needs. Our management will have significant discretion in the use of these funds, and you may disagree with the way these funds are utilized. We cannot assure you that proceeds dedicated to pursue possible acquisitions or for unspecified general corporate purposes will be invested to yield a significant return, or any return at all.
13
We do not have experience in managing a public company
Our management team has historically operated our business as a privately held limited liability company. Our management team has never had responsibility for managing a publicly traded company.
We may incur increased costs as a result of recently enacted and proposed changes in laws and regulations
Recently enacted and proposed changes in the laws and regulations affecting public companies, including the provisions of the Sarbanes-Oxley Act of 2002 and rules proposed by the SEC and by the Nasdaq Stock Market, could result in increased costs to us as we evaluate the implications of any new rules and respond to their requirements. The new rules could make it more difficult for us to obtain certain types of insurance, including director and officer liability insurance, and we may be forced to accept reduced policy limits and coverage or incur substantially higher costs to obtain the same or similar coverage. The impact of these events could also make it more difficult for us to attract and retain qualified persons to serve on our board of directors, our board committees or as executive officers. We are presently evaluating and monitoring developments with respect to new and proposed rules and cannot predict or estimate the amount of the additional costs we may incur or the timing of such costs.
Our controlling stockholder has the ability to determine the outcome of matters voted on by stockholders which will limit your rights
Angelo, Gordon & Co., L.P. (“Angelo Gordon”), together with its affiliates, currently controls 88% of our fully diluted equity, and after this offering will control 65% of our fully diluted equity. So long as Angelo Gordon controls a majority of our fully diluted equity, it will continue to have the ability to elect our directors and determine the outcome of votes by our stockholders on corporate matters, including mergers, sales of all or substantially all of our assets, charter amendments and other matters requiring stockholder approval. In addition, in accordance with our certificate of incorporation, so long as Angelo Gordon beneficially owns 30% or more of the outstanding common stock it will have the right to call a special meeting of the stockholders. This controlling interest may have a negative impact on the market price of our common stock by discouraging third-party investors.
We cannot assure you that a market will develop for our common stock or what the market price for our common stock will be in the future and, in the event that an active trading market does not develop, you may be unable to resell your shares
Prior to this offering, there has been no public market for our common stock. Although we have applied to have our common stock listed on the Nasdaq National Market, there can be no assurance that such application will be approved or, if approved, an active trading market will develop or continue after this offering or that the market price of our common stock will not decline below the initial public offering price. The initial public offering price of our common stock will be determined by negotiations among us, the underwriters and representatives of the underwriters, and may not be indicative of the market price for shares of our common stock after this offering. Prices for the shares of our common stock after this offering will be determined in the market and may be influenced by many factors, including the depth and liquidity of the market for our common stock, investor perception of us and our business, the consumer credit industry as a whole and general economic and market conditions. In the event an active trading market does not develop for our common stock, you may be unable to resell your shares at or about the initial price to the public or at all.
As a new investor, you will immediately experience substantial dilution in book value as a result of this offering
The purchasers of our common stock offered in this offering will experience immediate and substantial dilution of $7.44 per share, the amount by which the per share purchase price of the common stock offered is this offering exceeds the net book value per share of our common stock immediately
14
Our certificate of incorporation, by-laws and Delaware law contain provisions that may prevent or delay a change of control or that may otherwise be in the best interest of our stockholders
Our certificate of incorporation and by-laws contain provisions that may make it more difficult, expensive or otherwise discourage a tender offer or a change in control or takeover attempt by a third-party, even if such a transaction would be beneficial to our stockholders. The existence of these provisions may have a negative impact on the price of our common stock by discouraging third-party investors from purchasing our common stock. In particular, our certificate of incorporation and by-laws include provisions that:
| • | classify our board of directors into three groups, each of which, after an initial transition period, will serve for staggered three-year terms; | |
| • | permit a majority of the stockholders to remove our directors only for cause; | |
| • | permit our directors, and not our stockholders, to fill vacancies on our board of directors; | |
| • | require stockholders to give us advance notice to nominate candidates for election to our board of directors or to make stockholder proposals at a stockholders’ meeting; | |
| • | permit a special meeting of our stockholders be called only by approval of a majority of the directors, the chairman of the board of directors, the chief executive officer, the president or the written request of 30% of our stockholders; | |
| • | permit our board of directors to issue, without approval of our stockholders, preferred stock with such terms as our board of directors may determine; | |
| • | permit the authorized number of directors to be changed only by a resolution of the board of directors; and | |
| • | require the vote of the holders of a majority of our voting shares for stockholder amendments to our by-laws. |
In addition, we are subject to Section 203 of the Delaware General Corporation Law which provides certain restrictions on business combinations between us and any party acquiring a 15% or greater interest in our voting stock other than in a transaction approved by our board of directors and, in certain cases, by our stockholders. These provisions of our certificate of incorporation and by-laws and Delaware law could delay or prevent a change in control, even if our stockholders support such proposals. Moreover, these provisions could diminish the opportunities for stockholders to participate in certain tender offers, including tender offers at prices above the then-current market value of our common stock, and may also inhibit increases in the trading price of our common stock that could result from takeover attempts or speculation.
15
SPECIAL NOTE REGARDING FORWARD-LOOKING STATEMENTS
This prospectus contains certain forward-looking statements. When used in this prospectus, statements which are not historical in nature, including the words “anticipate,” “estimate,” “should,” “expect,” “believe,” “intend” and similar expressions are intended to identify forward-looking statements. Forward-looking statements also include statements containing a projection of revenues, earnings or losses, capital expenditures, dividends, capital structure or other financial terms.
The forward-looking statements in this prospectus are based upon our management’s beliefs, assumptions and expectations of our future operations and economic performance, taking into account currently available information. These statements are not statements of historical fact. Forward-looking statements involve risks and uncertainties, some of which are not currently known to us, that may cause our actual results, performance or financial condition to be materially different from the expectations of future results, performance or financial condition we express or imply in any forward-looking statements. Some of the important factors that could cause our actual results, performance or financial condition to differ materially from expectations are:
| • | changes in the business practices of credit originators in terms of selling defaulted consumer receivables or outsourcing defaulted consumer receivables to third-party contingent fee collection agencies; | |
| • | changes in government regulations that affect our ability to collect sufficient amounts on our acquired or serviced receivables; | |
| • | our ability to employ and retain qualified employees, especially collection personnel; | |
| • | changes in the credit or capital markets, which affect our ability to borrow money or raise capital to purchase or service defaulted consumer receivables; | |
| • | the degree and nature of our competition; and | |
| • | the other factors referenced in this prospectus, without limitation, under the sections entitled “Risk Factors,” “Management’s Discussion and Analysis of Financial Condition and Results of Operations” and “Business.” |
16
USE OF PROCEEDS
We estimate that our net proceeds from the issuance and sale by us of 3,470,000 shares of our common stock, based upon an assumed offering price of $13.00 per share, will be approximately $41.5 million after deducting the underwriting discount and estimated offering expenses. We will not realize any proceeds from the sale of shares of our common stock by the selling stockholder.
We expect to use the net proceeds from this offering as follows:
| • | to repay $29.0 million of currently outstanding indebtedness under our credit facilities (which indebtedness has been incurred to finance the acquisition of defaulted consumer receivables, has a weighted average interest rate of 6.37% as of June 30, 2002 and is scheduled to mature on September 15, 2005); | |
| • | to expand the capacity of our current operations by establishing a new call center at a current estimated cost of $1.9 million; and | |
| • | to fund working capital requirements and for general corporate purposes, such as the acquisition of additional defaulted consumer receivables portfolios or the pursuit of possible acquisitions of complementary businesses, technologies or products. |
The amount and timing of these expenditures may vary depending upon a number of factors, including but not limited to the amount of cash we generate from our operations. We may find it necessary or advisable to use portions of the net proceeds for other purposes, and we will have broad discretion in applying the balance of the net proceeds. Until we use the proceeds of this offering for the above purposes, we intend to invest the funds in short-term, investment-grade, interest-bearing securities. See “Management’s Discussion and Analysis of Financial Condition and Results of Operations — Liquidity and Capital Resources” for additional information regarding our sources and uses of capital.
DIVIDEND POLICY
Our board of directors sets our dividend policy. We currently intend to retain all available funds and any future earnings for use in the operation and expansion of our business, but we may determine in the future to declare or pay cash dividends on our common stock. Any future determination as to the declaration and payment of dividends will be at the discretion of our board of directors and will depend on then existing conditions, including our financial condition, results of operations, contractual restrictions, capital requirements, business prospects and other factors that our board of directors considers relevant.
REORGANIZATION
We were initially formed as Portfolio Recovery Associates, L.L.C., a Delaware limited liability company, on March 20, 1996. As a limited liability company, Portfolio Recovery Associates, L.L.C. was treated for income tax purposes as a partnership with taxes on income generated paid by its members. In connection with this offering, all of the membership units of Portfolio Recovery Associates, L.L.C. will be exchanged, simultaneously with the effectiveness of the registration statement of which this prospectus is a part, for a single class of the common stock of Portfolio Recovery Associates, Inc., a new Delaware corporation formed for purposes of this offering. Accordingly, the members of Portfolio Recovery Associates, L.L.C. shall become the common stockholders of Portfolio Recovery Associates, Inc., which shall be a parent company of Portfolio Recovery Associates, L.L.C. and its subsidiaries. In connection with the Reorganization, (i) each issued and outstanding membership unit of Portfolio Recovery Associates, L.L.C. will be exchanged for one share of common stock of Portfolio Recovery Associates, Inc. and (ii) warrants to purchase 2,235,000 membership units of Portfolio Recovery Associates, L.L.C. at a weighted average exercise price of $4.30 per unit will be exchanged for warrants to purchase 2,235,000 shares of common stock of Portfolio Recovery Associates, Inc. at a weighted average exercise price of $4.30 per share. The only condition precedent to this exchange and the Reorganization is the effectiveness of the registration statement of which this prospectus is a part.
17
CAPITALIZATION
The following table sets forth our capitalization as of June 30, 2002 on (i) an actual basis, without giving effect to the Reorganization, (ii) on a pro forma basis, giving effect to the Reorganization and (iii) on a pro forma as adjusted basis, giving effect to the sale of 3,470,000 shares of common stock by us in this offering at an assumed initial public offering price of $13.00 per share (excluding our estimated offering expenses and underwriting discounts) and our anticipated repayment of approximately $29.0 million of indebtedness.
You should read the following capitalization data in conjunction with “Use of Proceeds”, “Reorganization”, “Selected Financial Data”, “Management’s Discussion and Analysis of Financial Condition and Results of Operations”, the consolidated financial statements and accompanying notes and the other financial data included elsewhere in this prospectus.
| June 30, 2002 | |||||||||||||
| Pro Forma | |||||||||||||
| Actual | Pro Forma(1) | As Adjusted | |||||||||||
| (Dollars in thousands) | |||||||||||||
| Cash and cash equivalents | $ | 8,320 | $ | 8,320 | $ | 24,772 | |||||||
| Total debt, including capital lease obligations | 27,141 | (1) | 27,141 | (2) | 2,141 | ||||||||
| Members’/Stockholders’ Equity: | |||||||||||||
| Members’ equity | 33,897 | — | — | ||||||||||
| Preferred stock, $0.01 par value, 2,000,000 authorized; no shares issued and outstanding | — | — | — | ||||||||||
| Common stock, $0.01 par value, 30,000,000 authorized; no shares issued and outstanding, actual; 10,000,000 issued and outstanding, pro forma; 13,470,000 shares issued and outstanding, pro forma as adjusted | — | 100 | 135 | ||||||||||
| Additional paid-in capital | 33,797 | 75,214 | |||||||||||
| Accumulated other comprehensive income | (434 | ) | (434 | ) | (434 | ) | |||||||
| Total equity | 33,463 | 33,463 | 74,915 | ||||||||||
| Total capitalization | $ | 60,604 | $ | 60,604 | $ | 77,056 | |||||||
| (1) | The pro forma adjustments gives effect to the Reorganization pursuant to which 10,000,000 membership units of Portfolio Recovery Associates, L.L.C. (representing all of its outstanding membership units) will be exchanged for 10,000,000 shares of a single class of our common stock. This results in the elimination of the members’ equity line item, an increase in the common stock line item of $100,000 and an increase of additional paid in capital of $33.8 million. |
| (2) | Total debt, including capital lease obligations includes $25.0 million outstanding on a revolving line of credit which expires on September 15, 2005, long-term debt of $1.0 million with various maturities through 2007, capital lease obligations of $675,000 and a liability of $434,000 attributable to an interest rate hedge agreement which expires in May 2004. As of the date of this prospectus, the amount outstanding on our revolving line of credit is $29.0 million. |
The table above excludes 2,000,000 shares of our common stock reserved for issuance under our 2002 Stock Option Plan, of which 800,000 shares will be subject to options to be granted at the time of this offering at an exercise price equal to the initial public offering price, and 2,235,000 shares of our common stock reserved for issuance upon exercise of outstanding warrants at a weighted average exercise price of $4.30 per share, 2,110,000 of which will be exercisable after this offering.
18
DILUTION
As of June 30, 2002, after giving effect to the Reorganization, our net tangible book value was approximately $33.5 million, or approximately $3.35 per share of our common stock. Net tangible book value per share represents the amount of our total assets less intangible assets and less our total liabilities, divided by the total number of shares of common stock outstanding. We had no intangible assets on our books as of June 30, 2002.
After giving effect to the sale of common stock by us in this offering at an assumed initial public offering price of $13.00 per share and our estimated receipt of the net proceeds from the sale, our net tangible book value will increase to $5.56 per share. This represents an immediate increase in net tangible book value of $2.21 per share to existing stockholders and results in immediate dilution of $7.44 per share to new investors. The following table illustrates this per share dilution.
| Assumed initial public offering price per share | $ | 13.00 | |||||||
| Net tangible book value per share before offering | $ | 3.35 | |||||||
| Increase in net tangible book value per share attributable to this offering | $ | 2.21 | |||||||
| Net tangible book value per share after giving effect to this offering | $ | 5.56 | |||||||
| Dilution in net tangible book value per share to new investors | $ | 7.44 | |||||||
The following table summarizes, as of June 30, 2002, after giving effect to the Reorganization, the difference between the existing stockholders and the new investors with respect to the number of shares of common stock purchased, the total consideration paid and the average price paid per share paid before deducting underwriting discounts and our estimated offering expenses.
| Shares Purchased | Total Consideration | |||||||||||||||||||
| Average Price | ||||||||||||||||||||
| Number | Percentage | Amount | Percentage | Per Share | ||||||||||||||||
| Existing stockholders | 10,000,000 | 74.2 | % | $ | 18,264,375 | 28.8 | % | $ | 1.83 | |||||||||||
| New investors | 3,470,000 | 25.8 | % | $ | 45,110,000 | 71.2 | % | $ | 13.00 | |||||||||||
| Total | 13,470,000 | 100 | % | $ | 63,374,375 | 100 | % | |||||||||||||
19
SELECTED CONSOLIDATED FINANCIAL DATA
The following selected consolidated financial data for the years ended December 31, 1999, 2000 and 2001 and the six months ended June 30, 2002 and as of December 31, 2000 and 2001 and June 30, 2002 have been derived from our consolidated financial statements, included elsewhere in this prospectus which have been audited by PricewaterhouseCoopers LLP. The following selected financial data for the years ended December 31, 1997 and 1998 and as of December 31, 1997, 1998 and 1999 have been derived from our audited consolidated financial statements, not included in this prospectus.
The following selected consolidated financial data for the six months ended June 30, 2001 have been derived from our unaudited consolidated financial statements, included elsewhere in this prospectus. These financial statements include all adjustments, consisting only of normal recurring adjustments, which we consider necessary for a fair statement of our financial position and results of operations for this period.
Operating results for the six months ended June 30, 2002 are not necessarily indicative of results that may be expected for the year ending December 31, 2002.
| Six Months Ended | |||||||||||||||||||||||||||||
| Year Ended December 31, | June 30, | ||||||||||||||||||||||||||||
| 1997 | 1998 | 1999 | 2000 | 2001 | 2001 | 2002 | |||||||||||||||||||||||
| (Unaudited) | |||||||||||||||||||||||||||||
| (Dollars in thousands, except per share data) | |||||||||||||||||||||||||||||
| STATEMENT OF OPERATIONS DATA: | |||||||||||||||||||||||||||||
| Revenue: | |||||||||||||||||||||||||||||
| Income recognized on finance receivables | $ | 2,768 | (1) | $ | 6,815 | $ | 11,746 | $ | 18,991 | $ | 31,221 | $ | 14,407 | $ | 24,018 | ||||||||||||||
| Commissions | — | — | — | — | 214 | — | 816 | ||||||||||||||||||||||
| Net gain on cash sales of defaulted consumer receivables | — | — | 322 | 343 | 901 | 296 | 100 | ||||||||||||||||||||||
| Total revenue | 2,768 | 6,815 | 12,068 | 19,334 | 32,336 | 14,703 | 24,934 | ||||||||||||||||||||||
| Operating expenses: | |||||||||||||||||||||||||||||
| Compensation | 1,650 | 3,821 | 6,119 | 9,883 | 15,644 | 6,712 | 10,212 | ||||||||||||||||||||||
| Legal, accounting and outside fees and services | 400 | 839 | 1,493 | 2,583 | 3,627 | 1,561 | 3,242 | ||||||||||||||||||||||
| Communications | 156 | 318 | 553 | 871 | 1,645 | 666 | 929 | ||||||||||||||||||||||
| Rent and occupancy | 67 | 99 | 335 | 603 | 712 | 314 | 362 | ||||||||||||||||||||||
| Other operating expenses | 127 | 266 | 498 | 652 | 1,265 | 514 | 676 | ||||||||||||||||||||||
| Depreciation | 149 | 238 | 369 | 437 | 677 | 311 | 434 | ||||||||||||||||||||||
| Total operating expenses | 2,549 | 5,581 | 9,367 | 15,029 | 23,570 | 10,078 | 15,855 | ||||||||||||||||||||||
| Income from operations | 219 | 1,234 | 2,701 | 4,305 | 8,766 | 4,625 | 9,079 | ||||||||||||||||||||||
| Net interest expenses | 89 | 744 | 876 | 1,765 | 2,716 | 1,410 | 1,115 | ||||||||||||||||||||||
| Net income before extraordinary loss | 130 | 490 | 1,825 | 2,540 | 6,050 | (2) | 3,215 | 7,964 | |||||||||||||||||||||
| Extraordinary loss | — | — | — | — | (424 | )(3) | — | — | |||||||||||||||||||||
Net income(4) | $ | 130 | $ | 490 | $ | 1,825 | $ | 2,540 | $ | 5,626 | $ | 3,215 | $ | 7,964 | |||||||||||||||
| Pro forma net income before extraordinary loss | $ | 130 | $ | 402 | $ | 1,128 | $ | 1,639 | $ | 3,791 | $ | 2,014 | $ | 4,885 | |||||||||||||||
Pro forma net income(5) | $ | 130 | $ | 402 | $ | 1,128 | $ | 1,639 | $ | 3,526 | (6) | $ | 2,014 | $ | 4,885 | ||||||||||||||
| Pro forma earnings per share before extraordinary loss | |||||||||||||||||||||||||||||
| Basic | $ | 0.38 | $ | 0.49 | |||||||||||||||||||||||||
| Diluted | $ | 0.33 | $ | 0.43 | |||||||||||||||||||||||||
Pro forma net income per share(6) | |||||||||||||||||||||||||||||
| Basic | $ | 0.35 | $ | 0.49 | |||||||||||||||||||||||||
| Diluted | $ | 0.31 | $ | 0.43 | |||||||||||||||||||||||||
Pro forma weighted average shares(6) | |||||||||||||||||||||||||||||
| Basic | 10,000 | 10,000 | |||||||||||||||||||||||||||
| Diluted | 11,458 | (7) | 11,486 | (8) | |||||||||||||||||||||||||
| OPERATING AND OTHER FINANCIAL DATA: | |||||||||||||||||||||||||||||
Cash collections for period(9) | $ | 4,992 | $ | 10,881 | $ | 17,362 | $ | 30,733 | $ | 53,362 | $ | 23,702 | $ | 37,997 | |||||||||||||||
| Operating expenses to cash collections | 51 | % | 51 | % | 54 | % | 49 | % | 44 | % | 43 | % | 42 | % | |||||||||||||||
| Acquisitions of finance receivables, at cost | $ | 8,223 | $ | 11,480 | $ | 19,417 | $ | 24,663 | $ | 33,381 | $ | 12,179 | $ | 16,273 | |||||||||||||||
20
| Six Months Ended | |||||||||||||||||||||||||||||
| Year Ended December 31, | June 30, | ||||||||||||||||||||||||||||
| 1997 | 1998 | 1999 | 2000 | 2001 | 2001 | 2002 | |||||||||||||||||||||||
| (Unaudited) | |||||||||||||||||||||||||||||
| (Dollars in thousands, except per share data) | |||||||||||||||||||||||||||||
| Acquisitions of finance receivables, at face value | $ | 137,721 | $ | 324,251 | $ | 479,778 | $ | 1,004,114 | $ | 1,592,353 | $ | 790,546 | $ | 587,971 | |||||||||||||||
| Percentage increase of acquisitions of finance receivables, at cost | N/A | 40 | % | 69 | % | 27 | % | 35 | % | 62 | % | 34 | % | ||||||||||||||||
| Percentage increase in cash collections for period | N/A | 118 | % | 60 | % | 77 | % | 74 | % | 73 | % | 60 | % | ||||||||||||||||
| Percentage increase in pro forma net income for period | N/A | 209 | % | 181 | % | 45 | % | 115 | % | 360 | % | 143 | % | ||||||||||||||||
| Employees at period end: | |||||||||||||||||||||||||||||
| Total employees | 66 | 140 | 246 | 370 | 501 | 437 | 527 | ||||||||||||||||||||||
Ratio of collection personnel to total employees(10) | 89 | % | 84 | % | 86 | % | 89 | % | 89 | % | 89 | % | 88 | % | |||||||||||||||
| Year Ended December 31, | As of June 30, 2002 | |||||||||||||||||||||||||||
| (Dollars in thousands) | 1997 | 1998 | 1999 | 2000 | 2001 | Actual | As Adjusted(11) | |||||||||||||||||||||
FINANCIAL POSITION DATA: | ||||||||||||||||||||||||||||
| Cash and cash equivalents | $ | 638 | $ | 754 | $ | 1,456 | $ | 3,191 | $ | 4,780 | $ | 8,320 | $ | 24,772 | ||||||||||||||
| Finance receivables | 8,392 | 15,472 | 28,139 | 41,124 | 47,987 | 51,055 | 51,055 | |||||||||||||||||||||
| Total assets | 9,682 | 17,121 | 31,495 | 47,188 | 57,049 | 63,421 | 79,873 | |||||||||||||||||||||
| Long term debt | — | — | — | 532 | 568 | 1,031 | 1,031 | |||||||||||||||||||||
| Total debt, including capital lease obligations | 4,270 | 8,145 | 10,372 | 23,300 | 26,771 | 27,141 | 2,141 | |||||||||||||||||||||
Total stockholders’ equity(12) | 5,184 | 8,488 | 20,313 | 22,705 | 27,752 | 33,463 | 74,195 | |||||||||||||||||||||
| (1) | The financial statements for the year ended December 31, 1997 have been retroactively adjusted to reflect a change in accounting for the effects of the change in our revenue recognition method from the cost recovery method to the interest method effective January 1, 1998. Under the cost recovery method, no income was recognized until all acquisition costs associated with the investments were recovered. Since we had, and continue to have, a proven history of reasonably estimating the timing and degree of collectibility of our finance receivables, we adopted, effective January 1, 1998, the interest method of accounting with the guidance of AICPA Practice Bulletin 6, “Amortization of Discounts on Certain Acquired Loans,” and in accordance with generally accepted accounting principles. This change in revenue recognition method had the effect of increasing income recognized from finance receivables in 1997 from $352,000 to $2.8 million. | |
| (2) | Includes operating losses associated with the formation of our contingent fee collections operations in its first year of operations of $644,000. | |
| (3) | Incurred in connection with the early extinguishment of debt. | |
| (4) | At the time of this offering we will change our parent company legal structure from a limited liability company to a corporation. See “Reorganization.” As a limited liability company we were not subject to Federal or state corporate income taxes. Therefore, net income does not give effect to taxes. | |
| (5) | For comparison purposes, we have presented pro forma net income, which reflects income taxes assuming we had been a corporation since the time of our formation and assuming tax rates equal to the rates that would have been in effect had we been required to report tax expense in such years. | |
| (6) | Pro forma net income and pro forma weighted average shares assumes completion of the reorganization (see “Reorganization”) as if the reorganization had occurred at the beginning of the period presented. | |
| (7) | Weighted average diluted shares for the year ended December 31, 2001 include 10,000,000 basic shares and 1,457,741 common share equivalents calculated according to the treasury stock method using 2,235,000 warrants outstanding and an assumed initial public offering price of $13.00. | |
| (8) | Weighted average diluted shares for the six months ended June 30, 2002 include 10,000,000 basic shares and 1,486,128 common share equivalents calculated according to the treasury stock method using 2,235,000 warrants outstanding and an assumed initial public offering price of $13.00. | |
| (9) | Includes both cash collected on finance receivables and commission fee received during the relevant period. |
| (10) | Includes all collectors and all first-line collection supervisors. |
| (11) | Adjusted to give effect to estimated net proceeds from the sale of 3,470,000 of the common stock offered by us at an assumed initial public offering price of $13.00 share and our anticipated repayment of approximately $29.0 million of indebtedness, $25.0 million of which existed as of June 30, 2002. See “Use of Proceeds.” |
| (12) | Does not give effect to $3.4 million which was distributed to our members as a tax distribution during August and September 2002. |
21
MANAGEMENT’S DISCUSSION AND ANALYSIS OF
The following discussion should be read in conjunction with the consolidated financial statements and accompanying notes, which appear elsewhere in this prospectus. It contains forward-looking statements that involve risks and uncertainties. Our actual results could differ materially from those anticipated in these forward-looking statements as a result of various factors, including those discussed below and elsewhere in this prospectus, particularly under the heading “Risk Factors.”
Overview
We are a full-service provider of outsourced receivables management. We purchase, collect and manage portfolios of defaulted consumer receivables. Defaulted consumer receivables are the unpaid obligations of individuals to credit originators, including banks, credit unions, consumer and auto finance companies, retail merchants and other service providers. We believe that the strengths of our business are based on our sophisticated approach to portfolio pricing, our emphasis on collection personnel and procedures, and our relationships with many of the largest consumer lenders in the United States, including 11 of the top 13 bank credit card issuers and four of the top five store credit card issuers. The defaulted consumer receivables we collect are in substantially all cases either purchased from the credit originator or are collected on behalf of clients on a commission fee basis.
Cash Collections
A key driver to our performance and one of the primary metrics monitored by management is the collection of cash on our owned portfolios of defaulted consumer receivables. We collect cash daily from the 292 portfolios we have purchased through June 30, 2002. This measurement and focus on cash is important because it is the collection of cash that drives our business operations. When we analyze a portfolio for purchase, we model cash collections and cash expenses in order to understand our return on the portfolio investment. Likewise, when we analyze an existing portfolio’s investment performance, we compare cash collections to our original cash expectations. Additionally, the level of cash collections is input back into our proprietary models used to help determine pricing in acquiring future portfolios of defaulted consumer receivables. Excluding the impact of proceeds from occasional portfolio sales, we have increased cash collections on our owned portfolios of defaulted consumer receivables every quarter since our formation. In addition, cash collections have exceeded revenue every quarter since our formation. In certain circumstances, it is possible for revenue to exceed cash collections. The specific accounting methodology is described later under the caption “Accounting for Income Recognized on Finance Receivables.”
Sources of Revenue
Income Recognized on Finance Receivables
Our primary source of revenue is derived from cash collections on our owned defaulted consumer receivables. Because we purchase portfolios of defaulted consumer receivables that have been charged-off by credit originators, we are able to acquire the portfolios at a substantial discount to face value. Through June 30, 2002, we acquired 292 portfolios with a face value of $4.2 billion for $116 million, or 2.8% of face value. We seek to collect 2.5 to 3.0 times the amount paid for a portfolio, as measured over a five-year period. The specific accounting methodology utilized for income recognition is described under the caption “Accounting for Income Recognized on Finance Receivables.”
Commissions
We receive commission revenue for collections we make on behalf of clients, which may be credit originators or other owners of defaulted consumer receivables. These portfolios are still owned by the clients; however, the collection effort is outsourced to us under a commission fee arrangement based on the amount we collect. Most clients will place receivables with us for a specified time frame, generally four to
22
Net Gain on Cash Sales of Defaulted Consumer Receivables
We also from time to time sell previously acquired defaulted consumer receivables to third parties, retaining no claims to any of the subsequent collections. When we sell receivables prior to attempting any collection efforts, we record a gain or loss on sale by comparing the price paid for the receivables to the price received from the purchaser. If we sell certain receivables out of a portfolio that we have attempted to collect upon and have received collections, then we must determine the basis of the sold receivables. This is accomplished by using our statistical models or using the pro rata share of the face amount sold to the current carrying value of the portfolio, whichever is deemed to be more accurate.
Accounting for Income Recognized on Finance Receivables
Income recognized on finance receivables equals the excess of the cash collected from portfolios over the cash paid for the portfolios over their life span. For example, if a portfolio is projected to have collections over its life span equal to 3.0 times its cost or purchase price, and if the projections prove to be precisely accurate, then over the life span of the portfolio, revenue will be recognized equal to two-thirds of collections. Thus, if collections are $3.0 million and cost is $1.0 million, $2.0 million of revenues will be recognized over the portfolio’s life span. As described below, if collections for a portfolio deviate either below or above the projections, then adjustments to revenue are made to reflect the deviation. These adjustments are made to ensure that revenues accurately reflect ongoing collection results and to ensure that over the life span of a portfolio revenues plus cost or purchase price will be equal to collections.
We account for our investments in our finance receivables using the interest method under the guidance of AICPA Practice Bulletin 6, “Amortization of Discounts on Certain Acquired Loans.” Static pools of relatively homogenous defaulted consumer receivables are established as portfolios of receivables are acquired. A separate pool is established for each purchased pool of defaulted consumer receivables. Once a static pool is established, the defaulted consumer receivables in the static pool are not changed. Each static pool is initially recorded at cost, and is accounted for as a single unit for the recognition of income, principal payments and impairment. Income on finance receivables is accrued monthly based on each static pool’s effective yield. The yield is estimated based on the timing and the amount of anticipated future cash flows using our proprietary models. Monthly cash flows greater than the monthly interest accrual will reduce the carrying value of the static pool, resulting in cash collections exceeding revenue. Likewise, monthly cash flows that are less than the monthly interest accrual will accrete the carrying balance of the static pool, resulting in revenue exceeding cash collections.
Each static pool is reviewed on a monthly basis and compared to our proprietary models to ensure complete amortization of the carrying value at the end of each static pool’s life to the extent practicable. This is accomplished by evaluating the future cash flow and effective yield of each static pool. To the extent that cash collections have been lower than expected and or future cash collections are projected to be lower than expected, the effective yield will be prospectively reduced to accommodate the lower expectations and ensure complete amortization of the carrying value. Conversely, if past and or future cash collections exceed expectations, and are both probable and estimable, the effective yield will be prospectively increased. Integral to this process is the measurement of impairment. On a monthly basis, we compare the carrying value of each static pool to its fair value. Fair value is the net present value of expected future cash flows discounted at the current effective yield of the static pool. If the carrying value exceeds the fair value, a valuation allowance would be recognized in the amount of the impairment.
23
Operating Expenses
Compensation
Compensation is our primary expense and includes costs related to our collection work force, management and administration. Specifically, compensation includes salary expense, wages, incentive compensation and bonuses and any expenditures on employee-related health and retirement programs.
Legal, Accounting and Outside Fees and Services
In our ordinary course of business we use a significant amount of outside professional services primarily related to our collection efforts. For accounts that we seek to collect by initiating legal action, we use independent law firms to pursue our legal rights to attempt repayment. Legal fees primarily include contingent legal fees paid to independent attorneys and legal collections costs. While some portion of legal collection costs may be collected from consumers by initiating legal action, we have chosen to expense all costs associated with legal collections and only will recognize these future cash receipts when they are actually collected. Other fees include contingent agency expenses, credit bureau expenses and any external account scoring or analysis. In addition, we incur accounting related expenses related primarily to our annual audits.
Communications
Communications expense primarily includes telephone-related costs and postage expense. We operate two call centers that use sophisticated telephone equipment and advanced predictive dialing technology. We make a substantial number of calls on a monthly basis (more than two million for the month of July 2002), primarily long-distance, to perform our collection efforts. As such, we incur significant telephone expenses each month. We also attempt to reach consumers through several mailings, for which we incur postage and supplies expenses. We outsource the vast majority of our mailing activities and accordingly incur costs for that service.
Rent and Occupancy
Rent and occupancy expenses primarily include rent, utilities and property taxes. We own our Hutchinson, Kansas facility and incur expenses related to utilities, property taxes and maintenance. We lease our headquarters in Norfolk, Virginia and own an adjacent parking lot and pay rent, utilities, property taxes and other miscellaneous expenses.
Other Operating Expenses
Other operating expenses include costs such as travel and entertainment, advertising and marketing, dues and subscriptions, insurance, various taxes and licenses, general insurance, education and training and hiring expenses.
Depreciation
We incur depreciation expenses for costs related to our owned properties in Kansas and Virginia, our computers and information systems and our software.
Reorganization
At the time of this offering, we will change our parent company legal structure from a limited liability company to a corporation. As a limited liability company, we were not subject to Federal or state corporate income taxes and as such have not incurred any historical taxes. For comparison purposes, we have presented pro forma net income, which reflects income taxes assuming we have been a corporation since the time of our formation. See “Reorganization.”
24
Results of Operations
The following table sets forth certain operating data as a percentage of total revenue for the periods indicated:
| Year Ended | Six Months Ended | ||||||||||||||||||||
| December 31, | June 30, | ||||||||||||||||||||
| 1999 | 2000 | 2001 | 2001 | 2002 | |||||||||||||||||
| Revenue: | |||||||||||||||||||||
| Income recognized on finance receivables | 97.3 | % | 98.2 | % | 96.6 | % | 98.0 | % | 96.3 | % | |||||||||||
| Commissions | 0.0 | 0.0 | 0.7 | 0.0 | 3.3 | ||||||||||||||||
| Net gain on cash sales of defaulted consumer receivables | 2.7 | 1.8 | 2.7 | 2.0 | 0.4 | ||||||||||||||||
| Total revenue | 100.0 | 100.0 | 100.0 | 100.0 | 100.0 | ||||||||||||||||
| Operating Expenses: | |||||||||||||||||||||
| Compensation | 50.7 | 51.1 | 48.4 | 45.7 | 41.0 | ||||||||||||||||
| Legal, accounting and outside fees and services | 12.4 | 13.4 | 11.2 | 10.6 | 13.0 | ||||||||||||||||
| Communications | 4.6 | 4.5 | 5.1 | 4.5 | 3.7 | ||||||||||||||||
| Rent and occupancy | 2.8 | 3.1 | 2.2 | 2.1 | 1.5 | ||||||||||||||||
| Other operating expenses | 4.1 | 3.4 | 3.9 | 3.5 | 2.7 | ||||||||||||||||
| Depreciation | 3.0 | 2.2 | 2.1 | 2.1 | 1.7 | ||||||||||||||||
| Total operating expenses | 77.6 | 77.7 | 72.9 | 68.5 | 63.6 | ||||||||||||||||
| Income from operations | 22.4 | 22.3 | 27.1 | 31.5 | 36.4 | ||||||||||||||||
| Net interest expenses | 7.3 | 9.2 | 8.4 | 9.6 | 4.5 | ||||||||||||||||
| Net income before extraordinary loss | 15.1 | 13.1 | 18.7 | 21.9 | 31.9 | ||||||||||||||||
| Extraordinary loss | 0.0 | 0.0 | 1.3 | 0.0 | 0.0 | ||||||||||||||||
| Net income | 15.1 | % | 13.1 | % | 17.4 | % | 21.9 | % | 31.9 | % | |||||||||||
Pro forma net income(1) | 9.3 | % | 8.5 | % | 10.9 | % | 13.7 | % | 19.6 | % | |||||||||||
| (1) | At the time of this offering we will change our parent company legal structure from a limited liability company to a corporation. See “Reorganization.” As a limited liability company we were not subject to Federal or state corporate income taxes. For comparison purposes, we have presented pro forma net income, which reflects income taxes assuming we have been a corporation since the time of our formation and assuming tax rates equal to the rates that would have been in effect had we been required to report tax expense in such years. |
Six Months Ended June 30, 2002 Compared To Six Months Ended June 30, 2001
Revenue
Total revenue was $24.9 million for the six months ended June 30, 2002, an increase of $10.2 million or 69.4% compared to total revenue of $14.7 million for the six months ended June 30, 2001.
Income Recognized on Finance Receivables
Income recognized on finance receivables was $24.0 million for the six months ended June 30, 2002, an increase of $9.6 million or 66.7% compared to income recognized on finance receivables of $14.4 million for the six months ended June 30, 2001. The majority of the increase was due to an increase in our cash collections on our owned defaulted consumer receivables to $37.2 million from $23.7 million, an increase of 56.7%. During the six months ended June 30, 2002, we acquired defaulted consumer receivables portfolios with an aggregate face value amount of $588 million at a cost of $16.3 million.
25
Commissions
Commissions were $816,000 for the six months ended June 30, 2002, an increase of $816,000 compared to zero for the six months ended June 30, 2001. This increase is a result of the commencement of our contingent fee collections operations in March 2001.
Operating Expenses
Total operating expenses were $15.9 million for the six months ended June 30, 2002, an increase of $5.8 million or 57.4% compared to total operating expenses of $10.1 million for the six months ended June 30, 2001. Total operating expenses, including compensation expenses, were 41.7% of cash collections for the six months ended June 30, 2002 compared with 42.5% for the same period in 2001.
Compensation
Compensation expenses were $10.2 million for the six months ended June 30, 2002, an increase of $3.5 million or 52.2% compared to compensation expenses of $6.7 million for the six months ended June 30, 2001. Compensation expenses increased as total employees grew from 437 at June 30, 2001 to 527 at June 30, 2002. This increase reflects the establishment of our contingent fee collections operations and the growth in the number of portfolios of defaulted consumer receivables acquired. The contingent fee collection operation is responsible for 13.3% of this growth, while the remaining 86.7% is attributable to our growth in owned portfolios of defaulted consumer receivables. Compensation expenses as a percentage of cash collections decreased to 26.9% for the six months ended June 30, 2002 from 28.3% of cash collections for the same period in 2001.
Legal, Accounting and Outside Fees and Services
Legal, accounting and outside fees and services expenses were $3.2 million for the six months ended June 30, 2002, an increase of $1.6 million or 100.0% compared to legal, accounting and outside fees and services expenses of $1.6 million for the six months ended June 30, 2001. The increase was primarily attributable to the increased number of accounts referred to independent attorneys for collection. This increase is also consistent with the growth we experienced in our business.
Communications
Communications expenses were $929,000 for the six months ended June 30, 2002, an increase of $263,000 or 39.5% compared to communications expenses of $666,000 for the six months ended June 30, 2001. The increase was attributable to growth in mailings and a higher number of phone calls made to collect on a greater number of defaulted consumer receivables owned and serviced. Mailings were responsible for 72.0% of this increase, while the remaining 28% is attributable to a higher number of phone calls.
26
Rent and Occupancy
Rent and occupancy expenses were $362,000 for the six months ended June 30, 2002, an increase of $48,000 or 15.3% compared to rent and occupancy expenses of $314,000 for the six months ended June 30, 2001. The increase was primarily attributable to contractual increases in annual rental rates.
Other Operating Expenses
Other operating expenses were $676,000 for the six months ended June 30, 2002, an increase of $162,000 or 31.5% compared to other operating expenses of $514,000 for the six months ended June 30, 2001. The increase was due to increases in taxes, fees and licenses, travel and meals and miscellaneous expenses. Taxes, fees and licenses were responsible for 30.2% of this increase, travel and meals were responsible for 33.9% of this increase and miscellaneous expenses were responsible for the remaining 35.9% of this increase.
Depreciation
Depreciation expenses were $434,000 for the six months ended June 30, 2002, an increase of $123,000 or 39.5% compared to depreciation expenses of $311,000 for the six months ended June 30, 2001. The increase was attributable to continued capital expenditures on equipment and computers.
Interest Income
Interest income was $2,000 for the six months ended June 30, 2002, a decrease of $44,000 or 95.7% compared to interest income of $46,000 for the six months ended June 30, 2001. This decrease occurred due to a drop in our yields during the fourth quarter of 2001, so we terminated our repurchase agreement in favor of earning fee offset credit with our bank.
Interest Expense
Interest expense was $1.1 million for the six months ended June 30, 2002, a decrease of $340,000 or 24.3% compared to interest expense of $1.4 million for the six months ended June 30, 2001. This decrease occurred as higher average borrowings, which increased from $24.9 million to $27.0 million, were more than offset by lower interest rates.
Year Ended December 31, 2001 Compared to Year Ended December 31, 2000
Revenue
Total revenue was $32.3 million for the year ended December 31, 2001, an increase of $13.0 million or 67.4% compared to total revenue of $19.3 for the year ended December 31, 2000.
Income Recognized on Finance Receivables
Income recognized on finance receivables was $31.2 million for the year ended December 31, 2001, an increase of $12.2 million or 64.2% compared to income recognized on finance receivables of $19.0 million for the year ended December 31, 2000. The increase was due to an increase in our cash collections on our owned defaulted consumer receivables portfolios to $53.4 million from $30.7 million, an increase of 74.0%. During the year ended December 31, 2001, we acquired defaulted consumer receivables portfolios with an aggregate face value amount of $1.6 billion at a cost of $33 million. During the year ended December 31, 2000, we acquired defaulted consumer receivable portfolios with an aggregate face value of $1.0 billion at a cost of $24.7 million.
27
Commissions
Commissions were $214,000 for the year ended December 31, 2001, an increase of $214,000 compared to zero for the year ended December 31, 2000. The increase is a result of the commencement of our contingent fee collections operations in March 2001.
Net Gain on Cash Sales of Defaulted Consumer Receivables
Net gain on cash sales of defaulted consumer receivables was $901,000 for the year ended December 31, 2001, an increase of $558,000 or 162.7% compared to net gain on cash sales of defaulted consumer receivables of $343,000 for the year ended December 31, 2000. This increase is the result of increased sale activity. In 2000 we sold $13.6 million in face value at an average price of 4.3% whereas in 2001 we sold $151.5 million in face value at an average price of 3.8%. The percentage increase in face value sold from 2000 to 2001 was significantly more than the percentage increase in recognized net gain on cash sales of defaulted consumer receivables. This is simply because we had a much higher basis in the receivables sold in 2001 compared with those sold in 2000.
Expenses
Total operating expenses were $23.6 million for the year ended December 31, 2001, an increase of $8.6 million or 57.3% compared to total operating expenses of $15.0 million for the year ended December 31, 2000. Total operating expenses, including compensation expenses, were 44.2% of cash collections in 2001 compared to 48.9% in 2000.
Compensation
Compensation expenses were $15.6 million for the year ended December 31, 2001, an increase of $5.7 million or 57.6% compared to compensation expenses of $9.9 million for the year ended December 31, 2000. Compensation expenses increased as total employees grew from 370 at December 31, 2000 to 501 at December 31, 2001. This increase reflects the continued staffing of both our Virginia and Kansas facilities and the commencement of our contingent fee collections operations in March 2001. The additional employees were required to collect on our growing portfolio of acquired pools of defaulted consumer receivables. Compensation expenses decreased to 29.3% of cash collections in 2001 from 32.2% of cash collections in 2000. Staffing at our Virginia facility was responsible for 51.2% of this increase, staffing at our Kansas facility was responsible for 19.8% of this increase and staffing for our contingent collections operations was responsible for the remaining 29% of this increase.
Legal, Accounting and Outside Fees and Services
Legal, accounting and outside fees and services expenses were $3.6 million for the year ended December 31, 2001, an increase of $1.0 million or 38.5% compared to legal, accounting and outside fees and services expenses of $2.6 million for the year ended December 31, 2000. The increase was primarily attributable to the increased number of accounts referred to independent attorneys for collection.
Communications
Communications expenses were $1.6 million for the year ended December 31, 2001, an increase of $774,000 or 88.9% compared to communications expenses of $871,000 for the year ended December 31, 2000. The increase was primarily a result of higher postage due to mailings required under the Gramm-Leach-Bliley Act, and a higher number of phone calls made to collect on a greater number of receivables owned and serviced. Mailings were responsible for 62.9% of this increase while the remaining 37.1% is attributable to a higher number of phone calls.
28
Rent and Occupancy
Rent and occupancy expenses were $712,000 for the year ended December 31, 2001, an increase of $109,000 or 18.1% compared to rent and occupancy expenses of $603,000 for the year ended December 31, 2000. The increase was primarily a result of the first full year of occupancy of our Kansas facility, which opened in July 2000.
Other Operating Expenses
Other operating expenses were $1.3 million for the year ended December 31, 2001, an increase of $613,000 or 94.0% compared to other operating expenses of $652,000 for the year ended December 31, 2000. Significant components of the other operating expenses include taxes, fees and licenses, hiring expenses, travel and meals and miscellaneous expenses, all of which are related to our contingent fee collections operations and the continued expansion of our workforce throughout 2001. Taxes, fees and licenses were responsible for 26.9% of this increase, travel and meals were responsible for 16.9% of this increase, hiring expenses were responsible for 19.6% of this increase and miscellaneous expenses were responsible for the remaining 36.6% of this increase.
Depreciation
Depreciation expenses were $677,000 for the year ended December 31, 2001, an increase of $240,000 or 54.9% compared to depreciation expenses of $437,000 for the year ended December 31, 2000. The increase was attributable to increased capital expenditures during late 2000 and 2001, especially in connection with the acquisition of technology for our contingent fee collection operations.
Interest Income
Interest income was $65,000 for the year ended December 31, 2001, a decrease of $29,000 or 30.9% compared to interest income of $94,000 for the year ended December 31, 2000. This decrease occurred due to the significant drop in our yields during the fourth quarter of 2001. Our average cash balance changed from $2.7 million in 2000 to $4.3 million in 2001.
Interest Expense
Interest expense was $2.8 million for the year ended December 31, 2001, an increase of $922,000 or 49.6% compared to interest expense of $1.9 million for the year ended December 31, 2000. This increase was a result of increased borrowings to finance the growth in acquisitions of defaulted consumer receivable portfolios during 2001. During 2001, we made additional investments in defaulted consumer receivable portfolios of $33.4 million. To finance these acquisitions of defaulted consumer receivable portfolios, our borrowings increased during 2001. We had average monthly borrowings of $25.6 million during 2001, compared to average monthly borrowings of $15.5 million during 2000.
Extraordinary Loss
Extraordinary loss was $424,000 for the year ended December 31, 2001, an increase of $424,000 compared to none for the year ended December 31, 2000. The increase was due to the early extinguishment of debt under two of our previous line of credit agreements in 2001, for which we expensed $232,000 of remaining unamortized debt acquisition costs and $192,000 for the extinguishment of a contingent interest provision.
Year Ended December 31, 2000 Compared To Year Ended December 31, 1999
Revenue
Total revenue was $19.3 million for the year ended December 31, 2000, an increase of $7.2 million or 59.5% compared to total revenue of $12.1 for the year ended December 31, 1999.
29
Income Recognized on Finance Receivables
Income recognized on finance receivables was $19.0 million for the year ended December 31, 2000, an increase of $7.3 million or 62.4% compared to income recognized on finance receivables of $11.7 million for the year ended December 31, 1999. The increase was due to an increase in our cash collections on our owned defaulted consumer receivables portfolio to $30.7 million from $17.4 million, an increase of 76.4%. During the year ended December 31, 2000, we acquired defaulted consumer receivable portfolios with an aggregate face value amount of $1.0 billion at a cost of $25 million. During the year ended December 31, 1999, we acquired defaulted consumer receivable portfolios with an aggregate face value of $480 million at a cost of $19 million.
Expenses
Total operating expenses were $15.0 million for the year ended December 31, 2001, an increase of $5.6 million or 59.6% compared to total operating expenses of $9.4 million for the year ended December 31, 2000. Total operating expenses, including compensation expenses, were 48.9% of cash collections in 2000 compared to 54.0% in 1999.
Compensation
Compensation expenses were $9.9 million for the year ended December 31, 2000, an increase of $3.8 million or 62.3% compared to compensation expenses of $6.1 million for the year ended December 31, 1999. Compensation expenses increased as total employees grew from 246 at December 31, 1999 to 370 at December 31, 2000. This increase reflects the continued staffing of both our Virginia and Kansas facilities. Staffing at our Virginia facility was responsible for 54.8% of this increase, while the remaining 45.2% is attributable to increased staffing at our Kansas facility. The additional employees were required to collect on our growing portfolio of acquired pools of defaulted consumer receivables. Compensation expenses decreased to 32.2% of cash collections in 2000 from 35.2% of cash collections in 1999.
Legal, Accounting and Outside Fees and Services
Legal, accounting and outside fees and services expenses were $2.6 million for the year ended December 31, 2000, an increase of $1.1 million or 73.3% compared to legal, accounting and outside fees and services expenses of $1.5 million for the year ended December 31, 1999. This increase was primarily attributable to the increased number of accounts referred to independent attorneys for collection.
Communications
Communications expenses were $871,000 for the year ended December 31, 2000, an increase of $318,000 or 57.5% compared to communication expenses of $553,000 for the year ended December 31, 1999. The increase was primarily a result of higher postage due to our increase in acquired pools of defaulted consumer receivables and a higher number of phone calls made to collect a greater number of defaulted consumer receivables owned and serviced. Mailings were responsible for 15.9% of this increase, while the remaining 84.1% is attributable to a higher number of phone calls.
Rent and Occupancy
Rent and occupancy expenses were $603,000 for the year ended December 31, 2000, an increase of $268,000 or 80.0% compared to rent and occupancy expenses of $335,000 for the year ended December 31, 1999. The increase was primarily as a result of the first full year of occupancy at our Virginia headquarters, which opened in July 1999, and the opening of our Kansas facility in July 2000. Occupancy at our Virginia headquarters was responsible for 90.0% of this increase, while the remaining 10.0% is attributable to our Kansas facilities.
30
Other Operating Expenses
Other operating expenses were $652,000 for the year ended December 31, 2000, an increase of $154,000 or 30.9% compared to other operating expenses of $498,000 for the year ended December 31, 1999. The increase was due to increases in repairs, maintenance, taxes, fees and licenses. Repairs and maintenance was responsible for 49.6% of this increase, while the remaining 50.4% is attributable to taxes, fees and licenses.
Depreciation
Depreciation expenses were $437,000 for the year ended December 31, 2000, an increase of $68,000 or 18.4% compared to depreciation expenses of $369,000 for the year ended December 31, 1999. The increase was attributable to higher capital expenditures during late 1999 and 2000, in connection with the opening of our Kansas facility in July 2000.
Interest Income
Interest income was $94,000 for the year ended December 31, 2000, a decrease of $8,000 or 7.9% compared to interest income of $102,000 for the year ended December 31, 1999.
Interest Expense
Interest expense was $1.9 million for the year ended December 31, 2000, an increase of $881,000 or 90.1% compared to interest expense of $978,000 for the year ended December 31, 1999. This increase was a result of increased borrowings to finance the growth in our acquisitions of defaulted consumer receivable portfolios during 2000. During 2000, we made additional investment in defaulted consumer receivable portfolios of $24.7 million, compared to our investment of $19.4 million in 1999. To finance these acquisitions of defaulted consumer receivable portfolios, our borrowings increased during 2000. We had average monthly borrowings of $15.6 million during 2000, compared to average monthly borrowings of $8.7 million during 1999.
31
Unaudited Quarterly Results
The following table presents certain unaudited quarterly consolidated statements of operations data for the ten-quarter period ended June 30, 2002. The information has been derived from our unaudited consolidated financial statements. Our unaudited consolidated financial statements have been prepared on substantially the same basis as the audited consolidated financial statements contained in this prospectus and include all adjustments, consisting only of normal recurring adjustments, which we consider to be necessary to present fairly this information when read in conjunction with the consolidated financial statements and notes appearing elsewhere within this prospectus. The results of operations for any quarter are not necessarily indicative of the results to be expected for any future period.
| Quarter Ended | |||||||||||||||||||||||||||||||||||||||||
| Mar. 31, | June 30, | Sept. 30, | Dec. 31, | Mar. 31, | June 30, | Sept. 30, | Dec. 31, | Mar. 31, | June 30, | ||||||||||||||||||||||||||||||||
| 2000 | 2000 | 2000 | 2000 | 2001 | 2001 | 2001 | 2001 | 2002 | 2002 | ||||||||||||||||||||||||||||||||
(Dollars in thousands) | |||||||||||||||||||||||||||||||||||||||||
| Revenue: | |||||||||||||||||||||||||||||||||||||||||
| Income recognized on finance receivables | $ | 3,810 | $ | 4,002 | $ | 4,984 | $ | 6,195 | $ | 6,723 | $ | 7,685 | $ | 7,739 | $ | 9,074 | $ | 11,181 | $ | 12,837 | |||||||||||||||||||||
| Commissions | — | — | — | — | — | — | 55 | 159 | 376 | 440 | |||||||||||||||||||||||||||||||
| Net gain on cash sales of defaulted consumer receivables | — | 88 | 223 | 32 | 137 | 159 | 459 | 146 | — | 100 | |||||||||||||||||||||||||||||||
| Total revenue | 3,810 | 4,090 | 5,207 | 6,227 | 6,860 | 7,844 | 8,253 | 9,379 | 11,557 | 13,377 | |||||||||||||||||||||||||||||||
| Operating Expenses: | |||||||||||||||||||||||||||||||||||||||||
| Compensation | 1,964 | 2,168 | 2,689 | 3,062 | 3,287 | 3,425 | 4,108 | 4,824 | 5,068 | 5,144 | |||||||||||||||||||||||||||||||
| Legal, accounting and outside fees and services | 575 | 665 | 638 | 705 | 746 | 815 | 940 | 1,126 | 1,291 | 1,951 | |||||||||||||||||||||||||||||||
| Communications | 191 | 194 | 197 | 289 | 314 | 352 | 486 | 493 | 450 | 479 | |||||||||||||||||||||||||||||||
| Rent and occupancy | 143 | 151 | 148 | 161 | 157 | 157 | 191 | 207 | 173 | 189 | |||||||||||||||||||||||||||||||
| Other operating expenses | 153 | 130 | 160 | 209 | 241 | 274 | 332 | 418 | 306 | 370 | |||||||||||||||||||||||||||||||
| Depreciation | 111 | 98 | 105 | 123 | 142 | 168 | 175 | 192 | 211 | 223 | |||||||||||||||||||||||||||||||
| Total operating expenses | 3,137 | 3,406 | 3,937 | 4,549 | 4,887 | 5,191 | 6,232 | 7,260 | 7,499 | 8,356 | |||||||||||||||||||||||||||||||
| Income from operations | 673 | 684 | 1,270 | 1,678 | 1,973 | 2,653 | 2,021 | 2,119 | 4,058 | 5,021 | |||||||||||||||||||||||||||||||
| Net interest expenses | 287 | 392 | 447 | 639 | 689 | 721 | 664 | 642 | 526 | 589 | |||||||||||||||||||||||||||||||
| Net income before extraordinary item | 386 | 292 | 823 | 1,039 | 1,284 | 1,932 | 1,357 | 1,477 | 3,532 | 4,432 | |||||||||||||||||||||||||||||||
| Extraordinary loss | — | — | — | — | — | — | 232 | 192 | — | — | |||||||||||||||||||||||||||||||
| Net income | $ | 386 | $ | 292 | $ | 823 | $ | 1,039 | $ | 1,284 | $ | 1,932 | $ | 1,125 | $ | 1,285 | $ | 3,532 | $ | 4,432 | |||||||||||||||||||||
Pro forma net income(1) | $ | 249 | $ | 188 | $ | 531 | $ | 671 | $ | 805 | $ | 1,211 | $ | 705 | $ | 805 | $ | 2,167 | $ | 2,718 | |||||||||||||||||||||
| Pro forma net income per share | |||||||||||||||||||||||||||||||||||||||||
| Basic | 0.08 | 0.12 | 0.07 | 0.08 | 0.22 | 0.27 | |||||||||||||||||||||||||||||||||||
| Diluted | 0.07 | 0.11 | 0.06 | 0.07 | 0.19 | 0.24 | |||||||||||||||||||||||||||||||||||
| Pro forma weighted average shares | |||||||||||||||||||||||||||||||||||||||||
| Basic | 10,000 | 10,000 | 10,000 | 10,000 | 10,000 | 10,000 | |||||||||||||||||||||||||||||||||||
| Diluted | 11,388 | 11,473 | 11,485 | 11,485 | 11,485 | 11,487 | |||||||||||||||||||||||||||||||||||
| (1) | At the time of this offering we will change our parent company legal structure from a limited liability company to a corporation. See “Reorganization.” As a limited liability company we were not subject to Federal or state corporate income taxes. For comparison purposes, we have presented pro forma net income, which reflects income taxes assuming we had been a corporation since the time of our formation and assuming tax rates equal to the rates that would have been in effect had we been required to report tax expense in such years. |
32
Seasonality
Our business depends on the ability to collect on our owned and serviced defaulted consumer receivables. Collections tend to be higher in the first and second quarters of the year, due to consumers’ receipt of tax refunds and other factors. Conversely, collections tend to be lower in the third and fourth quarters of the year, due to consumers’ spending in connection with summer and holiday vacations. Due to our historical quarterly increases in cash collections, our growth has masked the impact of this seasonality.
Liquidity and Capital Resources
Cash collections have substantially exceeded revenue in each quarter since our formation, as shown in the following table. Our resulting strong cash flow has permitted us to acquire all new portfolios since October 2001 without any incremental borrowings. The following chart illustrates the consistent excess of our cash collections on our owned portfolios over the income recognized on finance receivables on a quarterly basis.
Cash Collections(1) and Income Recognized on Finance Receivables
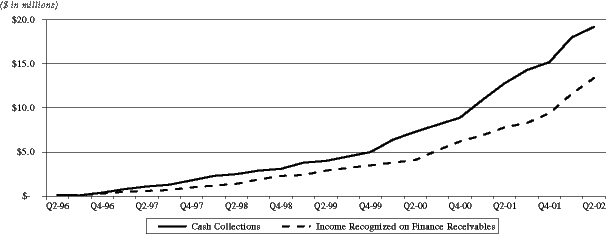
| (1) | Includes cash collections on finance receivables only. Excludes commission fees and cash proceeds from sales of defaulted consumer receivables. |
33
The following table shows the changes in finance receivables, including the amounts paid to acquire new portfolios.
| Six Months Ended | ||||||||||||||||||||||||
| Year Ended December 31, | June 30, | |||||||||||||||||||||||
| 1997 | 1998 | 1999 | 2000 | 2001 | 2002 | |||||||||||||||||||
| Balance at beginning of period | $ | 3,025,026 | $ | 8,392,389 | $ | 15,471,538 | $ | 28,139,051 | $ | 41,124,377 | $ | 47,986,744 | ||||||||||||
| Acquisitions of finance receivables, net of buybacks | 7,591,008 | 11,145,275 | 18,853,787 | 25,035,237 | 33,491,211 | 16,232,137 | ||||||||||||||||||
Cash collections applied to principal(1) | (2,223,645 | ) | (4,066,126 | ) | (5,616,241 | ) | (11,741,998 | ) | (21,926,815 | ) | (13,163,179 | ) | ||||||||||||
| Cost of finance receivables sold net of allowance for returns | — | — | (570,033 | ) | (307,913 | ) | (4,702,029 | ) | (600 | ) | ||||||||||||||
| Balance at end of period | $ | 8,392,389 | $ | 15,471,538 | $ | 28,139,051 | $ | 41,124,377 | $ | 47,986,744 | $ | 51,055,102 | ||||||||||||
| (1) | Cash collections applied to principal consists of cash collections less income recognized on finance receivables. |
Our operating activities provided cash of $1.8 million, $3.1 million, $6.5 million and $8.9 million for the years ended December 31, 1999, 2000 and 2001 and the six months ended June 30, 2002, respectively. In each of these periods, cash from operations was generated primarily from net income earned through cash collections, commissions received and gains on cash sales of defaulted consumer receivables for the period, which increased from $1.8 million in 1999 to $2.5 million in 2000 and to $5.6 million in 2001 and to $8.0 million for the six months ended June 30, 2002.
Our investing activities used cash of $13.4 million, $13.2 million, $7.2 million and $3.4 million for the years ended December 31, 1999, 2000 and 2001 and the six month period ended June 30, 2002, respectively. Cash used in investing activities is primarily driven by acquisitions of defaulted consumer receivables, net of cash collections applied to the cost of the receivables.
Our financing activities provided (used) cash of $11.9 million, $12.4 million, $2.3 million and $(1.9) million, respectively, for the years ended December 31, 1999, 2000 and 2001 and the six months ended June 30, 2002, respectively. A principal source of cash from financing activities has been proceeds from lines of credit, which totaled $12.7 million, $25.6 million, $28.6 million and none at December 31, 1999, 2000 and 2001 and June 30, 2002, respectively. Proceeds from lines of credit were partially offset in each of the periods by repayments of our lines of credit, which totaled $10.7 million, $13.5 million, $25.7 million and none, respectively. In 1999, we also received a capital contribution from Angelo Gordon of $10.0 million.
Cash paid for interest expenses was $1.0 million, $1.8 million, $2.8 million and $1.0 million for the years ended December 31, 1999, 2000 and 2001 and the six months ended June 30, 2002, respectively. The majority of interest expenses was paid for lines of credit used to finance acquisitions of defaulted consumer receivables portfolios.
PRA III, LLC, our wholly owned subsidiary, maintains a $40.0 million revolving line of credit with Westside Funding Corporation (“Westside”) pursuant to an agreement entered into on September 18, 2001. We, as well as PRA Receivables Management LLC (d/b/a Anchor Receivables Management), PRA II, LLC and PRA Holding, LLC (all of which are wholly-owned subsidiaries of ours) are guarantors to this agreement. The credit facility bears interest at a spread over LIBOR and extends through September 15, 2005. The agreement provides for:
| • | restrictions on monthly borrowings in excess of $4 million per month and quarterly borrowings in excess of $10 million; | |
| • | a maximum leverage ratio of not greater than 4.0 to 1.0 and net income per year of at least $0.01, calculated on a consolidated basis; | |
| • | a restriction on distributions in excess of 75% of our net income for any year; | |
| • | compliance with certain special purpose vehicle and corporate separateness covenants; and |
34
| • | restrictions on change of control. |
Upon consummation of this offering, we will pay off $29.0 million, the current outstanding balance of this facility, with proceeds from this offering. After this offering, we intend to either replace or renegotiate the terms of this facility.
In addition, PRA AG Funding, LLC, our wholly owned subsidiary, maintains a $2.5 million revolving line of credit, pursuant to an agreement entered into with RBC Centura Bank on June 30, 2002. The credit facility bears interest at a spread over LIBOR and extends through July 2003. The agreement provides:
| • | that we maintain a current ratio of 1.6 to 1.0 (the current ratio being defined to include finance receivables as a current asset and to include the credit facility with Westside as a current liability); | |
| • | that we maintain a debt to tangible net worth ratio of not more than 1.5 to 1.0; | |
| • | for a minimum balance sheet cash position at month end of $2 million; and | |
| • | a restriction on distributions by us to 75% of net income. |
This $2.5 million facility had no amounts outstanding at July 31, 2002. After this offering, we intend to replace or renegotiate the terms of this facility.
On December 30, 1999, PRA AG Funding, LLC, our wholly owned subsidiary, entered into a credit agreement with AG PRA 1999 Funding Co., (“AG 1999”) an affiliate of Angelo Gordon, for a line of credit of $12.5 million. See “Certain Relationships and Related Transactions.” In December 2001, PRA AG Funding, LLC paid all outstanding loans under the credit facility with AG 1999. PRA AG Funding, LLC has no outstanding liability under this credit facility which expired on June 30, 2002.
As of June 30, 2002 there are three additional loans outstanding. In July 2000, PRA Holding I, LLC, our wholly owned subsidiary, entered into a credit facility with Bank of America, N.A., for a $550,000 loan, for the purpose of purchasing a building in Hutchinson, Kansas. The loan bears interest at a variable rate based on LIBOR and consists of monthly principal payments for 60 months and a final installment of unpaid principal and accrued interest payable on July 21, 2005. On February 9, 2001, we entered into a commercial loan agreement with Bank of America, N.A. in the amount of $107,000 in order to purchase equipment for its Norfolk, Virginia location. This loan bears interest at a fixed rate of 7.9% and matures on February 1, 2006. On February 20, 2002, we entered into an additional arrangement with Bank of America, N.A. for a $500,000 commercial loan in order to finance construction of a parking lot at our Norfolk, Virginia location. This loan bears interest at a fixed rate of 6.47% and matures on September 1, 2007.
Critical Accounting Policy
We utilize the interest method to determine income recognized on finance receivables. Under this method, each static pool of receivables we acquire is statistically modeled to determine its projected cash flows. A yield is then established which, when applied to the outstanding balance of the receivables, results in the recognition of income at a constant yield relative to the remaining balance in the pool. Each pool is analyzed monthly to assess the actual performance compared to that expected by the model. If differences are noted, the yield is adjusted prospectively to reflect the revised estimate of cash flows.
Recent Accounting Pronouncements
In July 2001, the Financial Accounting Standards Board (“FASB”) issued SFAS No. 141, “Business Combinations,” and SFAS No. 142, “Goodwill and Other Intangible Assets.” SFAS Nos. 141 and 142 changed the accounting for business combinations and goodwill in two significant ways. First, SFAS No. 141 requires that the purchase method of accounting be used in all business combinations initiated after June 30, 2001. Use of the pooling-of-interests method is prohibited. Second, SFAS No. 142 changes
35
In June 2001, the FASB issued SFAS No. 143, “Accounting for Asset Retirement Obligations”. SFAS 143 requires that obligations associated with the retirement of tangible long-lived assets be recorded as a liability when those obligations are incurred, with the amount of liability initially measured at fair value. SFAS No. 143 will be effective for fiscal years beginning after June 15, 2002, though early adoption is encouraged. The application of this statement is not expected to have a material impact on our financial statements.
In July 2001, the FASB issued SFAS No. 144, “Accounting for the Impairment or Disposal of Long-Lived Assets.” SFAS No. 144 supersedes SFAS No. 121, “Accounting for the Impairment of Long-Lived Assets to be Disposed Of.” SFAS No. 144 applies to all long-lived assets including discontinued operations, and amends Accounting Principles Board Opinion No. 30, “Reporting the Effect of Disposal of a Segment of a Business, Extraordinary, Unusual and Infrequently Occurring Events and Transactions”. SFAS No. 144 requires that long-lived assets that are to be disposed of by sale be measured at the lower of book or fair value, less cost to sell. SFAS No. 144 is effective for fiscal years beginning after December 15, 2001 and its provisions are expected to be applied prospectively. The application of this statement is not expected to have a material impact on our financial statements.
In May 2002, the FASB issued SFAS No. 145, “Rescission of FASB Statements No. 4, 44, and 64, Amendment of FASB Statement No. 13, and Technical Corrections as of April 2002.” SFAS 145 rescinds FASB Statement No. 4, “Reporting Gains and Losses from Extinguishment of Debt” and an amendment of that statement, FASB Statement No. 64, “Extinguishments of Debt Made to Satisfy Sinking-Fund Requirements” and eliminates extraordinary gain and loss treatment for the early extinguishment of debt. This statement also rescinds FASB Statement No. 44, “Accounting for Intangible Assets of Motor Carriers” and amends FASB Statement No. 13, “Accounting for Leases,” to eliminate an inconsistency between the required accounting for sale-leaseback transactions and the required accounting for certain lease modifications that have economic effects that are similar to sale-leaseback transactions. This statement also amends other existing authoritative pronouncements to make various technical corrections, clarify meanings, or describe their applicability under changed conditions. This statement is effective for fiscal years beginning after May 15, 2002. We will adopt SFAS 145 for the year ending December 31, 2002. The application of this statement is not expected to have a material impact on our financial statements other than the elimination of the extraordinary loss treatment for the debt extinguishment in 2001.
In June 2002, the FASB issued SFAS No. 146, “Accounting for Costs Associated with Exit or Disposal Activities.” SFAS 146 addresses financial accounting and reporting for costs associated with exit or disposal activities and nullifies Emerging Issues Task Force Issue No. 94-3, “Liability Recognition for Certain Employee Termination Benefits and Other Costs to Exit an Activity (including Certain Costs Incurred in a Restructuring).” The application of this statement is not expected to have a material impact on our financial statements.
36
BUSINESS
Overview
We are a full-service provider of outsourced receivables management. We purchase, collect and manage portfolios of defaulted consumer receivables. Defaulted consumer receivables are the unpaid obligations of individuals to credit originators, including banks, credit unions, consumer and auto finance companies, retail merchants and other service providers. We believe that the strengths of our business are our sophisticated approach to portfolio pricing, our emphasis on collection personnel and procedures and our relationships with many of the largest consumer lenders in the United States, including 11 of the top 13 bank credit card issuers and four of the top five store credit card issuers. Our proven ability to collect defaulted consumer receivables allows us to offer credit originators a complete outsourced solution to address their defaulted consumer receivables. The defaulted consumer receivables we collect are in substantially all cases either purchased from the credit originator or are collected on behalf of clients on a commission fee basis. We intend to continue leveraging our strengths and grow our business through the disciplined approach that has contributed to our success to date.
We specialize in receivables that have been charged-off by the credit originator. Since the credit originator has unsuccessfully attempted to collect these receivables, we are able to purchase them at a substantial discount to their face value. Through June 30, 2002, we have acquired 292 portfolios with a face value of $4.2 billion for $116 million, or 2.8% of face value. Our success depends on our ability to purchase portfolios of defaulted consumer receivables at appropriate valuations and to collect on those receivables effectively and efficiently. To date, we have consistently been able to collect at a rate of 2.5 to 3.0 times our purchase price for defaulted consumer receivables portfolios, as measured over a five-year period, which has enabled us to generate increasing profits and positive cash flow.
We believe we have been capitalized conservatively, operating with low levels of financial leverage and funding most of our recent portfolio acquisitions through cash flow generated from collection activities. We have devoted considerable effort to developing statistical models and databases for pricing portfolio purchases, and we have systems and infrastructure which allow for detailed reporting and analysis of collection results. We have also been careful to ensure that the growth in our portfolio of defaulted consumer receivables does not outpace our ability to profitably collect on our receivables. We maintain a ratio of collectors to total employees that we believe is significantly higher than many of our competitors.
We believe that our collectors are critical to the success of our business, as a majority of our collections occur as a result of telephone contact with consumers. We have found that the tenure and productivity of our collectors are directly related. Therefore, we have placed considerable focus on attracting, hiring, training, retaining and motivating our collection workforce. Historically, collectors working on our owned portfolios who have been with us for more than 12 months are 90% more productive than collectors with less tenure. We expect an increase in productivity and profitability as our ratio of collectors with more than 12 months of experience increases over time.
We were formed in March 1996 by four members of senior management that continue to lead us. Prior to our formation, members of the management team played key roles in the development of a defaulted consumer receivables acquisition and divestiture operation for Household Recovery Services, a subsidiary of Household International. We are owned by certain members of our senior management and Angelo, Gordon & Co., L.P., a New York based investment management firm, and its affiliates. Since our formation, we have acquired and serviced portfolios of defaulted consumer receivables. In March 2001 we commenced our third-party contingent fee collections operations to provide defaulted receivables management on a commission fee basis, receiving a percentage of the amounts collected on behalf of the client.
We have achieved strong financial results since our formation, with cash collections growing from $5.0 million in 1997 to $53.4 million in 2001. Revenue has grown from $2.8 million in 1997 to $32.3 million in 2001, a compound annual growth rate of 84%. Similarly, pro forma net income has grown from $130,000 in 1997 to $3.5 million in 2001. Our solid financial performance has continued into 2002. For the six month period ended June 30, 2002, cash collections were $38.0 million, revenue was $24.9 million and pro forma net income was $4.9 million, compared to cash collections of $23.7 million,
37
Quarterly Cash Collections(1)
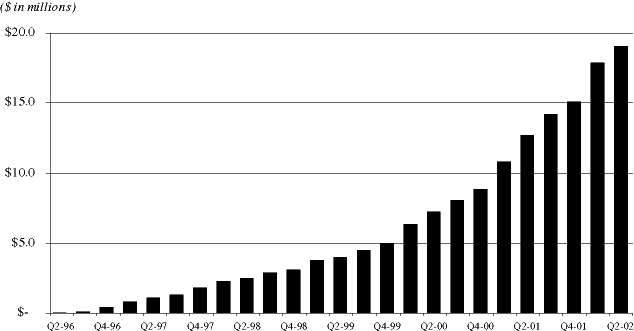
| (1) | Includes cash collections on finance receivables only. Excludes commission fees and cash proceeds from sales of defaulted consumer receivables. |
Industry Overview
The accounts receivable management industry is growing, driven by increasing levels of consumer obligations, increasing charge-offs of the underlying receivables by credit originators and increasing utilization of third-party providers to execute the recovery of defaulted receivables. According to the U.S. Federal Reserve Board, consumer credit, which consists of non-real estate related short- and intermediate-term credit extended to individuals, had grown approximately 37% to $1.7 trillion on June 30, 2002 from $1.2 trillion on December 31, 1997. According to the Consumer Bankers Association, the delinquency rate on non-mortgage consumer obligations reached its highest level in a decade at December 31, 2001, an approximately 33% increase from December 31, 2000. Collections & Credit Risk, an industry publication, estimates that consumer credit charge-offs during 2001 totaled $60 billion. Meanwhile, according to the Nilson Report, a credit card industry newsletter, credit originators outsourced an estimated $135 billion in defaulted consumer receivables for collection in 2000, nearly double the $73 billion outsourced for collection in 1990.
The accounts receivable management industry (owned portfolio and contingent fee) is highly fragmented and competitive, consisting of approximately 6,000 consumer and commercial agencies. In recent years, the accounts receivable management industry has increased its use of technology in order to operate more effectively and leading companies utilize proprietary databases and portfolio evaluation programs, automated predictive dialers, automated call distributors and computerized skip-tracing capabilities. We expect the increasing importance of technology and the associated increased capital requirements to cause challenges for many smaller participants lacking the required capital and management resources to implement and effectively utilize such technology to compete effectively and to continue to maintain regulatory standards.
38
The accounts receivable management industry services credit originators including banks, healthcare providers, utilities, telecommunications providers, consumer finance companies, retail businesses and auto lenders. The dollar amount of defaulted receivables being sold or placed for collection by credit originators typically increases with the level of consumer obligations during periods of relative economic strength. However, during periods of relative economic weakness, the extent to which consumer obligations decline tends to be partially offset by a corresponding higher default rate.
Historically, credit originators have sought to limit credit losses either through using internal collection efforts with their own personnel or outsourcing collection activities to accounts receivables management providers. Credit originators that have outsourced the collection of defaulted receivables have typically remained committed to third-party providers as a result of the perceived economic benefit of outsourcing and the resources required to reestablish the infrastructure required to support in-house collection efforts. The credit originator can pursue an outsourced solution by either selling their defaulted receivables for immediate cash proceeds or by placing defaulted receivables with an outsourced provider on a contingent fee basis while retaining ownership of the receivables. The Kaulkin Report estimates that the contingent fee market accounts for $7.5 billion, or 68%, of the market while the purchased receivables market accounts for the remaining $3.6 billion, or 32%, of the market. Further, the Kaulkin Report estimates that in 2000 the face value of purchased receivables increased 20% to $60 billion from $50 billion in 1999 while the contingent fee market is estimated to be growing at 9% annually.
In the event that a credit originator sells receivables to an accounts receivables management company such as Portfolio Recovery Associates, the credit originator receives immediate cash proceeds and eliminates the related fixed and variable costs associated with internal recovery operations. The discounted amount received by the credit originator typically ranges from one to ten percent of the face amount of the receivables, depending on the amount the purchaser anticipates it can recover and the anticipated effort required to recover that amount. Credit originators have developed a variety of processes in which to sell their receivables. Some credit originators pursue an auction-type sales approach in which they obtain bids for specified portfolios from competing parties. Receivables are also sold in privately-negotiated transactions between the credit originator and a purchaser. In addition, many credit originators enter into forward flow contracts. Forward flow contracts commit a credit originator to sell, and purchasers to acquire, a steady flow of defaulted consumer receivables periodically over a specified period of time, usually no less than one year, for a fixed percentage of the face amount of the receivables.
As an alternative to selling defaulted receivables, a credit originator can place receivables with an outsourced accounts receivable management provider on a commission fee basis for a typical period of four to six months, or as long as nine months or more if there have been previous collection efforts. The commission fee paid to the provider is based on the likely collectibility of the defaulted consumer receivables principally is driven by the duration of the receivables past due status and typically has ranged from 15% to 50%.
We believe an outsourced provider’s ability to successfully collect payments on defaulted receivables, despite previous collection efforts by the credit originator, is driven by several factors including the ability to:
| • | pursue collections over multi-year periods; | |
| • | tailor flexible repayment plans based on a consumer’s ability to pay; and | |
| • | utilize cumulative experience and resources, including litigation, reflecting their strategic focus on maximizing collections of defaulted receivables as their core business. |
Competitive Strengths
Complete Outsourced Solution for Credit Originators
We offer credit originators a complete outsourced solution to address their defaulted consumer receivables. Depending on a credit originator’s timing and needs, we can either purchase from the credit
39
Disciplined and Proprietary Underwriting Process
One of the key components of our growth has been our ability to price portfolio acquisitions at levels that have generated profitable returns on investment. To date, we have consistently been able to collect at a rate of 2.5 to 3.0 times our purchase price for defaulted consumer receivables portfolios, as measured over a five-year period, which has enabled us to generate increasing profits and cash flow. Since October 2001, we have funded portfolio acquisitions primarily out of cash flow generated from our collection activities. In order to price portfolios and forecast the targeted collection results for a portfolio, we use two separate statistical models developed internally that are often supplemented with on-site due diligence of the credit originator’s collection process and loan files. As we collect on our portfolios, the results are input back into the models in an ongoing process which we believe increases their accuracy. Through June 30, 2002 our management team has acquired 292 portfolios with a face value of more than $4.2 billion.
Ability to Hire, Develop and Retain Productive Collectors
In an industry characterized by high turnover, our ability to hire, develop and retain effective collectors is a key to our continued growth and profitability. We have found that tenure is a primary driver of our collector effectiveness. We offer our collectors a competitive wage with the opportunity to receive unlimited incentive compensation based on performance, as well as an attractive benefits package and the ability to work on a flexible schedule. We have a comprehensive six week training program for most new employees and provide continuing advanced classes conducted in our four training centers. Recognizing the demands of the job, management has endeavored to create a professional and supportive environment for collectors. Furthermore, several large military bases and several telemarketing, customer service and reservation phone centers are located near our headquarters in Virginia, providing access to a large pool of trained personnel. We have also found the Hutchinson, Kansas area to provide a large potential workforce of trained personnel.
Established Systems and Infrastructure
We have devoted significant effort to developing our systems, including statistical models, databases and reporting packages, to optimize our portfolio purchases and collection efforts. In addition, our technology infrastructure is flexible, secure, reliable and redundant to ensure the protection of our sensitive data and to ensure minimal exposure to systems failure or unauthorized access. We believe that our systems and infrastructure give us meaningful advantages over our competitors. We have developed financial models and systems for pricing portfolio acquisitions, managing the collections process and monitoring operating results. We perform static pool analysis on each of our portfolios, inputting actual results back into our acquisition models, to enhance their accuracy. We monitor collection results continuously, seeking to identify and resolve negative trends immediately. Our comprehensive management reporting package is designed to fully inform the management team so that it may make timely operating decisions. This combination of hardware, software and proprietary modeling and systems has been developed by our team through years of experience in this industry and we believe provides us with an important competitive advantage from the acquisition process all the way through collection operations.
40
Strong Relationships with Major Credit Originators
We have done business with many of the top 25 consumer lenders in the United States, including 11 of the top 13 bank credit card issuers and four of the five largest store credit card issuers. We maintain an extensive marketing effort and our senior management team is in contact with known and prospective credit originators. We believe that we have earned a reputation as a reliable purchaser of defaulted consumer receivables portfolios and as responsible collectors. Further, from the perspective of the selling credit originator, the failure to close on a negotiated sale of a portfolio consumes valuable time and expense and can have an adverse effect on pricing when the portfolio is re-marketed. We have never failed to close on a transaction. Similarly, if a credit originator sells a portfolio to a group that violates industry standard collecting practices, it can taint the reputation of the credit originator. We go to great lengths to collect from consumers in a responsible, professional and lawful manner. We believe our strong relationships with major credit originators provide us with access to quality opportunities for portfolio purchases and contingent fee collection placements.
Experienced Management Team
We have an experienced management team with considerable expertise in the accounts receivable management industry. We were formed in March 1996 by four members of senior management that continue to lead us. Prior to our formation, the founders played key roles in the development and management of a consumer receivables acquisition and divestiture operation of Household Recovery Services, a subsidiary of Household International. As we have grown, our founders have expanded the management team with a group of successful, seasoned executives. Following this offering, our management team will own approximately 19% of our common stock on a fully diluted basis.
Growth Opportunities
Continue to Develop and Retain Collectors
Based on our experience, collectors working on our owned portfolios who have been with us for more than 12 months are 90% more productive than collectors with less tenure. As we have grown, we have been able to increase the number of collectors with more than 12 months of tenure dramatically. Since August 1999, we have increased the number of collectors with more than 12 months of tenure from 28 to 254. We believe this leads directly to higher cash collections and higher operating margins. As of September 30, 2002, our base of existing collectors working on our owned portfolios is 452 persons, with an additional 48 collectors working on our contingent fee collections operations. We intend to maintain our historical controlled growth in the number of collectors we add. Accordingly, we expect the percentage of collectors with more than 12 months of experience will increase, which we believe will drive our productivity and profitability.
Maintain Conservative Capitalization for Portfolio Acquisitions
The additional equity capital from this offering will allow us to continue to capitalize our portfolio acquisitions conservatively. As we continue to grow off a larger base of acquired portfolios, we will continue to capitalize them prudently. This helps ensure that we do not allow growth in our acquired portfolios to outpace growth in our collector base, and thus our ability to collect effectively and profitably on our acquired portfolios. We believe our capitalization and access to funds provides us with an advantage as we continue to be opportunistic purchasers of diversified pools of defaulted consumer receivables.
Increase Share in Growing Market
The Kaulkin Report estimates that the market for outsourced accounts receivables management is growing at a rate of 14% per year. The growth is driven by increasing levels of consumer obligations, higher default rates and increasing use of third-party providers by credit originators to collect their defaulted receivables. The accounts receivable management industry is highly fragmented, with more than 6,000 companies providing a range of services across a broad spectrum of sophistication. We believe that
41
Leverage Expertise into Other Asset Types
To date, we have focused primarily on defaulted consumer credit card related receivables. We have also had profitable experiences with defaulted consumer receivables related to auto finance companies, retail finance, student loans, retail oil and gas, long-distance telephone, consumer finance and small business commercial debt. We expect to continue seeking opportunities to leverage our portfolio purchasing and collections expertise in these and other asset types. It is our intention to enter into new asset types, or expand our exposure to certain asset types with which we have had limited experience, in a controlled and disciplined way. We expect to continue to make small purchases with new asset types as we build our base of purchasing and collections expertise. Potential markets in which we may expand include receivables related to utilities, healthcare and specialty retail. Our success in new receivables markets will be dictated by our ability to price the receivables accurately and collect them effectively and profitably.
Grow Our Contingent Fee Collections Operations
We commenced our contingent fee collections operations in March 2001. The capability to perform collections on a commission fee basis allows us to offer a complete outsourced solution to credit originators while leveraging our existing infrastructure, skill set, personnel and client relationships. We have experienced increased operating performance since commencing our contingent fee collections operations, which has generated positive operating income for the first six months of 2002. As of September 30, 2002, we have entered into contingent fee collection arrangements with 11 clients, four of which are credit originators from whom we have purchased portfolios from in the past. We currently anticipate that we will expand our contingent fee collections operations as we add collectors and offer credit originators the choice of selling their portfolios or having us service the accounts on a commission fee basis.
Leverage Existing Infrastructure and Management Team
We have made substantial investments in technology, infrastructure and systems since our formation. In addition, we have a full management team in place that we believe is capable of leading our growth in the foreseeable future. As a result, we are capable of acquiring and servicing substantially larger volumes of defaulted consumer receivables without incurring proportional increases in fixed costs. In 2001, a 67% increase in revenues generated a 104% increase in income from operations.
Explore Selected Acquisitions
We will evaluate opportunities to make acquisitions of companies or group hires. We will primarily seek opportunities that would add new skill sets, such as expertise in pricing new asset types. We would also seek opportunities that will bring us strong credit originator relationships, collection facilities and access to skilled collectors.
Portfolio Acquisitions
Our portfolio of defaulted consumer receivables includes a diverse set of accounts that can be segmented by asset type, age and size of account, level of previous collection efforts and geography. To identify attractive buying opportunities, we maintain an extensive marketing effort with our senior officers contacting known and prospective sellers of defaulted consumer receivables. We acquire receivables of Visa®, MasterCard® and Discover® credit cards, private label credit cards, installment loans, lines of credit, deficiency balances of various types and legal judgments, all from a variety of credit originators. These credit originators include major banks, credit unions, consumer finance companies, retailers and auto finance companies. In addition, we exhibit at trade shows, advertise in a variety of trade publications and
42
| Finance | |||||||||||||||||||||||||
| Receivables, | |||||||||||||||||||||||||
| No. of | Face Value of Defaulted | net as of | |||||||||||||||||||||||
| Asset Type | Accounts | % | Consumer Receivables | % | June 30, 2002 | % | |||||||||||||||||||
| Visa/MasterCard/Discover | 788,193 | 52.8 | % | $ | 2,838,080,351 | 68.0 | % | $ | 32,138,015 | 63.0 | % | ||||||||||||||
| Consumer Finance | 232,982 | 15.6 | 519,715,923 | 12.5 | 4,717,012 | 9.2 | |||||||||||||||||||
| Private Label Credit Cards | 462,924 | 31.0 | 784,802,399 | 18.8 | 14,200,071 | 27.8 | |||||||||||||||||||
| Auto Deficiency | 8,643 | 0.6 | 27,557,659 | 0.7 | 4 | 0.0 | |||||||||||||||||||
Total | 1,492,742 | 100.0 | % | $ | 4,170,156,332 | 100.0 | % | $ | 51,055,102 | 100.0 | % | ||||||||||||||
We have done business with many of the largest 25 consumer lenders in the United States, including 11 of the top 13 largest bank credit card issuers and four of the top five store credit card issuers. Since our formation, we have purchased accounts from approximately 40 credit originators. We currently have one forward flow contract with a major retail credit originator which we believe will account for more than 10% of our revenues in 2002.
We have acquired portfolios at various price levels, depending on the age of the portfolio, its geographic distribution, our historical experience with a certain asset type or credit originator and similar factors. A typical defaulted consumer receivables portfolio ranges from $3.0 to $50.0 million in face value and contains defaulted consumer receivables from diverse geographic locations with average initial individual account balances of $2,500 to $6,000.
The age of a defaulted consumer receivables portfolio (i.e., the time since an account has been charged-off) is an important factor in determining the maximum price at which we will purchase a receivables portfolio. Generally, there is an inverse relationship between the age of a portfolio and the price that we will purchase the portfolio. This relationship is due to the fact that older receivables typically are more difficult to collect. The accounts receivables management industry places receivables into categories depending on the number of collection agencies that have previously attempted to collect on the receivables. Fresh accounts are typically past due 120 to 270 days and charged-off by the credit originator that are either being sold prior to any post-charge-off collection activity or are placed with a third-party for the first time. These accounts typically sell for the highest purchase price. Primary accounts are typically 270 to 360 days past due, have been previously placed with one contingent fee servicer and receive a lower purchase price. Secondary and tertiary accounts are typically more than 360 days past due, have been placed with two or three contingent fee servicers and receive even lower purchase prices. As shown in the following chart, as of June 30, 2002 a majority of our portfolios are primary and secondary accounts but we purchase or service accounts at any point in the delinquency cycle.
| Finance | |||||||||||||||||||||||||
| Receivables, | |||||||||||||||||||||||||
| No. of | Face Value of Defaulted | net as of | |||||||||||||||||||||||
| Account Type | Accounts | % | Consumer Receivables | % | June 30, 2002 | % | |||||||||||||||||||
| Fresh | 111,945 | 7.5 | % | $ | 407,881,470 | 9.8 | % | $ | 7,360,865 | 14.4 | % | ||||||||||||||
| Primary | 318,281 | 21.3 | 1,107,552,545 | 26.6 | 15,244,209 | 29.9 | |||||||||||||||||||
| Secondary | 644,725 | 43.2 | 1,509,814,635 | 36.2 | 23,001,231 | 45.1 | |||||||||||||||||||
| Tertiary | 243,351 | 16.3 | 601,177,224 | 14.4 | 3,190,451 | 6.2 | |||||||||||||||||||
| Other | 174,440 | 11.7 | 543,730,458 | 13.0 | 2,258,346 | 4.4 | |||||||||||||||||||
Total | 1,492,742 | 100.0 | % | $ | 4,170,156,332 | 100.0 | % | $ | 51,055,102 | 100.0 | % | ||||||||||||||
We also review the geographic distribution of accounts within a portfolio because we have found that certain states have more debtor-friendly laws than others and, therefore, are less desirable from a collectibility perspective. In addition, economic factors and bankruptcy trends vary regionally and are
43
| No. of | Face Value of Defaulted | ||||||||||||||||
| Geographic Distribution | Accounts | % | Consumer Receivables | % | |||||||||||||
| California | 167,665 | 11 | % | $ | 518,735,166 | 12 | % | ||||||||||
| Texas | 178,616 | 12 | 495,065,527 | 12 | |||||||||||||
| Florida | 139,696 | 9 | 412,434,098 | 10 | |||||||||||||
| New York | 116,256 | 8 | 366,749,602 | 9 | |||||||||||||
| Pennsylvania | 64,708 | 4 | 180,462,342 | 4 | |||||||||||||
| New Jersey | 45,729 | 3 | 141,946,362 | 3 | |||||||||||||
| Massachusetts | 43,156 | 3 | 130,150,283 | 3 | |||||||||||||
| Illinois | 48,270 | 3 | 128,500,519 | 3 | |||||||||||||
| Ohio | 46,529 | 3 | 119,607,248 | 3 | |||||||||||||
| North Carolina | 46,343 | 3 | 114,892,653 | 3 | |||||||||||||
| Georgia | 39,958 | 3 | 103,271,521 | 2 | |||||||||||||
| Michigan | 39,728 | 3 | 101,593,767 | 2 | |||||||||||||
| Maryland | 26,380 | 2 | 79,199,124 | 2 | |||||||||||||
| Virginia | 28,038 | 2 | 74,644,900 | 2 | |||||||||||||
| Tennessee | 28,283 | 2 | 69,678,497 | 2 | |||||||||||||
| Missouri | 26,306 | 2 | 69,028,011 | 2 | |||||||||||||
| Connecticut | 19,501 | 1 | 66,958,612 | 2 | |||||||||||||
| Arizona | 22,296 | 1 | 64,391,227 | 2 | |||||||||||||
| South Carolina | 25,346 | 2 | 63,663,770 | 2 | |||||||||||||
| Other | 339,938 | 23 | 869,183,101 | 20 | %(1) | ||||||||||||
Total | 1,492,742 | 100 | % | $ | 4,170,156,332 | 100 | % | ||||||||||
| (1) | Each state included in “Other” represents under 2% of the face value of total defaulted consumer receivables. |
Purchasing Process
We acquire portfolios from credit originators through both an auction and a negotiated sale process. In an auction process, the credit originator will assemble a portfolio of receivables and seek purchase prices from specifically invited potential purchasers. In a privately negotiated sale process, the credit originator will contact known, reputable purchasers directly and negotiate the terms of sale. On a limited basis, we also acquire accounts in forward flow contracts. We currently have one such contract. Under a forward flow contract, we agree to purchase defaulted consumer receivables from a credit originator on a periodic basis, at a set percentage of face value of the receivables over a specified time period. These agreements typically have a provision requiring that the attributes of the receivables to be sold will not significantly change each month and that the credit originator’s efforts to collect these receivables will not change. If this provision is not provided for, the contract will allow for the early termination of the forward flow contract by the purchaser. Forward flow contracts are a consistent source of defaulted consumer receivables for accounts receivables management providers and provide the credit originators with a reliable source of revenue and a professional resolution of defaulted consumer receivables.
In a typical sale transaction, a credit originator distributes a computer disk or data tape containing 10 to 15 basic data fields on each receivables account in the portfolio offered for sale. Such fields typically include the consumer’s name, address, outstanding balance, date of charge-off, date of last payment and the date the account was opened. We perform our initial due diligence on the portfolio by electronically cross-checking the data fields on the computer disk or data tape against the accounts in our owned
44
In order to determine a maximum purchase price for a portfolio, we use computer models developed internally that often are supplemented with on-site due diligence of the credit originator’s collection operation and/or a review of their loan origination files, collection notes and work processes. We analyze the portfolio using our proprietary multiple regression model, which analyzes the broad characteristics of the portfolio by comparing it to portfolios we have previously acquired to determine collectibility at fixed periods in the future. In addition, we analyze the portfolio using an adjustment model, which uses an appropriate cash flow model depending upon whether it is a purchase of fresh, primary, secondary or tertiary accounts. We then make adjustments to the cash flow model to compensate for demographic attributes supported by detailed analysis of demographic data. This process yields our quantitative purchasing analysis used to help price transactions and prioritize collection work efforts subsequent to purchase. With respect to prospective forward flow contracts and other long-term relationships, in addition to the procedures outlined above, we may obtain a small test portfolio to evaluate and compare the characteristics of the portfolio to the assumptions we developed in our purchasing analysis.
Our due diligence and portfolio review results in a comprehensive analysis of the proposed portfolio. This analysis compares defaulted consumer receivables in the prospective portfolio with our collection history in similar portfolios. We then summarize all anticipated cash collections and associated direct expenses and project a collectibility value expressed both in dollars and liquidation percentage and a detailed expense projection over the portfolio’s estimated five-year economic life. We use the total projected collectibility value to determine an appropriate purchase price.
We maintain detailed static pool analysis on each portfolio that we have acquired, capturing all demographic data and revenue and expense items for further analysis. We use the static pool analysis to refine the underwriting models that we use to price future portfolio purchases. The results of the static pool analysis are input back into our models, increasing the accuracy of the models as the data set increases with every portfolio purchase and each day’s collection efforts.
The quantitative and qualitative data derived in our due diligence is evaluated together with our knowledge of the current defaulted consumer receivables market and any subjective factors that management may know about the portfolio or the credit originator. A portfolio acquisition approval memorandum is prepared for each prospective portfolio before a purchase price is submitted to a credit originator. This approval memorandum, which outlines the portfolio’s anticipated collectibility and purchase structure, is distributed to members of our investment committee. The approval by the committee sets a maximum purchase price for the portfolio.
Once a portfolio purchase has been approved by our investment committee and the terms of the sale have been agreed to with the credit originator, the acquisition is documented in an agreement that contains customary terms and conditions. Provisions are incorporated for bankrupt, disputed, fraudulent or deceased accounts and typically, the credit originator either agrees to re-purchase these accounts or replace them with acceptable replacement accounts within certain time frames.
Collection Operations
Our work flow management system places, recalls and prioritizes accounts in collectors’ work queues, based on our analyses of our accounts and other demographic, credit and prior work collection attributes. We use this process to focus our work effort on those consumers most likely to pay on their accounts and to rotate to other collectors the non-paying accounts from which other collectors have been unsuccessful in receiving payment. The majority of our collections occur as a result of telephone contact with consumers.
The age of a newly acquired portfolio will determine collection strategy. For example, we will obtain credit reports for many of fresh accounts and those accounts will be sent immediately to collectors’ work queues. Alternatively, we will send only those tertiary accounts with the highest perceived collectibility to
45
When a collector establishes contact with a consumer, the account information is placed automatically in the collector’s work queue. Our computer system allows each collector to view all the scanned documents relating to the consumer’s account, which typically includes the original account application and payment checks. A typical collector work queue may include 650 to 1,000 accounts, depending on the skill level of the collector. The work queue is depleted and replenished automatically by our computerized work flow system.
On the initial contact call, the consumer is given a standardized presentation regarding the benefits of resolving his or her account with us. Emphasis is placed on determining the reason for the consumer’s default in order to better assess the consumer’s situation and create a plan for repayment. The collector is incentivized to have the consumer pay the full balance of the account. If the collector cannot obtain payment of the full balance, the collector will suggest a three to four month payment plan or a reduced lump-sum settlement. If the consumer elects to utilize an installment plan, we have developed a system to make monthly withdrawals from a consumer’s bank account. Furthermore, we will settle the consumer’s obligations for less than the full balance, and each collector is authorized to make settlements above a threshold percentage or with the authorization of our Director of Operations.
If a collector is unable to establish contact with a consumer based on information received, the collector must undertake skip tracing procedures to develop important account information. Skip tracing is the process of developing new phone, address, job or asset information on a consumer. Each collector does his or her own skip tracing using a number of computer applications available at his or her workstation, as well as a series of automated skip tracing procedures implemented by us on a regular basis.
Accounts for which the consumer is not cooperative and for which we can establish a garnishable job or attachable asset are reviewed for legal action. Depending on the balance of the defaulted consumer receivable and the applicable state collection laws, we determine whether to commence legal action to collect on the receivable. The legal process can take an extended period of time, but it also generates cash collections that likely would not have been realized otherwise.
Our legal recovery department oversees and coordinates an independent nationwide collections attorney network which is responsible for the preparation and filing of judicial collection proceedings in multiple jurisdictions, determining the suit criteria, coordinating sales of property and instituting wage garnishments to satisfy judgments. This network consists of approximately 70 independent law firms who work on a contingent fee basis. Our legal department also processes proofs of claims for recovery on receivables which are included in consumer bankruptcies filed under Chapter 13 of the U.S. Bankruptcy Code, and submits claims against estates in cases involving deceased debtors having assets at the time of death. Legal cash collections currently constitute approximately 20% of our total collections. As our portfolio matures, a larger number of accounts will be directed to our Legal Recovery Department for judicial collection; consequently, we anticipate that legal cash collections will grow commensurately and comprise a considerably larger percentage of our total cash collections.
Contingent Fee Collections Operations
In order to provide credit originators with alternative collection solutions and to capitalize on common competencies between a contingent fee collections operation and an acquired receivables portfolio business, we commenced our third-party contingent fee collections operations in March 2001. In a contingent fee arrangement, clients typically place defaulted receivables with an outsourced provider once they have been deemed non-collectible. The clients then pay the third-party agency a commission fee based upon the amount actually collected from the consumer. A contingent fee placement of defaulted consumer receivables is usually for a fixed time frame, typically four to six months, or as long as nine months or more if there have been previous collection efforts. At the end of this fixed period, the third-party agency will return the uncollected defaulted consumer receivables to the client, which may then place the defaulted consumer receivables with another collection agency or sell the portfolio receivables.
46
The determination of the commission fee to be paid for third-party collections is generally based upon the potential collectibility of the defaulted consumer receivables being assigned for placement. For example, if there has been no prior third-party collection activity with respect to the defaulted consumer receivables, the commission fee would be lower than if there had been one or more previous collection agencies attempting to collect on the receivables. The earlier the placement of defaulted consumer receivables in the collection process, the higher the probability of receiving a cash collection and, therefore, the lower the cost to collect and the lower the commission fee. Other factors, such as the location of the consumers, the size of the defaulted consumer receivables and the clients’ collection procedures and work standards also contribute to establishing a commission fee.
Once a defaulted consumer receivable has been placed with us, the collection process operates in a slightly different manner than with our portfolio acquisition business. Servicing time limitations imposed by our clients require a greater emphasis on immediate settlements and larger down payments, compared to much longer term repayment plans common with our owned portfolios of defaulted consumer receivables. In addition, work standards are often dictated by our clients. While our contingent fee collections operations utilize their own collectors and collection system, we have been able to leverage the portfolio acquisition business’ infrastructure, existing facilities and skill set of our management team to provide support for this business operation. The leveraged competencies of the portfolio acquisition business include our sophisticated technology systems and training techniques.
Competition
We face competition in both of the markets we serve — owned portfolio and contingent fee accounts receivable management — from new and existing providers of outsourced receivables management services, including other purchasers of defaulted consumer receivables portfolios, third-party contingent fee collection agencies and credit originators that manage their own defaulted consumer receivables rather than outsourcing them. The accounts receivable management industry (owned portfolio and contingent fee) is highly fragmented and competitive, consisting of approximately 6,000 consumer and commercial agencies. We estimate that more than 90% of these agencies compete in the contingent fee market, based upon The Debt Buyers’ Association current membership. There are few significant barriers for entry to new providers of contingent fee receivables management services and, consequently, the number of agencies serving the contingent fee market may continue to grow. Greater capital needs and the need for portfolio evaluation expertise sufficient to price portfolios effectively constitute significant barriers for entry to new providers of owned portfolio receivables management services. Based on the Nilson Report’s estimate that $135 billion of defaulted consumer receivables were outsourced for collection in 2000, we believe that we possess less than a 1% market share.
We face bidding competition in our acquisition of defaulted consumer receivables and in our obtaining placement of contingent fee receivables. We also compete on the basis of reputation, industry experience and performance. Among the positive factors which we believe influence our ability to compete effectively in this market are our ability to bid on portfolios at appropriate prices, our reputation from previous transactions regarding our ability to close transactions in a timely fashion, our relationships with originators of defaulted consumer receivables, our team of well-trained collectors who provide quality customer service and compliance with applicable collections laws, our ability to collect on various asset types and our ability to provide both purchased and contingent fee solutions to credit originators. Among the negative factors which we believe influence our ability to compete effectively in this market are that some of our current competitors and possible new competitors may have substantially greater financial, personnel and other resources, greater adaptability to changing market needs, longer operating histories and more established relationships in our industry than we currently have.
In the future, we may not have the resources or ability to compete successfully. Some of our competitors have substantially greater financial, personnel and other resources, and there can be no assurance that additional competitors with greater resources than ours will not enter our market. Moreover, there can be no assurance that our existing or potential clients will continue to outsource their defaulted consumer receivables at recent levels or at all, or that we may continue to offer competitive bids for
47
Information Technology
Technology Operating Systems and Server Platform
The scalability of our systems provides us with a technology system that is flexible, secure, reliable and redundant to ensure the protection of our sensitive data. We utilize Intel-based servers running industry standard open systems coupled with Microsoft Windows 2000 and NT Server operating systems. In addition, we utilize a blend of purchased and proprietary software systems tailored to the needs of our business. These systems are designed to eliminate inefficiencies in our collections, continue to meet business objectives in a changing environment and meet compliance obligations with regulatory entities. We believe that our combination of purchased and proprietary software packages provide collections automation that is superior to our competitors.
Network Technology
To provide delivery of our applications, we utilize Intel-based workstations across our entire business operations. The environment is configured to provide speeds of 100 megabytes to the desktops of our collections and administration staff. Our one gigabyte server network architecture supports high-speed data transport. Our network system is designed to be scalable and meet expansion and inter-building bandwidth and quality of service demands.
Database Systems
The ability to access and utilize data is essential to our being able to operate nationwide in a cost-effective manner. Our centralized computer-based information systems support the core processing functions of our business under a set of integrated databases and are designed to be both replicable and scalable to accommodate our internal growth. This integrated approach helps to assure that consistent sources are processed efficiently. We use these systems for portfolio and client management, skip tracing, check taking, financial and management accounting, reporting, and planning and analysis. The systems also support our consumers, including on-line access to address changes, account status and payment entry. We use a combination of Microsoft, Oracle and Cache database software to manage our portfolios, financial, customer and sales data, and we believe these systems will be sufficient for our needs for the foreseeable future. Our contingent fee collections operations database incorporates an integrated and proprietary predictive dialing platform used with our predictive dialer discussed below.
| Redundancy, System Backup, Security and Disaster Recovery |
Our data centers provide the infrastructure for innovative collection services and uninterrupted support of hardware and server management, server co-location and an all-inclusive server administration for our business. We believe our facilities and operations include sufficient redundancy, file back-up and security to ensure minimal exposure to systems failure or unauthorized access. The preparations in this area include the use of call centers in Virginia and in Kansas in order to help provide redundancy for data and processes should one site be completely disabled. We have a comprehensive disaster recovery plan covering our business that is tested on a periodic basis. The combination of our locally distributed call control systems provides enterprise-wide call and data distribution between our call centers for efficient portfolio collection and business operations. In addition to real-time replication of data between the sites, incremental backups of both software and databases are performed on a daily basis and a full system backup is performed weekly. Backup data tapes are stored at an offsite location along with copies of schedules and production control procedures, procedures for recovery using an off-site data center, documentation and other critical information necessary for recovery and continued operation. Our Virginia headquarters has two separate power and telecommunications feeds, uninterruptible power supply and a
48
| Plasma Displays for Real Time Data Utilization |
We utilize plasma displays at our main facility to aid in recovery of portfolios. The displays provide real-time business-critical information to our collection personnel for efficient collection efforts such as telephone, production, employee status, goal trending, training and corporate information.
Dialer Technology
The Noble Systems Predictive Dialer ensures that our collection staff focuses on certain defaulted consumer receivables according to our specifications. Our predictive dialer takes account of all campaign and dialing parameters and is able to constantly adjust its dialing pace to match changes in campaign conditions and provide the lowest possible wait times on abandoned calls.
Employees
We employed 598 persons on a full-time basis, including 452 collectors on our owned portfolios and an additional 48 collectors working in our contingent fee collections operations, as of September 30, 2002. None of our employees are represented by a union or covered by a collective bargaining agreement. We believe that our relations with our employees are good.
Hiring
We recognize that our collectors are critical to the success of our business as a majority of our collection efforts occur as a result of telephone contact with consumers. We have found that the tenure and productivity of our collectors are directly related. Therefore, attracting, hiring, training, retaining and motivating our collection personnel is a major focus for us. We pay our collectors competitive wages and offer employees a full benefits program which includes comprehensive medical coverage, short and long term disability, life insurance, dental and vision coverage, an employee assistance program and a matching 401(k) program. In addition to a base wage, we provide collectors with the opportunity to receive unlimited compensation through an incentive compensation program that pays bonuses above a set monthly base, based upon each collector’s collection results. This program is designed to ensure that employees are paid based not only on performance, but also on consistency. We believe that these practices have enabled us to achieve an annual post-training turnover rate of 34%.
A large number of telemarketing, customer-service and reservation phone centers are located near our Virginia headquarters. We believe that we offer a higher base wage than many local employers and therefore have access to a large number of trained personnel. In addition, there are approximately 100,000 active-duty military personnel in the area. We employ numerous military spouses and retirees and find them to be excellent employees. We have also found the Hutchinson, Kansas area to provide a large potential workforce of trained personnel.
Training
We provide a comprehensive six-week training program for all new collectors. The first three weeks of the training program is comprised of lectures to learn collection techniques, state and federal collection laws, systems, negotiation skills, skip tracing and telephone use. These sessions are then followed by an additional three weeks of practical experience conducting live calls with additional managerial supervision in order to provide employees with confidence and guidance while still contributing to our profitability. Each trainee must successfully pass a comprehensive examination before being assigned to the collection floor. In addition, we conduct continuing advanced classes in our four training centers. Our technology and systems allow us to monitor individual employees and then offer additional training in areas of deficiency
49
Legal
Legal Recovery Department
An important component of our collections effort involves our legal recovery department and the judicial collection of accounts of customers who have the ability, but not the willingness, to resolve their obligations. Our legal recovery department oversees and coordinates an independent nationwide attorney network which is responsible for the preparation and filing of judicial collection proceedings in multiple jurisdictions, determining the suit criteria, coordinating sales of property and instituting wage garnishments to satisfy judgments. This nationwide collections attorney network consists of approximately 70 independent law firms. Our legal recovery department also submits claims against estates in cases involving deceased debtors having assets at the time of death, and processes proofs of claims for recovery on accounts which are included in consumer bankruptcies filed under Chapter 13 of the U.S. Bankruptcy Code. Recent proposed amendments to federal bankruptcy laws, if passed, will very likely have an impact upon our operations. The amendments, which, among other things, establish income criteria for the filing of a Chapter 7 bankruptcy petition, are expected to cause more debtors to file bankruptcy petitions under Chapter 13, rather than Chapter 7 of the U.S. Bankruptcy Code. Consequently, we expect that fewer debtors will be able to have their obligations completely discharged in Chapter 7 bankruptcy actions, and will instead enter into the payment plans required by Chapter 13. We expect that this will enable us to generate recoveries from a larger number of bankrupt debtors through the filing of proofs of claims with bankruptcy trustees.
Corporate Legal Department
Our corporate legal department manages general corporate legal matters, including litigation management, contract and document preparation and review, regulatory and statutory compliance, obtaining and maintaining multi-state licensing, bonding and insurance, and dispute and complaint resolution. As a part of its compliance functions, our corporate legal department also assists with training our staff. We provide employees with extensive training on the Fair Debt Collection Practices Act and other relevant laws and regulations. Our corporate legal department distributes guidelines and procedures for collection personnel to follow when communicating with a customer, customer’s agents, attorneys and other parties during our recovery efforts. In addition, our corporate legal department regularly researches, and provides collection personnel and the training department with summaries and updates of changes in federal and state statutes and relevant case law, so that they are aware of new laws and judicial interpretations of applicable requirements and laws when tracing or collecting an account.
Regulation
Federal and state statutes establish specific guidelines and procedures which debt collectors must follow when collecting consumer accounts. It is our policy to comply with the provisions of all applicable federal laws and comparable state statutes in all of our recovery activities, even in circumstances in which we may not be specifically subject to these laws. Our failure to comply with these laws could have a material adverse effect on us in the event and to the extent that they apply to some or all of our recovery activities. Federal and state consumer protection, privacy and related laws and regulations extensively regulate the relationship between debt collectors and debtors, and the relationship between customers and credit card issuers. Significant federal laws and regulations applicable to our business as a debt collector include the following:
| • | Fair Debt Collection Practices Act.This act imposes certain obligations and restrictions on the practices of debt collectors, including specific restrictions regarding communications with consumer customers, including the time, place and manner of the communications. This act also gives consumers certain rights, including the right to dispute the validity of their obligations. |
50
| • | Fair Credit Reporting Act.This act places certain requirements on credit information providers regarding verification of the accuracy of information provided to credit reporting agencies and investigating consumer disputes concerning the accuracy of such information. We provide information concerning our accounts to the three major credit reporting agencies, and it is our practice to correctly report this information and to investigate credit reporting disputes. | |
| • | Gramm-Leach-Bliley Act.This act requires that certain financial institutions, including collection agencies, develop policies to protect the privacy of consumers’ private financial information and provide notices to consumers advising them of their privacy policies. This act also requires that if private personal information concerning a consumer is shared with another unrelated institution, the consumer must be given an opportunity to opt out of having such information shared. Since we do not share consumer information with non-related entities, except as required by law, or except as needed to collect on the receivables, our consumers are not entitled to any opt-out rights under this act. This act is enforced by the Federal Trade Commission, which has retained exclusive jurisdiction over its enforcement, and does not afford a private cause of action to consumers who may wish to pursue legal action against a financial institution for violations of this act. | |
| • | Electronic Funds Transfer Act.This act regulates the use of the Automated Clearing House (“ACH”) system to make electronic funds transfers. All ACH transactions must comply with the rules of the National Automated Check Clearing House Association (“NACHA”) and Uniform Commercial Code § 3-402. This act, the NACHA regulations and the Uniform Commercial Code give the consumer, among other things, certain privacy rights with respect to the transactions, the right to stop payments on a pre-approved fund transfer, and the right to receive certain documentation of the transaction. This act also gives consumers a right to sue institutions which cause financial damages as a result of their failure to comply with its provisions. | |
| • | Telephone Consumer Protection Act.In the process of collecting accounts, we use automated predictive dialers to place calls to consumers. This act and similar state laws place certain restrictions on telemarketers and users of automated dialing equipment who place telephone calls to consumers. | |
| • | U.S. Bankruptcy Code.In order to prevent any collection activity with bankrupt debtors by creditors and collection agencies, the U.S. Bankruptcy Code provides for an automatic stay, which prohibits certain contacts with consumers after the filing of bankruptcy petitions. |
Additionally, there are in some states statutes and regulations comparable to the above federal laws, and specific licensing requirements which affect our operations. State laws may also limit credit account interest rates and the fees, as well as limit the time frame in which judicial actions may be initiated to enforce the collection of consumer accounts.
Although we are not a credit originator, some of these laws directed toward credit originators may occasionally affect our operations because our receivables were originated through credit transactions, such as the following laws, which apply principally to credit originators:
| • | Truth in Lending Act; | |
| • | Fair Credit Billing Act; and | |
| • | Equal Credit Opportunity Act. |
Federal laws which regulate credit originators require, among other things, that credit card issuers disclose to consumers the interest rates, fees, grace periods, and balance calculation methods associated with their credit card accounts. Consumers are entitled under current laws to have payments and credits applied to their accounts promptly, to receive prescribed notices, and to require billing errors to be resolved promptly. Some laws prohibit discriminatory practices in connection with the extension of credit. Federal statutes further provide that, in some cases, consumers cannot be held liable for, or their liability is limited with respect to, charges to the credit card account that were a result of an unauthorized use of the credit card. These laws, among others, may give consumers a legal cause of action against us, or may limit our
51
The U.S. Congress and several states are currently in the process of enacting legislation concerning identity theft. Additional consumer protection and privacy protection laws may be enacted that would impose additional requirements on the enforcement of and recovery on consumer credit card or installment accounts. Any new laws, rules or regulations that may be adopted, as well as existing consumer protection and privacy protection laws, may adversely affect our ability to recover the receivables. In addition, our failure to comply with these requirements could adversely affect our ability to enforce the receivables.
We cannot assure you that some of the receivables were not established as a result of identity theft or unauthorized use of a credit card and, accordingly, we could not recover the amount of the defaulted consumer receivables. As a purchaser of defaulted consumer receivables, we may acquire receivables subject to legitimate defenses on the part of the consumer. Our account purchase contracts allow us to return to the credit originators certain defaulted consumer receivables that may not be collectible, due to these and other circumstances. Upon return, the credit originators are required to replace the receivables with similar receivables or repurchase the receivables. These provisions limit to some extent our losses on such accounts.
Facilities
Our principal executive offices and primary operations facility are located in approximately 40,000 square feet of leased space in Norfolk, Virginia and we rent two administrative facilities in Virginia Beach, Virginia that are each approximately 2,500 square feet. Our Virginia facilities can currently accommodate approximately 550 employees. We own a two-acre parcel of land across from our headquarters which we developed into a parking lot for use by our employees. In addition, we own an approximately 15,000 square foot facility in Hutchinson, Kansas that can currently accommodate approximately 100 employees. We are also in the process of seeking to secure one or more additional facilities in Virginia to accommodate an additional 250 to 300 employees. We do not consider any specific leased or owned facility to be material to our operations. We believe that equally suitable alternative facilities are available in all areas where we currently do business.
Legal Proceedings
From time to time, we are involved in various legal proceedings which are incidental to the ordinary course of our business. We regularly initiate lawsuits against consumers and are occasionally countersued by them in such actions. Also, consumers occasionally initiate litigation against us, in which they allege that we have violated a state or federal law in the process of collecting on their account. We do not believe that these routine matters represent a substantial volume of our accounts or that, individually or in the aggregate, they are material to our business or financial condition.
We have agreed to mediate a dispute concerning our acquisition of a receivables portfolio. We currently anticipate that the outcome of this mediation, even if adverse, will not have a material adverse impact on us.
We are not a party to any material legal proceedings and we are unaware of any contemplated material actions against us.
52
MANAGEMENT
Directors and Executive Officers
The following table sets forth certain information about our directors and executive officers.
| Name | Position | Age | ||||
| Steven D. Fredrickson | President, Chief Executive Officer and Chairman of the Board | 43 | ||||
| Kevin P. Stevenson | Senior Vice President, Chief Financial Officer, Treasurer and Assistant Secretary | 38 | ||||
| Craig A. Grube | Senior Vice President — Acquisitions | 42 | ||||
| Andrew J. Holmes | Senior Vice President — Administration | 55 | ||||
| James L. Keown | Senior Vice President — Information Technology | 45 | ||||
| Judith S. Scott | Senior Vice President, General Counsel and Secretary | 57 | ||||
| David N. Roberts | Director | 40 | ||||
It is currently anticipated that three additional directors, all of whom will be independent under current and proposed SEC and Nasdaq Stock Market regulations, will be appointed to our board of directors shortly after the closing of this offering.
Steven D. Fredrickson, President, Chief Executive Officer and Chairman of the Board.Prior to co-founding Portfolio Recovery Associates in 1996, Mr. Fredrickson was Vice President, Director of Household Recovery Services’ (“HRSC”) Portfolio Services Group from late 1993 until February 1996. At HRSC Mr. Fredrickson was ultimately responsible for HRSC’s portfolio sale and purchase programs, finance and accounting, as well as other functional areas. Prior to joining HRSC, he spent five years with Household Commercial Financial Services managing a national commercial real estate workout team and five years with Continental Bank of Chicago as a member of the FDIC workout department, specializing in corporate and real estate workouts. He received a B.S. degree from the University of Denver and a M.B.A. degree from the University of Illinois. He is a past board member of the American Asset Buyers Association.
Kevin P. Stevenson, Senior Vice President, Chief Financial Officer, Treasurer and Assistant Secretary.Prior to co-founding Portfolio Recovery Associates in 1996, Mr. Stevenson served as Controller and Department Manager of Financial Control and Operations Support at HRSC from June 1994 to March 1996, supervising a department of approximately 30 employees. Prior to joining HRSC, he served as Controller of Household Bank’s Regional Processing Center in Worthington, Ohio where he also managed the collections, technology, research and ATM departments. While at Household Bank, Mr. Stevenson participated in eight bank acquisitions and numerous branch acquisitions or divestitures. He is a certified public accountant and received his B.S.B.A. with a major in accounting from the Ohio State University.
Craig A. Grube, Senior Vice President — Acquisitions.Prior to joining Portfolio Recovery Associates in March 1998, Mr. Grube was a senior officer and director of Anchor Fence, Inc., a manufacturing and distribution business from 1989 to March 1997, when the company was sold. Between the time of the sale and March 1998, Mr. Grube continued to work for Anchor Fence. Prior to joining Anchor Fence, he managed distressed corporate debt for the FDIC at Continental Illinois National Bank for five years. He received his B.A. degree from Boston College and his M.B.A. degree from the University of Illinois.
Andrew J. Holmes, Senior Vice President — Administration.Prior to co-founding Portfolio Recovery Associates in 1996, Mr. Holmes was a 27-year veteran of Household Finance Corporation (“HFC”), last serving as Department Manager, Specialty Services at HRSC where he was responsible for portfolio sales and purchases. Mr. Holmes held a variety of management positions both in the lending and collection/recovery sides of various HFC businesses. He received his B.A. degree from St. Peters College.
53
James L. Keown, Senior Vice President — Information Technology.Prior to co-founding Portfolio Recovery Associates in 1996, Mr. Keown had been with HRSC for 14 years and had sales and finance experience prior to joining HRSC. Mr. Keown’s final position at HRSC was Department Manager, Technology Service where he was directly responsible for a 275 node local area network, all phone and data communications, as well as performance engineering and applications programming.
Judith S. Scott, Senior Vice President, General Counsel and Secretary. Prior to joining Portfolio Recovery Associates in March 1998, Ms. Scott held senior positions, from 1991 to March 1998, with Old Dominion University as Director of its Virginia Peninsula campus, from 1985 to 1991, as General Counsel of a computer manufacturing firm; as Senior Counsel in the Office of the Governor of Virginia from 1982 to 1985; as Senior Counsel for the Virginia Housing Development Authority from 1976 to 1982, and as Assistant Attorney General for the Commonwealth of Virginia from 1975 to 1976. Ms. Scott received her B.S. from Virginia State University, a post baccalaureate degree from Swarthmore College, and a J.D. from the Catholic University School of Law.
David N. Roberts, Director.Mr. Roberts has been a director of Portfolio Recovery Associates since its formation in 1996. Mr. Roberts joined Angelo, Gordon & Co., L.P. in 1993. He manages the firm’s private equity and special situations area and was the founder of the firm’s opportunistic real estate area. Mr. Roberts has invested in a wide variety of real estate, corporate and special situations transactions. Prior to joining Angelo Gordon, Mr. Roberts was a principal at Gordon Investment Corporation, a Canadian merchant bank from 1989 to 1993, where he participated in a wide variety of principal transactions including investments in the real estate, mortgage banking and food industries. Prior to joining Gordon Investment Corporation, he worked in the Corporate Finance Department of L.F. Rothschild where he specialized in mergers and acquisitions. He has a B.S. degree in economics from the Wharton School of the University of Pennsylvania.
Compensation of Directors
The non-employee members of the board of directors will receive compensation of $3,750 per quarter for their service on the board of directors. Directors who are employees will not receive any compensation for services performed in their capacity as directors. We will reimburse each director for reasonable out-of-pocket expenses incurred in attending meetings of the board of directors and any of its committees. In addition, directors who are not employees will be eligible to receive options under our 2002 Stock Option Plan. Under this plan, eligible directors may receive an option to purchase 5,000 shares of our common stock upon becoming a director (or in the case of Mr. Roberts, at the time of this offering) and additional shares on each anniversary of that date. Upon the appointment of three new directors, we intend to grant options to purchase in aggregate 20,000 shares of our common stock, with an exercise price equal to the then current market price per share, to our four non-employee directors.
Committees of the Board of Directors
Upon the appointment of our independent directors, our board of directors will maintain a standing audit committee, a compensation committee and a nominating and corporate governance committee. The audit committee will be responsible for recommending to the full board of directors the appointment of our independent accountants and reviewing with those accountants the scope of their audit and their report. The audit committee will also review and evaluate our accounting principles and system of internal accounting controls. The compensation committee will be responsible for acting on matters relating to the compensation of directors, senior management and key employees, including the granting of stock options. The nominating and corporate governance committee will be responsible for making recommendations to the full board of directors with respect to director nominees and monitoring corporate governance and ethical issues.
54
Executive Compensation
The following table sets forth, for the years ended December 31, 1999, 2000 and 2001, all compensation earned for services rendered in all capacities by our chief executive officer and each of our other top four executive officers whose salary and bonus exceeded $100,000 in 2001. These five officers are referred to as the “named executive officers” in this prospectus. The compensation table excludes other compensation in the form of perquisites and other personal benefits that constitute the lesser of $50,000 or 10% of the total annual salary and bonus earned by each of the named executive officers in 2001. In addition, the compensation described in this table does not include medical, group life insurance or other benefits which are available generally to all of our salaried employees.
Summary Compensation Table
| Long-Term | |||||||||||||||||
| Compensation | |||||||||||||||||
| Annual Compensation | Securities | ||||||||||||||||
| Underlying | |||||||||||||||||
| Name and Principal Position | Year | Salary($) | Bonus($) | Warrants(#)(1) | |||||||||||||
| Steven D. Fredrickson | 2001 | 181,311 | 69,750 | — | |||||||||||||
| President, Chief Executive Officer and | 2000 | 136,288 | 48,240 | 35,000 | |||||||||||||
| Chairman of the Board | 1999 | 131,684 | 40,930 | 600,000 | |||||||||||||
| James L. Keown | 2001 | 122,973 | 31,750 | — | |||||||||||||
| Senior Vice President — Information Technology | 2000 | 101,246 | 26,685 | — | |||||||||||||
| 1999 | 96,945 | 25,581 | 230,000 | ||||||||||||||
| Craig A. Grube | 2001 | 109,026 | 47,250 | — | |||||||||||||
| Senior Vice President — Acquisitions | 2000 | 95,999 | 30,791 | 15,000 | |||||||||||||
| 1999 | 85,133 | 18,479 | 300,000 | ||||||||||||||
| Kevin P. Stevenson | 2001 | 108,937 | 47,250 | — | |||||||||||||
| Senior Vice President, Chief Financial Officer, | 2000 | 96,618 | 35,923 | �� | 15,000 | ||||||||||||
| Treasurer and Assistant Secretary | 1999 | 87,203 | 32,774 | 440,000 | |||||||||||||
| Andrew J. Holmes | 2001 | 123,288 | 19,150 | — | |||||||||||||
| Senior Vice President — Administration | 2000 | 102,060 | 13,599 | — | |||||||||||||
| 1999 | 99,200 | 13,302 | 200,000 | ||||||||||||||
| (1) | In connection with the Reorganization, warrants owned by the named executive officers as shown in the above table will be exchanged for warrants to purchase the same number of shares of our common stock with the same respective exercise price. 2,110,000 warrants are immediately exercisable and have an exercise price of $4.20 per share. |
Employment Agreements
The following describe the employment agreements which we expect to enter into with each of the named executive officers soon after the consummation of this offering. All of such agreements will be effective as of the date of consummation of this offering.
Steven D. Fredrickson’s employment agreement will expire on December 31, 2005. Mr. Fredrickson’s agreement will provide for a base salary of $190,000 per year for the first year and a four percent increase each subsequent year. Mr. Fredrickson will be eligible for an annual cash incentive bonus based on our management bonus program. Mr. Fredrickson will receive options to purchase 190,000 shares of our common stock which, in accordance with his employment agreement, will vest immediately upon a change of control. The agreement will also contain confidentiality provisions, a one year non-compete covenant and a two year non-solicitation covenant. If we terminate Mr. Fredrickson without cause or if Mr. Fredrickson terminates his employment within six months following a change of control, he would receive a severance package that would include a lump-sum payment equal to (w) his then current base salary, target bonus compensation and accrued vacation pay through the date of such termination, (x) the greater of a lump-sum payment equal to two times his then current base salary or the minimum base
55
James L. Keown’s employment agreement will expire on December 31, 2005. Mr. Keown’s agreement will provide for a base salary of $105,000 per year for the first year and a four percent increase each subsequent year. Mr. Keown will be eligible for an annual cash incentive bonus based on our management bonus program. The agreement will also contain confidentiality provisions, a one year non-compete covenant and a two year non-solicitation covenant. If we terminate Mr. Keown without cause or if Mr. Keown terminates his employment within six months following a change of control, he would receive a severance package that would include a lump-sum payment equal to (w) his then current base salary, target bonus compensation and accrued vacation pay through the date of such termination, (x) the greater of a lump-sum payment equal to one times his then current base salary or the minimum base salary due under the remaining term of his employment agreement, (y) the greater of a lump-sum payment equal to one times the amount of the bonus compensation, if any, paid to him in the year immediately prior to the year of termination or the target bonus compensation due under the remaining term of the employment agreement (whether or not the target is actually met) and (z) certain benefits, including payment for COBRA benefits for the longer of three months or the remaining term of his employment agreement. In the event that Mr. Keown’s employment agreement is not renewed, he would receive a severance package that would include (i) a lump sum payment equal to his then remaining base salary, target bonus compensation and accrued vacation pay through the term renewal date, (ii) a lump sum payment equal to one-quarter times his then current base salary and (iii) certain benefits, including payment for COBRA benefits for three months.
Craig A. Grube’s employment agreement will expire on December 31, 2005. Mr. Grube’s agreement will provide for a base salary of $120,000 per year for the first year and a four percent increase each subsequent year. Mr. Grube will be eligible for an annual cash incentive bonus based on our management bonus program. Mr. Grube will receive options to purchase 105,000 shares of our common stock which, in accordance with his employment agreement, will vest immediately upon a change of control. The agreement will also contain confidentiality provisions, a one year non-compete covenant and a two year non-solicitation covenant. If we terminate Mr. Grube without cause or if Mr. Grube terminates his employment within six months following a change of control, he would receive a severance package that would include a lump-sum payment equal to (w) his then current base salary, target bonus compensation and accrued vacation pay through the date of such termination, (x) the greater of a lump-sum payment equal to two times his then current base salary or the minimum base salary due under the remaining term of his employment agreement, (y) the greater of a lump-sum payment equal to two times the amount of the bonus compensation, if any, paid to him in the year immediately prior to the year of termination or the target bonus compensation due under the remaining term of the employment agreement (whether or not the target is actually met) and (z) certain benefits, including payment for COBRA benefits for the longer of 12 months or the remaining term of his employment agreement. In the event that Mr. Grube’s employment agreement is not renewed, he would receive a severance package that would include (i) a lump sum payment equal to his then remaining base salary, target bonus compensation and accrued vacation pay through the term renewal date, (ii) a lump sum payment equal to one times his then current base salary and (iii) certain benefits, including payment for COBRA benefits for 12 months.
Kevin P. Stevenson’s employment agreement will expire on December 31, 2005. Mr. Stevenson’s agreement will provide for a base salary of $120,000 per year for the first year and a four percent increase
56
Andrew J. Holmes’ employment agreement will expire on December 31, 2005. Mr. Holmes’ agreement will provide for a base salary of $94,640 per year for the first year and a four percent increase each subsequent year. Mr. Holmes will be eligible for an annual cash incentive bonus based on our management bonus program. The agreement will also contain confidentiality provisions, a one year non-compete covenant and a two year non-solicitation covenant. If we terminate Mr. Holmes without cause or if Mr. Holmes terminates his employment within six months following a change of control, he would receive a severance package that would include a lump-sum payment equal to (w) his then current base salary, target bonus compensation and accrued vacation pay through the date of such termination, (x) the greater of a lump-sum payment equal to one times his then current base salary or the minimum base salary due under the remaining term of his employment agreement, (y) the greater of a lump-sum payment equal to one times the amount of the bonus compensation, if any, paid to him in the year immediately prior to the year of termination or the target bonus compensation due under the remaining term of the employment agreement (whether or not the target is actually met) and (z) certain benefits, including payment for COBRA benefits for the longer of three months or the remaining term of his employment agreement. In the event that Mr. Holmes’ employment agreement is not renewed, he would receive a severance package that would include (i) a lump sum payment equal to his then remaining base salary, target bonus compensation and accrued vacation pay through the term renewal date, (ii) a lump sum payment equal to one-quarter times his then current base salary and (iii) certain benefits, including payment for COBRA benefits for three months.
2002 Stock Option Plan
Our 2002 Stock Option Plan will become effective prior to the closing of this offering. We believe that the plan will promote our success and enhance our value by linking the personal interests of participants to those of our stockholders and providing an incentive for outstanding performance.
Under the plan, we may grant nonqualified or incentive stock options to our officers, directors, employees and key consultants. The plan will be administered by our compensation committee. The compensation committee will have authority to administer the plan, including the power to determine eligibility, the types and sizes of options, the price and timing of options, and any vesting, including acceleration of vesting, of options.
An aggregate of 2,000,000 shares of our common stock will be available for grant under the plan, subject to a proportionate increase or decrease in the event of a stock split, reverse stock split, stock
57
The members of the board of directors have previously approved the grant of options to the following executive officers at an exercise price equal to the initial public offering price as shown in the following table:
| Name | Number of Shares | |||
| Steven D. Fredrickson | 190,000 | |||
| Kevin P. Stevenson | 105,000 | |||
| Craig A. Grube | 105,000 | |||
| James L. Keown | 10,000 | |||
| Judith S. Scott | 25,000 | |||
Upon the appointment of independent directors and the formation of a compensation committee, options will be granted to our non-employee directors as described under the caption “Compensation of Directors” above. The plan will be approved by the members of Portfolio Recovery Associates, L.L.C. in connection with the Reorganization. The compensation committee may terminate or amend the plan to the extent stockholder approval is not required by law. Termination or amendment will not adversely affect options previously granted under the plan.
Indemnification of Directors and Officers
We are obligated in some situations, under our certificate of incorporation and by-laws to indemnify each of our directors and officers to the fullest extent permitted by Delaware law. We must indemnify our directors and officers with respect to all expenses, liability and losses reasonably incurred or suffered in any action, suit or proceeding in which the person was or is made or threatened to be made a party or is otherwise involved by reason of the fact that the person is or was our director or officer. We are obligated to pay the reasonable expenses of the directors or officers incurred in defending the proceedings if the indemnified party agrees to repay all amounts advanced by us if it is ultimately determined that the indemnified party is not entitled to indemnification. We also maintain customary insurance covering directors and officers. See “Description of Capital Stock — Limitations on Liability of Officers and Directors.”
CERTAIN RELATIONSHIPS AND RELATED TRANSACTIONS
On December 30, 1999, we entered into a $12.5 million credit agreement with AG PRA 1999 Funding Co., LLC (“AG 1999”) that expired on June 30, 2002. Terms of the agreement included the possibility of AG 1999 earning contingent interest. AG 1999 is owned by affiliates of Angelo Gordon, our majority stockholder, and by Steven Fredrickson, Craig Grube and David Roberts. Over the term of the agreement we borrowed $6.6 million. In December 2001, we paid off all outstanding loans under this agreement and incurred an expense of $300,000 to extinguish the contingent interest provision. In addition, in accordance with this agreement we granted AG 1999 warrants to purchase 125,000 membership units of Portfolio Recovery Associates, L.L.C. which were immediately exercisable for $3.60 per unit. This agreement with AG 1999 expired on June 30, 2002. In connection with the Reorganization, warrants issued to AG 1999 were exchanged for comparable warrants to purchase 125,000 shares of our common stock, which were immediately exercisable for $3.60 per share.
PRA Investments, L.L.C., one of our principal stockholders, was formed in March 1999 in order to make an investment in our equity. PRA Investments, L.L.C. is a single-investment entity and has never invested or held securities other than the membership units of Portfolio Recovery Associates, L.L.C. and shares of our common stock. Angelo Gordon is the managing member of PRA Investments, L.L.C. and owns 1.1% of its outstanding membership interests.
58
David N. Roberts, one of our directors, is a limited partner of the entity which is a general partner of Angelo Gordon, one of our principal stockholders. As a limited partner in such entity, Mr. Roberts maintains an indirect economic interest in Angelo Gordon, but does not exercise voting or investment power over the shares beneficially owned by PRA Investments, L.L.C., Angelo Gordon or the entity of which he is a limited partner.
With respect to related party transactions we require that written agreements are negotiated and executed between the related party and us. Prior to execution, any such agreement must be reviewed and approved by our board of directors. The agreement discussed above was entered into after arms’ length negotiations between the related party and us.
59
PRINCIPAL AND SELLING STOCKHOLDERS
The following table contains information about the beneficial ownership of our common stock before and after our initial public offering for:
| • | each stockholder known by us to own beneficially more than 5% of our common stock; | |
| • | each of our directors; | |
| • | each of our named executive officers; and | |
| • | all directors and executive officers as a group. |
The percentage ownership in the following table is based on shares of common stock outstanding on August 31, 2002, after giving effect to the Reorganization.
Beneficial ownership is determined in accordance with the rules of the SEC. Except as indicated by footnote and subject to community property laws where applicable, to our knowledge the persons named in the table below have sole voting and investment power with respect to all shares of common stock shown as beneficially owned by them. In computing the number of shares beneficially owned by a person and the percentage ownership of that person, all outstanding warrants are deemed outstanding, while such warrants are not deemed outstanding for purposes of computing percentage ownership of any other person.
| Percent | ||||||||||||
| beneficially | ||||||||||||
| Number of | owned | |||||||||||
| shares | ||||||||||||
| beneficially | Before | After | ||||||||||
| Name of beneficial owner | owned | offering | offering(1) | |||||||||
| PRA Investments, L.L.C. | 6,051,166 | 60.5 | % | 44.9 | %(2) | |||||||
Angelo, Gordon & Co., L.P.(3) | 2,834,667 | 28.3 | % | 21.0 | % | |||||||
Steven D. Fredrickson(4) | 968,149 | 9.1 | % | 6.9 | % | |||||||
Kevin P. Stevenson(5) | 556,900 | 5.3 | % | 4.0 | % | |||||||
Craig A. Grube(6) | 404,525 | 3.9 | % | 2.9 | % | |||||||
Andrew J. Holmes(7) | 464,463 | 4.6 | % | 3.4 | % | |||||||
James L. Keown(8) | 494,463 | 4.8 | % | 3.6 | % | |||||||
Judith S. Scott(9) | 10,000 | * | * | |||||||||
David N. Roberts(10) | 2,500 | * | * | |||||||||
All executive officers and directors as a group (7 persons)(10)(11) | 2,901,000 | 24.5 | % | 18.9 | % | |||||||
| * | Less than 1%. |
| (1) | Assumes no exercise of the over-allotment option. |
| (2) | PRA Investments, L.L.C. has granted the underwriters the option to purchase up to an additional 520,500 shares at the public offering price, less the underwriting discount, within 30 days from the date of this prospectus to cover over-allotments. |
| (3) | Includes 67,833 shares, or 0.68%, indirectly owned by Angelo Gordon through its investment in PRA Investments, L.L.C., a Delaware limited liability company, and immediately exercisable warrants to purchase 21,000 shares issued to AG 1999. See “Certain Relationships and Related Transactions.” Excludes 5,983,333 shares, or 59.83%, held by PRA Investments, L.L.C. but not owned by Angelo Gordon. Mr. Roberts, one of our directors, is an employee of Angelo Gordon but does not exercise voting or investment power over the shares beneficially owned by PRA Investments, L.L.C. or Angelo Gordon. PRA Investments, L.L.C. is the selling stockholder in this offering. |
| (4) | Includes immediately exercisable warrants to purchase 636,000 shares, including warrants to purchase 1,000 shares issued to AG 1999. See “Certain Relationships and Related Transactions.” |
| (5) | Includes immediately exercisable warrants to purchase 455,000 shares. |
60
| (6) | Includes immediately exercisable warrants to purchase 317,000 shares, including warrants to purchase 2,000 shares issued to AG 1999. See “Certain Relationships and Related Transactions.” |
| (7) | Includes immediately exercisable warrants to purchase 200,000 shares. |
| (8) | Includes immediately exercisable warrants to purchase 230,000 shares. |
| (9) | Includes immediately exercisable warrants to purchase 7,500 shares. |
| (10) | Does not include any shares owned by Angelo Gordon or PRA Investments, L.L.C., but includes immediately exercisable warrants to purchase 2,500 shares issued to AG 1999. See “Certain Relationships and Related Transactions.” |
| (11) | Includes immediately exercisable warrants to purchase 1,848,000 shares, including warrants to purchase 5,500 shares issued to AG 1999. See “Certain Relationships and Related Transactions.” |
61
DESCRIPTION OF CAPITAL STOCK
General
Upon the closing of this offering and the filing of our amended and restated certificate of incorporation, our authorized capital stock will consist of 30,000,000 shares of common stock, $0.01 par value share, and 2,000,000 shares of preferred stock, $0.01 par value per share. After giving effect to the Reorganization, but before giving effect to the sale of shares by us or the selling stockholder pursuant to this offering, upon the closing of this offering, there were outstanding 10,000,000 shares of our common stock, held of record by 14 stockholders, and outstanding warrants to purchase 2,235,000 shares of our common stock.
The following description of our capital stock is qualified in its entirety by reference to our certificate of incorporation, a copy of which is filed as an exhibit to the registration statement of which this prospectus is a part.
Common Stock
We have a single class of common stock. Holders of our common stock are entitled to one vote per share on all matters submitted to a vote of stockholders generally. Stockholders have no right to cumulate their votes in the election of directors. Accordingly, holders of a majority of the outstanding shares of our common stock entitled to vote in any election of directors may elect all of the directors standing for election. Our certificate of incorporation gives the holders of our common stock no preemptive or other subscription or conversion rights, and there are no redemption provisions with respect to the shares. All outstanding shares of our common stock are, and the shares offered hereby will be, when issued and paid for, validly issued, fully paid and non-assessable.
Preferred Stock
Our certificate of incorporation authorizes the board of directors at any time, and from time to time, to issue shares of preferred stock in one or more series, with such designations, preferences and relative, participating, optional or other special rights, and qualifications, limitations or restrictions thereof, as the board of directors may determine, subject to the limitations prescribed by law and the certificate of incorporation. If any shares of preferred stock are issued, a certificate of designation, setting forth the series of such preferred stock and the rights, privileges and limitations of the holders of the preferred stock will be filed with the Secretary of State of the State of Delaware.
Warrants
In March 1999, in connection with an internal reorganization of Portfolio Recovery Associates, L.L.C., warrants to purchase 2,000,000 membership units were issued and additional warrants to purchase 235,000 membership units were since issued and are outstanding. Exercise prices of the warrants ranged from $3.60 to $10.00 at a weighted average exercise price of $4.30 per share. In connection with the Reorganization, all of the issued and outstanding warrants will be exchanged by the respective holders for comparable warrants to purchase an aggregate of 2,235,000 shares of our common stock at the same respective exercise prices. Due to this offering, the vesting period for most of these warrants will be accelerated and the outstanding warrants will be exercisable upon the closing of this offering. The total number of warrants that will not vest is 125,000; 75,000 of which were granted in 2001 and 50,000 of which were granted in 2002. For the warrants that do accelerate due to this offering, this will result in a $15,000 expense being incurred in fiscal 2002, instead of 2003 and 2004 which would have been called for under the normal vesting schedule. We will expense those in accordance with SFAS No. 123.
Options
Our 2002 Stock Option Plan will become effective at the closing of this offering. A total of 2,000,000 authorized shares of common stock are reserved for issuance under the plan. Under the plan we may grant
62
Limitations on Liability of Officers and Directors
Our certificate of incorporation provides that our directors shall not be personally liable to us or our stockholders for monetary damages for breach of fiduciary duty as a director, except for liability for:
| • | any breach of the director’s duty of loyalty to us or our stockholders; | |
| • | acts or omissions not in good faith or which involve intentional misconduct or a knowing violation of law; | |
| • | payments of dividends or stock purchases or redemptions in violation of Section 174 of the Delaware General Corporation Law; and | |
| • | any transaction from which the director derived an improper personal benefit. |
Our certificate of incorporation and by-laws also provide for indemnification of our officers and directors to the fullest extent permitted by Delaware law, including some instances in which indemnification is otherwise discretionary under Delaware law. We believe that these provisions are essential to attracting and retaining qualified persons as directors and officers.
There is no pending litigation or proceeding involving any of our directors or officers as to which indemnification is being sought. In addition, we are not aware of any threatened litigation that may result in claims for indemnification by any officer or director.
Restrictive Provisions of By-laws and Certificate of Incorporation
Our certificate of incorporation and by-laws contain provisions that may make it more difficult, expensive or otherwise discourage a tender offer or a change in control or takeover attempt by a third-party, even if such a transaction would be beneficial to our stockholders. The existence of these provisions may have a negative impact on the price of our common stock by discouraging third-party investors from purchasing our common stock. In particular, our certificate of incorporation and by-laws include provisions that:
| • | classify our board of directors into three groups, each of which, after an initial transition period, will serve for staggered three-year terms; | |
| • | permit a majority of the stockholders to remove our directors only for cause; | |
| • | permit our directors, and not our stockholders, to fill vacancies on our board of directors; | |
| • | require stockholders to give us advance notice to nominate candidates for election to our board of directors or to make stockholder proposals at a stockholders’ meeting; | |
| • | permit a special meeting of our stockholders be called only by approval of a majority of the directors, the chairman of the board of directors, the chief executive officer, the president or the written request of 30% of our stockholders; | |
| • | permit our board of directors to issue, without approval of our stockholders, preferred stock with such terms as our board of directors may determine; | |
| • | permit the authorized number of directors to be changed only by a resolution of the board of directors; and | |
| • | require the vote of the holders of a majority of our voting shares for stockholder amendments to our by-laws. | |
63
Our certificate of incorporation also precludes an interested stockholder, generally a holder of 15% of our common stock, from engaging in a merger, asset sale or other business combination with us for a period of three years after the date of the transaction in which the person became an interested stockholder, unless one of the following occurs:
| • | prior to the time the stockholder became an interested stockholder, the board of directors approved either the business combination or the transaction which resulted in the person becoming an interested stockholder; | |
| • | the stockholder owned at least 85% of the outstanding voting stock of the corporation, excluding shares held by directors who were also officers or held in certain employee stock plans, upon consummation of the transaction which resulted in a stockholder becoming an interested stockholder; and | |
| • | the business combination was approved by the board of directors and by two-thirds of the outstanding voting stock of the corporation, excluding shares held by the interested stockholder. |
In general, our current major stockholders and their affiliates and transferees are excepted from these limitations.
Our by-laws require that, subject to certain exceptions, any stockholder desiring to propose business or nominate a person to the board of directors at a stockholders meeting must give notice of any proposals or nominations within a specified time frame. These provisions may have the effect of precluding a nomination for the election of directors or the conduct of business at a particular annual meeting if the proper procedures are not followed or may discourage or deter a third-party from conducting a solicitation of proxies to elect its own slate of directors or otherwise attempting to obtain control of us, even if the conduct of such solicitation or such attempt might be beneficial to us and our stockholders. For us to include a proposal in our annual proxy statement, the proponent and the proposal must comply with the proxy proposal submission rules of the SEC.
Our certificate of incorporation provides that it will require the vote of the holders of at least a majority of the shares entitled to vote in the election of directors to remove a director and only for cause. In addition, stockholders can amend or repeal our by-laws only with the vote of the holders of at least a majority of our outstanding common stock. In addition, our certificate of incorporation has established that we will have a classified board of directors. A classified board is one in which a group or class of directors is elected on a rotating basis each year. This method of electing directors makes changes in the composition of the board of directors lengthier, which consequently would make a change in control of a corporation a lengthier and more difficult process.
Transfer Agent and Registrar
The transfer agent and registrar for our common stock is Continental Stock Transfer and Trust Company.
64
SHARES ELIGIBLE FOR FUTURE SALE
We will have 13,470,000 shares of common stock outstanding after this offering. Of those shares, only the 3,470,000 shares of common stock sold in this offering will be freely transferable without restriction immediately, unless purchased by persons deemed to be our “affiliates” as that term is defined in Rule 144 under the Securities Act of 1933, as amended (the “Securities Act”). The remaining 10,000,000 shares of common stock to be outstanding immediately following this offering are “restricted” which means they were originally sold in certain types of offerings that were not subject to a registration statement filed with the SEC. These restricted shares may only be sold through registration under the Securities Act or under an available exemption from registration, such as provided through Rule 144 promulgated under the Securities Act. In general, under Rule 144 a person or persons whose shares are aggregated including an affiliate, who has beneficially owned the shares for one year or more, may sell in the open market within any three-month period a number of shares that does not exceed the greater of:
| • | 1% of the then outstanding shares of our common stock, which would be approximately 134,700 shares immediately after this offering; or | |
| • | the average weekly trading volume in the common stock on the Nasdaq National Market during the four calendar weeks preceding the sale. |
Sales under Rule 144 are also subject to limitations on the manner of sale, notice requirements and the availability of our current public information. A person who is deemed not to have been our affiliate at any time during the three months preceding a sale by him and who has beneficially owned his or her shares for at least two years, may sell the shares in the public market under Rule 144(k) without regard to the volume limitations, manner of sale provisions, notice requirements, or the availability of current information we refer to above. After restricted shares are properly sold in reliance upon Rule 144, they will be freely tradeable without restrictions or registration under the Securities Act, unless thereafter held by one of our affiliates. Due to the Reorganization, all shares of our common stock outstanding immediately after this offering (except for the 3,470,000 shares sold in this offering) shall be deemed to have a new “holding period” for purposes of Rule 144.
We have reserved an aggregate of 2,000,000 shares of common stock for issuance under our 2002 Stock Option Plan and 2,235,000 shares of common stock for issuance upon exercise of outstanding warrants. We intend to register the shares subject to the plan on a registration statement following this offering. Shares of common stock issued under the plan after the effective date of any registration statement registering the shares will be available for sale in the public market without restriction to the extent they are held by persons who are not our affiliates, and by affiliates under Rule 144.
The holders of 10,000,000 shares of common stock outstanding not being sold in this offering have agreed to a 180-day “lock-up” with respect to these shares. This generally means they cannot sell these shares during the 180 days following the date of this prospectus. See “Underwriting.” After the 180-day lock-up period, these shares may be sold in accordance with the provisions of the federal securities laws.
No trading market for the common stock existed prior to this offering. No prediction can be made as to the effect, if any, that future sales of shares under Rule 144 or otherwise will have on the market price prevailing from time to time. Sales of substantial amounts of common stock into the public market following this offering, or the perception that these sales could occur, could adversely affect the then prevailing market price.
65
UNDERWRITING
The underwriters named below, for which William Blair & Company, L.L.C., and U.S. Bancorp Piper Jaffray Inc. are acting as representatives, have severally agreed, subject to the terms and conditions set forth in the underwriting agreement by and among the underwriters, the selling stockholder and us, to purchase from us and the selling stockholder, the respective number of shares of common stock set forth opposite each underwriter’s name in the table below.
| Underwriter | Number of Shares | |||
| William Blair & Company, L.L.C. | ||||
| U.S. Bancorp Piper Jaffray Inc. | ||||
| Total | 3,470,000 | |||
This offering will be underwritten on a firm commitment basis. In the underwriting agreement, the underwriters have agreed, subject to the terms and conditions set forth therein, to purchase the shares of common stock being sold pursuant this prospectus at a price per share equal to the public offering price less the underwriting discount specified on the cover page of this prospectus. According to the terms of the underwriting agreement, the underwriters either will purchase all of the shares or none of them. In the event of default by any underwriter, in certain circumstances, the purchase commitments of the non-defaulting underwriters may be increased or the underwriting agreement may be terminated. In the underwriting agreement, we and the selling stockholder have made certain representations and warranties to the underwriters and have agreed to indemnify them and their controlling persons against certain liabilities, including liabilities under the Securities Act, or to contribute to payments the underwriters may be required to make in respect thereof.
The representatives of the underwriters have advised us and the selling stockholder that the underwriters propose to offer the common stock to the public initially at the public offering price set forth on the cover page of this prospectus and to selected dealers at such price less a concession of not more than $[ ] per share. The underwriters may allow, and such dealers may re-allow, a concession not in excess of $[ ] per share to certain other dealers. The underwriters will offer the shares subject to prior sale and subject to receipt and acceptance of the shares by the underwriters. The underwriters may reject any order to purchase shares in whole or in part. The underwriters expect that we and the selling stockholder will deliver the shares to the underwriters through the facilities of The Depository Trust Company in New York, New York on or about [ ], 2002. At that time, the underwriters will pay us and the selling stockholder for the shares in immediately available funds. After commencement of the public offering, the representatives may change the public offering price and other selling terms.
PRA Investments, L.L.C. has granted the underwriters an option, exercisable within 30 days after the date of this prospectus, to purchase up to an aggregate of 520,500 additional shares of common stock at the same price per share to be paid by the underwriters for the other shares offered hereby solely for the purpose of covering over-allotments. If the underwriters purchase any such additional shares pursuant to this option, each of the underwriters will be committed to purchase such additional shares in approximately the same proportion as set forth in the table above. The underwriters may exercise the
66
The underwriters have reserved for sale, at the initial public offering price, up to 104,100 shares of common stock in this offering for our employees, relatives of our executive officers, business associates and other possible third parties. Those receiving these reserved shares will not be subject to lock-up agreements by virtue of their having purchased such shares (though an employee could otherwise be subject to a lock-up agreement as an executive officer). Purchases of the reserved shares would reduce the number of shares available for sale to the general public. The underwriters will offer any reserved shares which are not so purchased to the general public on the same terms as the other shares being sold in this offering.
The following table summarizes the compensation to be paid by us and the selling stockholder to the underwriters. This information assumes either no exercise or full exercise by the underwriters of their over-allotment option:
| Without | With | |||||||||||
| Over- | Over- | |||||||||||
| Per Share | Allotment | Allotment | ||||||||||
| Public offering price | ||||||||||||
| Underwriting discount paid by us | ||||||||||||
| Underwriting discount paid by selling stockholder | ||||||||||||
| Proceeds, before expenses, to us | ||||||||||||
| Proceeds to the selling stockholder | ||||||||||||
We estimate that our total expenses for this offering, excluding the underwriting discount, will be approximately $500,000.
We, each of our directors and executive officers and Angelo Gordon (on behalf of itself and PRA Investments, L.L.C.), who in the aggregate have the right of disposition for 9,847,975 shares of common stock, have agreed, subject to limited exceptions, for a period of 180 days after the date of this prospectus, not to, without the prior written consent of William Blair & Company, L.L.C.:
| • | directly or indirectly, offer, sell (including “short” selling), assign, transfer, encumber, pledge, contract to sell, grant an option to purchase, establish an open “put equivalent position” within the meaning of Rule 16a-1(h) under the Exchange Act, or otherwise dispose of any shares of common stock or securities convertible or exchangeable into, or exercisable for, common stock held of record or beneficially owned (within the meaning of Rule 13d-3 under the Exchange Act); and | |
| • | enter any swap or other arrangement that transfers all or a portion of the economic consequences associated with the ownership of any common stock. |
This agreement does not extend to bona fide gifts to immediate family members of such persons who agree to be bound by such restrictions, or to limited partners or stockholders, who agree to be bound by such restrictions. In determining whether to consent to a transaction prohibited by these restrictions, the underwriters will take into account various factors, including the number of shares requested to be sold, the anticipated manner and timing of sale, the potential impact of the sale on the market for the common stock, and market conditions generally. We may grant options and issue common stock under existing stock option plans and issue unregistered shares in connection with any outstanding convertible securities or options during the lock-up period. For more information, see “Shares Eligible for Future Sale.”
The representatives have informed us that the underwriters will not confirm, without client authorization, sales to their client accounts as to which they have discretionary authority. The representatives have also informed us that the underwriters intend to deliver all copies of this prospectus
67
In connection with this offering, the underwriters and other persons participating in this offering may engage in transactions which affect the market price of the common stock. These may include stabilizing and over-allotment transactions and purchases to cover syndicate short positions. Stabilizing transactions consist of bids or purchases for the purpose of pegging, fixing or maintaining the price of the common stock. An over-allotment involves selling more shares of common stock in this offering than are specified on the cover page of this prospectus, which results in a syndicate short position. The underwriters may cover this short position by purchasing common stock in the open market or by exercising all or part of their over-allotment option. In addition, the representatives may impose a penalty bid. This allows the representative to reclaim the selling concession allowed to an underwriter or selling group member if common stock sold by such underwriter or selling group member in this offering is repurchased by the representative in stabilizing or syndicate short covering transactions. These transactions, which may be effected on the Nasdaq National Market or otherwise, may stabilize, maintain or otherwise affect the market price of the common stock and could cause the price to be higher than it would be without these transactions. The underwriters and other participants in this offering are not required to engage in any of these activities and may discontinue any of these activities at any time without notice. We, the selling stockholders and the underwriters make no representation or prediction as to whether the underwriters will engage in such transactions or choose to discontinue any transactions engaged in or as to the direction or magnitude of any effect that these transactions may have on the price of the common stock.
Prior to this offering, there has been no public market for our common stock. Consequently, we and representatives of the underwriters will negotiate to determine the initial public offering price. We and they will consider current market conditions, our operating results in recent periods, the market capitalization of other companies in our industry and estimates of our potential. The estimated price range specified on the cover page of this prospectus may change because of market conditions and other factors.
The selling stockholder is an affiliate of Angelo Gordon, which is a member of the National Association of Securities Dealers, Inc. (the “NASD”). Because an affiliate of an NASD member that has participated in the preparation of this prospectus may (if the over-allotment option is exercised) receive some of the proceeds of this offering, this offering is being conducted in accordance with Rule 2720 of the NASD. That rule requires that the price at which our common stock is offered to the public be no higher than that recommended by a “qualified independent underwriter,” as defined by the NASD. William Blair & Company, L.L.C. has served in that capacity and performed due diligence investigations and reviewed and participated in the preparation of this prospectus.
We have applied to list our common stock on the Nasdaq National Market under the symbol “PRAA.”
In the ordinary course of business, some of the underwriters and their affiliates have provided, and may in the future provide, investment banking, commercial banking and other services to us for which they have received, and may in the future receive, customary fees or other compensation.
LEGAL MATTERS
The validity of the common stock offered hereby has been passed upon for us by Swidler Berlin Shereff Friedman, LLP, New York, New York. Certain legal matters in connection with this offering will be passed upon for the underwriters by Sidley Austin Brown & Wood, Chicago, Illinois.
EXPERTS
The financial statements as of December 31, 2000 and 2001 and for each of the three years in the period ended December 31, 2001 and as of June 30, 2002 and for the six months then ended included in
68
WHERE YOU CAN FIND MORE INFORMATION
We have filed with the SEC, a registration statement on Form S-1 under the Securities Act, including the exhibits with the registration statement, with respect to the shares offered by this prospectus. This prospectus does not contain all the information contained in the registration statement. For further information with respect to us and shares to be sold in this offering, we refer you to the registration statement. Statements contained in this prospectus as to the contents of any contract, agreement or other document to which we make reference are not necessarily complete. In each instance, we refer you to the copy of the contract, agreement or other document filed as an exhibit to the registration statement, each statement being qualified in all respects by the more complete description of the matter involved.
You may read a copy or any portion of the registration statement or any reports, statements or other information we file at the SEC’s public reference room at 450 Fifth Street, N.W., Washington, D.C. 20549. Please call the SEC at 1-800-SEC-0330 for further information on the operation of the public reference room. You can receive copies of these documents upon payment of a duplicating fee by writing to the SEC. Our SEC filings, including the registration statement, will also be available to you on the SEC’s Internet site athttp://www.sec.gov.
69
INDEX TO FINANCIAL STATEMENTS
| Report of Independent Accountants | F-2 | |||
| Consolidated Statements of Financial Position as of December 31, 2000 and 2001 and June 30, 2002 | F-3 | |||
| Consolidated Statements of Operations for the years ended December 31, 1999, 2000 and 2001 and the six months ended June 30, 2001 and 2002 | F-4 | |||
| Consolidated Statements of Changes in Members’ Equity for the years ended December 31, 1999, 2000 and 2001 and the six months ended June 30, 2001 and 2002 | F-5 | |||
| Consolidated Statements of Cash Flows for the years ended December 31, 1999, 2000 and 2001 and the six months ended June 30, 2001 and 2002 | F-6 | |||
| Notes to Consolidated Financial Statements | F-7 |
F-1
REPORT OF INDEPENDENT ACCOUNTANTS
Board of Directors and Stockholders
In our opinion, the accompanying consolidated statements of financial position and the related consolidated statements of operations and changes in members’ equity, and of cash flows present fairly, in all material respects, the financial position of Portfolio Recovery Associates, Inc. and its subsidiaries (the “Company”) at December 31, 2000, December 31, 2001 and June 30, 2002 and the results of their operations and their cash flows for each of the three years in the period ended December 31, 2001 and the six months ended June 30, 2002 in conformity with accounting principles generally accepted in the United States of America. These financial statements are the responsibility of the Company’s management; our responsibility is to express an opinion on these financial statements based on our audits. We conducted our audits of these statements in accordance with auditing standards generally accepted in the United States of America, which require that we plan and perform the audit to obtain reasonable assurance about whether the financial statements are free of material misstatement. An audit includes examining, on a test basis, evidence supporting the amounts and disclosures in the financial statements, assessing the accounting principles used and significant estimates made by management, and evaluating the overall consolidated financial statement presentation. We believe that our audits provide a reasonable basis for our opinion.
PricewaterhouseCoopers LLP
Harrisburg, PA
F-2
PORTFOLIO RECOVERY ASSOCIATES, INC.
CONSOLIDATED STATEMENTS OF FINANCIAL POSITION
| December 31, | December 31, | June 30, | June 30, | ||||||||||||||||
| 2000 | 2001 | 2001 | 2002 | ||||||||||||||||
| (unaudited) | |||||||||||||||||||
ASSETS | |||||||||||||||||||
| Cash and cash equivalents | $ | 3,191,479 | $ | 4,780,399 | $ | 4,223,301 | $ | 8,320,483 | |||||||||||
| Finance receivables, net | 41,124,377 | 47,986,744 | 43,918,789 | 51,055,102 | |||||||||||||||
| Property and equipment, net | 2,217,419 | 3,379,576 | 2,827,194 | 3,432,917 | |||||||||||||||
| Other assets | 654,447 | 901,789 | 1,130,258 | 612,903 | |||||||||||||||
| Total assets | $ | 47,187,722 | $ | 57,048,508 | 52,099,542 | $ | 63,421,405 | ||||||||||||
LIABILITIES AND MEMBERS’ EQUITY | |||||||||||||||||||
| Liabilities: | |||||||||||||||||||
| Accounts payable | $ | 156,753 | $ | 236,885 | $ | 432,946 | $ | 549,818 | |||||||||||
| Accrued expenses | 314,863 | 614,698 | 371,479 | 608,179 | |||||||||||||||
| Accrued payroll and bonuses | 710,591 | 1,674,371 | 775,927 | 1,659,871 | |||||||||||||||
| Revolving lines of credit | 22,166,094 | 25,000,000 | 23,176,461 | 25,000,000 | |||||||||||||||
| Long-term debt | 531,667 | 568,432 | 605,052 | 1,031,420 | |||||||||||||||
| Obligations under capital lease | 602,348 | 825,313 | 923,510 | 675,129 | |||||||||||||||
| Interest rate swap contract | — | 377,303 | — | 434,156 | |||||||||||||||
| Total liabilities | 24,482,316 | 29,297,002 | 26,285,375 | 29,958,573 | |||||||||||||||
| Equity: | |||||||||||||||||||
| Members’ equity | 22,705,406 | 28,128,809 | 25,814,167 | 33,896,988 | |||||||||||||||
| Accumulated other comprehensive income | — | (377,303 | ) | — | (434,156 | ) | |||||||||||||
| Total equity | 22,705,406 | 27,751,506 | 25,814,167 | 33,462,832 | |||||||||||||||
| Total liabilities and equity | $ | 47,187,722 | $ | 57,048,508 | $ | 52,099,542 | $ | 63,421,405 | |||||||||||
The accompanying notes are an integral part of these consolidated financial statements.
F-3
PORTFOLIO RECOVERY ASSOCIATES, INC.
CONSOLIDATED STATEMENTS OF OPERATIONS
| Six Months | Six Months | |||||||||||||||||||||
| Year Ended | Year Ended | Year Ended | Ended | Ended | ||||||||||||||||||
| December 31, | December 31, | December 31, | June 30, | June 30, | ||||||||||||||||||
| 1999 | 2000 | 2001 | 2001 | 2002 | ||||||||||||||||||
| (unaudited) | ||||||||||||||||||||||
| Revenue: | ||||||||||||||||||||||
| Income recognized on finance receivables | $ | 11,745,876 | $ | 18,990,695 | $ | 31,220,857 | $ | 14,407,410 | $ | 24,017,807 | ||||||||||||
| Commissions | — | — | 214,539 | — | 816,437 | |||||||||||||||||
| Net gain on cash sales of defaulted consumer receivables | 321,953 | 342,952 | 900,916 | 295,594 | 100,156 | |||||||||||||||||
| Total revenue | 12,067,829 | 19,333,647 | 32,336,312 | 14,703,004 | 24,934,400 | |||||||||||||||||
| Operating expenses: | ||||||||||||||||||||||
| Compensation | 6,118,776 | 9,882,683 | 15,644,460 | 6,711,907 | 10,212,055 | |||||||||||||||||
| Legal, accounting and outside fees and services | 1,492,973 | 2,583,000 | 3,627,135 | 1,560,788 | 3,241,582 | |||||||||||||||||
| Communications | 553,054 | 870,833 | 1,644,557 | 666,027 | 929,452 | |||||||||||||||||
| Rent and occupancy | 334,771 | 602,630 | 712,400 | 314,305 | 362,447 | |||||||||||||||||
| Other operating expenses | 498,254 | 652,410 | 1,265,132 | 514,535 | 675,571 | |||||||||||||||||
| Depreciation | 368,887 | 436,684 | 676,677 | 310,605 | 433,623 | |||||||||||||||||
| 9,366,715 | 15,028,240 | 23,570,361 | 10,078,167 | 15,854,730 | ||||||||||||||||||
| Income from operations | 2,701,114 | 4,305,407 | 8,765,951 | 4,624,837 | 9,079,670 | |||||||||||||||||
| Other income and (expense): | ||||||||||||||||||||||
| Interest income | 102,271 | 94,365 | 65,362 | 45,956 | 1,699 | |||||||||||||||||
| Interest expense | (978,443 | ) | (1,859,637 | ) | (2,781,674 | ) | (1,456,377 | ) | (1,116,713 | ) | ||||||||||||
| Net income before extraordinary loss | 1,824,942 | 2,540,135 | 6,049,639 | 3,214,416 | 7,964,656 | |||||||||||||||||
| Extraordinary loss | — | — | (423,305 | ) | — | — | ||||||||||||||||
| Net income | $ | 1,824,942 | $ | 2,540,135 | $ | 5,626,334 | $ | 3,214,416 | $ | 7,964,656 | ||||||||||||
| Pro forma data (unaudited): | ||||||||||||||||||||||
| Historical income before taxes | $ | 1,824,942 | $ | 2,540,135 | $ | 5,626,334 | $ | 3,214,416 | $ | 7,964,656 | ||||||||||||
| Pro forma provision for income taxes | 697,366 | 900,899 | 2,100,609 | 1,200,112 | 3,079,177 | |||||||||||||||||
| Pro forma net income before extraordinary loss | 1,127,576 | 1,639,236 | 3,790,988 | 2,014,304 | 4,885,479 | |||||||||||||||||
| Pro forma extraordinary loss | 0 | 0 | (265,263 | ) | 0 | 0 | ||||||||||||||||
| Pro forma net income | 1,127,576 | 1,639,236 | 3,525,725 | 2,014,304 | 4,885,479 | |||||||||||||||||
| Pro forma net income per common share before extraordinary loss | ||||||||||||||||||||||
| Basic | $ | 0.38 | $ | 0.49 | ||||||||||||||||||
| Diluted | $ | 0.33 | $ | 0.43 | ||||||||||||||||||
| Pro forma extraordinary loss per common share | ||||||||||||||||||||||
| Basic | $ | 0.03 | 0 | |||||||||||||||||||
| Diluted | $ | 0.02 | 0 | |||||||||||||||||||
| Net income adjusted for pro forma income tax provision | $ | 1,127,576 | $ | 1,639,236 | $ | 3,525,725 | $ | 2,014,304 | $ | 4,885,479 | ||||||||||||
| Pro forma net income per common share: | ||||||||||||||||||||||
| Basic | $ | 0.35 | $ | 0.49 | ||||||||||||||||||
| Diluted | $ | 0.31 | $ | 0.43 | ||||||||||||||||||
| Pro forma weighted average number of shares outstanding: | ||||||||||||||||||||||
| Basic | 10,000,000 | 10,000,000 | ||||||||||||||||||||
| Diluted | 11,457,741 | 11,486,128 | ||||||||||||||||||||
The accompanying notes are an integral part of these consolidated financial statements.
F-4
PORTFOLIO RECOVERY ASSOCIATES, INC.
CONSOLIDATED STATEMENTS OF CHANGES IN MEMBERS’ EQUITY
| Accumulated | |||||||||||||||||
| Other | Total | ||||||||||||||||
| Capital | Operating | Comprehensive | Members’ | ||||||||||||||
| Members | Members | Income (Loss) | Equity | ||||||||||||||
| Balance at December 31, 1998 | $ | 8,447,113 | $ | 41,226 | $ | — | $ | 8,488,339 | |||||||||
| Allocation of net income | 1,652,376 | 172,566 | 1,824,942 | ||||||||||||||
| Total comprehensive income | — | — | — | 1,824,942 | |||||||||||||
| Contributions | 9,916,000 | 84,000 | — | 10,000,000 | |||||||||||||
| Balance at December 31, 1999 | 20,015,489 | 297,792 | — | 20,313,281 | |||||||||||||
| Allocation of net income | 2,234,557 | 305,578 | — | 2,540,135 | |||||||||||||
| Total comprehensive income | 2,540,135 | ||||||||||||||||
| Distributions | — | (148,010 | ) | — | (148,010 | ) | |||||||||||
| Balance at December 31, 2000 | 22,250,046 | 455,360 | — | 22,705,406 | |||||||||||||
| Allocation of net income | 4,949,486 | 676,848 | — | 5,626,334 | |||||||||||||
| Unrealized loss on interest rate swap | — | — | (377,303 | ) | (377,303 | ) | |||||||||||
| Total comprehensive income | 5,249,031 | ||||||||||||||||
| Distributions | — | (202,931 | ) | — | (202,931 | ) | |||||||||||
| Balance at December 31, 2001 | 27,199,532 | 929,277 | (377,303 | ) | 27,751,506 | ||||||||||||
| Allocation of net income | 7,006,508 | 958,148 | — | 7,964,656 | |||||||||||||
| Unrealized loss on interest rate swap | — | — | (56,853 | ) | (56,853 | ) | |||||||||||
| Total comprehensive income | 7,907,803 | ||||||||||||||||
| Distributions | (1,759,400 | ) | (437,077 | ) | — | (2,196,477 | ) | ||||||||||
| Balance at June 30, 2002 | $ | 32,446,640 | $ | 1,450,348 | $ | (434,156 | ) | $ | 33,462,832 | ||||||||
The accompanying notes are an integral part of these financial statements.
F-5
PORTFOLIO RECOVERY ASSOCIATES, INC.
CONSOLIDATED STATEMENTS OF CASH FLOWS
| Year Ended | Year Ended | Year Ended | Six Months | Six Months | ||||||||||||||||||||
| December 31, | December 31, | December 31, | Ended June 30, | Ended June 30, | ||||||||||||||||||||
| 1999 | 2000 | 2001 | 2001 | 2002 | ||||||||||||||||||||
| (unaudited) | ||||||||||||||||||||||||
| Operating activities: | ||||||||||||||||||||||||
| Net income | $ | 1,824,942 | $ | 2,540,135 | $ | 5,626,334 | $ | 3,214,415 | $ | 7,964,656 | ||||||||||||||
| Adjustments to reconcile net income to cash provided by operating activities: | ||||||||||||||||||||||||
| Depreciation | 368,887 | 436,684 | 676,677 | 310,605 | 433,623 | |||||||||||||||||||
| Gain on sales of finance receivables | (321,953 | ) | (342,952 | ) | (900,916 | ) | (295,594 | ) | (100,156 | ) | ||||||||||||||
| (Gain)/loss on disposal of property and equipment | 5,450 | — | (1,766 | ) | — | — | ||||||||||||||||||
| Extraordinary loss on extinguishment of debt | — | — | 423,305 | — | — | |||||||||||||||||||
| Changes in operating assets and liabilities: | ||||||||||||||||||||||||
| Other assets | (430,436 | ) | 75,514 | (590,647 | ) | (475,810 | ) | 288,886 | ||||||||||||||||
| Accounts payable | 72,564 | 33,633 | 80,132 | 276,193 | 312,933 | |||||||||||||||||||
| Accrued expenses | 147,994 | 102,403 | 219,835 | 56,616 | (6,519 | ) | ||||||||||||||||||
| Accrued payroll and bonuses | 101,579 | 236,536 | 963,780 | 65,337 | (14,500 | ) | ||||||||||||||||||
| Net cash provided by operating activities | 1,769,027 | 3,081,953 | 6,496,739 | 3,151,762 | 8,878,923 | |||||||||||||||||||
| Cash flows from investing activities: | ||||||||||||||||||||||||
| Purchases of property and equipment | (604,144 | ) | (1,069,420 | ) | (1,279,356 | ) | (458,022 | ) | (448,079 | ) | ||||||||||||||
| Acquisition of finance receivables, net of buybacks | (18,853,787 | ) | (25,035,237 | ) | (33,491,211 | ) | (12,436,272 | ) | (16,232,137 | ) | ||||||||||||||
| Collections applied to principal on finance receivables | 5,616,241 | 11,741,998 | 21,926,815 | 9,294,557 | 13,163,179 | |||||||||||||||||||
| Proceeds from sales of finance receivables, net of allowances for returns | 891,986 | 650,864 | 5,602,945 | 642,896 | 100,756 | |||||||||||||||||||
| Cash restricted for letter of credit | (500,000 | ) | 500,000 | — | — | — | ||||||||||||||||||
| Net cash used in investing activities | (13,449,704 | ) | (13,211,795 | ) | (7,240,807 | ) | (2,956,841 | ) | (3,416,281 | ) | ||||||||||||||
| Cash flows from financing activities: | ||||||||||||||||||||||||
| Proceeds from capital contributions | 10,000,000 | — | — | — | — | |||||||||||||||||||
| Distribution of capital | — | (148,010 | ) | (202,931 | ) | (105,654 | ) | (2,196,477 | ) | |||||||||||||||
| Proceeds from lines of credit | 12,682,250 | 25,612,141 | 28,577,299 | 2,576,260 | — | |||||||||||||||||||
| Payments on lines of credit | (10,744,807 | ) | (13,488,098 | ) | (25,743,719 | ) | (1,565,893 | ) | — | |||||||||||||||
| Proceeds from long-term debt | — | 550,000 | 107,000 | 107,000 | 500,000 | |||||||||||||||||||
| Payments on building loan | — | (18,333 | ) | (70,235 | ) | (33,614 | ) | (37,012 | ) | |||||||||||||||
| Payments of capital lease obligations | (54,895 | ) | (142,347 | ) | (334,421 | ) | (141,198 | ) | (189,069 | ) | ||||||||||||||
| Net cash provided (used) by financing activities | 11,882,548 | 12,365,353 | 2,332,993 | 836,901 | (1,922,558 | ) | ||||||||||||||||||
| Net increase in cash and cash equivalents | 201,871 | 2,235,511 | 1,588,920 | 1,031,822 | 3,540,084 | |||||||||||||||||||
| Cash and cash equivalents, beginning of period | 754,097 | 955,968 | 3,191,479 | 3,191,479 | 4,780,399 | |||||||||||||||||||
| Cash and cash equivalents, end of period | $ | 955,968 | $ | 3,191,479 | $ | 4,780,399 | $ | 4,223,301 | $ | 8,320,483 | ||||||||||||||
| Supplemental disclosure of cash flow information: | ||||||||||||||||||||||||
| Cash paid for interest | $ | 961,479 | $ | 1,847,747 | $ | 2,821,784 | $ | 1,446,448 | $ | 1,000,836 | ||||||||||||||
| Noncash investing and financing activities: | ||||||||||||||||||||||||
| Capital lease obligations incurred | 344,449 | 414,404 | 555,988 | 462,358 | 38,885 | |||||||||||||||||||
| Accounts receivable for assets disposal | 33,829 | — | — | — | — | |||||||||||||||||||
The accompanying notes are an integral part of these consolidated financial statements.
F-6
PORTFOLIO RECOVERY ASSOCIATES, INC.
NOTES TO CONSOLIDATED FINANCIAL STATEMENTS
1. Organization and Business:
Portfolio Recovery Associates, L.L.C., a Delaware limited liability company (“PRA”), and its subsidiaries (collectively, the “Company”) purchase, collect and manage portfolios of defaulted consumer receivables. The defaulted consumer receivables PRA collects are in substantially all cases either purchased from the credit originator or are collected on behalf of clients on a commission fee basis.
On December 22, 1997, PRA formed a wholly owned subsidiary, PRA II, LLC (“PRA II”), of which PRA is the sole initial member. PRA II was organized for the sole purpose of facilitating the purchase and collection of portfolios of defaulted or charged-off consumer receivables, which purchases were originally financed by loans from an institutional investor. In May 2000, the loan facility from the institutional investor was paid in full and closed.
On December 22, 1999, PRA formed a wholly owned subsidiary, PRA AG Funding, LLC (“PRA AG Funding”), of which PRA is the sole initial member. PRA AG Funding is organized for the purpose of facilitating the purchase of portfolios of defaulted or charged off consumer credit receivables. Loans from an affiliated lender were paid in full in December, 2001. PRA AG Funding maintains a $2.5 million revolving line of credit with RBC Centura Bank, which extends through 2003. This line of credit had no amounts outstanding as of June 30, 2002.
On December 28, 1999, PRA formed a wholly owned subsidiary, PRA Holding I, LLC (“PRA Holding I”), of which PRA is the sole initial member. PRA Holding I as a holder of PRA’s real property.
On June 1, 2000, PRA formed a wholly owned subsidiary, PRA Receivables Management, LLC, d/b/a Anchor Receivables Management (“Anchor”), of which PRA is the sole initial member. Anchor is organized as a contingent fee collection agency and contracts with holders of finance receivables to attempt collection efforts on a contingent fee basis for a stated period of time. Anchor commenced operations during March 2001.
In July 2000, the Company opened a regional office in Hutchinson, Kansas. This new office provides the Company with another time zone presence as well as an additional labor pool. The Company purchased a building and made necessary improvements to the location.
On June 12, 2001, PRA formed a wholly owned subsidiary, PRA III, LLC (“PRA III”) of which PRA is the sole initial member. PRA III was organized for the sole purpose of facilitating the purchase of portfolios of defaulted or charged-off consumer receivables, which purchases are financed by loans from an institutional lender. PRA III is a named borrower under a $40 million loan facility (see Note 8). In addition, PRA, PRA II, PRA Holding I, and Anchor, exclusive of Anchor’s deposits held for others, are named guarantors.
| 2. | Summary of Significant Accounting Policies: |
Cash and cash equivalents:The Company considers all highly liquid investments with a maturity of three months or less when purchased to be cash equivalents.
Principles of accounting and consolidation:The consolidated financial statements of the Company include the accounts of PRA and its wholly owned subsidiaries, PRA II, PRA AG Funding, PRA Holding I, Anchor and PRA III. All significant intercompany accounts and transactions have been eliminated.
Finance receivables and income recognition:The Company accounts for its investment in finance receivables using the interest method under the guidance of Practice Bulletin 6, “Amortization of Discounts on Certain Acquired Loans.” Static pools of relatively homogenous accounts are established. Once a static pool is established, the receivable accounts in the pool are not changed. Each static pool is
F-7
NOTES TO CONSOLIDATED FINANCIAL STATEMENTS — (Continued)
recorded at cost, and is accounted for as a single unit for the recognition of income, principal payments and loss provision. Income on finance receivables is accrued monthly based on each static pool’s effective interest rate. This interest rate is estimated based on the timing and amount of anticipated cash flows using the Company’s proprietary collection model. Monthly cash flows greater than the interest accrual will reduce the carrying value of the static pool. Likewise, monthly cash flows that are less than the monthly accrual will accrete the carrying balance. Each pool is reviewed monthly and compared to the Company’s models to ensure complete amortization of the carrying balance by the end of each pool’s life.
In the event that cash collections would be inadequate to amortize the carrying balance, an impairment charge would be taken with a corresponding write-off of the receivable balance. Accordingly, we do not maintain an allowance for credit losses.
The agreements to purchase the aforementioned receivables include general representations and warranties from the sellers covering account holder death or bankruptcy, and accounts settled or disputed prior to sale. The representation and warranty period permitting the return of these accounts from the Company to the seller is typically 90 to 180 days.
Commissions:The Company also receives commission revenue for collections they make on behalf of clients, which may be credit organizations or other owners of defaulted consumer receivables. These portfolios are owned by the clients; however, the collection effort is outsourced to the Company under a commission fee arrangement based upon the amount the Company collects. Revenue is recognized at the time funds are received form clients. A loss reserve or allowance amount will be created if there is doubt that fees billed to the client for services rendered will be paid.
Net gain on cash sales of finance receivables:Net gain on cash sales of finance receivables representing the difference between the sales price and the unamortized value of the finance receivables are recognized when finance receivables are sold.
The Company applies a financial components approach that focuses on control when accounting and reporting for transfers and servicing of financial assets and extinguishments of liabilities. Under that approach, after a transfer of financial assets, an entity recognizes the financial and servicing assets it controls and the liabilities it has incurred, eliminates financial assets when control has been surrendered, and eliminates liabilities when extinguished. This approach provides consistent standards for distinguishing transfers of financial assets that are sales from transfers that are secured borrowings.
Property and equipment:Property and equipment, including improvements that significantly add to the productive capacity or extend useful life, are recorded at cost, while maintenance and repairs are expensed currently. Property and equipment are depreciated over their useful lives using the straight-line method of depreciation. Software and computer equipment are depreciated over three to five years. Furniture and fixtures are depreciated over five years. Equipment is depreciated over five to seven years. Leasehold improvements are depreciated over the remaining life of the leases, which range from three to five years. Building Improvements are depreciated over ten to thirty-nine years.
Advertising costs:Advertising costs are expensed when incurred. Total advertising costs are considered immaterial for separate disclosure and are presented by period:
| Six Months Ended | ||||||||||||||||||||||||||||
| Years Ended December 31, | June 30, | |||||||||||||||||||||||||||
| 1997 | 1998 | 1999 | 2000 | 2001 | 2001 | 2002 | ||||||||||||||||||||||
| Advertising/marketing | $ | 3,988 | $ | 22,559 | $ | 22,559 | $ | 44,561 | $ | 38,115 | $ | 17,455 | $ | 5,231 | ||||||||||||||
Operating leases: General abatements or prepaid leasing costs are recognized on a straight-line basis over the life of the lease. Any stipulated escalation clauses that are considered to be reasonable and ordinary are expensed as incurred.
F-8
NOTES TO CONSOLIDATED FINANCIAL STATEMENTS — (Continued)
Pro forma earnings per share: Basic earnings per share reflect net income adjusted for pro forma income tax provision divided by the weighted-average number shares outstanding. Diluted earnings per share include the effect of dilutive stock warrants outstanding during the period.
Income taxes:PRA and its subsidiaries are limited liability companies. As such, federal and state tax regulations provide that income for the Company is includable in the tax return of the capital and operating members.
Use of estimates:The preparation of financial statements in conformity with accounting principles generally accepted in the United States of America requires management to make estimates and assumptions that affect the reported amounts of assets and liabilities and disclosure of contingent assets and liabilities at the date of the financial statements and the reported amounts of revenues and expenses during the reporting period. Actual results could differ from those estimates.
Significant estimates have been made by management with respect to the estimates of the timing and amounts of future cash flows of portfolios. Actual results could differ from these estimates making it reasonably possible that a change in these estimates could occur within one year. On a monthly basis, management reviews the estimate of future collections, and it is reasonably possible that its assessment of collectibility may change based on actual results and other factors.
Reclassifications:Certain 1999, 2000 and 2001 amounts have been reclassified to conform to the 2002 presentation.
| 3. | Finance Receivables: |
As of December 31, 1999, 2000 and 2001 and June 30, 2002, the Company had $28,139,051, $41,124,377, $47,986,744 and $51,055,102, respectively, remaining of finance receivables. These amounts represent 141, 202, 258 and 292 pools of accounts as of December 31, 1999, 2000 and 2001 and June 30, 2002, respectively.
Changes in finance receivables for the periods ended December 31, 1999, 2000 and 2001 and June 30, 2002 were as follows:
| Six Months | |||||||||||||||||
| Years Ended December 31, | Ended June 30, | ||||||||||||||||
| 1999 | 2000 | 2001 | 2002 | ||||||||||||||
| Balance at beginning of period | $ | 15,471,538 | $ | 28,139,051 | $ | 41,124,377 | $ | 47,986,744 | |||||||||
| Acquisitions of finance receivables, net of buybacks | 18,853,787 | 25,035,237 | 33,491,211 | 16,232,137 | |||||||||||||
| Cash collections | (17,362,117 | ) | (30,732,693 | ) | (53,147,672 | ) | (37,180,986 | ) | |||||||||
| Income recognized on finance receivables | 11,745,876 | 18,990,695 | 31,220,857 | 24,017,807 | |||||||||||||
| Cash collections applied to principal | (5,616,211 | ) | (11,741,998 | ) | (21,926,815 | ) | (13,163,179 | ) | |||||||||
| Cost of finance receivables sold, net of allowance for returns | (570,033 | ) | (307,913 | ) | (4,702,029 | ) | (600 | ) | |||||||||
| Balance at end of period | $ | 28,139,051 | $ | 41,124,377 | $ | 47,986,744 | $ | 51,055,102 | |||||||||
F-9
NOTES TO CONSOLIDATED FINANCIAL STATEMENTS — (Continued)
At the time of acquisition, the life of each pool is generally set at between 60 and 72 months based upon the proprietary models of the Company. As of June 30, 2002 the Company has $51,055,102 in finance receivables included in the Statement of Financial Position. Based upon current projections, cash collections applied to principal will be as follows:
| June 30, 2003 | $ | 16,747,425 | ||
| June 30, 2004 | 14,095,580 | |||
| June 30, 2005 | 11,236,954 | |||
| June 30, 2006 | 7,102,843 | |||
| June 30, 2007 | 1,732,307 | |||
| June 30, 2008 | 139,527 | |||
| June 30, 2009 | 466 |
| 4. | Operating Leases: |
The Company rents office space and equipment under operating leases. Rental expense was $376,759, $698,256, $777,676 and $411,007 for the years ended December 31, 1999, 2000 and 2001 and the six months ended June 30, 2002.
Future minimum lease payments at June 30, 2002 are as follows:
| 2002 | $ | 391,906 | ||
| 2003 | 707,160 | |||
| 2004 | 727,319 | |||
| 2005 | 733,855 | |||
| 2006 | 363,279 | |||
| Thereafter | 4,211 | |||
| $ | 2,927,730 | |||
| 5. | Capital Leases: |
Leased assets included in property and equipment consist of the following:
| December 31, | December 31, | June 30, | ||||||||||
| 2000 | 2001 | 2002 | ||||||||||
| Software | $ | 116,650 | $ | 375,022 | $ | 337,658 | ||||||
| Computer equipment | 141,232 | 319,535 | 297,417 | |||||||||
| Furniture and fixtures | 361,586 | 600,564 | 600,564 | |||||||||
| Equipment | — | — | 27,249 | |||||||||
| Less accumulated depreciation | (114,456 | ) | (352,425 | ) | (449,319 | ) | ||||||
| $ | 505,012 | $ | 942,696 | $ | 813,569 | |||||||
Depreciation expense recognized on capital leases for the years ended December 31, 1999, 2000 and 2001 and the six months ended June 30, 2002 was $28,441, $79,558, $238,719 and $131,241, respectively.
F-10
NOTES TO CONSOLIDATED FINANCIAL STATEMENTS — (Continued)
Commitments for minimum annual rental payments for these leases as of June 30, 2002 are as follows:
| 2002 | $ | 208,991 | ||
| 2003 | 309,208 | |||
| 2004 | 169,102 | |||
| 2005 | 70,834 | |||
| 2006 | 7,365 | |||
| Thereafter | — | |||
| 765,500 | ||||
| Less amount representing taxes and interest | 90,371 | |||
| Present value of net minimum lease payments | $ | 675,129 | ||
| 6. | Modeling Agreement: |
On August 18, 1999, the Company entered into an agreement (the “Modeling Agreement”) with an external third party (the “Modeling Company”). The term of the Modeling Agreement was 60 months. In accordance with the Modeling Agreement, the Modeling Company was exclusively providing the Company with statistical modeling.
For these services, the Company paid a combination of fixed and variable charges. The Company guaranteed a volume of accounts to satisfy the variable component of the charge. This guaranteed volume was calculated on a rolling six-month basis.
The Company also awarded the Modeling Company warrants to acquire 200,000 membership units (see Note 12). The exercise price is $4.20 per unit. The Company had the right to terminate this Modeling Agreement at any time with at least two months’ prior notice. The Modeling Company had the right to terminate this Modeling Agreement after 30 months.
The Company terminated the Modeling Agreement on August 15, 2001 and cancelled warrants to acquire 120,000 membership units previously awarded (see Note 12).
| 7. | 401(k) Retirement Plan: |
Effective October 1, 1998, the Company implemented a defined contribution plan. Under the Plan, all employees over 21 years of age are eligible to make voluntary contributions to the Plan up to 15% of their compensation, subject to Internal Revenue Service limitations, after completing six months of service, as defined in the Plan. The Company makes matching contributions of up to 4% of an employee’s salary. Such contributions vest immediately. Total compensation expense related to these contributions was $68,901, $152,983, $198,627 and $135,407 for the years ended December 31, 1999, 2000 and 2001 and the six months ended June 30, 2002, respectively.
F-11
NOTES TO CONSOLIDATED FINANCIAL STATEMENTS — (Continued)
8. Revolving Lines of Credit:
Amounts outstanding under revolving lines of credit at December 31, 2000 and 2001 and June 30, 2002 were as follows:
| 2000 | 2001 | 2002 | ||||||||||
| Line of credit with commercial lender, originated September 2001, collateralized by all receivables, collections on receivables and assets of PRA III; expires on September 15, 2005; interest is based on LIBOR and was 6.25% and 6.37% at December 31, 2001 and June 30, 2002, respectively; total credit available $40 million | $ | — | $ | 25,000,000 | $ | 25,000,000 | ||||||
| Line of credit with commercial lender, originated May 2000, collateralized by all receivables, collections on receivables and assets of the Company with the exception of PRA AG Funding and certain assets of PRA Holding I (see Note 11); expires on May 17, 2004; interest is based on prime and was 12.50% at December 31, 2000; paid off September 18, 2001 | 19,470,000 | — | — | |||||||||
| Line of credit with related party, originated December 1999, collateralized by all assets of PRA AG Funding; the PRA AG Funding’s interest rate was 12.00% at December 31, 2000; total credit available $12.5 million; paid off December 31, 2001 | 2,696,094 | — | — | |||||||||
| $ | 22,166,094 | $ | 25,000,000 | $ | 25,000,000 | |||||||
On December 30, 1999, PRA AG Funding borrowed its first loan under the credit facility with AG PRA 1999 Funding Co., (“AG 1999”), an affiliate of Angelo, Gordon & Co. Terms of the credit facility included the possibility of the lender earning contingent interest and included the issuance of warrants to acquire 125,000 units to AG 1999 (see Note 12). In December 2001, PRA AG Funding paid off all outstanding loans under the credit facility with AG 1999 and incurred an expense of $300,000 to extinguish the contingent interest provision. Of this amount, $191,741 is considered an early extinguishment of debt pursuant to Statement of Financial Accounting Standards No. 4 (SFAS No. 4) “Reporting Gains and Losses from Extinguishment of Debt.” The Company incurred interest expense related to the credit facility of $0, $412,974 and $450,532 during the years ended December 31, 1999, 2000 and 2001, respectively. The PRA AG Funding has no outstanding liability with AG 1999 at December 31, 2001 and June 30, 2002. The credit facility’s expiration date was modified during 2002 to expire on June 30, 2002. It was subsequently replaced with another $2.5 million facility with another financial institution after June 30, 2002.
During May 2000, the Company arranged with a new commercial lender to provide financing under a revolving line of credit of up to $20 million. Upon approval of the line of credit, the Company immediately utilized the initial draw to pay down the other commercial lender’s outstanding balance and the institutional lender’s outstanding balance. This line of credit was paid in full and terminated on September 18, 2001. The unamortized remaining line of credit acquisition costs of $231,564 were expensed as an extraordinary loss as this is an early extinguishment of debt pursuant to SFAS No. 4 “Reporting Gains and Losses from Extinguishment of Debt”.
F-12
NOTES TO CONSOLIDATED FINANCIAL STATEMENTS — (Continued)
On September 18, 2001, PRA III arranged with a new commercial lender to provide financing under a revolving line of credit of up to $40 million. The initial draw of $20 million was utilized to facilitate the purchase of all the finance receivable portfolios from PRA and PRA II. PRA then used those funds to terminate the existing line of credit agreement (May 2000) as described above. An additional $5 million was drawn to purchase additional portfolios from third parties in the normal course of business. Restrictive covenants under this agreement include:
| • | restrictions on monthly borrowings in excess of $4 million per month and quarterly borrowings in excess of $10 million; | |
| • | a maximum leverage ratio of not greater than 4 to 1 and net income of at least $0.01, calculated on a consolidated basis; | |
| • | a restriction on distributions in excess of 75% of our net income for any year; | |
| • | compliance with certain special purpose vehicle and corporate separateness covenants; and | |
| • | restrictions on change of control. |
As of June 30, 2002 the Company is in compliance with all of the covenants of this agreement. Upon consummation of the reorganization discussed in Note 15, the Company will need a waiver in order to remain in compliance with the terms of the agreement.
In addition, PRA AG Funding, LLC maintains a $2.5 million revolving line of credit, pursuant to an agreement entered into with RBC Centura Bank and, which extends through July 2003. The line of credit bears interest at a spread over LIBOR. The terms of this agreement require that PRA AG Funding maintain a current ratio of 1.6:1.0 or greater, the current ratio being defined to include finance receivables as a current asset and to include the credit facility in place as of June 30, 2002 as a current liability. The agreement further requires that PRA AG Funding maintain a debt to tangible net worth ratio of 1.5:1.0 or less and a minimum balance sheet cash position at month end of $2 million. Distributions are limited under the terms of the facility to 75% of net income. PRA AG Funding is in full compliance with these covenants. This $2.5 million facility had no amounts outstanding as of June 30, 2002.
9. Property and Equipment:
Property and equipment, at cost, consist of the following as of December 31, 2000 and 2001 and June 30, 2002:
| December 31, | December 31, | ||||||||||||
| 2000 | 2001 | June 30, 2002 | |||||||||||
| Software | $ | 530,533 | $ | 1,036,172 | $ | 1,191,918 | |||||||
| Computer equipment | 965,995 | 1,130,786 | 1,273,353 | ||||||||||
| Furniture and fixtures | 702,808 | 848,901 | 913,386 | ||||||||||
| Equipment | 300,340 | 640,574 | 694,350 | ||||||||||
| Leasehold improvements | 171,135 | 277,469 | 277,469 | ||||||||||
| Building and improvements | 713,942 | 1,057,643 | 1,127,973 | ||||||||||
| Land | 10,515 | 100,515 | 100,515 | ||||||||||
| Less accumulated depreciation | (1,177,849 | ) | (1,712,484 | ) | (2,146,047 | ) | |||||||
| Net property and equipment | $ | 2,217,419 | $ | 3,379,576 | $ | 3,432,917 | |||||||
F-13
NOTES TO CONSOLIDATED FINANCIAL STATEMENTS — (Continued)
10. Hedging Activity:
During 2001, the Company entered into an interest rate hedging transaction for the purpose of managing exposure to fluctuations in interest rates related to variable rate financing. As of December 31, 2001 and June 30, 2002, the Company had an interest rate swap transaction which fixed the interest rate on $10 million of its outstanding debt with the commercial lender. The interest rate swap agreement requires payment or receipt of the difference between a fixed rate of 5.33% and a variable rate of interest based on 1-month LIBOR. The unrealized gains and losses associated with the change in market value of the interest rate swap are recognized as other comprehensive income. This swap transaction expires in May 2004.
The only expenses incurred related to the swap agreement were interest expenses for the year ending December 31, 2001 of $118,944 and $175,093 for the six months ending June 30, 2002. The net interest payments are a component of “Interest Expense” on the income statement and a reduction of net income in the cash flow statement.
11. Long-Term Debt:
In July 2000, the Company purchased a building in Hutchinson, Kansas. The building was financed with a commercial loan for $550,000 with a variable interest rate based on LIBOR. This commercial loan is collateralised by the building. Interest rates varied between 8.87% and 9.17% in 2000, 4.38% and 9.26% in 2001 and 4.08% and 4.22% in the first six months of 2002. Monthly principal payments on the loan are $4,583 for an amortized term of 10 years. A balloon payment of $275,000 is due July 21, 2005, which results in a five-year principal payout. The loan matures July 21, 2005.
On February 9, 2001, the Company purchased a generator for its Norfolk location. The generator was financed with a commercial loan for $107,000 with a fixed rate of 7.9%. This commercial loan is collateralized by the generator. Monthly payments on the loan are $2,170 and the loan matures on February 1, 2006.
On February 20, 2002, the Company completed the construction of a satellite parking lot at its Norfolk location. The parking lot was financed with a commercial loan for $500,000 with a fixed rate of 6.47%. This commercial loan is collateralized by the parking lot. The first six months were interest only payments. Beginning October 1, 2002, there is a fixed monthly payment of $9,797 and the loan matures September 1, 2007.
Annual payments including interest on the loans outstanding as of June 30, 2002 are as follows:
| 2002 | $ | 89,306 | |||
| 2003 | 219,090 | ||||
| 2004 | 216,248 | ||||
| 2005 | 465,455 | ||||
| 2006 | 121,905 | ||||
| 2007 and beyond | 88,174 | ||||
| 1,200,178 | |||||
| Less amount representing interest | (168,758 | ) | |||
| Principal due | $ | 1,031,420 | |||
Under each of the commercial loans discussed above, the Company is subject to certain covenants the most restrictive of which include minimum net worth requirements and the maintenance of certain financial ratios. As of December 31, 2000 and 2001 and June 30, 2002 the Company was in compliance with the debt covenants specified in the lending agreements.
F-14
NOTES TO CONSOLIDATED FINANCIAL STATEMENTS — (Continued)
12. Members’ Equity:
There are two classes of members in PRA: operating members and capital members. On April 6, 1999, PRA amended and restated its limited liability company operating agreement (the “Agreement”), to authorize the issuance of 20,000,000 membership units. As of December 31, 1999, 2000 and 2001 and June 30, 2002, 10,000,000 membership units were outstanding. Pursuant to the Agreement, the capital members own 8,797,000 membership units or 87.97% of the business, while the operating members own the remaining 1,203,000 membership units or 12.03%. Allocations and distributions of profits and losses are based on the aforementioned percentages. In accordance with the Agreement, capital members and operating members have the same economic rights. Capital members are entitled to elect 3 of the 5 members of the Management Committee of the LLC while operating members are entitled to elect the remaining 2 members. PRA is permitted to make distributions to the Members. During the six months ended June 30, 2002, quarterly tax draws were made to the Members to allow for the payment of quarterly estimated taxes. Additional tax draw distributions were made by PRA to its Members during the three months ended September 30, 2002. The capital members received $2,639,100 and the operating members received $713,954 of the distribution. These distributions did not exceed the Company’s consolidated earnings during the previous 12 months.
In accordance with the Agreement, the PRA management committee is authorized to issue warrants to partners, employees or vendors to purchase membership units. Generally, warrants granted have a term between 5 and 7 years and vest within 3 years. Warrants have been issued at or above the fair market value on the date of grant. Warrants vest and expire according to terms established at the grant date.
The following summarizes all warrant related transactions from January 1, 1999 through June 30, 2002:
| Average | |||||||||
| Warrants | Exercise | ||||||||
| Outstanding | Price | ||||||||
| January 1, 1999 | — | $ | — | ||||||
| Granted | 2,325,000 | 4.17 | |||||||
| Exercised | — | — | |||||||
| Cancelled | — | — | |||||||
| December 31, 1999 | 2,325,000 | 4.17 | |||||||
| Granted | 65,000 | 4.20 | |||||||
| Exercised | — | — | |||||||
| Cancelled | (230,000 | ) | 4.20 | ||||||
| December 31, 2000 | 2,160,000 | 4.17 | |||||||
| Granted | 155,000 | 4.20 | |||||||
| Exercised | — | — | |||||||
| Cancelled | (120,000 | ) | 4.20 | ||||||
| December 31, 2001 | 2,195,000 | 4.17 | |||||||
| Granted | 50,000 | 10.00 | |||||||
| Exercised | — | — | |||||||
| Cancelled | (10,000 | ) | 4.20 | ||||||
| June 30, 2002 | 2,235,000 | $ | 4.30 | ||||||
At December 31, 1999, 2000 and 2001 and June 30, 2002, the Company had exercisable warrants outstanding of 125,000, 795,000, 1,406,667 and 2,066,667, respectively. Of the 2,066,667 warrants outstanding, all but 205,000 were issued to employees and operating members of PRA. Of the 205,000 issued to non-employees, 125,000 were issued to AG 1999 (see footnote 8) and 80,000 were issued and
F-15
NOTES TO CONSOLIDATED FINANCIAL STATEMENTS — (Continued)
vested to SMR Research Corporation, a vendor of the Company in connection with a business agreement to utilize certain software. All of the warrants granted in the years ended December 31, 1999, 2000 and 2001 vest in 3 years except for the 200,000 warrants granted to SMR Research Corporation in 1999 of which 20,000 vested immediately and 60,000 were scheduled to vest in each of the next 3 years and the 125,000 warrants granted to AG 1999 in 1999 which vested immediately. The 50,000 warrants granted in the six months ended June 30, 2002 vest 15,000 in one year, 10,000 in each of the 3 subsequent years and 5,000 based on performance which is expected to occur in the first year. The total number of warrants that will not vest is 125,000; 75,000 of which were granted in 2001 and 50,000 of which were granted in 2002. For the warrants that accelerate due to the public offering discussed in footnote 15, an expense of $15,000 will be incurred in fiscal 2002, instead of 2003 and 2004 which would have been prescribed under the normal vesting schedule in accordance with SFAS No. 123.
The warrants issued to AG 1999 and SMR Research Corporation would be convertible into capital member units and all other warrants would be convertible into operating member units.
The following information is as of June 30, 2002:
| Warrants Exercisable | ||||||||||||||||
| Weighted- | ||||||||||||||||
| Average | Weighted- | Weighted- | ||||||||||||||
| Remaining | Average | Average | ||||||||||||||
| Contractual | Exercise | Number | Exercise | |||||||||||||
| Exercise Prices | Life (Years) | Price | Exercisable | Price | ||||||||||||
| $4.20 | 3.69 | $ | 4.20 | 1,941,667 | $ | 4.20 | ||||||||||
| $3.60 | 2.75 | $ | 3.60 | 125,000 | $ | 3.60 | ||||||||||
| $10.00 | 5.95 | $ | 10.00 | — | $ | 10.00 | ||||||||||
| Total at June 30, 2002 | 3.69 | $ | 4.30 | 2,066,667 | $ | 4.16 | ||||||||||
The Company applies Accounting Principles Board Opinion No. 25, “Accounting for Stock Issued to Employees,” in accounting for stock based employee compensation arrangements whereby no compensation cost related to stock options is deducted in determining net income for warrants granted at or above fair value. Had compensation cost for warrant grants under the Management Agreement been determined pursuant to SFAS No. 123, “Accounting for Stock-Based Compensation”, the Company’s net income would have decreased accordingly. Using a fair-value (minimum value calculation), the following assumptions were used:
| Warrants issue year: | 1999 | 2000 | 2001 | 2002 | |||||||||||||
| Expected life from vest date (in years): | |||||||||||||||||
| Employees | N/A | N/A | 4.00 | 3.00 | |||||||||||||
| Operating members | 6.00 | 5.00 | N/A | N/A | |||||||||||||
| Risk-free interest rates | 5.37%-6.47% | 6.30 | % | 4.66%-4.77% | 4.53 | % | |||||||||||
| Volatility | N/A | N/A | N/A | N/A | |||||||||||||
| Dividend Yield | N/A | N/A | N/A | N/A | |||||||||||||
The fair value model utilizes the risk-free interest rate at grant with an expected exercise date sometime in the future generally assuming an exercise date in the first half of 2005. In addition, warrant valuation models require the input of highly subjective assumptions, including the expected stock price volatility. The Company’s warrants have characteristics significantly different from those of traded warrants, and changes in the subjective input assumptions can materially affect the fair value estimate. Based upon the above assumptions, the weighted average fair value of employee warrants granted during fiscal years 1999, 2000 and 2001 and the first six months of 2002 was zero, $0.21, $0.35 and $1.24, respectively.
F-16
NOTES TO CONSOLIDATED FINANCIAL STATEMENTS — (Continued)
For purposes of pro forma disclosures, the estimated fair value of the warrants is amortized over the warrants’ vesting period. Had the Company’s warrants been accounted for under SFAS No. 123, net income would have been reduced to the following pro forma amounts:
| Net income: | 1999 | 2000 | 2001 | 2002 | ||||||||||||
| As reported | $ | 1,824,942 | $ | 2,540,135 | $ | 5,626,334 | $ | 7,964,656 | ||||||||
| Pro forma | $ | 1,824,942 | $ | 2,537,908 | $ | 5,615,191 | $ | 7,916,386 | ||||||||
Effective August 18, 1999, PRA’s management committee issued warrants to acquire 200,000 membership units to SMR Research Corporation. The warrants were to vest over a 60 month period and are exercisable at $4.20 per unit. The warrants vested as to 80,000 membership units and the remaining 120,000 membership units were cancelled upon the termination of an agreement between the Company and SMR Research Corporation. The value of the warrants was calculated using the intrinsic method and no expense was recognized on these warrants. The fair value approach was then applied, as designated by SFAS No. 123, which utilizes a comparison of the discounted value of the underlying units discounted using a risk-free interest rate at the date of grant, these warrants were shown to have a negative present value and as such no expense has been recorded.
Effective December 30, 1999, PRA’s management committee issued warrants to acquire 125,000 membership units to an affiliate of Angelo, Gordon & Co. (see Note 8). The warrants immediately vested and are exercisable at $3.60 per unit. The warrants are exercisable in whole or in part and expire March 31, 2005. As these warrants are not issued as compensation to an employee or operating member of the Company, an expense of $51,206 was incurred and recognized during the period from 1999 to 2002. The value of the warrants was calculated using the methodology established for valuing warrants issued to employees and operating members. This fair value approach as designated by SFAS No. 123 utilizes a comparison of the discounted value of the underlying units discounted using a risk-free interest rate at the date of grant.
As of December 31, 1998 and through April 6, 1999, the capital members owned 66.7% of the business, while the operating members owned the remaining 33.3%. Each type of member received a distribution based on a rate of 15% compounded annually and calculated based upon contributed capital amounts. Distributions of profits were allocated based on the aforementioned percentages, unless unrecovered capital or unrecovered preferred returns existed. In that case, unrecovered capital was paid first to all members in proportion to the unrecovered capital balance, then undistributed preferred balances, in proportion to the undistributed preferred balances, and thereafter distributions were based on the ownership percentages.
13. Operating Member Agreement:
The operating member agreement details each operating member’s contribution to the Company. It also sets forth criteria necessary to maintain status as a limited liability company. Additionally, it describes a special discount, which will be applied if an operating member leaves the Company within two years of the commencement date. There are currently six operating members, two of whom are designated as operating managers.
14. Contingencies and Commitments:
The Company has employment agreements with each of its operating members, the terms of which expire on December 31, 2002 or December 31, 2004. Such agreements provide for base salary payments as well as bonuses which are based on the attainment of specific management goals. Remaining compensation under these agreements is approximately $1,753,501. The agreements also contain confidentiality and non-compete provisions.
On December 30, 1999, the Company entered into a $12.5 million dollar credit agreement with AG 1999 that expired on June 30, 2002. Terms of the agreement included the possibility of AG 1999 earning contingent interest. AG 1999 is owned by affiliates of Angelo Gordon, the Company’s majority stockholder, and certain other operating members. Over the term of the agreement, the Company borrowed $6.6 million. In December 2001, the Company repaid all outstanding loans under this agreement and incurred an expense of $300,000 to extinguish the contingent interest provision. The Company incurred
F-17
NOTES TO CONSOLIDATED FINANCIAL STATEMENTS — (Continued)
interest expense related to the agreement of $0, $412,974, and $450,532 during the years ended December 31, 1999, 2000, and 2001, respectively. In addition, in accordance with the agreement the management committee of PRA granted AG 1999 warrants to purchase 125,000 membership units of PRA which were immediately exercisable for $3.60 per unit. The agreement discussed above was entered into after arms’ length negotiations between the related party and the Company.
The Company is from time to time subject to routine litigation incidental to its business. The Company believes that the results of any pending legal proceedings will not have a material adverse effect on the financial condition, results of operations or liquidity of the Company.
15. Subsequent Event (unaudited):
PRA is in the process of offering its common stock for sale in an initial public offering (“IPO”). Assuming the completion of the IPO, PRA will be treated as a C corporation under the Internal Revenue Code and will be subject to corporate income taxes. Accordingly, a pro forma income tax provision for corporate income taxes has been calculated as if PRA was taxable as a C corporation for all periods presented.
In August 2002 PRA formed a new Delaware corporation, Portfolio Recovery Associates, Inc. Immediately prior to the offering the former members of PRA will exchange their units of PRA for common stock of the corporation and will accordingly own all of the issued and outstanding shares of Portfolio Recovery Associates, Inc. which will own all of the outstanding membership units of PRA. Each capital or operating member unit will be exchanged for one share of common stock. Prior to this exchange transaction, Portfolio Recovery Associates, Inc. will not have conducted any business and has no assets or liabilities. The legal name of Portfolio Recovery Associates, Inc. has been retroactively applied to all periods presented in these financial statements.
16. Pro Forma Net Income
The Company presented pro forma tax information assuming they have been a taxable corporation since inception and assuming tax rates equal to the rates that would have been in effect had they been required to report income tax expense in such years. The Company’s pro forma income tax expense differed from the corporate statutory federal income tax for the years ended December 31, 1999, 2000, 2001 and the six months ended June 20, 2002 as follows:
| Six Months | ||||||||||||||||
| Years Ended December 31, | Ended June 30, | |||||||||||||||
| 1999 | 2000 | 2001 | 2002 | |||||||||||||
| Income Tax Reconciliation | ||||||||||||||||
| Federal tax at statutory rate | $ | 620,480 | $ | 863,646 | $ | 1,912,953 | $ | 2,750,574 | ||||||||
| Non-deductible expense | 4,136 | 4,045 | 6,551 | 9,443 | ||||||||||||
| State income tax, net of federal benefit | 72,749 | 100,199 | 226,975 | 319,162 | ||||||||||||
| State tax credit, net of federal benefit | — | (66,990 | ) | (45,870 | ) | — | ||||||||||
Total | $ | 697,366 | $ | 900,899 | $ | 2,100,609 | $ | 3,079,180 | ||||||||
Included in the pro-forma income tax expense were state tax credits actually earned by the Company in connection with our Kansas operations.
| Year Ended December 31, 2001 | Six Months Ended June 30, 2002 | |||||||||||||||||||||||
| Per Share | Per Share | |||||||||||||||||||||||
| Income | Shares | Amount | Income | Shares | Amount | |||||||||||||||||||
| Basic pro forma net income per share | $ | 3,525,725 | 10,000,000 | $ | 0.35 | $ | 4,885,479 | 10,000,000 | $ | 0.49 | ||||||||||||||
| Effect of diluted warrants outstanding | 1,457,741 | 1,486,128 | ||||||||||||||||||||||
| Diluted pro forma net income per share | $ | 3,525,725 | 11,457,741 | $ | 0.31 | $ | 4,885,479 | 11,486,128 | $ | 0.43 | ||||||||||||||
F-18
3,470,000 Shares
Common Stock
PROSPECTUS
, 2002
You should rely only on the information contained in this prospectus. We have not authorized anyone to provide you with information different from that which is set forth in this prospectus. We are offering to sell shares of our common stock and seeking offers to buy shares of our common stock only in jurisdictions where offers and sales are permitted. The information contained in this prospectus is accurate only as of the date of this prospectus, regardless of the time of delivery of this prospectus or any sale of these securities. Our business, financial condition, results of operation and prospects may have changed after the date of this prospectus.
Until , 2002 (25 days after the date of this prospectus), all dealers that effect transactions in these securities, whether or not participating in this offering, may be required to deliver a prospectus. This is in addition to the dealers’ obligation to deliver a prospectus when acting as underwriters and with respect to their unsold allotments or subscriptions.
| William Blair & Company | U.S. Bancorp Piper Jaffray |
PART II
INFORMATION NOT REQUIRED IN PROSPECTUS
Item 13. Other Expenses of Issuance and Distribution
The following table sets forth the expenses expected to be incurred in connection with the issuance and distribution of common stock registered hereby, all of which expenses, except for the Securities and Exchange Commission registration fee, are estimated.
| Securities and Exchange Commission registration fee | $ | 5,290 | |||
| NASD filing fee | 6,250 | ||||
| Nasdaq listing fee | 1,000 | ||||
| Printing and engraving fees and expenses | 100,000 | ||||
| Legal fees and expenses | 215,000 | ||||
| Accounting fees and expenses | 150,000 | ||||
| “Blue sky” fees and expenses | 5,000 | ||||
| Transfer agent and registrar fees and expenses | 10,000 | ||||
| Miscellaneous expenses | 7,464 | ||||
| Total | $ | 500,000 | |||
Item 14. Indemnification of Directors and Officers
The registrant’s certificate of incorporation (the “Certificate”) provides that each person who was or is made a party or is threatened to be made a party to or is involved in any threatened, pending or completed action, suit or proceeding, whether civil, criminal, administrative or investigative (hereinafter a “proceeding”), by reason of the fact that he or she, or a person of whom he or she is the legal representative, is or was a director, officer or employee of the registrant or is or was serving at the request of the registrant as a director, officer, employee or agent of another corporation, partnership, joint venture, trust or other enterprise, including service with respect to employee benefit plans, whether the basis of such proceeding is alleged action in an official capacity as a director, officer, employee or agent or alleged action in any other capacity while serving as a director, officer, employee or agent, shall be indemnified by the registrant to the fullest extent permitted by the General Corporation Law of the State of Delaware (the “Delaware Law”) as the same exists or may hereafter be amended (but, in the case of any such amendment, only to the extent that such amendment permits the registrant to provide broader indemnification rights then said law permitted the registrant to provide prior to such amendment) against all expense, liability and loss (including attorneys’ fees, judgments, fines, excise taxes or penalties pursuant to the Employee Retirement Income Security Act of 1974 and amounts paid or to be paid in settlement) reasonably incurred by such person in connection with such proceeding and such indemnification shall continue as to a person who has ceased to be a director, officer, employee or agent and shall inure to the benefit of his or her heirs, executors and administrators; provided, however, that the registrant shall indemnify any such person seeking indemnification in connection with a proceeding initiated by him or her only if such proceeding was authorized by the board of directors, either generally or in the specific instance.
The Delaware Law permits indemnification of a director, officer, employee or agent in civil, criminal, administrative or investigative actions, suits or proceedings (other than an action by or in the right of the corporation) to which such person is a party or is threatened to be made a party by reason of the fact of such relationship with the corporation or the fact that such person is or was serving in a similar capacity with another entity at the request of the corporation against expenses (including attorneys’ fees), judgments, fines and amounts paid in settlement actually and reasonably incurred by him in connection with such action if such person acted in good faith and in a manner he or she reasonably believed to be in or not opposed to the best interests of the corporation, and, with respect to any criminal action or
II-1
The Certificate provides that the right to indemnification contained therein includes the right to be paid by the registrant the expenses incurred in defending any such proceeding in advance of its final disposition in accordance with procedures established from time to time by the board of directors; provided, however, that if the Delaware Law requires, the payment of such expenses incurred by a director, officer or employee in advance of the final disposition of a proceeding shall be made only upon delivery to the registrant of an undertaking by or on behalf of such person to repay all amounts so advanced if it shall ultimately be determined that such person is not entitled to be indemnified by the registrant as authorized in the Certificate or otherwise.
The registrant maintains directors’ and officers’ liability insurance covering certain liabilities incurred by the directors and officers of the registrant in connection with the performance of their duties.
Insofar as indemnification for liabilities arising under the Securities Act of 1933 may be permitted to directors, officers or persons controlling the registrant pursuant to the foregoing provisions, the registrant has been informed that in the opinion of the Securities and Exchange Commission such indemnification is against public policy as expressed in the Act and is therefore unenforceable.
Item 15. Recent Sales of Unregistered Securities
The following is a list of all securities sold by the registrant or its predecessor Portfolio Recovery Associates, L.L.C. within the past three years which, pursuant to the exemption provided by Rule 701
II-2
On December 30, 1999, a subsidiary of the registrant, PRA AG Funding, LLC, entered into a credit agreement with AG PRA 1999 Funding Co., LLC (“AG 1999”) which terminated on June 30, 2002. Pursuant to this credit agreement, AG 1999 provided PRA AG Funding, LLC, with a $12,500,000 credit facility to finance the purchase of pools of delinquent consumer receivables. In accordance with the credit agreement, on December 30, 1999, AG 1999 was issued immediately exercisable warrants to purchase 125,000 membership units of Portfolio Recovery Associates, L.L.C. with an exercise price of $3.60 per unit. As a financially sophisticated investor, this issuance was made to AG 1999 in reliance upon an exemption from the registration requirements of the Securities Act provided by Section 4(2) of the Securities Act. In connection with the equity exchange between the registrant and the members of Portfolio Recovery Associates, L.L.C., these warrants were exchanged by AG 1999 for comparable warrants to purchase 125,000 shares of common stock of the registrant.
As of June 21, 2000, the registrant issued warrants to the following individuals as compensation for services performed, each of whom is an officer of the registrant, to purchase the number of membership units of Portfolio Recovery Associates, L.L.C. indicated next to their respective names, at an exercise price of $4.20 per unit.
| Steve Fredrickson | — | 35,000 | ||
| Craig Grube | — | 15,000 | ||
| Kevin Stevenson | — | 15,000 |
As executive employees these individuals had access to the kind of information which a registration would disclose and this issuance was therefore made in reliance upon an exemption from the registration requirements of the Securities Act provided by Section 4(2) of the Securities Act. In connection with this public offering, the vesting of these warrants was accelerated, and the warrants will therefore be exercisable upon the closing of this offering. In connection with the equity exchange between the registrant and the members of Portfolio Recovery Associates, L.L.C., these warrants were exchanged by the respective holders for comparable warrants to purchase the same number of shares of common stock of the registrant.
As of March 28, 2001, the registrant issued warrants to Robert J. Rey as compensation for services performed, an officer of the registrant, to purchase 100,000 membership units of Portfolio Recovery Associates, L.L.C. with an exercise price of $4.20 per unit. As an executive employee Mr. Rey had access to the kind of information which a registration would disclose and this issuance was therefore made to Mr. Rey in reliance upon an exemption from the registration requirements of the Securities Act provided by Section 4(2) of the Securities Act. In connection with this public offering, the vesting of 25,000 of these warrants was accelerated, and the warrants will therefore be exercisable upon the closing of this offering. In connection with the equity exchange between the registrant and the members of Portfolio Recovery Associates, L.L.C., these warrants were exchanged by Mr. Rey for comparable warrants to purchase the same number of shares of common stock of the registrant.
As of May 7, 2001, the registrant issued warrants to the following individuals as compensation for services performed, each of whom is an officer of the registrant, to purchase the number of membership units of Portfolio Recovery Associates, L.L.C., indicated next to their respective names, at an exercise price of $4.20 per unit.
| William O’Daire | — | 25,000 | ||
| Judith Scott | — | 7,500 | ||
| JoAnn York | — | 7,500 | ||
| Christy Beatty | — | 2,500 | ||
| Patrick Lipsky | — | 2,500 |
II-3
As executive employees these individuals had access to the kind of information which a registration would disclose and this issuance was therefore made in reliance upon an exemption from the registration requirements of the Securities Act provided by Section 4(2) of the Securities Act. In connection with this public offering, the vesting of these warrants was accelerated, and the warrants will therefore be exercisable upon the closing of this offering. In connection with the equity exchange between the registrant and the members of Portfolio Recovery Associates, L.L.C., these warrants were exchanged by the respective holders for comparable warrants to purchase the same number of shares of common stock of the registrant.
As of June 10, 2002, the registrant issued warrants to Michael Jones as compensation for services performed, an employee of the Registrant, to purchase 50,000 membership units of Portfolio Recovery Associates, L.L.C. with an exercise price of $10.00 per unit. As an executive employee Mr. Jones had access to the kind of information which a registration would disclose and this issuance to Mr. Jones was therefore made in reliance upon an exemption from the registration requirements of the Securities Act provided by Section 4(2) of the Securities Act. In connection with the equity exchange between the registrant and the members of Portfolio Recovery Associates, L.L.C., these warrants were exchanged by Mr. Jones for comparable warrants to purchase the same number of shares of common stock of the registrant.
II-4
Item 16. Exhibits and Financial Statement Schedules
(a) Exhibits
The following exhibits are filed as part of this registration statement.
| Exhibit | ||||
| Number | Description | |||
| 1 | .1+ | Underwriting Agreement. | ||
| 2 | .1 | Equity Exchange Agreement among Portfolio Recovery Associates, L.L.C., Portfolio Recovery Associates, Inc and the other parties thereto. | ||
| 3 | .1 | Amended and Restated Certificate of Incorporation of Portfolio Recovery Associates, Inc. | ||
| 3 | .2 | Amended and Restated By-Laws of Portfolio Recovery Associates, Inc. | ||
| 4 | .1+ | Form of Common Stock Certificate. | ||
| 4 | .2 | Form of Warrant. | ||
| 5 | .1 | Opinion of Swidler Berlin Shereff Friedman, LLP. | ||
| 10 | .1+ | Credit Agreement, dated as of December 30, 1999, by and between PRA AG Funding, LLC, AG PRA 1999 Funding Co., LLC. | ||
| 10 | .2+ | Loan Agreement, dated July 20, 2000, by and between PRA Holding I, LLC, Bank of America, N.A. and Portfolio Recovery Associates, L.L.C. | ||
| 10 | .3+ | Loan and Security Agreement, dated September 18, 2001, by and between Westside Funding Corporation, PRA III, LLC, Portfolio Recovery Associates, L.L.C., PRA Receivables Management, LLC (d/b/a Anchor Receivables Management), PRA II, LLC and PRA Holding I, LLC. | ||
| 10 | .4+ | Business Loan Agreement, dated June 28, 2002, by and between PRA AG Funding, LLC and RBC Centura Bank. | ||
| 10 | .5+ | Business Loan Agreement, dated September 24, 2001, by and between PRA Holding I, LLC, Bank of America, N.A. and Portfolio Recovery Associates, L.L.C. | ||
| 10 | .6+ | Amendment to Business Loan Agreement, dated February 20, 2002, by and between PRA Holding I, LLC, Bank of America, N.A. and Portfolio Recovery Associates, L.L.C. | ||
| 10 | .7 | Employment Agreement, dated January 1, 2002, by and between Steven D. Fredrickson and Portfolio Recovery Associates, L.L.C. | ||
| 10 | .8 | Employment Agreement, dated January 1, 2002, by and between Kevin P. Stevenson and Portfolio Recovery Associates, L.L.C. | ||
| 10 | .9 | Employment Agreement, dated January 1, 2002, by and between Craig A. Grube and Portfolio Recovery Associates, L.L.C. | ||
| 10 | .10 | Employment Agreement, dated January 1, 2002, by and between Andrew J. Holmes and Portfolio Recovery Associates, L.L.C. | ||
| 10 | .11 | Employment Agreement, dated January 1, 2002, by and between James L. Keown and Portfolio Recovery Associates, L.L.C. | ||
| 10 | .12 | Portfolio Recovery Associates, Inc. 2002 Stock Option Plan. | ||
| 10 | .13+ | Riverside Commerce Center Office Lease, dated February 12, 1999, by and between Riverside Investors, L.C. and Portfolio Recovery Associates, L.L.C. | ||
| 10 | .14+ | First Amendment to Riverside Commerce Center Office Lease, dated April 27, 1999, by and between Riverside Investors, L.C. and Portfolio Recovery Associates, L.L.C. | ||
| 10 | .15+ | Second Amendment to Riverside Commerce Center Office Lease, dated September 29, 2000, by and between Riverside Investors, L.C. and Portfolio Recovery Associates, L.L.C. | ||
| 21 | .1+ | Subsidiaries of the Registrant. | ||
| 23 | .1+ | Consent of PricewaterhouseCoopers LLP. | ||
| 23 | .2 | Consent of Swidler Berlin Shereff Friedman, LLP (included in Exhibit 5.1). | ||
| 24 | .1+ | Powers of Attorney (included on signature page). | ||
| + | Previously filed. |
II-5
Item 17. Undertakings
The undersigned registrant hereby undertakes to provide to the underwriter at the closing specified in the underwriting agreement certificates in such denominations and registered in such names as required by the underwriter to permit prompt delivery to each purchaser.
Insofar as indemnification for liabilities arising under the Securities Act of 1933 may be permitted to directors, officers and controlling persons of the registrant pursuant to the foregoing provisions, or otherwise, the registrant has been advised that in the opinion of the Securities and Exchange Commission such indemnification is against public policy as expressed in the Act and is, therefore, unenforceable. In the event that a claim for indemnification against such liabilities (other than the payment by the registrant of expenses incurred or paid by a director, officer or controlling person of the registrant in the successful defense of any action, suit or proceeding) is asserted by such director, officer or controlling person in connection with the securities being registered, the registrant will, unless in the opinion of its counsel the matter has been settled by controlling precedent, submit to a court of appropriate jurisdiction the question whether such indemnification by it is against public policy as expressed in the Act and will be governed by the final adjudication of such issue.
The undersigned registrant hereby undertakes that:
| 1. For purposes of determining any liability under the Securities Act of 1933, the information omitted from the form of prospectus filed as part of this registration statement in reliance upon Rule 430A and contained in a form of prospectus filed by the registrant pursuant to Rule 424(b) (1) or (4) or 497(h) under the Securities Act shall be deemed to be part of this registration statement as of the time it was declared effective. | |
| 2. For the purpose of determining any liability under the Securities Act of 1933, each post-effective amendment that contains a form of prospectus shall be deemed to be a new registration statement relating to the securities offered therein, and the offering of such securities at that time shall be deemed to be the initial bona fide offering thereof. |
II-6
SIGNATURES
Pursuant to the requirements of the Securities Act of 1933, the Registrant has duly caused Amendment No. 2 to this Registration Statement to be signed on its behalf by the undersigned, thereunto duly authorized, in the City of Norfolk, in the Commonwealth of Virginia, on October 30, 2002.
| PORTFOLIO RECOVERY ASSOCIATES, INC. |
| By: | /s/ STEVEN D. FREDRICKSON |
| Steven D. Fredrickson | |
| Chief Executive Officer, President and | |
| Chairman of the Board of Directors |
| By: | /s/ KEVIN P. STEVENSON |
| Kevin P. Stevenson | |
| Chief Financial Officer, Senior Vice President, | |
| Treasurer and Assistant Secretary |
Pursuant to the requirements of the Securities Act of 1933, Amendment No. 2 to this Registration Statement has been signed below by the following persons in the capacity and on the dates indicated.
| Signature | Title | Date | ||||
| /s/ STEVEN D. FREDRICKSON Steven D. Fredrickson | Chief Executive Officer and Chairman of the Board of Directors (Principal Executive Officer) | October 30, 2002 | ||||
| /s/ KEVIN P. STEVENSON Kevin P. Stevenson | Senior Vice President, Chief Financial Officer, Treasurer and Assistant Secretary (Principal Financial and Accounting Officer) | October 30, 2002 | ||||
| /s/ DAVID N. ROBERTS David N. Roberts | Director | October 30, 2002 | ||||
II-7