EXHIBIT 99.1b

Annual Meeting
April 30, 2008
Welcome To
7%
Increase
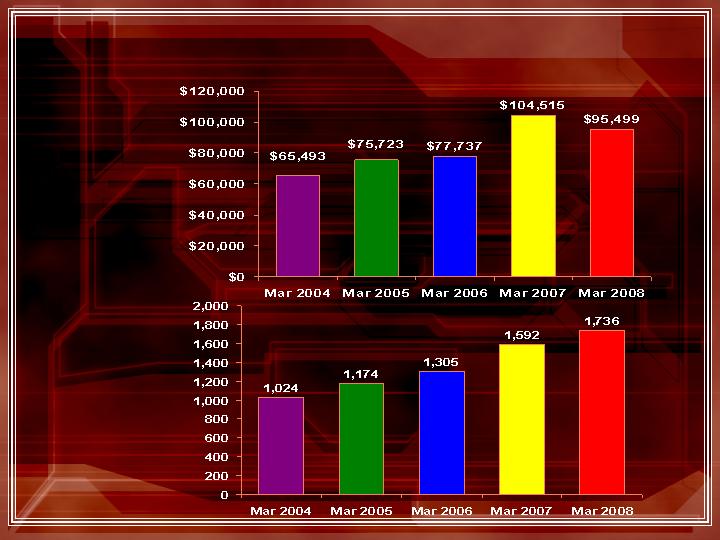
35%
Increase
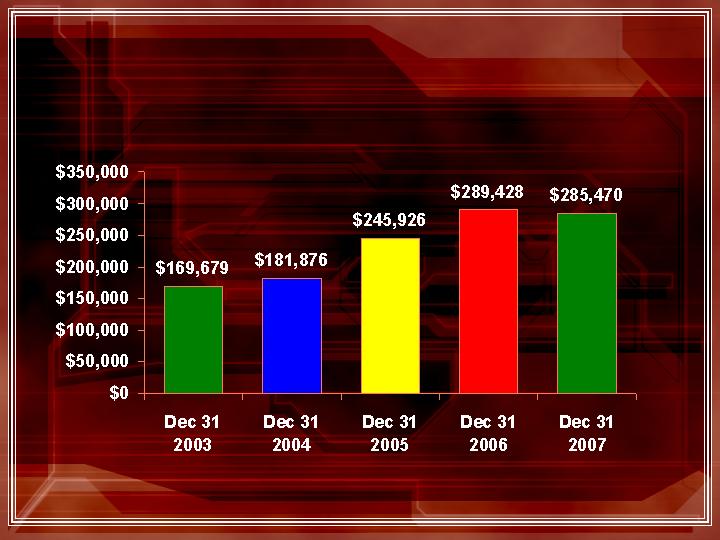
Total Assets
13%
Increase
18%
Increase
1%
Decrease
( in thousands)
2

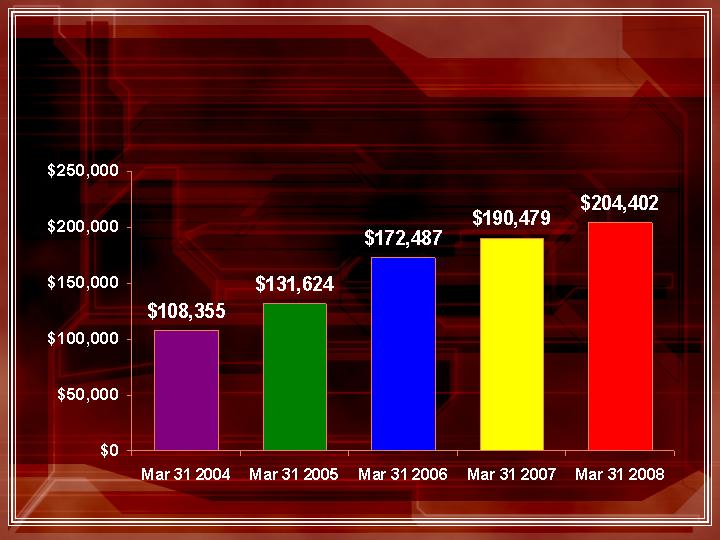
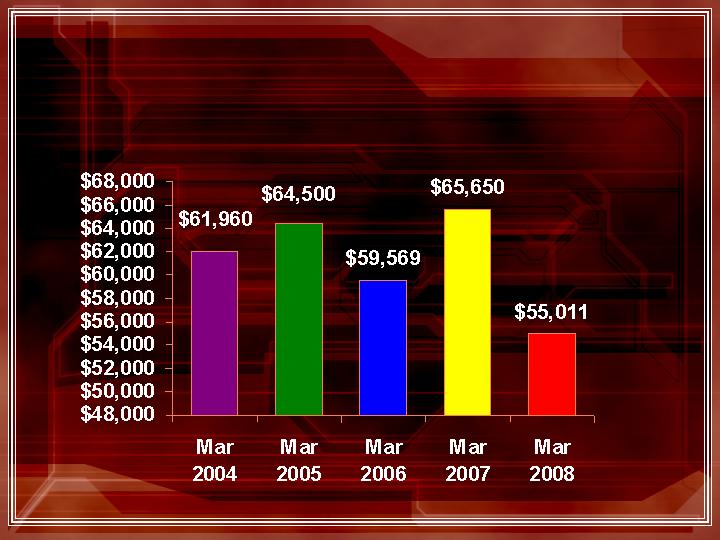
Total Assets
13%
Increase
25%
Increase
14%
Increase
22%
Increase
2%
Decrease
( in thousands)
3

Statement of Operations
( in thousands)
*reflects a one time $449,000 reversal of the valuation allowance for taxes
** reflects a one time $1,200,000 write off of goodwill and a $1,000,000 increase in loan loss
provisions
Year
Net Income
Change From Prior Year
2003
$1,173
+ 555%
2004
$1,359
+
16%
2005
$2,115 *
+ 56%
2006
$2,198
+
4%
2007
$
382 **
-
83
%
4

Net Income 4 Years – Without
Adjustments
2004-2007
* 2005 and 2007 net income without prior page foot noted adjustments, also reflects the costs
associated with our newly opened branches - Madison (September 2006) and Long Valley (May
2007).
(2.7%)
$2,139*
32%
$2,198
22%
$1,663*
16%
$1,359
Net
Income
%
2007
%
2006
%
2005
%
2004
( in thousands)
5

Income Trend
( in thousands)
*reflects a one time $449,000 reversal of the valuation allowance for taxes
** reflects a one time $1,200,000 write off of goodwill and a $1,000,000 increase in loan loss
provisions
2004
2005
2006
2007
2008
1
st
Qtr.
$ 222
$ 262
$ 475
$520
$444
2
nd
Qtr.
313
345
485
536
3
rd
Qtr.
410
457
573
504
4
th
Qtr.
414
1,051*
665
(1,178)**
6
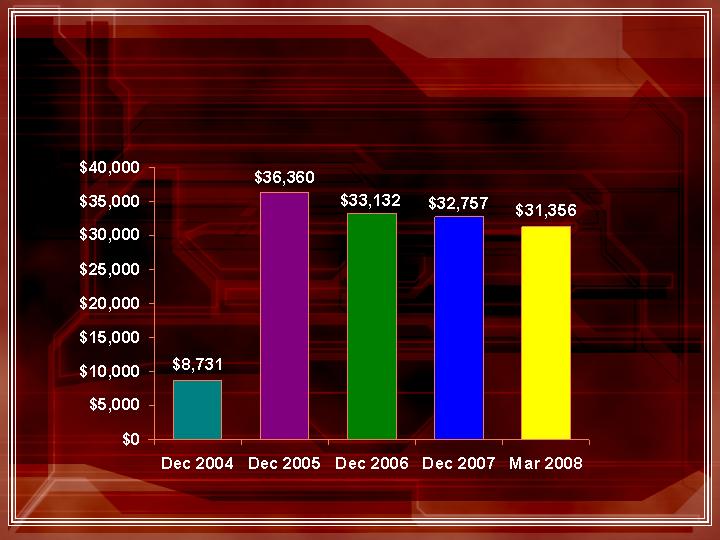
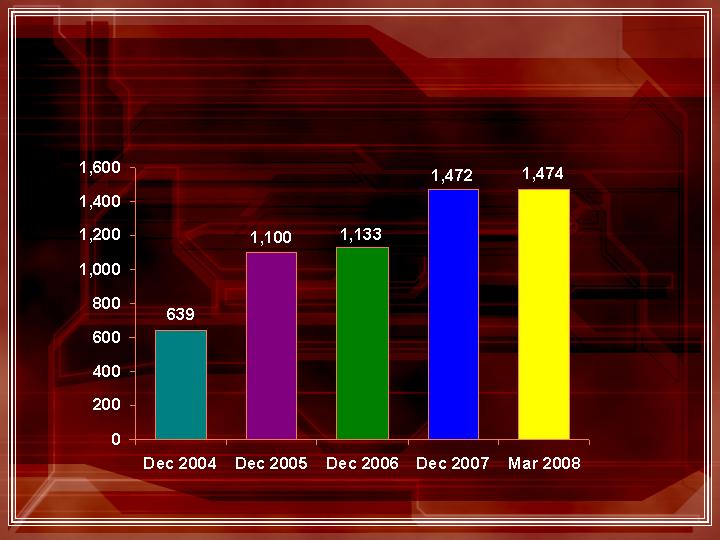
Loan Growth - Total Balances
10%
Increase
20%
Increase
31%
Increase
7%
Increase
10%
Increase
( in thousands)
7
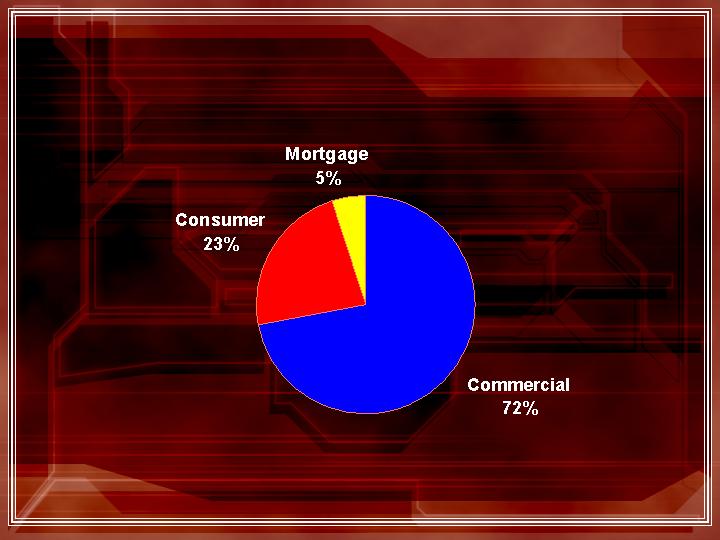
Loan Mix Composition Total Balances
March 31, 2008
8

Net Interest Margin
3.92%
03/31/2007
4.22%
03/31/2008
4.15%
12/31/2006
4.02%
12/31/2007
4.31%
12/31/2005
3.78%
12/31/2004
9

Deposit Growth
Total Deposits
Core Deposits
15%
Increase
22%
Increase
31%
Increase
26%
Increase
14%
Increase
16%
Increase
6%
Decrease
38%
Increase
4%
Decrease
20%
Increase
( in thousands)
10

Deposit Mix - Total Balances
86%
$35,616
$163,590
$51,015
12/31/2006
87%
$31,428
$159,462
$53,783
12/31/2007
90%
$20,731
$141,846
$45,667
12/31/2005
85%
$23,748
$94,066
$37,061
12/31/2004
79%
$30,545
$86,111
$28,995
12/31/2003
Core Deposits as a
% of Total Deposits
Time
Deposits
NOW/Money
Market/Savings
Demand
( in thousands)
11
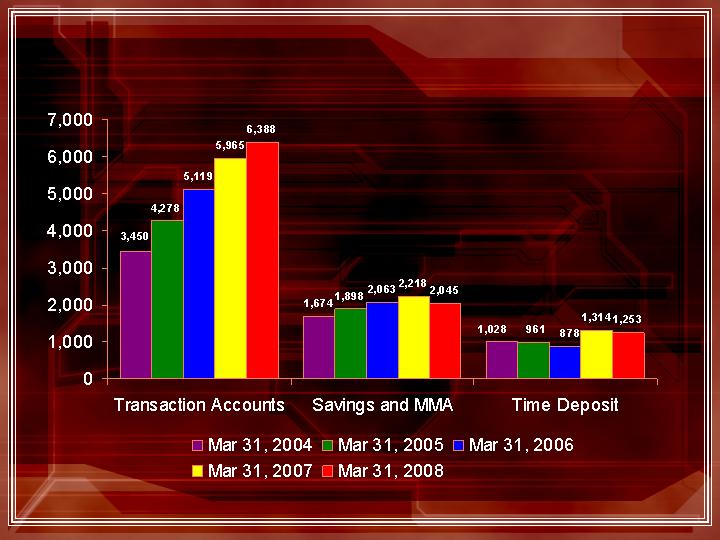
Number of Accounts
12
Paramount Checking
Total Balances
Number of Accounts
22%
Increase
16%
Increase
19%
Increase
15%
Increase
3%
Increase
11%
Increase
9%
Decrease
9%
Increase
34%
Increase
22%
Increase
( in thousands)
13
Paramount Checking - continued
Average Balance Per Account
14
Escrow Ease
Total Balances
( in thousands)
15
Escrow Ease - continued
Number of Client Accounts
16

Transaction Activity
Teller Transactions
Per Month
ACH Transactions
Per Month
27%
Increase
8%
Increase
58%
Increase
34%
Increase
5%
Increase
33%
Increase
8%
Decrease
4%
Increase
6%
Increase
23%
Increase
17

Capital Ratios
( in thousands)
Actual
Well Capitalized
December 31, 2007
Amount
Ratio
Amount
Ratio
Total Capital (to risk
-
weighted assets)
$39,485
16.01%
$2
4
,657
>
10.00%
Tier I Capital (to risk
-
weighted assets)
36,404
14.76
14,794
>
6.00
Tier I Capital (to average asse
ts)
36,404
12.68
14,353
>
5.00
December 31, 2006
Amount
Ratio
Amount
Ratio
Total Capital (to risk
-
weighted assets)
$39,063
16.52%
$23,645
>
10.00%
Tier I Capital (to risk
-
weighted assets)
36,893
15.60
14,187
>
6.00
Tier I Capital (to avera
ge assets)
36,893
13.69
13,475
>
5.00
December 31, 2005
Total Capital (to risk
-
weighted assets)
$26,450
12.73%
$20,772
>
10.00%
Tier I Capital (to risk
-
weighted assets)
24,421
11.76
12,463
>
6.00
Tier I Capital (to average assets)
24,4
21
10.40
11,739
>
5.00
December 31, 2004
Total Capital (to risk
-
weighted assets)
$23,557
13.77%
$17,106
>
10.00%
Tier I Capital (to risk
-
weighted assets)
21,923
12.82
10,263
>
6.00
Tier I Capital (to average assets)
21,923
11.83
9,268
>
5.00
18

Sullivan Financial Services, Inc.
a subsidiary of Somerset Hills Bank
Headquarters
100 Executive Drive, Suite 140
West Orange, NJ 07052
Phone: 973-325-5000
Fax: 973-736-7947
19

Sullivan Financial Services, Inc.
Products and Services
Conventional Mortgage Loans
Fixed and Adjustable Rate Loans
FHA/VA Loans
Jumbo Mortgages
1st Time Buyer Programs
Reverse Mortgages
No Cost Refinances
20

Sullivan Financial Services, Inc.
Loan Volume
2003
2004
2005
2006
2007
Originations
$530,913
,000
$330,491
,000
$379,114
,000
$341,689
,000
$261,168
,000
Originations
2,159
1,297
1,362
1,293
864
Closings
$505,384
,000
$270,803
,000
$311,273
,000
$293,329
,000
$232,
7
05
,000
Closings
1,384
2,0
98
1,091
1,132
781
21

Somerset Hills Wealth Management, LLC
For the Individual:
Financial Planning
Investment Management
Estate Review
Life, Health & Long Term Care
Insurance
Property and Casualty Insurance
22

Somerset Hills Wealth Management, LLC
For the Business Owner:
Business Succession Planning
Buy-Sell & Key Person
Agreements
Retirement Plans & Group
Insurance
Property and Casualty Insurance
23

Somerset Hills Wealth Management, LLC
Annual Profits
( in thousands)
24

Somerset Hills Title Company, LLC
PROVIDING TITLE SERVICE IN CONNECTION WITH THE
CLOSING OF REAL ESTATE TRANSACTIONS
2005
2006
2007
Total
Transactions
62
36
5
8
Amount of
Closed
Transactions
$57 Million
$55 Million
$
34
Million
Net Income to
Bank
$64,000
$101,000
$4
5
,000
25

Looking at 2008
Realize on existing franchise
Cross Sell Opportunities
Expense Management
Selective staffing
opportunities
26
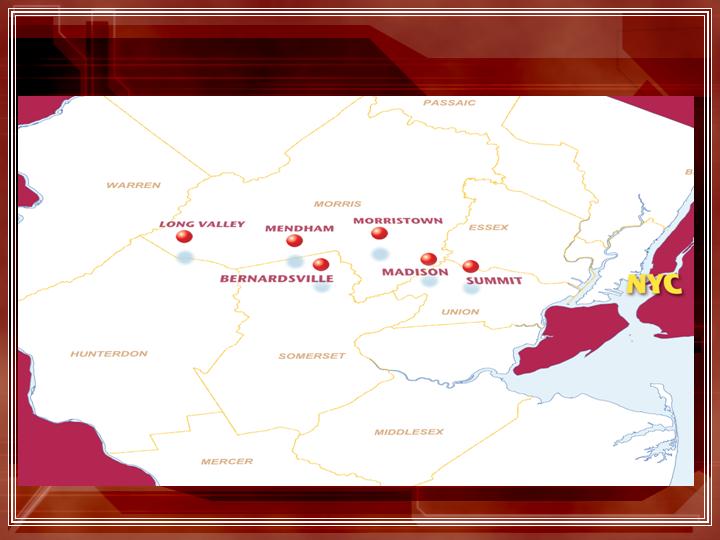
“Our Franchise”
27

New in 2007
Then and now…
24 Schooley’s Mt. Road
Long Valley, NJ 07853
908-876-5525
28

New in 2008
Remote Deposit Capture Product
Competitively necessary
Opens new markets at minimal costs
Immediate cost savings
29

5% Stock Dividend !!!
30

$0.05 per quarter
25% Increase!!!
Cash Dividend
31