Exhibit 99.1

Investor Presentation
Stifel Nicolaus
May 12, 2009

Forward-Looking Statements
This investor presentation contains certain forward-looking statements which are based on certain
assumptions and describe future plans, strategies and expectations of the Company. These
forward-looking statements are generally identified by use of the words "believe," "expect,"
"intend," "anticipate," "estimate," "project," or similar expressions. The Company's ability to
predict results or the actual effect of future plans or strategies is inherently uncertain. Factors
which could have a material adverse effect on the operations of the Company and the
subsidiaries include, but are not limited to, changes in interest rates, general economic
conditions, legislative/regulatory changes, monetary and fiscal policies of the U.S. Government,
including policies of the U.S. Treasury and the Federal Reserve Board, the quality or composition
of the loan or investment portfolios, demand for loan products, deposit flows, competition,
demand for financial services in the Company's market area and accounting principles and
guidelines. These risks and uncertainties should be considered in evaluating forward-looking
statements and undue reliance should not be placed on such statements. The Company does not
undertake -- and specifically disclaims any obligation -- to publicly release the result of any
revisions which may be made to any forward-looking statements to reflect events or
circumstances after the date of such statements or to reflect the occurrence of anticipated or
unanticipated events.

Company Profile
Commercial banking franchise founded in 1998
Six branches located in one of the Nation’s wealthiest regions in Northern NJ
$316 million in assets as of March 31, 2009
Solid Asset Quality
Only $127,000 in NPL’s out of $207 million loan portfolio (0.06%)
Superior Deposit Mix
More than three-quarters of deposits are “Core”
Strong Capital
Tangible Common Equity Ratio of 12.1%; TCE/Risk Weighted 15.5%
Highly Liquid
$46.4 million in cash as of March 31, 2009

Valuable Branch Network
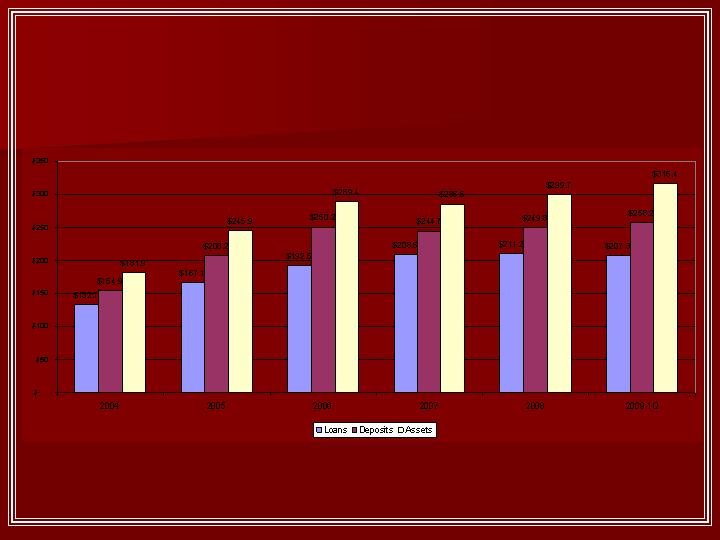
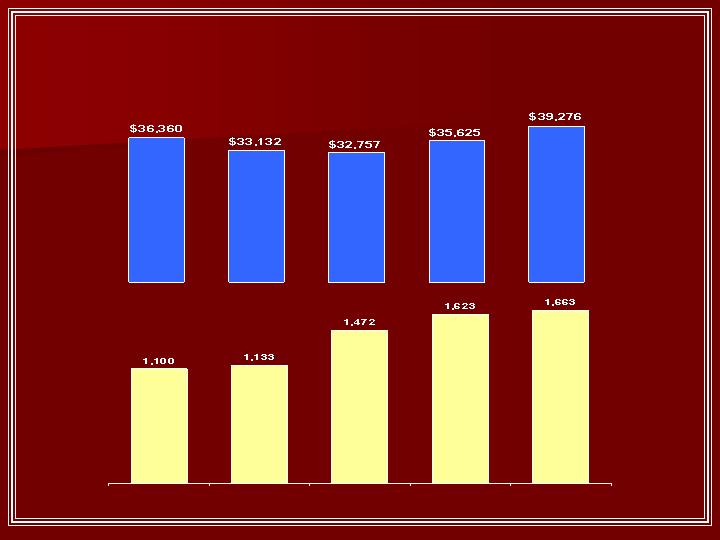
Deposit, Loan and Asset Growth
($ millions)

Net Income
($ thousands)

Our Credit Culture
We understand our local market -- that is where we lend
We adhere to a “know your borrower” philosophy
Our lenders are skilled and highly experienced in the state of New Jersey
We are a collateral lender with minimal unsecured exposure
We seek lower LTV/CLTV ratios, commensurate with loan type and risk
We generally require personal guarantees
Many of our loans are secured by multiple pieces of collateral
Collateral types include commercial R/E, personal homes, marketable
securities and other business assets.
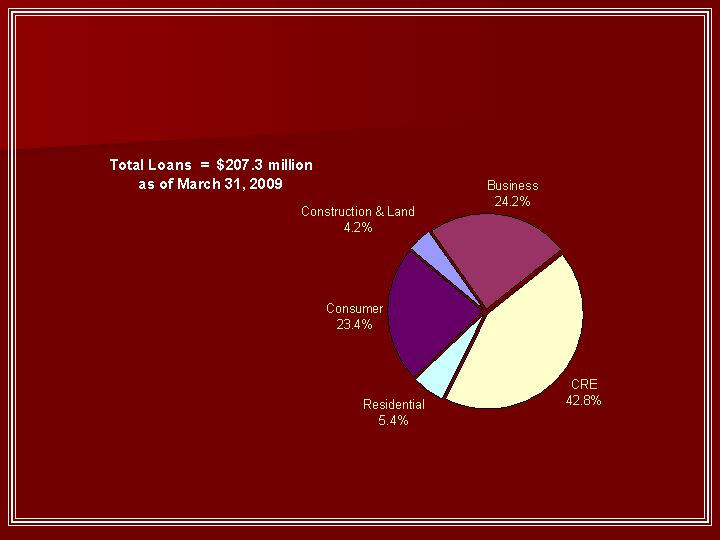
Loan Mix
Note: Business and Construction & Land Loans are included in Commercial and Industrial Loans in the Corporation’s SEC Filings.

Commercial RE Loan Portfolio
Portfolio totals $88.9 million as of March 31, 2009
No nonperforming loans or loans past-due more than 30 days at 3/31/09
We’ve never had a loss in this portfolio
99.6% of portfolio is secured by NJ properties
Diversified exposure with $650,000 average loan size
Weighted average LTV less than 50%
98.5% of portfolio carries a personal guarantee (excludes not for profits)

Business Loan Portfolio
Portfolio totals $50.2 million as of March 31, 2009
As of 3/31/09, no nonperforming loans or loans past due more than 30 days
Average loan size $201,000, reflecting a diverse local customer base, with
strong cross sell and referral opportunities
Virtually all business loans are supported by collateral including:
First- and second-liens on residential and commercial properties
Liquid assets, such as marketable securities
Other business assets including equipment, inventory and trade receivables

Consumer Loan Portfolio
$48.5 million outstanding as of March 31, 2009 (98% Home Equity)
Historical charge-offs in this portfolio = ZERO
Loans past due more than 30 days only 0.35%, and nonaccrual loans only
0.26% of total portfolio
100% in State of NJ
Self-originated, individually underwritten in-house.
We do not use automated underwriting models
Majority originated with a CLTV of 50% to 65%; maximum of 80%
HELOCs (75% of portfolio) are also underwritten on a principal & interest basis
We never entered the “piggy-back” business

Residential Mortgage Lending
Residential portfolio totals $11.1 million at 3/31/09
Primarily “accommodation” jumbos to high net worth individuals
Current avg. LTV is less than 40%
No nonperformers or past-due more than 30 days at 3/31/09
Sullivan Financial Services, Inc. (wholly-owned subsidiary)
All loans sold on a flow basis, servicing released, (i.e. a fee-based operating
model)
Efficient and scalable platform
Managed by mortgage banking veterans
Poised to capitalize on current re-financing wave and expected pick-up in “home
purchase” business

NPA’s/Total Assets vs. Industry
Source: SNL Financial. Community banks between $100mm and $1billion in total assets.
1st Q
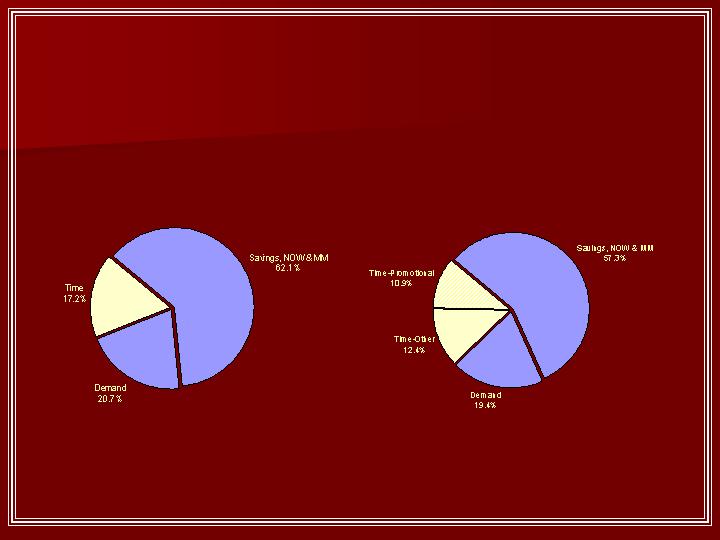
Deposit Mix
2008
1Q 2009
Note: Approximately $27 million of promotional CD’s were issued primarily during the 3 rd qtr of 2008 and mature largely
during the second half of 2009. Percentages reflect average balances for period.
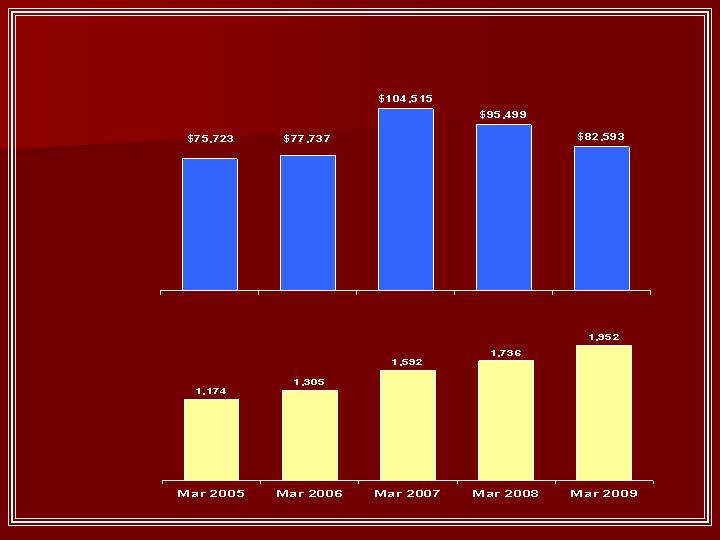
Paramount Checking
($ thousands)
Total Balances
Number of Accounts
Escrow Ease
($ thousands)
Total Balances
Number of Accounts
12/31/05
12/31/06
12/31/07
12/31/08
3/31/09
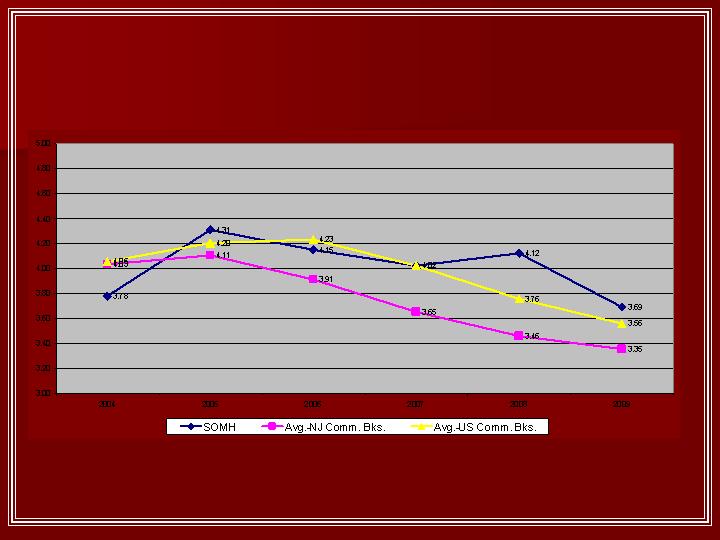
Net Interest Margin vs. Industry
March
Source: SNL Financial. Community banks between $100mm and $1billion in total assets.
1st Q

Strong Capital
Somerset Hills
Bancorp
Except Somerset Hills Bancorp
15.5%

On January 16, 2009 SOMH Issued “TARP Preferred”
$7.4 million in capital proceeds to Holding Company
163,065 warrants to purchase common stock at $6.82
Reasons for Issuing
Perception that only the strongest community banks would be approved
Encouraged by the regulators to participate
Possibly provide greater access to acquisitions of troubled banks, branches and
deposits.
On April 2, 2009, We Filed Notice with our Regulators to Redeem
Market perception for recipients changed from “the Strongest” to “Bailout”
More oversight of lending activities than anticipated
Post issuance market view more as debt, less as capital
Prohibits dividend increases and stock repurchases
On May 8, 2009 our Notice to Redeem was approved
Capital Issued under TARP