UNITED STATES
SECURITIES AND EXCHANGE COMMISSION
Washington, D.C. 20549
FORM N-CSR
CERTIFIED SHAREHOLDER REPORT OF REGISTERED
MANAGEMENT INVESTMENT COMPANIES
Investment Company Act file number 811- 21202
John Hancock Preferred Income Fund II
(Exact name of registrant as specified in charter)
200 Berkeley Street, Boston, Massachusetts 02116 (Address of principal executive offices) (Zip code)
Salvatore Schiavone
Treasurer
200 Berkeley Street
Boston, Massachusetts 02116
(Name and address of agent for service)
Registrant's telephone number, including area code: 617-663-4497
Date of fiscal year end: | July 31 |
Date of reporting period: | January 31, 2021 |
ITEM 1. REPORTS TO STOCKHOLDERS.


President and CEO,
John Hancock Investment Management
Head of Wealth and Asset Management,
United States and Europe
| SEMIANNUAL REPORT | JOHN HANCOCK PREFERRED INCOME FUND II | 1 |
| 2 | JOHN HANCOCK PREFERRED INCOME FUND II | SEMIANNUAL REPORT |

| SEMIANNUAL REPORT | JOHN HANCOCK PREFERRED INCOME FUND II | 3 |
| TOP 10 ISSUERS AS OF 1/31/2021 (% of total investments) | |
| U.S. Cellular Corp. | 4.5 |
| DTE Energy Company | 4.2 |
| CenterPoint Energy, Inc. | 4.0 |
| Wells Fargo & Company | 3.5 |
| Dominion Energy, Inc. | 3.2 |
| Algonquin Power & Utilities Corp. | 3.2 |
| Morgan Stanley | 2.8 |
| Citigroup, Inc. | 2.8 |
| South Jersey Industries, Inc. | 2.6 |
| PPL Capital Funding, Inc. | 2.6 |
| TOTAL | 33.4 |
| Cash and cash equivalents are not included. | |
| 4 | JOHN HANCOCK PREFERRED INCOME FUND II | SEMIANNUAL REPORT |
| SEMIANNUAL REPORT | JOHN HANCOCK PREFERRED INCOME FUND II | 5 |
| Shares | Value | ||||
| Preferred securities (A) 109.7% (73.6% of Total investments) | $454,265,726 | ||||
| (Cost $452,462,330) | |||||
| Communication services 12.4% | 51,338,854 | ||||
| Diversified telecommunication services 2.1% | |||||
| Qwest Corp., 6.500% (B) | 110,790 | 2,843,979 | |||
| Qwest Corp., 6.750% | 220,000 | 5,735,400 | |||
| Wireless telecommunication services 10.3% | |||||
| Telephone & Data Systems, Inc., 6.625% (B) | 168,297 | 4,234,353 | |||
| Telephone & Data Systems, Inc., 6.875% (B) | 115,519 | 2,951,510 | |||
| Telephone & Data Systems, Inc., 7.000% | 283,000 | 7,191,030 | |||
| U.S. Cellular Corp., 5.500% | 105,000 | 2,633,400 | |||
| U.S. Cellular Corp., 6.250% | 220,000 | 5,882,800 | |||
| U.S. Cellular Corp., 6.950% (B)(C) | 613,600 | 15,634,528 | |||
| U.S. Cellular Corp., 7.250% | 165,825 | 4,231,854 | |||
| Consumer discretionary 1.5% | 6,129,300 | ||||
| Internet and direct marketing retail 1.5% | |||||
| Qurate Retail, Inc., 8.000% | 55,000 | 5,503,300 | |||
| QVC, Inc., 6.250% (B) | 25,000 | 626,000 | |||
| Consumer staples 3.4% | 13,920,000 | ||||
| Food products 3.4% | |||||
| Ocean Spray Cranberries, Inc., 6.250% (B)(D) | 160,000 | 13,920,000 | |||
| Energy 2.2% | 8,970,300 | ||||
| Oil, gas and consumable fuels 2.2% | |||||
| Enbridge, Inc. (6.375% to 4-15-23, then 3 month LIBOR + 3.593%) (B) | 210,000 | 5,644,800 | |||
| NuStar Logistics LP (3 month LIBOR + 6.734%), 6.975% (B)(E) | 150,000 | 3,325,500 | |||
| Financials 35.9% | 148,750,341 | ||||
| Banks 19.1% | |||||
| Bank of America Corp., 6.000% (B) | 108,575 | 2,957,583 | |||
| Bank of America Corp. (6.450% to 12-15-66, then 3 month LIBOR + 1.327%) (B) | 110,000 | 3,000,800 | |||
| Bank of America Corp., 7.250% | 2,000 | 2,925,560 | |||
| Citigroup Capital XIII (3 month LIBOR + 6.370%), 6.575% (E) | 265,000 | 7,438,550 | |||
| Citigroup, Inc. (7.125% to 9-30-23, then 3 month LIBOR + 4.040%) (B)(C) | 300,564 | 8,412,786 | |||
| Fifth Third Bancorp, 6.000% (B) | 150,000 | 4,024,500 | |||
| First Republic Bank, 4.700% (B) | 128,875 | 3,318,531 | |||
| Fulton Financial Corp., 5.125% (B) | 113,025 | 2,964,646 | |||
| 6 | JOHN HANCOCK PREFERRED INCOME FUND II | SEMIANNUAL REPORT | SEE NOTES TO FINANCIAL STATEMENTS |
| Shares | Value | ||||
| Financials (continued) | |||||
| Banks (continued) | |||||
| GMAC Capital Trust I (3 month LIBOR + 5.785%), 6.007% (B)(E) | 361,904 | $9,597,694 | |||
| Pinnacle Financial Partners, Inc., 6.750% | 140,000 | 3,850,000 | |||
| Synovus Financial Corp. (6.300% to 6-21-23, then 3 month LIBOR + 3.352%) (B)(C) | 164,500 | 4,378,990 | |||
| The PNC Financial Services Group, Inc. (6.125% to 5-1-22, then 3 month LIBOR + 4.067%) (B) | 145,000 | 3,828,000 | |||
| U.S. Bancorp (6.500% to 1-15-22, then 3 month LIBOR + 4.468%) (B) | 30,000 | 785,400 | |||
| Wells Fargo & Company (6.625% to 3-15-24, then 3 month LIBOR + 3.690%) (B) | 269,225 | 7,737,527 | |||
| Wells Fargo & Company, 7.500% | 7,500 | 10,830,000 | |||
| WesBanco, Inc. (6.750% to 11-15-25, then 5 Year CMT + 6.557%) | 93,000 | 2,530,530 | |||
| Western Alliance Bancorp, 6.250% (B) | 20,000 | 513,200 | |||
| Capital markets 4.9% | |||||
| Brookfield Finance, Inc., 4.625% (B) | 95,000 | 2,378,800 | |||
| Morgan Stanley (6.375% to 10-15-24, then 3 month LIBOR + 3.708%) (B) | 125,000 | 3,545,000 | |||
| Morgan Stanley (6.875% to 1-15-24, then 3 month LIBOR + 3.940%) (B)(C) | 86,000 | 2,432,940 | |||
| Morgan Stanley (7.125% to 10-15-23, then 3 month LIBOR + 4.320%) | 405,472 | 11,689,758 | |||
| Consumer finance 1.4% | |||||
| Navient Corp., 6.000% (B) | 244,271 | 5,960,212 | |||
| Insurance 10.4% | |||||
| AEGON Funding Company LLC, 5.100% (B) | 267,925 | 6,979,446 | |||
| American Equity Investment Life Holding Company (6.625% to 9-1-25, then 5 Year CMT + 6.297%) | 131,750 | 3,524,313 | |||
| American Financial Group, Inc., 5.125% (B) | 123,850 | 3,315,465 | |||
| American International Group, Inc., 5.850% (B)(C) | 200,000 | 5,570,000 | |||
| Athene Holding, Ltd., Series A (6.350% to 6-30-29, then 3 month LIBOR + 4.253%) (B) | 250,000 | 7,155,000 | |||
| Brighthouse Financial, Inc., 6.600% | 222,187 | 6,003,493 | |||
| Prudential PLC, 6.500% (B) | 103,000 | 2,733,620 | |||
| The Hartford Financial Services Group, Inc. (7.875% to 4-15-22, then 3 month LIBOR + 5.596%) (B)(C) | 46,750 | 1,283,288 | |||
| The Phoenix Companies, Inc., 7.450% (B) | 216,500 | 3,236,459 | |||
| Unum Group, 6.250% (B) | 127,500 | 3,417,000 | |||
| Thrifts and mortgage finance 0.1% | |||||
| Federal National Mortgage Association, Series S, 8.250% (F) | 75,000 | 431,250 | |||
| SEE NOTES TO FINANCIAL STATEMENTS | SEMIANNUAL REPORT | JOHN HANCOCK PREFERRED INCOME FUND II | 7 |
| Shares | Value | ||||
| Health care 0.7% | $3,095,400 | ||||
| Health care equipment and supplies 0.7% | |||||
| Becton, Dickinson and Company, 6.000% | 55,000 | 3,095,400 | |||
| Industrials 1.0% | 4,274,277 | ||||
| Trading companies and distributors 1.0% | |||||
| WESCO International, Inc. (10.625% to 6-22-25, then 5 Year CMT + 10.325%) | 137,525 | 4,274,277 | |||
| Information technology 1.1% | 4,406,250 | ||||
| Semiconductors and semiconductor equipment 1.1% | |||||
| Broadcom, Inc., 8.000% (B) | 3,000 | 4,406,250 | |||
| Real estate 5.5% | 22,890,238 | ||||
| Equity real estate investment trusts 5.5% | |||||
| American Homes 4 Rent, Series E, 6.350% (B) | 79,996 | 2,045,498 | |||
| American Homes 4 Rent, Series F, 5.875% (B) | 146,511 | 3,755,077 | |||
| Diversified Healthcare Trust, 5.625% (B) | 665,020 | 15,667,871 | |||
| Vornado Realty Trust, 5.400% | 56,600 | 1,421,792 | |||
| Utilities 46.0% | 190,490,766 | ||||
| Electric utilities 17.9% | |||||
| American Electric Power Company, Inc., 6.125% (B) | 115,000 | 5,675,250 | |||
| Duke Energy Corp., 5.125% (B)(C) | 386,624 | 9,990,364 | |||
| Duke Energy Corp., 5.750% (B) | 160,000 | 4,459,200 | |||
| Interstate Power & Light Company, 5.100% (B) | 108,837 | 2,851,529 | |||
| NextEra Energy, Inc., 5.279% (B)(C) | 55,000 | 2,939,200 | |||
| NextEra Energy, Inc., 6.219% (B)(C) | 178,000 | 9,473,160 | |||
| NSTAR Electric Company, 4.780% (B) | 15,143 | 1,561,395 | |||
| PG&E Corp., 5.500% | 35,000 | 3,992,100 | |||
| PPL Capital Funding, Inc., 5.900% (B) | 615,000 | 15,780,900 | |||
| SCE Trust II, 5.100% | 176,787 | 4,419,675 | |||
| SCE Trust III (5.750% to 3-15-24, then 3 month LIBOR + 2.990%) (B) | 20,000 | 486,400 | |||
| SCE Trust VI, 5.000% | 20,000 | 491,200 | |||
| The Southern Company, 6.750% (B) | 245,000 | 12,054,000 | |||
| Gas utilities 3.9% | |||||
| South Jersey Industries, Inc., 5.625% (B)(C) | 188,875 | 4,842,755 | |||
| South Jersey Industries, Inc., 7.250% | 283,600 | 11,125,628 | |||
| Multi-utilities 24.2% | |||||
| Algonquin Power & Utilities Corp. (6.200% to 7-1-24, then 3 month LIBOR + 4.010%) | 290,000 | 8,073,600 | |||
| Algonquin Power & Utilities Corp. (6.875% to 10-17-23, then 3 month LIBOR + 3.677%) | 420,050 | 11,626,984 | |||
| CenterPoint Energy, Inc., 7.000% (B) | 615,000 | 24,427,800 | |||
| CMS Energy Corp., 5.625% (B) | 187,515 | 4,959,772 | |||
| 8 | JOHN HANCOCK PREFERRED INCOME FUND II | SEMIANNUAL REPORT | SEE NOTES TO FINANCIAL STATEMENTS |
| Shares | Value | ||||
| Utilities (continued) | |||||
| Multi-utilities (continued) | |||||
| DTE Energy Company, 5.250% (B) | 160,000 | $4,187,200 | |||
| DTE Energy Company, 6.000% (B) | 69,950 | 1,859,271 | |||
| DTE Energy Company, 6.250% (B)(C) | 424,300 | 19,679,034 | |||
| Integrys Holding, Inc. (6.000% to 8-1-23, then 3 month LIBOR + 3.220%) (B)(C) | 237,872 | 6,332,153 | |||
| NiSource, Inc. (6.500% to 3-15-24, then 5 Year CMT + 3.632%) (B)(C) | 288,000 | 8,136,000 | |||
| Sempra Energy, 5.750% (B)(C) | 270,000 | 7,371,000 | |||
| Sempra Energy, 6.750% (B) | 36,100 | 3,695,196 | |||
| Common stocks 6.5% (4.3% of Total investments) | $26,669,713 | ||||
| (Cost $35,647,674) | |||||
| Communication services 0.5% | 1,857,000 | ||||
| Diversified telecommunication services 0.5% | |||||
| Lumen Technologies, Inc. (B) | 150,000 | 1,857,000 | |||
| Energy 2.8% | 11,438,866 | ||||
| Oil, gas and consumable fuels 2.8% | |||||
| BP PLC, ADR (B) | 140,000 | 3,110,800 | |||
| Equitrans Midstream Corp. (B) | 358,446 | 2,383,666 | |||
| The Williams Companies, Inc. (B)(C) | 280,000 | 5,944,400 | |||
| Utilities 3.2% | 13,373,847 | ||||
| Multi-utilities 3.2% | |||||
| Dominion Energy, Inc. (B)(C) | 135,500 | 13,373,847 | |||
| Rate (%) | Maturity date | Par value^ | Value | ||
| Corporate bonds 28.9% (19.4% of Total investments) | $119,652,260 | ||||
| (Cost $117,520,825) | |||||
| Communication services 1.4% | 5,961,054 | ||||
| Wireless telecommunication services 1.4% | |||||
| SoftBank Group Corp. (6.875% to 7-19-27, then 5 Year ICE Swap Rate + 4.854%) (B)(G) | 6.875 | 07-19-27 | 5,988,000 | 5,961,054 | |
| Consumer discretionary 2.6% | 10,591,300 | ||||
| Automobiles 2.6% | |||||
| General Motors Financial Company, Inc. (5.700% to 9-30-30, then 5 Year CMT + 4.997%) (G) | 5.700 | 09-30-30 | 2,500,000 | 2,809,375 | |
| General Motors Financial Company, Inc. (6.500% to 9-30-28, then 3 month LIBOR + 3.436%) (G) | 6.500 | 09-30-28 | 7,239,000 | 7,781,925 | |
| Consumer staples 0.2% | 703,500 | ||||
| Food products 0.2% | |||||
| Land O' Lakes, Inc. (B)(D)(G) | 8.000 | 07-16-25 | 670,000 | 703,500 | |
| SEE NOTES TO FINANCIAL STATEMENTS | SEMIANNUAL REPORT | JOHN HANCOCK PREFERRED INCOME FUND II | 9 |
| Rate (%) | Maturity date | Par value^ | Value | ||
| Energy 5.3% | $22,037,875 | ||||
| Oil, gas and consumable fuels 5.3% | |||||
| DCP Midstream LP (7.375% to 12-15-22, then 3 month LIBOR + 5.148%) (G) | 7.375 | 12-15-22 | 9,297,000 | 7,902,450 | |
| Energy Transfer Operating LP (3 month LIBOR + 3.018%) (B)(E) | 3.223 | 11-01-66 | 8,050,000 | 5,622,925 | |
| Energy Transfer Operating LP (6.625% to 2-15-28, then 3 month LIBOR + 4.155%) (B)(C)(G) | 6.625 | 02-15-28 | 6,500,000 | 5,557,500 | |
| MPLX LP (6.875% to 2-15-23, then 3 month LIBOR + 4.652%) (B)(C)(G) | 6.875 | 02-15-23 | 3,000,000 | 2,955,000 | |
| Financials 14.8% | 61,111,212 | ||||
| Banks 9.2% | |||||
| Barclays PLC (7.750% to 9-15-23, then 5 Year U.S. Swap Rate + 4.842%) (B)(C)(G) | 7.750 | 09-15-23 | 1,102,000 | 1,200,023 | |
| Barclays PLC (8.000% to 6-15-24, then 5 Year CMT + 5.672%) (G) | 8.000 | 06-15-24 | 1,935,000 | 2,169,619 | |
| Citigroup, Inc. (3 month LIBOR + 4.478%) (E)(G) | 4.699 | 05-15-21 | 1,350,000 | 1,355,113 | |
| Citizens Financial Group, Inc. (6.375% to 4-6-24, then 3 month LIBOR + 3.157%) (G) | 6.375 | 04-06-24 | 6,000,000 | 6,300,000 | |
| Comerica, Inc. (5.625% to 7-1-25, then 5 Year CMT + 5.291%) (G) | 5.625 | 07-01-25 | 2,750,000 | 3,025,000 | |
| Huntington Bancshares, Inc. (5.625% to 7-15-30, then 10 Year CMT + 4.945%) (G) | 5.625 | 07-15-30 | 1,500,000 | 1,763,265 | |
| JPMorgan Chase & Co. (3 month LIBOR + 3.320%) (B)(C)(E)(G) | 3.558 | 04-01-21 | 4,220,000 | 4,181,735 | |
| JPMorgan Chase & Co. (6.750% to 2-1-24, then 3 month LIBOR + 3.780%) (B)(G) | 6.750 | 02-01-24 | 667,000 | 749,963 | |
| Lloyds Banking Group PLC (7.500% to 6-27-24, then 5 Year U.S. Swap Rate + 4.760%) (G) | 7.500 | 06-27-24 | 6,000,000 | 6,672,000 | |
| Regions Financial Corp. (5.750% to 6-15-25, then 5 Year CMT + 5.430%) (G) | 5.750 | 06-15-25 | 1,800,000 | 2,010,366 | |
| Societe Generale SA (5.375% to 11-18-30, then 5 Year CMT + 4.514%) (D)(G) | 5.375 | 11-18-30 | 4,900,000 | 5,108,250 | |
| SVB Financial Group (4.100% to 2-15-31, then 10 Year CMT + 3.064%) (G) | 4.100 | 02-15-31 | 1,400,000 | 1,422,680 | |
| Wells Fargo & Company (5.900% to 6-15-24, then 3 month LIBOR + 3.110%) (B)(G) | 5.900 | 06-15-24 | 2,000,000 | 2,110,758 | |
| Capital markets 0.8% | |||||
| The Charles Schwab Corp. (5.375% to 6-1-25, then 5 Year CMT + 4.971%) (B)(C)(G) | 5.375 | 06-01-25 | 3,100,000 | 3,435,916 | |
| Consumer finance 0.9% | |||||
| Discover Financial Services (6.125% to 6-23-25, then 5 Year CMT + 5.783%) (G) | 6.125 | 06-23-25 | 3,400,000 | 3,828,808 | |
| Diversified financial services 0.8% | |||||
| Enstar Finance LLC (5.750% to 9-1-25, then 5 Year CMT + 5.468%) | 5.750 | 09-01-40 | 3,000,000 | 3,133,406 | |
| 10 | JOHN HANCOCK PREFERRED INCOME FUND II | SEMIANNUAL REPORT | SEE NOTES TO FINANCIAL STATEMENTS |
| Rate (%) | Maturity date | Par value^ | Value | ||
| Financials (continued) | |||||
| Insurance 3.1% | |||||
| Markel Corp. (6.000% to 6-1-25, then 5 Year CMT + 5.662%) (G) | 6.000 | 06-01-25 | 2,000,000 | $2,196,260 | |
| MetLife, Inc. (5.875% to 3-15-28, then 3 month LIBOR + 2.959%) (B)(C)(G) | 5.875 | 03-15-28 | 4,000,000 | 4,626,000 | |
| SBL Holdings, Inc. (7.000% to 5-13-25, then 5 Year CMT + 5.580%) (B)(C)(D)(G) | 7.000 | 05-13-25 | 6,890,000 | 5,822,050 | |
| Materials 0.6% | 2,547,940 | ||||
| Chemicals 0.6% | |||||
| Braskem Netherlands Finance BV (8.500% to 1-23-26, then 5 Year CMT + 8.220%) (D) | 8.500 | 01-23-81 | 2,300,000 | 2,547,940 | |
| Utilities 4.0% | 16,699,379 | ||||
| Electric utilities 3.1% | |||||
| Emera, Inc. (6.750% to 6-15-26, then 3 month LIBOR + 5.440% to 6-15-46, then 3 month LIBOR + 6.190%) (B)(C) | 6.750 | 06-15-76 | 2,490,000 | 2,907,075 | |
| Southern California Edison Company (6.250% to 2-1-22, then 3 month LIBOR + 4.199%) (B)(C)(G) | 6.250 | 02-01-22 | 6,500,000 | 6,646,250 | |
| The Southern Company (4.000% to 1-15-26, then 5 Year CMT + 3.733%) (B)(C) | 4.000 | 01-15-51 | 3,000,000 | 3,172,404 | |
| Multi-utilities 0.9% | |||||
| CMS Energy Corp. (4.750% to 6-1-30, then 5 Year CMT + 4.116%) (B)(C) | 4.750 | 06-01-50 | 3,500,000 | 3,973,650 | |
| Capital preferred securities (H) 1.7% (1.1% of Total investments) | $7,061,368 | ||||
| (Cost $6,064,403) | |||||
| Financials 0.1% | 487,254 | ||||
| Banks 0.1% | |||||
| Wachovia Capital Trust III (Greater of 3 month LIBOR + 0.930% or 5.570%) (B)(E)(G) | 5.570 | 03-01-21 | 486,000 | 487,254 | |
| Utilities 1.6% | 6,574,114 | ||||
| Multi-utilities 1.6% | |||||
| Dominion Resources Capital Trust III (B)(C) | 8.400 | 01-15-31 | 5,000,000 | 6,574,114 | |
| Par value^ | Value | ||||
| Short-term investments 2.3% (1.6% of Total investments) | $9,516,000 | ||||
| (Cost $9,516,000) | |||||
| Repurchase agreement 2.3% | 9,516,000 | ||||
| Repurchase Agreement with State Street Corp. dated 1-29-21 at 0.000% to be repurchased at $9,516,000 on 2-1-21, collateralized by $9,332,500 U.S. Treasury Notes, 2.125% due 12-31-22 (valued at $9,706,373) | 9,516,000 | 9,516,000 | |||
| SEE NOTES TO FINANCIAL STATEMENTS | SEMIANNUAL REPORT | JOHN HANCOCK PREFERRED INCOME FUND II | 11 |
| Par value^ | Value | ||||
| Total investments (Cost $621,211,232) 149.1% | $617,165,067 | ||||
| Other assets and liabilities, net (49.1%) | (203,109,985) | ||||
| Total net assets 100.0% | $414,055,082 | ||||
| The percentage shown for each investment category is the total value of the category as a percentage of the net assets of the fund unless otherwise indicated. | |
| ^All par values are denominated in U.S. dollars unless otherwise indicated. | |
| Security Abbreviations and Legend | |
| ADR | American Depositary Receipt |
| CMT | Constant Maturity Treasury |
| ICE | Intercontinental Exchange |
| LIBOR | London Interbank Offered Rate |
| (A) | Includes preferred stocks and hybrid securities with characteristics of both equity and debt that pay dividends on a periodic basis. |
| (B) | All of a portion of this security is pledged as collateral pursuant to the Credit Facility Agreement. Total collateral value at 1-31-21 was $390,841,083. A portion of the securities pledged as collateral were loaned pursuant to the Credit Facility Agreement. The value of securities on loan amounted to $171,327,327. |
| (C) | All or a portion of this security is on loan as of 1-31-21, and is a component of the fund's leverage under the Credit Facility Agreement. |
| (D) | These securities are exempt from registration under Rule 144A of the Securities Act of 1933. Such securities may be resold, normally to qualified institutional buyers, in transactions exempt from registration. |
| (E) | Variable rate obligation. The coupon rate shown represents the rate at period end. |
| (F) | Non-income producing security. |
| (G) | Perpetual bonds have no stated maturity date. Date shown as maturity date is next call date. |
| (H) | Includes hybrid securities with characteristics of both equity and debt that trade with, and pay, interest income. |
| 12 | JOHN HANCOCK PREFERRED INCOME FUND II | SEMIANNUAL REPORT | SEE NOTES TO FINANCIAL STATEMENTS |
| Open contracts | Number of contracts | Position | Expiration date | Notional basis^ | Notional value^ | Unrealized appreciation (depreciation) |
| 10-Year U.S. Treasury Note Futures | 520 | Short | Mar 2021 | $(71,714,438) | $(71,256,250) | $458,188 |
| $458,188 |
| Interest rate swaps | ||||||||||
| Counterparty (OTC)/ Centrally cleared | Notional amount | Currency | Payments made | Payments received | Fixed payment frequency | Floating payment frequency | Maturity date | Unamortized upfront payment paid (received) | Unrealized appreciation (depreciation) | Value |
| Centrally cleared | 60,000,000 | USD | Fixed 2.136% | USD 3 month LIBOR BBA(a) | Semi-Annual | Quarterly | Oct 2022 | — | $(2,338,253) | $(2,338,253) |
| — | $(2,338,253) | $(2,338,253) | ||||||||
| (a) | At 1-31-21, the 3 month LIBOR was 0.202%. |
| Derivatives Currency Abbreviations | |
| USD | U.S. Dollar |
| Derivatives Abbreviations | |
| BBA | The British Banker's Association |
| LIBOR | London Interbank Offered Rate |
| OTC | Over-the-counter |
| SEE NOTES TO FINANCIAL STATEMENTS | SEMIANNUAL REPORT | JOHN HANCOCK PREFERRED INCOME FUND II | 13 |
| Assets | |
| Unaffiliated investments, at value (Cost $621,211,232) | $617,165,067 |
| Receivable for centrally cleared swaps | 474,603 |
| Receivable for futures variation margin | 113,711 |
| Cash | 281 |
| Collateral held at broker for futures contracts | 890,000 |
| Dividends and interest receivable | 2,804,381 |
| Other assets | 24,320 |
| Total assets | 621,472,363 |
| Liabilities | |
| Credit facility agreement payable | 204,000,000 |
| Payable for investments purchased | 3,125,237 |
| Interest payable | 145,567 |
| Payable to affiliates | |
| Accounting and legal services fees | 28,269 |
| Trustees' fees | 338 |
| Other liabilities and accrued expenses | 117,870 |
| Total liabilities | 207,417,281 |
| Net assets | $414,055,082 |
| Net assets consist of | |
| Paid-in capital | $443,794,246 |
| Total distributable earnings (loss) | (29,739,164) |
| Net assets | $414,055,082 |
| Net asset value per share | |
| Based on 21,372,768 shares of beneficial interest outstanding - unlimited number of shares authorized with no par value | $19.37 |
| 14 | JOHN HANCOCK PREFERRED INCOME FUND II | SEMIANNUAL REPORT | SEE NOTES TO FINANCIAL STATEMENTS |
| Investment income | |
| Dividends | $14,851,243 |
| Interest | 3,625,616 |
| Total investment income | 18,476,859 |
| Expenses | |
| Investment management fees | 2,264,634 |
| Interest expense | 850,143 |
| Accounting and legal services fees | 40,599 |
| Transfer agent fees | 21,795 |
| Trustees' fees | 23,277 |
| Custodian fees | 32,042 |
| Printing and postage | 69,847 |
| Professional fees | 39,620 |
| Stock exchange listing fees | 12,052 |
| Other | 10,456 |
| Total expenses | 3,364,465 |
| Less expense reductions | (23,210) |
| Net expenses | 3,341,255 |
| Net investment income | 15,135,604 |
| Realized and unrealized gain (loss) | |
| Net realized gain (loss) on | |
| Unaffiliated investments | 1,638,083 |
| Futures contracts | 219,398 |
| Swap contracts | (606,680) |
| 1,250,801 | |
| Change in net unrealized appreciation (depreciation) of | |
| Unaffiliated investments | 24,596,866 |
| Futures contracts | 1,080,859 |
| Swap contracts | 621,143 |
| 26,298,868 | |
| Net realized and unrealized gain | 27,549,669 |
| Increase in net assets from operations | $42,685,273 |
| SEE NOTES TO FINANCIAL STATEMENTS | SEMIANNUAL REPORT | JOHN HANCOCK PREFERRED INCOME FUND II | 15 |
| Six months ended 1-31-21 (unaudited) | Year ended 7-31-20 | |
| Increase (decrease) in net assets | ||
| From operations | ||
| Net investment income | $15,135,604 | $29,881,898 |
| Net realized gain (loss) | 1,250,801 | (15,814,557) |
| Change in net unrealized appreciation (depreciation) | 26,298,868 | (45,226,717) |
| Increase (decrease) in net assets resulting from operations | 42,685,273 | (31,159,376) |
| Distributions to shareholders | ||
| From earnings | (15,837,221)1 | (29,985,747) |
| From tax return of capital | — | (2,352,704) |
| Total distributions | (15,837,221) | (32,338,451) |
| Fund share transactions | ||
| Issued pursuant to Dividend Reinvestment Plan | — | 909,862 |
| Total increase (decrease) | 26,848,052 | (62,587,965) |
| Net assets | ||
| Beginning of period | 387,207,030 | 449,794,995 |
| End of period | $414,055,082 | $387,207,030 |
| Share activity | ||
| Shares outstanding | ||
| Beginning of period | 21,372,768 | 21,325,264 |
| Issued pursuant to Dividend Reinvestment Plan | — | 47,504 |
| End of period | 21,372,768 | 21,372,768 |
| 1 | A portion of the distributions may be deemed a tax return of capital at the fiscal year end. |
| 16 | JOHN HANCOCK PREFERRED INCOME FUND II | SEMIANNUAL REPORT | SEE NOTES TO FINANCIAL STATEMENTS |
| Cash flows from operating activities | |
| Net increase in net assets from operations | $42,685,273 |
| Adjustments to reconcile net increase in net assets from operations to net cash provided by operating activities: | |
| Long-term investments purchased | (77,161,807) |
| Long-term investments sold | 69,830,693 |
| Net purchases and sales in short-term investments | (7,899,614) |
| Net amortization of premium (discount) | 158,273 |
| (Increase) Decrease in assets: | |
| Receivable for futures variation margin | (113,711) |
| Receivable for centrally cleared swaps | 161,362 |
| Collateral held at broker for futures contracts | 150,000 |
| Dividends and interest receivable | (350,014) |
| Receivable for investments sold | 640,182 |
| Other assets | 1,126 |
| Increase (Decrease) in liabilities: | |
| Payable for futures variation margin | (32,526) |
| Payable for investments purchased | 3,125,237 |
| Interest payable | 591 |
| Payable to affiliates | 10,895 |
| Other liabilities and accrued expenses | 7,187 |
| Net change in unrealized (appreciation) depreciation on: | |
| Investments | (24,596,866) |
| Net realized (gain) loss on: | |
| Investments | (1,638,083) |
| Net cash provided by operating activities | $4,978,198 |
| Cash flows provided by (used in) financing activities | |
| Distributions to shareholders | $(15,837,221) |
| Decrease in due to custodian | (140,696) |
| Borrowings (repayments) under the credit facility agreement | 11,000,000 |
| Net cash used in financing activities | $(4,977,917) |
| Net increase in cash | $281 |
| Cash at beginning of period | — |
| Cash at end of period | $281 |
| Supplemental disclosure of cash flow information: | |
| Cash paid for interest | $(849,552) |
| SEE NOTES TO FINANCIAL STATEMENTS | SEMIANNUAL REPORT | JOHN HANCOCK PREFERRED INCOME FUND II | 17 |
| Period ended | 1-31-211 | 7-31-20 | 7-31-19 | 7-31-18 | 7-31-17 | 7-31-16 |
| Per share operating performance | ||||||
| Net asset value, beginning of period | $18.12 | $21.09 | $21.13 | $21.89 | $22.58 | $21.59 |
| Net investment income2 | 0.71 | 1.40 | 1.34 | 1.50 | 1.60 | 1.59 |
| Net realized and unrealized gain (loss) on investments | 1.28 | (2.85) | 0.30 | (0.58) | (0.61) | 1.08 |
| Total from investment operations | 1.99 | (1.45) | 1.64 | 0.92 | 0.99 | 2.67 |
| Less distributions | ||||||
| From net investment income | (0.74)3 | (1.41) | (1.40) | (1.68) | (1.68) | (1.53) |
| From tax return of capital | — | (0.11) | (0.28) | — | — | (0.15) |
| Total distributions | (0.74) | (1.52) | (1.68) | (1.68) | (1.68) | (1.68) |
| Net asset value, end of period | $19.37 | $18.12 | $21.09 | $21.13 | $21.89 | $22.58 |
| Per share market value, end of period | $18.36 | $18.46 | $23.67 | $21.27 | $22.39 | $22.68 |
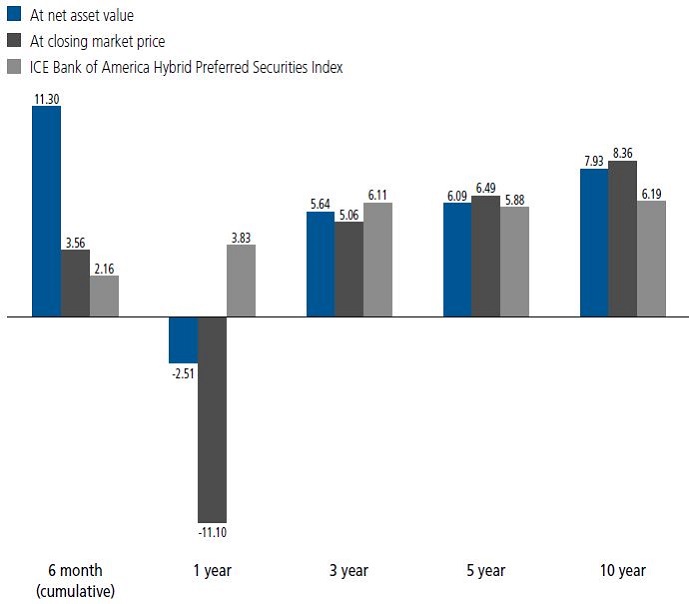
| Total return at net asset value (%)4,5 | 11.306 | (7.07) | 8.26 | 4.63 | 4.87 | 13.47 |
| Total return at market value (%)4 | 3.566 | (15.65) | 20.70 | 2.97 | 6.79 | 26.12 |
| Ratios and supplemental data | ||||||
| Net assets, end of period (in millions) | $414 | $387 | $450 | $450 | $466 | $480 |
| Ratios (as a percentage of average net assets): | ||||||
| Expenses before reductions | 1.667 | 2.36 | 2.98 | 2.52 | 2.06 | 1.81 |
| Expenses including reductions8 | 1.657 | 2.35 | 2.97 | 2.50 | 2.05 | 1.80 |
| Net investment income | 7.467 | 7.20 | 6.60 | 7.13 | 7.42 | 7.37 |
| Portfolio turnover (%) | 12 | 34 | 35 | 24 | 21 | 14 |
| Senior securities | ||||||
| Total debt outstanding end of period (in millions) | $204 | $193 | $238 | $238 | $238 | $238 |
| Asset coverage per $1,000 of debt9 | $3,030 | $3,006 | $2,890 | $2,889 | $2,956 | $3,016 |
| 1 | Six months ended 1-31-21. Unaudited. |
| 2 | Based on average daily shares outstanding. |
| 3 | A portion of the distributions may be deemed a tax return of capital at the fiscal year end. |
| 4 | Total return based on net asset value reflects changes in the fund’s net asset value during each period. Total return based on market value reflects changes in market value. Each figure assumes that distributions from income, capital gains and tax return of capital, if any, were reinvested. |
| 5 | Total returns would have been lower had certain expenses not been reduced during the applicable periods. |
| 6 | Not annualized. |
| 7 | Annualized. |
| 8 | Expenses including reductions excluding interest expense were 1.23% (annualized), 1.25%, 1.26%, 1.25%, 1.25% and 1.24% for the periods ended 1-31-21, 7-31-20, 7-31-19, 7-31-18, 7-31-17 and 7-31-16, respectively. |
| 9 | Asset coverage equals the total net assets plus borrowings divided by the borrowings of the fund outstanding at period end (Note 7). As debt outstanding changes, the level of invested assets may change accordingly. Asset coverage ratio provides a measure of leverage. |
| 18 | JOHN HANCOCK PREFERRED INCOME FUND II | SEMIANNUAL REPORT | SEE NOTES TO FINANCIAL STATEMENTS |
| SEMIANNUAL REPORT | JOHN HANCOCK Preferred Income Fund II | 19 |
| Total value at 1-31-21 | Level 1 quoted price | Level 2 significant observable inputs | Level 3 significant unobservable inputs | |
| Investments in securities: | ||||
| Assets | ||||
| Preferred securities | ||||
| Communication services | $51,338,854 | $42,822,654 | $8,516,200 | — |
| Consumer discretionary | 6,129,300 | 6,129,300 | — | — |
| Consumer staples | 13,920,000 | — | 13,920,000 | — |
| Energy | 8,970,300 | 8,970,300 | — | — |
| Financials | 148,750,341 | 145,513,882 | 3,236,459 | — |
| Health care | 3,095,400 | 3,095,400 | — | — |
| Industrials | 4,274,277 | 4,274,277 | — | — |
| Information technology | 4,406,250 | 4,406,250 | — | — |
| Real estate | 22,890,238 | 22,890,238 | — | — |
| Utilities | 190,490,766 | 184,158,613 | 6,332,153 | — |
| Common stocks | 26,669,713 | 26,669,713 | — | — |
| Corporate bonds | 119,652,260 | — | 119,652,260 | — |
| Capital preferred securities | 7,061,368 | — | 7,061,368 | — |
| Short-term investments | 9,516,000 | — | 9,516,000 | — |
| Total investments in securities | $617,165,067 | $448,930,627 | $168,234,440 | — |
| Derivatives: | ||||
| Assets | ||||
| Futures | $458,188 | $458,188 | — | — |
| Liabilities | ||||
| Swap contracts | (2,338,253) | — | $(2,338,253) | — |
| 20 | JOHN HANCOCK Preferred Income Fund II | SEMIANNUAL REPORT |
| SEMIANNUAL REPORT | JOHN HANCOCK Preferred Income Fund II | 21 |
| 22 | JOHN HANCOCK Preferred Income Fund II | SEMIANNUAL REPORT |
| Risk | Statement of assets and liabilities location | Financial instruments location | Assets derivatives fair value | Liabilities derivatives fair value |
| Interest rate | Receivable/payable for futures variation margin1 | Futures | $458,188 | — |
| Interest rate | Swap contracts, at value2 | Interest rate swaps | — | $(2,338,253) |
| $458,188 | $(2,338,253) |
| SEMIANNUAL REPORT | JOHN HANCOCK Preferred Income Fund II | 23 |
| 1 | Reflects cumulative appreciation/depreciation on futures as disclosed in Fund's investments. Only the period end variation margin is separately disclosed on the Statement of assets and liabilities. |
| 2 | Reflects cumulative value of swap contracts. Receivable/payable for centrally cleared swaps, which includes value and margin, are shown separately on the Statement of assets and liabilities. |
| Statement of operations location - Net realized gain (loss) on: | |||
| Risk | Futures contracts | Swap contracts | Total |
| Interest rate | $219,398 | $(606,680) | $(387,282) |
| Statement of operations location - Change in net unrealized appreciation (depreciation) of: | |||
| Risk | Futures contracts | Swap contracts | Total |
| Interest rate | $1,080,859 | $621,143 | $1,702,002 |
| 24 | JOHN HANCOCK Preferred Income Fund II | SEMIANNUAL REPORT |
| • | the likelihood of greater volatility of NAV and market price of shares; |
| • | fluctuations in the interest rate paid for the use of the CFA; |
| • | increased operating costs, which may reduce the fund’s total return; |
| • | the potential for a decline in the value of an investment acquired through leverage, while the fund’s obligations under such leverage remains fixed; and |
| • | the fund is more likely to have to sell securities in a volatile market in order to meet asset coverage or other debt compliance requirements. |
| SEMIANNUAL REPORT | JOHN HANCOCK Preferred Income Fund II | 25 |
| 26 | JOHN HANCOCK Preferred Income Fund II | SEMIANNUAL REPORT |
| SEMIANNUAL REPORT | JOHN HANCOCK Preferred Income Fund II | 27 |
| Payment Date | Income Distributions1 |
| 8/31/2020 | $0.1235 |
| 9/30/2020 | 0.1235 |
| 10/30/2020 | 0.1235 |
| 11/30/2020 | 0.1235 |
| 12/31/2020 | 0.1235 |
| 1/29/2021 | 0.1235 |
| Total | $0.7410 |
| 1A portion of the distributions may be deemed a tax return of capital at year-end. | |
Computershare
P.O. Box 505000
Louisville, KY 40233
Computershare
462 South 4th Street, Suite 1600
Louisville, KY 40202
| 28 | JOHN HANCOCK PREFERRED INCOME FUND II | SEMIANNUAL REPORT |
Steven R. Pruchansky, Vice Chairperson
Andrew G. Arnott†
Charles L. Bardelis*
James R. Boyle
Peter S. Burgess
*William H. Cunningham
Grace K. Fey
Marianne Harrison†
Deborah C. Jackson
James M. Oates*
Frances G. Rathke*,1
Gregory A. Russo
President
Chief Financial Officer
Treasurer
Secretary and Chief Legal Officer
Chief Compliance Officer
Bradley L. Lutz, CFA
| You can also contact us: | ||
| 800-852-0218 | Regular mail: | Express mail: |
| jhinvestments.com | Computershare P.O.Box 505000 Louisville,KY 40233 | Computershare 462 South 4th Street, Suite 1600 Louisville, KY 40202 |
| SEMIANNUAL REPORT | JOHN HANCOCK PREFERRED INCOME FUND II | 29 |
Communications ETF
GOVERNANCE FUNDS
representing one of America’s most trusted brands, with a heritage of
financial stewardship dating back to 1862. Helping our shareholders
pursue their financial goals is at the core of everything we do. It’s why
we support the role of professional financial advice and operate with
the highest standards of conduct and integrity.
We search the world to find proven portfolio teams with specialized
expertise for every strategy we offer, then we apply robust investment
oversight to ensure they continue to meet our uncompromising
standards and serve the best interests of our shareholders.
a diverse set of investments backed by some of the world’s best
managers, along with strong risk-adjusted returns across asset classes.

200 Berkeley Street ■ Boston, MA 02116-5010 ■ 800-225-5291 ■ jhinvestments.com

| MF1516388 | P11SA 1/21 |
ITEM 2. CODE OF ETHICS.
Not applicable at this time.
ITEM 3. AUDIT COMMITTEE FINANCIAL EXPERT.
Not applicable at this time.
ITEM 4. PRINCIPAL ACCOUNTANT FEES AND SERVICES.
Not applicable at this time.
ITEM 5. AUDIT COMMITTEE OF LISTED REGISTRANTS.
Not applicable at this time.
ITEM 6. SCHEDULE OF INVESTMENTS.
(a)Not applicable.
(b)Not applicable.
ITEM 7. DISCLOSURE OF PROXY VOTING POLICIES AND PROCEDURES FOR CLOSED- END MANAGEMENT INVESTMENT COMPANIES.
Not applicable at this time.
ITEM 8. PORTFOLIO MANAGERS OF CLOSED-END MANAGEMENT INVESTMENT COMPANIES.
Not applicable at this time.
ITEM 9. PURCHASES OF EQUITY SECURITIES BY CLOSED-END MANAGEMENT INVESTMENT COMPANY AND AFFILIATED PURCHASERS.
Not applicable at this time.
ITEM 10. SUBMISSION OF MATTERS TO A VOTE OF SECURITY HOLDERS.
Not applicable at this time.
ITEM 11. CONTROLS AND PROCEDURES.
(a)Based upon their evaluation of the registrant's disclosure controls and procedures as
conducted within 90 days of the filing date of this Form N-CSR, the registrant's principal executive officer and principal financial officer have concluded that those disclosure controls and procedures provide reasonable assurance that the material information required to be disclosed by the registrant on this report is recorded, processed, summarized and reported within the time periods specified in the Securities and Exchange Commission's rules and forms.
(b)There were no changes in the registrant's internal control over financial reporting that
occurred during the period covered by this report that have materially affected, or are reasonably likely to materially affect, the registrant's internal control over financial reporting.
ITEM 12. DISCLOSURE OF SECURITIES LENDING ACTIVITIES FOR CLOSED-END MANAGEMENT INVESTMENT COMPANIES.
The Fund did not participate directly in securities lending activities. See Note 7 to financial statements in Item 1.
ITEM 13. EXHIBITS.
SIGNATURES
Pursuant to the requirements of the Securities Exchange Act of 1934 and the Investment Company Act of 1940, the registrant has duly caused this report to be signed on its behalf by the undersigned, thereunto duly authorized.
John Hancock Preferred Income Fund II
By: /s/ Andrew G. Arnott
------------------------------
Andrew G. Arnott
President
Date: March 24, 2021
Pursuant to the requirements of the Securities Exchange Act of 1934 and the Investment Company Act of 1940, this report has been signed below by the following persons on behalf of the registrant and in the capacities and on the dates indicated.
By: /s/ Andrew G. Arnott
-------------------------------
Andrew G. Arnott
President
Date: March 24, 2021
By: /s/ Charles A. Rizzo
--------------------------------
Charles A. Rizzo
Chief Financial Officer
Date: March 24, 2021