FORM 6 - K
SECURITIES AND EXCHANGE COMMISSION
Washington, D.C. 20549
Report of Foreign Private Issuer
Pursuant to Rule 13a - 16 or 15d - 16 of
the Securities Exchange Act of 1934
As of April 27, 2010
TENARIS, S.A.
(Translation of Registrant's name into English)
TENARIS, S.A.
46a, Avenue John F. Kennedy
L-1855 Luxembourg
(Address of principal executive offices)
Indicate by check mark whether the registrant files or will file annual reports under cover Form 20-F or 40-F.
Form 20-F ü Form 40-F
Indicate by check mark whether the registrant by furnishing the information contained in this Form is also thereby furnishing the information to the Commission pursuant to Rule 12G3-2(b) under the Securities Exchange Act of 1934.
Yes __ No ü
If “Yes” is marked, indicate below the file number assigned to the registrant in connection
with Rule 12g3-2(b): 82-
The attached material is being furnished to the Securities and Exchange Commission pursuant to Rule 13a-16 and Form 6-K under the Securities Exchange Act of 1934, as amended. This report contains Tenaris' notice of Annual General Meeting of Shareholders and the Shareholder Meeting Brochure and Proxy Statement and the Company’s 2009 annual report (which includes the Company’s consolidated financial statements for the years ended December 31, 2009, 2008 and 2007 and the Company’s annual accounts as at December 31, 2009, together with the independent auditors’ reports and the Board of Directors’ management report and certification).
SIGNATURE
Pursuant to the requirements of the Securities Exchange Act of 1934, the Registrant has duly caused this report to be signed on its behalf by the undersigned, thereunto duly authorized.
Date: April 27, 2010
Tenaris, S.A.
By: /s/ Cecilia Bilesio
Cecilia Bilesio
Corporate Secretary
Dear Tenaris Shareholder and ADR Holder,
I am pleased to invite you to attend the Annual General Meeting of Shareholders of the Company. The meeting will be held on Wednesday, June 2, 2010, at 46A, Avenue John F. Kennedy L-1855 Luxembourg and will begin promptly at 11:00 a.m. (Central European Time).
At the Annual General Meeting, you will have the opportunity to hear a report on the Company’s business, financial condition and results of operation and to vote on various matters, including the approval of the Company’s consolidated financial statements, the election of the members of the Board of Directors and the appointment of the independent auditors.
The Notice and Agenda for the meeting, the Shareholder Meeting Brochure and Proxy Statement and the Company’s 2009 annual report (which includes the Company’s consolidated financial statements for the years ended December 31, 2009, 2008 and 2007, and the Company’s annual accounts as at December 31, 2009, together with the independent auditors’ reports and the Board of Directors’ management report and certifications), are available free of charge at the Company's registered office in Luxembourg and on our website at www.tenaris.com/investors. They may also be obtained upon request, by calling (352) 26-47-89-78 (if you are in Luxembourg), 1-800-555-2470 (if you are in the United States), or +1-267-468-0786 (if you are in any other jurisdiction).
Even if you only own a few shares or ADRs, I hope that you will exercise your right to vote at the meeting. You can vote your shares personally or by proxy. If you choose to vote by proxy, you may use the enclosed dedicated proxy form. If you are a holder of ADRs, please see the letter from THE BANK OF NEW YORK MELLON, depositary bank, for instructions on how to exercise your vote by proxy.
Yours sincerely,
Paolo Rocca
Chairman and Chief Executive Officer
April 23, 2010

Re: TENARIS S.A.
| To: | Registered Holders of American Depositary Receipts (“ADRs”) |
| for ordinary shares, US$1 Par Value (the “Shares”), of |
| Tenaris S.A. (the “Company”): |
The Company has announced that its Annual General Meeting of Shareholders (the “Meeting”) will be held on June 2, 2010, at 11:00 a.m. (Central European Time). The Meeting will take place at 46A, Avenue John F. Kennedy L-1855 Luxembourg. A copy of the Company’s Notice of Annual General Meeting of Shareholders, including the agenda for the Meeting, is enclosed.
The Notice of Annual General Meeting of Shareholders, the Shareholder Meeting Brochure and Proxy Statement, and the Company’s 2009 annual report (which includes the Company’s consolidated financial statements for the years ended December 31, 2009, 2008 and 2007, and the Company’s annual accounts as at December 31, 2009, together with the independent auditors’ reports and the Board of Directors’ management report and certifications), are available on the Company’s website at www.tenaris.com/investors and may also be obtained upon request, by calling 1-800-555-2470 (if you are in the United States) or +1-267-468-0786 (if you are outside the United States). These materials are provided to allow the Shares represented by your ADRs to be voted at the Meeting.
Each holder of ADRs as of each of April 23, 2010, and May 17, 2010, is entitled to instruct THE BANK OF NEW YORK MELLON, as Depositary (the “Depositary”), as to the exercise of the voting rights pertaining to the Shares represented by such holder’s ADRs. Although voting instructions are sent to ADR holders and proxy materials are available on the Company’s website beginning on April 23, 2010, only those holders of record at each of April 23, 2010, and May 17, 2010, will be entitled to provide the Depositary with voting instructions. Notwithstanding that holders of ADRs must have held ADRs on each such date, in order to avoid the possibility of double vote, only those positions on May 17, 2010, will be counted for voting instruction purposes. Eligible ADR holders who desire to give voting instructions with respect to their Shares represented by their ADRs must complete, date and sign a proxy form and return it to the Depositary at THE BANK OF NEW YORK MELLON, Proxy Processing P.O. Box 3549, S. Hackensack, NJ 07606-9249, U.S.A. If the Depositary receives properly completed instructions by 5:00 p.m., New York City time, on May 27, 2010, then it shall vote, or cause to be voted, the Shares represented by such ADRs in the manner prescribed by the instructions. However, if by 5:00 p.m., New York time, on May 27, 2010, the Depositary receives no instructions from the holder of ADRs, or the instructions received by the Depositary are not in proper form, then the Depositary shall deem such ADR holder to have instructed the Depositary to vote the Shares represented by any such ADRs in favor of any proposals or recommendations of the Company, for which purposes the Depositary shall issue a proxy to a person appointed by the Company to vote such Shares represented by such ADRs in favor of any proposals or recommendations of the Company (including any recommendation by the Company to vote such Shares represented by such ADRs on any given issue in accordance with the majority shareholder vote on that issue). No proxy shall be given, and no instruction shall be deemed given, with respect to any matter as to which the Company informs the Depositary that (i) it does not wish such proxy given, (ii) it has knowledge that substantial opposition exists with respect to the action to be taken at the Meeting, or (iii) the matter materially and adversely effects the rights of the holders of ADRs.
Any holder of ADRs entitled to provide the Depositary with voting instructions in respect of the Shares represented by its ADRs, is also entitled to revoke any instructions which it has previously given to the Depositary by filing with the Depositary a written revocation or duly executed instructions bearing a later date at any time prior to 5:00 p.m., New York time, on May 27, 2010. No instructions, revocations or revisions thereof shall be accepted by the Depositary after that time.
IF YOU WANT YOUR VOTE TO BE COUNTED, THE DEPOSITARY MUST RECEIVE YOUR VOTING INSTRUCTIONS PRIOR TO 5:00 P.M. (NEW YORK CITY TIME) ON MAY 27, 2010.
THE BANK OF NEW YORK MELLON
Depositary
April 23, 2010
New York, New York
Tenaris S.A.
Société Anonyme Holding
46A, avenue John F. Kennedy
L-1855, Luxembourg
RCS Luxembourg B 85 203
Notice of the Annual General Meeting of Shareholders to be held on June 2, 2010
Notice is hereby given to holders of ordinary shares (the “Shares”) of Tenaris S.A. (the “Company”) that the Annual General Meeting of Shareholders (the “Meeting”) will be held on June 2, 2010, at 11:00 a.m. (Central European Time). The Meeting will be held at 46A, avenue John F. Kennedy L-1855 Luxembourg. In the Meeting, shareholders will vote with respect to the items listed below under the heading “Annual General Meeting of Shareholders”.
Agenda
Annual General Meeting of Shareholders
| 1. | Consideration of the Board of Directors’ management report and certifications and the independent auditors’ reports on the Company’s consolidated financial statements for the years ended December 31, 2009, 2008 and 2007, and the Company’s annual accounts as at December 31, 2009. |
| 2. | Approval of the Company’s consolidated financial statements for the years ended December 31, 2009, 2008 and 2007. |
| 3. | Approval of the Company’s annual accounts as at December 31, 2009. |
| 4. | Allocation of results and approval of dividend payment for the year ended December 31, 2009. |
| 5. | Discharge of the members of the Board of Directors for the exercise of their mandate during the year ended December 31, 2009. |
| 6. | Election of members of the Board of Directors. |
| 7. | Compensation of members of the Board of Directors. |
| 8. | Appointment of the independent auditors for the fiscal year ending December 31, 2010 and approval of their fees. |
| 9. | Authorisation to the Company, or any subsidiary, to from time to time purchase, acquire or receive shares of the Company, in accordance with Article 49-2 of the Luxembourg law of 10 August 1915 and with applicable laws and regulations. |
| 10. | Authorisation to the Board of Directors to cause the distribution of all shareholder communications, including its shareholder meeting and proxy materials and annual reports to shareholders, by such electronic means as is permitted by any applicable laws or regulations. |
Pursuant to the Company’s Articles of Association, resolutions at the Meeting will be passed by a simple majority of the votes cast, irrespective of the number of Shares present or represented.
Procedures for Attending the Meeting
Any shareholder registered in the Company’s share register on May 28, 2010 (the “Record Date”) shall be admitted to the Meeting and may attend the Meeting in person.
Any shareholder registered in the Company’s share register on the Record Date may also vote by proxy. To vote by proxy, holders of Shares must file a completed proxy form not later than 4:00 p.m. (local time) on the Record Date at any of the addresses indicated below or, in the case of Shares held in Mexico, with S.D. Indeval, S.A. de C.V. (Paseo de la Reforma #255, 2o. y 3er. piso Col. Cuauhtémoc, Mexico City).
Holders of Shares holding their Shares through fungible securities accounts wishing to attend the Meeting in person must present a certificate (issued by the financial institution or professional depositary holding such Shares) evidencing deposit of their Shares and certifying the number of Shares recorded in the relevant account as of the Record Date. Certificates certifying the number of Shares recorded in the relevant account as of a date other than the Record Date will not be accepted and such shareholders will not be admitted to the Meeting. Each certificate must (i) indicate the stock exchange on which the Shares evidenced by such certificate trade, and (ii) in case of certificates evidencing Shares trading on the Argentine or Italian stock exchanges, certify that such Shares have been blocked for trading until the date of the Meeting. Certificates must be filed not later than 4:00 p.m. (local time) on the Record Date, at any of the addresses indicated below or, in the case of Shares held through fungible securities accounts in Mexico, with S.D. Indeval, S.A. de C.V. (Paseo de la Reforma #255, 2o. y 3er. piso Col. Cuauhtémoc, Mexico City).
Holders of Shares holding their Shares through fungible securities accounts may also vote by proxy. To do so, holders of Shares must present a certificate (issued by the financial institution or professional depositary holding such Shares) evidencing deposit of their Shares and certifying the number of Shares recorded in the relevant account as of the Record Date. Certificates certifying the number of Shares recorded in the relevant account as of a date other than the Record Date will not be accepted and such shareholders will not be admitted to the Meeting. Each certificate must (i) indicate the stock exchange on which the Shares evidenced by such certificate trade, and (ii) in case of certificates evidencing Shares trading on the Argentine or Italian stock exchanges, certify that such Shares have been blocked for trading until the date of the Meeting. In addition, such holders of Shares wishing to vote by proxy must also present a completed proxy form. Such certificate and proxy form must be filed not later than 4:00 p.m. (local time) on the Record Date, at any of the addresses indicated below and, in the case of Shares held through fungible securities accounts in Mexico, with S.D. Indeval, S.A. de C.V. (Paseo de la Reforma #255, 2o. y 3er. piso Col. Cuauhtémoc, Mexico City).
In the event of Shares owned by a corporation or any other legal entity, individuals representing such entity who wish to attend the Meeting in person and vote at the Meeting on behalf of such entity, must present evidence of their authority to attend, and vote at, the Meeting by means of a proper document (such as a general or special power-of-attorney) issued by the respective entity. A copy of such power of attorney or other proper document must be filed not later than 4:00 p.m. (local time) on the Record Date, at any of the addresses indicated below. The original documentation evidencing the authority to attend, and vote at, the Meeting, or a notarized and legalized copy thereof, must be presented at the Meeting.
Luxembourg: 46A, Avenue John F. Kennedy
L-1855 Luxembourg
Attn: Adélia Soares
Argentina: c/o Siderca S.A.I.C.
Carlos María della Paolera 299, piso 16°
(C1001ADA) Buenos Aires
Attn: Horacio de las Carreras and/or Eleonora Cimino
Italy: c/o Dalmine S.p.A.
Piazza Caduti 6 luglio 1944 n. 1 24044
Dalmine (BG)
Attn: Marco Tajana and/or Teresa Gaini
Mexico: c/o Tubos de Acero de México, S.A.
Campos Elíseos 400-17
Col. Chapultepec Polanco
11560 México D.F.
Attn: Félix Todd and/or Cecilia Pérez Valencia
Those shareholders who have sold their Shares between the Record Date and the date of the Meeting cannot attend the Meeting or vote by proxy. In case of breach of such prohibition, criminal sanctions may apply.
Holders of American Depositary Receipts (“ADRs”) as of each of April 23, 2010, and May 17, 2010, are entitled to instruct THE BANK OF NEW YORK MELLON, as Depositary (the “Depositary”), as to the exercise of the voting rights pertaining to the Company’s Shares represented by such holder’s ADRs. Although voting instructions are sent to holders and proxy materials are available on the Company’s website beginning on April 23, 2010, only those holders of record as of each of April 23, 2010 and May 17, 2010, will be entitled to provide the Depositary with voting instructions. Notwithstanding that holders of ADRs must have held ADRs on each such date, in order to avoid the possibility of double vote, only those positions on May 17, 2010, will be counted for voting instruction purposes. Eligible ADR holders who desire to give voting instructions with respect of the Shares represented by their ADRs must complete, date and sign a proxy form and return it to the Depositary, at THE BANK OF NEW YORK MELLON, Proxy Processing P.O. Box 3549, S. Hackensack, NJ 07606-9249, U.S.A., by 5:00 p.m., New York City time, on May 27, 2010.
Under Luxembourg legislation implementing the EU Transparency Directive, investors in the Company’s securities should notify the Company and the Luxembourg Commission de Surveillance du Secteur Financier (CSSF) on an ongoing basis whenever their direct or indirect ownership or other control rights over shares of the Company’s capital or rights to vote such shares either reaches, exceeds or falls below any of the following thresholds: 5%, 10%, 15%, 20%, 25%, 33.33%, 50% and 66.66%. The total number of issued and outstanding shares and votes set forth in the second paragraph of the Shareholder Meeting Brochure and Proxy Statement should be used for purposes of determining whether an investor reaches or exceeds each such threshold. Any such notification shall be made as indicated in the Company’s website at www.tenaris.com/investors and in accordance with CSSF regulations. Failure to make such notification will cause the suspension of the exercise of voting rights relating to the shares exceeding the fraction that should have been notified.
The Shareholder Meeting Brochure and Proxy Statement (which contains reports on each item of the agenda for the Meeting, and further details on voting procedures) and the forms furnished by the Company in connection with the Meeting, may be obtained at any of the addresses indicated above or upon request by calling (352) 26-47-89-78 (if you are in Luxembourg), 1-800-555-2470 (if you are in the United States), or +1-267-468-0786 (if you are in any other jurisdiction), but also from the Depositary, Borsa Italiana SpA (Piazza degli Affari 6, 20123, Milan, Italy) and S.D. Indeval S.A. de C.V., as from April 23, 2010, between 10:00 a.m. and 5:00 p.m. (local time).
Copies of the Shareholder Meeting Brochure and Proxy Statement and the forms are also available at www.tenaris.com/investors. Copies of the Company’s 2009 annual report (including the Company’s consolidated financial statements for the years ended December 31, 2009, 2008 and 2007, and the Company’s annual accounts as at December 31, 2009, together with the independent auditors’ reports and management report and certifications, and the documents referred to in the preceding sentence) may also be obtained free of charge at the Company's registered office in Luxembourg or upon request by calling (352) 26-47-89-78 (if you are in Luxembourg), 1-800-555-2470 (if you are in the United States), or +1-267-468-0786 (if you are in any other jurisdiction).
Cecilia Bilesio
Secretary to the Board of Directors
April 23, 2010
Luxembourg
Tenaris S.A.
Société Anonyme Holding
46A, avenue John F. Kennedy
L-1855, Luxembourg
RCS Luxembourg B 85 203
Shareholder Meeting Brochure and Proxy Statement
Annual General Meeting of Shareholders to be held on June 2, 2010
This Shareholder Meeting Brochure and Proxy Statement is furnished by Tenaris S.A. (the “Company”) in connection with the Annual General Meeting of Shareholders (the “Meeting”) to be held, for the purposes set forth in the accompanying Notice of the Annual General Meeting of Shareholders (the “Notice”), on June 2, 2010, starting at 11:00 a.m., at 46A, avenue John F. Kennedy L-1855 Luxembourg.
As of April 23, 2010, there were issued and outstanding 1,180,536,830 ordinary shares, US$1 par value each, of the Company (the “Shares”), including the Shares (the “Deposited Shares”) deposited with various agents for THE BANK OF NEW YORK MELLON, as depositary (the “Depositary”), under the Amended and Restated Deposit Agreement, dated as of February 28, 2008 (the “Deposit Agreement”), among the Company, the Depositary and all holders from time to time of American Depositary Receipts (the “ADRs”) issued thereunder. The Deposited Shares are represented by American Depositary Shares, which are evidenced by the ADRs (one ADR equals two Deposited Shares). Each Share entitles the holder thereof to one vote at the Meeting.
Any shareholder registered in the Company’s share register on May 28, 2010 (the “Record Date”) shall be admitted to the Meeting and may attend the Meeting in person. Any shareholder registered in the Company’s share register on the Record Date may also vote by proxy. To vote by proxy, holders of Shares must file a completed proxy form not later than 4:00 p.m. (local time) on the Record Date at any of the addresses indicated in the Notice.
Holders of Shares holding their Shares through fungible securities accounts wishing to attend the Meeting in person must present a certificate (issued by the financial institution or professional depositary holding such Shares) evidencing deposit of their Shares and certifying the number of Shares recorded in the relevant account as of the Record Date. Certificates certifying the number of Shares recorded in the relevant account as of a date other than the Record Date will not be accepted and such shareholders will not be admitted to the Meeting. Each certificate must (i) indicate the stock exchange on which the Shares evidenced by such certificate trade, and (ii) in case of certificates evidencing Shares trading on the Argentine or Italian stock exchanges, certify that such Shares have been blocked for trading until the date of the Meeting. Certificates must be filed not later than 4:00 p.m. (local time) on the Record Date, at any of the addresses indicated in the Notice.
Holders of Shares holding their Shares through fungible securities accounts may also vote by proxy. To do so, such holders of Shares must present a certificate (issued by the financial institution or professional depositary holding such Shares) evidencing deposit of their Shares and certifying the number of Shares recorded in the relevant account as of the Record Date. Certificates certifying the number of Shares recorded in the relevant account as of a date other than the Record Date will not be accepted and such shareholders will not be admitted to the Meeting. Each certificate must (i) indicate the stock exchange on which the Shares evidenced by such certificate trade, and (ii) in case of certificates evidencing Shares trading on the Argentine or Italian stock exchanges, certify that such Shares have been blocked for trading until the date of the Meeting. In addition, such holders of Shares must also present a completed proxy form. Such certificate and proxy form must be filed not later than 4:00 p.m. (local time) on the Record Date, at any of the addresses indicated in the Notice.
In the event of Shares owned by a corporation or any other legal entity, individuals representing such entity who wish to attend the Meeting in person and vote at the Meeting on behalf of such entity, must present evidence of their authority to attend, and vote at, the Meeting by means of a proper document (such as a general or special power-of-attorney) issued by the respective entity. A copy of such power of attorney or other proper document must be filed not later than 4:00 p.m. (local time) on the Record Date, at any of the addresses indicated in the Notice. The original documentation evidencing the authority to attend, and vote at, the Meeting, or a notarized and legalized copy thereof, must be presented at the Meeting.
Each holder of ADRs as of each of April 23, 2010, and May 17, 2010, is entitled to instruct the Depositary, as to the exercise of the voting rights pertaining to the Shares represented by such holder’s ADRs. Although voting instructions are sent to holders and proxy materials are available at the Company’s website beginning on April 23, 2010, only those holders of record as of each of April 23, 2010 and May 17, 2010, will be entitled to provide the Depositary with voting instructions. Notwithstanding that holders of ADRs must have held ADRs on each such date, in order to avoid the possibility of double vote, only those positions on May 17, 2010, will be counted for voting instruction purposes. Eligible holders of ADRs who wish to give voting instructions in respect of the Shares represented by their ADRs must complete, date and sign a proxy form and return it to the Depositary, at THE BANK OF NEW YORK MELLON, Proxy Processing P.O. Box 3549, S. Hackensack, NJ 07606-9249, U.S.A. If the Depositary receives properly completed instructions by 5:00 p.m., New York City time, on May 27, 2010, then it shall vote or cause to be voted the Shares underlying such ADRs in the manner prescribed by the instructions. However, if by 5:00 p.m., New York time, on May 27, 2010, the Depositary receives no instructions from the holder of ADRs, or the instructions are not in proper form, then the Depositary shall deem such ADR holder to have instructed the Depositary to vote the Shares represented by any such ADRs in favor of any proposals or recommendations of the Company, for which purposes the Depositary shall issue a proxy to a person appointed by the Company to vote such Shares represented by such ADRs in favor of any proposals or recommendations of the Company (including any recommendation by the Company to vote such underlying shares on any given issue in accordance with the majority shareholder vote on that issue). No proxy shall be given, and no instruction shall be deemed given, with respect to any matter as to which the Company informs the Depositary that (i) it does not wish such proxy given (ii) it has knowledge that substantial opposition exists with respect to the action to be taken at the Meeting, or (iii) the matter materially and adversely effects the rights of the holders of ADRs. Any holder of ADRs entitled to provide the Depositary with voting instructions in respect of the Shares represented by its ADRs, is also entitled to revoke any instructions which it has previously given to the Depositary by filing with the Depositary a written revocation or duly executed instructions bearing a later date at any time prior to 5:00 p.m., New York time, on May 27, 2010. No instructions, revocations or revisions thereof shall be accepted by the Depositary after that time.
Holders of ADRs maintaining non-certificated positions must follow voting instructions given by their broker or custodian bank.
Due to regulatory differences and market practices in each country where the Company’s Shares or ADRs are listed, holders of Shares traded on the Argentine and Italian stock exchanges who have requested admission to the Meeting, or who have issued a voting proxy, must have their Shares blocked for trading until the date of the Meeting, while holders of Shares traded in the Mexican stock exchange and holders of ADRs traded in the New York stock exchange need not have their Shares or ADRs, as the case may be, blocked for trading. However, the votes of holders of Shares traded in the Mexican stock exchange who sell their Shares between May 27, 2010, and June 1, 2010, shall be disregarded for voting purposes.
Under Luxembourg legislation implementing the EU Transparency Directive, investors in the Company’s securities should notify the Company and the Luxembourg Commission de Surveillance du Secteur Financier (CSSF) on an ongoing basis whenever their direct or indirect ownership or other control rights over shares of the Company’s capital or rights to vote such shares either reaches, exceeds or falls below any of the following thresholds: 5%, 10%, 15%, 20%, 25%, 33.33%, 50% and 66.66%. The total number of issued and outstanding shares and votes set forth in the second paragraph of this Shareholder Meeting Brochure and Proxy Statement should be used for purposes of determining whether an investor reaches or exceeds each such threshold. Any such notification shall be made as indicated in the Company’s website at www.tenaris.com/investors and in accordance with CSSF regulations. Failure to make such notification will cause the suspension of the exercise of voting rights relating to the shares exceeding the fraction that should have been notified.
The Meeting will appoint a chairperson pro tempore to preside the Meeting. The chairperson pro tempore will have broad authority to conduct the Meeting in an orderly and timely manner and to establish rules for shareholders who wish to address the Meeting; the chairperson may exercise broad discretion in recognizing shareholders who wish to speak and in determining the extent of discussion on each item of the agenda.
Pursuant to the Company’s Articles of Association, resolutions at the Meeting will be passed by simple majority of the votes cast, irrespective of the number of Shares present or represented.
The Meeting is called to address and vote on the following agenda:
Annual General Meeting of Shareholders
1. Consideration of the Board of Directors’ management report and certifications and the independent auditors’ reports on the Company’s consolidated financial statements for the years ended December 31, 2009, 2008 and 2007, and the Company’s annual accounts as at December 31, 2009.
The Board of Directors recommends a vote FOR approval of the Board of Directors’ management report and certifications and the independent auditors’ reports on the Company’s consolidated financial statements for the years ended December 31, 2009, 2008 and 2007, and the Company’s annual accounts as at December 31, 2009. The Board of Directors’ management report on such consolidated financial statements -which has been combined with its management report on the Company’s annual accounts- management’s certifications and the independent auditors’ reports to such consolidated financial statements and annual accounts are included in the Company’s 2009 annual report, a copy of which is available on the Company’s website at www.tenaris.com/investors and may also be obtained upon request, by calling (352) 26-47-89-78 (if you are in Luxembourg), 1-800-555-2470 (if you are in the United States), or +1-267-468-0786 (if you are in any other jurisdiction).
2. Approval of the Company’s consolidated financial statements for the years ended December 31, 2009, 2008 and 2007.
The Board of Directors recommends a vote FOR approval of the Company’s consolidated financial statements for the years ended December 31, 2009, 2008 and 2007, after due consideration of the Board of Directors’ management report and certifications and the independent auditor’s reports on such consolidated financial statements. The consolidated balance sheets and the related consolidated statements of income, of cash flows and of changes in equity and the notes to such consolidated financial statements are included in the Company’s 2009 annual report, a copy of which is available on the Company’s website at www.tenaris.com/investors and may also be obtained upon request, by calling (352) 26-47-89-78 (if you are in Luxembourg), 1-800-555-2470 (if you are in the United States), or +1-267-468-0786 (if you are in any other jurisdiction).
3. Approval of the Company’s annual accounts as at December 31, 2009.
The Board of Directors recommends a vote FOR approval of the Company’s annual accounts as at December 31, 2009, after due consideration of the of the Board of Directors’ management report and certifications and the independent auditor’s reports on such annual accounts. The balance sheet, the profit and loss account and the notes to such annual accounts are included in the Company's 2009 annual report, a copy of which is available on our website at www.tenaris.com/investors and may also be obtained upon request, by calling (352) 26-47-89-78 (if you are in Luxembourg), 1-800-555-2470 (if you are in the United States), or +1-267-468-0786 (if you are in any other jurisdiction).
4. Allocation of results and approval of dividend payment for the year ended December 31, 2009.
The Board of Directors recommends a vote FOR approval of a dividend in U.S. dollars, in the amount of US$0.34 per Share currently issued and outstanding and US$0.68 per ADR currently issued and outstanding. As required by Luxembourg law, this dividend includes the interim dividend of US$0.13 per Share (US$0.26 per ADR) paid on November 26, 2009. Accordingly, if this dividend proposal is approved, the Company will make a dividend payment on June 24, 2010, in the amount of US$ 0.21 per Share currently issued and outstanding and US$ 0.42 per ADR currently issued and outstanding.
The aggregate amount of US$ 153,469,787.90 distributed as interim dividend on November 26, 2009, was paid from reserves of earnings from the nine-month period ended September 30, 2009. The aggregate amount of US$ 247,912,734.30 to be distributed as dividend on June 24, 2010, is to be paid from profits earned during the year ended December 31, 2009. The balance of the fiscal year’s profits will be allocated to the Company’s retained earnings account.
Upon approval of this resolution, it is proposed that the Board of Directors be authorized to determine or amend, in its discretion, the terms and conditions of the dividend payment.
5. Discharge to the members of the Board of Directors for the exercise of their mandate during the year ended December 31, 2009.
In accordance with applicable Luxembourg law and regulations, it is proposed that, upon approval of the Company’s annual accounts as at December 31, 2009, the members of the Board of Directors be discharged from any liability in connection with the management of the Company’s affairs during such year.
6. Election of the members of the Board of Directors.
The Company’s Articles of Association provide for the annual election by the shareholders of a Board of Directors of not less than five and not more than fifteen members. Members of the Board of Directors have a term of office of one year, but may be reappointed.
Under the Company’s Articles of Association and applicable U.S. laws and regulations, effective as of July 15, 2005, the Company is required to have an Audit Committee comprised solely of directors who are independent.
The present Board of Directors of the Company consists of ten directors. Three members of the Board of Directors (Messrs. Jaime Serra Puche, Amadeo Vázquez y Vázquez and Roberto Monti) qualify as independent directors under the Company’s Articles of Association and applicable law and are members of the Audit Committee.
It is proposed that the number of members of the Board of Directors be maintained at ten and that all of the current members of the Board of Directors be re-elected.
Set forth below is summary biographical information of each of the candidates:
| 1. | Roberto Bonatti. Mr. Bonatti is a member of the Company’s board of directors. He is a grandson of Agostino Rocca, founder of the Techint group, a group of companies controlled by San Faustin N.V. (“San Faustin”).Throughout his career in the Techint group he has been involved specifically in the engineering and construction and corporate sectors. He was first employed by the Techint group in 1976, as deputy resident engineer in Venezuela. In 1984, he became a director of San Faustin, and since 2001 he has served as its president. In addition, Mr. Bonatti currently serves as president of Tecpetrol S.A. (“Tecpetrol”) and Techint Compañia Técnica Internacional S.A.C.I. He is also a member of the board of directors of Ternium S.A. (“Ternium”), Siderca S.A.I.C. (“Siderca”) and Siderar S.A.I.C. (“Siderar”). Mr. Bonatti is an Italian citizen. |
| 2. | Carlos Condorelli. Mr. Condorelli is a member of the Company’s board of directors. He served as our chief financial officer from October 2002 until September 2007. He is also a board member of Ternium. He began his career within the Techint group in 1975 as an analyst in the accounting and administration department of Siderar. He has held several positions within Tenaris and other Techint group companies, including finance and administration director of Tubos de Acero de México, S.A. (“Tamsa”) and president of the board of directors of Empresa Distribuidora La Plata S.A., or Edelap, an Argentine utilities company. Mr. Condorelli is an Argentine citizen. |
| 3. | Carlos Franck. Mr. Franck is a member of the Company’s board of directors. He is president of Santa María S.A.I.F. and Inverban S.A., vice president of Siderca and a member of the board of directors of Techint Financial Corporation N.V., III Industrial Investments Inc., Siderar, Tecpetrol and Tecgas N.V. He has financial, planning and control responsibilities in subsidiaries of San Faustin. He serves as a member of the Board in the Di Tella University. Mr. Franck is an Argentine citizen. |
| 4. | Roberto Monti. Mr. Monti is a member of the Company’s board of directors. He is the non-executive chairman of Trefoil Limited and a member of the board of directors of Petrobras Energia. He has served as vice president of Exploration and Production of Repsol YPF and chairman and CEO of YPF. He was also president of Dowell, a subsidiary of Schlumberger and president of Schlumberger Wire & Testing division for East Hemisphere Latin America. Mr. Monti is an Argentine citizen. |
| 5. | Gianfelice Mario Rocca. Mr. Rocca is a member of the Company’s board of directors. He is a grandson of Agostino Rocca. He is chairman of the board of directors of San Faustin, a member of the board of directors of Ternium, president of the Humanitas Group and president of the board of directors of Techint Compagnia Tecnica Internazionale S.p.A. and Tenova S.p.A. In addition, he sits on the board of directors or executive committees of several companies, including Allianz S.p.A and Buzzi Unicem. He is vice president of Confindustria, the leading association of Italian industrialists. He is a member of the Advisory Board of Allianz Group, the Trilateral Commission and the European Advisory Board of the Harvard Business School. Mr. Rocca is an Italian citizen. |
| 6. | Paolo Rocca. Mr. Rocca is chairman of the Company’s board of directors and our chief executive officer. He is a grandson of Agostino Rocca. He is also chairman of the board of directors of Tamsa. He is also chairman of the board of directors of Ternium, director and vice president of San Faustin and director of Techint Financial Corporation N.V. Mr. Rocca is the chairman of the World Steel Association and member of the International Advisory Committee of the NYSE Euronext (New York Stock Exchange). Mr. Rocca is an Italian citizen. |
| 7. | Jaime Serra Puche. Mr. Serra Puche is a member of the Company’s board of directors. He is chairman of SAI Consultores, a Mexican consulting firm, and a member of the board of directors of Chiquita Brands International, the Mexico Fund, Grupo Vitro and Grupo Modelo. Mr. Serra Puche served as Mexico’s Undersecretary of Revenue, Secretary of Trade and Industry, and Secretary of Finance. He led the negotiation and implementation of NAFTA. Mr. Serra Puche is a Mexican citizen. |
| 8. | Alberto Valsecchi. Mr. Valsecchi is a member of the Company’s board of directors. He served as our chief operating officer from February 2004 until July 2007. He joined the Techint group in 1968 and has held various positions within Tenaris and other Techint group companies. He has retired from his executive positions. He is also a member of the board of directors of San Faustin and has been elected as the chairman of the board of directors of Dalmine, a position he assumed in May 2008. Mr. Valsecchi is an Italian citizen. |
| 9. | Amadeo Vázquez y Vázquez. Mr. Vázquez y Vázquez is a member of the Company’s board of directors. He is an independent member of the board of directors of Gas Natural Ban S.A. He is a member of the Asociación Empresaria Argentina, and of the Fundación Mediterránea, and he is a member of the Advisory Board of the Fundación de Investigaciones Económicas Latinoamericanas. He served as CEO of the Banco Río de la Plata S.A. until August 1997 and was also the chairman of the board of directors of Telecom Argentina S.A. until April 2007. Mr. Vázquez y Vázquez is a Spanish and Argentine citizen. |
| 10. | Guillermo Vogel. Mr. Vogel is a member of the Company’s board of directors. He is vice chairman of Tamsa, chairman of Grupo Collado S.A.B. de C.V, vice chairman of Estilo y Vanidad S.A. de C.V. and member of the board of directors of Alfa S.A.B. de C.V., the American Iron and Steel Institute, the North American Steel Council, the Universidad Panamericana and the IPADE. In addition, he is a member of the board of directors and of the investment committee of the Corporación Mexicana de Inversiones de Capital and a member of the board of directors and the audit committee of HSBC (México). Mr. Vogel is a Mexican citizen. |
Each elected director will hold office until the next Annual General Meeting of Shareholders. Under the current Company’s Articles of Association, such meeting is required to be held on June 1st, 2011.
The Company’s Board of Directors met eleven times during 2009. On January 31, 2003, the Board of Directors created an Audit Committee pursuant to Article 11 of the Company’s Articles of Association. As permitted under applicable laws and regulations, the Board of Directors does not have any executive, nominating or compensation committee, or any committees exercising similar functions.
7. Compensation of the members of the Board of Directors.
It is proposed that each of the members of the Board of Directors receive an amount of US$70,000 as compensation for their services during the fiscal year 2010. It is further proposed that the members of the Board of Directors who are members of the Audit Committee receive an additional fee of US$50,000 and that the Chairman of such Audit Committee receive, further, an additional fee of US$10,000.
8. Appointment of the independent auditors for the fiscal year ending December 31, 2010, and approval of their fees.
Based on the recommendation from the Audit Committee, the Board of Directors recommends a vote FOR the appointment of PricewaterhouseCoopers (acting, in connection with the Company’s annual accounts and annual consolidated financial statements required under Luxembourg law, through PricewaterhouseCoopers S.àr.l., Réviseur d'entreprises, and, in connection with the Company’s annual and interim consolidated financial statements required under the laws of any other relevant jurisdiction, through Pricewaterhouse & Co. S.R.L.) as the Company’s independent auditors for the fiscal year ending December 31, 2010, to be engaged until the next Annual General Meeting of Shareholders that will be convened to decide on the 2010 accounts.
In addition, the Board of Directors recommends a vote FOR approval of the independent auditors’ fees for audit, audit-related and other services to be rendered during the fiscal year ending December 31, 2010, broken-down into five currencies (Argentine Pesos, Euro, Mexican Pesos, Brazilian reais and U.S. Dollars), up to a maximum amount for each currency equal to AR$7,533,962, €472,297, MX$4,237,309, BR$345,000 and US$1,408,735. Such fees would cover the audit of the Company’s consolidated financial statements and annual accounts, the audit of the Company’s internal controls over financial reporting as mandated by the Sarbanes-Oxley Act of 2002, other audit-related services, and other services rendered by the independent auditors. For information purposes, based on the exchange rate between the U.S. Dollar and each applicable other currency as of December 14, 2009, the aggregate amount of fees for audit, audit-related and other services to be rendered by the independent auditors during the fiscal year ending December 31, 2010, is equivalent to US$4,611,249. The Board of Directors also recommends that its Audit Committee be authorised to approve any increase or reallocation of the independent auditors’ fees as may be necessary, appropriate or desirable under the circumstances.
9. Authorisation to the Company, or any subsidiary, to from time to time purchase, acquire or receive shares of the Company, in accordance with Article 49-2 of the Luxembourg law of 10 August 1915 and with applicable laws and regulations.
It is recommended that the authorisation to the Company and to the Company’s subsidiaries to acquire, from time to time, Shares, including Shares represented by ADRs (collectively, “Securities”) granted by the General Meeting of Shareholders held on June 3, 3009, be cancelled and that a new authorization be granted to the Company and to the Company’s subsidiaries to purchase, acquire or receive, from time to time, Securities, on the following terms and conditions:
| 1. | Purchases, acquisitions or receptions of Securities may be made in one or more transactions as the Board of Directors or the board of directors or other governing bodies of the relevant entity, as applicable, considers advisable. |
| 2. | The maximum number of Securities acquired pursuant to this authorization may not exceed 10% of the Company’s issued and outstanding Shares or, in the case of acquisitions made through a stock exchange in which the Securities are traded, such lower amount as may not be exceeded pursuant to any applicable laws or regulations of such market. The number of Securities acquired as a block may amount to the maximum permitted amount of purchases. |
| 3. | The purchase price per share to be paid in cash may not exceed 125% (excluding transaction costs and expenses), nor may it be lower than 75% (excluding transaction costs and expenses), in each case of the average of the closing prices of the Company’s Securities in the stock exchange through which the Company’s Securities are acquired, during the five trading days in which transactions in the Securities were recorded in such stock exchange preceding (but excluding) the day on which the Company’s Securities are acquired. For over-the-counter or off-market transactions, the purchase price per ADR to be paid in cash may not exceed 125% (excluding transaction costs and expenses), nor may it be lower than 75% (excluding transaction costs and expenses), in each case of the average of the closing prices of the Company’s ADRs in the New York Stock Exchange during the five trading days in which transactions in ADRs were recorded in the New York Stock Exchange preceding (but excluding) the day on which the Company’s ADRs are acquired; and, in the case of acquisition of Securities, other than in the form of ADRs, such maximum and minimum purchase prices shall be calculated based on the number of underlying Shares represented by such ADRs. Compliance with maximum and minimum purchase price requirements in any and all acquisitions made pursuant to this authorization (including, without limitation, acquisitions carried out through the use of derivative financial instruments or option strategies) shall be determined on and as of the date on which the relevant transaction is entered into, irrespective of the date on which the transaction is to be settled. |
| 4. | The above maximum and minimum purchase prices shall, in the event of a change in the par value of the Shares, a capital increase by means of a capitalization of reserves, a distribution of Shares under compensation or similar programs, a stock split or reverse stock split, a distribution of reserves or any other assets, the redemption of capital, or any other transaction impacting on the Company’s equity be adapted automatically, so that the impact of any such transaction on the value of the Shares shall be reflected. |
| 5. | The acquisitions of Securities may not have the effect of reducing the Company’s net assets below the sum of the Company’s capital stock plus its undistributable reserves. |
| 6. | Only fully paid-up Securities may be acquired pursuant to this authorisation. |
| 7. | The acquisitions of Securities may be carried out for any purpose, as may be permitted under applicable laws and regulations, including without limitation to reduce the share capital of the Company, to offer such shares to third parties in the context of corporate mergers or acquisitions of other entities or participating interests therein, for distribution to the Company’s or the Company’s subsidiaries’ directors, officers or employees or to meet obligations arising from convertible debt instruments. |
| 8. | The acquisitions of Securities may be carried out by any and all means, as may be permitted under applicable laws and regulations, including through any stock exchange in which the Company’s Securities are traded, through public offers to all shareholders of the Company to buy Securities, through the use of derivative financial instruments or option strategies, or in over the counter or off-market transactions or in any other manner. |
| 9. | The acquisitions of Securities may be carried out at any time, during the duration of the authorisation, including during a tender offer period, as may be permitted under applicable laws and regulations. |
| 10. | The authorisation granted to acquire Securities shall be valid for such maximum period as may be provided for under applicable Luxembourg law as in effect from time to time (such maximum period being, as of to date, 5 years). |
| 11. | The acquisitions of Securities shall be made at such times and on such other terms and conditions as may be determined by the Board of Directors or the board of directors or other governing bodies of the relevant entity, provided that, any such purchase shall comply with Article 49-2 et.seq. of the Luxembourg Law of 10 August 1915 on commercial companies, as amended (or any successor law) and, in the case of acquisitions of Securities made through a stock exchange in which the Company’s Securities are traded, with any applicable laws and regulations of such market. |
It is recommended that the Meeting grant this authorization and further grant all powers to the Board of Directors and to the board of directors or other governing bodies of the Company’s subsidiaries, in each case with powers to delegate in accordance with applicable laws, the Company’s Articles of Association or the articles of association of other applicable organizational documents of the relevant Company’s subsidiary, to decide on and implement this authorisation, to define, if necessary, the terms and procedures for carrying out any purchase, acquisition or reception of Securities, and, in particular, to place any stock exchange orders, conclude any agreements, including for keeping registers of purchases and sales of Securities, make any declarations to the applicable regulatory authorities, carry out all formalities and, generally, do all such other acts and things as may be necessary, appropriate or desirable under the circumstances. The Board of Directors is expressly authorized to delegate to its Chairman, with the latter having the option to sub-delegate to any other person(s), the performance of the actions entrusted to the Board of Directors, pursuant to, or in connection with, this authorisation.
10. Authorisation to the Board of Directors to cause the distribution of all shareholder communications, including its shareholder meeting and proxy materials and annual reports to shareholders, by such electronic means as is permitted by any applicable laws or regulations.
In order to expedite shareholder communications and ensure their timely delivery, the Board of Directors recommends that it be authorised to cause the distribution of all shareholder communications, including its shareholder meeting and proxy materials and annual reports to shareholders (either in the form of a separate annual report containing financial statements of the Company and its consolidated subsidiaries or in the form of an annual report on Form 20-F or similar document, as filed with the securities authorities or stock markets) by such electronic means as are permitted or required by any applicable laws or regulations (including any interpretations thereof), including, without limitation, by posting such communication on the Company's website, or by sending electronic communications (emails) with attachment(s) in a widely used format or with a hyperlink to the applicable filing by the Company on the website of the above referred authorities or stock markets, or by any other existing or future electronic means of communication as is or may be permitted by any applicable laws or regulations.
In this resolution the Company seeks authorisation under Article 16 of the Luxembourg Transparency Law of 11 January 2008 to give, send or supply information (including any notice or other document) that is required or authorised to be given, sent or supplied to a shareholder by the Company whether required under the Company’s Articles of Association or by any applicable law or any other rules or regulations to which the Company may be subject, by making such information (including any notice or other document) available on the Company’s website or through other electronic means.
* * * * *
The Company anticipates that the next Annual General Meeting of Shareholders will be held on June 1, 2011. Any holder of Shares who intends to present a proposal to be considered at the next Annual General Meeting of Shareholders is requested to submit its proposal in writing to the Company at any of the offices indicated in the Notice not later than 4:00 P.M. (local time) on March 31, 2011, or in accordance with the procedures set forth under applicable Luxembourg law, in order for such proposal to be considered for inclusion on the agenda for the 2011 Annual General Meeting of Shareholders.
PricewaterhouseCoopers are the Company’s independent auditors. A representative of the independent auditors will be present at the meeting to respond to questions.
Cecilia Bilesio
Secretary to the Board of Directors
TENARIS S.A.
ANNUAL REPORT 2009
TABLE OF CONTENTS
| COMPANY PROFILE | 2 |
| LETTER FROM THE CHAIRMAN | 3 |
| MANAGEMENT REPORT | 5 |
| Leading indicators | 7 |
| Information on Tenaris | 8 |
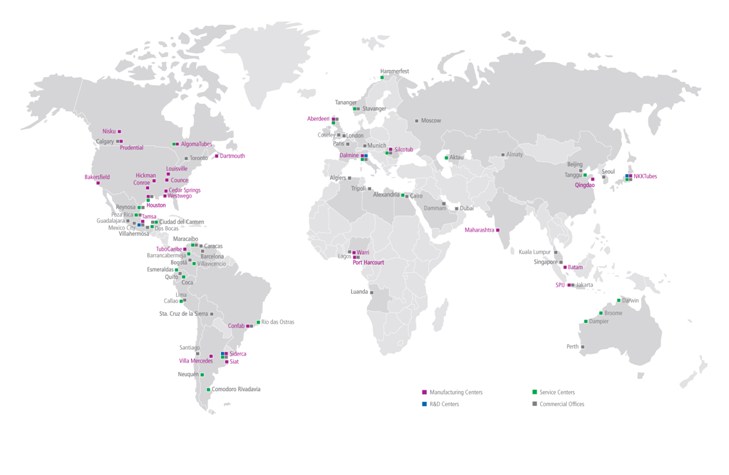
| TenarisHydril | 13 |
| Tenaris in numbers | 16 |
| Principal Risks and Uncertainties | 18 |
| Operating and Financial Review and Prospects | 20 |
| Recent Developments | 30 |
| Environmental Regulation | 30 |
| Related Party Transactions | 30 |
| Corporate Governance | 30 |
| MANAGEMENT CERTIFICATION | 41 |
| FINANCIAL INFORMATION | 42 |
| Consolidated Financial Statements | 42 |
| Tenaris S.A. Annual Accounts (Luxembourg GAAP) | 105 |
| CORPORATE INFORMATION | 121 |
company profile
Tenaris is a leading supplier of tubes and related services for the world’s energy industry and certain other industrial applications. Our mission is to deliver value to our customers through product development, manufacturing excellence and supply chain management. We minimize risk for our customers and help them reduce costs, increase flexibility and improve time-to-market. Our employees around the world are committed to continuous improvement by sharing knowledge across a single global organization.
2
Letter From The Chairman
Dear Shareholders,
In 2009, we felt the impact of the global economic and financial crisis on demand for our products and services. Pipe shipments were down 41% compared to 2008. Tenaris responded well, adjusting production levels, reducing working capital and structural costs, while continuing with our investments to strengthen our positioning in a more competitive marketplace. Our employees made remarkable efforts to support the difficult adjustment that we had to execute, when our average level of plant utilization fell to around 40 % of that in 2008.
Our results for the year reflect a good performance in spite of the difficult comparison with the exceptional results of the previous years. With an EBITDA of $2.3 billion on net sales of $8.1 billion and a strong balance sheet with $0.7 billion in net cash, we are well positioned for the recovery of demand which we are starting to see particularly in North America and in the Middle East.
In the US market, attractive oil prices and the exploitation of leases for productive shale gas drilling is leading activity higher although rising natural gas production levels and falling prices may limit the extent of the recovery. At the same time, OCTG inventories have adjusted to more normal levels after reaching unsustainable levels following the surge in Chinese imports that took place in the second half of 2008 and first half of 2009.
In the Middle East, reactivation in Iraq and the development of deep and sour gas reserves in various parts of the region is driving activity. Meanwhile, the adjustment of inventory levels continued in the region in 2009 and inventories of premium products are now relatively low. We also expect activity levels to increase in other regions as oil and gas companies increase or maintain their budgets for exploration and production activity while drilling costs have come down.
The investments we have under way position us well for the recovery. In the US, we have been investing to transform the quality performance of our mills and we are completing new tubing and finishing facilities. We are currently ramping up production to meet the increase in demand. The construction of our new rolling mill in Veracruz is on schedule and we expect to begin operations in October. Following the agreement we concluded with the unions and the government in December in Italy, we will now go forward with a significant investment at our Dalmine mill aimed at increasing product differentiation and improving industrial efficiency.
With new production capacity continuing to come into the market all over the world and global demand for OCTG unlikely to recover the level seen in 2008 any time soon, the competitive environment over the coming years is expected to be fierce. We are pleased, however, that the governments of the US, Canada and the European Union have recognized the injury, and threat thereof, to local industrial production from subsidized Chinese imports.
A clear priority is to be close to our customers. Over the past few years, we have been building up local production and service capabilities in various key markets around the world. Over the past year, we have integrated into Tenaris, the heat treatment and premium finishing operations we acquired in Indonesia and have established a strong local presence. In May, we will start production at our new premium finishing facility in Saudi Arabia and the recruiting and training of local personnel is well under way. We will now reinforce this priority by making Dubai the center of our oil and gas commercial operations of the Eastern hemisphere.
Notwithstanding a more difficult competitive environment, the fundamentals of our business remain solid. We are capable of differentiating our products and services consistently from those of our competitors, in an environment in which the demand for more sophisticated products for complex applications is increasing. The decline in market prices that started towards the end of 2008 has largely taken its course and the raw material cost dynamics are starting to be reflected in price increases. We remain confident that Tenaris will continue to perform strongly.
3
We propose, however, to adjust the dividend payout to bring it more in line with the level of results we had this year. Accordingly, we are proposing a dividend of US$0.34 per share (US$0.68 per ADS), which includes the interim dividend of US$0.13 per share (US$0.26 per ADS) paid in November. The balance of the dividend will be payable in June.
As we went into 2009, the economic and financial crisis was still unfolding and there was considerable uncertainty as to the depth and course it would take. I wish to thank our employees for their extraordinary commitment and sense of responsibility in responding to the crisis and for their efforts to sustain and enhance the competitive position of the company. I also thank our customers, suppliers and shareholders for their continuing support and confidence in Tenaris.
April 22, 2010
Paolo Rocca
4
Management Report
CERTAIN DEFINED TERMS
Unless otherwise specified or if the context so requires:
| · | References in this annual report to “the Company” refer exclusively to Tenaris S.A., a Luxembourg joint stock corporation (société anonyme holding). |
| · | References in this annual report to “Tenaris”, “we”, “us” or “our” refer to Tenaris S.A. and its consolidated subsidiaries. See Accounting Policies A, B and L to our audited consolidated financial statements included in this annual report. |
| · | References in this annual report to “San Faustin” refer to San Faustin N.V., a Netherlands Antilles corporation and the Company’s controlling shareholder. |
| · | “Shares” refers to ordinary shares, par value $1.00 of the Company. |
| · | “ADSs” refers to the American Depositary Shares, which are evidenced by American Depositary Receipts. |
| · | “tons” refers to metric tons; one metric ton is equal to 1,000 kilograms, 2,204.62 pounds, or 1.102 U.S. (short) tons. |
| · | “billion” refers to one thousand million, or 1,000,000,000. |
| · | “dollars”, “U.S. dollars”, “US$” or “$” each refers to the United States dollar |
PRESENTATION OF CERTAIN FINANCIAL AND OTHER INFORMATION
Accounting Principles
We prepare our consolidated financial statements in conformity with International Financial Reporting Standards, as issued by the International Accounting Standards Board and adopted by the European Union, or IFRS.
We publish consolidated financial statements expressed in U.S. dollars. Our consolidated financial statements included in this annual report are those for the years ended December 31, 2009, 2008 and 2007.
Rounding
Certain monetary amounts, percentages and other figures included in this annual report have been subject to rounding adjustments. Accordingly, figures shown as totals in certain tables may not be the arithmetic aggregation of the figures that precede them, and figures expressed as percentages in the text may not total 100% or, as applicable, when aggregated may not be the arithmetic aggregation of the percentages that precede them.
CAUTIONARY STATEMENT CONCERNING FORWARD-LOOKING STATEMENTS
This annual report and any other oral or written statements made by us to the public may contain “forward-looking statements”. Forward looking statements are based on management’s current views and assumptions and involve known and unknown risks that could cause actual results, performance or events to differ materially from those expressed or implied by those statements.
We use words such as “aim”, “will likely result”, “will continue”, “contemplate”, “seek to”, “future”, “objective”, “goal”, “should”, “will pursue”, “anticipate”, “estimate”, “expect”, “project”, “intend”, “plan”, “believe” and words and terms of similar substance to identify forward-looking statements, but they are not the only way we identify such statements. This annual report contains forward-looking statements, including with respect to certain of our plans and current goals and expectations relating to Tenaris’s future financial condition and performance. Sections of this annual report that by their nature contain forward-looking statements include, but are not limited to, “Business Overview”, “Principal Risks and Uncertainties”, and “Operating and Financial Review and Prospects”. In addition to the risks related to our business discussed under “Principal Risks and Uncertainties”, other factors could cause actual results to differ materially from those described in the forward-looking statements. These factors include, but are not limited to:
5
| · | our ability to implement our business strategy or to grow through acquisitions, joint ventures and other investments; |
| · | our ability to price our products and services in accordance with our strategy; |
| · | trends in the levels of investment in oil and gas exploration and drilling worldwide; |
| · | general macroeconomic and political conditions in the countries in which we operate or distribute pipes; and |
| · | our ability to absorb cost increases and to secure supplies of essential raw materials and energy. |
By their nature, certain disclosures relating to these and other risks are only estimates and could be materially different from what actually occurs in the future. As a result, actual future gains or losses that may affect our financial condition and results of operations could differ materially from those that have been estimated. You should not place undue reliance on the forward-looking statements, which speak only as of the date of this annual report. Except as required by law, we are not under any obligation, and expressly disclaim any obligation, to update or alter any forward-looking statements, whether as a result of new information, future events or otherwise.
6
Leading indicators
| 2009 | 2008 | 2007 | ||||||||||
| SALES VOLUMES (thousands of metric tons) | ||||||||||||
| Tubes-Seamless | 1,970 | 2,818 | 2,818 | |||||||||
| Tubes-Welded | 346 | 1,057 | 965 | |||||||||
| Tubes-Total | 2,316 | 3,875 | 3,783 | |||||||||
| Projects-Welded | 334 | 591 | 474 | |||||||||
| Total –Tubes+Projects | 2,650 | 4,466 | 4,257 | |||||||||
| PRODUCTION VOLUMES (thousands of metric tons) | ||||||||||||
| Tubes-Seamless | 1,770 | 3,005 | 2,836 | |||||||||
| Tubes-Welded | 249 | 999 | 909 | |||||||||
| Tubes-Total | 2,019 | 4,004 | 3,745 | |||||||||
| Projects-Welded | 291 | 548 | 499 | |||||||||
| Total –Tubes+Projects | 2,310 | 4,552 | 4,244 | |||||||||
| FINANCIAL INDICATORS (millions of US$) | ||||||||||||
| Net sales | 8,149 | 11,988 | 9,874 | |||||||||
| Operating income | 1,814 | 3,126 | 2,917 | |||||||||
| EBITDA (1) | 2,318 | 4,044 | 3,401 | |||||||||
| Net income | 1,208 | 2,276 | 2,076 | |||||||||
| Cash flow from operations | 3,064 | 1,465 | 2,021 | |||||||||
| Capital expenditures | 461 | 443 | 448 | |||||||||
| BALANCE SHEET (millions of US$) | ||||||||||||
| Total assets | 13,483 | 15,101 | 15,245 | |||||||||
| Total financial debt | 1,447 | 2,977 | 4,020 | |||||||||
| Net financial debt/ (cash) (2) | (676 | ) | 1,392 | 2,970 | ||||||||
| Total liabilities | 3,762 | 6,399 | 7,715 | |||||||||
| Shareholders’ equity including minority interest | 9,721 | 8,702 | 7,530 | |||||||||
| PER SHARE / ADS DATA (US$ PER SHARE / PER ADS) | ||||||||||||
| Number of shares outstanding (3) (thousands of shares) | 1,180,537 | 1,180,537 | 1,180,537 | |||||||||
| Earnings per share | 0.98 | 1.80 | 1.63 | |||||||||
| Earnings per ADS | 1.97 | 3.60 | 3.26 | |||||||||
| Dividends per share (4) | 0.34 | 0.43 | 0.38 | |||||||||
| Dividends per ADS (4) | 0.68 | 0.86 | 0.76 | |||||||||
| ADS Stock price at year-end | 42.65 | 20.98 | 44.73 | |||||||||
| Number of employees (3) | 22,591 | 23,873 | 23,372 | |||||||||
| 1. | Defined as operating income plus depreciation, amortization and impairment charges. |
| 2. | Defined as borrowings less cash and cash equivalents and other current investments. |
| 3. | As of December 31. |
| 4. | Proposed or paid in respect of the year. |
7
Information on Tenaris
Overview
We are a leading global manufacturer and supplier of steel pipe products and related services for the world’s energy industry as well as for other industrial applications. Our customers include most of the world’s leading oil and gas companies as well as engineering companies engaged in constructing oil and gas gathering, transportation, processing and power generation facilities. Our principal products include casing, tubing, line pipe, and mechanical and structural pipes.
Over the last two decades, we have expanded our business globally through a series of strategic investments. We now operate an integrated worldwide network of steel pipe manufacturing, research, finishing and service facilities with industrial operations in North and South America, Europe, Asia and Africa and a direct presence in most major oil and gas markets.
Our business is organized in two main business segments: Tubes and Projects.
| · | Tubes includes our operations that consist in the production, distribution and sale of seamless and welded tubular products and related services mainly for energy and select industrial applications. |
| · | Projects includes our operations that consist in the production, distribution and sale of welded pipes mainly used in the construction of major pipeline projects. |
A third business segment (Others) includes all other business activities and operating segments that are not required under IFRS to be separately reported, such as the production, distribution and sale of sucker rods, welded steel pipes for electric conduits, industrial equipment and raw materials that exceed our internal requirements.
History and Development of Tenaris
Tenaris began with the formation of Siderca S.A.I.C., or Siderca, the sole Argentine producer of seamless steel pipe products, by San Faustin’s predecessor in Argentina in 1948. Siat, an Argentine welded steel pipe manufacturer, was acquired in 1986. We grew organically in Argentina and then, in the early 1990s, began to evolve beyond this initial base into a global business through a series of strategic investments. These investments included the acquisition, directly or indirectly, of controlling or substantial interests in the following companies:
| · | Tubos de Acero de México S.A., or Tamsa, the sole Mexican producer of seamless steel pipe products (June 1993); |
| · | Dalmine S.p.A., or Dalmine, a leading Italian producer of seamless steel pipe products (February 1996); |
| · | Tubos de Acero de Venezuela S.A., or Tavsa, the sole Venezuelan producer of seamless steel pipe products (October 1998)1; |
| · | Confab Industrial S.A., or Confab, the leading Brazilian producer of welded steel pipe products (August 1999); |
| · | NKKTubes, a leading Japanese producer of seamless steel pipe products (August 2000); |
| · | Algoma Tubes Inc., or AlgomaTubes, the sole Canadian producer of seamless steel pipe products (October 2000); |
1 In 2009, the Venezuelan government announced the nationalization of Tavsa. For more information on the Tavsa nationalization process, see note 32 (b) “Processes in Venezuela-Nationalization of Venezuelan Subsidiaries” to our consolidated financial statements included in this annual report.
8
| · | S.C. Silcotub S.A., or Silcotub, a leading Romanian producer of seamless steel pipe products (July 2004); |
| · | Maverick Tube Corporation, or Maverick, a leading North American producer of welded steel pipe products with operations in the U.S., Canada and Colombia (October 2006); |
| · | Hydril Company, or Hydril, a leading North American manufacturer of premium connection products for oil and gas drilling production (May 2007); and |
| · | Seamless Pipe Indonesia Jaya, or SPIJ, an Indonesian OCTG processing business with heat treatment and premium connection threading facilities (April 2009). |
In addition, we have established a global network of pipe finishing, distribution and service facilities with a direct presence in most major oil and gas markets and a global network of research and development centers.
Business Overview
Our business strategy is to continue expanding our operations worldwide and further consolidate our position as a leading global supplier of high-quality tubular products and services to the energy and other industries by:
| · | pursuing strategic investment opportunities in order to strengthen our presence in local and global markets; |
| · | expanding our comprehensive range of products and developing new high-value products designed to meet the needs of customers operating in increasingly challenging environments; |
| · | securing an adequate supply of production inputs and reducing the manufacturing costs of our core products; and |
| · | enhancing our offer of technical and pipe management services designed to enable customers to optimize their selection and use of our products and reduce their overall operating costs. |
Pursuing strategic investment opportunities and alliances
We have a solid record of growth through strategic investments and acquisitions. We pursue selective strategic investments and acquisitions as a means to expand our operations and presence in selected markets, enhance our global competitive position and capitalize on potential operational synergies. For example, we are building new capacity at our seamless pipe facility in Mexico in order to enhance our ability to serve local and global markets. Our track record on companies’ acquisitions is described above (See “History and Development of Tenaris”).
9
Developing high-value products
We have developed an extensive range of high-value products suitable for most of our customers’ operations using our network of specialized research and testing facilities and by investing in our manufacturing facilities. As our customers expand their operations, we seek to supply high-value products that reduce costs and enable them to operate safely in increasingly challenging environments.
Securing inputs for our manufacturing operations
We seek to secure our existing sources of raw material and energy inputs, and to gain access to new sources, of low-cost inputs which can help us maintain or reduce the cost of manufacturing our core products over the long term.
Enhancing our offer of technical and pipe management services
We continue to enhance our offer of technical and pipe management services for our customers worldwide. Through the provision of these services, we seek to enable our customers to optimize their operations, reduce costs and to concentrate on their core businesses. They are also intended to differentiate us from our competitors and further strengthen our relationships with our customers worldwide through long-term agreements.
Our Competitive Strengths
We believe our main competitive strengths include:
| · | our global production, commercial and distribution capabilities, offering a full product range with flexible supply options backed up by local service capabilities in important oil and gas producing and industrial regions around the world; |
| · | our ability to develop, design and manufacture technologically advanced products; |
| · | our solid and diversified customer base and historic relationships with major international oil and gas companies around the world, and our strong and stable market shares in the countries in which we have manufacturing operations; |
| · | our human resources around the world with their diverse knowledge and skills; |
| · | our low-cost operations, primarily at state-of-the-art, strategically located production facilities with favorable access to raw materials, energy and labor, and 50 years of operating experience; and |
| · | our strong balance sheet. |
Business Segments
Our business is organized in two main business segments: Tubes and Projects.
| · | Tubes includes our operations that consist in the production, distribution and sale of seamless and welded tubular products and related services mainly for energy and select industrial applications. |
| · | Projects includes our operations that consist in the production, distribution and sale of welded pipes mainly used in the construction of major pipeline projects. |
A third business segment (Others) includes all other business activities and operating segments that are not required under IFRS to be separately reported, such as the production, distribution and sale of sucker rods, welded steel pipes for electric conduits, industrial equipment and raw materials that exceed our internal requirements.
Our Products
Our principal finished products are seamless and welded steel casing and tubing, line pipe and various other mechanical and structural steel pipes for different uses. Casing and tubing are also known as oil country tubular goods or OCTG. In our Projects business segment we also produce large diameter welded steel pipes for oil and gas pipelines. We manufacture our steel pipe products in a wide range of specifications, which vary in diameter, length, thickness, finishing, steel grades, threading and coupling. For most complex applications, including high pressure and high temperature applications, seamless steel pipes are usually specified and, for some standard applications, welded steel pipes can also be used.
10
Casing. Steel casing is used to sustain the walls of oil and gas wells during and after drilling.
Tubing. Steel tubing is used to conduct crude oil and natural gas to the surface after drilling has been completed.
Line pipe. Steel line pipe is used to transport crude oil and natural gas from wells to refineries, storage tanks and loading and distribution centers.
Mechanical and structural pipes. Mechanical and structural pipes are used by general industry for various applications, including the transportation of other forms of gas and liquids under high pressure.
Cold-drawn pipe. The cold-drawing process permits the production of pipes with the diameter and wall thickness required for use in boilers, superheaters, condensers, heat exchangers, automobile production and several other industrial applications.
Premium joints and couplings. Premium joints and couplings are specially designed connections used to join lengths of steel casing and tubing for use in high temperature or high pressure environments. A significant portion of our steel casing and tubing products are supplied with premium joints and couplings. We own an extensive range of premium connections, and following the integration of Hydril’s premium connections business, we market our premium connection products under the TenarisHydril brand name. In addition, we hold licensing rights to manufacture and sell the Atlas Bradford range of premium connections outside of the United States.
Coiled tubing. Coiled tubing is used for oil and gas drilling and well workovers and for subsea pipelines.
Other Products. We also manufacture sucker rods used in oil extraction activities, industrial equipment of various specifications and diverse applications, including liquid and gas storage equipment, and welded steel pipes for electric conduits used in the construction industry. In addition, we sell raw materials that exceed our internal requirements.
.
11
Research and Development
Research and development, or R&D, of new products and processes to meet the increasingly stringent requirements of our customers is an important aspect of our business.
R&D activities are carried out primarily at our specialized research facilities located at our Campana plant in Argentina, at our Veracruz plant in Mexico, at our Dalmine plant in Italy, at the product testing facilities of NKKTubes in Japan and at the research facilities of the Centro Sviluppo Materiali S.p.A, or CSM, in Rome. We have an 8% interest in CSM, which was acquired in 1997. Product development and research currently being undertaken are focused on the increasingly challenging energy markets and include:
| · | proprietary premium joint products including Dopeless® technology; |
| · | heavy wall deep water line pipe and risers; |
| · | proprietary steels; |
| · | tubes and components for the car industry and mechanical applications; |
| · | tubes for boilers; and |
| · | welded pipes for oil and gas and other applications. |
In addition to R&D aimed at new or improved products, we continuously study opportunities to optimize our manufacturing processes. Recent projects in this area include modeling of rolling and finishing process and the development of different process controls, with the goal of improving product quality and productivity at our facilities.
We spent $62.7 million for R&D in 2009, compared to $77.3 million in 2008.
12
TenarisHydril TenarisHydril is today a byword for a secure source of superior premium connection technology. The complete TenarisHydril offer is geared towards meeting customer needs for high-performance applications in even the most extreme environments. The comprehensive range of premium connections products and services is the achievement following on from Tenaris's acquisition of Hydril, a leading manufacturerer of connections for the oil and gas industry in 2007. Together, under the brand TenarisHydril, we offer an integrated package of products, services and technical assistance able to perform in the most demanding well conditions ranging from severe sour enviroments to high pressure and high temperature conditions as well as extreme locations such as ultra-deep water wells in the Gulf of Mexico or drilling in the Arctic. TenarisHydril provides proven market-leading solutions, including both the Blue(TM) Series and Wedge Series 500(TM) technology to serve the sophisticated needs of today's energy industry. We have entered into direct agreements built on long-term agreements with oil and gas engineering companies, many of which now require groundbreaking technologies to explore new fields in increasingly harsh environments. We service this challenging market with quality products developed by specialist teams of highly-qualified industry and technical experts dedicated to finding solutions by continuous improvement and innovation in our Research & Development Centers which are located in strategic markets. This global network of expertise taps into some of the world's leading industrial research institutions ensuring that the best minds in the field are involved in solving the problems posed by the complexities of E&P projects with innovative applications.
Global customer support We have a wide international network of licensed threading shops enabling it to efficiently service every area where TenarisHydril products are used. This means that a swift and flexible response can be provided when changes occur in required specifications and any other unexpected conditions arise during project operations, ensuring that industry quality standards are met. Connections are threaded as close as possible to customer operations, at the manufacturing centers and finishing facilities which form part of the network designed to provide the flexibility required to meet customer needs. All facilities are highly qualified and regularly audited by Tenaris technicians to make sure standards are maintained at all times. Our global technical sales team is made up of experienced engineers who work with our customers to identify the most appropriate product and technology solutions for each particular oil and gas drilling environment. Our engineers not only know how to best apply connections and OCTG products but also understand how the products interact in different environments and operations, providing customers with seasoned advice and informed recommendations.
Our global technical sales team is made up of experienced engineers who work with our customers to identify the most appropriate product and technology solutions for each particular oil and gas drilling environment. Our engineers not only know how to best apply connections and OCTG products but also understand how the products interact in different environments and operations, providing customers with seasoned advice and informed recommendations.

Product technology Our porfolio of TenarisHydril premium connectins is a broad range of proven products designed to deliver a long-lasting quality performance in the complicated and tough environments that are part of today's E&P industry scenario.Manufactured in Tenaris's global network of production facilities, all products are endorsed by the single integrated quality management system underlying design, production, treatment and finishing which ensures consistency and reliability the world over.Furthermore, all of our technology is extensively tested both in our laboratories and in the field, thus guaranteeing the performance of our premium connections and also acting as a basis for future R&D work. Our premium connection products are supported by a global network of field services and licensed threading shops. Dopeless(R) technology Constant research and development of new technologies ensures that products are at the cutting edge of design and performance. Dopeless(R) technology is an example of Tenaris's ability to respond to new requirements and offer customers the opportunity to acquire differential operational and environmental advantages. Originally designed in response to stringent environmental requirements for offshore operations in the North Sea, this technology is free of liquid-based lubricants, using a dope-free coating applied at the mill guaranteed to last through the life cycle of the connection and ensuring it remains corrosion-free.Tenaris's unmatched expertise with Dopeless(R) technology is supported by its global network of field services and technical sales teams which provide complete well design and running support.
14
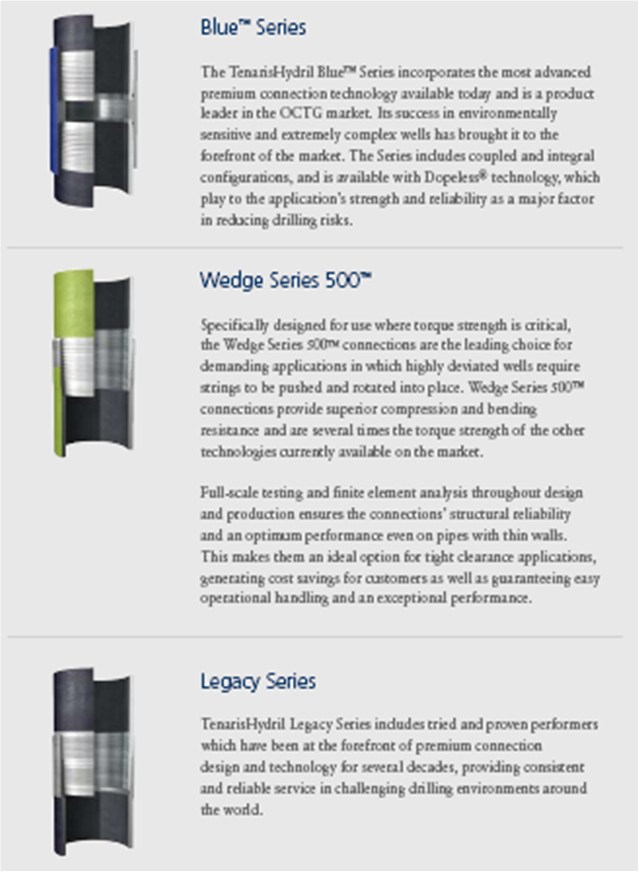
Blue(TM) Series The TenarisHydril Blue(TM) Series incorporates the most advanced premium connection technolgoy available today and is a product leader in the OCTG market. Its success in environmentally sensitive and extremely complex wells has brought it to the forefront of the market. The Series includes coupled and integral configurations, and is available with Dopeless(R) technology, which play to the application's strength and reliability as a major factor in reducing drilling risks. Wedge Series 500(TM) Specifically designed for use where torque strength is critical, the Wedge Series 500(TM) connections are the leading choice for demanding applications in which highly deviated wells require strings to be pushed and rotated into place. Wedge Series 500(TM) connections provide superior compression and bending resistance and are several times the torque strength of the other technologies currently available on the market. Full-scale testing and finite element analysis throughout design and production ensures the connections' structural reliability and an optimum performance even on pipes with thin walls. This makes them an ideal option for tight clearance applications, generating cost savings for customers as well as guaranteeing easy operational handling and an exceptional performance. Legacy Series TenarisHydril Legacy Series includes tried and proven performers which have been at the forefront of premium conncetion design and technology for several decades, providing consistent and reliable service in challenging drilling environments around the world.
15
Tenaris in numbers
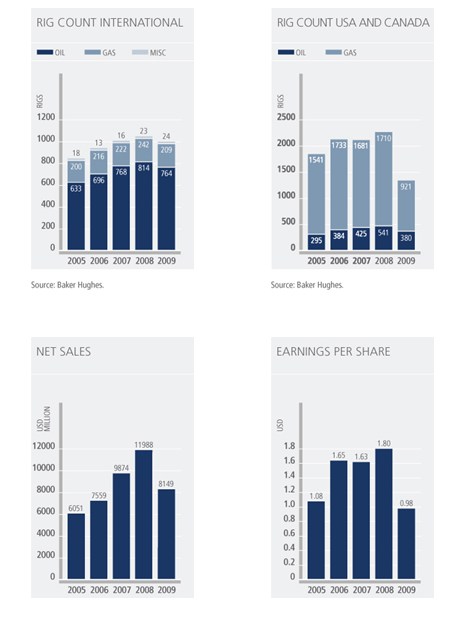
16
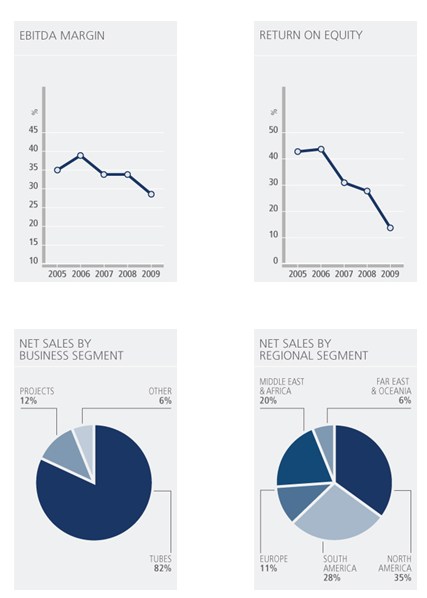
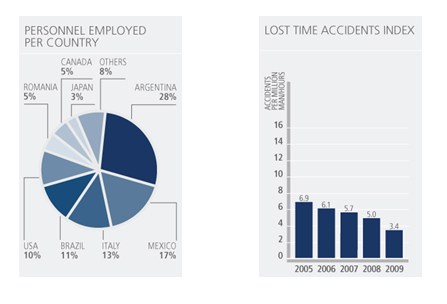
17
Principal Risks and Uncertainties
We face certain risks associated to our business and the industry in which we operate. We are a global steel pipe manufacturer with a strong focus on manufacturing products and related services for the oil and gas industry. Demand for our products depends primarily on the level of exploration, development and production activities of oil and gas companies which is affected by current and expected future prices of oil and natural gas. Several factors, such as the supply and demand for oil and gas, and political and global economic conditions, affect these prices. The recent global financial and economic crisis, which started in September 2008 and lasted through much of 2009, resulted in a significant decline in oil and gas prices, affected the level of drilling activity and triggered efforts to reduce inventories, adversely affecting demand for our products and services. This had, and to some extent continues to have, a negative impact on our business, revenues, profitability and financial position. Similarly, our sales of steel pipe products for pipeline projects have also been adversely affected, as they depend mainly on the implementation of major regional projects, which are likely to be adversely affected by changes in governmental policies, the impact of credit restrictions on our customers’ ability to perform their payment obligations with us and any adverse economic, political or social developments in our major markets. In turn, increases in the cost of raw materials and energy may hurt our profitability if we are not able to recover them through increased prices of our products. We responded to the crisis by adjusting production levels and reducing working capital and structural costs. These measures helped us weather the crisis; in addition, demand, production levels and prices have started to recover in certain segments and markets; however, the extent, timing and duration of the recovery still remain uncertain.
We have significant operations in various countries, including Argentina, Brazil, Canada, Colombia, Italy, Japan, Mexico, Romania and the United States, and we sell our products and services throughout the world. Therefore, like other companies with worldwide operations, we are exposed to risks from fluctuations in foreign currency exchange rates, interest rates and inflation, governmental policies regarding spending, exchange controls, regulatory and taxation changes, and other adverse political, economic or social developments in such countries, which could affect our revenues, profitability and financial condition. As a global company, a portion of our business is carried out in currencies other than the U.S. dollar, which is the Company’s functional currency. As a result, we are exposed to foreign exchange rate risk, which could adversely affect our financial position and results of operations.
In addition, our business and operations have been, and could in the future be, affected from time to time to varying degrees by political developments, events, laws and regulations. Both the likelihood of such occurrences and their overall impact upon us vary greatly from country to country and are not predictable. On May 22, 2009, Venezuela’s President Hugo Chávez announced the nationalization of Tavsa, Matesi and Comsigua. In August 2009, Venezuela, acting through the transition committee appointed by the Venezuelan Ministry of Basic Industries and Mining, unilaterally assumed exclusive operational control over the assets of Matesi. In November 2009, Venezuela, acting through PDVSA Industrial S.A. (a subsidiary of Petroleos de Venezuela S.A.), formally assumed exclusive operational control over the assets of Tavsa. Our investments in Tavsa, Matesi and Comsigua are protected under applicable bilateral investment treaties, including the bilateral investment treaty between Venezuela and the Belgian-Luxembourgish Union, and Tenaris continues to reserve all of its rights under contracts, investment treaties and Venezuelan and international law, and to consent to the jurisdiction of the ICSID in connection with the nationalization process. However, we can give no assurance that the Venezuelan government will agree to pay a fair and adequate compensation for our interest in Tavsa, Matesi and Comsigua, or that any such compensation will be freely convertible into or exchangeable for foreign currency. We may be forced to engage in litigation procedures to enforce our rights under contracts, investment treaties and Venezuelan and international law, and the time, costs and management efforts associated with such litigation may be significant. For further information on the nationalization of the Venezuelan subsidiaries, see note 32 (b) “Processes in Venezuela-Nationalization of Venezuelan Subsidiaries” to our consolidated financial statements included in this annual report.
A key element of our business strategy is to develop and offer higher value-added products and services and to continuously identify and pursue growth-enhancing strategic opportunities. Failure to successfully implement our strategy or to integrate future acquisitions and strategic partnerships could affect our ability to grow, our competitive position and our sales and profitability. In addition, failure to agree with our joint venture partner in Japan on the strategic direction of our joint operations, may have an adverse impact on our operations in Japan.
18
At December 31, 2009, we had $1,804.7 million in goodwill corresponding mainly to the acquisition of Maverick ($771.3 million) and Hydril ($919.9 million). In 2008 we recorded an impairment charge for $502.9 million (of which $394.3 million correspond to Maverick). No impairment charge was recorded in 2009; however, we cannot assure that further impairment charges will not be required in the future.
Potential environmental, product liability and other claims arising from the inherent risks associated with the products we sell and the services we render, including well failures, line pipe leaks, bursts and fires, that could result in death, personal injury, property damage, environmental pollution or loss of production could create significant liabilities for us. In addition, we are subject to a wide range of local, provincial and national laws, regulations, permit requirements and decrees relating to the protection of human health and the environment and the cost of complying with such regulations as well as unforeseen environmental liabilities may increase our operating costs or negatively impact our net worth.
We conduct business in certain countries known to experience governmental corruption. Although we are committed to conducting business in a legal and ethical manner in compliance with local and international statutory requirements and standards applicable to our business, there is a risk that our employees or representatives may take actions that violate applicable laws and regulations that generally prohibit the making of improper payments to foreign government officials for the purpose of obtaining or keeping business, including laws relating to the 1997 OECD Convention on Combating Bribery of Foreign Public Officials in International Business Transactions such as the U.S. Foreign Corrupt Practices Act.
As a holding company, our ability to pay expenses, debt service and cash dividends depends on the results of operations and financial condition of our subsidiaries, which could be restricted by legal, contractual or other limitations, including exchange controls or transfer restrictions, and other agreements and commitments of our subsidiaries.
The Company’s controlling shareholder may be able to take actions that do not reflect the will or best interests of other shareholders.
The Company’s tax-exempt status will terminate on December 31, 2010. If we are unable to mitigate the consequences of the termination of the preferential tax regime applying to the Company, we may be subject to a higher tax burden in the future and our shareholders may be subject to tax withholdings.
Our financial risk management is described in Section III. Financial Risk Management, and our provisions and contingent liabilities are described in accounting policy Q and notes 23, 24 and 26 of our consolidated financial statements included in this annual report.
19
Operating and Financial Review and Prospects
The following discussion and analysis of our financial condition and results of operations are based on, and should be read in conjunction with, our audited consolidated financial statements and the related notes included elsewhere in this annual report. This discussion and analysis presents our financial condition and results of operations on a consolidated basis. We prepare our consolidated financial statements in conformity with IFRS, as issued by the IASB and adopted by the European Union.
Certain information contained in this discussion and analysis and presented elsewhere in this annual report, including information with respect to our plans and strategy for our business, includes forward-looking statements that involve risks and uncertainties. See “Cautionary Statement Concerning Forward-Looking Statements”. In evaluating this discussion and analysis, you should specifically consider the various risk factors identified in “Principal Risks and Uncertainties”, other risk factors identified elsewhere in this annual report and other factors that could cause results to differ materially from those expressed in such forward-looking statements.
Overview
We are a leading global manufacturer and supplier of steel pipe products and related services for the energy industry and other industries.
We are a leading global manufacturer and supplier of steel pipe products and related services for the world’s energy industry as well as for other industrial applications. Our customers include most of the world’s leading oil and gas companies as well as engineering companies engaged in constructing oil and gas gathering and processing and power facilities. Over the last two decades, we have expanded our business globally through a series of strategic investments, and, we now operate an integrated worldwide network of steel pipe manufacturing, research, finishing and service facilities with industrial operations in North and South America, Europe, Asia and Africa and a direct presence in most major oil and gas markets.
Our main source of revenue is the sale of products and services to the oil and gas industry, and the level of such sales is sensitive to international oil and gas prices and their impact on drilling activities.
Demand for our products and services from the global oil and gas industry, particularly for tubular products and services used in drilling operations, represents a substantial majority of our total sales. Our sales, therefore, depend on the condition of the oil and gas industry and our customers’ willingness to invest capital in oil and gas exploration and development as well as in associated downstream processing activities. The level of these expenditures is sensitive to oil and gas prices as well as the oil and gas industry’s view of such prices in the future. With the onset of the global economic and financial crisis and its impact on global consumption of oil and gas, oil and gas prices collapsed in the second half of 2008. This followed four years during which persistently high oil and gas prices encouraged oil and gas companies to increase their spending and drilling activity to offset declining rates of production from mature fields and to explore and develop new reserves. In 2009, global oil prices rose from their low of $30 per barrel and subsequently have fluctuated within a $70-$90 per barrel range as global oil demand, led by increased consumption in non-OECD countries, began to recover in the second half of the year and OPEC producers adjusted their production output. North American gas prices, however, have remained low fluctuating within a range of $3-$6 per million BTU. Advances in drilling technology have encouraged producers to develop productive gas shale deposits which resulted in an increase in US gas production in 2009 despite a substantial drop in gas drilling activity. This development has also impacted gas prices in the rest of the world as it coincides with an increase in LNG capacity, much of which was built in the expectation of growing demand for gas imports in the USA. Drilling activity decreased in 2009; the annual average of the international count of active drilling rigs, published by Baker Hughes, decreased 8% in 2009 compared to 2008 while the corresponding rig count in the U.S. and Canada, decreased 42% in 2009 compared to 2008. Oil drilling activity has since recovered in the US and Canada but gas drilling activity remains at substantially lower levels than in the five years preceding 2009 due to extensive drilling of productive shale deposits. Drilling activity in the rest of the world has also begun to recover.
A growing proportion of exploration and production spending by oil and gas companies has been directed at offshore, deep drilling and non-conventional drilling operations in which high-value tubular products, including special steel grades and premium connections, are usually specified. Technological advances in drilling techniques and materials are opening up new areas for exploration and development. More complex drilling conditions are expected to continue to demand new and high value products and services in most areas of the world.
20
We estimate that apparent demand for OCTG worldwide declined by more than 30% in 2009, reflecting the decline in oil and gas drilling activity and efforts made to adjust inventory levels, particularly in the US.
With activity levels now recovering and inventories at more reasonable levels, we can expect shipments in our Tubes segment to show a recovery in 2010 from the low level recorded in 2009. In our Projects segment, however, we expect lower shipments since the order backlog for our large-diameter pipes for pipeline projects in South America declined throughout the year and ended at a low level.
Our business is highly competitive.
The global market for steel pipes is highly competitive, with the primary competitive factors being price, quality, service and technology. We sell our products in a large number of countries worldwide and compete primarily against European and Japanese producers in most markets outside North America. In the United States and Canada we compete against a wide range of local and foreign producers. Competition in markets worldwide has been increasing, particularly for products used in standard applications, as producers in countries like China and Russia increase production capacity and enter export markets.
Our production costs are sensitive to prices of steelmaking raw materials and other steel products.
We purchase substantial quantities of steelmaking raw materials, including ferrous steel scrap, direct reduced iron (DRI), pig iron, iron ore and ferroalloys, for use in our production of our seamless pipe products. In addition, we purchase substantial quantities of steel coils and plate for use in the production of our welded pipe products. Our production costs, therefore, are sensitive to prices of steelmaking raw materials and certain steel products, which reflect supply and demand factors in the global steel industry and in the countries where we have our manufacturing facilities.
The costs of steelmaking raw materials and of steel coils and plates, which have decreased steeply during the second half of 2008, as the recessionary environment had an almost immediate impact on global steelmaking activity, stabilized during the first part of 2009 and started an upward trend in the second part of 2009. In the first part of 2010, raw material costs have risen sharply. Pipe prices are expected to rise following the increase in raw material costs but there can be no assurance that such price increases will be sufficient to offset raw material cost increases.
Results of Operations
The following discussion and analysis of our financial condition and results of operations are based on our audited consolidated financial statements included elsewhere in this annual report. Accordingly, this discussion and analysis present our financial condition and results of operations on a consolidated basis. See accounting policies A and B to our audited consolidated financial statements included in this annual report. The following discussion should be read in conjunction with our audited consolidated financial statements and the related notes included in this annual report.
21
| Thousands of U.S. dollars (except number of shares and per share amounts) | For the year ended December 31, | |||||||
2009 | 2008 | |||||||
| Selected consolidated income statement data | ||||||||
| IFRS | ||||||||
| Continuing Operations | ||||||||
Net sales | 8,149,320 | 11,987,760 | ||||||
Cost of sales | (4,864,922 | ) | (6,698,285 | ) | ||||
Gross profit | 3,284,398 | 5,289,475 | ||||||
| Selling, general and administrative expenses | (1,473,791 | ) | (1,787,952 | ) | ||||
| Other operating income (expenses), net | 3,000 | (375,873 | ) | |||||
Operating income | 1,813,607 | 3,125,650 | ||||||
Interest income | 30,831 | 48,711 | ||||||
Interest expense | (118,301 | ) | (179,885 | ) | ||||
Other financial results | (64,230 | ) | (99,850 | ) | ||||
| Income before equity in earnings of associated companies and income tax | 1,661,907 | 2,894,626 | ||||||
| Equity in earnings of associated companies | 87,041 | 89,423 | ||||||
Income before income tax | 1,748,948 | 2,984,049 | ||||||
Income tax | (513,211 | ) | (1,015,334 | ) | ||||
Income for continuing operations (1) | 1,235,737 | 1,968,715 | ||||||
| Discontinued Operations | ||||||||
| Income (loss) for discontinued operations | (28,138 | ) | 306,905 | |||||
Income for the year (1) | 1,207,599 | 2,275,620 | ||||||
Income attributable to (1): | ||||||||
| Equity holders of the Company……………………... | 1,161,555 | 2,124,802 | ||||||
Minority interest | 46,044 | 150,818 | ||||||
Income for the year(1) | 1,207,599 | 2,275,620 | ||||||
Depreciation and amortization | (504,837 | ) | (532,934 | ) | ||||
Weighted average number of shares outstanding | 1,180,536,830 | 1,180,536,830 | ||||||
| Basic and diluted earnings per share for continuing operations | 1.00 | 1.49 | ||||||
| Basic and diluted earnings per share | 0.98 | 1.80 | ||||||
Dividends per share(2) | 0.34 | 0.43 | ||||||
| _______________ |
| (1) | International Accounting Standard No. 1 (“IAS 1”) (revised), requires that income for the year as shown on the income statement not exclude minority interest. Earnings per share, however, continue to be calculated on the basis of income attributable solely to the equity holders of the Company. |
| (2) | Dividends per share correspond to the dividends proposed or paid in respect of the year. |
22
| Thousands of U.S. dollars (except number of shares) | At December 31, | |||||||
2009 | 2008 | |||||||
| Selected consolidated balance sheet data | ||||||||
| IFRS | ||||||||
Current assets | 5,621,841 | 7,252,417 | ||||||
| Property, plant and equipment, net | 3,254,587 | 2,982,871 | ||||||
Other non-current assets | 4,606,880 | 4,865,424 | ||||||
Total assets | 13,483,308 | 15,100,712 | ||||||
Current liabilities | 1,970,470 | 3,790,017 | ||||||
Non-current borrowings | 655,181 | 1,241,048 | ||||||
Deferred tax liabilities | 860,787 | 1,053,838 | ||||||
Other non-current liabilities | 276,034 | 313,922 | ||||||
Total liabilities | 3,762,472 | 6,398,825 | ||||||
| Capital and reserves attributable to the Company’s equity holders | 9,092,164 | 8,176,571 | ||||||
Minority interest | 628,672 | 525,316 | ||||||
Total liabilities and equity | 13,483,308 | 15,100,712 | ||||||
| Number of shares outstanding | 1,180,536,830 | 1,180,536,830 | ||||||
23
| The following table sets forth our operating and other costs and expenses as a percentage of net sales for the periods indicated. |
| Percentage of net sales | For the year ended December 31, | |||||||
2009 | 2008 | |||||||
| Continuing Operations | ||||||||
Net sales | 100.0 | 100.0 | ||||||
Cost of sales | (59.7 | ) | (55.9 | ) | ||||
Gross profit | 40.3 | 44.1 | ||||||
| Selling, general and administrative expenses | (18.1 | ) | (14.9 | ) | ||||
| Other operating income (expenses), net | 0.0 | (3.1 | ) | |||||
Operating income | 22.3 | 26.1 | ||||||
Interest income | 0.4 | 0.4 | ||||||
Interest expense | (1.5 | ) | (1.5 | ) | ||||
Other financial results | (0.8 | ) | (0.8 | ) | ||||
| Income before equity in earnings of associated companies and income tax | 20.4 | 24.1 | ||||||
| Equity in earnings of associated companies | 1.1 | 0.7 | ||||||
Income before income tax | 21.5 | 24.9 | ||||||
Income tax | (6.3 | ) | (8.5 | ) | ||||
| Income for continuing operations | 15.2 | 16.4 | ||||||
| Discontinued Operations | ||||||||
| Income (loss) for discontinued operations | (0.3 | ) | 2.6 | |||||
| Income for the year | 14.8 | 19.0 | ||||||
| Income attributable to: | ||||||||
Equity holders of the Company | 14.3 | 17.7 | ||||||
Minority interest | 0.6 | 1.3 | ||||||
Fiscal Year Ended December 31, 2009, Compared to Fiscal Year Ended December 31, 2008
Net Sales, Cost of Sales and Operating Income
The following table shows our net sales by business segment for the periods indicated below:
| Millions of U.S. dollars | For the year ended December 31, | |||||||||||||||||||
2009 | 2008 | Increase / (Decrease) | ||||||||||||||||||
Tubes | 6,670.9 | 82 | % | 10,010.1 | 84 | % | (33 | %) | ||||||||||||
Projects | 986.5 | 12 | % | 1,270.9 | 11 | % | (22 | %) | ||||||||||||
Others | 491.8 | 6 | % | 706.8 | 6 | % | (30 | %) | ||||||||||||
| Total | 8,149.3 | 100 | % | 11,987.8 | 100 | % | (32 | %) | ||||||||||||
The following table indicates our sales volume of seamless and welded pipes by business segment for the periods indicated below:
| Thousands of tons | For the year ended December 31, | |||||||||||
2009 | 2008 | Increase / (Decrease) | ||||||||||
Tubes – Seamless | 1,970 | 2,818 | (30 | %) | ||||||||
Tubes – Welded | 346 | 1,057 | (67 | %) | ||||||||
Tubes – Total | 2,316 | 3,875 | (40 | %) | ||||||||
Projects – Welded | 334 | 591 | (43 | %) | ||||||||
| Total – Tubes + Projects | 2,650 | 4,466 | (41 | %) | ||||||||
Tubes
The following table indicates, for our Tubes business segment, net sales by geographic region, cost of sales as a percentage of net sales, operating income and operating income as a percentage of net sales for the periods indicated below:
24
| Millions of U.S. dollars | For the year ended December 31, | |||||||||||
2009 | 2008 | Increase / (Decrease) | ||||||||||
| Net sales | ||||||||||||
| - North America | 2,756.1 | 4,519.3 | (39 | %) | ||||||||
| - South America | 981.9 | 1,248.7 | (21 | %) | ||||||||
| - Europe | 828.8 | 1,705.6 | (51 | %) | ||||||||
| - Middle East & Africa | 1,622.6 | 1,809.9 | (10 | %) | ||||||||
| - Far East & Oceania | 481.5 | 726.6 | (34 | %) | ||||||||
| Total net sales | 6,670.9 | 10,010.1 | (33 | %) | ||||||||
| Cost of sales (% of sales) | 57 | % | 53 | % | ||||||||
| Operating income | 1,576.8 | 2,827.0 | (44 | %) | ||||||||
| Operating income (% of sales) | 24 | % | 28 | % | ||||||||
Net sales of tubular products and services decreased 33% to US$6,670.9 million in 2009, compared to US$10,010.1 million in 2008, due to a sharp reduction in volumes (down 40%). This reduction in shipments was partially offset by higher average selling prices (up 12%), reflecting, in part, a higher proportion of sales of specialized high-end products and the lagged effect of price variations as average selling prices rose to a peak in the second quarter of 2009. In North America, notwithstanding higher demand for OCTG products in Mexico, sales decreased 39%, due primarily to substantially lower demand for OCTG and line pipe products in the US and Canada, reflecting the decline in drilling activity and inventory adjustments following the surge in imports of Chinese products in the second half of 2008 and first half of 2009. In South America, sales decreased reflecting sharply lower demand from all sectors in Argentina and for OCTG in Venezuela. In Europe, sales were affected by lower demand from all sectors, including the process and power plant sector, the industrial and automotive sector and the oil and gas sector. Sales in the Middle East and Africa declined by 10% as reduced demand for OCTG products was partially offset by higher sales of deepwater linepipe products in West Africa. In the Far East and Oceania, sales decreased in China and demand for all our products decreased in the rest of the region.
Cost of sales of tubular products and services, expressed as a percentage of net sales, rose from 53% to 57%, mainly due to the negative effect of low production capacity utilization rates, on efficiency, absorption of fixed and semi-fixed costs and on the time lag between raw material cost decreases and their impact on the cost of sales.
Operating income from tubular products and services, decreased 44% to US$1,576.8 million in 2009, from US$2,827.0 million in 2008, mainly due to a significant decrease in volumes. While operating income in 2008 included impairment charges amounting to US$354.9 million, there was no impairment charge in 2009.
Projects
The following table indicates, for our Projects business segment, net sales, cost of sales as a percentage of net sales, operating income and operating income as a percentage of net sales for the periods indicated below:
| Millions of U.S. dollars | For the year ended December 31, | |||||||||||
2009 | 2008 | Increase / (Decrease) | ||||||||||
| Net sales | 986.5 | 1,270.9 | (22 | %) | ||||||||
| Cost of sales (% of sales) | 71 | % | 70 | % | ||||||||
| Operating income | 208.6 | 249.0 | (16 | %) | ||||||||
| Operating income (% of sales) | 21 | % | 20 | % | ||||||||
Net sales of pipes for pipeline projects decreased 22% to US$986.5 million in 2009, compared to US$1,270.9 million in 2008, reflecting a sharp decrease in shipments to gas and other pipeline projects in Brazil, Argentina and Colombia partially offset by higher average selling prices particularly for offshore projects in Brazil.
25
Operating income from pipes for pipeline projects decreased 16% to US$208.6 million in 2009, from US$249.0 million in 2008, due to the decrease in net sales and a stable operating margin.
Others
The following table indicates, for our Others business segment, net sales, cost of sales as a percentage of net sales, operating income and operating income as a percentage of net sales for the periods indicated below:
| Millions of U.S. dollars | For the year ended December 31, | |||||||||||
2009 | 2008 | Increase / (Decrease) | ||||||||||
| Net sales | 491.8 | 706.8 | (30 | %) | ||||||||
| Cost of sales (% of sales) | 79 | % | 73 | % | ||||||||
| Operating income | 28.1 | 49.6 | (43 | %) | ||||||||
| Operating income (% of sales) | 6 | % | 7 | % | ||||||||
Net sales of other products and services decreased 30% to US$491.8 million in 2009, compared to US$706.8 million in 2008, mainly due to lower sales of welded pipes for electric conduits in USA as well as sucker rods.
Operating income from other products and services, decreased 43% to US$28.1 million in 2009, from US$49.6 million in 2008, due to the decrease in net sales.
Selling, general and administrative expenses, or SG&A, increased as a percentage of net sales to 18.1% in 2009 compared to 14.9% in 2008, mainly due to the effect of fixed and semi-fixed expenses over lower revenues. However, in absolute terms SG&A decreased US$314.2 million to US$1,473.8 million in 2009, from US$1,788.0 million in 2008, mainly due to lower commissions, freight and other selling expenses, taxes and labor costs, reflecting lower activity in terms of net sales.
Other operating income and expenses resulted in net income of US$3.0 million in 2009, compared to a net loss of US$375.9 million in 2008, which loss was mainly related to impairment charges at our North American operations.
Net interest expenses totalled US$87.5 million in 2009, compared to net interest expenses of US$131.2 million in 2008, reflecting the change in our net debt position and lower interest rates.
Other financial results generated a loss of US$64.2 million in 2009, compared to a loss of US$99.8 million during 2008. These results largely reflect losses on net foreign exchange transactions and the fair value of derivative instruments and are to a large extent offset by changes to our net equity position. These losses are mainly attributable to variations in the exchange rates between our subsidiaries’ functional currencies (other than the US dollar) and the US dollar in accordance with IFRS.
Equity in earnings of associated companies generated a gain of US$87.0 million in 2009, compared to a gain of US$89.4 million in 2008. These gains were derived mainly from our equity investment in Ternium S.A., or Ternium.
Income tax charges of US$513.2 million were recorded during 2009, equivalent to 31% of income before equity in earnings of associated companies and income tax, like in 2008, when excluding the effect of impairment losses during the year amounting to US$394.3 million, the tax rate was also 31%.
Results for discontinued operations reflected a loss of US$28.1 million in 2009, relating to the discontinuation of Tavsa and Matesi’s operations following their nationalization by the Venezuelan government, compared to a gain of US$306.9 million in 2008, relating to income from discontinued operations, mainly derived from the sale of Hydril’s pressure control business.
Net income decreased to US$1,207.6 million in 2009, compared to US$2,275.6 million in 2008, mainly reflecting lower operating results.
26
Income attributable to equity holders was US$1,161.6 million, or US$0.98 per share (US$1.97 per ADS), in 2009, compared to US$2,124.8 million, or US$1.80 per share (US$3.60 per ADS) in 2008.
Income attributable to minority interest was US$46.0 million in 2009, compared to US$150.8 million in 2008, mainly reflecting lower results at Confab and losses at NKKTubes.
Liquidity and Capital Resources
The following table provides certain information related to our cash generation and changes in our cash and cash equivalents position for each of the last two years:
| Millions of U.S. dollars | For the year ended December 31, | |||||||
2009 | 2008 | |||||||
| Net cash provided by operating activities | 3,063.9 | 1,465.0 | ||||||
| Net cash provided by (used in) investing activities | (1,040.6 | ) | 722.4 | |||||
| Net cash (used in) provided by financing activities | (2,019.1 | ) | (1,570.4 | ) | ||||
| Increase (Decrease) in cash and cash equivalents | 4.3 | 617.0 | ||||||
| Effect of exchange rate changes | 9.1 | (46.3 | ) | |||||
| Decrease in cash due to deconsolidation | (9.7 | ) | - | |||||
| Cash and cash equivalents at the beginning of year | 1,525.0 | 954.3 | ||||||
| Cash and cash equivalents at the end of year | 1,528.7 | 1,525.0 | ||||||
Our financing strategy is to maintain adequate financial resources and access to additional liquidity. During 2009, we have counted mainly on cash flows from operations to fund our transactions. Short-term bank borrowings were used as needed throughout the year.
We believe that funds from operations, availability of liquid financial assets and our access to external borrowing through the financial markets will be sufficient to satisfy our working capital needs and to service our debt in the foreseeable future. Net financial debt during 2009, decreased by $2,068.1 million to a positive net cash position of $675.7 million at December 31, 2009. We believe that our liquidity and capital resources give us adequate flexibility to manage our planned capital spending programs, to service our debt and to address short-term changes in business conditions.
We have a conservative approach to the management of our liquidity, which consist mainly of cash and cash equivalents and other current investments, comprising cash in banks, short-term money market funds and highly liquid short & medium-term securities. These assets are carried at fair market value, or at historical cost which approximates fair market value.
We hold primarily money market investments and variable or fixed-rate securities from investment grade issuers. We concentrate our cash in major financial centers (mainly New York and London). We hold our cash and cash equivalents primarily in U.S. dollars. As of December 31, 2009, U.S. dollar denominated liquid assets represented around 82%. At December 31, 2009, liquid financial assets as a whole were 15.8% of total assets (excluding Available for sale assets) compared to 10.2% at the end of 2008.
Cash and cash equivalents (excluding bank overdraft) increased slightly to $1,542.8 million at December 31, 2009, compared with $1,538.8 million at December 31, 2008. In addition, Other current investments increased $533.8 million to $579.7 million as of December 31, 2009 from $45.9 million as of December 31, 2008.
Fiscal Year Ended December 31, 2009, Compared to Fiscal Year Ended December 31, 2008
Operating activities
In 2009, notwithstanding the decrease in operating income, net cash provided by operations increased to $3,063.9 million compared to $1,465.0 million in 2008, primarily reflecting a decrease in working capital. Working capital decreased by $1,737.3 million in 2009, compared to an increase of $1,051.6 million in 2008. The decrease in working capital comprised mainly:
27
| · | a decrease in inventories of $1,414.2 million, reflecting primarily a decrease in business activity; |
| · | a decrease in trade receivables of $792.3 million, mainly due to lower sales; and |
| · | a decrease in trade payables and customer advances of $316.9 million, and $180.5 million respectively, also due to the lower level of activity. |
Investing activities
Net cash used in investing activities in 2009 was $1,040.6 million, compared to net cash provided by investing activities amounting to $722.4 million in 2008, with the main differences being:
| · | in 2008, we received the proceeds from the sale of Hydril’s pressure control business, amounting to approximately $1.1 billion; and |
| · | in 2009, we invested $533.8 million in short term securities, compared to net proceeds of $41.7 million in 2008. |
Capital expenditures increased slightly to $460.9 million in 2009, compared to $443.2 million in 2008.
Financing activities
Net cash used in financing activities, including dividends paid, proceeds and repayments of borrowings, was $2,019.1 million in 2009, compared to $1,570.4 million in 2008.
Dividends paid, including dividends paid to minority shareholders in subsidiaries, amounted to $553.7 million in 2009, of which $354 million were paid to equity holders in respect of the 2008 fiscal year, while $153 million were paid to equity holders in November 2009, as an interim dividend in respect of the dividend corresponding to the 2009 fiscal year. This compares to $535.8 million paid in 2008, of which $295 million were paid in respect of the 2007 fiscal year and $153 million were paid to equity holders in November 2008, as an interim dividend for the 2008 fiscal year.
Net repayments of borrowings (repayments less proceeds) totaled $1,465.4 million in 2009, compared to $1,034.6 million in 2008.
Our total liabilities to total assets ratio decreased to 0.28:1 as of December 31, 2009, compared to 0.42:1 as of December 31, 2008.
Principal Sources of Funding
During 2009, we have counted mainly on cash flows from operations to fund our transactions and short-term bank borrowings were used as needed throughout the year.
Financial liabilities
Total financial debt decreased by $1,530.3 million to $1,446.8 million at December 31, 2009, from $2,977.0 million at December 31, 2008.
Our financial liabilities (other than trade payables and derivative financial instruments) consist mainly of bank loans. As of December 31, 2009 U.S. dollar-denominated financial debt and Euro-denominated financial debt represented 73.8% and 6.1%, respectively, of total financial debt. For further information about our financial debt, please see note 20 “Borrowings” to our consolidated financial statements included in this annual report.
The following table shows the composition of our financial debt at December 31, 2009 and 2008:
28
| Thousands of U.S. dollars | 2009 | 2008 | ||||||
| Bank borrowings | 1,422,762 | 2,820,398 | ||||||
| Bank overdrafts | 14,122 | 13,747 | ||||||
| Other loans | 9,294 | 141,938 | ||||||
| Finance lease liabilities | 586 | 932 | ||||||
| Total borrowings | 1,446,764 | 2,977,015 | ||||||
The weighted average interest rates before tax shown below were calculated using the rates set for each instrument in its corresponding currency as of December 31, 2009 and 2008. The changes in interest rate are basically due to changes in floating interest rate.
2009 | 2008 | |||||||
| Bank borrowings | 3.97 | % | 5.23 | % | ||||
| Other loans | 4.00 | % | 4.99 | % | ||||
| Finance lease liabilities | 8.02 | % | 7.74 | % | ||||
The maturity of our financial debt is as follows:
Thousands of U.S. dollars At December 31, 2009 | 1 year or less | 1 - 2 years | 2 – 3 years | 3 - 4 years | 4 - 5 years | Over 5 years | Total | |||||||||||||||||||||
| Financial lease | 179 | 324 | 83 | - | - | - | 586 | |||||||||||||||||||||
| Other borrowings | 791,404 | 390,638 | 186,625 | 32,700 | 7,579 | 37,232 | 1,446,178 | |||||||||||||||||||||
| Total borrowings | 791,583 | 390,962 | 186,708 | 32,700 | 7,579 | 37,232 | 1,446,764 | |||||||||||||||||||||
| Estimated interests to be accrued | 39,056 | 13,246 | 8,199 | 3,532 | 2,719 | 7,357 | 74,109 | |||||||||||||||||||||
| Estimated interest rate derivative contract | 12,452 | 5,286 | - | - | - | - | 17,738 | |||||||||||||||||||||
| Total borrowings plus estimated interests to be accrued | 843,091 | 409,494 | 194,907 | 36,232 | 10,298 | 44,589 | 1,538,611 | |||||||||||||||||||||
Our current debt to total debt ratio decreased from 0.58:1 as of December 31, 2008 to 0.55:1 as of December 31 2009.
For information on our derivative financial instruments, please see note 25 “Derivative financial instruments” to our audited consolidated financial statements included in this annual report.
Significant Borrowings
Our most significant borrowings as of December 31, 2009 are as follows:
| Millions of U.S. dollars | |||||||||||
Date | Borrower | Type | Original Principal Amount | Outstanding Principal amount as of December 31, 2009 | Maturity | ||||||
| March 2005 | Tamsa | Syndicated loan | 300.0 | 60.0 | March 2010 | ||||||
| September 2006 | Tamsa | Syndicated loan | 700.0 | 311.1 | October 2011(*) | ||||||
| September 2006 | Dalmine | Syndicated loan | 150.0 | 66.7 | October 2011(*) | ||||||
| April 2007 | Tenaris | Syndicated loan | 1,700.0 | 178.6 | May 2012 | ||||||
| April 2007 | Hydril | Syndicated loan | 300.0 | 166.7 | May 2012 | ||||||
| June 2008 | Dalmine | Bilateral | 150.0 | 150.0 | June 2013 | ||||||
29
As of December 31, 2009, Tenaris was in compliance with all of its financial and other covenants.
Recent Developments
Dividend payment
In February 2010, our board of directors proposed, for the approval of the annual general shareholders’ meeting to be held on June 2, 2010, the payment of an annual dividend of $0.34 per share ($0.68 per ADS), or approximately $401 million, which includes the interim dividend of $0.13 per share ($0.26 per ADS) paid in November 2009. If the annual dividend is approved by the shareholders, a dividend of $0.21 per share ($0.42 per ADS), or approximately $248 million will be paid on June 24, 2010, with an ex-dividend date of June 21, 2010.
Environmental Regulation
We are subject to a wide range of local, provincial and national laws, regulations, permits and decrees in the countries where we have manufacturing operations concerning, among other things, human health, discharges to the air and water and the handling and disposal of solid and hazardous wastes. Compliance with these environmental laws and regulations is a significant factor in our business.
We have not been subject to any material penalty for any material environmental violation in the last five years, and we are not aware of any current material legal or administrative proceedings pending against us with respect to environmental matters which could have an adverse material impact on our financial condition or results of operations.
Related Party Transactions
Tenaris is a party to several related party transactions, which include, among others, purchases and sales of goods (including steel pipes, flat steel products, steel bars, raw materials, gas and electricity) and services (including engineering services and related services) from or to entities controlled by San Faustin or in which San Faustin holds significant interests. Material related party transactions are subject to the review of the audit committee of the Company’s board of directors and the requirements of the Company’s articles of association and Luxembourg law, as explained below. For further detail on Tenaris’s related party transactions, see Note 30 “Related party transactions” to our consolidated financial statements, included in this annual report.
Corporate Governance
Our corporate governance practices are governed by Luxembourg Law (particularly the law of August 10, 1915 on commercial companies and the law of July 31, 1929, as amended) and our articles of association. As a Luxembourg company listed on the New York Stock Exchange (the NYSE), the Bolsa Mexicana de Valores, S.A. de C.V. (the Mexican Stock Exchange), the Bolsa de Comercio de Buenos Aires (the Buenos Aires Stock Exchange) and Borsa Italiana S.p.A. (the Italian Stock Exchange), we are required to comply with some, but not all, of the corporate governance standards of these exchanges. We, however, believe that our corporate governance practices meet, in all material respects, the corporate governance standards that are generally required for controlled companies by all of the exchanges on which our securities trade.
30
For a summary of the significant ways in which our corporate governance practices differ from the corporate governance standards required for controlled companies by the exchanges on which our shares trade, please visit our website at http://www.tenaris.com/investors/
Board of Directors
Management of the Company is vested in a board of directors with the broadest power to act on behalf of the Company and accomplish or authorize all acts and transactions of management and disposal that are within its corporate purpose and which are not specifically reserved in the articles of association or by applicable law to the general shareholders’ meeting. The Company’s articles of association provide for a board of directors consisting of a minimum of three and a maximum of fifteen directors; however, if the Company’s shares are listed on a stock exchange, the minimum number of directors must be five. The board of directors meets at least four times per year, or as often as required by the interests of the Company. A majority of the members of the board constitutes a quorum, and resolutions may be adopted by the vote of a majority of the directors present or represented. In the case of a tie, the chairman is entitled to cast the deciding vote.
Directors are elected at the annual ordinary general shareholders’ meeting to serve one-year renewable terms, as determined by the shareholders. The general shareholders’ meeting may dismiss all or any one member of the board of directors at any time, with or without cause, by resolution passed by a simple majority vote. for as long as our shares are listed on at least one stock exchange, the Company must have an audit committee composed of three members, all of which must qualify as independent directors under the Company’s articles of association.
Under the Company’s articles of association, an independent director is a director who:
| · | is not and has not been employed by us or our subsidiaries in an executive capacity for the preceding five years; |
| · | is not a person that controls us, directly or indirectly, and is not a member of the board of directors of a company controlling us, directly or indirectly; |
| · | does not have (and is not affiliated with a company or a firm that has) a significant business relationship with us, our subsidiaries or our controlling shareholder; |
| · | is not and has not been affiliated with or employed by a present or former auditor of us, our subsidiaries or our controlling shareholder for the preceding five years; and |
| · | is not a spouse, parent, sibling or relative up to the third degree of any of the above persons. |
The following table sets forth the name of the Company’s current directors, their respective positions on the board, their principal occupation, their years of service as board members and their age.
Name | Position | Principal Occupation | Years as Director | Age at December 31, 2009 | ||||||||
Roberto Bonatti(1) | Director | President of San Faustin | 7 | 60 | ||||||||
| Carlos Condorelli | Director | Director of Tenaris and Ternium | 3 | 58 | ||||||||
| Carlos Franck | Director | President of Santa María | 7 | 59 | ||||||||
| Roberto Monti | Director | Non-executive chairman of Trefoil Limited and member of the board of directors of Petrobras Energia | 5 | 70 | ||||||||
Gianfelice Mario Rocca(1) | Director | Chairman of the board of directors of San Faustin | 7 | 61 | ||||||||
Paolo Rocca(1) | Director | Chairman and chief executive officer of Tenaris | 8 | 57 | ||||||||
| Jaime Serra Puche | Director | Chairman of SAI Consultores | 7 | 58 | ||||||||
| Alberto Valsecchi | Director | Director of Tenaris | 2 | 65 | ||||||||
| Amadeo Vázquez y Vázquez | Director | Director of Gas Natural Ban S.A. and member of Asociación Empresaria Argentina | 7 | 67 | ||||||||
| Guillermo Vogel | Director | Vice chairman of Tamsa | 7 | 59 | ||||||||
| ___________ |
| (1) | Paolo Rocca and Gianfelice Rocca are brothers, and Roberto Bonatti is Paolo and Gianfelice Rocca’s first cousin. |
31
Roberto Bonatti. Mr. Bonatti is a member of our board of directors. He is a grandson of Agostino Rocca, founder of the Techint group, a group of companies controlled by San Faustin. Throughout his career in the Techint group he has been involved specifically in the engineering and construction and corporate sectors. He was first employed by the Techint group in 1976, as deputy resident engineer in Venezuela. In 1984, he became a director of San Faustin, and since 2001 he has served as its president. In addition, Mr. Bonatti currently serves as president of Tecpetrol S.A. and Techint Compañia Técnica Internacional S.A.C.I. He is also a member of the board of directors of Ternium, Siderca and Siderar S.A.I.C., or Siderar. Mr. Bonatti is an Italian citizen.
Carlos Condorelli. Mr. Condorelli is a member of our board of directors. He served as our chief financial officer from October 2002 until September 2007. He is also a board member of Ternium. He began his career within the Techint group in 1975 as an analyst in the accounting and administration department of Siderar. He has held several positions within Tenaris and other Techint group companies, including finance and administration director of Tamsa and president of the board of directors of Empresa Distribuidora La Plata S.A., or Edelap, an Argentine utilities company. Mr. Condorelli is an Argentine citizen.
Carlos Franck. Mr. Franck is a member of our board of directors. He is president of Santa María S.A.I.F. and Inverban S.A., vice president of Siderca and a member of the board of directors of Techint Financial Corporation N.V., III Industrial Investments Inc., Siderar, Tecpetrol and Tecgas N.V. He has financial planning and control responsibilities in subsidiaries of San Faustin. He serves as a member of the board of the Di Tella University. Mr. Franck is an Argentine citizen.
Roberto Monti. Mr. Monti is a member of our board of directors. He is the non-executive chairman of Trefoil Limited and a member of the board of directors of Petrobras Energia. He has served as vice president of Exploration and Production of Repsol YPF and chairman and CEO of YPF. He was also president of Dowell, a subsidiary of Schlumberger and president of Schlumberger Wire & Testing division for East Hemisphere Latin America. Mr. Monti is an Argentine citizen.
Gianfelice Mario Rocca. Mr. Rocca is a member of our board of directors. He is a grandson of Agostino Rocca. He is chairman of the board of directors of San Faustin, a member of the board of directors of Ternium, president of the Humanitas Group and president of the board of directors of Techint Compagnia Tecnica Internazionale S.p.A. and Tenova S.p.A. In addition, he sits on the board of directors or executive committees of several companies, including Allianz S.p.A and Buzzi Unicem. He is vice president of Confindustria, the leading association of Italian industrialists. He is a member of the Advisory Board of Allianz Group, the Trilateral Commission and the European Advisory Board of the Harvard Business School. Mr. Rocca is an Italian citizen.
Paolo Rocca. Mr. Rocca is chairman of our board of directors and our chief executive officer. He is a grandson of Agostino Rocca. He is also chairman of the board of directors of Tamsa. He is also chairman of the board of directors of Ternium, director and vice president of San Faustin and director of Techint Financial Corporation N.V. Mr. Rocca is the chairman of the World Steel Association and member of the International Advisory Committee of the NYSE Euronext (New York Stock Exchange). Mr. Rocca is an Italian citizen.
32
Jaime Serra Puche. Mr. Serra Puche is a member of our board of directors. He is chairman of SAI Consultores, a Mexican consulting firm, and a member of the board of directors of Chiquita Brands International, the Mexico Fund, Vitro and Grupo Modelo. Mr. Serra Puche served as Mexico’s Undersecretary of Revenue, Secretary of Trade and Industry, and Secretary of Finance. He led the negotiation and implementation of NAFTA. Mr. Serra Puche is a Mexican citizen.
Alberto Valsecchi. Mr. Valsecchi is a member of our board of directors. He served as our chief operating officer from February 2004 until July 2007. He joined the Techint group in 1968 and has held various positions within Tenaris and other Techint group companies. He has retired from his executive positions. He is also a member of the board of directors of San Faustin and has been elected as the chairman of the board of directors of Dalmine, a position he assumed in May 2008. Mr. Valsecchi is an Italian citizen.
Amadeo Vázquez y Vázquez. Mr. Vázquez y Vázquez is a member of our board of directors. He is an independent member of the board of directors of Gas Natural Ban S.A. He is a member of the Asociación Empresaria Argentina, and of the Fundación Mediterránea, and he is a member of the Advisory Board of the Fundación de Investigaciones Económicas Latinoamericanas. He served as CEO of the Banco Río de la Plata S.A. until August 1997 and was also the chairman of the board of directors of Telecom Argentina S.A. until April 2007. Mr. Vázquez y Vázquez is a Spanish and Argentine citizen.
Guillermo Vogel. Mr. Vogel is a member of our board of directors. He is vice chairman of Tamsa, chairman of Grupo Collado S.A.B. de C.V, vice chairman of Estilo y Vanidad S.A. de C.V. and member of the board of directors of Alfa S.A.B. de C.V., the American Iron and Steel Institute, the North American Steel Council and the Universidad Panamericana and the IPADE. In addition, he is a member of the board of directors and of the investment committee of the Corporación Mexicana de Inversiones de Capital and a member of the board of directors and the audit committee of HSBC (México). Mr. Vogel is a Mexican citizen.
Director Liability
Under Luxembourg law, a director may be liable to us for any damage caused by management errors, such as wrongful acts committed during the execution of his or her mandate, and to the Company, its shareholders and third parties in the event that the Company, its shareholders or third parties suffer a loss due to an infringement of either the Luxembourg Company Law or the Company’s articles of association. Under Luxembourg law, related-party transactions involving directors may be subject to approval procedures established by Luxembourg law and are to be reported at the next following shareholders’ meeting.
Under Luxembourg law, any director having a conflict of interest in respect of a transaction submitted for approval to the board of directors may not take part in the deliberations concerning such transaction and must inform the board of such conflict. Subject to certain exceptions, transactions in which any directors may have had an interest conflicting with that of the Company must be reported at the next shareholders’ meeting following any such transaction.
The general shareholders meeting may dismiss all or any one member of the board of directors at any time, with or without cause, by resolution passed by a simple majority vote, irrespective of the number of shares present or represented at the meeting.
A director will not be liable if, notwithstanding his presence at the board meeting at which a resolution was adopted or notwithstanding his opposition to that resolution, he advised the board of directors of his knowledge thereto and caused a record of his statement to be included in the minutes of the meeting. The director must report his opposition at the next shareholders’ meeting before any other resolution is voted on.
The Company may initiate actions against directors for damages with the approval of shareholders by a vote of more than 50% of votes cast and without the presence of a quorum. Actions against directors who misappropriate corporate assets or commit a breach of trust may be brought by any shareholder.
Audit Committee
The Company’s board of directors has an audit committee consisting of three members. On June 3, 2009, the Company’s board of directors reappointed Jaime Serra Puche, Amadeo Vázquez y Vázquez and Roberto Monti as members of our audit committee. All three members of the audit committee qualify as independent directors under the Company’s articles of association.
33
Under the Company’s articles of association, the audit committee is required to report to the board of directors on its activities from time to time, and on the adequacy of the systems of internal control over financial reporting once a year at the time the annual accounts are approved. In addition, the charter of the audit committee sets forth, among other things, the audit committee’s purpose and responsibilities. The audit committee assists the board of directors in its oversight responsibilities with respect to our financial statements, and the independence, performance and fees of our independent auditors. The audit committee also performs other duties entrusted to it by the Company’s board of directors.
In addition, the audit committee is required by the Company’s articles of association to review “material transactions”, as such term is defined under the Company’s articles of association, to be entered into by the Company or its subsidiaries with “related parties”, as such term is defined in the Company’s articles of association, in order to determine whether their terms are consistent with market conditions or are otherwise fair to the Company and/or its subsidiaries. In the case of material transactions entered into by the Company’s subsidiaries with related parties, the Company’s audit committee will review those transactions entered into by those subsidiaries whose boards of directors do not have independent members. Confab is currently our only subsidiary with independent board members.
Under the Company’s articles of association, as supplemented by the audit committee’s charter, a material transaction is:
| · | any transaction between the Company or its subsidiaries with related parties (x) with an individual value equal to or greater than $10 million, or (y) with an individual value lower than $10 million, when the aggregate sum – as reflected in the financial statements of the four fiscal quarters of the Company preceding the date of determination- of any series of transactions for such lower value that can be deemed to be parts of a unique or single transaction (but excluding any transactions that were reviewed and approved by Company’s audit committee or board of directors, as applicable, or the independent members of the board of directors of any of its subsidiaries) exceeds 1.5% of the Company’s consolidated net sales made in the fiscal year preceding the year on which the determination is made; |
| · | any corporate reorganization transaction (including a merger, spin-off or bulk transfer of a business) affecting the Company for the benefit of, or involving, a related party; and |
| · | any corporate reorganization transaction (including a merger, spin-off or bulk transfer of a business) not reviewed and approved by the independent members of the board of directors of any of the Company’s direct or indirect subsidiaries, affecting any of the Company’s direct or indirect subsidiaries for the benefit of, or involving, a related party. |
The audit committee has the power (to the maximum extent permitted by applicable laws) to request that the Company or relevant subsidiary provide any information necessary for it to review any material transaction. A related party transaction shall not be entered into unless (i) the circumstances underlying the proposed transaction justify that it be entered into before it can be reviewed by the Company’s audit committee or approved by the board of directors and (ii) the related party agrees to unwind the transaction if the Company’s audit committee or board of directors does not approve it.
The audit committee has the authority to conduct any investigation appropriate to fulfill its responsibilities, and has direct access to the Company’s internal and external auditors as well as to the Company’s management and employees and, subject to applicable laws, its subsidiaries.
34
Senior Management
Our current senior management as of April 2010, consists of:
Name | Position | Age at December 31, 2009 |
| Paolo Rocca | Chairman and Chief Executive Officer | 57 |
| Ricardo Soler | Chief Financial Officer | 58 |
| Marcelo Ramos | Technology Director | 46 |
| Alejandro Lammertyn | Commercial Director | 44 |
| Renato Catallini | Supply Chain Director | 43 |
| Marco Radnic | Human Resources Director | 60 |
| Sergio Tosato | Industrial Coordination Director | 60 |
| Carlos Pappier | Planning Director | 48 |
| Germán Curá | North American Area Manager | 47 |
| Sergio de la Maza | Central American Area Manager | 53 |
| Guillermo Noriega | South American Area Manager | 59 |
| Vincenzo Crapanzano | European Area Manager | 57 |
| Claudio Leali | North East Asia Area Manager | 59 |
Paolo Rocca. Mr. Rocca is chairman of our board of directors and our chief executive officer. He is a grandson of Agostino Rocca. He is also chairman of the board of directors of Tamsa. He is also chairman of the board of directors of Ternium, director and vice president of San Faustin and director of Techint Financial Corporation N.V. Mr. Rocca is the chairman of the World Steel Association and member of the International Advisory Committee of the NYSE Euronext (New York Stock Exchange). Mr. Rocca is an Italian citizen.
Ricardo Soler. Mr Soler currently serves as our chief financial officer, a position that he assumed in October 2007. Previously he served as chief executive officer of Hydril and from 1999 until November 2006 served as managing director of our welded pipe operations in South America and as executive vice-president of Confab and Siat. He started his career in the Techint group in 1973 as a planning analyst at Siderar. He served as Siderca’s financial director from 1993 until 1995. Mr. Soler is an Argentine citizen.
Marcelo Ramos. Mr. Ramos currently serves as our technology director, with responsibility over technology and quality. Previously he served as quality director and managing director of NKKTubes and our Japanese operations. He joined the Techint group in 1987 and has held various positions within Tenaris including quality control director at Siderca. He assumed his current position in April 2010, when the quality and technology departments were combined. Mr. Ramos is an Argentine citizen.
Alejandro Lammertyn. Mr. Lammertyn currently serves as our commercial director. Previously he served as supply chain director. He began his career with Tenaris in 1990 as special projects analyst in Siderca. In 2000, he was assistant to the CEO for marketing, organizational model and mill allocation matters. He assumed his current position in August 2007. Mr. Lammertyn is an Argentine citizen.
Renato Catallini. Mr. Catallini currently serves as our supply chain director, with responsibility for the execution of all contractual deliveries to customers. He joined Tenaris in 2001 in the supply management area, as a general manager of Exiros Argentina. In July 2002, he was appointed operations director and subsequently, in January 2005, became managing director of Exiros. Before joining Tenaris, he worked for ten years in the energy sector, working for TGN, Nova Gas Internacional, TransCanada Pipelines and TotalFinaElf, among others. He assumed his current position in August 2007. Mr. Catallini is an Argentine citizen.
Marco Radnic. Mr. Radnic currently serves as our human resources director. He began his career within the Techint group in the Industrial Engineering Department of Siderar in 1975. Later he held several positions in the technical departments of Siderca and various companies within the Techint group. After holding several positions in the marketing and procurement areas in Europe, in 1996 he became commercial director of Dalmine. In 1998, he became the director of our Process and Power Services business unit. In 2001, he was appointed chief of staff for Paolo Rocca in Buenos Aires. He assumed his current position in December 2002. Mr. Radnic is an Argentine citizen.
35
Sergio Tosato. Mr. Tosato currently serves as our industrial coordination director. He first joined Dalmine in 1974 in the personnel organization area, and has held many positions within Tenaris, including director of operations in Siderca and manufacturing director in Dalmine, before assuming his current position in 2003. Mr. Tosato is an Italian citizen.
Carlos Pappier. Mr. Pappier currently serves as our planning director, a position that he assumed in October 2006. He began his career within the Techint group in 1984 as a cost analyst in Siderar. After holding several positions within Tenaris and other Techint group companies in 2002 he became chief of staff of Tenaris. Mr. Pappier is an Argentine citizen.
Germán Curá. Mr. Curá currently serves as our North American area manager. He is a marine engineer and was first employed with Siderca in 1988. Previously, he served as Siderca’s exports director, Tamsa’s exports director and commercial director, sales and marketing manager of our Middle East office, president of Algoma Tubes, director of our Oilfield Services business unit and commercial director. He is also a member of the board of directors of the American Petroleum Institute (API). He assumed his current position in October 2006. Mr. Curá is an Argentine citizen.
Sergio de la Maza. Mr. de la Maza currently serves as our Central American area manager and also serves as a director and executive vice-president of Tamsa. Previously he served as our Mexican area manager. He first joined Tamsa in 1980. From 1983 to 1988, Mr. de la Maza worked in several positions in Tamsa and Dalmine. He then became manager of Tamsa’s new pipe factory and later served as manufacturing manager and quality director of Tamsa. Subsequently, he was named manufacturing director of Siderca. He assumed his current position in 2006. Mr. de la Maza is a Mexican citizen.
Guillermo Noriega. Mr. Noriega currently serves as our South American area manager and also serves as managing director of Siderca. He began his career at Siderca as an industrial engineer in 1981. Previously, he served as Siderca’s commercial director for the Argentine market. He assumed his current position with Siderca in 2000. Mr. Noriega is an Argentine citizen.
Vincenzo Crapanzano. Mr. Crapanzano currently serves as our European area manager and also serves as managing director of Dalmine. Previously he served as our Mexican area manager and executive vice president of Tamsa. Prior to joining Tenaris, he held various positions at Grupo Falck from 1979 to 1989. When Dalmine acquired the tubular assets of Grupo Falck in 1990, he was appointed managing director of the cold drawn tubes division. He is also vice president of Centro Sviluppo Materiali S.p.A, and of Federacciai. He assumed his current position in January 2004. Mr. Crapanzano is an Italian citizen.
Claudio Leali. Mr. Leali currently serves as our North East Asia area manager, a position that he assumed in 2009, after having served as director of our Japanese operations since November 2006. He began his career at Dalmine as a development product technician in 1976. From March 1994 to October 1995 he served as technical managing director of DMV, a joint venture between Dalmine, Vallourec and Mannesmann. Before assuming his current position he also served as quality director and as executive assistant of the technology department. Mr. Leali is an Italian citizen.
Upon the retirement of Mr. San Martín from his executive functions as technology director, the technology and quality departments have been merged into the technology department under the responsibility of Marcelo Ramos.
Compensation
The compensation of the members of the Company’s board of directors is determined at the annual ordinary general shareholders’ meeting. Each member of the board of directors received as compensation for such position a fee of $70 thousand.
The chairman of the audit committee received as additional compensation a fee of $60 thousand, while the other members of the audit committee received an additional fee of $50 thousand. Under the Company’s articles of association, the members of the audit committee are not eligible to participate in any incentive compensation plan for employees of the Company or any of its subsidiaries.
36
The aggregate compensation earned by directors and senior management during 2009 amounted to $18.2 million.
There are no service contracts between any director and Tenaris that provide for benefits upon termination of employment.
Employee retention and incentive program
On January 1, 2007, we adopted an employee retention and long term incentive program. Pursuant to this program, certain senior executives have been granted a number of units equivalent in value to the equity book value per share (excluding minority interest). The units will be vested over a period of four years and Tenaris will redeem vested units following a period of seven years from the grant date, or when the employee ceases employment, at the equity book value per share at the time of the payment. Beneficiaries also receive a cash amount per unit equivalent to the dividend paid per share whenever the Company pays a cash dividend to its shareholders. Annual compensation under this program is not expected to exceed 35%, on average, of the total annual compensation of the beneficiaries.
The total value of the units granted under the program, based on the number of units and the book value per share as of December 31, 2009, was $27.6 million. As of December 31, 2009, we have recorded a total liability of $19.6 million, based on actuarial calculations provided by independent advisors.
Auditors
The Company’s articles of association require the appointment of at least one independent auditor chosen from among the members of the Luxembourg Institute of Independent Auditors. The primary responsibility of the independent auditor is to audit the Company’s annual accounts and to submit a report on the accounts to shareholders at the annual shareholders’ meeting. Following a recommendation from our audit committee, auditors are appointed by the general shareholders’ meeting through a resolution passed by a simple majority vote, irrespective of the number of shares present or represented. Shareholders may determine the number and the term of office of the auditors at the ordinary general shareholders’ meeting, provided however that an auditor’s term shall not exceed one year and that any auditor may be reappointed or dismissed by the general shareholders meeting at any time, with or without cause. Luxembourg law does not allow directors to serve concurrently as independent auditors. As part of their duties, the auditors report directly to the audit committee.
PricewaterhouseCoopers (acting, in connection with the Company’s annual accounts and annual consolidated financial statements required under Luxembourg law, through PricewaterhouseCoopers S.á.r.l., Réviseur d’entreprises and, in connection with the Company’s annual and interim consolidated financial statements required under the laws of any other relevant jurisdiction, through Price Waterhouse & Co. S.R.L.) were appointed as the Company’s independent auditors for the fiscal year ending December 31, 2009, at the ordinary general shareholders’ meeting held on June 3, 2009.
The Company’s audit committee is responsible for, among other things, the oversight of the Company’s independent auditors. The audit committee has adopted in its charter a policy of pre-approval of audit and permissible non-audit services provided by its independent auditors. Under the policy, the audit committee makes its recommendations to the shareholders’ meeting concerning the continuing appointment or termination of the Company’s independent auditors. On a yearly basis, the audit committee reviews together with management and the independent auditor, the audit plan, audit related services and other non-audit services and approves the related fees. Any changes to the approved fees must be reviewed and approved by the audit committee. In addition, the audit committee delegates to its Chairman the authority to consider and approve, on behalf of the audit committee, additional non-audit services that were not recognized at the time of engagement, which must be reported to the other members of the audit committee at its next meeting. No services outside the scope of the audit committee’s approval can be undertaken by the independent auditor.
Fees Paid to the Company’s Principal Accountant
37
In 2009, PricewaterhouseCoopers served as the principal external auditor for the Company. Fees payable to PricewaterhouseCoopers in 2009 are detailed below.
| Thousands of U.S. dollars | For the year ended December 31, 2009 | |||
Audit Fees | 3,743 | |||
Audit-Related Fees | 490 | |||
Tax Fees | 129 | |||
All Other Fees | - | |||
| Total | 4,362 | |||
Audit Fees
Audit fees were paid for professional services rendered by the auditors for the audit of the consolidated financial statements and internal control over financial reporting of the Company, the statutory financial statements of the Company and its subsidiaries, and any other audit services required for US Securities and Exchange Commission or other regulatory filings.
Audit-Related Fees
Audit-related fees are typically services that are reasonably related to the performance of the audit or review of the consolidated financial statements of the Company and the statutory financial statements of the Company and its subsidiaries and are not reported under the audit fee item above. This item includes fees for attestation services on financial information of the Company and its subsidiaries included in their annual reports that are filed with their respective regulators.
Tax Fees
Tax fees paid for tax compliance professional services.
All Other Fees
In 2009, PricewaterhouseCoopers did not perform any services other than those described above.
Employees
The following table shows the number of persons employed by Tenaris:
| At December 31, | ||||
2009 | ||||
| Argentina | 6,396 | |||
| Mexico | 3,809 | |||
| Italy | 2,870 | |||
| Brazil | 2,544 | |||
| United States | 2,320 | |||
| Romania | 1,107 | |||
| Canada | 1,061 | |||
| Japan | 636 | |||
| Other Countries | 1,848 | |||
| Total employees | 22,591 | |||
At December 31, 2008 and December 31, 2007, the number of persons employed by Tenaris was 23,873 and 23,372 respectively.
The number of our employees decreased during 2009, from 23,873 at December 2008, to 22,591 at December 2009. The addition of SPIJ’s employees in April 2009, was more than offset by employee departures as a result of a reduction in activity levels as a consequence of the global economic and financial crisis and the discontinuation of the operations of our production facilities in Venezuela, Tavsa and Matesi, following their nationalization by the Venezuelan government.
38
Approximately 55% of our employees are unionized. We believe that we enjoy good or satisfactory relations with our employees and their unions in each of the countries in which we have manufacturing facilities, and we have not experienced any major strikes or other labor conflicts with a material impact on our operations over the last five years.
Share Ownership
To our knowledge, the total number of the Company’s shares (in the form of ordinary shares or ADSs) beneficially owned by our directors and senior management as of March 31, 2010 was 1,400,839, which represents 0.1% of our outstanding shares.
The following table provides information regarding share ownership by our directors and senior management:
Director or Officer | Number of Shares Held | |||
Guillermo Vogel | 1,325,446 | |||
Carlos Condorelli | 67,211 | |||
Ricardo Soler | 8,182 | |||
Total | 1,400,839 | |||
Major Shareholders
The following table shows the beneficial ownership of the Company’s ordinary shares, as of March 31, 2010, by (1) the Company’s principal shareholders (persons or entities that own beneficially 5% or more of the Company’s shares), (2) non-affiliated public shareholders, and (3) the Company’s directors and senior management as a group.
| Identity of Person or Group | Number | Percent | ||||||
San Faustin(1) | 713,605,187 | 60.4 | % | |||||
| Directors and senior management as a group | 1,400,839 | 0.1 | % | |||||
| Public | 465,530,804 | 39.4 | % | |||||
| Total | 1,180,536,830 | 100.0 | % | |||||
| (1) | Shares held by III CI, a wholly-owned subsidiary of San Faustin. Rocca & Partners S.A. controls a significant portion of the voting power of San Faustin and has the ability to influence matters affecting, or submitted to a vote of, the shareholders of San Faustin. |
The voting rights of the Company’s major shareholders do not differ from the voting rights of other shareholders. None of its outstanding shares have any special control rights. There are no restrictions on voting rights, nor are there, to the Company’s knowledge, any agreements among shareholders of the Company that might result in restrictions on the transfer of securities or the exercise of voting rights.
The Company does not know of any significant agreements or other arrangements to which the Company is a party and which take effect, alter or terminate in the event of a change of control of the Company. The Company does not know of any arrangements, the operation of which may at a subsequent date result in a change of control of the Company.
Information required under the Luxembourg Law on takeovers of May 19, 2006
We have an authorized share capital of a single class of 2,500,000,000 shares with a par value of US$ 1.00 per share. Our authorized share capital is fixed by our articles of association as amended from time to time with the approval of our shareholders in an extraordinary shareholders’ meeting. There were 1,180,536,830 shares issued as of December 31, 2009. All shares are fully paid.
Under our articles of association, our board of directors is authorized until August 2, 2012, to increase from time to time our issued share capital wholly or in part, within the limits of the authorized capital.
Tenaris is controlled by San Faustin, which owns 60.45% of our outstanding shares, through its wholly owned subsidiary I.I.I. Industrial Investments Inc., a Cayman Islands corporation. Rocca & Partners S.A., or Rocca & Partners, controls a significant portion of the voting power of San Faustin and has the ability to influence matters affecting, or submitted to a vote of the shareholders of, San Faustin, such as the election of directors, the approval of certain corporate transactions and other matters concerning the company’s policies. There are no controlling shareholders for Rocca & Partners. Our directors and senior management as a group own 0.1% of our outstanding shares, while the remaining 39.4% are publicly traded. Our shares trade on the Italian Stock Exchange, the Buenos Aires Stock Exchange and the Mexican Stock Exchange; in addition, our American Depositary Securities (ADSs) trade on the New York Stock Exchange. See “Corporate Governance – Major Shareholders”.
39
None of our outstanding securities has any special control rights. There are no restrictions on voting rights, nor are there, to our knowledge, any agreements among our shareholders that might result in restrictions on the transfer of securities or the exercise of voting rights.
There are no significant agreements to which we are a party and which take effect, alter or terminate in the event of a change in the control of Tenaris following a takeover bid, thereby materially and adversely affecting us, nor are there any agreements between us and members of our board of directors or employees that provide for compensation if they resign or are made redundant without reason, or if their employment ceases pursuant to a takeover bid.
Management is vested in a board of directors. Directors are elected at the annual ordinary shareholders’ meeting to serve one-year renewable terms.
Under our articles of association, any issuance of new shares pursuant to the authorization granted to our board of directors, must grant our existing shareholders a preferential right to subscribe for such newly-issued shares, except:
| · | in circumstances in which the shares are issued for consideration other than money |
| · | with respect to shares issued as compensation to directors, officers, agents or employees, its subsidiaries or affiliates, and |
| · | with respect to shares issued to satisfy conversion or option rights created to provide compensation to directors, officers, agents or employees, its subsidiaries or affiliates. |
Any shares to be issued as compensation or to satisfy conversion or option rights may not exceed 1.5% of our issued capital stock.
Our articles of association do not contain any redemption or sinking fund provisions, nor do they impose any restrictions on the transfer of our shares.
Amendment of our articles of association requires the approval of shareholders on an extraordinary shareholders’ meeting with a two-thirds majority of the votes present or represented.
40
Management Certification
We confirm, to the best of our knowledge, that:
| 1. | the consolidated financial statements prepared in conformity with International Financial Reporting Standards, included in this annual report, give a true and fair view of the assets, liabilities, financial position and profit or loss of Tenaris S.A. and its consolidated subsidiaries, taken as a whole; |
| 2. | the annual accounts prepared in accordance with Luxembourg legal and regulatory requirements, included in this annual report, give a true and fair view of the assets, liabilities, financial position and profit or loss of Tenaris S.A.; and |
| 3. | the consolidated management report, which has been combined with the management report for Tenaris S.A., included in this annual report, gives a fair review of the development and performance of the business and the position of Tenaris S.A., or Tenaris S.A. and its consolidated subsidiaries, taken as a whole, as applicable, together with a description of the principal risks and uncertainties they face. |
Chief Executive Officer
Paolo Rocca
April 22, 2010
Chief Financial Officer
Ricardo Soler
April 22, 2010
41
Financial Information
Consolidated Financial Statements
For the years ended December 31, 2009, 2008 and 2007
42

Report of Independent Registered Public Accounting Firm
To the Board of Directors and Shareholders of
Tenaris S.A.
In our opinion, the accompanying consolidated statement of financial position and the related consolidated statements of income, comprehensive income, changes in equity and cash flows present fairly, in all material respects, the financial position of Tenaris S.A. and its subsidiaries at December 31, 2009 and 2008, and the results of their operations and their cash flows for each of the three years in the period ended December 31, 2009 in conformity with International Financial Reporting Standards as issued by the International Accounting Standards Board and in conformity with International Financial Reporting Standards as adopted by the European Union. These financial statements are the responsibility of the Company’s management. Our responsibility is to express an opinion on these financial statements based on our audits. We conducted our audits of these statements in accordance with the standards of the Public Company Accounting Oversight Board (United States). Those standards require that we plan and perform the audit to obtain reasonable assurance about whether the financial statements are free of material misstatement. An audit includes examining, on a test basis, evidence supporting the amounts and disclosures in the financial statements, assessing the accounting principles used and significant estimates made by management, and evaluating the overall financial statement presentation. We believe that our audits provide a reasonable basis for our opinion.
Buenos Aires, Argentina
April 22, 2010
| PRICE WATERHOUSE & CO. S.R.L. | |
| by | (Partner) |
Diego Niebuhr | |
43
CONSOLIDATED INCOME STATEMENT
| (all amounts in thousands of U.S. dollars, unless otherwise stated) | Year ended December 31, | |||||||||||||||
| Notes | 2009 | 2008 | 2007 | |||||||||||||
| Continuing operations | ||||||||||||||||
| Net sales | 1 | 8,149,320 | 11,987,760 | 9,874,312 | ||||||||||||
| Cost of sales | 1 & 2 | (4,864,922 | ) | (6,698,285 | ) | (5,408,984 | ) | |||||||||
| Gross profit | 3,284,398 | 5,289,475 | 4,465,328 | |||||||||||||
| Selling, general and administrative expenses | 1 & 3 | (1,473,791 | ) | (1,787,952 | ) | (1,551,836 | ) | |||||||||
| Other operating income | 5 (i) | 7,673 | 35,140 | 27,251 | ||||||||||||
| Other operating expenses | 5 (ii) | (4,673 | ) | (411,013 | ) | (23,771 | ) | |||||||||
| Operating income | 1,813,607 | 3,125,650 | 2,916,972 | |||||||||||||
| Interest income | 6 | 30,831 | 48,711 | 92,733 | ||||||||||||
| Interest expense | 6 | (118,301 | ) | (179,885 | ) | (270,705 | ) | |||||||||
| Other financial results | 6 | (64,230 | ) | (99,850 | ) | (22,358 | ) | |||||||||
| Income before equity in earnings of associated companies and income tax | 1,661,907 | 2,894,626 | 2,716,642 | |||||||||||||
| Equity in earnings of associated companies | 7 | 87,041 | 89,423 | 113,062 | ||||||||||||
| Income before income tax | 1,748,948 | 2,984,049 | 2,829,704 | |||||||||||||
| Income tax | 8 | (513,211 | ) | (1,015,334 | ) | (805,773 | ) | |||||||||
| Income for continuing operations | 1,235,737 | 1,968,715 | 2,023,931 | |||||||||||||
| Discontinued operations | ||||||||||||||||
| Result for discontinued operations | 29 | (28,138 | ) | 306,905 | 52,128 | |||||||||||
| Income for the year | 1,207,599 | 2,275,620 | 2,076,059 | |||||||||||||
| Attributable to: | ||||||||||||||||
| Equity holders of the Company | 1,161,555 | 2,124,802 | 1,923,748 | |||||||||||||
| Minority interest | 46,044 | 150,818 | 152,311 | |||||||||||||
| 1,207,599 | 2,275,620 | 2,076,059 | ||||||||||||||
| Earnings per share attributable to the equity holders of the Company during year : | ||||||||||||||||
| Weighted average number of ordinary shares (thousands) | 9 | 1,180,537 | 1,180,537 | 1,180,537 | ||||||||||||
| Continuing and Discontinued operations | ||||||||||||||||
| Basic and diluted earnings per share (U.S. dollars per share) | 9 | 0.98 | 1.80 | 1.63 | ||||||||||||
| Basic and diluted earnings per ADS (U.S. dollars per ADS) | 9 | 1.97 | 3.60 | 3.26 | ||||||||||||
| Continuing operations | ||||||||||||||||
| Basic and diluted earnings per share (U.S. dollars per share) | 1.00 | 1.49 | 1.58 | |||||||||||||
| Basic and diluted earnings per ADS (U.S. dollars per ADS) | 2.00 | 2.99 | 3.17 | |||||||||||||
44
CONSOLIDATED STATEMENT OF COMPREHENSIVE INCOME
| (all amounts in thousands of U.S. dollars) | Year ended December 31, | |||||||||||
| 2009 | 2008 | 2007 | ||||||||||
| Income for the year | 1,207,599 | 2,275,620 | 2,076,059 | |||||||||
| Other comprehensive income: | ||||||||||||
| Currency translation adjustment | 357,511 | (486,636 | ) | 306,266 | ||||||||
| Cash flow hedges | 1,384 | (8,513 | ) | (10,554 | ) | |||||||
| Share of other comprehensive income of associates | ||||||||||||
| Currency translation adjustment | (1,302 | ) | (51,004 | ) | 3,595 | |||||||
| Cash flow hedges | 2,722 | (6,044 | ) | - | ||||||||
| Income tax relating to components of other comprehensive income (*) | 2,089 | 3,003 | - | |||||||||
| Other comprehensive income for the year, net of tax | 362,404 | (549,194 | ) | 299,307 | ||||||||
| Total comprehensive income for the year | 1,570,003 | 1,726,426 | 2,375,366 | |||||||||
| Attributable to: | ||||||||||||
| Equity holders of the Company | 1,423,986 | 1,620,640 | 2,175,289 | |||||||||
| Minority interest | 146,017 | 105,786 | 200,077 | |||||||||
| 1,570,003 | 1,726,426 | 2,375,366 | ||||||||||
(*) Relates to Cash flow hedges.
The accompanying notes are an integral part of these Consolidated Financial Statements.
45
CONSOLIDATED STATEMENT OF FINANCIAL POSITION
| (all amounts in thousands of U.S. dollars) | At December 31, 2009 | At December 31, 2008 | ||||||||||||||||||
| Notes | ||||||||||||||||||||
| ASSETS | ||||||||||||||||||||
| Non-current assets | ||||||||||||||||||||
| Property, plant and equipment, net | 10 | 3,254,587 | 2,982,871 | |||||||||||||||||
| Intangible assets, net | 11 | 3,670,920 | 3,826,987 | |||||||||||||||||
| Investments in associated companies | 12 | 602,572 | 527,007 | |||||||||||||||||
| Other investments | 13 | 34,167 | 38,355 | |||||||||||||||||
| Deferred tax assets | 21 | 197,603 | 390,323 | |||||||||||||||||
| Receivables | 14 | 101,618 | 7,861,467 | 82,752 | 7,848,295 | |||||||||||||||
| Current assets | ||||||||||||||||||||
| Inventories | 15 | 1,687,059 | 3,091,401 | |||||||||||||||||
| Receivables and prepayments | 16 | 220,124 | 251,481 | |||||||||||||||||
| Current tax assets | 17 | 260,280 | 201,607 | |||||||||||||||||
| Trade receivables | 18 | 1,310,302 | 2,123,296 | |||||||||||||||||
| Available for sale assets | 32 | 21,572 | - | |||||||||||||||||
| Other investments | 19 | 579,675 | 45,863 | |||||||||||||||||
| Cash and cash equivalents | 19 | 1,542,829 | 5,621,841 | 1,538,769 | 7,252,417 | |||||||||||||||
| Total assets | 13,483,308 | 15,100,712 | ||||||||||||||||||
| EQUITY | ||||||||||||||||||||
| Capital and reserves attributable to the Company’s equity holders | 9,092,164 | 8,176,571 | ||||||||||||||||||
| Minority interest | 628,672 | 525,316 | ||||||||||||||||||
| Total equity | 9,720,836 | 8,701,887 | ||||||||||||||||||
| LIABILITIES | ||||||||||||||||||||
| Non-current liabilities | ||||||||||||||||||||
| Borrowings | 20 | 655,181 | 1,241,048 | |||||||||||||||||
| Deferred tax liabilities | 21 | 860,787 | 1,053,838 | |||||||||||||||||
| Other liabilities | 22 (i) | 192,467 | 223,142 | |||||||||||||||||
| Provisions | 23 (ii) | 80,755 | 89,526 | |||||||||||||||||
| Trade payables | 2,812 | 1,792,002 | 1,254 | 2,608,808 | ||||||||||||||||
| Current liabilities | ||||||||||||||||||||
| Borrowings | 20 | 791,583 | 1,735,967 | |||||||||||||||||
| Current tax liabilities | 17 | 306,539 | 610,313 | |||||||||||||||||
| Other liabilities | 22 (ii) | 192,190 | 242,620 | |||||||||||||||||
| Provisions | 24 (ii) | 28,632 | 28,511 | |||||||||||||||||
| Customer advances | 95,107 | 275,815 | ||||||||||||||||||
| Trade payables | 556,419 | 1,970,470 | 896,791 | 3,790,017 | ||||||||||||||||
| Total liabilities | 3,762,472 | 6,398,825 | ||||||||||||||||||
| Total equity and liabilities | 13,483,308 | 15,100,712 | ||||||||||||||||||
Contingencies, commitments and restrictions to the distribution of profits are disclosed in Note 26. | ||||||||||||||||||||
The accompanying notes are an integral part of these Consolidated Financial Statements.
46
CONSOLIDATED STATEMENTS OF CHANGES IN EQUITY
(all amounts in thousands of U.S. dollars)
| Attributable to equity holders of the Company | ||||||||||||||||||||||||||||||||||||
| Share Capital | Legal Reserves | Share Premium | Currency Translation Adjustment | Other Reserves | Retained Earnings (*) | Total | Minority Interest | Total | ||||||||||||||||||||||||||||
| Balance at January 1, 2009 | 1,180,537 | 118,054 | 609,733 | (223,779 | ) | 2,127 | 6,489,899 | 8,176,571 | 525,316 | 8,701,887 | ||||||||||||||||||||||||||
| Income for the year | - | - | - | - | - | 1,161,555 | 1,161,555 | 46,044 | 1,207,599 | |||||||||||||||||||||||||||
| Other comprehensive income for the year | - | - | - | 253,312 | 9,119 | - | 262,431 | 99,973 | 362,404 | |||||||||||||||||||||||||||
| Total comprehensive income for the year | - | - | - | 253,312 | 9,119 | 1,161,555 | 1,423,986 | 146,017 | 1,570,003 | |||||||||||||||||||||||||||
| Acquisition and decrease of minority interest | - | - | - | - | (783 | ) | - | (783 | ) | 3,425 | 2,642 | |||||||||||||||||||||||||
| Change in equity reserves | - | - | - | - | 21 | - | 21 | - | 21 | |||||||||||||||||||||||||||
| Dividends paid in cash | - | - | - | - | - | (507,631 | ) | (507,631 | ) | (46,086 | ) | (553,717 | ) | |||||||||||||||||||||||
Balance at December 31, 2009 | 1,180,537 | 118,054 | 609,733 | 29,533 | 10,484 | 7,143,823 | 9,092,164 | 628,672 | 9,720,836 | |||||||||||||||||||||||||||
(*) The Distributable Reserve and Retained Earnings calculated according to Luxembourg Law are disclosed in Note 26.
The accompanying notes are an integral part of these Consolidated Financial Statements.
47
CONSOLIDATED STATEMENT OF CHANGES IN EQUITY (Cont.)
(all amounts in thousands of U.S. dollars)
| Attributable to equity holders of the Company | ||||||||||||||||||||||||||||||||||||
| Share Capital | Legal Reserves | Share Premium | Currency Translation Adjustment | Other Reserves | Retained Earnings | Total | Minority Interest | Total | ||||||||||||||||||||||||||||
| Balance at January 1, 2008 | 1,180,537 | 118,054 | 609,733 | 266,049 | 18,203 | 4,813,701 | 7,006,277 | 523,573 | 7,529,850 | |||||||||||||||||||||||||||
| Income for the year | - | - | - | - | - | 2,124,802 | 2,124,802 | 150,818 | 2,275,620 | |||||||||||||||||||||||||||
| Other comprehensive income for the year | - | - | - | (489,828 | ) | (14,334 | ) | - | (504,162 | ) | (45,032 | ) | (549,194 | ) | ||||||||||||||||||||||
| Total comprehensive income for the year | - | - | - | (489,828 | ) | (14,334 | ) | 2,124,802 | 1,620,640 | 105,786 | 1,726,426 | |||||||||||||||||||||||||
| Acquisition and decrease of minority interest | - | - | - | - | (1,742 | ) | - | (1,742 | ) | (16,843 | ) | (18,585 | ) | |||||||||||||||||||||||
| Dividends paid in cash | - | - | - | - | - | (448,604 | ) | (448,604 | ) | (87,200 | ) | (535,804 | ) | |||||||||||||||||||||||
| Balance at December 31, 2008 | 1,180,537 | 118,054 | 609,733 | (223,779 | ) | 2,127 | 6,489,899 | 8,176,571 | 525,316 | 8,701,887 | ||||||||||||||||||||||||||
| Attributable to equity holders of the Company | ||||||||||||||||||||||||||||||||||||
| Share Capital | Legal Reserves | Share Premium | Currency Translation Adjustment | Other Reserves | Retained Earnings | Total | Minority Interest | Total | ||||||||||||||||||||||||||||
| Balance at January 1, 2007 | 1,180,537 | 118,054 | 609,733 | 3,954 | 28,757 | 3,397,584 | 5,338,619 | 363,011 | 5,701,630 | |||||||||||||||||||||||||||
| Income for the year | - | - | - | - | - | 1,923,748 | 1,923,748 | 152,311 | 2,076,059 | |||||||||||||||||||||||||||
| Other comprehensive income for the year | - | - | - | 262,095 | (10,554 | ) | - | 251,541 | 47,766 | 299,307 | ||||||||||||||||||||||||||
| Total comprehensive income for the year | - | - | - | 262,095 | (10,554 | ) | 1,923,748 | 2,175,289 | 200,077 | 2,375,366 | ||||||||||||||||||||||||||
| Acquisition and decrease of minority interest | - | - | - | - | - | - | - | 20,748 | 20,748 | |||||||||||||||||||||||||||
| Dividends paid in cash | - | - | - | - | - | (507,631 | ) | (507,631 | ) | (60,263 | ) | (567,894 | ) | |||||||||||||||||||||||
| Balance at December 31, 2007 | 1,180,537 | 118,054 | 609,733 | 266,049 | 18,203 | 4,813,701 | 7,006,277 | 523,573 | 7,529,850 | |||||||||||||||||||||||||||
The accompanying notes are an integral part of these Consolidated Financial Statements
48
CONSOLIDATED STATEMENT OF CASH FLOWS
| Year ended December 31, | ||||||||||||||||
| (all amounts in thousands of U.S. dollars) | Note | 2009 | 2008 | 2007 | ||||||||||||
| Cash flows from operating activities | ||||||||||||||||
| Income for the year | 1,207,599 | 2,275,620 | 2,076,059 | |||||||||||||
| Adjustments for: | ||||||||||||||||
| Depreciation and amortization | 10 & 11 | 504,864 | 532,934 | 514,820 | ||||||||||||
| Income tax accruals less payments | 28 (ii) | (458,086 | ) | (225,038 | ) | (393,055 | ) | |||||||||
| Equity in earnings of associated companies | (86,179 | ) | (89,556 | ) | (94,888 | ) | ||||||||||
| Interest accruals less payments, net | 28 (iii) | (24,167 | ) | 55,492 | (21,302 | ) | ||||||||||
| Income from disposal of investment and other | - | (394,323 | ) | (18,388 | ) | |||||||||||
| Changes in provisions | (7,268 | ) | 783 | (421 | ) | |||||||||||
| Impairment charge | 5 | - | 502,899 | - | ||||||||||||
| Changes in working capital | 28 (i) | 1,737,348 | (1,051,632 | ) | (110,425 | ) | ||||||||||
| Other, including currency translation adjustment | 189,837 | (142,174 | ) | 68,224 | ||||||||||||
| Net cash provided by operating activities | 3,063,948 | 1,465,005 | 2,020,624 | |||||||||||||
| Cash flows from investing activities | ||||||||||||||||
| Capital expenditures | 10 & 11 | (460,927 | ) | (443,238 | ) | (447,917 | ) | |||||||||
| Acquisitions of subsidiaries and minority interest | 27 | (73,584 | ) | (18,585 | ) | (1,927,262 | ) | |||||||||
| Other disbursements relating to the acquisition of Hydril | - | - | (71,580 | ) | ||||||||||||
| Proceeds from the sale of pressure control business (*) | 29 | - | 1,113,805 | - | ||||||||||||
| Decrease in subsidiaries / associated | - | - | 27,321 | |||||||||||||
| Proceeds from disposal of property, plant and equipment and intangible assets | 16,310 | 17,161 | 24,041 | |||||||||||||
| Dividends and distributions received from associated companies | 12 | 11,420 | 15,032 | 12,170 | ||||||||||||
| Changes in restricted bank deposits | - | - | 21 | |||||||||||||
| Investments in short terms securities | (533,812 | ) | 41,667 | 96,074 | ||||||||||||
| Other | - | (3,428 | ) | - | ||||||||||||
| Net cash (used in) provided by investing activities | (1,040,593 | ) | 722,414 | (2,287,132 | ) | |||||||||||
| Cash flows from financing activities | ||||||||||||||||
| Dividends paid | (507,631 | ) | (448,604 | ) | (507,631 | ) | ||||||||||
| Dividends paid to minority interest in subsidiaries | (46,086 | ) | (87,200 | ) | (60,263 | ) | ||||||||||
| Proceeds from borrowings | 631,544 | 1,087,649 | 2,718,264 | |||||||||||||
| Repayments of borrowings | (2,096,925 | ) | (2,122,268 | ) | (2,347,054 | ) | ||||||||||
| Net cash used in financing activities | (2,019,098 | ) | (1,570,423 | ) | (196,684 | ) | ||||||||||
| Increase (decrease) in cash and cash equivalents | 4,257 | 616,996 | (463,192 | ) | ||||||||||||
| Movement in cash and cash equivalents | ||||||||||||||||
| At the beginning of the period | 1,525,022 | 954,303 | 1,365,008 | |||||||||||||
| Effect of exchange rate changes | 9,124 | (46,277 | ) | 52,487 | ||||||||||||
| Decrease in cash due to deconsolidation | 32 | (9,696 | ) | - | - | |||||||||||
| Increase (decrease) in cash and cash equivalents | 4,257 | 616,996 | (463,192 | ) | ||||||||||||
| At December 31, | 28 (iv) | 1,528,707 | 1,525,022 | 954,303 | ||||||||||||
| Non-cash financing activity | ||||||||||||
| Conversion of debt to equity in subsidiaries | - | - | 35,140 | |||||||||
(*) Includes $394 million of after-tax gain, $381 million of assets and liabilities held for sale and $339 million of income tax charges and related expenses.
49
The accompanying notes are an integral part of these Consolidated Financial Statements.
INDEX TO THE NOTES TO THE CONSOLIDATED FINANCIAL STATEMENTS
| I. | GENERAL INFORMATION | IV. | OTHER NOTES TO THE CONSOLIDATED FINANCIAL STATEMENTS |
| 1 | Segment information | ||
| II. | ACCOUNTING POLICIES (“AP”) | 2 | Cost of sales |
| A | Basis of presentation | 3 | Selling, general and administrative expenses |
| B | Group accounting | 4 | Labor costs (included in Cost of sales and in Selling, general and administrative expenses) |
| C | Segment information | 5 | Other operating items |
| D | Foreign currency translation | 6 | Financial results |
| E | Property, plant and equipment | 7 | Equity in earnings of associated companies |
| F | Intangible assets | 8 | Income tax |
| G | Impairment of non financial assets | 9 | Earnings and dividends per share |
| H | Other investments | 10 | Property, plant and equipment, net |
| I | Inventories | 11 | Intangible assets, net |
| J | Trade and other receivables | 12 | Investments in associated companies |
| K | Cash and cash equivalents | 13 | Other investments - non current |
| L | Equity | 14 | Receivables - non current |
| M | Borrowings | 15 | Inventories |
| N | Current and Deferred income tax | 16 | Receivables and prepayments |
| O | Employee benefits | 17 | Current tax assets and liabilities |
| P | Employees’ statutory profit sharing | 18 | Trade receivables |
| Q | Provisions | 19 | Cash and cash equivalents, and Other investments |
| R | Trade payables | 20 | Borrowings |
| S | Revenue recognition | 21 | Deferred income tax |
| T | Cost of sales and sales expenses | 22 | Other liabilities |
| U | Earnings per share | 23 | Non-current allowances and provisions |
| V | Financial instruments | 24 | Current allowances and provisions |
| 25 | Derivative financial instruments | ||
| 26 | Contingencies, commitments and restrictions on the distribution of profits | ||
| III. | FINANCIAL RISK MANAGEMENT | 27 | Business combinations and other acquisitions |
| 28 | Cash flow disclosures | ||
| A | Financial Risk Factors | 29 | Discontinued operations |
| B | Financial instruments by category | 30 | Related party transactions |
| C | Fair value by hierarchy | 31 | Principal subsidiaries |
| D | Fair value estimation | 32 | Processes in Venezuela |
| E | Accounting for derivatives financial instruments and hedging activities | 33 | Subsequent events |
50
I. GENERAL INFORMATION
Tenaris S.A. (the “Company”), a Luxembourg corporation (societé anonyme holding), was incorporated on December 17, 2001, as a holding company in steel pipe manufacturing and distributing operations. The Company holds, either directly or indirectly, controlling interests in various subsidiaries. References in these financial statements to “Tenaris” refer to Tenaris S.A. and its consolidated subsidiaries.
The Company’s shares trade on the Milan Stock Exchange, the Buenos Aires Stock Exchange and the Mexico City Stock Exchange; the Company’s American Depositary Securities (“ADS”) trade on the New York Stock Exchange.
These Consolidated Financial Statements were approved for issue by the Company’s Board of Directors on February 24, 2010.
II. ACCOUNTING POLICIES
The principal accounting policies applied in the preparation of these Consolidated Financial Statements are set out below. These policies have been consistently applied to all the years presented, unless otherwise stated.
A Basis of presentation
The Consolidated Financial Statements of Tenaris have been prepared in accordance with International Financial Reporting Standards (“IFRS”), as issued by the International Accounting Standards Board (“IASB”) and adopted by the European Union, under the historical cost convention, as modified by the revaluation of financial assets and liabilities (including derivative instruments) at fair value through profit or loss. The Consolidated Financial Statements are presented in thousands of U.S. dollars (“$”).
Certain comparative amounts have been reclassified to conform to changes in presentation in the current year.
The preparation of consolidated financial statements in conformity with IFRS requires management to make certain accounting estimates and assumptions that might affect the reported amounts of assets and liabilities and the disclosure of contingent assets and liabilities at the balance sheet dates, and the reported amounts of revenues and expenses during the reporting years. Actual results may differ from these estimates.
| (1) | New and amended standards effective in 2009 and relevant for Tenaris |
| § | IFRS 7, “Financial Instruments – Disclosures (amendment)” |
This amendment, effective 1 January 2009, requires enhanced disclosures about fair value measurement and liquidity risk. In particular, the amendment requires disclosure of fair value measurements by level of a fair value measurement hierarchy. As the change in accounting policy only results in additional disclosures, there is no impact on earnings per share.
| § | IFRS 8, “Operating segments” |
Tenaris early adopted IFRS 8 “Operating Segments” as from January 1, 2006, which replaces IAS 14 and requires an entity to report financial and descriptive information about its reportable segments (as aggregations of operating segments). Financial information is required to be reported on the same basis used internally for evaluating operating segment performance and deciding how to allocate resources to operating segments also giving certain descriptive information. See Section II C.
| § | IAS 1 Revised, “Presentation of Financial Statements” |
IAS 1 has been revised to enhance the usefulness of information presented in the financial statements. The principal changes, among others, are: the introduction of a new statement of comprehensive income; additional disclosures about income tax relating to each component of other comprehensive income and not mandatory introduction of new terminology.
51
| § | IAS 23 Revised, “Borrowing Costs” |
IAS 23 revised, eliminates the option of expensing all borrowing costs and requires borrowing costs to be capitalized if they are directly attributable to the acquisition, construction or production of a qualifying asset. This amendment has no material effect on the Company’s financial condition or results of operations.
| (2) | Interpretations and amendments to published standards that are not yet effective and have not been early adopted |
| § | IAS 27 Revised, “Consolidated and separate financial statements” |
This revised standard requires the effects of all transactions with non-controlling interests to be recorded in equity if there is no change in control and these transactions will no longer result in goodwill or gains and losses. The standard also specifies the accounting when control is lost. Any remaining interest in the entity is re-measured to fair value, and a gain or loss is recognized in profit or loss. The Company will apply IAS 27 revised prospectively to transactions with non-controlling interests from January 1, 2010.
| § | IFRS 3 (revised January 2008), “Business Combinations” |
In January 2008, the IASB issued IFRS 3 (revised January 2008), “Business Combinations” (“IFRS 3 - revised”). IFRS 3 revised includes amendments that are meant to provide guidance for applying the acquisition method.
IFRS 3 revised replaces IFRS 3 (as issued in 2004) and comes into effect for business combinations for which the acquisition date is on or after the beginning of the first annual reporting period beginning on or after July 1, 2009.
This standard does not impact the current financial statements, and future impact is dependent on the existence of business combinations.
| § | Amendment to IFRS 5 “Non-current Assets held for sale and Discontinued Operations” |
In May 2008, the IASB amended IFRS 5 “Non-current Assets held for sale and Discontinued Operations” by requiring this classification although the entity retains a non-controlling interest.
Entities shall apply these amendments for annual periods beginning on or after July 1, 2009. Earlier application is permitted, provided that IAS 27 – amended is applied at the same time.
This standard does not impact the current financial statements, and future impact is dependent on the existence of discontinued operations.
| § | IFRS 9, “Financial Instruments” |
In November 2009, the IASB issued IFRS 9 “Financial Instruments” which establishes principles for the financial reporting of financial assets by simplifying their classification and measurement.
This interpretation is applicable for annual periods beginning on or after 1 January 2013. Earlier application is not permitted for entities that prepare financial statements in accordance with IFRS as adopted by the EU, since the interpretation is not yet adopted by the EU.
The Company’s management has not yet assessed the potential impact that the application of IFRS 9 will have on the Company’s financial statements.
52
| § | Improvements to International Financial Reporting Standards |
In April 2009, the IASB issued “Improvements to International Financial Reporting Standards” by which it amended several international accounting and financial reporting standards. Entities shall apply these amendments for annual periods beginning on or after January 1, 2010. Earlier application is not permitted for entities that prepare financial statements in accordance with IFRS as adopted by the EU, since these improved standards are not yet adopted by the EU.
The Company’s management estimates that the application of these amendments will not have a material effect on the Company’s financial condition or results of operations.
Management assessed the relevance of other new standards, amendments or interpretations not yet effective and concluded that they are not relevant to Tenaris.
B Group accounting
(1) Subsidiaries
Subsidiaries are all entities which are controlled by Tenaris as a result of its ability to govern an entity’s financial and operating policies generally accompanying a shareholding of more than 50% of the voting rights. Subsidiaries are consolidated from the date on which control is exercised by the Company and are no longer consolidated from the date control ceases.
The purchase method of accounting is used to account for the acquisition of subsidiaries by Tenaris. The cost of an acquisition is measured as the fair value of the assets given, equity instruments issued and liabilities incurred or assumed at the date of exchange, plus costs directly attributable to the acquisition. Identifiable assets acquired, liabilities and contingent liabilities assumed in a business combination are measured initially at their fair values at the acquisition date, irrespective of the extent of any minority interest. The excess of the cost of acquisition over the fair value of Tenaris share of the identifiable net assets acquired is recorded as goodwill. If the cost of acquisition is less than the fair value of the net assets of the subsidiary acquired, the difference is recognized directly in the income statement.
Material inter-company transactions, balances and unrealized gains (losses) on transactions between Tenaris subsidiaries have been eliminated in consolidation. However, since the functional currency of some subsidiaries is its respective local currency, some financial gains (losses) arising from inter-company transactions are generated. These are included in the Consolidated Income Statement under Other financial results.
See Note 31 for the list of the principal subsidiaries.
(2) Associates
Associates are all entities in which Tenaris has significant influence but not control, generally accompanying a shareholding of between 20% and 50% of the voting rights. Investments in associates are accounted for by the equity method of accounting and are initially recognized at cost.
Unrealized results on transactions between Tenaris and its associated companies are eliminated to the extent of Tenaris’ interest in the associated companies. Unrealized losses are also eliminated unless the transaction provides evidence of an impairment indicator of the asset transferred. Financial statements of associated companies have been adjusted where necessary to ensure consistency with IFRS.
The Company’s pro-rata share of earnings in associates is recorded in the Consolidated Income Statement under Equity in earnings of associated companies. The Company’s pro-rata share of changes in other reserves is recognized in the Consolidated Statement of Changes in Equity under Other Reserves.
53
The Company’s investment in Ternium S.A. (“Ternium”) has been accounted for by the equity method, as Tenaris has significant influence as defined by IAS 28, “Investments in Associates”. At December 31, 2009, Tenaris holds 11.46% of Ternium’s common stock. The Company’s investment in Ternium is carried at incorporation cost plus proportional ownership of Ternium’s earnings and other shareholders’ equity accounts. Because the exchange of its holdings in Amazonia and Ylopa for shares in Ternium was considered to be a transaction between companies under common control of San Faustin N.V., Tenaris recorded its initial ownership interest in Ternium at $229.7 million, the carrying value of the investments exchanged. This value was $22.6 million less than Tenaris proportional ownership of Ternium’s shareholders’ equity at the transaction date. As a result of this treatment, Tenaris investment in Ternium will not reflect its proportional ownership of Ternium’s net equity position. Ternium carried out an initial public offering (“IPO”) of its shares on February 1, 2006, listing its ADS on the New York Stock Exchange.
Tenaris review investments in associated companies for impairment whenever events or changes in circumstances indicate that the asset’s balance sheet carrying amount may not be recoverable, such as a significant or prolonged decline in fair value below the carrying value. Tenaris carries its investment in Ternium at its proportional equity value, with no additional goodwill or intangible assets recognized. At December 31, 2009, 2008 and 2007, no impairment provisions were recorded on Tenaris’ investment in Ternium.
C Segment information
The Company is organized in two major business segments: Tubes and Projects.
The Tubes segment includes the operations that consist of the production and selling of both seamless and welded steel tubular products and related services mainly for energy and industrial applications.
The Projects segment includes the operations that consist of the production and selling of welded steel pipe products mainly used in the construction of major pipeline projects.
The Other segment includes all other business activities and operating segments that are not required to be separately reported, including the operations that consist of the production and selling of sucker rods, welded steel pipes for electric conduits, industrial equipment and raw materials that exceed Tenaris’ internal requirements.
Corporate general and administrative expenses have been allocated to the Tubes segment.
Tenaris groups its geographical information in five areas: North America, South America, Europe, Middle East and Africa, and Far East and Oceania. For purposes of reporting geographical information, net sales are allocated to geographical areas based on the customer’s location; allocation of assets and capital expenditures and associated depreciation and amortization are based on the geographic location of the assets.
54
D Foreign currency translation
(1) Functional and presentation currency
IAS 21 (revised) defines the functional currency as the currency of the primary economic environment in which an entity operates.
The functional and presentation currency of the Company is the U.S. dollar. The U.S. dollar is the currency that best reflects the economic substance of the underlying events and circumstances relevant to Tenaris global operations.
Generally, the functional currency of the Company’s subsidiaries is the respective local currency. Tenaris argentine operations, however, which consist of Siderca S.A.I.C. (“Siderca”) and its argentine subsidiaries, have determined their functional currency to be the U.S. dollar, based on the following considerations:
| · | Sales are mainly negotiated, denominated and settled in U.S. dollars. If priced in a currency other than the U.S. dollar, the price considers exposure to fluctuation in the exchange rate versus the U.S. dollar; |
| · | Prices of critical raw materials and inputs are priced and settled in U.S. dollars; |
| · | The exchange rate of the currency of Argentina has long-been affected by recurring and severe economic crises; and |
| · | Net financial assets and liabilities are mainly received and maintained in U.S. dollars. |
In addition to Siderca, the Colombian subsidiaries and most of the Company’s distributing subsidiaries and intermediate holding subsidiaries have the U.S. dollar as their functional currency, reflecting the transaction environment and cash flow of these operations.
(2) Translation of financial information in currencies other than the functional currency
Results of operations for subsidiaries whose functional currencies are not the U.S. dollar are translated into U.S. dollars at the average exchange rates for each quarter of the year. Balance sheet positions are translated at the end-of-year exchange rates. Translation differences are recognized in a separate component of equity as currency translation adjustments. In the case of a sale or other disposal of any of such subsidiaries, any accumulated translation difference would be recognized in income as a gain or loss from the sale.
(3) Transactions in currencies other than the functional currency
Transactions in currencies other than the functional currency are accounted for at the exchange rates prevailing at the date of the transactions. Gains and losses resulting from the settlement of such transactions, including inter-company transactions, and from the translation of monetary assets and liabilities denominated in currencies other than the functional currency, are recorded as gains and losses from foreign exchange and included in Other Financial results in the Consolidated Income Statement.
E Property, plant and equipment
Property, plant and equipment are recognized at historical acquisition or construction cost less accumulated depreciation and impairment losses; historical cost includes expenditure that is directly attributable to the acquisition of the items. Property, plant and equipment acquired through acquisitions accounted for as business combinations have been valued initially at the fair market value of the assets acquired.
Major overhaul and rebuilding expenditures are capitalized as property, plant and equipment only when the investment enhances the condition of assets beyond its original condition. The carrying amount of the replaced part is derecognized.
Ordinary maintenance expenses on manufacturing properties are recorded as cost of products sold in the year in which they are incurred.
55
Borrowing costs that are attributable to the acquisition or construction of certain capital assets are capitalized as part of the cost of the asset, in accordance with IAS 23(R) (“Borrowing Costs”). Assets for which borrowing costs are capitalized are those that require a substantial period of time to prepare for their intended use.
Land is not depreciated. Depreciation on other assets is calculated using the straight-line method to depreciate the cost of each asset to its residual value over its estimated useful life, as follows:
| Buildings and improvements | 30-50 years | |
| Plant and production equipment | 10-20 years | |
| Vehicles, furniture and fixtures, and other equipment | 4-10 years |
The asset’s residual values and useful lives of significant plant and production equipment are reviewed, and adjusted if appropriate, at each year-end date.
Management’s re-estimation of assets useful lives, performed in accordance with IAS 16 (“Property plant and equipment”), did not materially affect depreciation expenses for 2009.
Tenaris depreciates each significant part of an item of property, plant and equipment for its different production facilities that (i) can be properly identified as an independent component with a cost that is significant in relation to the total cost of the item, and (ii) has a useful operating life that is different from another significant part of that same item of property, plant and equipment.
Gains and losses on disposals are determined by comparing the proceeds with the carrying amount of assets and are recognized under Other operating income or Other operating expenses in the Consolidated Income Statement.
F Intangible assets
(1) Goodwill
Goodwill represents the excess of the acquisition cost over the fair value of Tenaris’ share of net identifiable assets acquired as part of business combinations determined mainly by independent valuations. Goodwill is tested annually for impairment and carried at cost less accumulated impairment losses. Impairment losses on goodwill are not reversed. Goodwill is included on the Consolidated Statement of Financial Position under Intangible assets, net.
Goodwill is allocated to cash-generating units (“CGU’s”) for the purpose of impairment testing, which represents a subsidiary or group of subsidiaries that are expected to benefit from the business combination which generated the goodwill being tested.
(2) Information systems projects
Costs associated with developing or maintaining computer software programs are generally recognized as an expense as incurred. However, costs directly related to the development, acquisition and implementation of information systems are recognized as intangible assets if it is probable they have economic benefits exceeding one year.
Information systems projects recognized as assets are amortized using the straight-line method over their useful lives, not exceeding a period of 3 years. Amortization charges are classified as Selling, general and administrative expenses in the Consolidated Income Statement.
56
(3) Licenses, patents, trademarks and proprietary technology
Licenses, patents, trademarks, and proprietary technology acquired in a business combination are initially recognized at fair value at the acquisition date, and subsequently shown at historical cost.
Expenditures on acquired patents, trademarks, technology transfer and licenses are capitalized and amortized using the straight-line method over their estimated useful lives, not exceeding a period of 10 years.
The balance of acquired trademarks amounts to $88.0 million and $85.3 million at December 31, 2009 and 2008 respectively, have indefinite useful lives according to external appraisal. Main factors considered in the determination of the indefinite useful lives, include the years that they have been in service and their recognition among customers in the industry.
(4) Research and development
Research expenditures as well as development costs that do not fulfill the criteria for capitalization are recorded as Cost of sales in the Consolidated Income Statement as incurred. Research and development expenditures included in Cost of sales for the years 2009, 2008 and 2007 totaled $62.7 million, $77.3 million and $61.7 million, respectively.
| (5) | Customer relationships |
In accordance with IFRS 3 and IAS 38, Tenaris has recognized the value of customer relationships separately from goodwill attributable to the acquisition of Maverick and Hydril.
Customer relationships acquired in a business combination are recognized at fair value at the acquisition date. Customer relationships acquired in a business combination have a finite useful life and are carried at cost less accumulated amortization. Amortization is calculated using the straight line method over the expected life of approximately 14 years for Maverick and 10 years for Hydril.
G Impairment of non financial assets
Long-lived assets including identifiable intangible assets and goodwill are regularly reviewed for impairment.
Assets that are subject to amortization are reviewed for impairment whenever events or changes in circumstances indicate that the balance sheet carrying amount may not be recoverable.
Intangible assets with indefinite useful life, including goodwill, are subject to at least an annual impairment test.
The recoverable amount is the higher of an asset’s value in use and fair value less cost to sell.
Tenaris uses cash flow projections for a five year period with a terminal value calculated based on perpetuity. Management judgment is required to estimate discounted future cash flows and appropriate discount rates. Accordingly, actual cash flows and values could vary significantly from the forecasted future cash flows and related values derived using discounting techniques.
H Other investments
Other investments consist primarily of investments in financial debt instruments and time deposits with an original maturity of more than three months.
These investments are classified as financial assets “at fair value through profit or loss”.
Purchases and sales of financial investments are recognized as of the settlement date. The change in fair value of financial investments designated as held at fair value through profit or loss is charged to Financial results in the Consolidated Income Statement.
57
Results from financial investments are recognized in Financial Results in the Consolidated Income Statement.
The fair values of quoted investments are based on current bid prices. If the market for a financial investment is not active or the securities are not listed, Tenaris estimates the fair value by using standard valuation techniques (see Section III Financial Risk Management).
I Inventories
Inventories are stated at the lower of cost (calculated principally on the first-in-first-out “FIFO” method) and net realizable value. The cost of finished goods and goods in process is comprised of raw materials, direct labor, other direct costs and related production overhead costs. Tenaris estimates net realizable value of inventories by grouping, where applicable, similar or related items. Net realizable value is the estimated selling price in the ordinary course of business, less any estimated costs of completion and selling expenses. Goods in transit at year end are valued based on supplier’s invoice cost.
Tenaris establishes an allowance for obsolete or slow-moving inventory related to finished goods, supplies and spare parts. For slow moving or obsolete finished products, an allowance is established based on management’s analysis of product aging. An allowance for slow-moving inventory of supplies and spare parts is established based on management's analysis of such items to be used as intended and the consideration of potential obsolescence due to technological changes.
J Trade and other receivables
Trade and other receivables are recognized initially at fair value, generally the original invoice amount. Tenaris analyzes its trade accounts receivable on a regular basis and, when aware of a specific counterparty’s difficulty or inability to meet its obligations to Tenaris, impairs any amounts due by means of a charge to an allowance for doubtful accounts receivable. Additionally, this allowance is adjusted periodically based on the aging of receivables.
K Cash and cash equivalents
Cash and cash equivalents are comprised of cash in banks, short-term money market funds and highly liquid short-term securities with a maturity of less than three months at the date of purchase. Assets recorded in cash and cash equivalents are carried at fair market value or at historical cost which approximates fair market value.
For the purposes of the Consolidated Statement of Cash Flows, cash and cash equivalents is comprised of cash, bank accounts and short-term highly liquid investments and overdrafts.
On the Consolidated Statement of Financial Position, bank overdrafts are included in Borrowings in current liabilities.
L Equity
(1) Equity components
The Consolidated Statement of Changes in Equity includes:
| · | The value of share capital, legal reserve, share premium and other distributable reserve calculated in accordance with Luxembourg Law; |
| · | The currency translation adjustment, other reserves, retained earnings and minority interest calculated in accordance with IFRS. |
(2) Share capital
Total ordinary shares issued and outstanding as of December 31, 2009, 2008 and 2007 are 1,180,536,830 with a par value of $1.00 per share with one vote each. All issued shares are fully paid.
58
(3) Dividends distribution by the Company to shareholders
Dividends distributions are recorded in the Company’s financial statements when Company’s shareholders have the right to receive the payment, or when interim dividends are approved by the Board of Directors in accordance with the by-laws of the Company.
Dividends may be paid by the Company to the extent that it has distributable retained earnings, calculated in accordance with Luxembourg law. As a result, retained earnings included in the Consolidated Financial Statements may not be wholly distributable (see Note 26).
M Borrowings
Borrowings are recognized initially at fair value net of transaction costs incurred. In subsequent years, borrowings are stated at amortized cost.
N Current and Deferred income tax
Under present Luxembourg law, the Company is not subject to income tax, withholding tax on dividends paid to shareholders or capital gains tax payable in Luxembourg as long as the Company maintains its status as a “1929 Holding Billionaire Company”. Following a previously announced decision by the European Commission, the Grand-Duchy of Luxembourg has terminated its 1929 holding company regime, effective January 1, 2007. However, under the implementing legislation, pre-existing publicly listed companies -including the Company- will be entitled to continue benefiting from their current tax regime until December 31, 2010.
The tax expense for the period comprises current and deferred tax. Tax is recognized in the Consolidated Income Statement, except to the extent that it relates to items recognized in the Consolidated Statement of Other Comprehensive Income. In this case, the tax is also recognized in the Consolidated Statement of Other Comprehensive Income.
The current income tax charge is calculated on the basis of the tax laws in effect in the countries where the Company’s subsidiaries operate and generate taxable income. Management periodically evaluates positions taken in tax returns with respect to situations in which applicable tax regulations are subject to interpretation and establishes provisions when appropriate.
Deferred income tax is recognized applying the liability method on temporary differences arising between the tax basis of assets and liabilities and their carrying amounts in the financial statements. The principal temporary differences arise from fair value adjustments of assets acquired in business combinations, the effect of currency translation on fixed assets, depreciation on property, plant and equipment, valuation of inventories and provisions for pension plans. Deferred tax assets are also recognized for net operating loss carry-forwards. Deferred tax assets and liabilities are measured at the tax rates that are expected to apply in the time period when the asset is realized or the liability is settled, based on tax laws that have been enacted or substantively enacted by the balance sheet date.
Deferred tax assets are recognized to the extent it is probable that future taxable income will be available against which the temporary differences can be utilized.
O Employee benefits
(a) Employee severance indemnity
Employee severance indemnity costs are assessed annually using the projected unit credit method. Employee severance indemnity obligations are measured at the present value of the estimated future cash outflows, based on actuarial calculations provided by independent advisors and in accordance with current legislation and labor contracts in effect in each respective country. The cost of this obligation is charged to the Consolidated Income Statement over the expected service lives of employees.
59
This provision is primarily related to the liability accrued for employees at Tenaris’ Italian and Mexican subsidiaries.
As from January 1, 2007 as a consequence of a change in an Italian law, employees were entitled to make contributions to external funds or to maintain the contributions within the company. If the employee chooses to make contributions to the external funds Tenaris’ Italian subsidiary pays every year the matured contribution to the funds and no more obligation will be in charge of it. As a consequence of the abovementioned, the structure of the plan could be changed from a defined benefit plan to a defined contribution plan effective from the date of the choice, but only limited to the contributions of 2007 onwards.
(b) Defined benefit pension obligations
Defined benefit plans determine an amount of pension benefit that an employee will receive on retirement, usually dependent on one or more factors such as age, years of service and compensation.
The liability recognized in the Consolidated Statement of Financial Position in respect of defined benefit pension plans is the present value of the defined benefit obligation at the end of the reporting year less the fair value of plan assets together with adjustments for unrecognized past-service costs and unrecognized actuarial gains and losses. Post-retirement obligations are measured at the present value of the estimated future cash outflows. The present value of the defined benefit pension obligation is calculated, at least annually by independent advisors using the projected unit credit method based on actuarial calculations provided by independent advisors.
Certain officers of Tenaris are covered by defined benefit employee retirement plans designed to provide post-retirement and other benefits.
Benefits under this plan are provided in U.S. dollars, and are calculated based on seven-year salary averages. Tenaris accumulates assets for the payment of benefits expected to be disbursed by this plan in the form of investments that are subject to time limitations for redemption. These investments are neither part of a specific pension plan nor are they segregated from Tenaris’ other assets. As a result, this plan is considered to be “unfunded” under IFRS definitions.
Tenaris sponsors other four funded and unfunded non-contributory defined benefit pension plans in certain subsidiaries. The plans provide defined benefits based on years of service and, in the case of salaried employees, final average salary.
All of Tenaris’ plans recognize actuarial gains and losses over the average remaining service lives of employees.
(c) Other compensation obligations
Employee entitlements to annual leave and long-service leave are accrued as earned.
Other length of service based compensation to employees in the event of dismissal or death is charged to income in the year in which it becomes payable.
(d) Employee retention and long term incentive program
On January 1, 2007 Tenaris adopted an employee retention and long term incentive program. Pursuant to this program, certain senior executives will be granted with a number of units’ equivalent in value to the equity book value per share (excluding minority interest). The units will be vested over four years period and Tenaris will redeem vested units following a period of seven years from the grant date, or when the employee ceases employment, at the equity book value per share at the time of payment. Beneficiaries will also receive a cash amount per unit equivalent to the dividend paid per share whenever the Company pays a cash dividend to its shareholders.
60
Annual compensation under this program is not expected to exceed 35% in average of the total annual compensation of the beneficiaries.
The total value of the units granted to date under the program, considering the number of units and the book value per share amounts to $27.6 million and $16.8 million at December 31, 2009 and 2008, respectively. As of December 31, 2009, and 2008 Tenaris has recorded a total liability of $19.6 million and $10.4 million, respectively, based on actuarial calculations provided by independent advisors.
P Employee statutory profit sharing
Under Mexican law, the Company’s Mexican subsidiaries are required to pay to their employees an annual benefit calculated on a similar basis to that used for local income tax purposes. Employee statutory profit sharing is calculated using the liability method, and is recorded in Current other liabilities and Non-current other liabilities in the Consolidated Statement of Financial Position. Because Mexican employee statutory profit sharing is determined on a similar basis to that used for determining local income taxes, Tenaris accounts for temporary differences arising between the statutory calculation and reported expense as determined under IFRS in a manner similar to the calculation of deferred income tax.
Q Provisions
Tenaris is subject to various claims, lawsuits and other legal proceedings, including customer claims, in which a third party is seeking payment for alleged damages, reimbursement for losses or indemnity. Tenaris’ potential liability with respect to such claims, lawsuits and other legal proceedings cannot be estimated with certainty. Management periodically reviews the status of each significant matter and assesses potential financial exposure. If a potential loss from a claim or proceeding is considered probable and the amount can be reasonably estimated, a provision is recorded. Accruals for loss contingencies reflect a reasonable estimate of the losses to be incurred based on information available to management as of the date of preparation of the financial statements, and take into consideration Tenaris’ litigation and settlement strategies. These estimates are primarily constructed with the assistance of legal counsel. As the scope of liabilities become better defined, there may be changes in the estimates of future costs which could have a material adverse effect on its results of operations, financial condition and net worth.
If Tenaris expects to be reimbursed for an accrued expense, as would be the case for an expense or loss covered under an insurance contract, and reimbursement is considered virtually certain, the expected reimbursement is recognized as a receivable.
R Trade payables
Trade payables are recognized initially at fair value and subsequently measured at amortized cost.
S Revenue recognition
Revenue comprises the fair value of the consideration received or receivable for the sale of goods and services in the ordinary course of Tenaris’ activities. Revenue is shown net of value-added tax, returns, rebates and discounts and after eliminating sales within the group.
Tenaris’ products and services are sold based upon purchase orders, contracts or upon other persuasive evidence of an arrangement with customers, including that the sales price is known or determinable. Sales are recognized as revenue upon delivery and when collection is reasonably assured. Delivery is defined by the transfer of risk, provision of sales contracts and may include delivery to a storage facility located at one of the Company’s subsidiaries.
Other revenues earned by Tenaris are recognized on the following bases:
| · | Interest income: on the effective yield basis. |
| · | Dividend income from investments in other companies: when Tenaris’ right to receive payment is established. |
61
T Cost of sales and sales expenses
Cost of sales and sales expenses are recognized in the Consolidated Income Statement on the accrual basis of accounting.
Commissions, freight and other selling expenses, including shipping and handling costs, are recorded in Selling, general and administrative expenses in the Consolidated Income Statement.
U Earnings per share
Earnings per share are calculated by dividing the income attributable to equity holders of the Company by the daily weighted average number of common shares outstanding during the year.
V Financial instruments
Non derivative financial instruments comprise investment in equity and debt securities, trade and other receivables, cash and cash equivalents, borrowings, and trade and other payables. Tenaris non derivative financial instruments are classified into the following categories:
| · | Financial instruments at fair value through profit and loss: comprises mainly cash and cash equivalents and investments in debt securities held for trading. |
| · | Loans and receivables: measured at amortized cost using the effective interest rate method less any impairment. |
| · | Available for sale assets: See Note 32 (b) |
| · | Other financial liabilities: measured at amortized cost using the effective interest rate method. |
The classification depends on the nature and purpose of the financial instrument and is determined at the time of initial recognition.
Financial assets and liabilities are recognized and derecognized on the settlement date.
Accounting for derivative financial instruments and hedging activities is included within the Section III, Financial Risk Management.
Tenaris has identified certain embedded derivatives and in accordance with IAS 39 (“Financial Instruments: Recognition and Measurement”) has accounted them separately from their host contracts. This result has been recognized under “Foreign exchange derivatives contracts results”.
III. FINANCIAL RISK MANAGEMENT
The multinational nature of Tenaris’ operations and customer base expose the Company to a variety of risks, mainly related to market risks (including the effects of changes in foreign currency exchange rates and interest rates) and capital risk. To manage the volatility related to these exposures, management evaluates exposures on a consolidated basis to take advantage of logical exposure netting. For the remaining exposures, the Company or its subsidiaries may enter into various derivative transactions in order to manage potential adverse impacts on the Tenaris’ financial performance. Such derivative transactions are executed in accordance with internal policies in areas such as counterparty exposure and hedging practices.
A. Financial Risk Factors
(i) Capital Risk
Tenaris seeks to maintain an adequate debt to total equity ratio considering the industry and the markets where it operates. The year end ratio of debt to total equity (where “debt” comprises financial borrowings and “equity” is the sum of financial borrowings and equity) is 0.13 as of December 31, 2009, in comparison with 0.25 as of December 31, 2008. The Company does not have to comply with regulatory capital adequacy requirements as known in the financial services industry.
62
(ii) Foreign exchange risk
Tenaris manufactures and sells its products in a number of countries throughout the world and consequently is exposed to foreign exchange rate risk. Since the Company’s functional currency is the U.S. dollar the purpose of Tenaris’ foreign currency hedging program is mainly to reduce the risk caused by changes in exchange rates against the U.S. dollar.
Tenaris’ exposure to currency fluctuations is reviewed on a periodic basis. A number of derivative transactions are performed in order to achieve an efficient coverage. Almost all of these hedging transactions are forward exchange rates contracts (see Note 25 Derivative financial instruments).
Tenaris does not hold or issue derivative financial instruments for speculative trading purposes.
Because a number of subsidiaries have functional currencies other than the U.S. dollar, the results of hedging activities, reported in accordance with IFRS, may not reflect management’s assessment of its foreign exchange risk hedging program. Inter-company balances between Tenaris subsidiaries may generate financial gains (losses) to the extent that functional currencies differ.
The following table shows a breakdown of Tenaris’ assessed long / (short) balance sheet exposure to currency risk as of December 31, 2009, including the effect of forward exchange rate contracts in place. These balances also include inter-company positions where the intervening parties have different functional currencies.
| Monetary position | Functional Currency (in thousand $) | ||||||||
| exposure | USD | EUR | MXN | GBP | BRL | JPY | CAD | RON | CNY |
| USD | (n/a) | (211,143) | (183,143) | (417) | 393,521 | 89,911 | 211,236 | 5,369 | (34,706) |
| EUR | (22,113) | (n/a) | 32,236 | - | 361 | (489) | (115) | (11,311) | 1 |
| MXN | (1) | - | (n/a) | - | - | - | - | - | - |
| GBP | 2,291 | (2,642) | (18) | (n/a) | - | (100) | - | 686 | - |
| BRL | - | - | - | - | (n/a) | - | - | - | - |
| JPY | 344 | (49) | (3) | - | - | (n/a) | - | - | (1,782) |
| CAD | (67,972) | - | 136 | - | 1,476 | (19) | (n/a) | - | - |
| RON | (4,017) | - | - | - | - | - | - | (n/a) | - |
| VEF | (731) | - | - | - | - | - | - | - | - |
| ARS | (74,527) | - | - | - | - | - | - | - | - |
| Other | 10,285 | (7) | - | - | - | - | - | - | - |
The Company estimates that the impact under IFRS in the net exposure at December 31, 2009 of a simultaneous 1% favorable / unfavorable movement in the main exchange rates would result in a maximum pre-tax gain / loss of approximately $12.6 million as compared with a maximum pre-tax gain / loss of approximately $15.8 million at December 31, 2008.
Considering the above mentioned assumptions the maximum effect in equity originated in monetary assets and liabilities would result in approximately $4.3 million and $7.8 million for 2009 and 2008, respectively.
Additionally, the Company has recognized an embedded derivative in connection to a ten year steel supply agreement signed in 2007 by a Canadian subsidiary which as of December 31, 2009 has an estimated outstanding amount of $275.8 million. The Company estimates that the impact of 1% favorable / unfavorable movement in USD/CAD the exchange rate would result in a maximum pre-tax gain / loss of approximately $2.4 million. See fair value of this embedded derivative in Note 25.
63
| (iii) | Interest rate risk |
The following table summarizes the proportions of variable-rate and fixed-rate debt as of each year end (see Note 25 Derivative financial instruments).
| As of December 31, | ||||||||||||||||
| 2009 | 2008 | |||||||||||||||
| Amount in million of $ | Percentage | Amount in million of $ | Percentage | |||||||||||||
| Fixed rate | 287.7 | 20 | % | 222.9 | 7 | % | ||||||||||
| Variable rate | 1,159.1 | 80 | % | 2,754.1 | 93 | % | ||||||||||
Considering the above, if interest rates on the aggregate average notional of variable rate borrowings held during 2009, would have been 100 basis points higher with all other variables held constant, total profit for the year ended December 31, 2009 would have been $19.3 million lower.
Tenaris’ financing strategy is to manage interest expense using a mixture of fixed-rate and variable-rate debt.
In order to partially hedge future interest payments related to long-term debt, as well as to convert borrowings from floating to fixed rates, Tenaris has entered into interest rate swaps and swaps with an embedded knock-in option (See Note 25).
(iv) Credit risk
Credit risk arises from cash and cash equivalents, deposits with banks and financial institutions, as well as credit exposures to customers, including outstanding receivables and committed transactions. The Company has established credit guidelines in place to ensure that derivative and treasury counterparties are limited to high credit quality financial institutions.
There is no significant concentration of credit risk from customers. No single customer comprised more than 10% of Tenaris’ net sales in 2009 and 2008.
Tenaris’ credit policies related to sales of products and services are designed to identify customers with acceptable credit history, and to allow Tenaris to require the use of credit insurance, letters of credit and other instruments designed to minimize credit risks whenever deemed necessary. Tenaris maintains allowances for impairment for potential credit losses (See Section II J).
As of December 31, 2009 trade receivables amount to $1,310.3 million. These trade receivables have guarantees under letter of credit and other bank guarantees of $222.6 million, credit insurance of $317.7 million and other guarantees of $48.6 million.
As of December 31, 2009 trade receivables amounting to $274.1 million were past due but not impaired. These relate to a number of customers for whom there is no recent history of default.
The amount of the allowance for doubtful accounts was $40.2 million as of December 31, 2009. This allowance for doubtful accounts and the existing guarantees are sufficient to cover doubtful overdue trade receivables.
(v) Counterparty risk
Tenaris has investments guidelines with specific parameters to limit issuer risk on marketable securities and counterparty risk on financial institutions. Derivative counterparties and cash transactions are limited to high credit quality financial institutions, normally investment grade.
More than 97.5% of Tenaris’ liquid financial assets correspond to Investment Grade-rated instruments as of December 31, 2009, in comparison with 94.9% as of December 31,2008.
64
(vi) Liquidity risk
Tenaris has a conservative approach to the management of its liquidity, which consists of cash and cash equivalents, comprising cash in banks, short-term money market funds and highly liquid short-term securities with a maturity of no more than three months at the date of purchase.
Tenaris holds primarily liquidity money market investments and variable or fixed-rate securities from investment grade issuers. Tenaris holds its cash and cash equivalents primarily in U.S. dollar. As of December 31, 2009 and 2008, U.S. dollar denominated liquid assets represented around 82% and 70% of total liquid financial assets respectively. Liquid financial assets as a whole (excluding Available for sale assets) were 15.8% of total assets at the end of 2009 compared to 10.2% at the end of 2008.
Tenaris financing strategy is to maintain adequate financial resources and access to additional liquidity. During 2009, Tenaris has counted on cash flows from operations as well as additional bank financing to fund its transactions.
Management maintains sufficient cash and marketable securities to finance normal operations and believes that Tenaris also has access to market for short-term working capital needs.
B. Financial instruments by category
The accounting policies for financial instruments have been applied to the line items below:
| December 31, 2009 | Assets at fair value through profit and loss | Loans and receivables | Available for sale | Total | ||||||||||||
| Assets as per balance sheet | ||||||||||||||||
| Derivative financial instruments | 16,873 | - | - | 16,873 | ||||||||||||
| Trade receivables | - | 1,310,302 | - | 1,310,302 | ||||||||||||
| Other receivables | - | 102,348 | - | 102,348 | ||||||||||||
| Available for sale assets | - | - | 21,572 | 21,572 | ||||||||||||
| Other investments | 613,842 | - | - | 613,842 | ||||||||||||
| Cash and cash equivalents | 1,542,829 | - | - | 1,542,829 | ||||||||||||
| Total | 2,173,544 | 1,412,650 | 21,572 | 3,607,766 | ||||||||||||
| Liabilities at fair value through profit and loss | Other financial liabilities | Total | ||||||||||
| December 31, 2009 | ||||||||||||
| Liabilities as per balance sheet | ||||||||||||
| Borrowings | - | 1,446,764 | 1,446,764 | |||||||||
| Derivative financial instruments | 23,990 | - | 23,990 | |||||||||
| Trade and other payables (*) | - | 596,897 | 596,897 | |||||||||
| Total | 23,990 | 2,043,661 | 2,067,651 | |||||||||
| December 31, 2008 | Assets at fair value through profit and loss | Loans and receivables | Total | |||||||||
| Assets as per balance sheet | ||||||||||||
| Derivative financial instruments | 41,509 | - | 41,509 | |||||||||
| Trade receivables | - | 2,123,296 | 2,123,296 | |||||||||
| Other receivables | - | 97,683 | 97,683 | |||||||||
| Other investments | 84,218 | - | 84,218 | |||||||||
| Cash and cash equivalents | 1,538,769 | - | 1,538,769 | |||||||||
| Total | 1,664,496 | 2,220,979 | 3,885,475 | |||||||||
65
| Liabilities at fair value through profit and loss | Other financial liabilities | Total | ||||||||||
| December 31, 2008 | ||||||||||||
| Liabilities as per balance sheet | ||||||||||||
| Borrowings | - | 2,977,015 | 2,977,015 | |||||||||
| Derivative financial instruments | 77,792 | - | 77,792 | |||||||||
| Trade and other payables (*) | - | 952,660 | 952,660 | |||||||||
| Total | 77,792 | 3,929,675 | 4,007,467 | |||||||||
(*) The maturity of trade payables is of one year or less.
C. Fair value by hierarchy
Effective 1 January 2009, Tenaris adopted the amendment to IFRS 7 for financial instruments that are measured in the balance sheet at fair value, which requires disclosure of fair value measurements by level of the following fair value measurement hierarchy:
Level 1- Quoted prices (unadjusted) in active markets for identical assets or liabilities.
Level 2- Inputs other than quoted prices included within level 1 that are observable for the asset or liability, either directly (that is, as prices) or indirectly (that is, derived from prices).
Level 3- Inputs for the asset or liability that are not based on observable market data (that is, unobservable inputs).
Comparative information is not presented for the first year of application, as permitted by the transitional provisions of the standard.
The following table presents the assets and liabilities that are measured at fair value at 31 December 2009.
| Level 1 | Level 2 | Level 3 | Total | |||||||||||||
| Assets | ||||||||||||||||
| Cash and cash equivalents | 1,542,829 | - | - | 1,542,829 | ||||||||||||
| Other investments | 456,209 | 155,137 | 2,496 | 613,842 | ||||||||||||
| Foreign exchange derivatives contracts | - | 16,873 | - | 16,873 | ||||||||||||
| Available for sale assets* | - | - | 21,572 | 21,572 | ||||||||||||
| Total | 1,999,038 | 172,010 | 24,068 | 2,195,116 | ||||||||||||
| Liabilities | ||||||||||||||||
| Foreign exchange derivatives contracts | - | 3,434 | - | 3,434 | ||||||||||||
| Interest rate derivatives financial instruments | - | 17,738 | - | 17,738 | ||||||||||||
| Embedded derivative (See Note 25) | - | - | 2,818 | 2,818 | ||||||||||||
| Total | - | 21,172 | 2,818 | 23,990 | ||||||||||||
* For further detail regarding Available for sale assets, see Note 32 (b).
The fair value of financial instruments traded in active markets is based on quoted market prices at the balance sheet date. A market is regarded as active if quoted prices are readily and regularly available from an exchange, dealer, broker, industry group, pricing service, or regulatory agency, and those prices represent actual and regularly occurring market transactions on an arm’s length basis. The quoted market price used for financial assets held by Tenaris is the current bid price. These instruments are included in level 1 and comprise primary corporate and sovereign debt securities.
66
The fair value of financial instruments that are not traded in an active market (such as certain debt securities, certificates of deposits with original maturity of more than three months, forward and interest rate derivative instruments) is determined by using valuation techniques. These valuation techniques maximize the use of observable market data where it is available and rely as little as possible on entity specific estimates. If all significant inputs required to value an instrument are observable, the instrument is included in level 2.
If one or more of the significant inputs is not based on observable market data, the instruments are included in level 3. The following table presents the changes in level 3 assets and liabilities:
| Year ended December 31, 2009 | ||||||||
| Assets | Liabilities | |||||||
| At the beginning of the year | 12,370 | (30,758 | ) | |||||
| Available for sale assets | 11,578 | - | ||||||
| Gain for the year | - | 27,940 | ||||||
| Currency translation adjustment | 120 | - | ||||||
| At the end of the year | 24,068 | (2,818 | ) | |||||
D. Fair value estimation
The paragraphs below describe the fair value estimation for significant financial instruments included in different categories than those valued at fair value through profit and loss.
The carrying amount of financial assets and liabilities with maturities of less than one year approximates to their fair value.
Since most of the Company’s cash and marketable securities are short-term instruments, a change of 50 basis points in the reference interest rates would not have a significant impact in the fair value of financial assets.
Most borrowings are comprised of variable rate debt with a short term portion where interest has already been fixed. Tenaris estimates that the fair value of its main financial liabilities is approximately 99.0% of its carrying amount including interests accrued in 2009 as compared with 98.9% in 2008. Tenaris estimates that a change of 50 basis points in the reference interest rates would have an estimated impact of less than 0.1% in the fair value of borrowings as of December 31, 2009 and 0.1% in 2008. Fair values were calculated using standard valuation techniques for floating rate instruments and comparable market rates for discounting flows.
Specific derivative instruments are priced using valuation tools in order to obtain market values.
E. Accounting for derivative financial instruments and hedging activities
Derivative financial instruments are initially recognized in the balance sheet at fair value on the date a derivative contract is entered into and are subsequently remeasured at fair value. Specific tools are used for calculation of each instrument’s fair value and these tools are tested for consistency on a quarterly basis. Market rates are used for all pricing operations. These include exchange rates, deposit rates and other discount rates matching the nature of each underlying risk.
As a general rule, Tenaris recognizes the full amount related to the change in fair value of derivative financial instruments in Financial results in the Consolidated Income Statement.
Tenaris designates certain derivatives as hedges of a particular risk associated with a recognized asset or liability or a highly probable forecast transaction. These transactions are classified as cash flow hedges (mainly currency forward contracts on highly probable forecast transactions and interest rate swaps). The effective portion of the fair value of derivatives that are designated and qualify as cash flow hedges is recognized in equity. Amounts accumulated in equity are recognized in the income statement in the same period than offsetting losses and gains on the hedged item. The gain or loss relating to the ineffective portion is recognized immediately in the income statement. The fair value of Tenaris derivative financial instruments (asset or liability) continues to be reflected on the balance sheet.
67
For transactions designated and qualifying for hedge accounting, Tenaris documents at the inception of the transaction the relationship between hedging instruments and hedged items, as well as its risk management objectives and strategy for undertaking various hedge transactions. At December 31, 2009, the effective portion of designated cash flow hedges amounts to $16.7 million, not including tax effect, and is included in Other Reserves in equity (see Note 25 Derivative financial instruments). Tenaris also documents its assessment on an ongoing basis, of whether the derivatives that are used in hedging transactions are highly effective in offsetting changes in fair values or cash flow of hedged items.
The fair values of various derivative instruments used for hedging purposes are disclosed in Note 25. Movements in the hedging reserve included within Other Reserves in equity are also shown in Note 25. The full fair value of a hedging derivative is classified as a non current asset or liability when the remaining hedged item is more than 12 months and as a current asset or liability when the remaining maturity of the hedged item is less than 12 months.
68
IV. OTHER NOTES TO THE CONSOLIDATED FINANCIAL STATEMENTS
(In the notes all amounts are shown in thousands of U.S. dollars, unless otherwise stated)
1 Segment information
Reportable operating segments
| (all amounts in thousands of U.S. dollars) | Tubes | Projects | Other | Unallocated (**) | Total Continuing operations | Total Discontinued operations (*) | ||||||||||||||||||
| Year ended December 31, 2009 | ||||||||||||||||||||||||
| Net sales | 6,670,929 | 986,548 | 491,843 | - | 8,149,320 | 18,558 | ||||||||||||||||||
| Cost of sales | (3,769,895 | ) | (704,238 | ) | (390,789 | ) | - | (4,864,922 | ) | (31,866 | ) | |||||||||||||
| Gross profit | 2,901,034 | 282,310 | 101,054 | - | 3,284,398 | (13,308 | ) | |||||||||||||||||
| Selling, general and administrative expenses | (1,325,441 | ) | (75,841 | ) | (72,509 | ) | - | (1,473,791 | ) | (9,540 | ) | |||||||||||||
| Other operating income (expenses), net | 1,249 | 2,165 | (414 | ) | - | 3,000 | (179 | ) | ||||||||||||||||
| Operating income | 1,576,842 | 208,634 | 28,131 | - | 1,813,607 | (23,027 | ) | |||||||||||||||||
| Segment assets | 11,365,861 | 971,783 | 521,520 | 624,144 | 13,483,308 | - | ||||||||||||||||||
| Segment liabilities | 3,463,294 | 234,549 | 64,629 | - | 3,762,472 | - | ||||||||||||||||||
| Capital expenditures | 425,545 | 30,820 | 4,562 | - | 460,927 | - | ||||||||||||||||||
| Depreciation and amortization | 464,841 | 18,593 | 21,403 | - | 504,837 | 27 | ||||||||||||||||||
| Year ended December 31, 2008 | ||||||||||||||||||||||||
| Net sales | 10,010,066 | 1,270,915 | 706,779 | - | 11,987,760 | 242,464 | ||||||||||||||||||
| Cost of sales | (5,300,257 | ) | (883,534 | ) | (514,494 | ) | - | (6,698,285 | ) | (158,616 | ) | |||||||||||||
| Gross profit | 4,709,809 | 387,381 | 192,285 | - | 5,289,475 | 83,848 | ||||||||||||||||||
| Selling, general and administrative expenses | (1,549,466 | ) | (136,923 | ) | (101,563 | ) | - | (1,787,952 | ) | (44,858 | ) | |||||||||||||
| Other operating income (expenses), net | (333,302 | ) | (1,415 | ) | (41,156 | ) | - | (375,873 | ) | (109,770 | ) | |||||||||||||
| Operating income | 2,827,041 | 249,043 | 49,566 | - | 3,125,650 | (70,780 | ) | |||||||||||||||||
| Segment assets | 13,154,333 | 941,519 | 477,853 | 527,007 | 15,100,712 | - | ||||||||||||||||||
| Segment liabilities | 5,860,736 | 377,497 | 160,592 | - | 6,398,825 | - | ||||||||||||||||||
| Capital expenditures | 412,298 | 17,284 | 13,656 | - | 443,238 | 3,429 | ||||||||||||||||||
| Depreciation and amortization | 481,953 | 20,084 | 22,426 | - | 524,463 | 17,436 | ||||||||||||||||||
| Impairment charge | 354,905 | - | 39,347 | - | 394,252 | 108,647 | ||||||||||||||||||
| Year ended December 31, 2007 | ||||||||||||||||||||||||
| Net sales | 8,433,166 | 876,289 | 564,857 | - | 9,874,312 | 405,916 | ||||||||||||||||||
| Cost of sales | (4,360,781 | ) | (620,836 | ) | (427,367 | ) | - | (5,408,984 | ) | (264,139 | ) | |||||||||||||
| Gross profit | 4,072,385 | 255,453 | 137,490 | - | 4,465,328 | 141,777 | ||||||||||||||||||
| Selling, general and administrative expenses | (1,373,773 | ) | (94,702 | ) | (83,361 | ) | - | (1,551,836 | ) | (58,554 | ) | |||||||||||||
| Other operating income (expenses), net | (19,611 | ) | 24,089 | (998 | ) | - | 3,480 | 1,022 | ||||||||||||||||
| Operating income | 2,679,001 | 184,840 | 53,131 | - | 2,916,972 | 84,245 | ||||||||||||||||||
| Segment assets | 12,453,156 | 1,085,254 | 545,663 | 509,354 | 14,593,427 | 651,160 | ||||||||||||||||||
| Segment liabilities | 6,727,523 | 579,376 | 140,796 | - | 7,447,695 | 267,042 | ||||||||||||||||||
| Capital expenditures | 404,545 | 17,969 | 16,822 | - | 439,336 | 8,581 | ||||||||||||||||||
| Depreciation and amortization | 443,712 | 19,563 | 20,956 | - | 484,231 | 30,589 | ||||||||||||||||||
Transactions between segments, which were eliminated in consolidation, include sales of scrap and pipe protectors from the Other segment to the Tubes segment for $113,408, $191,036 and $109,574 in 2009, 2008 and 2007, respectively.
69
1 Segment information (Cont.)
Geographical information
| (all amounts in thousands of U.S. dollars) | North America | South America | Europe | Middle East & Africa | Far East & Oceania | Unallocated (**) | Total Continuing operations | Total Discontinued operations (*) | ||||||||||||||||||||||||
| Year ended December 31, 2009 | ||||||||||||||||||||||||||||||||
| Net sales | 2,891,523 | 2,285,677 | 866,692 | 1,623,541 | 481,887 | - | 8,149,320 | 18,558 | ||||||||||||||||||||||||
| Total assets | 6,722,816 | 2,790,249 | 2,469,042 | 386,242 | 490,815 | 624,144 | 13,483,308 | - | ||||||||||||||||||||||||
| Trade receivables | 344,548 | 361,976 | 235,708 | 327,924 | 40,146 | - | 1,310,302 | - | ||||||||||||||||||||||||
| Property, plant and equipment, net | 1,387,146 | 826,028 | 864,612 | 14,357 | 162,444 | - | 3,254,587 | - | ||||||||||||||||||||||||
| Capital expenditures | 261,781 | 99,521 | 68,394 | 5,580 | 25,651 | - | 460,927 | - | ||||||||||||||||||||||||
| Depreciation and amortization | 272,677 | 100,089 | 108,770 | 1,367 | 21,934 | - | 504,837 | 27 | ||||||||||||||||||||||||
| Year ended December 31, 2008 | ||||||||||||||||||||||||||||||||
| Net sales | 4,809,330 | 2,815,578 | 1,824,684 | 1,810,695 | 727,473 | - | 11,987,760 | 242,464 | ||||||||||||||||||||||||
| Total assets | 7,083,508 | 3,460,729 | 3,033,555 | 436,179 | 559,734 | 527,007 | 15,100,712 | - | ||||||||||||||||||||||||
| Trade receivables | 786,867 | 432,987 | 379,794 | 386,786 | 136,862 | - | 2,123,296 | - | ||||||||||||||||||||||||
| Property, plant and equipment, net | 1,180,738 | 796,009 | 861,892 | 10,128 | 134,104 | - | 2,982,871 | - | ||||||||||||||||||||||||
| Capital expenditures | 159,990 | 141,174 | 101,050 | 6,705 | 34,319 | - | 443,238 | 3,429 | ||||||||||||||||||||||||
| Depreciation and amortization | 298,240 | 99,261 | 111,040 | 1,246 | 14,676 | - | 524,463 | 17,436 | ||||||||||||||||||||||||
| Year ended December 31, 2007 | ||||||||||||||||||||||||||||||||
| Net sales | 3,187,753 | 2,185,279 | 1,707,788 | 2,093,916 | 699,576 | - | 9,874,312 | 405,916 | ||||||||||||||||||||||||
| Total assets | 7,471,569 | 3,342,206 | 2,315,187 | 507,331 | 447,780 | 509,354 | 14,593,427 | 651,160 | ||||||||||||||||||||||||
| Trade receivables | 418,081 | 344,743 | 435,384 | 455,965 | 94,660 | - | 1,748,833 | 79,220 | ||||||||||||||||||||||||
| Property, plant and equipment, net | 1,349,863 | 906,211 | 913,642 | 4,672 | 94,619 | - | 3,269,007 | 63,629 | ||||||||||||||||||||||||
| Capital expenditures | 149,434 | 149,355 | 112,165 | 1,879 | 26,503 | - | 439,336 | 8,581 | ||||||||||||||||||||||||
| Depreciation and amortization | 283,358 | 102,518 | 87,311 | 1,139 | 9,905 | - | 484,231 | 30,589 | ||||||||||||||||||||||||
There are no revenues from external customers attributable to the Company’s country of incorporation (Luxembourg). For geographical information purposes, “North America” comprises Canada, Mexico and the USA; “South America” comprises principally Argentina, Brazil, Colombia, Ecuador and Venezuela; “Europe” comprises principally Italy, Norway, Romania and Russia; “Middle East and Africa” comprises principally Algeria, Angola, Iraq, Lybia, Nigeria and Saudi Arabia; “Far East and Oceania” comprises principally China, Indonesia and Japan.
(*) Corresponds to the Venezuelan Companies (years 2009, 2008 and 2007) and Pressure Control (years 2008 and 2007) operations (See Notes 29 and 32).
(**) Includes Investments in associated companies and Available for sale assets for $21.6 million in 2009 (See Note 32 (b)).
70
2 Cost of sales
| Year ended December 31, | ||||||||||||
| (all amounts in thousands of U.S. dollars) | 2009 | 2008 | 2007 | |||||||||
| Inventories at the beginning of the year | 3,091,401 | 2,598,856 | 2,372,308 | |||||||||
| Plus: Charges of the year | ||||||||||||
| Raw materials, energy, consumables and other | 1,948,596 | 5,430,147 | 4,183,577 | |||||||||
| Increase in inventory due to business combinations | 53,541 | - | 152,500 | |||||||||
| Services and fees | 240,346 | 395,104 | 392,531 | |||||||||
| Labor cost | 737,883 | 927,132 | 766,173 | |||||||||
| Depreciation of property, plant and equipment | 263,634 | 282,407 | 263,813 | |||||||||
| Amortization of intangible assets | 2,813 | 2,170 | 1,737 | |||||||||
| Maintenance expenses | 145,413 | 203,207 | 180,502 | |||||||||
| Provisions for contingencies | 1,984 | 12 | 3,191 | |||||||||
| Allowance for obsolescence | 89,041 | (2,055 | ) | 24,371 | ||||||||
| Taxes | 6,799 | 8,655 | 7,651 | |||||||||
| Other | 46,122 | 102,667 | 82,453 | |||||||||
| 3,536,172 | 7,349,446 | 6,058,499 | ||||||||||
| Deconsolidation / Transfer to assets held for sale | (43,726 | ) | - | (158,828 | ) | |||||||
| Less: Inventories at the end of the year | (1,687,059 | ) | (3,091,401 | ) | (2,598,856 | ) | ||||||
| 4,896,788 | 6,856,901 | 5,673,123 | ||||||||||
| From Discontinued operations | (31,866 | ) | (158,616 | ) | (264,139 | ) | ||||||
| 4,864,922 | 6,698,285 | 5,408,984 | ||||||||||
3 Selling, general and administrative expenses
| Year ended December 31, | ||||||||||||
| (all amounts in thousands of U.S. dollars) | 2009 | 2008 | 2007 | |||||||||
| Services and fees | 207,202 | 214,010 | 193,389 | |||||||||
| Labor cost | 407,235 | 447,150 | 402,919 | |||||||||
| Depreciation of property, plant and equipment | 14,524 | 12,096 | 13,272 | |||||||||
| Amortization of intangible assets | 223,893 | 245,226 | 235,998 | |||||||||
| Commissions, freight and other selling expenses | 368,451 | 571,823 | 462,640 | |||||||||
| Provisions for contingencies | 33,880 | 37,101 | 30,738 | |||||||||
| Allowances for doubtful accounts | 13,837 | 13,823 | 5,035 | |||||||||
| Taxes | 114,976 | 167,686 | 147,326 | |||||||||
| Other | 99,333 | 123,895 | 119,073 | |||||||||
| 1,483,331 | 1,832,810 | 1,610,390 | ||||||||||
| From Discontinued operations | (9,540 | ) | (44,858 | ) | (58,554 | ) | ||||||
| 1,473,791 | 1,787,952 | 1,551,836 | ||||||||||
71
4 Labor costs (included in Cost of sales and in Selling, general and administrative expenses)
| Year ended December 31, | ||||||||||||
| (all amounts in thousands of U.S. dollars) | 2009 | 2008 | 2007 | |||||||||
| Wages, salaries and social security costs | 1,113,757 | 1,347,667 | 1,139,587 | |||||||||
| Employees' severance indemnity | 13,436 | 19,168 | 10,931 | |||||||||
| Pension benefits - defined benefit plans | 8,734 | 8,161 | 7,454 | |||||||||
| Employee retention and long term incentive program | 9,191 | (714 | ) | 11,120 | ||||||||
| 1,145,118 | 1,374,282 | 1,169,092 | ||||||||||
| From Discontinued operations | (23,024 | ) | (55,835 | ) | (57,565 | ) | ||||||
| 1,122,094 | 1,318,447 | 1,111,527 | ||||||||||
5 Other operating items
| Year ended December 31, | |||||||||||||
| (all amounts in thousands of U.S. dollars) | 2009 | 2008 | 2007 | ||||||||||
| (i) | Other operating income | ||||||||||||
| Reimbursement from insurance companies and other third parties | 76 | 10,511 | 2,611 | ||||||||||
| Net income from other sales | 2,130 | 23,704 | 21,957 | ||||||||||
| Net rents | 3,538 | 1,971 | 2,437 | ||||||||||
| Other | 1,750 | - | 1,834 | ||||||||||
| 7,494 | 36,186 | 28,839 | |||||||||||
| From Discontinued operations | 179 | (1,046 | ) | (1,588 | ) | ||||||||
| 7,673 | 35,140 | 27,251 | |||||||||||
| (ii) | Other operating expenses | ||||||||||||
| Contributions to welfare projects and non-profits organizations | 2,758 | 2,871 | 2,283 | ||||||||||
| Provisions for legal claims and contingencies | - | (22 | ) | (51 | ) | ||||||||
| Loss on fixed assets and material supplies disposed / scrapped | 27 | 461 | 5,742 | ||||||||||
| Settlement of outstanding redemptions on Maverick’s 2005 notes | - | - | 10,275 | ||||||||||
| Loss from natural disasters | - | 1,743 | 5,693 | ||||||||||
| Allowance for doubtful receivables | 1,888 | (184 | ) | 395 | |||||||||
| Losses on prepayment to suppliers | - | 3,830 | - | ||||||||||
| Impairment charge | - | 502,899 | - | ||||||||||
| Other | - | 10,231 | - | ||||||||||
| 4,673 | 521,829 | 24,337 | |||||||||||
| From Discontinued operations | - | (110,816 | ) | (566 | ) | ||||||||
| 4,673 | 411,013 | 23,771 | |||||||||||
Impairment charge
Long-lived assets including identifiable intangible assets and goodwill are regularly reviewed for impairment.
Long-lived assets are tested for impairment whenever events or changes in circumstances indicate that the balance sheet carrying amount of an asset may not be recoverable. Intangible assets with indefinite useful life, including goodwill are subject to at least an annual impairment test.
The recoverable amount is the higher of the value in use and the fair value less cost to sell.
72
The present value of future cash flows involves highly sensitive estimates and assumptions specific to the nature of CGU’s activities such as the selected discount rate, the expected changes in market prices and the expected changes in the demand of Tenaris products and services.
Tenaris uses cash flow projections for a five year period with a terminal value calculated based on perpetuity.
The discount rates are the respective weighted average cost of capital (WACC) which is considered to be a good indicator of the capital cost. For each CGU where the assets are allocated a specific WACC was determined taking into account the industry, the country and the size of the business.
In 2008, Tenaris recorded an impairment charge of $502.9 million; of which $394.3 million corresponds to intangible assets originated in the acquisition of Maverick in 2006. This charge impacted the following CGU: OCTG (USA and Colombia), Coiled Tubing, Prudential (Canada) and Electric Conduits.
The pretax rates used in the calculation ranged from 11% to 14% per annum and for the cash flows beyond the fifth year an inflation and growth rate of 2% was considered.
These impairment charges primarily arose in connection with the Company’s operations in the United States and Canada, mainly due to recessionary environment, the abrupt decline in oil and gas prices, and its impact on drilling activity and therefore on demand for OCTG products.
In particular, the main factors that precipitated the impairment charges in the United States and Canada were the steep reduction in the average number of active oil and drilling rigs, or rig count, in these markets, which are sensitive to North American gas prices and the worldwide financial and economic crisis. In 2008, North American gas prices rose rapidly during the first half of the year, peaking in excess of $12 per million BTU, before falling even more steeply to levels below $4 per million BTU. This collapse in North American gas prices had an immediate effect on the U.S. and Canadian rig counts. The rig count in the United States, which is more sensitive to North American gas prices, increased 6% in 2008, compared to 2007, rising steadily in the first part of the year to peak at 2,031 during the month of September and falling in the fourth quarter to end the year at 1,623 (a 20% decrease over that period); by the end of March 2009, rig count in the United States had fallen to 1,039, an additional 36% decrease. This decrease in drilling activity and the high level of inventories put downward pressure on the tubes price.
Accordingly, in December 2008, the Company expected that the current decrease in apparent demand of OCTG products in North America would continue, due to the decline in oil and gas drilling activity and its customers’ efforts to reduce inventories.
Tenaris’ Venezuelan operations, today nationalized and consequently disclosed as discontinued operations, also contributed to this impairment charge of 2008. Although during the first half of 2008 most of the business indicators of the Venezuelan subsidiaries were favorable, in the second half of the year the steep decline in the prices of raw materials affected the operations of Matesi, a hot-briquetted iron producer; and the lower investments in drilling activity in Venezuela led to a decline in the projected sales in Tavsa. Also, the operating disruptions at the production facilities of each of Tenaris former subsidiaries, Matesi and Tavsa, precipitated this impairment charge.
At December 31, 2008, the carrying value of the total remaining assets (in thousand of U.S. dollars) of the impaired businesses was:
| Total Assets before impairment | Impairment | Total Assets after impairment (*) | ||||||||||
| Oil Country Tubular Goods ("OCTG") | 2,506,332 | (192,707 | ) | 2,313,625 | ||||||||
| Prudential | 736,772 | (138,466 | ) | 598,306 | ||||||||
| Coiled Tubing | 259,722 | (23,732 | ) | 235,990 | ||||||||
| Electric Conduits | 250,106 | (39,347 | ) | 210,759 | ||||||||
| Total U.S. and Canadian Operations | 3,752,932 | (394,252 | ) | 3,358,680 | ||||||||
| Venezuelan Operations | 266,758 | (108,647 | ) | 158,111 | ||||||||
| Total | 4,019,690 | (502,899 | ) | 3,516,791 | ||||||||
73
(*) These amounts include total assets of the operation (e.g. short and long lived assets), including goodwill and other intangible assets at December 31, 2008.
For the 2009 impairment tests, Tenaris considered that the activity levels will continue to recover, with better competitive conditions, and the rig counts and oil and gas prices in North America higher than those of 2009. Accordingly, no impairment charge was recorded in 2009 financial statements. The discount rates used for these tests were in a range between 10% and 13%, based on Tenaris’ weighted average cost of capital taking into account the industry, the country and the size of the business.
The main factors that could result in additional impairment charges in future periods in connection with the Company’s continuing operations would be an increase in the discount rate used in the Company’s cash flow projections and a further deterioration of the business, competitive and economic factors discussed in 2008, such as the cost of raw materials, oil and gas prices, competitive environment, capital expenditure program of our clients and the evolution of the rig count.
Had the Company used a discount rate 1% higher for its cash flow projections for its continuing operations, it would have suffered an impairment charge of approximately $152 million in 2009 and an additional $291 million in 2008. As there is a significant interaction of the main assumptions made in estimating its cash flow projections, Tenaris believes that any sensitivity analysis considering changes in one assumption at a time could potentially be misleading.
6 Financial results
| (all amounts in thousands of U.S. dollars) | Year ended December 31, | |||||||||||
| 2009 | 2008 | 2007 | ||||||||||
| Interest income | 30,986 | 49,114 | 93,458 | |||||||||
| Interest expense (*) | (121,881 | ) | (185,851 | ) | (275,763 | ) | ||||||
| Interest net | (90,895 | ) | (136,737 | ) | (182,305 | ) | ||||||
| Net foreign exchange transaction results | (73,015 | ) | (120,515 | ) | 5,908 | |||||||
| Foreign exchange derivatives contracts results (**) | 10,467 | 35,993 | (16,690 | ) | ||||||||
| Other | (2,564 | ) | (19,738 | ) | (11,969 | ) | ||||||
| Other financial results | (65,112 | ) | (104,260 | ) | (22,751 | ) | ||||||
| Net financial results | (156,007 | ) | (240,997 | ) | (205,056 | ) | ||||||
| From Discontinued operations | 4,307 | 9,973 | 4,726 | |||||||||
| (151,700 | ) | (231,024 | ) | (200,330 | ) | |||||||
Each item included in this note differs from its corresponding line in the income statement because it includes discontinued operations’ results.
Net foreign exchange transaction results include those amounts that affect the gross margin of certain subsidiaries which functional currencies are different from the U.S. dollar.
(*) Interest rate swaps included under “Interest expense” for the years 2009, 2008 and 2007 amount to a loss of $21.7 million, a loss of $9.7 million and a gain of $0.7 million, respectively.
The Company estimates that the impact under IFRS of a decrease of up to 1% in the reference interest rates on the outstanding interest rate derivatives as of December 31, 2009 would result in a maximum pre-tax loss of approximately $3.3 million.
As further described in “Section III.A. Financial Risk Factors”, in order to partially hedge future interest payments related to long-term debt, as well as to convert borrowings from floating to fixed rates, Tenaris has entered into interest rate swaps and swaps with an embedded knock-in options. A total notional amount of $500 million was covered by these instruments which coverage has begun between April and June, 2009 and expires between April and June, 2011. Between September and December 2009, a Tenaris subsidiary partially prepaid the syndicated loan facility entered into to finance the acquisition of Maverick in an aggregate amount of $320 million. Accordingly, Tenaris derecognized the corresponding portion of its hedge reserve designation (notional of $150 million) on interest rate swaps derivatives recording a loss for an amount of $8.2 million, included in the total amount of $21.7 million of interest rate swaps losses for the year ended December 31, 2009.
74
(**) Tenaris has identified certain embedded derivatives and in accordance with IAS 39 (“Financial Instruments: Recognition and Measurement”) has accounted for them separately from their host contracts. A net gain of $27.9 million, a loss of $40.7 million and a gain of $9.7 million arising from the valuation of these contracts have been recognized for 2009, 2008 and 2007, respectively.
7 Equity in earnings of associated companies
| Year ended December 31, | ||||||||||||
| (all amounts in thousands of U.S. dollars) | 2009 | 2008 | 2007 | |||||||||
| From associated companies | 87,159 | 89,556 | 94,888 | |||||||||
| (Loss) gain on sale of associated companies and other | (980 | ) | - | 18,388 | ||||||||
| 86,179 | 89,556 | 113,276 | ||||||||||
| From Discontinued operations | 862 | (133 | ) | (214 | ) | |||||||
| 87,041 | 89,423 | 113,062 | ||||||||||
8 Income tax
| Year ended December 31, | ||||||||||||
| (all amounts in thousands of U.S. dollars) | 2009 | 2008 | 2007 | |||||||||
| Current tax | 541,818 | 1,255,759 | 936,831 | |||||||||
| Deferred tax | (32,962 | ) | (244,331 | ) | (97,799 | ) | ||||||
| 508,856 | 1,011,428 | 839,032 | ||||||||||
| Effect of currency translation on tax base (a) | 4,297 | 10,704 | (5,654 | ) | ||||||||
| 513,153 | 1,022,132 | 833,378 | ||||||||||
| From Discontinued operations | 58 | (6,798 | ) | (27,605 | ) | |||||||
| 513,211 | 1,015,334 | 805,773 | ||||||||||
The tax on Tenaris’ income before tax differs from the theoretical amount that would arise using the tax rate in each country as follows:
| Year ended December 31, | ||||||||||||
| (all amounts in thousands of U.S. dollars) | 2009 | 2008 | 2007 | |||||||||
| Income before income tax | 1,748,948 | 2,984,049 | 2,829,704 | |||||||||
| Tax calculated at the tax rate in each country | 525,844 | 918,200 | 835,738 | |||||||||
| Non taxable income / Non deductible expenses (*) | (25,760 | ) | 85,950 | (6,838 | ) | |||||||
| Changes in the tax rates | 837 | (4,476 | ) | (27,479 | ) | |||||||
| Effect of currency translation on tax base (a) | 4,297 | 10,704 | (5,654 | ) | ||||||||
| Effect of taxable exchange differences | 8,906 | 8,878 | 11,660 | |||||||||
| Utilization of previously unrecognized tax losses | (913 | ) | (3,922 | ) | (1,654 | ) | ||||||
| Tax charge | 513,211 | 1,015,334 | 805,773 | |||||||||
(*) Includes the effect of the impairment charge for 2008.
| (a) | Tenaris applies the liability method to recognize deferred income tax expense on temporary differences between the tax bases of assets and their carrying amounts in the financial statements. By application of this method, Tenaris recognizes gains and losses on deferred income tax due to the effect of the change in the value of the Argentine peso on the tax bases of the fixed assets of its Argentine subsidiaries, which have the U.S. dollar as their functional currency. These gains and losses are required by IFRS even though the devalued tax basis of the relevant assets will result in a reduced dollar value of amortization deductions for tax purposes in future periods throughout the useful life of those assets. As a result, the resulting deferred income tax charge does not represent a separate obligation for Tenaris that is due and payable in any of the relevant periods. |
75
9 Earnings and dividends per share
Earnings per share are calculated by dividing the net income attributable to equity holders of the Company by the daily weighted average number of ordinary shares in issue during the year.
| Year ended December 31, | ||||||||||||
| 2009 | 2008 | 2007 | ||||||||||
| Net income attributable to equity holders | 1,161,555 | 2,124,802 | 1,923,748 | |||||||||
| Weighted average number of ordinary shares in issue (thousands) | 1,180,537 | 1,180,537 | 1,180,537 | |||||||||
| Basic and diluted earnings per share ( U.S. dollars per share) | 0.98 | 1.80 | 1.63 | |||||||||
| Basic and diluted earnings per ADS ( U.S. dollars per ADS) (*) | 1.97 | 3.60 | 3.26 | |||||||||
| Dividends paid | (507,631 | ) | (448,604 | ) | (507,631 | ) | ||||||
| Basic and diluted dividends per share (U.S. dollars per share) | 0.43 | 0.38 | 0.43 | |||||||||
| Basic and diluted dividends per ADS (U.S. dollars per ADS) (*) | 0.86 | 0.76 | 0.86 | |||||||||
| Result for discontinued operations attributable to equity holders | ||||||||||||
| Basic and diluted earnings per share (U.S. dollars per share) | (0.01 | ) | 0.31 | 0.04 | ||||||||
| Basic and diluted earnings per ADS (U.S. dollars per ADS) (*) | (0.03 | ) | 0.61 | 0.09 | ||||||||
(*) Each ADS equals to two shares
On November 5, 2009, the Company’s board of directors approved the payment of an interim dividend of $0.13 per share ($0.26 per ADS), or approximately $153 million, on November 26, 2009, with an ex-dividend date of November 23, 2009.
On June 3, 2009, the Company’s shareholders approved an annual dividend in the amount of $0.43 per share ($0.86 per ADS). The amount approved included the interim dividend previously paid in November 2008, in the amount of $0.13 per share ($0.26 per ADS). The balance, amounting to $0.30 per share ($0.60 per ADS), was paid on June 25, 2009. In the aggregate, the interim dividend paid in November 2008 and the balance paid in June 2009 amounted to approximately $507 million.
On November 6, 2008 Tenaris’ board of directors approved the payment of an interim dividend of $0.13 per share ($0.26 per ADS), or approximately $153 million, on November 27, 2008 (or, only in those jurisdictions where such date is not a business day, on November 28, 2008), with an ex-dividend date of November 24.
On June 4, 2008, the Company’s shareholders approved an annual dividend in the amount of $0.38 per share ($0.76 per ADS) of common stock currently issued and outstanding. This amount approved included the interim dividend previously paid in November 2007, in the amount of $0.13 per share ($0.26 per ADS). The balance, amounting to $0.25 per share ($0.50 per ADS), was paid on June 26, 2008. In the aggregate, the interim dividend paid in November 2007 and the balance paid in June 2008 amounted to approximately $449 million.
On November 7, 2007, the Company’s board of directors approved the payment of an interim dividend of $0.13 per share ($0.26 per ADS), or approximately $153 million, on November 22, 2007, with an ex-dividend date of November 19.
On June 6, 2007, the Company’s shareholders approved an annual dividend in the amount of $0.30 per share of common stock currently issued and outstanding, which in the aggregate amounted to approximately $354 million. The cash dividend was paid on June 21, 2007.
76
10 Property, plant and equipment, net
| Year ended December 31, 2009 | Land, building and improvements | Plant and production equipment | Vehicles, furniture and fixtures | Work in progress | Spare parts and equipment | Total | ||||||||||||||||||
| Cost | ||||||||||||||||||||||||
| Values at the beginning of the year | 689,173 | 6,238,423 | 195,628 | 235,857 | 38,450 | 7,397,531 | ||||||||||||||||||
| Translation differences | 30,682 | 155,286 | 8,091 | 13,967 | 1,795 | 209,821 | ||||||||||||||||||
| Additions | 2,741 | 3,613 | 1,194 | 427,170 | 5,749 | 440,467 | ||||||||||||||||||
| Disposals / Consumptions | (3,358 | ) | (10,591 | ) | (3,750 | ) | - | (7,850 | ) | (25,549 | ) | |||||||||||||
| Increase due to business acquisitions | 12,083 | 11,507 | 46 | 487 | - | 24,123 | ||||||||||||||||||
| Transfers / Reclassifications | 31,603 | 194,760 | (12,859 | ) | (218,954 | ) | 2,886 | (2,564 | ) | |||||||||||||||
| Deconsolidation / Transfers to Available for sale assets | (4,435 | ) | (137,874 | ) | (793 | ) | (7,508 | ) | (5,237 | ) | (155,847 | ) | ||||||||||||
| Values at the end of the year | 758,489 | 6,455,124 | 187,557 | 451,019 | 35,793 | 7,887,982 | ||||||||||||||||||
| Depreciation and impairment | ||||||||||||||||||||||||
| Accumulated at the beginning of the year | 158,443 | 4,136,038 | 99,113 | 7,200 | 13,866 | 4,414,660 | ||||||||||||||||||
| Translation differences | 9,419 | 84,364 | 6,684 | - | 252 | 100,719 | ||||||||||||||||||
| Depreciation charge | 19,350 | 232,927 | 24,529 | - | 1,352 | 278,158 | ||||||||||||||||||
| Transfers / Reclassifications | 194 | 1,183 | (1,377 | ) | - | - | - | |||||||||||||||||
| Disposals / Consumptions | (33 | ) | (7,884 | ) | (2,420 | ) | - | (18 | ) | (10,355 | ) | |||||||||||||
| Deconsolidation / Transfers to Available for sale assets | (3,550 | ) | (135,809 | ) | (584 | ) | (7,200 | ) | (2,644 | ) | (149,787 | ) | ||||||||||||
| Accumulated at the end of the year | 183,823 | 4,310,819 | 125,945 | - | 12,808 | 4,633,395 | ||||||||||||||||||
| At December 31, 2009 | 574,666 | 2,144,305 | 61,612 | 451,019 | 22,985 | 3,254,587 | ||||||||||||||||||
| Year ended December 31, 2008 | Land, building and improvements | Plant and production equipment | Vehicles, furniture and fixtures | Work in progress | Spare parts and equipment | Total | ||||||||||||||||||
| Cost | ||||||||||||||||||||||||
| Values at the beginning of the year | 642,269 | 6,570,777 | 196,538 | 327,019 | 35,818 | 7,772,421 | ||||||||||||||||||
| Translation differences | (87,144 | ) | (436,811 | ) | (9,720 | ) | (26,315 | ) | (2,008 | ) | (561,998 | ) | ||||||||||||
| Additions | 16,125 | 7,769 | 2,110 | 381,375 | 4,603 | 411,982 | ||||||||||||||||||
| Disposals / Consumptions | (7,986 | ) | (161,804 | ) | (49,958 | ) | - | (3,796 | ) | (223,544 | ) | |||||||||||||
| Transfers / Reclassifications | 125,909 | 258,492 | 56,658 | (446,222 | ) | 3,833 | (1,330 | ) | ||||||||||||||||
| Values at the end of the year | 689,173 | 6,238,423 | 195,628 | 235,857 | 38,450 | 7,397,531 | ||||||||||||||||||
| Depreciation and impairment | ||||||||||||||||||||||||
| Accumulated at the beginning of the year | 163,919 | 4,196,295 | 132,729 | - | 10,471 | 4,503,414 | ||||||||||||||||||
| Translation differences | (25,416 | ) | (249,212 | ) | (6,729 | ) | - | (339 | ) | (281,696 | ) | |||||||||||||
| Depreciation charge | 19,431 | 239,990 | 31,622 | - | 1,206 | 292,249 | ||||||||||||||||||
| Transfers / Reclassifications | 558 | 10,186 | (10,744 | ) | - | - | - | |||||||||||||||||
| Disposals / Consumptions | (2,628 | ) | (157,296 | ) | (47,914 | ) | - | (116 | ) | (207,954 | ) | |||||||||||||
| Impairment charge (see Note 5) | 2,579 | 96,075 | 149 | 7,200 | 2,644 | 108,647 | ||||||||||||||||||
| Accumulated at the end of the year | 158,443 | 4,136,038 | 99,113 | 7,200 | 13,866 | 4,414,660 | ||||||||||||||||||
| At December 31, 2008 | 530,730 | 2,102,385 | 96,515 | 228,657 | 24,584 | 2,982,871 | ||||||||||||||||||
Property, plant and equipment include capitalized interests for net amounts at December 31, 2009 and 2008 of $3,371 (out of which $975 were capitalized during the year 2009) and $2,548, respectively.
77
11 Intangible assets, net
| Year ended December 31, 2009 | Information system projects | Licenses, patents and trademarks (*) | Goodwill (**) | Customer relationships | Total | |||||||||||||||
| Cost | ||||||||||||||||||||
| Values at the beginning of the year | 203,612 | 495,657 | 2,130,799 | 1,975,254 | 4,805,322 | |||||||||||||||
| Translation differences | 6,679 | 3,170 | 11,963 | 70,418 | 92,230 | |||||||||||||||
| Additions | 20,385 | 75 | - | - | 20,460 | |||||||||||||||
| Deconsolidation / Transfers to Available for sale assets | (430 | ) | - | - | - | (430 | ) | |||||||||||||
| Transfers / Reclassifications | 2,564 | - | - | - | 2,564 | |||||||||||||||
| Disposals | (626 | ) | (583 | ) | - | - | (1,209 | ) | ||||||||||||
| Values at the end of the year | 232,184 | 498,319 | 2,142,762 | 2,045,672 | 4,918,937 | |||||||||||||||
| Amortization and impairment | ||||||||||||||||||||
| Accumulated at the beginning of the year | 133,974 | 130,167 | 325,440 | 388,754 | 978,335 | |||||||||||||||
| Translation differences | 5,713 | 204 | 12,652 | 24,500 | 43,069 | |||||||||||||||
| Amortization charge | 20,815 | 54,736 | - | 151,155 | 226,706 | |||||||||||||||
| Disposals | (56 | ) | (37 | ) | - | - | (93 | ) | ||||||||||||
| Accumulated at the end of the year | 160,446 | 185,070 | 338,092 | 564,409 | 1,248,017 | |||||||||||||||
| At December 31, 2009 | 71,738 | 313,249 | 1,804,670 | 1,481,263 | 3,670,920 | |||||||||||||||
| Year ended December 31, 2008 | Information system projects | Licenses, patents and trademarks (*) | Goodwill (**) | Customer relationships | Total | |||||||||||||||
| Cost | ||||||||||||||||||||
| Values at the beginning of the year | 186,073 | 500,523 | 2,149,037 | 2,072,006 | 4,907,639 | |||||||||||||||
| Translation differences | (9,906 | ) | (7,469 | ) | (16,836 | ) | (100,264 | ) | (134,475 | ) | ||||||||||
| Additions | 26,970 | 4,286 | - | - | 31,256 | |||||||||||||||
| Transfers / Reclassifications | 635 | (1,606 | ) | - | 3,512 | 2,541 | ||||||||||||||
| Disposals | (160 | ) | (77 | ) | (1,402 | ) | - | (1,639 | ) | |||||||||||
| Values at the end of the year | 203,612 | 495,657 | 2,130,799 | 1,975,254 | 4,805,322 | |||||||||||||||
| Amortization and impairment | ||||||||||||||||||||
| Accumulated at the beginning of the year | 124,164 | 67,200 | - | 173,923 | 365,287 | |||||||||||||||
| Translation differences | (8,041 | ) | (163 | ) | (684 | ) | (14,144 | ) | (23,032 | ) | ||||||||||
| Amortization charge | 17,851 | 63,198 | - | 159,636 | 240,685 | |||||||||||||||
| Transfers / Reclassifications | - | - | - | 1,211 | 1,211 | |||||||||||||||
| Impairment charge (see Note 5) | - | - | 326,124 | 68,128 | 394,252 | |||||||||||||||
| Disposals | - | (68 | ) | - | - | (68 | ) | |||||||||||||
| Accumulated at the end of the year | 133,974 | 130,167 | 325,440 | 388,754 | 978,335 | |||||||||||||||
| At December 31, 2008 | 69,638 | 365,490 | 1,805,359 | 1,586,500 | 3,826,987 | |||||||||||||||
(*) Includes Proprietary Technology.
(**) Goodwill at December 31, 2009 and December 31, 2008 corresponds principally to the Tubes segment.
78
The geographical allocation of goodwill is presented below.
| Year ended December 31, | ||||||||
| 2009 | 2008 | |||||||
| South America | 189,376 | 189,376 | ||||||
| Europe | 769 | 769 | ||||||
| North America | 1,614,525 | 1,615,214 | ||||||
| 1,804,670 | 1,805,359 | |||||||
Out of $1,804.7 million of goodwill, $771.3 million and $919.9 million correspond to the acquisitions of Maverick and Hydril, respectively. For the purpose of the impairment test, goodwill is allocated to each of the Tenaris’ CGU’s that are expected to benefit from the synergies of the combination.
12 Investments in associated companies
| Year ended December 31, | ||||||||
| 2009 | 2008 | |||||||
| At the beginning of the year | 527,007 | 509,354 | ||||||
| Translation differences | (1,302 | ) | (51,004 | ) | ||||
| Equity in earnings of associated companies | 87,159 | 89,556 | ||||||
| Dividends and distributions received | (11,420 | ) | (15,032 | ) | ||||
| Transfer to Available for sale assets | (1,615 | ) | - | |||||
| Increase in equity reserves in Ternium and other | 2,743 | (5,867 | ) | |||||
| At the end of the year | 602,572 | 527,007 | ||||||
The principal associated companies are:
| Percentage of ownership and voting rights at December 31, | Value at December 31, | |||||||||||||||||||
| Company | Country of incorporation | 2009 | 2008 | 2009 | 2008 | |||||||||||||||
| Ternium S.A. | Luxembourg | 11.46 | % | 11.46 | % | 584,389 | 504,288 | |||||||||||||
| - | - | - | 18,183 | 22,719 | ||||||||||||||||
| 602,572 | 527,007 | |||||||||||||||||||
Summarized selected financial information of Ternium, including the aggregated amounts of assets, liabilities, revenues and profit or loss is as follows:
| Ternium S.A. | ||||||||
| 2009 | 2008 | |||||||
| Non-current assets | 5,250,135 | 5,491,408 | ||||||
| Current assets | 5,042,538 | 5,179,839 | ||||||
| Total assets | 10,292,673 | 10,671,247 | ||||||
| Non-current liabilities | 2,872,667 | 3,374,964 | ||||||
| Current liabilities | 1,158,767 | 1,734,819 | ||||||
| Total liabilities | 4,031,434 | 5,109,783 | ||||||
| Minority interest | 964,897 | 964,094 | ||||||
| Revenues | 4,958,983 | 8,464,885 | ||||||
| Gross profit | 848,613 | 2,336,858 | ||||||
| Income from discontinued operations | 428,023 | 157,095 | ||||||
| Net income for the period attributable to equity holders of the company | 717,400 | 715,418 | ||||||
79
13 Other investments – non current
| Year ended December 31, | ||||||||
| 2009 | 2008 | |||||||
| Deposits with insurance companies | 23,482 | 18,487 | ||||||
| Investments in other companies | 2,496 | 12,370 | ||||||
| Others | 8,189 | 7,498 | ||||||
| 34,167 | 38,355 | |||||||
14 Receivables – non current
| Year ended December 31, | ||||||||
| 2009 | 2008 | |||||||
| Government entities | 4,666 | 5,138 | ||||||
| Employee advances and loans | 13,682 | 13,512 | ||||||
| Tax credits | 17,575 | 10,013 | ||||||
| Trade receivables | 298 | 208 | ||||||
| Receivables from related parties | 375 | 495 | ||||||
| Receivables on off- take contract | 104 | 114 | ||||||
| Legal deposits | 22,545 | 15,812 | ||||||
| Advances to suppliers and other advances | 25,181 | 38,862 | ||||||
| Other | 21,917 | 3,615 | ||||||
| 106,343 | 87,769 | |||||||
| Allowances for doubtful accounts (see Note 23 (i)) | (4,725 | ) | (5,017 | ) | ||||
| 101,618 | 82,752 | |||||||
15 Inventories
| Year ended December 31, | ||||||||
| 2009 | 2008 | |||||||
| Finished goods | 715,906 | 1,122,147 | ||||||
| Goods in process | 353,367 | 665,982 | ||||||
| Raw materials | 297,834 | 659,973 | ||||||
| Supplies | 378,876 | 430,488 | ||||||
| Goods in transit | 125,847 | 306,155 | ||||||
| 1,871,830 | 3,184,745 | |||||||
| Allowance for obsolescence (See Note 24 (i)) | (184,771 | ) | (93,344 | ) | ||||
| 1,687,059 | 3,091,401 | |||||||
16 Receivables and prepayments
| Year ended December 31, | ||||||||
| 2009 | 2008 | |||||||
| Prepaid expenses and other receivables | 55,473 | 41,244 | ||||||
| Government entities | 11,739 | 3,793 | ||||||
| Employee advances and loans | 14,380 | 14,552 | ||||||
| Advances to suppliers and other advances | 15,894 | 33,063 | ||||||
| Government tax refunds on exports | 35,379 | 35,319 | ||||||
| Receivables from related parties | 16,561 | 45,735 | ||||||
| Derivative financial instruments | 16,873 | 41,509 | ||||||
| Miscellaneous | 60,769 | 41,513 | ||||||
| 227,068 | 256,728 | |||||||
| Allowance for other doubtful accounts (see Note 24 (i)) | (6,944 | ) | (5,247 | ) | ||||
| 220,124 | 251,481 | |||||||
80
17 Current tax assets and liabilities
| Year ended December 31, | ||||||||
| Current tax assets | 2009 | 2008 | ||||||
| V.A.T. credits | 78,925 | 167,691 | ||||||
| Prepaid taxes | 146,524 | 33,916 | ||||||
| Carry-backs | 34,831 | - | ||||||
| 260,280 | 201,607 | |||||||
| Year ended December 31, | ||||||||
| Current tax liabilities | 2009 | 2008 | ||||||
| Income tax liabilities | 202,111 | 474,640 | ||||||
| V.A.T. liabilities | 33,382 | 28,274 | ||||||
| Other taxes | 71,046 | 107,399 | ||||||
| 306,539 | 610,313 | |||||||
18 Trade receivables
| Year ended December 31, | ||||||||
| 2009 | 2008 | |||||||
| Current accounts | 1,341,942 | 2,138,146 | ||||||
| Receivables from related parties | 8,532 | 19,278 | ||||||
| 1,350,474 | 2,157,424 | |||||||
| Allowance for doubtful accounts (see Note 24 (i)) | (40,172 | ) | (34,128 | ) | ||||
| 1,310,302 | 2,123,296 | |||||||
The following table sets forth details of the age of trade receivables:
| Trade Receivables | Not Due | Past due | ||
| 1 - 180 days | > 180 days | |||
| At December 31, 2009 | ||||
| Guaranteed | 588,935 | 479,352 | 98,074 | 11,509 |
| Not guaranteed | 761,539 | 556,805 | 163,344 | 41,390 |
| Guaranteed and not guaranteed | 1,350,474 | 1,036,157 | 261,418 | 52,899 |
| Allowance for doubtful accounts | (40,172) | - | (183) | (39,989) |
| Net Value | 1,310,302 | 1,036,157 | 261,235 | 12,910 |
| At December 31, 2008 | ||||
| Guaranteed | 929,566 | 742,854 | 173,687 | 13,025 |
| Not guaranteed | 1,227,858 | 914,784 | 281,946 | 31,128 |
| Guaranteed and not guaranteed | 2,157,424 | 1,657,638 | 455,633 | 44,153 |
| Allowance for doubtful accounts | (34,128) | (246) | (2,997) | (30,885) |
| Net Value | 2,123,296 | 1,657,392 | 452,636 | 13,268 |
No material financial assets that are fully performing have been renegotiated in the last year.
19 Cash and cash equivalents, and Other investments
| Year ended December 31, | ||||||||
| 2009 | 2008 | |||||||
| Other investments | ||||||||
| Fixed income instruments and certificates of deposit | 579,675 | 45,863 | ||||||
| Cash and cash equivalents | ||||||||
| Cash at banks, liquidity funds and short - term investments | 1,542,829 | 1,538,769 | ||||||
81
20 Borrowings
| Year ended December 31, | ||||||||
| 2009 | 2008 | |||||||
| Non-Current | ||||||||
| Bank borrowings | 663,256 | 1,225,267 | ||||||
| Other loans | 220 | 22,803 | ||||||
| Finance lease liabilities | 407 | 564 | ||||||
| Costs of issue of debt | (8,702 | ) | (7,586 | ) | ||||
| 655,181 | 1,241,048 | |||||||
| Current | ||||||||
| Bank Borrowings | 771,024 | 1,608,467 | ||||||
| Other loans | 9,074 | 119,135 | ||||||
| Bank Overdrafts | 14,122 | 13,747 | ||||||
| Finance lease liabilities | 179 | 368 | ||||||
| Costs of issue of debt | (2,816 | ) | (5,750 | ) | ||||
| 791,583 | 1,735,967 | |||||||
| Total Borrowings | 1,446,764 | 2,977,015 | ||||||
The maturity of borrowings is as follows:
| 1 year or less | 1 - 2 years | 2 – 3 years | 3 - 4 years | 4 - 5 years | Over 5 years | Total | ||
| At December 31, 2009 | ||||||||
| Financial lease | 179 | 324 | 83 | - | - | - | 586 | |
| Other borrowings | 791,404 | 390,638 | 186,625 | 32,700 | 7,579 | 37,232 | 1,446,178 | |
| Total borrowings | 791,583 | 390,962 | 186,708 | 32,700 | 7,579 | 37,232 | 1,446,764 | |
| Interest to be accrued | 39,056 | 13,246 | 8,199 | 3,532 | 2,719 | 7,357 | 74,109 | |
| Interest rate derivatives contract | 12,452 | 5,286 | - | - | - | - | 17,738 | |
| Total | 843,091 | 409,494 | 194,907 | 36,232 | 10,298 | 44,589 | 1,538,611 |
Significant borrowings include:
| In million of $ | |||||||||||
| Disbursement date | Borrower | Type | Original | Outstanding | Final maturity | ||||||
| October 2006 | Tamsa | Syndicated | 700.0 | 311.1 | October 2011 (**) | ||||||
| May 2007 | Tenaris | Syndicated | 1,700.0 | 178.6 | May 2012 (*) | ||||||
| May 2007 | Hydril | Syndicated | 300.0 | 166.7 | May 2012 | ||||||
| June 2008 | Dalmine | Bilateral | 150.0 | 150.0 | June 2013 | ||||||
| October 2006 | Dalmine | Syndicated | 150.0 | 66.7 | October 2011 (**) | ||||||
| March 2005 | Tamsa | Syndicated | 300.0 | 60.0 | March 2010 | ||||||
(*) In May 2009, the Company has elected the option to extend the loan until May 2012.
(**) The main covenants on these loan agreements are limitations on liens and encumbrances, limitations on the sale of certain assets, certain restrictions on capital expenditures, restrictions on investments and compliance with financial ratios (e.g., leverage ratio and interest coverage ratio).
The main covenants on Hydril’s loan agreement are stated in Note 27 b).
As of December 31, 2009, Tenaris was in compliance with all of its covenants.
82
The weighted average interest rates before tax shown below were calculated using the rates set for each instrument in its corresponding currency as of December 31, 2009 and 2008. The changes in interest rate are basically due to changes in floating interest rate.
| 2009 | 2008 | |||||||
| Bank borrowings | 3.97 | % | 5.23 | % | ||||
| Other loans | 4.00 | % | 4.99 | % | ||||
| Finance lease liabilities | 8.02 | % | 7.74 | % | ||||
Breakdown of long-term borrowings by currency and rate is as follows:
Non current bank borrowings
| Year ended December 31, | |||||||||
| Currency | Interest rates | 2009 | 2008 | ||||||
| USD | Variable | 1,026,288 | 2,268,381 | ||||||
| USD | Fixed | 20 | 20 | ||||||
| EUR | Variable | 12,525 | 14,310 | ||||||
| EUR | Fixed | 4,525 | 5,133 | ||||||
| BRL | Fixed | 52,979 | - | ||||||
| BRL | Variable | - | 11,397 | ||||||
| 1,096,337 | 2,299,241 | ||||||||
| Less: Current portion of medium and long - term loans | (433,081 | ) | (1,073,974 | ) | |||||
| Total non current bank borrowings | 663,256 | 1,225,267 | |||||||
Non current other loans
| Year ended December 31, | |||||||||
| Currency | Interest rates | 2009 | 2008 | ||||||
| USD | Variable | - | 28,032 | ||||||
| AED | Variable | 220 | - | ||||||
| 220 | 28,032 | ||||||||
| Less: Current portion of medium and long - term loans | - | (5,229 | ) | ||||||
| Total non current other loans | 220 | 22,803 | |||||||
Non current finance lease liabilities
| Year ended December 31, | |||||||||
| Currency | Interest rates | 2009 | 2008 | ||||||
| EUR | Fixed | 10 | 195 | ||||||
| USD | Fixed | 572 | 737 | ||||||
| 582 | 932 | ||||||||
| Less: Current portion of medium and long - term loans | (175 | ) | (368 | ) | |||||
| Total non current finance leases | 407 | 564 | |||||||
The carrying amounts of Tenaris’ assets pledged as collateral of liabilities are as follows:
| Year ended December 31, | ||||||||
| 2009 | 2008 | |||||||
| Property, plant and equipment mortgages | 167,357 | 247,143 | ||||||
Tenaris’ consolidated debt includes $35.9 million of Dalmine secured by certain of its properties.
83
Breakdown of short-term borrowings by currency and rate is as follows:
Current bank borrowings
| Year ended December 31, | |||||||||
| Currency | Interest rates | 2009 | 2008 | ||||||
| USD | Variable | 463,370 | 1,134,416 | ||||||
| USD | Fixed | 674 | 76,472 | ||||||
| EUR | Variable | 75,001 | 251,138 | ||||||
| EUR | Fixed | 878 | 837 | ||||||
| CNY | Variable | - | 3,951 | ||||||
| BRL | Variable | 291 | 5,370 | ||||||
| NGN | Fixed | 669 | - | ||||||
| ARS | Fixed | 230,141 | 115,541 | ||||||
| VEB | Variable | - | 20,509 | ||||||
| VEB | Fixed | - | 233 | ||||||
| Total current bank borrowings | 771,024 | 1,608,467 | |||||||
Bank overdrafts
| Year ended December 31, | ||||||||
| Currency | 2009 | 2008 | ||||||
| USD | 7,121 | 51 | ||||||
| EUR | 762 | 24 | ||||||
| ARS | 896 | 8,871 | ||||||
| VEB | - | 44 | ||||||
| NGN | 5,152 | 4,051 | ||||||
| NOK | 6 | - | ||||||
| COP | 157 | 706 | ||||||
| RON | 28 | - | ||||||
| Total current bank overdrafts | 14,122 | 13,747 | ||||||
Current other loans
| Year ended December 31, | |||||||||
| Currency | Interest rates | 2009 | 2008 | ||||||
| EUR | Variable | 265 | 111,448 | ||||||
| USD | Variable | 2,733 | 2,186 | ||||||
| USD | Fixed | 5,610 | 5,229 | ||||||
| CAD | Variable | - | 1 | ||||||
| AED | Variable | 466 | 271 | ||||||
| Total Current other loans | 9,074 | 119,135 | |||||||
Current finance lease liabilities
| Year ended December 31, | |||||||||
| Currency | Interest rates | 2009 | 2008 | ||||||
| EUR | Fixed | 14 | 189 | ||||||
| USD | Fixed | 165 | 179 | ||||||
| Total current finance leases | 179 | 368 | |||||||
84
21 Deferred income tax
Deferred income taxes are calculated in full on temporary differences under the liability method using the tax rate of each country.
The movement on the deferred income tax account is as follows:
| Year ended December 31, | ||||||||
| 2009 | 2008 | |||||||
| At the beginning of the year | 663,515 | 923,246 | ||||||
| Translation differences | 9,991 | (49,022 | ) | |||||
| Deconsolidation / Transfer to held for sale | 24,250 | (464 | ) | |||||
| Charged directly to Other Comprehensive Income | (5,684 | ) | 2,421 | |||||
| Income statement credit | (32,962 | ) | (240,754 | ) | ||||
| Effect of currency translation on tax base | 4,297 | 10,704 | ||||||
| Deferred employees' statutory profit sharing charge | (223 | ) | 17,384 | |||||
| At the end of the year | 663,184 | 663,515 | ||||||
The evolution of deferred tax assets and liabilities during the year are as follows:
Deferred tax liabilities
| Fixed assets | Inventories | Intangible and Other (a) | Total | |||||||||||||
| At the beginning of the year | 242,426 | 49,176 | 762,236 | 1,053,838 | ||||||||||||
| Translation differences | 11,247 | 577 | 11,619 | 23,443 | ||||||||||||
| Deconsolidation / Transfer to held for sale | - | - | (149 | ) | (149 | ) | ||||||||||
| Charged directly to Other Comprehensive Income | - | - | (1,265 | ) | (1,265 | ) | ||||||||||
| Income statement charge / (credit) | (2,499 | ) | (11,017 | ) | (63,800 | ) | (77,316 | ) | ||||||||
| At December 31,2009 | 251,174 | 38,736 | 708,641 | 998,551 | ||||||||||||
| Fixed assets | Inventories | Intangible and Other (a) | Total | |||||||||||||
| At the beginning of the year | 300,459 | 39,620 | 893,757 | 1,233,836 | ||||||||||||
| Translation differences | (37,609 | ) | (5,137 | ) | (22,281 | ) | (65,027 | ) | ||||||||
| Deconsolidation / Transfer to held for sale | - | - | (464 | ) | (464 | ) | ||||||||||
| Income statement charge / (credit) | (20,424 | ) | 14,693 | (108,776 | ) | (114,507 | ) | |||||||||
| At December 31,2008 | 242,426 | 49,176 | 762,236 | 1,053,838 | ||||||||||||
(a) Includes the effect of currency translation on tax base explained in Note 8
Deferred tax assets
| Provisions and allowances | Inventories | Tax losses | Other | Total | ||||||||||||||||
| At the beginning of the year | (59,063 | ) | (218,969 | ) | (1,744 | ) | (110,547 | ) | (390,323 | ) | ||||||||||
| Translation differences | (8,663 | ) | (1,500 | ) | (352 | ) | (2,937 | ) | (13,452 | ) | ||||||||||
| Deconsolidation / Transfer to held for sale | 2,809 | 10,260 | - | 11,330 | 24,399 | |||||||||||||||
| Charged directly to Other Comprehensive Income | - | - | - | (4,419 | ) | (4,419 | ) | |||||||||||||
| Income statement charge / (credit) | 13,760 | 70,238 | (33,676 | ) | (1,894 | ) | 48,428 | |||||||||||||
| At December 31, 2009 | (51,157 | ) | (139,971 | ) | (35,772 | ) | (108,467 | ) | (335,367 | ) | ||||||||||
85
| Provisions and allowances | Inventories | Tax losses | Other | Total | ||||||||||||||||
| At the beginning of the year | (46,737 | ) | (143,652 | ) | (1,396 | ) | (118,805 | ) | (310,590 | ) | ||||||||||
| Translation differences | 5,243 | 211 | 46 | 10,505 | 16,005 | |||||||||||||||
| Charged directly to Other Comprehensive Income | - | - | - | 2,421 | 2,421 | |||||||||||||||
| Income statement charge / (credit) | (17,569 | ) | (75,528 | ) | (394 | ) | (4,668 | ) | (98,159 | ) | ||||||||||
| At December 31, 2008 | (59,063 | ) | (218,969 | ) | (1,744 | ) | (110,547 | ) | (390,323 | ) | ||||||||||
Deferred income tax assets and liabilities are offset when (1) there is a legally enforceable right to set off current tax assets against current tax liabilities and (2) the deferred income taxes relate to the same fiscal authority. The following amounts, determined after appropriate setoff, are shown in the consolidated balance sheet:
| Year ended December 31, | ||||||||
| 2009 | 2008 | |||||||
| Deferred tax assets | (197,603 | ) | (390,323 | ) | ||||
| Deferred tax liabilities | 860,787 | 1,053,838 | ||||||
| 663,184 | 663,515 | |||||||
The amounts shown in the balance sheet include the following:
| Year ended December 31, | ||||||||
| 2009 | 2008 | |||||||
| Deferred tax assets to be recovered after 12 months | (106,862 | ) | (71,849 | ) | ||||
| Deferred tax liabilities to be recovered after 12 months | 936,732 | 1,002,325 | ||||||
22 Other liabilities
(i) Other liabilities – Non current
| Year ended December 31, | ||||||||
| 2009 | 2008 | |||||||
| Employee liabilities | ||||||||
| Employee's statutory profit sharing | 26,369 | 26,381 | ||||||
| Employee severance indemnity (a) | 52,725 | 56,939 | ||||||
| Pension benefits (b) | 46,473 | 39,130 | ||||||
| Employee retention and long term incentive program | 19,597 | 10,406 | ||||||
| 145,164 | 132,856 | |||||||
| Taxes payable | 3,360 | 12,605 | ||||||
| Derivative financial instruments | 20,533 | 55,926 | ||||||
| Miscellaneous | 23,410 | 21,755 | ||||||
| 47,303 | 90,286 | |||||||
| 192,467 | 223,142 | |||||||
86
(a) Employees’ severance indemnity
The amounts recognized in the balance sheet are as follows:
| Year ended December 31, | ||||||||
| 2009 | 2008 | |||||||
| Total included in non - current Employee liabilities | 52,725 | 56,939 | ||||||
The amounts recognized in the income statement are as follows:
| Year ended December 31, | ||||||||
| 2009 | 2008 | |||||||
| Current service cost | 10,809 | 16,343 | ||||||
| Interest cost | 2,627 | 2,825 | ||||||
| Total included in Labor costs | 13,436 | 19,168 | ||||||
The principal actuarial assumptions used were as follows:
| Year ended December 31, | ||||||||
| 2009 | 2008 | |||||||
| Discount rate | 4% - 8 | % | 4% - 5 | % | ||||
| Rate of compensation increase | 3% - 6 | % | 2% - 4 | % | ||||
(b) Pension benefits
| § | Unfunded |
The amounts recognized in the balance sheet are determined as follows:
| Year ended December 31, | ||||||||
| 2009 | 2008 | |||||||
| Present value of unfunded obligations | 44,261 | 40,339 | ||||||
| Unrecognized past service cost | - | (68 | ) | |||||
| Unrecognized actuarial losses | (11,235 | ) | (14,512 | ) | ||||
| Liability in the balance sheet | 33,026 | 25,759 | ||||||
The amounts recognized in the income statement are as follows:
| Year ended December 31, | ||||||||
| 2009 | 2008 | |||||||
| Current service cost | 1,356 | 1,342 | ||||||
| Interest cost | 2,855 | 2,319 | ||||||
| Net actuarial losses (gains) recognized in the year | 681 | 405 | ||||||
| Past service cost recognized | 189 | 30 | ||||||
| Curtailments and settlements | - | 170 | ||||||
| Total included in Labor costs | 5,081 | 4,266 | ||||||
87
Movement in the present value of unfunded obligation:
| Year ended December 31, | ||||||||
| 2009 | 2008 | |||||||
| At the beginning of the year | 40,339 | 37,329 | ||||||
| Translation differences | 1,146 | (1,669 | ) | |||||
| Transfers, reclassifications and new participants of the plan | 2,662 | 605 | ||||||
| Total expense | 4,211 | 3,831 | ||||||
| Actuarial (gains) losses | (2,482 | ) | 2,104 | |||||
| Contributions paid | - | (791 | ) | |||||
| Benefits paid | (1,615 | ) | (1,070 | ) | ||||
| At the end of the year | 44,261 | 40,339 | ||||||
The principal actuarial assumptions used were as follows:
| Year ended December 31, | ||||||||
| 2009 | 2008 | |||||||
| Discount rate | 6% - 7 | % | 6% - 7 | % | ||||
| Rate of compensation increase | 2% - 3 | % | 2% - 3 | % | ||||
| ■ | Funded |
The amounts recognized in the balance sheet are as follows:
| Year ended December 31, | ||||||||
| 2009 | 2008 | |||||||
| Present value of funded obligations | 144,005 | 117,463 | ||||||
| Unrecognized actuarial losses | (10,053 | ) | (4,581 | ) | ||||
| Fair value of plan assets (*) | (120,505 | ) | (99,511 | ) | ||||
| Liability in the balance sheet | 13,447 | 13,371 | ||||||
(*) Mainly balanced strategy through mutual funds and money markets.
The amounts recognized in the income statement are as follows:
| Year ended December 31, | ||||||||
| 2009 | 2008 | |||||||
| Current service cost | 1,775 | 2,329 | ||||||
| Interest cost | 7,640 | 7,682 | ||||||
| Net actuarial (gains) losses recognized in the year | (168 | ) | 1,156 | |||||
| Expected return on plan assets | (5,594 | ) | (7,232 | ) | ||||
| Past service cost recognized | - | 291 | ||||||
| Curtailments and settlements | - | (331 | ) | |||||
| Total included in Labor costs | 3,653 | 3,895 | ||||||
88
Movement in the present value of funded obligations:
| Year ended December 31, | ||||||||
| 2009 | 2008 | |||||||
| At the beginning of the year | 117,463 | 138,736 | ||||||
| Translation differences | 14,204 | (21,672 | ) | |||||
| Transfers, reclassifications and new participants of the plan | - | 8,250 | ||||||
| Total expense | 9,415 | 9,680 | ||||||
| Actuarial losses (gains) | 11,827 | (11,787 | ) | |||||
| Benefits paid | (8,817 | ) | (5,709 | ) | ||||
| Other | (87 | ) | (35 | ) | ||||
| At the end of the year | 144,005 | 117,463 | ||||||
Movement in the fair value of plan assets:
| Year ended December 31, | ||||||||
| 2009 | 2008 | |||||||
| At the beginning of the year | (99,511 | ) | (122,196 | ) | ||||
| Translation differences | (10,762 | ) | 18,209 | |||||
| Transfers, reclassifications and new participants of the plan | - | (6,531 | ) | |||||
| Expected return on plan assets | (5,594 | ) | (7,232 | ) | ||||
| Actuarial (gains) losses | (7,694 | ) | 18,820 | |||||
| Contributions paid | (5,845 | ) | (6,405 | ) | ||||
| Benefits paid | 8,817 | 5,709 | ||||||
| Other | 84 | 115 | ||||||
| At the end of the year | (120,505 | ) | (99,511 | ) | ||||
The principal actuarial assumptions used were as follows:
| Year ended December 31, | ||||||||
| 2009 | 2008 | |||||||
| Discount rate | 6 | % | 6% - 7 | % | ||||
| Rate of compensation increase | 3% - 4 | % | 2% - 3 | % | ||||
(i) Other liabilities – current
| Year ended December 31, | ||||||||
| 2009 | 2008 | |||||||
| Payroll and social security payable | 151,067 | 166,139 | ||||||
| Liabilities with related parties | 1,142 | 1,424 | ||||||
| Derivative financial instruments | 3,457 | 21,866 | ||||||
| Miscellaneous | 36,524 | 53,191 | ||||||
| 192,190 | 242,620 | |||||||
89
23 Non-current allowances and provisions
(i) Deducted from non current receivables
| Year ended December 31, | ||||||||
| 2009 | 2008 | |||||||
| Values at the beginning of the year | (5,017 | ) | (10,583 | ) | ||||
| Translation differences | 276 | 1,157 | ||||||
| Reversals / Additional allowances | (2 | ) | (71 | ) | ||||
| Reclassifications | - | (551 | ) | |||||
| Used | 18 | 5,031 | ||||||
| At December 31, | (4,725 | ) | (5,017 | ) | ||||
(ii) Liabilities
| Year ended December 31, | ||||||||
| 2009 | 2008 | |||||||
| Values at the beginning of the year | 89,526 | 97,912 | ||||||
| Translation differences | 9,805 | (12,636 | ) | |||||
| Deconsolidation / Transfer to held for sale | (1,380 | ) | - | |||||
| Reversals / Additional provisions | (7,170 | ) | 25,604 | |||||
| Reclassifications | 129 | (8,408 | ) | |||||
| Used | (10,155 | ) | (12,946 | ) | ||||
| At December 31, | 80,755 | 89,526 | ||||||
24 Current allowances and provisions
(i) Deducted from assets
| Year ended December 31, 2009 | Allowance for doubtful accounts - Trade receivables | Allowance for other doubtful accounts - Other receivables | Allowance for inventory obsolescence | |||||||||
| Values at the beginning of the year | (34,128 | ) | (5,247 | ) | (93,344 | ) | ||||||
| Translation differences | (333 | ) | (238 | ) | (4,186 | ) | ||||||
| Reversals / Additional allowances | (13,960 | ) | (1,763 | ) | (89,041 | ) | ||||||
| Used | 3,756 | 304 | 218 | |||||||||
| Deconsolidation / Transfer to held for sale | 4,493 | - | 1,582 | |||||||||
| At December 31, 2009 | (40,172 | ) | (6,944 | ) | (184,771 | ) | ||||||
| Year ended December 31, 2008 | ||||||||||||
| Values at the beginning of the year | (24,530 | ) | (7,284 | ) | (102,211 | ) | ||||||
| Translation differences | 709 | 208 | 6,552 | |||||||||
| Reversals / Additional allowances | (13,901 | ) | 238 | 2,355 | ||||||||
| Reclassifications | - | 551 | - | |||||||||
| Used | 3,594 | 1,040 | (40 | ) | ||||||||
| At December 31, 2008 | (34,128 | ) | (5,247 | ) | (93,344 | ) | ||||||
90
(ii) Liabilities
| Year ended December 31, 2009 | Sales risks | Other claims and contingencies | Total | |||||||||
| Values at the beginning of the year | 9,318 | 19,193 | 28,511 | |||||||||
| Translation differences | 722 | 871 | 1,593 | |||||||||
| Reversals / Additional allowances | 20,586 | 19,158 | 39,744 | |||||||||
| Reclassifications | - | (129 | ) | (129 | ) | |||||||
| Used | (23,603 | ) | (17,484 | ) | (41,087 | ) | ||||||
| At December 31, 2009 | 7,023 | 21,609 | 28,632 | |||||||||
| Year ended December 31, 2008 | ||||||||||||
| Values at the beginning of the year | 9,136 | 10,206 | 19,342 | |||||||||
| Translation differences | 3 | (1,369 | ) | (1,366 | ) | |||||||
| Reversals / Additional allowances | 5,222 | 6,667 | 11,889 | |||||||||
| Reclassifications | - | 8,408 | 8,408 | |||||||||
| Used | (5,043 | ) | (4,719 | ) | (9,762 | ) | ||||||
| At December 31, 2008 | 9,318 | 19,193 | 28,511 | |||||||||
25 Derivative financial instruments
Net fair values of derivative financial instruments
The net fair values of derivative financial instruments disclosed within Other liabilities and Receivables at the balance sheet date, in accordance with IAS 39, are:
| Year ended December 31, | ||||||||
| 2009 | 2008 | |||||||
| Contracts with positive fair values | ||||||||
| Foreign exchange derivatives contracts | 16,873 | 41,509 | ||||||
| Contracts with negative fair values | ||||||||
| Interest rate derivatives contracts | (17,738 | ) | (29,220 | ) | ||||
| Foreign exchange derivatives contracts | (3,434 | ) | (17,814 | ) | ||||
| Embedded Canadian Dollar forward purchases | (2,818 | ) | (30,758 | ) | ||||
91
Foreign exchange derivatives contracts
The net fair values of exchange rate derivatives, including embedded derivatives, were as follows:
| Currencies | Contract | Term | Fair Value at Dec-09 | Fair Value at Dec-08 |
| USD/JPY | Japanese Yen Purchases | 2009 | - | 217 |
| KWD/USD | Kuwaiti Dinar Sales | 2009 | - | 857 |
| BRL/EUR | Euro Purchases | 2009 | - | 4,901 |
| RON/USD | Romanian Leu Sales | 2010 | 6 | (984) |
| GBP/USD | Great Britain Pound Sales | 2010 | 19 | - |
| USD/MXN | Mexican Peso Purchases | 2010 | (305) | - |
| CAD/USD | Canadian Dollar Sales | 2010 | (398) | (1,631) |
| COP/USD | Colombian Peso Sales | 2010 | 589 | - |
| BRL/USD | Brazilian Real Sales | 2010 | (585) | 11,109 |
| MXN/EUR | Euro Purchases | 2010 | (674) | 8,186 |
| USD/EUR | Euro Purchases | 2010 | 1,186 | 11,320 |
| USD/ARS | Argentine Peso Purchases | 2010 | 13,601 | (10,280) |
| Subtotal | 13,439 | 23,695 | ||
| USD/CAD | Embedded Canadian Dollar Purchases | 2017 | (2,818) | (30,758) |
| Total | 10,621 | (7,063) |
Interest rate derivatives contracts
In order to minimize the volatility effect of floating rates on future interest rate payments, Tenaris has entered into a number of swaps with knock in, partially hedging the outstanding debt. A knock-in swap is a type of barrier option, which is activated if the reference rate reaches a set level (“knock in”) at the end of certain period. A total notional amount of $500 million was covered by these instruments out of which $350 million are outstanding as of December 31, 2009.
Derivative financial instruments breakdown is as follows:
| Type of derivative | Receive Reference rate | Term | Notional amount | Fair Value at Dec-09 | Fair Value at Dec-08 |
| Pay fixed/Receive variable | Euribor | 2010 | 911 | (22) | (82) |
| Swaps with KI (2.50%) | Libor 6M | 2011 | 150,000 | - | (8,852) |
| Swaps with KI (2.50%) | Libor 6M | 2011 | 350,000 | (17,716) | (20,286) |
| 500,911 | (17,738) | (29,220) |
92
Hedge Accounting
Tenaris applies hedge acccounting for certain cash flow hedges of highly probable forecast transactions. The following are the derivatives that were designated for hedge accounting as of December 31, 2009 and 2008.
| · | Foreign Exchange Hedge |
| Fair Value | Hedge Accounting Reserve | |||||||||||||||||
| Year ended December 31, | Year ended December 31, | |||||||||||||||||
| Currencies | Contract | Term | 2009 | 2008 | 2009 | 2008 | ||||||||||||
| USD/EUR | Euro Forward Purchases | 2010 | (506 | ) | - | (506 | ) | - | ||||||||||
| BRL/EUR | Euro Forward Purchases | 2009 | - | 4,901 | - | 6,716 | ||||||||||||
| BRL/USD | Brazilian Real Forward Sales | 2008 | - | - | - | 362 | ||||||||||||
| MXN/EUR | Euro Forward Purchases | 2010 | (674 | ) | 5,432 | 1,511 | 5,671 | |||||||||||
| (1,180 | ) | 10,333 | 1,005 | 12,749 | ||||||||||||||
| · | Interest Rate Hedge |
| Fair Value | Hedge Accounting Reserve | |||||||||||||||||||||||||
| Type of | Notional | Year ended December 31, | Year ended December 31, | |||||||||||||||||||||||
| Derivative | Rate | Term | Rate | Amount | 2009 | 2008 | 2009 | 2008 | ||||||||||||||||||
| Pay fixed / Receive variable | Euribor | 2010 | 5.72 | % | 911 | (22 | ) | (82 | ) | - | (106 | ) | ||||||||||||||
| Swaps with KI (2.50%) | Libor 6M | 2011 | 4.79% - 5.01 | % | 150,000 | - | (8,852 | ) | - | (8,852 | ) | |||||||||||||||
| Swaps with KI (2.50%) | Libor 6M | 2011 | 4.60% - 5.08 | % | 350,000 | (17,716 | ) | (20,286 | ) | (17,716 | ) | (20,779 | ) | |||||||||||||
| (17,738 | ) | (29,220 | ) | (17,716 | ) | (29,737 | ) | |||||||||||||||||||
The following is a summary of the hedge reserve evolution not including tax effect:
| Equity Reserve Dec-07 | Movements 2008 | Equity Reserve Dec-08 | Movements 2009 | Equity Reserve Dec-09 | ||||||||||||||||
| Foreign Exchange | (5,462 | ) | 18,211 | 12,749 | (11,744 | ) | 1,005 | |||||||||||||
| Interest Rate (Euribor) | (91 | ) | (15 | ) | (106 | ) | 106 | - | ||||||||||||
| Interest Rate Collars | (2,922 | ) | 2,922 | - | - | - | ||||||||||||||
| Interest Rate (swaps with KI – notional $150 million) | - | (8,852 | ) | (8,852 | ) | 8,852 | - | |||||||||||||
| Interest Rate (swaps with KI – notional $350 million) | - | (20,779 | ) | (20,779 | ) | 3,063 | (17,716 | ) | ||||||||||||
| Total Cash flow Hedge | (8,475 | ) | (8,513 | ) | (16,988 | ) | 277 | (16,711 | ) | |||||||||||
26 Contingencies, commitments and restrictions to the distribution of profits
Contingencies
Tenaris is involved in litigations arising from time to time in the ordinary course of business. Based on management’s assessment and the advice of legal counsel, it is not anticipated that the ultimate resolution of pending litigation will result in amounts in excess of recorded provisions (Notes 23 and 24) that would be material to Tenaris’ consolidated financial position or results of operations.
93
Asbestos-related litigation
Dalmine S.p.A. (“Dalmine”), a Tenaris subsidiary organized in Italy is currently subject to 13 civil proceedings for work-related injuries arising from the use of asbestos in its manufacturing processes during the period from 1960 to 1980. In addition, another 32 asbestos related out-of-court claims have been forwarded to Dalmine.
As of December 31, 2009, the total claims pending against Dalmine were 45 (of which, none are covered by insurance): during 2009, 12 new claims were filed, no claims were adjudicated, 6 claims were settled all of which were paid, 3 claims were rejected and 13 claims were dismissed.
Aggregate settlement costs to date for Tenaris are Euro 8.5 million ($12.3 million). Dalmine estimates that its potential liability in connection with the claims not yet settled is approximately Euro 12.8 million ($18.4 million).
Accruals for Dalmine’s potential liability are based on the average of the amounts paid by Dalmine for asbestos-related claims plus an additional amount related to some reimbursements requested by the social security authority. The maximum potential liability is not determinable as in some cases the requests for damages do not specify amounts, and instead is to be determined by the court. The timing of payment of the amounts claimed is not presently determinable.
U.S. income tax return
The U.S. Internal Revenue Service (the “IRS”) is currently conducting its field examination of the Maverick Tube Corporation (“Maverick”) 2005 and 2006 U.S. tax returns. In connection with such field examination, the IRS has issued several Notices of Proposed Adjustment (NOPAs), which reflect the IRS’s opening position considering the facts and law as the IRS has developed them to date. The NOPAs seek to disallow, in full or in part, certain interest expense deductions taken in 2005 and 2006 of $1.0 million and $87.3 million, respectively, and to assess interest on any resulting underpayment of income tax. In particular, the NOPAs relating to the 2006 tax return propose an upward adjustment to Maverick’s income ranging from $23.2 million to $87.3 million, based on three alternative arguments. The Company believes that the Maverick 2005 and 2006 tax returns comply with applicable tax law and will vigorously defend its tax returns with IRS appeal and litigate the matter if necessary.
Maverick litigation
On November 22, 2006, Maverick Tube Corporation (“Maverick”) received a letter from The Bank of New York as trustee (“the Trustee”) for the holders of 2004 4% Convertible Senior Subordinated Notes due 2033 issued by Maverick (“the 2004 Notes”), concerning an alleged breach of the indenture entered into on December 30, 2004, between Maverick and the Trustee, and governing the 2004 Notes (as amended, the “Indenture”). The alleged breach of the Indenture was based on Maverick’s refusal to grant the holders of the 2004 Notes conversion rights provided by the “Public Acquirer Change of Control” provision of the Indenture.
On December 11, 2006, the Trustee filed a complaint against Maverick and Tenaris in the United States District Court for the Southern District of New York. The complaint alleged that Tenaris’ acquisition of Maverick triggered the “Public Acquirer Change of Control” provision and asserted a breach of contract claim against Maverick for refusing to accept the 2004 Notes for conversion for the consideration specified in the “Public Acquirer Change of Control” provision. The complaint also seeks a declaratory judgment that Tenaris’ acquisition of Maverick was a “Public Acquirer Change of Control” under the Indenture, and therefore triggers the above mentioned conversion rights, and asserts claims for tortious interference with contract and unjust enrichment against Tenaris.
Defendants filed a motion to dismiss the complaint, or in the alternative, for summary judgment on March 13, 2007. Plaintiff filed a motion for partial summary judgment on the same date. On January 25, 2008, Law Debenture Trust Company of New York (as successor to BNY as trustee under the Indenture) was substituted for The Bank of New York as plaintiff. On October 15, 2008, the court denied Law Debenture’s motion for partial summary judgment and granted defendants’ motion for summary judgment dismissing the complaint in its entirety.
94
On February 19, 2010, the United States Court of Appeals for the Second Circuit affirmed the District Court's judgment. The plaintiff is entitled to file a motion for rehearing, or rehearing en banc, with the Court of Appeals, or a petition for certiorari with the U.S. Supreme Court. The Company believes that the plaintiff's chances of prevailing on further appeal are remote.
Conversion of tax loss carry-forwards
On December 18, 2000, the Argentine tax authorities notified Siderca S.A.I.C., a Tenaris subsidiary organized in Argentina (“Siderca”), of an income tax assessment related to the conversion of tax loss carry-forwards into Debt Consolidation Bonds under Argentine Law No. 24.073. The adjustments proposed by the tax authorities represent an estimated contingency of ARS 91.0 million (approximately $24.1 million) at December 31, 2009, in taxes and penalties. Based on the views of Siderca’s tax advisors, Tenaris believes that it is not probable that the ultimate resolution of the matter will result in an obligation. Accordingly, no provision was recorded in these Consolidated Financial Statements.
Customer Claim
A lawsuit was filed on September 6, 2007, against three Tenaris’ subsidiaries, alleging negligence, gross negligence and intentional acts characterized as fraudulent inducement concerning allegedly defective well casing. Plaintiff alleged the complete loss of one natural gas production well and formation damage that precludes further exploration and production at the well site and sought compensatory and punitive damages of $25 million. The lawsuit was subsequently amended to add the Company and other of its subsidiaries as defendants and to change the claims to be breach of contract and fraud. On October 22, 2008, the Plaintiff again amended its petition to add new counts (including strict liability) and increase its prayer for damages to $245 million, plus punitive damages, treble damages and attorney fees. Each petition was tendered to a Tenaris subsidiary insurer, and the Tenaris subsidiary received the insurer’s agreement to provide a defense. The insurer reserved its rights with respect to its indemnity obligations. On July 20, 2009 the lawsuit was settled for an amount of $15 million and thus a Tenaris subsidiary recorded a loss of $12.7 million in addition to the previously recorded of $2.3 million. As of the date of these Consolidated Financial Statements, the insurer is not participating in this settlement. On September 11, 2009 certain Tenaris subsidiaries initiated legal proceedings against the insurer. According to IAS 37, no expected reimbursement from the insurer has been registered yet.
Ongoing investigation
The Company has learned from one of its customers in Central Asia that certain sales agency payments made by one of the Company’s subsidiaries may have improperly benefited employees of the customer and other persons. These payments may have violated certain applicable laws, including the U.S. FCPA (“Foreign corrupt practices act”). The Audit Committee of the Company’s Board of Directors has engaged external counsel in connection with a review of these payments and related matters, and the Company has voluntarily notified the U.S. Securities and Exchange Commission and the U.S. Department of Justice. The Company will share the results of this review with the appropriate regulatory agencies, and will cooperate with any investigations that may be conducted by such agencies. At this time, the Company cannot predict the outcome of these matters or estimate the range of potential loss or extent of risk, if any, to the Company’s business that may result from resolution of these matters.
Commitments
Set forth is a description of Tenaris’ main outstanding commitments:
| · | A Tenaris company is a party to a five-year contract with Nucor Corporation, under which it committed to purchase from Nucor steel coils, with deliveries starting in January 2007 on a monthly basis. The Tenaris company has negotiated and obtained from Nucor a waiver of the monthly committed volumes. The Company is reviewing its steel purchasing requirements with Nucor each quarter, therefore, the current waiver of monthly commitments is valid until March 31, 2010. |
95
| · | A Tenaris company is a party to a ten year raw material purchase contract with QIT, under which it committed to purchase steel bars, with deliveries starting in July 2007. The estimated aggregate amount of the remaining commitments on the contract at current prices is approximately $275.8 million. The contract allows the Tenaris company to claim lower commitments in market downturns and severe market downturns subject to certain limitations. |
| · | A Tenaris company is a party to a contract with Siderar for the supply of steam generated at the power generation facility owned by Tenaris in San Nicolas, Argentina. Under this contract, the Tenaris company is required to provide 250 tn/hour of steam and Siderar has the obligation to take or pay this volume. The contract is due to terminate in 2018. |
Restrictions to the distribution of profits and payment of dividends
As of December 31, 2009, equity as defined under Luxembourg law and regulations consisted of:
(all amounts in thousands of U.S. dollars)
| Share capital | 1,180,537 | |||
| Legal reserve | 118,054 | |||
| Share premium | 609,733 | |||
| Retained earnings including net income for the year ended December 31, 2009 | 3,916,482 | |||
| Total equity in accordance with Luxembourg law | 5,824,806 |
At least 5% of the Company’s net income per year, as calculated in accordance with Luxembourg law and regulations, must be allocated to the creation of a legal reserve equivalent to 10% of the Company’s share capital. As of December 31, 2009, this reserve is fully allocated and additional allocations to the reserve are not required under Luxembourg law. Dividends may not be paid out of the legal reserve.
The Company may pay dividends to the extent, among other conditions, that it has distributable retained earnings calculated in accordance with Luxembourg law and regulations.
At December 31, 2009, distributable amount for the financial period of Tenaris under Luxembourg law totals $4.5 billion, as detailed below.
(all amounts in thousands of U.S. dollars)
| Retained earnings at December 31, 2008 under Luxembourg law | 3,174,932 | |||
| Dividends received | 1,265,460 | |||
| Other income and expenses for the year ended December 31, 2009 | (16,279 | ) | ||
| Dividends paid | (507,631 | ) | ||
| Retained earnings at December 31, 2009 under Luxembourg law | 3,916,482 | |||
| Share premium | 609,733 | |||
| Distributable amount at December 31, 2009 under Luxembourg law | 4,526,215 |
27 Business combinations and other acquisitions
(a) Tenaris acquired control of Seamless Pipe Indonesia Jaya
In April 2009, Tenaris completed the acquisition from Bakrie & Brothers TbK, Green Pipe International Limited and Cakrawala Baru of a 77.45% holding in Seamless Pipe Indonesia Jaya (“SPIJ”), an Indonesian OCTG processing business with heat treatment and premium connection threading facilities, for a purchase price of $69.5 million, with $21.9 million being payable as consideration for SPIJ's equity and $47.6 million as consideration for the assignment of certain sellers' loan to SPIJ. Tenaris began consolidating SPIJ’s balance sheet and results of operations since April 2009.
96
Pro forma data including acquisitions for all of 2009
Had the SPIJ transaction been consummated on January 1, 2009, then Tenaris’ unaudited pro forma net sales and net income from continuing operations would not have changed materially.
(b) Acquisition of Hydril Company (“Hydril”)
On May 7, 2007, Tenaris paid $2.0 billion to acquire Hydril, a North American manufacturer of premium connections and pressure control products for the oil and gas industry. To finance the acquisition, Tenaris entered into syndicated loans in the amount of $2.0 billion, of which $0.5 billion were used to refinance an existing loan in the Company. The balance of the acquisition cost was paid out of cash on hand. Of the loan amount, $1.7 billion was allocated to the Company and the balance to Hydril.
The main covenants on these loan agreements are limitations on liens and encumbrances, limitations on the sale of certain assets, restrictions on investments and compliance with financial ratios (e.g., leverage ratio and interest coverage ratio in Hydril’s syndicated loan agreement, and leverage ratio and debt service coverage ratio in the Company’s syndicated loan agreement). In addition, Hydril’s syndicated loan agreement has certain restrictions in capital expenditures.
In November 2007, the Company prepaid loans under the Company’s syndicated loan agreement in a principal amount of $0.7 billion plus accrued interest thereon to such date. In May and July 2008, the Company prepaid loans under the Company’s syndicated loan agreement in a principal amount of $0.75 billion plus accrued interest thereon. In May 2009, the Company has elected to extend until May 2012 the due date of the $250 million outstanding principal amount of the Tranche A loans under the Company’s syndicated loan agreement.
Tenaris began consolidating Hydril’s balance sheet and results of operations as from May, 2007.
(c) Minority Interest
During the year ended December 31, 2009, 2008 and 2007 additional shares of certain Tenaris subsidiaries were acquired from minority shareholders for approximately $ 9.5 million, $18.6 million and $3.3 million respectively.
The assets and liabilities determined arising from the acquisitions are as follows:
| Year ended December 31, 2009 | ||||
| Other assets and liabilities (net) | (1,309 | ) | ||
| Property, plant and equipment | 24,123 | |||
| Net assets acquired | 22,814 | |||
| Minority interest | 3,170 | |||
| Sub-total | 25,984 | |||
| Assumed liabilities | 47,600 | |||
| Sub-total | 73,584 | |||
| Cash acquired | 5,501 | |||
| Purchase consideration | 79,085 | |||
The businesses acquired during the year ended December 31, 2009 contributed revenues of $92.5 million and an operating income of $0.9 million.
97
28 Cash flow disclosures
| (i) | Changes in working capital | Year ended December 31, | |||||||||||
| 2009 | 2008 | 2007 | |||||||||||
| Inventories | 1,414,157 | (492,545 | ) | (252,810 | ) | ||||||||
| Receivables and prepayments | (52,395 | ) | 12,079 | 2,080 | |||||||||
| Trade receivables | 792,345 | (374,463 | ) | (115,838 | ) | ||||||||
| Other liabilities | 80,696 | (71,638 | ) | 127,434 | |||||||||
| Customer advances | (180,531 | ) | (174,014 | ) | 113,548 | ||||||||
| Trade payables | (316,924 | ) | 48,949 | 15,161 | |||||||||
| 1,737,348 | (1,051,632 | ) | (110,425 | ) | |||||||||
| (ii) | Income tax accruals less payments | ||||||||||||
| Tax accrued (*) | 513,153 | 1,011,675 | 833,378 | ||||||||||
| Taxes paid | (971,239 | ) | (1,236,713 | ) | (1,226,433 | ) | |||||||
| (458,086 | ) | (225,038 | ) | (393,055 | ) | ||||||||
(*) Does not include tax accrued on the sale of Pressure Control disclosed as discontinued operations.
| (iii) | Interest accruals less payments, net | ||||||||||||
| Interest accrued | 90,896 | 136,737 | 183,995 | ||||||||||
| Interest received | 26,900 | 83,241 | 62,697 | ||||||||||
| Interest paid | (141,963 | ) | (164,486 | ) | (267,994 | ) | |||||||
| (24,167 | ) | 55,492 | (21,302 | ) | |||||||||
| (iv) | Cash and cash equivalents | ||||||||||||
Cash at banks, liquidity funds and short - term investments | 1,542,829 | 1,538,769 | 962,497 | ||||||||||
| Bank overdrafts | (14,122 | ) | (13,747 | ) | (8,194 | ) | |||||||
| 1,528,707 | 1,525,022 | 954,303 | |||||||||||
29 Discontinued operations
Nationalization of Venezuelan Subsidiaries
The results of operations and cash flows generated by the Venezuelan Companies (as defined in Note 32 (b)) are presented as discontinued operations in these Consolidated Financial Statements. For further information see Note 32 (b).
Sale of Hydril pressure control business
On April 1, 2008, Tenaris sold to General Electric Company (GE) the pressure control business included as part of the acquisition of Hydril Company undertaken on May 2007. The pressure control business was sold, for an amount equivalent on a debt-free basis to $1,114 million. The result of this transaction was an after-tax gain of $394.3 million, calculated as the net proceeds of the sale less the book value of net assets held for sale, the corresponding tax effect and related expenses.
98
Book value of the Assets and Liabilities disposed:
| At March 31, 2008 | ||||
| Property, plant and equipment, net | 64,556 | |||
| Intangible assets, net | 295,371 | |||
| Inventories | 173,110 | |||
| Trade receivables | 78,018 | |||
| Other assets | 39,643 | |||
| Total current and non current assets held for sale | 650,698 | |||
| Deferred tax liabilities | 71,434 | |||
| Customer advances | 128,975 | |||
| Trade payables | 54,175 | |||
| Other liabilities | 15,291 | |||
| Liabilities associated with current and non-current assets held for sale | 269,875 | |||
Analysis of the result of discontinued operations:
(i) Result for discontinued operations
| (all amounts in thousands of U.S. dollars) | (*) Year ended December 31, | |||||||||||
| 2009 | 2008 | 2007 | ||||||||||
| (Loss) income for discontinued operations | (28,138 | ) | (87,418 | ) | 52,128 | |||||||
| After tax gain on disposal of operations | - | 394,323 | - | |||||||||
| Net (loss) income for discontinued operations | (28,138 | ) | 306,905 | 52,128 | ||||||||
(*) Corresponds to the Venezuelan Companies (years 2009, 2008 and 2007) and Pressure Control (years 2008 and 2007) operations.
(ii) Net cash flows attributable to discontinued operations
| (*) Year ended December 31, | ||||||||||||
| 2009 | 2008 | 2007 | ||||||||||
| Net cash provided by operating activities | 1,788 | 20,786 | 41,678 | |||||||||
| Net cash used in investing activities | (801 | ) | (7,330 | ) | (21,854 | ) | ||||||
| Net cash provided by (used in) financing activities | 5,306 | 9,046 | (10,796 | ) | ||||||||
(*) Corresponds to the Venezuelan Companies (years 2009, 2008 and 2007) and Pressure Control (years 2008 and 2007) operations.
All amounts were estimated only for disclosure purposes, as cash flows from these discontinued operations were not managed separately from other cash flows.
30 Related party transactions
Based on the information most recently available to the Company, as of December 31, 2009:
| · | San Faustin N.V. owned 713,605,187 shares in the Company, representing 60.45% of the Company’s capital and voting rights. |
| · | San Faustin N.V. owned all of its shares in the Company through its wholly-owned subsidiary I.I.I. Industrial Investments Inc. |
| · | Rocca & Partners S.A. controlled a significant portion of the voting power of San Faustín N.V. and had the ability to influence matters affecting, or submitted to a vote of the shareholders of San Faustín N.V., such as the election of directors, the approval of certain corporate transactions and other matters concerning the company’s policies. |
| · | There were no controlling shareholders for Rocca & Partners S.A. |
99
Based on the information most recently available to the Company, as of December 31, 2009 Tenaris’ directors and senior management as a group owned 0.14% of the Company’s outstanding shares, while the remaining 39.41% were publicly traded.
At December 31, 2009, the closing price of Ternium’s ADSs as quoted on the New York Stock Exchange was $35.42 per ADS, giving Tenaris’ ownership stake a market value of approximately $813.6 million. At December 31, 2009, the carrying value of Tenaris’ ownership stake in Ternium, based on Ternium’s IFRS financial statements, was approximately $584.4 million. See Section II.B.2.
Transactions and balances disclosed as with “Associated” companies are those with companies over which Tenaris exerts significant influence or joint control in accordance with IFRS, but does not have control. All other transactions and balances with related parties which are not Associated and which are not consolidated are disclosed as “Other”. The following transactions were carried out with related parties:
| Year ended December 31, 2009 | |||||||||||||
| Associated (1) | Other | Total | |||||||||||
| (i) | Transactions (2) | ||||||||||||
| (a) Sales of goods and services | |||||||||||||
| Sales of goods | 25,561 | 75,097 | 100,658 | ||||||||||
| Sales of services | 12,752 | 4,352 | 17,103 | ||||||||||
| 38,313 | 79,449 | 117,762 | |||||||||||
| (b) Purchases of goods and services | |||||||||||||
| Purchases of goods | 40,171 | 9,705 | 49,877 | ||||||||||
| Purchases of services | 89,023 | 71,541 | 160,564 | ||||||||||
| 129,194 | 81,247 | 210,441 | |||||||||||
| Year ended December 31, 2008 | |||||||||||||
| Associated (1) | Other | Total | |||||||||||
| (i) | Transactions (3) | ||||||||||||
| (a) Sales of goods and services | |||||||||||||
| Sales of goods | 74,420 | 37,636 | 112,056 | ||||||||||
| Sales of services | 19,444 | 4,205 | 23,649 | ||||||||||
| 93,864 | 41,841 | 135,705 | |||||||||||
| (b) Purchases of goods and services | |||||||||||||
| Purchases of goods | 123,704 | 24,161 | 147,865 | ||||||||||
| Purchases of services | 125,161 | 79,037 | 204,198 | ||||||||||
| 248,865 | 103,198 | 352,063 | |||||||||||
| Year ended December 31, 2007 | |||||||||||||
| Associated (4) | Other | Total | |||||||||||
| (i) | Transactions (5) | ||||||||||||
| (a) Sales of goods and services | |||||||||||||
| Sales of goods | 98,141 | 39,307 | 137,448 | ||||||||||
| Sales of services | 18,712 | 5,110 | 23,822 | ||||||||||
| 116,853 | 44,417 | 161,270 | |||||||||||
| (b) Purchases of goods and services | |||||||||||||
| Purchases of goods | 254,063 | 27,277 | 281,340 | ||||||||||
| Purchases of services | 94,152 | 70,205 | 164,357 | ||||||||||
| 348,215 | 97,482 | 445,697 | |||||||||||
100
| At December 31, 2009 | |||||||||||||
| Associated (1) | Other | Total | |||||||||||
| (ii) | Year-end balances | ||||||||||||
| (a) Arising from sales / purchases of goods / services | |||||||||||||
| Receivables from related parties | 18,273 | 7,093 | 25,366 | ||||||||||
| Payables to related parties | (23,898 | ) | (5,856 | ) | (29,754 | ) | |||||||
| (5,625 | ) | 1,237 | (4,388 | ) | |||||||||
| (b) Financial debt | |||||||||||||
| Borrowings | (2,907 | ) | - | (2,907 | ) | ||||||||
| At December 31, 2008 | |||||||||||||
| Associated (1) | Other | Total | |||||||||||
| (ii) | Year-end balances | ||||||||||||
| (a) Arising from sales / purchases of goods / services | |||||||||||||
| Receivables from related parties | 50,137 | 15,504 | 65,641 | ||||||||||
| Payables to related parties | (44,470 | ) | (5,974 | ) | (50,444 | ) | |||||||
| 5,667 | 9,530 | 15,197 | |||||||||||
| (b) Financial debt | |||||||||||||
| Borrowings | (2,294 | ) | - | (2,294 | ) | ||||||||
| At December 31, 2007 | |||||||||||||
| Associated (1) | Other | Total | |||||||||||
| (ii) | Year-end balances | ||||||||||||
| (a) Arising from sales / purchases of goods / services | |||||||||||||
| Receivables from related parties | 45,773 | 8,015 | 53,788 | ||||||||||
| Payables to related parties | (61,597 | ) | (7,379 | ) | (68,976 | ) | |||||||
| (15,824 | ) | 636 | (15,188 | ) | |||||||||
| (b) Financial debt | |||||||||||||
| Borrowings (6) | (27,482 | ) | - | (27,482 | ) | ||||||||
(1) Includes Ternium S.A. and its subsidiaries (“Ternium”), Condusid C.A. (“Condusid”), Finma S.A.I.F (“Finma”), Lomond Holdings B.V. group (“Lomond”), Socotherm Brasil S.A. (“Socotherm”) and Hydril Jindal International Private Ltd.
(2) Includes $2.5 million of purchases of nationalized Venezuelan subsidiaries.
(3) Includes $12.9 million of sales and $9.5 million of purchases of nationalized Venezuelan subsidiaries.
(4) Includes Ternium, Condusid, Finma, Lomond, Dalmine Energie S.p.A. (“Dalmine Energie”) (until October 2007), Socotherm, Hydril Jindal International Private Ltd. and TMK – Hydril JV.
(5) Includes $52.5 million of sales and $56.1 million of purchases of nationalized Venezuelan subsidiaries.
(6) Includes loan from Sidor to Matesi of $26.4 million at December 31, 2007.
Directors’ and senior management compensation
The aggregate compensation earned by directors and senior management during 2009, 2008 and 2007 amounts to $18.2 million, $22.5 million and $20.0 million respectively.
101
31 Principal subsidiaries
The following is a list of Tenaris principal subsidiaries and its direct and indirect percentage of ownership of each controlled company at December 31, 2009.
| Company | Country of Organization | Main activity | Percentage of ownership at December 31, (*) | ||
| 2009 | 2008 | 2007 | |||
| ALGOMA TUBES INC. | Canada | Manufacturing of seamless steel pipes | 100% | 100% | 100% |
| CONFAB INDUSTRIAL S.A. and subsidiaries (a) | Brazil | Manufacturing of welded steel pipes and capital goods | 40% | 40% | 39% |
| DALMINE S.p.A. | Italy | Manufacturing of seamless steel pipes | 99% | 99% | 99% |
| HYDRIL COMPANY and subsidiaries (except detailed) (b) | USA | Manufacture and marketing of premium connections | 100% | 100% | 100% |
| HYDRIL U.K. LTD. | United Kingdom | Manufacturing of steel products | 100% | 100% | 100% |
| INVERSIONES BERNA S.A. | Chile | Financial Company | 100% | 100% | 100% |
| MAVERICK TUBE CORPORATION and subsidiaries (except detailed) | USA | Manufacturing of welded steel pipes | 100% | 100% | 100% |
| MAVERICK TUBE, LLC | USA | Manufacturing of welded steel pipes | 100% | 100% | 100% |
| NKKTUBES | Japan | Manufacturing of seamless steel pipes | 51% | 51% | 51% |
| PRUDENTIAL STEEL ULC | Canada | Manufacturing of welded steel pipes | 100% | 100% | 100% |
| S.C. SILCOTUB S.A. | Romania | Manufacturing of seamless steel pipes | 100% | 100% | 99% |
| SIAT S.A. | Argentina | Manufacturing of welded and seamless steel pipes | 82% | 82% | 82% |
| SIDERCA S.A.I.C. and subsidiaries (except detailed) (c) | Argentina | Manufacturing of seamless steel pipes | 100% | 100% | 100% |
| SIDTAM LTD. | British Virgin Islands | Holding Company | 100% | 100% | 100% |
| TALTA - TRADING E MARKETING SOCIEDADE UNIPESSOAL LDA. | Madeira | Holding Company | 100% | 100% | 100% |
| TENARIS CONNECTION Limited and subsidiaries (except detailed) | St. Vincent & the Grenadines | Ownership and licensing of steel technology | 100% | 100% | 100% |
| TENARIS FINANCIAL SERVICES S.A. | Uruguay | Financial Company | 100% | 100% | 100% |
| TENARIS GLOBAL SERVICES (CANADA) INC. | Canada | Marketing of steel products | 100% | 100% | 100% |
| TENARIS GLOBAL SERVICES (PANAMA) S.A. - Suc. Colombia | Colombia | Marketing of steel products | 100% | 100% | 100% |
| TENARIS GLOBAL SERVICES (U.S.A.) CORPORATION | USA | Marketing of steel products | 100% | 100% | 100% |
| TENARIS GLOBAL SERVICES NORWAY A.S. | Norway | Marketing of steel products | 100% | 100% | 100% |
| TENARIS GLOBAL SERVICES S.A. and subsidiaries (except detailed) (d) | Uruguay | Holding company and marketing of steel products | 100% | 100% | 100% |
| TENARIS INVESTMENTS LTD and subsidiaries (except detailed) | Ireland | Holding company and financial services | 100% | 100% | 100% |
| TUBOS DE ACERO DE MEXICO SA | Mexico | Manufacturing of seamless steel pipes | 100% | 100% | 100% |
| TUBOS DEL CARIBE LTDA. | Colombia | Manufacturing of welded steel pipes | 100% | 100% | 100% |
102
(*) All percentages rounded.
(a) Tenaris holds 99% of the voting shares of Confab Industrial S.A. Tenaris holds 40% of Confab’s subsidiaries except for Tenaris Confab Hastes de Bombeio S.A.where it holds 70%.
(b) Tenaris holds 100% of Hydril’s subsidiaries except for Technical Drilling & Production Services Nigeria Ltd. where it holds 60%.
(c) Tenaris holds 100% of Siderca’s subsidiaries, except for Scrapservice S.A. where it holds 75%.
(d) Tenaris holds 95% of Tenaris Supply Chain S.A and 95% of Tenaris Saudi Arabia Limited.
32 Processes in Venezuela
(a) Investment in Ternium: Sidor nationalization process
On May 7, 2009, Ternium completed the transfer of its entire 59.7% interest in Sidor to CVG. The transfer was effected as a result of Venezuela’s Decree Law 6058, which ordered that Sidor and its subsidiaries and associated companies be transformed into state-owned enterprises and declared the activities of such companies of public and social interest. While CVG had assumed operational control of Sidor on July 12, 2008, Ternium had retained formal title over the shares until May 7, 2009. Ternium agreed to receive an aggregate amount of $1.97 billion as compensation for its Sidor shares. Of that amount, CVG paid $400 million in cash on May 7, 2009. The balance was divided in two tranches: the first tranche, of $945 million, is being paid in six equal quarterly installments, while the second tranche will be paid at maturity in November 2010, subject to quarterly mandatory prepayment events based on the increase of the WTI crude oil price over its May 6, 2009 level.
As of the date of these financial statements, Ternium has not yet received the Sidor compensation payments required to be made by CVG on February 8, 2010. These payments consist of a $157.5 million principal installment, plus interest, due under the first tranche, and a $141.4 million mandatory prepayment, plus interest, due under the second tranche1. The total balance of the Sidor compensation payments outstanding as of December 31, 2009 amounted to $1.02 billion, plus interest.
(b) Nationalization of Venezuelan Subsidiaries
Within the framework of Decree Law 6058, on May 22, 2009, Venezuela’s President Hugo Chávez announced the nationalization of, among other companies, the Company’s majority-owned subsidiaries TAVSA – Tubos de Acero de Venezuela S.A. (“Tavsa”) and, Matesi, Materiales Siderurgicos S.A (“Matesi”), and Complejo Siderurgico de Guayana, C.A (“Comsigua”), in which the Company has a minority interest (collectively, “the Venezuelan Companies”). On May 25, 2009, the Minister of Basic Industries and Mines of Venezuela (“MIBAM”) issued official communications N°230/09 and 231/09, appointing the MIBAM’s representatives to the transition committees charged with overseeing the nationalization processes of Tavsa and Matesi. On May 29, 2009, the Company sent response letters to the MIBAM acknowledging the Venezuelan government’s decision to nationalize Tavsa and Matesi, appointing its representatives to the transition committees, and reserving all of its rights under contracts, investment treaties and Venezuelan and international law and the right to submit any controversy between the Company or its subsidiaries and Venezuela relating to Tavsa and Matesi’s nationalization to international arbitration, including arbitration administered by ICSID.
On July 14, 2009, President Chávez issued Decree 6796, which orders the acquisition of the Venezuelan Companies’ assets and provides that Tavsa’s assets will be held by the Ministry of Energy and Oil, while Matesi and Comsigua’s assets will be held by MIBAM. Decree 6796 also requires the Venezuelan government to create certain committees at each of the Venezuelan Companies; each transition committee must ensure the nationalization of each Venezuelan Company and the continuity of its operations, and each technical committee (to be composed of representatives of Venezuela and the private sector) must negotiate over a 60-day period (extendable by mutual agreement) a fair price for each Venezuelan Company to be transferred to Venezuela. In the event the parties fail to reach agreement by the expiration of the 60-day period (or any extension thereof), the applicable Ministry will assume control and exclusive operation of the relevant Venezuelan Company, and the Executive Branch will order their expropriation in accordance with the Venezuelan Expropriation Law. The Decree also specifies that all facts and activities there under are subject to Venezuelan law and any disputes relating thereto must be submitted to Venezuelan courts.
103
On August 19, 2009, the Company announced that Venezuela, acting through the transition committee appointed by the MIBAM, unilaterally assumed exclusive operational control over Matesi.
On November 17, 2009, the Company announced that Venezuela acting through PDVSA Industrial S.A. (a subsidiary of Petroleos de Venezuela S.A.), formally assumed exclusive operational control over the assets of Tavsa. Following this formal change in operational control, PDVSA Industrial has assumed complete responsibility over Tavsa’s operations and management and since then Tavsa’s operations are being managed by the transition committee previously appointed by Venezuela. The Company’s representatives in Tavsa’s board of directors have ceased in their functions.
The Company’s investments in Tavsa, Matesi and Comsigua are protected under applicable bilateral investment treaties, including the bilateral investment treaty between Venezuela and the Belgian-Luxembourgish Union, and, as noted above, Tenaris continues to reserve all of its rights under contracts, investment treaties and Venezuelan and international law, and to consent to the jurisdiction of the ICSID in connection with the nationalization process.
Based on the facts and circumstances described above and following the guidance set forth by IAS 27, the Company ceased consolidating the Venezuelan Companies results of operations and cash flows as from June 30, 2009 and classified its investments in the Venezuelan Companies as financial assets based on the definitions contained in paragraphs 11(c)(i) and 13 of IAS 32.
The Company classified its interests in the Venezuelan Companies as available-for-sale investments since management believes they do not fulfill the requirements for classification within any of the remaining categories provided by IAS 39 and such classification is the most appropriate accounting treatment applicable to non-voluntary dispositions of assets.
Tenaris subsidiaries have also net receivables with the Venezuelan Companies as of December 31, 2009 for a total amount of $27.7 million.
The Company records its interest in the Venezuelan Companies at its carrying amount at June 30, 2009, and not at fair value, following the guidance set forth by paragraphs 46(c), AG80 and AG81 of IAS 39.
33 Subsequent events
Annual Dividend Proposal
On February 24, 2010 the Company’s board of directors proposed, for the approval of the annual general shareholders' meeting to be held on June 2, 2010, the payment of an annual dividend of $0.34 per share ($0.68 per ADS), or approximately $401 million, which includes the interim dividend of $0.13 per share ($0.26 per ADS) paid on November 26, 2009. If the annual dividend is approved by the shareholders, a dividend of $0.21 per share ($0.42 per ADS), or approximately $248 million will be paid on June 24, 2010, with an ex-dividend date of June 21, 2010. These Consolidated Financial Statements do not reflect this dividend payable.
| Ricardo Soler | ||
| Chief Financial Officer |
104
Tenaris S.A. Annual Accounts (Luxembourg GAAP)
As at December 31, 2009
105

We have audited the accompanying annual accounts of Tenaris S.A., which comprise the balance sheet as at December 31, 2009, and the profit and loss account for the year then ended, and a summary of significant accounting policies and other explanatory notes.
Board of Directors’ responsibility for the annual accounts
The Board of Directors is responsible for the preparation and fair presentation of these annual accounts in accordance with Luxembourg legal and regulatory requirements relating to the preparation of the annual accounts. This responsibility includes: designing, implementing and maintaining internal control relevant to the preparation and fair presentation of annual accounts that are free from material misstatement, whether due to fraud or error; selecting and applying appropriate accounting policies; and making accounting estimates that are reasonable in the circumstances.
Auditor’s responsibility
Our responsibility is to express an opinion on these annual accounts based on our audit. We conducted our audit in accordance with International Standards on Auditing as adopted by the “Institut des Réviseurs d’Entreprises”. Those standards require that we comply with ethical requirements and plan and perform the audit to obtain reasonable assurance whether the annual accounts are free from material misstatement.
An audit involves performing procedures to obtain audit evidence about the amounts and disclosures in the annual accounts. The procedures selected depend on the Auditor’s judgment, including the assessment of the risks of material misstatement of the annual accounts, whether due to fraud or error. In making those risk assessments, the Auditor considers internal control relevant to the entity’s preparation and fair presentation of the annual accounts in order to design audit procedures that are appropriate in the circumstances, but not for the purpose of expressing an opinion on the effectiveness of the entity’s internal control. An audit also includes evaluating the appropriateness of accounting policies used and the reasonableness of accounting estimates made by the Board of Directors, as well as evaluating the overall presentation of the annual accounts.
106
We believe that the audit evidence we have obtained is sufficient and appropriate to provide a basis for our audit opinion.
Opinion
In our opinion, these annual accounts give a true and fair view of the financial position of Tenaris S.A. as of December 31, 2009 and of the results of its operations for the year then ended in accordance with Luxembourg legal and regulatory requirements relating to the preparation of annual accounts.
Report on other legal and regulatory requirements
The management report, which is the responsibility of the Board of Directors, is in accordance with the annual accounts.
| PricewaterhouseCoopers S.à r.l. Réviseur d’entreprises Represented by | Luxembourg, April 22, 2010 |
Mervyn R. Martins
107
Tenaris S.A.
Balance Sheet as at December 31, 2009
(expressed in United States Dollars)
| 2009 | 2008 | |||||||||||
| Note | USD | USD | ||||||||||
| ASSETS | ||||||||||||
| Fixed assets | ||||||||||||
| Shares in affiliated undertakings | 4.1 | 5,178,485,164 | 5,178,465,164 | |||||||||
| Loans to affiliated undertakings | 4.2 | 647,227,300 | 243,727,300 | |||||||||
| Other receivables | 3 | 336,677 | - | |||||||||
| 5,826,049,141 | 5,422,192,464 | |||||||||||
| Current assets | ||||||||||||
| Loans to affiliated undertakings | 5 | 53,382,238 | 35,998,143 | |||||||||
| Other receivables | 3 | 499,899 | 408,643 | |||||||||
| Short term investments | 6 | 37,047,072 | - | |||||||||
| Cash at banks, cash in hand and cash equivalents | 6 | 337,831,372 | 204,715,687 | |||||||||
| 428,760,581 | 241,122,473 | |||||||||||
| Total assets | 6,254,809,722 | 5,663,314,937 | ||||||||||
| LIABILITIES | ||||||||||||
| Equity | 7 | |||||||||||
| Subscribed capital | 1,180,536,830 | 1,180,536,830 | ||||||||||
| Share premium account | 609,732,757 | 609,732,757 | ||||||||||
| Legal reserve | 8 | 118,053,683 | 118,053,683 | |||||||||
| Retained earnings | 9 | 2,667,301,597 | 1,951,369,792 | |||||||||
| Profit for the financial year | 1,249,181,146 | 1,223,562,643 | ||||||||||
| 5,824,806,013 | 5,083,255,705 | |||||||||||
| Provisions | ||||||||||||
| Tax provision | 11 | 572,186 | 513,042 | |||||||||
| Other provisions | 875,959 | 659,494 | ||||||||||
| 1,448,145 | 1,172,536 | |||||||||||
| Creditors | ||||||||||||
| Amounts owed to affiliated undertakings | 12 | |||||||||||
| - due and payable within a year | 239,147,777 | 315,434,121 | ||||||||||
| - due and payable within more than a year | 6,250,000 | 6,250,000 | ||||||||||
| Amounts owed to credit institutions | 13 | |||||||||||
| - due and payable within a year | 71,515,215 | 252,607,552 | ||||||||||
| - due and payable within more than a year | 107,142,857 | - | ||||||||||
| Other creditors due and payable within a year | 4,499,715 | 4,595,023 | ||||||||||
| 428,555,564 | 578,886,696 | |||||||||||
| Total liabilities | 6,254,809,722 | 5,663,314,937 | ||||||||||
The accompanying notes are an integral part of these annual accounts.
108
Tenaris S.A.
Profit and loss account for the financial year ended December 31, 2009
(expressed in United States Dollars)
| 2009 | 2008 | |||||||||||
| Note | USD | USD | ||||||||||
| CHARGES | ||||||||||||
| Amortization of reorganization cost | - | 267,500 | ||||||||||
| Administrative and general expenses | 14 | 17,654,147 | 7,843,048 | |||||||||
| Value adjustments in respect of financial assets | 4.1 | - | 72,665,029 | |||||||||
| Interest expense - affiliated undertakings | 15 | 5,900,158 | 28,300,129 | |||||||||
| Interest expense - syndicated loan | 4,226,576 | 25,657,583 | ||||||||||
| Cost for issue of debt | 3 | 441,252 | 3,753,050 | |||||||||
| Realized loss on exchange | 388,389 | 81,495 | ||||||||||
| Other financial results | - | 2,802,000 | ||||||||||
| Taxes | 11 | 2,839,310 | 1,958,553 | |||||||||
| Profit for the financial year | 1,249,181,146 | 1,223,562,643 | ||||||||||
| Total charges | 1,280,630,978 | 1,366,891,030 | ||||||||||
| INCOME | ||||||||||||
| Dividend income | 16 | 1,265,459,659 | 1,338,867,500 | |||||||||
| Interest income - affiliated undertakings | 17 | 13,698,526 | 26,928,964 | |||||||||
| Interest income - third parties | 18 | 1,452,857 | 968,962 | |||||||||
| Realized gain on short term investments | - | 64,384 | ||||||||||
| Realized gain on exchange | 19,936 | 61,220 | ||||||||||
| Total income | 1,280,630,978 | 1,366,891,030 | ||||||||||
The accompanying notes are an integral part of these annual accounts.
109
Tenaris S.A.
Notes to audited annual accounts as at December 31, 2009
Note 1 – Background and description of the business
Tenaris S.A. (the “Company” or “Tenaris”) was incorporated on December 17, 2001 under the name of Tenaris Holding S.A. as a limited liability company (taking advantage of the law of July 31, 1929, on holding companies) under the laws of Luxembourg. Then, on June 26, 2002, it changed its name to Tenaris S.A.
Tenaris’s objective is to invest mainly in companies that manufacture and market steel tubes and other related businesses.
Tenaris prepares and publishes consolidated financial statements which include further information on Tenaris and its subsidiaries. They are available at the registered office of the Company, 46a avenue John F. Kennedy, L-1855, Luxembourg.
Note 2 – Summary of significant accounting policies
2.1 Accounts
The annual accounts have been prepared in accordance with Luxembourg legal requirements and accounting standards, on a basis consistent to that used in the annual accounts for the financial year ended December 31, 2008.
Certain comparative amounts have been reclassified to conform to changes in presentation in the current year.
2.2 Foreign currency translation
Current assets and liabilities denominated in currencies other than the United States Dollar (“USD”) are translated into USD at the rate of exchange at the balance sheet date. The resulting gains or losses are reflected in the Profit and loss account for the financial year. Income and expenses in currencies other than the USD are translated into USD at the exchange rate prevailing at the date of each transaction.
2.3 Fixed assets
Shares in affiliated undertakings are stated at cost, adding to the price paid the expenses incidental thereto.
Loans to affiliated undertakings are stated at amortized cost.
Whenever necessary, the Company conducts impairment tests on its fixed assets in accordance with Luxembourg regulations.
In case of other than a temporary decline in respect of the fixed assets value, its carrying value will be reduced to recognize this decline. If there is a change in the reasons for which the value adjustments were made, these adjustments could be reversed, if appropriate.
2.4 Short term investments, Cash at banks, cash in hand and cash equivalents
Short term investments and liquidity funds are valued at market value or at historical cost which approximates fair market value expressed in USD, at the balance sheet date.
110
Tenaris S.A.
Notes to audited annual accounts as at December 31, 2009 (Cont’d)
2.5 Financial liabilities
Financial liabilities are stated at amortized cost. The related transaction costs are initially recognized as an asset included in “Other receivables”, and subsequently amortized over the period of the debt, taking into account prepayments, if any.
Note 3 – Other receivables
| 2009 | 2008 | |||||||||||||||
| Current | Non-current | Current | Non-current | |||||||||||||
| Cost | USD | USD | USD | USD | ||||||||||||
Values at the beginning of the period (1) | 3,824,457 | 5,413,609 | 3,798,103 | 5,413,609 | ||||||||||||
Additions (2) | 348,958 | 500,227 | 26,354 | - | ||||||||||||
| 4,173,415 | 5,913,836 | 3,824,457 | 5,413,609 | |||||||||||||
| Amortization of cost for issue of debt | ||||||||||||||||
| - at the beginning of the financial year | 3,415,814 | 5,413,609 | 734,119 | 4,374,754 | ||||||||||||
- charge of the financial year (3) | 257,702 | 163,550 | 2,681,695 | 1,038,855 | ||||||||||||
| - at the end of the period | 3,673,516 | 5,577,159 | 3,415,814 | 5,413,609 | ||||||||||||
| Net book value at the end of the period | 499,899 | 336,677 | 408,643 | - | ||||||||||||
(1) Corresponds to the deferred costs for issue of debt, except for prepaid expenses included in the short term portion (2009: USD 150,943 and 2008: 124,587).
(2) Includes the net movement of prepaid expenses during the financial year (2009: USD 99,183 and 2008: USD 26,354).
(3) Amounts included in the caption "Cost for issue of debt" in the Profit and loss account for the fiscal year ended December 31, 2009 and 2008.
111
Tenaris S.A.
Notes to audited annual accounts as at December 31, 2009 (Cont’d)
Note 4 – Fixed assets
4.1 Shares in affiliated undertakings
Movements of investments in affiliated undertakings during the financial year are as follows:
| Company | Country | % of ownership | Book value at 12.31.2008 | Additions | Decreases | Book value at 12.31.2009 | |||||||||||||||
| (*) | USD | ||||||||||||||||||||
| Maverick Tube Corporation | U.S.A. | 100.0 | % | 1,717,756,800 | - | (136,157,993 | ) | 1,581,598,807 | |||||||||||||
| Siderca S.A.I.C. | Argentina | 100.0 | % | 1,604,950,726 | - | - | 1,604,950,726 | ||||||||||||||
| Hydril Company | U.S.A. | 100.0 | % | 960,208,982 | - | (873,790,174 | ) | 86,418,808 | |||||||||||||
| Ternium S.A. | Luxembourg | 11.5 | % | 459,970,986 | - | - | 459,970,986 | ||||||||||||||
| Tubos de Acero de México S.A. | Mexico | 100.0 | % | 303,244,203 | - | - | 303,244,203 | ||||||||||||||
| Tenaris Investments Limited | Ireland | 100.0 | % | 50,010,000 | 1,009,968,167 | - | 1,059,978,167 | ||||||||||||||
| Tenaris Global Services S.A. | Uruguay | 100.0 | % | 63,047,650 | - | - | 63,047,650 | ||||||||||||||
| Tenaris Connections Limited | St Vincent & The Grenadines | 100.0 | % | 11,567,000 | - | - | 11,567,000 | ||||||||||||||
| Sidtam Limited | British Virgin Islands | 100.0 | % | 7,702,000 | - | - | 7,702,000 | ||||||||||||||
| Talta - Trading e Marketing, Sociedade Unipessoal Lda. | Madeira | 100.0 | % | 6,817 | - | - | 6,817 | ||||||||||||||
| CAD Investments International S.R.L. | Barbados | 0.0 | % | - | 1,009,968,167 | (1,009,968,167 | ) | - | |||||||||||||
| Shares in affiliated undertakings | 5,178,465,164 | 2,019,936,334 | (2,019,916,334 | ) | 5,178,485,164 | ||||||||||||||||
(*) It represents the equity interest held directly by Tenaris and through any of its subsidiaries.
On January 23, 2009, Tenaris established CAD Investments International S.R.L. (“CAD Investments”) a wholly-owned subsidiary. On January 28, 2009 Tenaris transferred to CAD Investments 910 shares of Hydril Company (“Hydril”), representing 91% of the issued and outstanding shares of Hydril in exchange for newly issued shares in CAD Investments. On September 22, 2009 Tenaris transferred to CAD Investments 63,412 shares of Maverick Tube Corporation (“Maverick”), representing 6.3412% of the issued and outstanding shares of Maverick.
112
Tenaris S.A.
Notes to audited annual accounts as at December 31, 2009 (Cont’d)
On September 25, 2009, Tenaris transferred to its wholly-owned Irish subsidiary, Tenaris Investment Limited (“Tenaris Investment”) all of CAD Investments’ quotas, in exchange for a newly issued share of Tenaris Investment. On December 28, 2009, CAD Investments was dissolved.
These transfers were recorded at book value.
On December 15, 2009, the Company´s subsidiary previously named Tenaris Connections A.G. and originally incorporated under the jurisdiction of Liechtenstein, was registered in St Virgin & the Grenadines, under the name of Tenaris Connections Limited.
Maverick Tube Corporation (“Maverick”)
At December 31, 2008 Tenaris determined that, due to changes in economic and financial market conditions, the carrying value of the shares in Maverick exceeded its recoverable amount. As a consequence, the Company recognized an impairment charge of USD 72.7 million under the caption "Value adjustments in respect of financial assets" in the Profit and loss account for the financial year
ended December 31, 2008.
4.2 Loans to affiliated undertakings
| 2009 | 2008 | |||||||
| USD | USD | |||||||
| Maverick Tube Corporation | 475,500,000 | 110,000,000 | ||||||
| Hydril Company | 171,727,300 | 133,727,300 | ||||||
| 647,227,300 | 243,727,300 | |||||||
In connection with Hydril acquisition, in May 2007 Tenaris granted a loan to Hokkaido, a company subsequently merged with and into Hydril, for a principal amount of USD 806.6 million, which was partially prepaid; the principal amount outstanding as of December 31, 2009 was USD101.7 million. This loan accrues interest at Libor plus 1% with a final maturity on November 7, 2012. During 2009, Tenaris granted additional loans to Hydril for a principal amount of USD 95.0 million (principal amount of USD 25.0 million disclosed as current in Note 5: "Current assets – Loans to affiliated undertakings”), which remained outstanding as of December 31, 2009. All loans are subordinated and subject in right of payment to the obligations of Hydril under the USD 300.0 million syndicated loan agreement signed by Hydril on April 19, 2007, as amended. As of December 31, 2009, the principal outstanding amount under Hydril syndicated loan totaled USD 166.7 million.
On December 27, 2007, Tenaris granted a loan to Maverick, for a principal amount of USD 110.0 million, out of which the principal amount of USD 90.0 million is outstanding as of December 31, 2009. This loan accrues interest at Libor plus 1%, is payable semiannually and matures on December 27, 2012. During 2009, Tenaris granted additional loans to Maverick for a principal amount of USD 410.5 million (principal amount of USD 25.0 million disclosed as current in Note 5: "Current assets – Loans to affiliated undertakings”), which remained outstanding as of December 31, 2009. Maverick syndicated loan was fully prepaid in December 2009.
113
Tenaris S.A.
Notes to audited annual accounts as at December 31, 2009 (Cont’d)
Note 5 – Current assets – Loans to affiliated undertakings
| 2009 | 2008 | |||||||
| USD | USD | |||||||
Hydril Company (1) | 27,512,639 | 35,954,504 | ||||||
Maverick Tube Corporation (2) | 25,869,599 | 43,542 | ||||||
| Tenaris Investments Limited | - | 97 | ||||||
| 53,382,238 | 35,998,143 | |||||||
| (1) | Includes the outstanding interests of the loans mentioned in Note 4.2 (2009: USD 2,512,639 and 2008: 3,545,654). |
| (2) | Includes the outstanding interests of the loans mentioned in Note 4.2 (2009: USD 869,599 and 2008: 43,542). |
Note 6 – Short term investments, Cash at banks, cash in hand and cash equivalents
| 2009 | 2008 | |||||||
| USD | USD | |||||||
| Short term securities investments | 37,047,072 | - | ||||||
| Liquidity funds & Cash at banks | 337,797,702 | 204,654,264 | ||||||
| Time deposits with affiliated undertakings | 33,670 | 61,423 | ||||||
| 374,878,444 | 204,715,687 | |||||||
Note 7 –Equity
| Item | Suscribed capital | Share premium account | Legal reserve | Retained earnings | Equity | |||||||||||||||
| USD | ||||||||||||||||||||
| Balance at the beginning of the year | 1,180,536,830 | 609,732,757 | 118,053,683 | 3,174,932,435 | 5,083,255,705 | |||||||||||||||
Dividend paid (1) | - | - | - | (354,161,050 | ) | (354,161,050 | ) | |||||||||||||
Interim dividend (2) | - | - | - | (153,469,788 | ) | (153,469,788 | ) | |||||||||||||
| Profit for the financial year | - | - | - | 1,249,181,146 | 1,249,181,146 | |||||||||||||||
| Balance at the end of the period | 1,180,536,830 | 609,732,757 | 118,053,683 | 3,916,482,743 | 5,824,806,013 | |||||||||||||||
| (1) | As approved by the ordinary shareholder’s meeting held on June 3, 2009. |
| (2) | As approved by the board of director’s meeting held on November 5, 2009. |
The authorized capital of the Company amounts to USD 2.5 billion. The total authorized share capital of the Company is represented by 2,500,000,000 shares with a par value of USD 1 per share. The total capital issued and fully paid-up at December 31, 2009 was 1,180,536,830 shares with a par value of USD 1 per share.
The board of directors is authorized until August 2, 2012, to increase the issued share capital, through issues of shares within the limits of the authorized capital.
114
Tenaris S.A.
Notes to audited annual accounts as at December 31, 2009 (Cont’d)
Note 8 – Legal reserve
In accordance with Luxembourg law, the Company is required to set aside a minimum of 5% of its annual net profit for each financial year to a legal reserve. This requirement ceases to be necessary once the balance on the legal reserve has reached 10% of the issued subscribed capital. The Company’s reserve has already reached this 10%. The legal reserve is not available for distribution to the shareholders.
Note 9 – Distributable amounts
Dividends may be paid by Tenaris upon the ordinary shareholders’ meeting’s approval to the extent distributable retained earnings exist.
At December 31, 2009, the retained earnings and profit for the financial year of Tenaris under Luxembourg law totaled USD 3.9 billion.
The share premium account amounting to USD 0.6 billion can also be reimbursed.
Note 10 – Interim dividend paid
In November 2009, the Company paid an interim dividend of USD 153 million based on the board of director’s decision of November 5, 2009 and in compliance with the conditions set out in the “Amended law of August 10, 1915 on commercial companies” regarding the payment of interim dividends.
Note 11 – Taxes
The Company is subject to the tax regime applicable to billionaire holdings as defined by the law dated July 31, 1929.
Following a previously announced decision by the European Commission, the Grand-Duchy of Luxembourg has terminated its 1929 holding company regime, effective January 1, 2007. However, under the implementing legislation, pre-existing publicly listed companies -including Tenaris- will be entitled to continue benefiting from their current tax regime until December 31, 2010.
In addition to the corresponding charge of the above mentioned tax regime, the Company included the withholding taxes on dividends received, amounting to USD 2.1 million and USD 1.3 million, under the caption “Taxes” in the Profit and loss account for the financial years ended December 31, 2009 and 2008, respectively.
115
Tenaris S.A.
Notes to audited annual accounts as at December 31, 2009 (Cont’d)
Note 12 – Creditors – Amounts owed to affiliated undertakings
| 2009 | 2008 | |||||||
| USD | USD | |||||||
| - due and payable within a year | ||||||||
| Other creditors | 12,718,012 | 1,608,051 | ||||||
Loans for acquisition of shares in subsidiaries companies (1) | 226,429,765 | 313,823,361 | ||||||
| Overdrafts | - | 2,709 | ||||||
| 239,147,777 | 315,434,121 | |||||||
| - due and payable within more than a year | ||||||||
Loans for acquisition of shares in subsidiaries companies (1) | 6,250,000 | 6,250,000 | ||||||
| 6,250,000 | 6,250,000 | |||||||
(1) Terms and conditions of Loans for acquisition of shares in subsidiaries companies are as follows:
| 2009 | 2008 | ||||||
| Lender | Due | Interest rate (*) | Current | Non-current | Current | Non-current | |
| USD | |||||||
| Siderca International ApS | 2010 | L + 0.35% | 226,413,103 | - | 220,715,607 | - | |
| Techint Investments Netherlands B.V. | 2011 | L + 0.50% | 16,662 | 6,250,000 | 67,971 | 6,250,000 | |
| Tenaris Financial Services S.A. | 2012 | L + 0.35% | - | - | 93,039,783 | - | |
| Loans for acquisition of shares in subsidiaries companies | 226,429,765 | 6,250,000 | 313,823,361 | 6,250,000 | |||
(*) L: LIBOR
During the fiscal year ended December 31, 2009, Tenaris fully prepaid the remaining outstanding of USD 93.0 million of the loan granted by Tenaris Financial Services S.A. on December 27, 2007, for a principal amount of USD 410.0 million.
Note 13 – Creditors – Amounts owed to credit institutions
| 2009 | 2008 | |||||||
| USD | USD | |||||||
| - due and payable within a year | ||||||||
| Principal - short term portion | 71,428,572 | 250,000,000 | ||||||
| Interest accrued | 86,643 | 2,607,552 | ||||||
| 71,515,215 | 252,607,552 | |||||||
| - due and payable within more than a year | ||||||||
| Principal - long term portion | 107,142,857 | - | ||||||
| 107,142,857 | - | |||||||
116
Tenaris S.A.
Notes to audited annual accounts as at December 31, 2009 (Cont’d)
It corresponds to the outstanding amounts relating to the syndicated loan agreement entered into by the Company to finance the acquisition of Hydril and to refinance an existing loan in the Company.
This borrowing accrues interest at Libor plus 0.5% and is payable in seven equal installments, the first one due in May 2009 and the each following every six months.
Note 13 – Creditors – Amounts owed to credit institutions (Cont’d)
The main covenants on this syndicated loan agreement are limitations on liens and encumbrances, limitations on the sale of certain assets, restrictions on investments and compliance with financial ratios (e.g., leverage ratio and debt service coverage ratio calculated in the Company’s consolidated and unconsolidated financial statements, respectively). As at December 31, 2009, Tenaris was in compliance with all of its covenants.
Note 14 – Administrative and general expenses
| 2009 | 2008 | |||||||
| USD | USD | |||||||
| Services and fees | 13,812,815 | 2,446,032 | ||||||
| Board of director's accrued fees | 3,629,120 | 4,510,150 | ||||||
| Others | 212,212 | 886,866 | ||||||
| 17,654,147 | 7,843,048 | |||||||
In 2009 there was an increase of USD 9.8 million in administrative and general expenses attributable to higher corporate expenses mainly comprised of personnel costs, legal and other fees.
Note 15 – Interest expense – affiliated undertakings
During the financial year ended December 31, 2009, the Company accrued the following interest from its debts and overdrafts with affiliated undertakings:
| 2009 | 2008 | |||||||
| USD | USD | |||||||
| Siderca International ApS | 5,697,495 | 7,374,002 | ||||||
| Techint Investments Netherlands B.V. | 162,446 | 264,845 | ||||||
| Tenaris Financial Services S.A. | 40,160 | 20,661,257 | ||||||
| Tenaris Investments Limited | 57 | 25 | ||||||
| 5,900,158 | 28,300,129 | |||||||
Note 16 – Dividend income
During the financial year ended December 31, 2009 and December 31, 2008, the Company received dividends from its affiliated undertakings amounting to USD 1,265.5 million and USD 1,338.9 million, respectively.
117
Tenaris S.A.
Notes to audited annual accounts as at December 31, 2009 (Cont’d)
Note 17 – Interest income – affiliated undertakings
During the financial year ended December 31, 2009, the Company accrued the following interest from its loans to and time deposits with affiliated undertakings:
| 2009 | 2008 | |||||||
| USD | USD | |||||||
| Maverick Tube Corporation | 7,043,572 | 5,512,777 | ||||||
| Hydril Company | 6,654,443 | 21,281,199 | ||||||
| Tenaris Financial Services S.A. | 257 | 367 | ||||||
| Tenaris Investments Limited | 254 | 5,446 | ||||||
| Tenaris Global Services S.A. | - | 129,175 | ||||||
| 13,698,526 | 26,928,964 | |||||||
Note 18 – Interest income – third parties
During the financial year ended December 31, 2009, the Company accrued the following interest from its cash equivalents and its short term investments:
| 2009 | 2008 | |||||||
| USD | USD | |||||||
| Liquidity funds | 1,374,883 | 931,500 | ||||||
| Others | 77,974 | 37,462 | ||||||
| 1,452,857 | 968,962 | |||||||
Note 19 – Contingencies and Off balance sheet commitments
Maverick litigation
On November 22, 2006, Maverick received a letter from The Bank of New York as trustee (“the Trustee”) for the holders of 2004 4% Convertible Senior Subordinated Notes due 2033 issued by Maverick (“the 2004 Notes”), concerning an alleged breach of the indenture entered into on December 30, 2004, between Maverick and the Trustee, and governing the 2004 Notes (as amended, the “Indenture”). The alleged breach of the Indenture was based on Maverick’s refusal to grant the holders of the 2004 Notes conversion rights provided by the “Public Acquirer Change of Control” provision of the Indenture.
On December 11, 2006, the Trustee filed a complaint against Maverick and Tenaris in the United States District Court for the Southern District of New York. The complaint alleged that Tenaris’ acquisition of Maverick triggered the “Public Acquirer Change of Control” provision and asserted a breach of contract claim against Maverick for refusing to accept the 2004 Notes for conversion for the consideration specified in the “Public Acquirer Change of Control” provision. The complaint also seeks a declaratory judgment that Tenaris’ acquisition of Maverick was a “Public Acquirer Change of Control” under the Indenture, and therefore triggers the above mentioned conversion rights, and asserts claims for tortious interference with contract and unjust enrichment against Tenaris.
118
Tenaris S.A.
Notes to audited annual accounts as at December 31, 2009 (Cont’d)
Defendants filed a motion to dismiss the complaint, or in the alternative, for summary judgment on March 13, 2007. Plaintiff filed a motion for partial summary judgment on the same date. On January 25, 2008, Law Debenture Trust Company of New York (as successor to BNY as trustee under the Indenture) was substituted for The Bank of New York as plaintiff. On October 15, 2008, the court denied Law Debenture’s motion for partial summary judgment and granted defendants’ motion for summary judgment dismissing the complaint in its entirety.
On February 19, 2010, the United States Court of Appeals for the Second Circuit affirmed the District Court's judgment. The plaintiff is entitled to file a motion for rehearing, or rehearing en banc, with the Court of Appeals, or a petition for certiorari with the U.S. Supreme Court. The Company believes that the plaintiff's chances of prevailing on further appeal are remote.
Customer Claim
A lawsuit was filed on September 6, 2007, against three Tenaris’ subsidiaries, alleging negligence, gross negligence and intentional acts characterized as fraudulent inducement concerning allegedly defective well casing. Plaintiff alleged the complete loss of one natural gas production well and formation damage that precludes further exploration and production at the well site and sought compensatory and punitive damages of USD 25 million. The lawsuit was subsequently amended to add the Company and other of its subsidiaries as defendants and to change the claims to be breach of contract and fraud. On October 22, 2008, the Plaintiff again amended its petition to add new counts (including strict liability) and increase its prayer for damages to USD 245 million, plus punitive damages, treble damages and attorney fees. Each petition was tendered to a Tenaris subsidiary insurer, and the Tenaris subsidiary received the insurer’s agreement to provide a defense. The insurer reserved its rights with respect to its indemnity obligations. On July 20, 2009 the lawsuit was settled for an amount of USD 15 million and thus a Tenaris subsidiary recorded a loss of USD 12.7 million in addition to the previously recorded of USD 2.3 million. As of the date of these annual accounts, the insurer is not participating in this settlement. On September 11, 2009 certain Tenaris subsidiaries initiated legal proceedings against the insurer.
Ongoing investigation
The Company has learned from one of its customers in Central Asia that certain sales agency payments made by one of the Company’s subsidiaries may have improperly benefited employees of the customer and other persons. These payments may have violated certain applicable laws, including the U.S. FCPA (“Foreign corrupt practices act”). The Audit Committee of the Company’s Board of Directors has engaged external counsel in connection with a review of these payments and related matters, and the Company has voluntarily notified the U.S. Securities and Exchange Commission and the U.S. Department of Justice. The Company will share the results of this review with the appropriate regulatory agencies, and will cooperate with any investigations that may be conducted by such agencies. At this time, the Company cannot predict the outcome of these matters or estimate the range of potential loss or extent of risk, if any, to the Company’s business that may result from resolution of these matters.
119
Tenaris S.A.
Notes to audited annual accounts as at December 31, 2009 (Cont’d)
Maverick Convertible Senior Subordinated Notes’ guarantee
As result of the Maverick acquisition, the Company has fully and unconditionally guaranteed to each holder of 1.875% Convertible Senior Subordinated Notes (the “Notes”) issued by Maverick on November 15, 2005, and due in 2025, the due and punctual payment of the principal of and any premium and interest on such Notes.
Note 20 – Parent Company
Based on the information most recently available to the Company, as of December 31, 2009:
| § | San Faustin N.V. owned 713,605,187 shares in the Company, representing 60.45% of the Company’s capital and voting rights. |
| § | San Faustin N.V. owned all of its shares in the Company through its wholly-owned subsidiary I.I.I. Industrial Investments Inc. |
| § | Rocca & Partners S.A. controlled a significant portion of the voting power of San Faustin N.V. and had the ability to influence matters affecting, or submitted to a vote of the shareholders of San Faustin N.V., such as the election of directors, the approval of certain corporate transactions and other matters concerning the company’s policies. |
| § | There were no controlling shareholders for Rocca & Partners S.A. |
Based on the information most recently available to the Company, as of December 31, 2009, Tenaris’ directors and senior management as a group owned 0.14% of the Company’s outstanding shares, while the remaining 39.41% were publicly traded.
Note 21 – Subsequent events
Annual Dividend Proposal
On February 24, 2010 the Company’s board of directors proposed, for the approval of the annual general shareholders' meeting to be held on June 2, 2010, the payment of an annual dividend of USD 0.34 per share (USD 0.68 per ADS) or approximately USD 401 million, which includes the interim dividend of USD 0.13 per share (USD 0.26 per ADS) paid in November, 2009. If the annual dividend is approved by the shareholders, a dividend of USD 0.21 per share (USD 0.42 per ADS), or approximately USD 248 million will be paid on June 24, 2010, with an ex-dividend date of June 21, 2010. These annual accounts do not reflect this dividend payable.
Ricardo Soler Chief Financial Officer |
120
Corporate Information
Registered Office
46A, avenue John F. Kennedy
L-1855 Luxembourg
(352) 26 47 89 78 tel
(352) 26 47 89 79 fax
| Principal Offices Av. L. N. Alem 1067 27th Floor (C1001AAF) Buenos Aires, Argentina (54) 11 4018 4100 tel (54) 11 4018 1000 fax | 2200 West Loop South, Suite 800 Houston, TX 77027, USA (1) 713 767 4400 tel (1) 713 767 4444 fax |
| Piazza Caduti 6 Luglio 1944, 1 24044 Dalmine (Bergamo), Italy (39) 035 560 1111 tel (39) 035 560 3827 fax | Edificio Parque Reforma Campos Elíseos 400 17th Floor 11560 Mexico, D.F. (52) 55 5282 9900 tel (52) 55 5282 9961 fax |
INVESTOR INFORMATION
Investor Relations Director
Giovanni Sardagna
| Phones USA 1 888 300 5432 Argentina (54) 11 4018 2928 Italy (39) 02 4384 7654 Mexico (52) 55 5282 9929 | General Inquiries investors@tenaris.com |
| Stock Information New York Stock Exchange (TS) Mercato Telematico Azionario (TEN) Mercado de Valores de Buenos Aires (TS) Bolsa Mexicana de Valores, S.A. de C.V. (TS) | ADS Depositary Bank The Bank of New York CUSIP No. 88031M019 |
Internet
www.tenaris.com
121