SECURITIES AND EXCHANGE COMMISSION
Washington, D.C. 20549
FORM 6-K
Report of Foreign Private Issuer
Pursuant to Rule 13a-16 or 15d-16
of the Securities Exchange Act of 1934
For the Month of March 2021
Commission File Number 1-31517
China Telecom Corporation Limited
(Translation of registrant’s name into English)
31 Jinrong Street, Xicheng District
Beijing 100033, China
(Address of principal executive offices)
(Indicate by check mark whether the registrant files or will file annual reports under cover of Form 20-F or Form 40-F.)
Form 20-F ☒ Form 40-F ☐
(Indicate by check mark if the registrant is submitting the Form 6-K in paper as permitted by Regulation S-T Rule 101(b)(1): ☐)
(Indicate by check mark if the registrant is submitting the Form 6-K in paper as permitted by Regulation S-T Rule 101(b)(7): ☐)
(Indicate by check mark whether the registrant by furnishing the information contained in this Form is also thereby furnishing the information to the Commission pursuant to Rule 12g3-2(b) under the Securities Exchange Act of 1934.)
Yes ☐ No ☒
(If “Yes” is marked, indicate below the file number assigned to the registrant in connection with Rule 12g3-2(b):82- .)
EXHIBITS
FORWARD-LOOKING STATEMENTS
Certain statements contained in this Form 6-K may be viewed as “forward-looking statements” within the meaning of Section 27A of the Securities Act of 1933, as amended, and Section 21E of the Securities Exchange Act of 1934, as amended, or the Exchange Act. These forward-looking statements are, by their nature, subject to significant risks and uncertainties, and include, without limitation, statements relating to:
| • | our business and operating strategies and our ability to successfully execute these strategies; |
| • | our network expansion and capital expenditure plans; |
| • | our operations and business prospects; |
| • | the expected benefit of any acquisitions or other strategic transactions; |
| • | our financial condition and results of operations; |
| • | the expected impact of new services on our business, financial condition and results of operations; |
| • | the future prospects of and our ability to integrate acquired businesses and assets; |
| • | the industry regulatory environment as well as the industry outlook generally; and |
| • | future developments in the telecommunications industry in the People’s Republic of China, or the PRC. |
The words “anticipate,” “believe,” “could,” “estimate,” “expect,” “intend,” “may,” “plan,” “seek,” “will,” “would” and similar expressions, as they relate to us, are intended to identify a number of these forward-looking statements.
These forward-looking statements are subject to risks, uncertainties and assumptions, some of which are beyond our control. In addition, these forward-looking statements reflect our current views with respect to future events and are not a guarantee of future performance. We are under no obligation to update these forward-looking statements and do not intend to do so. Actual results may differ materially from the information contained in the forward-looking statements as a result of a number of factors, including, without limitation, the following:
| • | any changes in the regulations or policies of the Ministry of Industry and Information Technology of the PRC (prior to March 2008, the Ministry of Information Industry, or the MII), or the MIIT, and other relevant government authorities relating to, among other matters: |
| • | the granting and approval of licenses; |
| • | tariff or network speed policies; |
| • | interconnection and settlement arrangements; |
| • | capital investment priorities; |
| • | the provision of telephone and other telecommunications services to rural areas in the PRC; and |
| • | spectrum and numbering resources allocation; |
| • | the effects of competition on the demand for and price of our services; |
| • | any potential further restructuring or consolidation of the PRC telecommunications industry; |
| • | changes in telecommunications and related technologies including the fifth generation mobile telecommunications, or 5G, and future generations of mobile technologies, and applications based on such technologies, including testing and monetization of 5G and future generations of mobile technologies; |
| • | the development of new technologies and applications or services affecting the PRC telecommunications industry and our current and future business; |
| • | the potential impact of restrictions, sanctions or other legal or regulatory actions under relevant laws and regulations in various jurisdictions on our telecommunications equipment suppliers and other business partners; |
| • | the impact of COVID-19 pandemic on our operations and financial performance, the PRC economy and world economy, including disruptions to the demand for certain of our services and products such as international roaming services and services provided to corporate clients, a decline in network service quality due to the increased volume of online utilization, temporary closures of our sales outlets and a decline in new subscriber registration due to such closures, disruptions to the delivery of services or supplies and delay in network construction progress due to travel and other restrictions, decline in labor force, increased bad debts risk due to the deteriorating financial condition of certain corporate customers; |
| • | changes in political, economic, legal and social conditions in the PRC, including changes in the PRC government’s specific policies with respect to foreign investment in and entry by foreign companies into the PRC telecommunications industry, economic growth, inflation, foreign exchange and the availability of credit; |
| • | results and effects of any inspections by the relevant PRC regulatory authorities; and |
| • | the development of our mobile business is dependent on the Tower Company. |
Please also see the “Risk Factors” section of the Company’s latest Annual Report on Form 20-F, as filed with the Securities and Exchange Commission.
SIGNATURES
Pursuant to the requirements of the Securities Exchange Act of 1934, the registrant has duly caused this report to be signed on its behalf by the undersigned, thereunto duly authorized.
| CHINA TELECOM CORPORATION LIMITED | ||||||||
| Date: April 8, 2021 | By: | /s/ Ke Ruiwen | ||||||
| Name: | Ke Ruiwen | |||||||
| Title: | Chairman and Chief Executive Officer | |||||||
About China Telecom Corporation Limited (“China Telecom” or the “Company”, a joint stock China Telecom limited company incorporated in the People’s Republic of China with limited liability, together with its subsidiaries, collectively the “Group”) is a large-scale and leading integrated intelligent information services operator in the world, providing wireline & mobile telecommunications services, Internet access services, information services and other value-added telecommunications services primarily in the PRC. As at the end of 2020, the Company had mobile subscribers of about 351 million, wireline broadband subscribers of about 159 million and access lines in service of about 108 million. The Company’s H shares are listed on the Main Board of The Stock Exchange of Hong Kong Limited (the “Hong Kong Stock Exchange” or “HKSE”). Contents 2 2020 Milestones 120 Table of the ESG 3 Indicators Corporate Information 4 125 Independent Assurance Financial Highlights Report 8 Chairman’s Statement 126 Appendix – ESG 19 Biographical Details of Directors, Reporting Guide Index Senior Management and 130 Corporate Governance Supervisors Report 30 Management’s Discussion and 160 Independent Auditor’s Report Analysis 164 Consolidated Statement of 30 Business Review Financial Position 38 Financial Review 166 Consolidated Statement of 48 Report of the Directors Comprehensive Income 80 Report of the Supervisory 168 Consolidated Statement of Committee Changes in Equity 84 Recognition and Awards 169 Consolidated Statement of 86 Cash Flows Environmental, Social and Governance Report 171 Notes to the Consolidated 88 Financial Statements Corporate Social Responsibility Report 245 Financial Summary 112 Human Resources 247 Shareholder Information Development Report Corporate Culture
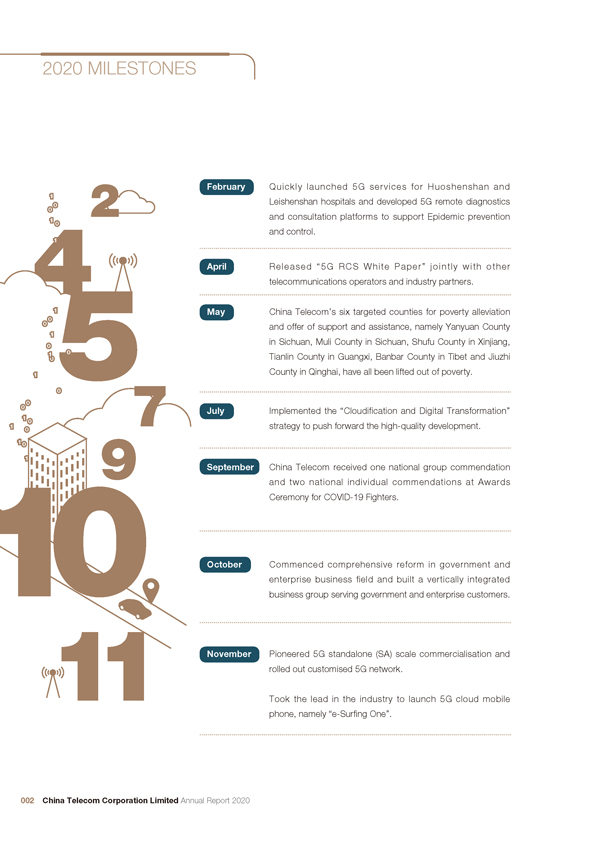
2020 MILESTONES 2 February Quickly launched 5G services for Huoshenshan and Leishenshan hospitals and developed 5G remote diagnostics 4 and consultation platforms to support Epidemic prevention and control. telecommunications operators and industry partners. May China Telecom’s six targeted counties for poverty alleviation and offer of support and assistance, namely Yanyuan County in Sichuan, Muli County in Sichuan, Shufu County in Xinjiang, Tianlin County in Guangxi, Banbar County in Tibet and Jiuzhi 5 April Released “5G RCS White Paper” jointly with other County in Qinghai, have all been lifted out of poverty. 7 July Implemented the “Cloudification and Digital Transformation” 9 strategy to push forward the high-quality development. 10 September China Telecom received one national group commendation and two national individual commendations at Awards Ceremony for COVID-19 Fighters. October Commenced comprehensive reform in government and enterprise business field and built a vertically integrated business group serving government and enterprise customers. 11 November Pioneered 5G standalone (SA) scale commercialisation and rolled out customised 5G network. Took the lead in the industry to launch 5G cloud mobile phone, namely “e-Surfing One”. 002 China Telecom Corporation Limited Annual Report 2020
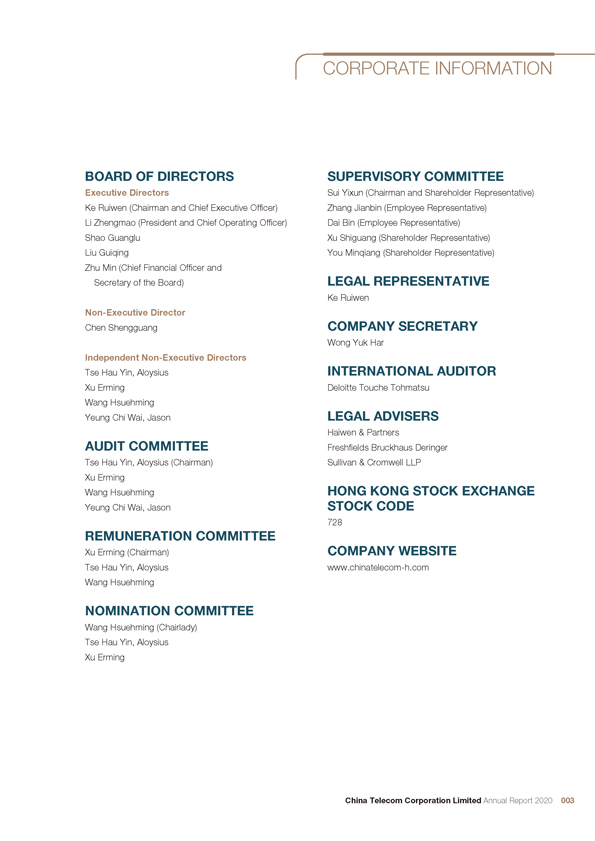
CORPORATE INFORMATION BOARD OF DIRECTORS SUPERVISORY COMMITTEE Executive Directors Sui Yixun (Chairman and Shareholder Representative) Ke Ruiwen (Chairman and Chief Executive Officer) Zhang Jianbin (Employee Representative) Li Zhengmao (President and Chief Operating Officer) Dai Bin (Employee Representative) Shao Guanglu Xu Shiguang (Shareholder Representative) Liu Guiqing You Minqiang (Shareholder Representative) Zhu Min (Chief Financial Officer and Secretary of the Board) LEGAL REPRESENTATIVE Ke Ruiwen Non-Executive Director Chen Shengguang COMPANY SECRETARY Wong Yuk Har Independent Non-Executive Directors Tse Hau Yin, Aloysius INTERNATIONAL AUDITOR Xu Erming Deloitte Touche Tohmatsu Wang Hsuehming Yeung Chi Wai, Jason LEGAL ADVISERS Haiwen & Partners AUDIT COMMITTEE Freshfields Bruckhaus Deringer Tse Hau Yin, Aloysius (Chairman) Sullivan & Cromwell LLP Xu Erming Wang Hsuehming HONG KONG STOCK EXCHANGE Yeung Chi Wai, Jason STOCK CODE 728 REMUNERATION COMMITTEE Xu Erming (Chairman) COMPANY WEBSITE Tse Hau Yin, Aloysius www.chinatelecom-h.com Wang Hsuehming NOMINATION COMMITTEE Wang Hsuehming (Chairlady) Tse Hau Yin, Aloysius Xu Erming China Telecom Corporation Limited Annual Report 2020 003
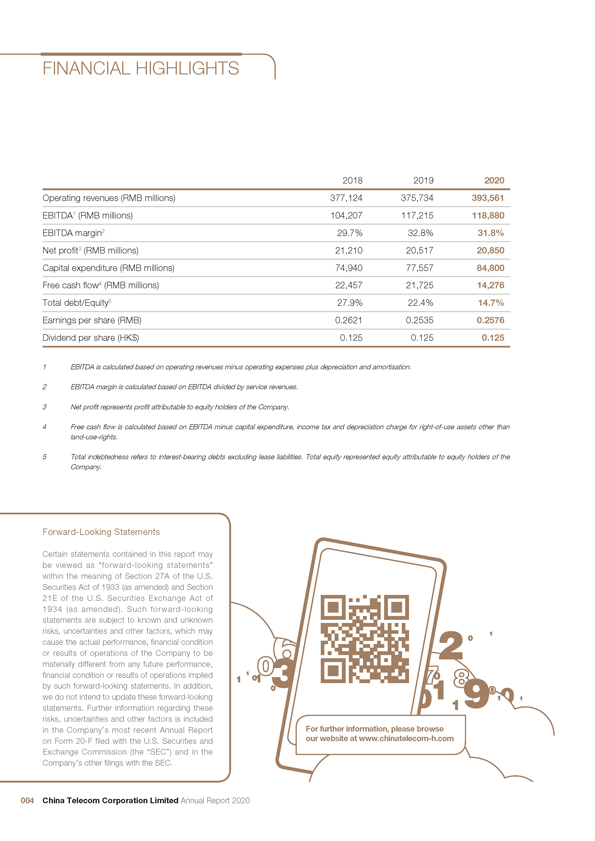
FINANCIAL HIGHLIGHTS 2018 2019 2020 Operating revenues (RMB millions) 377,124 375,734 393,561 EBITDA1 (RMB millions) 104,207 117,215 118,880 EBITDA margin2 29.7% 32.8% 31.8% Net profit3 (RMB millions) 21,210 20,517 20,850 Capital expenditure (RMB millions) 74,940 77,557 84,800 Free cash flow4 (RMB millions) 22,457 21,725 14,276 Total debt/Equity5 27.9% 22.4% 14.7% Earnings per share (RMB) 0.2621 0.2535 0.2576 Dividend per share (HK$) 0.125 0.125 0.125 1 EBITDA is calculated based on operating revenues minus operating expenses plus depreciation and amortisation. 2 EBITDA margin is calculated based on EBITDA divided by service revenues. 3 Net profit represents profit attributable to equity holders of the Company. 4 Free cash flow is calculated based on EBITDA minus capital expenditure, income tax and depreciation charge for right-of-use assets other than land-use-rights. 5 Total indebtedness refers to interest-bearing debts excluding lease liabilities. Total equity represented equity attributable to equity holders of the Company. Forward-Looking Statements Certain statements contained in this report may be viewed as “forward-looking statements” within the meaning of Section 27A of the U.S. Securities Act of 1933 (as amended) and Section 21E of the U.S. Securities Exchange Act of 1934 (as amended). Such forward-looking statements are subject to known and unknown 6 2 risks, uncertainties and other factors, which may 0 1 cause the actual performance, financial condition or results of operations of the Company to be 0 materially different from any future performance, 89 financial condition or results of operations implied 1 0 1 01 3 71 by such forward-looking statements. In addition, 0 0 0 we do not intend to update these forward-looking 10 1 statements. Further information regarding these 1 risks, uncertainties and other factors is included in the Company’s most recent Annual Report For further information, please browse on Form 20-F filed with the U.S. Securities and our website at www.chinatelecom-h.com Exchange Commission (the “SEC”) and in the Company’s other filings with the SEC. 004 China Telecom Corporation Limited Annual Report 2020
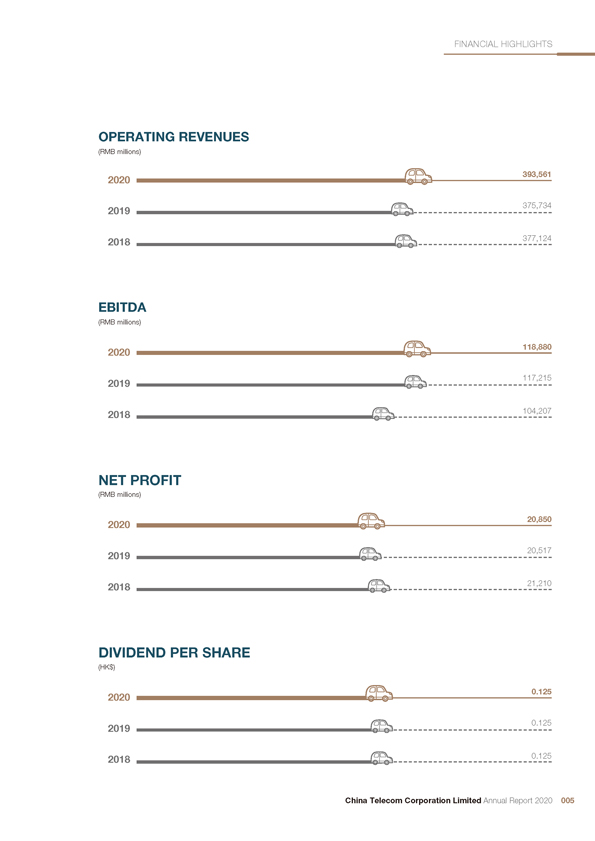
FINANCIAL HIGHLIGHTS OPERATING REVENUES (RMB millions) 393,561 2020 375,734 2019 2018 377,124 EBITDA (RMB millions) 118,880 2020 117,215 2019 2018 104,207 NET PROFIT (RMB millions) 20,850 2020 20,517 2019 2018 21,210 DIVIDEND PER SHARE (HK$) 0.125 2020 0.125 2019 2018 0.125 China Telecom Corporation Limited Annual Report 2020 005
1 0 1 1 0 Cloudi_cation for Endowment
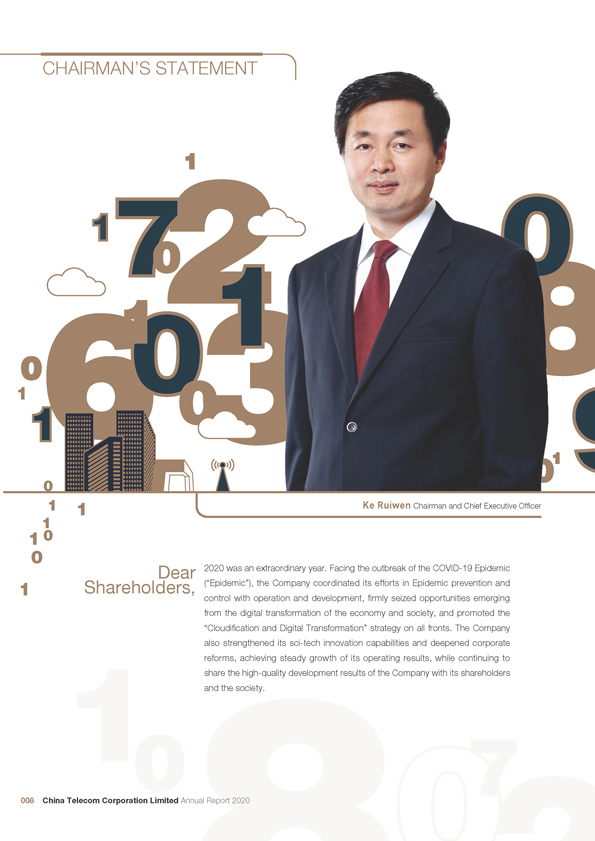
CHAIRMAN’S 7 1 6 10 1 0 11 1 0 1 1 Ke Ruiwen Chairman and Chief Executive Officer 1 1 0 0 Dear 2020 was an extraordinary year. Facing the outbreak of the COVID-19 Epidemic 1 Shareholders, (“Epidemic”), the Company coordinated its efforts in Epidemic prevention and control with operation and development, firmly seized opportunities emerging from the digital transformation of the economy and society, and promoted the “Cloudification and Digital Transformation” strategy on all fronts. The Company also strengthened its sci-tech innovation capabilities and deepened corporate reforms, achieving steady growth of its operating results, while continuing to share the high-quality development results of the Company with its shareholders and the society. 008 China Telecom Corporation Limited Annual Report 2020
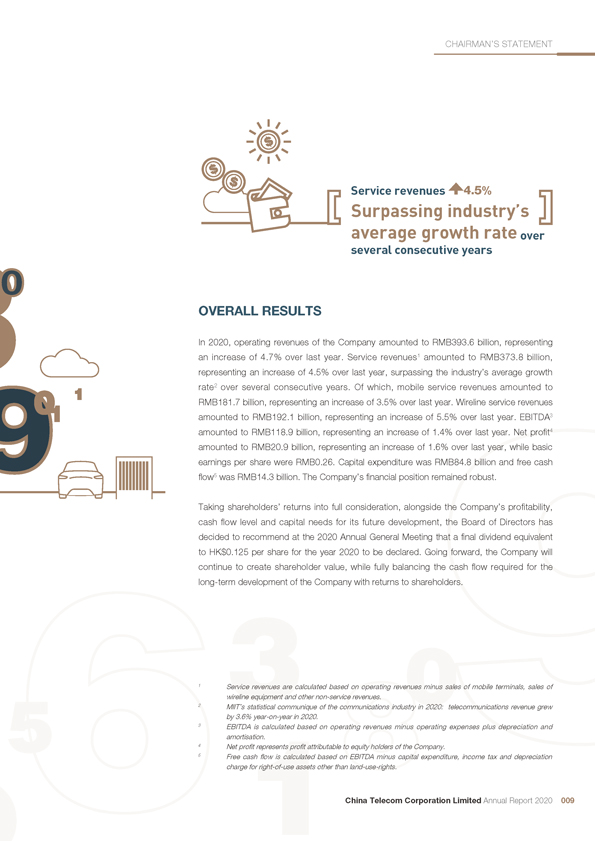
CHAIRMAN’S STATEMENT Service revenues 4.5 % Surpassing industry’s average growth rate over several consecutive years OVERALL RESULTS In 2020, operating revenues of the Company amounted to RMB393.6 billion, representing an increase of 4.7% over last year. Service revenues1 amounted to RMB373.8 billion, representing an increase of 4.5% over last year, surpassing the industry’s average growth 0 1 rate2 over several consecutive years. Of which, mobile service revenues amounted to RMB181.7 billion, representing an increase of 3.5% over last year. Wireline service revenues 1 amounted to RMB192.1 billion, representing an increase of 5.5% over last year. EBITDA3 amounted to RMB118.9 billion, representing an increase of 1.4% over last year. Net profit4 amounted to RMB20.9 billion, representing an increase of 1.6% over last year, while basic earnings per share were RMB0.26. Capital expenditure was RMB84.8 billion and free cash flow5 was RMB14.3 billion. The Company’s financial position remained robust. Taking shareholders’ returns into full consideration, alongside the Company’s profitability, cash flow level and capital needs for its future development, the Board of Directors has decided to recommend at the 2020 Annual General Meeting that a final dividend equivalent to HK$0.125 per share for the year 2020 to be declared. Going forward, the Company will continue to create shareholder value, while fully balancing the cash flow required for the long-term development of the Company with returns to shareholders. 1 Service revenues are calculated based on operating revenues minus sales of mobile terminals, sales of wireline equipment and other non-service revenues. 2 MIIT’s statistical communique of the communications industry in 2020: telecommunications revenue grew by 3.6% year-on-year in 2020. 3 EBITDA is calculated based on operating revenues minus operating expenses plus depreciation and amortisation. 4 Net profit represents profit attributable to equity holders of the Company. 5 Free cash flow is calculated based on EBITDA minus capital expenditure, income tax and depreciation charge for right-of-use assets other than land-use-rights. China Telecom Corporation Limited Annual Report 2020 009
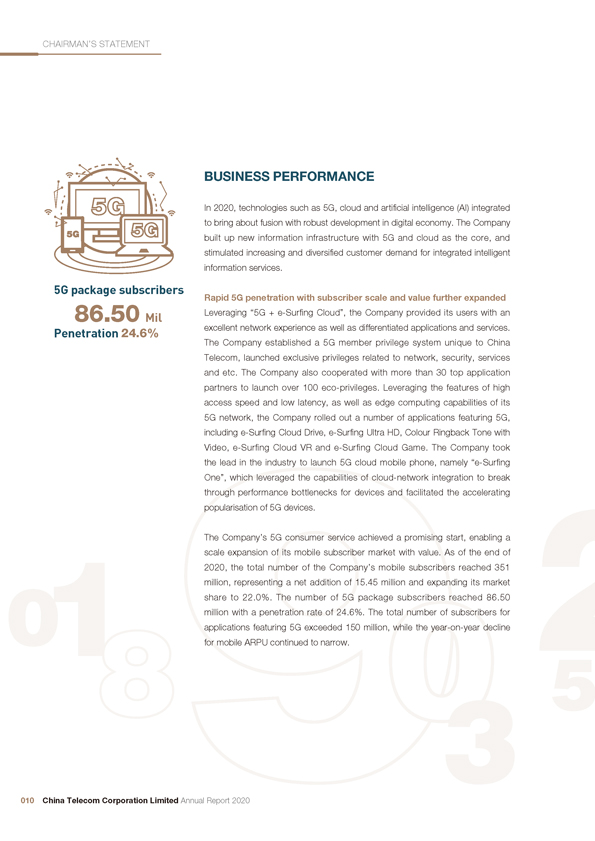
CHAIRMAN’S STATEMENT BUSINESS PERFORMANCE In 2020, technologies such as 5G, cloud and artificial intelligence (AI) integrated to bring about fusion with robust development in digital economy. The Company built up new information infrastructure with 5G and cloud as the core, and stimulated increasing and diversified customer demand for integrated intelligent information services. 5G package subscribers Rapid 5G penetration with subscriber scale and value further expanded 86.50 Mil Leveraging “5G + e-Surfing Cloud”, the Company provided its users with an Penetration 24.6% excellent network experience as well as differentiated applications and services. The Company established a 5G member privilege system unique to China Telecom, launched exclusive privileges related to network, security, services and etc. The Company also cooperated with more than 30 top application partners to launch over 100 eco-privileges. Leveraging the features of high access speed and low latency, as well as edge computing capabilities of its 5G network, the Company rolled out a number of applications featuring 5G, including e-Surfing Cloud Drive, e-Surfing Ultra HD, Colour Ringback Tone with Video, e-Surfing Cloud VR and e-Surfing Cloud Game. The Company took the lead in the industry to launch 5G cloud mobile phone, namely “e-Surfing One”, which leveraged the capabilities of cloud-network integration to break through performance bottlenecks for devices and facilitated the accelerating popularisation of 5G devices. The Company’s 5G consumer service achieved a promising start, enabling a scale expansion of its mobile subscriber market with value. As of the end of 2020, the total number of the Company’s mobile subscribers reached 351 million, representing a net addition of 15.45 million and expanding its market share to 22.0% . The number of 5G package subscribers reached 86.50 million with a penetration rate of 24.6% . The total number of subscribers for applications featuring 5G exceeded 150 million, while the year-on-year decline for mobile ARPU continued to narrow. 010 China Telecom Corporation Limited Annual Report 2020
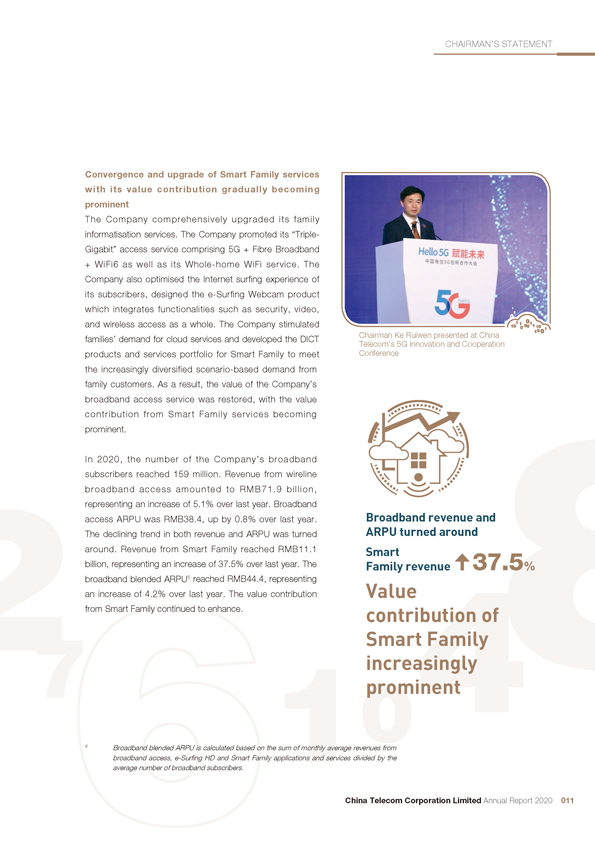
CHAIRMAN’S STATEMENT Convergence and upgrade of Smart Family services with its value contribution gradually becoming prominent The Company comprehensively upgraded its family informatisation services. The Company promoted its “Triple-Gigabit” access service comprising 5G + Fibre Broadband + WiFi6 as well as its Whole-home WiFi service. The Company also optimised the Internet surfing experience of its subscribers, designed the e-Surfing Webcam product which integrates functionalities such as security, video, and wireless access as a whole. The Company stimulated families’ demand for cloud services and developed the DICT Chairman Ke Ruiwen presented at China Telecom’s 5G Innovation and Cooperation products and services portfolio for Smart Family to meet Conference the increasingly diversified scenario-based demand from family customers. As a result, the value of the Company’s broadband access service was restored, with the value contribution from Smart Family services becoming prominent. In 2020, the number of the Company’s broadband subscribers reached 159 million. Revenue from wireline broadband access amounted to RMB71.9 billion, representing an increase of 5.1% over last year. Broadband access ARPU was RMB38.4, up by 0.8% over last year. Broadband revenue and The declining trend in both revenue and ARPU was turned ARPU turned around around. Revenue from Smart Family reached RMB11.1 Smart billion, representing an increase of 37.5% over last year. The Family revenue 37.5 % broadband blended ARPU6 reached RMB44.4, representing an increase of 4.2% over last year. The value contribution Value from Smart Family continued to enhance. contribution of Smart Family increasingly prominent 6 Broadband blended ARPU is calculated based on the sum of monthly average revenues from broadband access, e-Surfing HD and Smart Family applications and services divided by the average number of broadband subscribers. China Telecom Corporation Limited Annual Report 2020 011
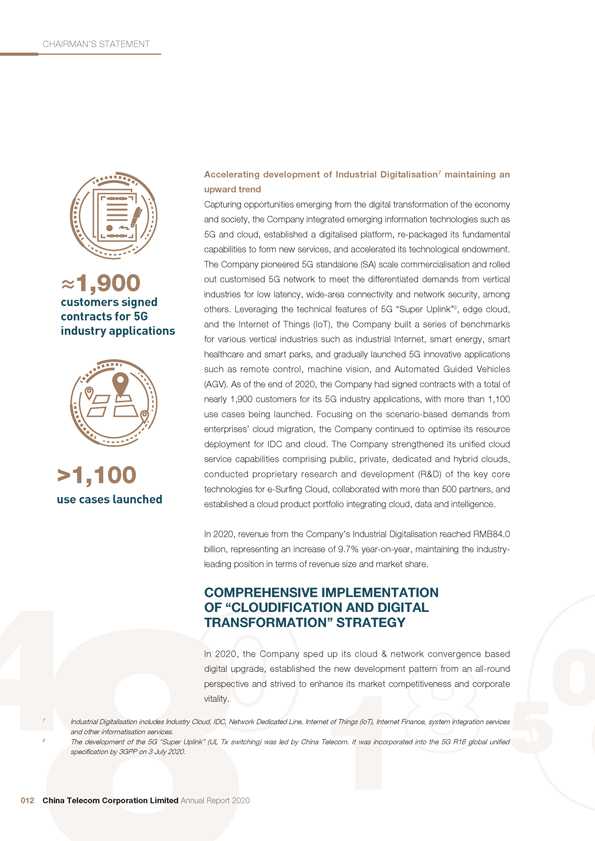
CHAIRMAN’S STATEMENT Accelerating development of Industrial Digitalisation7 maintaining an upward trend Capturing opportunities emerging from the digital transformation of the economy and society, the Company integrated emerging information technologies such as 5G and cloud, established a digitalised platform, re-packaged its fundamental capabilities to form new services, and accelerated its technological endowment. The Company pioneered 5G standalone (SA) scale commercialisation and rolled ?1,900 out customised 5G network to meet the differentiated demands from vertical industries for low latency, wide-area connectivity and network security, among customers signed others. Leveraging the technical features of 5G “Super Uplink”8, edge cloud, contracts for 5G industry applications and the Internet of Things (IoT), the Company built a series of benchmarks for various vertical industries such as industrial Internet, smart energy, smart healthcare and smart parks, and gradually launched 5G innovative applications such as remote control, machine vision, and Automated Guided Vehicles (AGV). As of the end of 2020, the Company had signed contracts with a total of nearly 1,900 customers for its 5G industry applications, with more than 1,100 use cases being launched. Focusing on the scenario-based demands from enterprises’ cloud migration, the Company continued to optimise its resource deployment for IDC and cloud. The Company strengthened its unified cloud service capabilities comprising public, private, dedicated and hybrid clouds, >1,100 conducted proprietary research and development (R&D) of the key core technologies for e-Surfing Cloud, collaborated with more than 500 partners, and use cases launched established a cloud product portfolio integrating cloud, data and intelligence. In 2020, revenue from the Company’s Industrial Digitalisation reached RMB84.0 billion, representing an increase of 9.7% year-on-year, maintaining the industry-leading position in terms of revenue size and market share. COMPREHENSIVE IMPLEMENTATION OF “CLOUDIFICATION AND DIGITAL TRANSFORMATION” STRATEGY In 2020, the Company sped up its cloud & network convergence based digital upgrade, established the new development pattern from an all-round perspective and strived to enhance its market competitiveness and corporate vitality. 7 Industrial Digitalisation includes Industry Cloud, IDC, Network Dedicated Line, Internet of Things (IoT), Internet Finance, system integration services and other informatisation services. 8 The development of the 5G “Super Uplink” (UL Tx switching) was led by China Telecom. It was incorporated into the 5G R16 global unified specification by 3GPP on 3 July 2020. 012 China Telecom Corporation Limited Annual Report 2020
CHAIRMAN’S STATEMENT 9 Strengthening the distribution of cloud-network capabilities and building new infrastructure based on cloud-network integration 7 The Company adhered to the strategic direction of “Cloud central, Network around, Network adaptive to cloud, Cloud and network as one”, and sped up the construction of new infrastructure based on cloud-network integration. The Company continued to promote 5G network co-building and co-sharing. The number of 5G base stations in use exceeded 380,000. The Company also took a global lead in achieving scale commercialisation of 5G SA network, and launched customised 5G networks including “Wide-area”, “Adjacent” and “Wingspan”. At the same time, the Company conducted 4G network co-sharing and activated approximately 170,000 co-shared 4G base stations throughout the year, which further optimised the network coverage, as well as achieved savings in investment and operations and maintenance costs. In line with the Industrial Digitalisation overall “2+4+31+X+O” deployment, the Company accelerated the construction revenue 9.7 % of e-Surfing Cloud and IDC, with the number of cloud resource pools exceeding 100 and the number of IDC cabinets exceeding 420,000. Of which, about 80% Maintaining of cabinets were deployed in the four major regions, namely Beijing-Tianjin- industry-leading Hebei, Yangtze River Delta, Guangdong-Hong Kong-Macau, and Shaanxi- position in terms of Sichuan-Chongqing. Leveraging its massive amount of exchange buildings at revenue size and the edge, the Company commenced the development of multi-access edge market share computing (MEC) and forged capabilities of cloud-edge coordination. The Company pushed forward the upgrade of its Gigabit fibre broadband network in 280 cities and completed the construction of five major regional ROADM9 transmission backbone network with nationwide coverage, while expanding the coverage of its superior OTN network for government and enterprise customers. Revenue from Overall Cloud10 services reached RMB13.8 billion, with the Company continuing to rank at forefront in terms of the market share in public cloud in China. 9 ROADM represents Reconfigurable Optical Add-Drop Multiplexer. 10 Overall Cloud includes Industry Cloud, Family Cloud and access service directly related to cloud, etc. China Telecom Corporation Limited Annual Report 2020 013
CHAIRMAN’S STATEMENT Building a digitalised platform to empower digital transformation The Company strengthened the planning of its digitalised platform to empower the internal and external digital transformation. Internally, the Company pushed forward the digitalisation of its operation. The Company explored the potential demand for 5G and Smart Family by leveraging AI and Big Data. The coverage of targeted marketing exceeded 85%, significantly enhancing marketing resources’ effectiveness in driving incremental revenue. The Company accelerated the construction of its new-generation cloud-network operating system to support the scale commercialisation of 5G SA and enhance the efficiency of service ?700 IDC sites activation and product loading, while optimising its network quality and user 420k cabinets Nationwide experience. The Company’s overall satisfaction rate11 maintained the industry-Industry No.112 leading position. The Company also conducted proprietary research of AI algorithms to promote energy saving for 4G base stations, as well as to explore smart energy saving solutions for 5G base stations. The Company gradually expanded its trial scope and implemented smart energy saving initiatives for IDC sites. As a result, the Company’s electricity cost as a percentage of service revenues was at low level in the industry. Applying Big Data to achieve precision investment and construction, the Company redeployed under-utilised 4G base stations to busy or blind-spot areas, and enhanced the utilisation rate of its fibre broadband ports. Externally, the Company propelled cloud migration, the use of data and intelligence injection for its customers, and built the technological foundation for digitalised platform. Supported by its digitalised platform, the Company aggregated its internal fundamental capabilities including communications, security, AI, Big Data and IoT, among others, while combining external digital ecology, to inject intelligence powered by data and provide endowment for products and services, so as to propel industrial digitalisation and intelligent transformation. The number of times for capabilities deployment of the whole network exceeded 10 billion. Promoting sci-tech innovation to accelerate the shift towards a sci-tech company The Company pushed forward its R&D system reforms and stimulated vitality for sci-tech innovation. Focusing on its technological development objectives, the Company increased its investment in R&D, elevated the input and output efficiency of R&D resources, and strengthened its R&D teams in key areas such 11 Source is from the result of MIIT’s national user satisfaction survey on telecommunications service quality. 12 Source of ranking in IDC industry: Internet Weekly 014 China Telecom Corporation Limited Annual Report 2020
CHAIRMAN’S STATEMENT as cloud-network integration and security. The Company strengthened its own problem-tackling efforts for core technologies, and reinforced its challenge-confronting efforts for core technologies in key areas such as 5G, cloud-network integration as well as network and information security. The Company IaaS conducted proprietary R&D of e-Surfing Cloud 3.0 and mastered 20 core technologies, including platform-as-a-service (PaaS). The Company commenced scale commercialisation of e-Surfing Cloud content delivery networks (CDN) and distributed storage systems. As a result, the Company’s competitiveness in cloud computing market was effectively elevated. The Company’s e-Surfing Cloud PaaS platform has been widely adopted by internal and external Public cloud IaaS14 customers, providing stable hosting for hundreds of millions of customers, while No.7 CDN is serving a number of top Internet customers. The Company conducted Global proprietary R&D for MEC platform and launched trial projects for top vertical- No.1 industry customers. Through the gradual deployment of equipment such as Among telcos frequency-shifting MIMO indoor distribution systems, expandable small cells and lightweight UPF13, the cost for 5G network construction was effectively reduced. During the year, the Company completed 40 global standardisation projects and filed 882 new patents. In GSMA, the Company led and organised global industry chain in the development and release of “5G SA Implementation Guidelines”. The Company also continued to optimise the planning of its sci-tech innovation and collaborated with partners from the ecosystem to carry out cooperative innovation among industry, academia and R&D institutes in the fields of quantum communications and network security. The Company also has strategic cooperation with universities and research institutes to jointly promote research in key technologies and application innovation. Deepening reforms on all fronts to inspire corporate vitality and expanding cooperation to forge ecological competitiveness The Company pushed forward reforms on all fronts, sped up the establishment of a new customer-oriented institutional system and built a vertically integrated business group serving government and enterprise customers. The Company enhanced its capabilities of informatisation development as well as its operating vitality in government and enterprise market, by sharing and integrating fundamental capabilities, products and services on its digitalised platform. 13 UPF represents User Port Function. 14 Source of public cloud IaaS ranking: Released by IDC in 2019. China Telecom Corporation Limited Annual Report 2020 015
CHAIRMAN’S STATEMENT Overall satisfaction The Company also orderly promoted reforms of its professional companies, explored structural optimisation for system integration, and strengthened core technological capabilities. System Integration company was included in the “Science Reform Demonstration Action” list by SASAC15. The Company commenced the restructuring of its cloud company, fully consolidated the cloud resources, strengthened R&D, operation and ecological cooperation for its cloud service, while also deepening the market-oriented mechanism reforms. The Company streamlined its departments and personnel in the headquarters, commenced reengineering for operation and management procedures, and Maintained carried out reforms to grant and delegate power to provincial branches, with an industry-leading aim to enhance operating efficiency. The Company also innovated its market-oriented talent recruitment mechanism, strengthened the recruitment and promotion of young employees, built a team of sci-tech and innovative talents and optimised its performance-based remuneration system, so as to enhance employees’ vitality and efficiency. The Company strengthened its planning of ecosystem, continued to expand its corporate boundaries and deepened cooperation of the whole industry chain. Leveraging its core capabilities and platform, the Company enriched the ecology for industries such as family informatisation and vertical industries for government and enterprise customers. The Company also strengthened cooperation and eco-aggregation with capital financing, expanded innovative cooperation in emerging areas, and gradually create an industry chain ecology with a larger scope and at a higher-level. CORPORATE GOVERNANCE AND SOCIAL RESPONSIBILITY As a large-scale and leading full-service, integrated intelligent information services provider in the world, the Company has long been insisting on integrating environmental, social and governance responsibilities into its business operation and management. The Company is also continuously enhancing the respective risk management and internal control systems. By adhering to excellent, prudent, and effective corporate governance principles, the Company insists on compliance with laws and regulations, as well as standardised and green operation. The Company proactively responded to changes in the external environment to ensure its healthy and sustainable development and safeguard the long-term interests of the Company and its shareholders. During 15 State-owned Assets Supervision and Administration Commission of the State Council. 016 China Telecom Corporation Limited Annual Report 2020
CHAIRMAN’S STATEMENT the past year, the Company’s continuous efforts and outstanding performance have been widely recognised and highly acclaimed. The Company received “ESG Leading Enterprise Award” from Bloomberg Businessweek and was named “Most Honoured Company in Asia” for the 10th consecutive year by Institutional Investor. The Company was also awarded the “Platinum Award – Excellence in Environmental, Social and Governance” for the 12th consecutive year by The Asset. In addition, the Company was awarded “The Best of Asia – Icon on Corporate Governance” for the 13th time by Corporate Governance Asia. Moreover, the Company was named “No.1 Best Telecommunications Company in Asia” by FinanceAsia. With the outbreak of the Epidemic in 2020, the Company quickly completed the construction of 5G network and cloud platform for Huoshenshan and Leishenshan hospitals, among others, and built the widely-acclaimed “cloud supervision” live broadcast platform. The Company also developed 5G remote diagnostics and consultation platforms to support Epidemic prevention and control. The Company launched “Operation Warm Spring”, which comprised of nine types of informatisation services, to support the resumption of work and production for the society. The Company also provided care for its employees and dedicated itself to safeguarding the safety and well-being of its employees based locally and overseas. In recognition of these efforts, China Telecom received one national group commendation and two national individual commendations. The Company proactively shouldered the poverty alleviation work, vigorously promoted poverty reduction in areas of industry, employment, consumption and education. The Company continued to promote poverty reduction in areas of network, communications and informatisation. The targeted counties and villages which received partner assistance to poverty reduction from our companies at different levels have all been lifted out of poverty. The Company proactively created a favourable operating environment, promoted value enhancement for the industry, further implemented Speed Upgrade and Tariff Reduction and Mobile Number Portability, and safeguarded network and information security. The Company also initiated informatisation service support designed specifically for SME customers, while helping small, medium and micro enterprises, as well as self-employed merchants to reduce their operational burdens. The Company also successfully completed tasks such as emergency communications and communications assurance for key projects. China Telecom Corporation Limited Annual Report 2020 017
CHAIRMAN’S STATEMENT OUTLOOK Finally, on behalf of the Board of Directors, I would like to take this opportunity to express our sincere appreciation 2021 marks the first year of China’s “14th Five-Year Plan”. to all our shareholders and customers for their ongoing Entering the new stage of its development, the Company support. I would also like to express our sincere thanks to will insist on new development philosophy and establish all our employees for their hard work and contributions. new development pattern. Seizing the opportunities Furthermore, I would like to extend our heartfelt gratitude brought by the robust development of digital economy towards Mr. Chen Zhongyue and Mr. Wang Guoquan as well as the accelerated digital transformation of the for their outstanding contributions during their tenure as society, the Company will comprehensively and deeply directors of the Company. promote “Cloudification and Digital Transformation” strategy. The Company will continue to deepen reforms, commence the initial public offering and listing of shares in the domestic capital market, innovate systems and mechanisms, enhance corporate and employees’ vitality, expand ecological cooperation and enhance its sustainable development capabilities. The Company will strengthen sci-tech innovation centred around problem-tackling of core technologies and accelerate the integration of 5G, Ke Ruiwen cloud and AI to develop new information infrastructure. Chairman and Chief Executive Officer The Company will also stimulate the ever-migrating and Beijing, China evolving demands from the society for informatisation under converged scenarios, continue to build its digitalised 9 March 2021 platform, and proactively empower internal and external digital transformation. The Company will also proactively shoulder its social responsibility to promote rural revitalisation, and facilitate the construction of Cyberpower, digital China and smart society. The Company will share the results of its high-quality development with shareholders and customers and continue to create value for the society. 018 China Telecom Corporation Limited Annual Report 2020
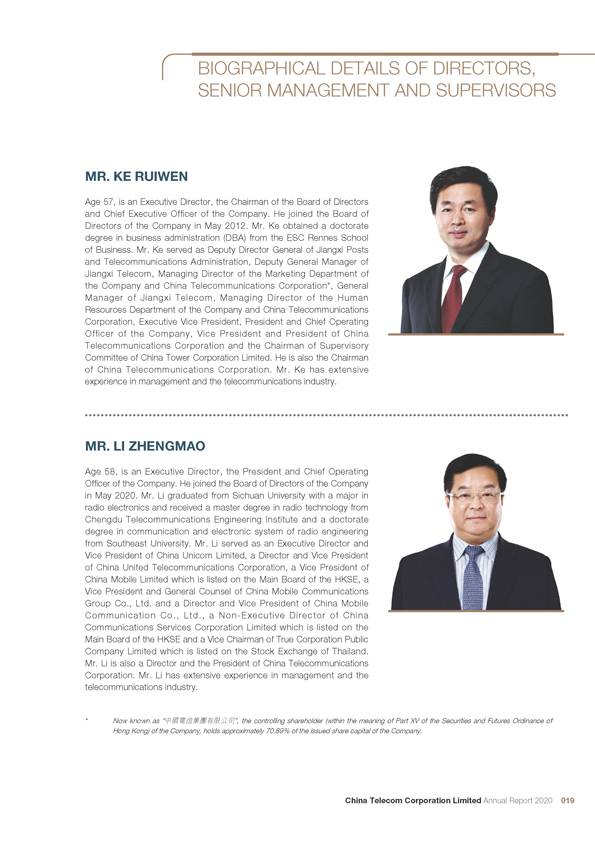
BIOGRAPHICAL DETAILS OF DIRECTORS, SENIOR MANAGEMENT AND SUPERVISORS MR. KE RUIWEN Age 57, is an Executive Director, the Chairman of the Board of Directors and Chief Executive Officer of the Company. He joined the Board of Directors of the Company in May 2012. Mr. Ke obtained a doctorate degree in business administration (DBA) from the ESC Rennes School of Business. Mr. Ke served as Deputy Director General of Jiangxi Posts and Telecommunications Administration, Deputy General Manager of Jiangxi Telecom, Managing Director of the Marketing Department of the Company and China Telecommunications Corporation*, General Manager of Jiangxi Telecom, Managing Director of the Human Resources Department of the Company and China Telecommunications Corporation, Executive Vice President, President and Chief Operating Officer of the Company, Vice President and President of China Telecommunications Corporation and the Chairman of Supervisory Committee of China Tower Corporation Limited. He is also the Chairman of China Telecommunications Corporation. Mr. Ke has extensive experience in management and the telecommunications industry. MR. LI ZHENGMAO Age 58, is an Executive Director, the President and Chief Operating Officer of the Company. He joined the Board of Directors of the Company in May 2020. Mr. Li graduated from Sichuan University with a major in radio electronics and received a master degree in radio technology from Chengdu Telecommunications Engineering Institute and a doctorate degree in communication and electronic system of radio engineering from Southeast University. Mr. Li served as an Executive Director and Vice President of China Unicom Limited, a Director and Vice President of China United Telecommunications Corporation, a Vice President of China Mobile Limited which is listed on the Main Board of the HKSE, a Vice President and General Counsel of China Mobile Communications Group Co., Ltd. and a Director and Vice President of China Mobile Communication Co., Ltd., a Non-Executive Director of China Communications Services Corporation Limited which is listed on the Main Board of the HKSE and a Vice Chairman of True Corporation Public Company Limited which is listed on the Stock Exchange of Thailand. Mr. Li is also a Director and the President of China Telecommunications Corporation. Mr. Li has extensive experience in management and the telecommunications industry. * Now known as “中國電信集團有限公司”, the controlling shareholder (within the meaning of Part XV of the Securities and Futures Ordinance of Hong Kong) of the Company, holds approximately 70.89% of the issued share capital of the Company. China Telecom Corporation Limited Annual Report 2020 019
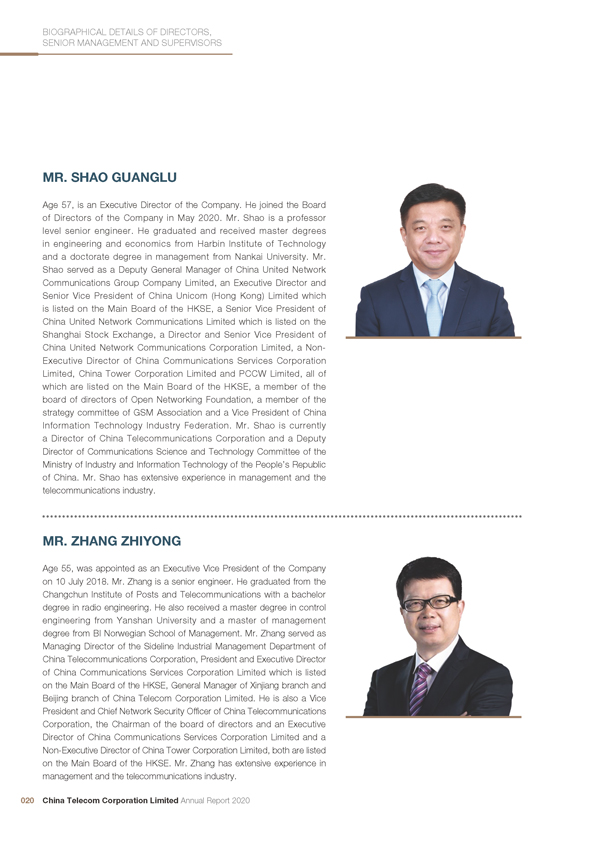
BIOGRAPHICAL DETAILS OF DIRECTORS, SENIOR MANAGEMENT AND SUPERVISORS MR. SHAO GUANGLU Age 57, is an Executive Director of the Company. He joined the Board of Directors of the Company in May 2020. Mr. Shao is a professor level senior engineer. He graduated and received master degrees in engineering and economics from Harbin Institute of Technology and a doctorate degree in management from Nankai University. Mr. Shao served as a Deputy General Manager of China United Network Communications Group Company Limited, an Executive Director and Senior Vice President of China Unicom (Hong Kong) Limited which is listed on the Main Board of the HKSE, a Senior Vice President of China United Network Communications Limited which is listed on the Shanghai Stock Exchange, a Director and Senior Vice President of China United Network Communications Corporation Limited, a Non-Executive Director of China Communications Services Corporation Limited, China Tower Corporation Limited and PCCW Limited, all of which are listed on the Main Board of the HKSE, a member of the board of directors of Open Networking Foundation, a member of the strategy committee of GSM Association and a Vice President of China Information Technology Industry Federation. Mr. Shao is currently a Director of China Telecommunications Corporation and a Deputy Director of Communications Science and Technology Committee of the Ministry of Industry and Information Technology of the People’s Republic of China. Mr. Shao has extensive experience in management and the telecommunications industry. MR. ZHANG ZHIYONG Age 55, was appointed as an Executive Vice President of the Company on 10 July 2018. Mr. Zhang is a senior engineer. He graduated from the Changchun Institute of Posts and Telecommunications with a bachelor degree in radio engineering. He also received a master degree in control engineering from Yanshan University and a master of management degree from BI Norwegian School of Management. Mr. Zhang served as Managing Director of the Sideline Industrial Management Department of China Telecommunications Corporation, President and Executive Director of China Communications Services Corporation Limited which is listed on the Main Board of the HKSE, General Manager of Xinjiang branch and Beijing branch of China Telecom Corporation Limited. He is also a Vice President and Chief Network Security Officer of China Telecommunications Corporation, the Chairman of the board of directors and an Executive Director of China Communications Services Corporation Limited and a Non-Executive Director of China Tower Corporation Limited, both are listed on the Main Board of the HKSE. Mr. Zhang has extensive experience in management and the telecommunications industry. 020 China Telecom Corporation Limited Annual Report 2020
BIOGRAPHICAL DETAILS OF DIRECTORS, SENIOR MANAGEMENT AND SUPERVISORS MR. LIU GUIQING Age 54, is an Executive Director and Executive Vice President of the Company. He joined the Board of Directors of the Company in August 2019. Mr. Liu is a professor-level senior engineer. He received a doctorate degree in engineering science from National University of Defense Technology. Mr. Liu served as Deputy General Manager and General Manager of China Unicom Hunan branch and General Manager of China Unicom Jiangsu provincial branch. He is also a Vice President of China Telecommunications Corporation, a Deputy Director General of China Institute of Communications and a Director of Global System for Mobile communications Association (GSMA). Mr. Liu has extensive experience in management and the telecommunications industry. MADAM ZHU MIN Age 56, is an Executive Director, Executive Vice President, Chief Financial Officer and Secretary of the Board of the Company. She joined the Board of Directors of the Company in October 2018. Madam Zhu is a senior accountant. She received a master degree in system engineering from the Faculty of Management Engineering at the Beijing Institute of Posts and Telecommunications and a doctorate degree in business administration from the Hong Kong Polytechnic University. Madam Zhu served as Managing Director of Finance Department of China Telecom (Hong Kong) Limited, Managing Director of Finance Department of China Mobile (Hong Kong) Group Limited, Deputy Chief Financial Officer and Managing Director of Finance Department of China Mobile Limited which is listed on the Main Board of the HKSE, Director General of Finance Department of China Mobile Communications Corporation, Deputy Chief Accountant and Director General of Finance Department of China Mobile Communications Group Co., Ltd. and a Director of Shanghai Pudong Development Bank Co., Ltd. which is listed on the Shanghai Stock Exchange. She is currently the Chief Accountant of China Telecommunications Corporation. Madam Zhu has extensive experience in finance, management and the telecommunications industry. China Telecom Corporation Limited Annual Report 2020 021
BIOGRAPHICAL DETAILS OF DIRECTORS, SENIOR MANAGEMENT AND SUPERVISORS MR. CHEN SHENGGUANG Age 57, is a Non-Executive Director of the Company. He joined the Board of Directors of the Company in May 2017. Mr. Chen graduated from Zhongnan University of Economics with a major in finance and accounting, and obtained a postgraduate degree in economics from Guangdong Academy of Social Sciences and a master degree in business administration (MBA) from Lingnan College of Sun Yat-sen University. Mr. Chen is currently the Director and General Manager of Guangdong Rising Holdings Group Co., Ltd.* (one of the domestic shareholders of the Company). Mr. Chen served as the Manager of Finance Department and Deputy General Manager of Guangdong Foreign Trade Import & Export Corporation, Head of Finance Department, Assistant to General Manager and Chief Accountant of Guangdong Guangxin Foreign Trade Group Co., Limited, a Director of FSPG Hi-Tech Co., Ltd. which is listed on the Shenzhen Stock Exchange, a Non-Executive Director of Xingfa Aluminium Holdings Limited which is listed on the Main Board of the HKSE, a Director of Guangdong Silk-Tex Group Co., Ltd., the Chief Accountant and Deputy General Manager of Guangdong Guangxin Holdings Group Ltd. Mr. Chen has extensive experience in finance and corporate management. * A substantial shareholder of the Company within the meaning of Part XV of the Securities and Futures Ordinance. 022 China Telecom Corporation Limited Annual Report 2020
BIOGRAPHICAL DETAILS OF DIRECTORS, SENIOR MANAGEMENT AND SUPERVISORS MR. TSE HAU YIN, ALOYSIUS Age 73, is an Independent Non-Executive Director of the Company. He joined the Board of Directors of the Company in September 2005. Mr. Tse is currently an Independent Non-Executive Director of CNOOC Limited, Sinofert Holdings Limited, SJM Holdings Limited and China Huarong Asset Management Co., Ltd., all of which are listed on the Main Board of the HKSE. Mr. Tse is also an Independent Non-Executive Director of OCBC Wing Hang Bank Limited (formerly known as “Wing Hang Bank Limited”, which was listed on the Main Board of the HKSE until October 2014). From 2004 to 2010, he was an Independent Non-Executive Director of China Construction Bank Corporation, which is listed on the Main Board of the HKSE. From 2005 to 2016, Mr. Tse was also an Independent Non-Executive Director of Daohe Global Group Limited (formerly known as “Linmark Group Limited”), which is listed on the Main Board of the HKSE. Mr. Tse was appointed as an Independent Non-Executive Director of CCB International (Holdings) Limited, a wholly owned subsidiary of China Construction Bank Corporation in March 2013. He is also a member of the International Advisory Council of the People’s Municipal Government of Wuhan. Mr. Tse is a fellow of the Institute of Chartered Accountants in England and Wales, and the Hong Kong Institute of Certified Public Accountants (“HKICPA”). Mr. Tse is a past President and a former member of the Audit Committee of the HKICPA. He joined KPMG in 1976, became a partner in 1984 and retired in March 2003. Mr. Tse was a Non-Executive Chairman of KPMG’s operations in China and a member of the KPMG China advisory board from 1997 to 2000. Mr. Tse is a graduate of the University of Hong Kong. China Telecom Corporation Limited Annual Report 2020 023
BIOGRAPHICAL DETAILS OF DIRECTORS, SENIOR MANAGEMENT AND SUPERVISORS PROFESSOR XU ERMING Age 71, is an Independent Non-Executive Director of the Company. He joined the Board of Directors of the Company in September 2005. Professor Xu is a Vice Chairman of the Chinese Enterprise Management Research Association. He is entitled to the State Council’s special government allowances. Professor Xu served as a professor, Ph.D. supervisor of the Graduate School and Dean of Business School at the Renmin University of China, a professor and Dean of Business School of Shantou University, and was an Independent Supervisor of Harbin Electric Company Limited and an Independent Non-Executive Director of Comtec Solar Systems Group Limited, both are listed on the Main Board of the HKSE. Over the years, Professor Xu has conducted research in areas related to strategic management, innovation and entrepreneurship management, and has been responsible for research on many subjects put forward by the National Natural Science Foundation, the National Social Science Foundation, and other authorities at provincial and ministry level. He has received many awards such as the Ministry of Education’s Class One Excellent Higher Education Textbook Award, the State-Level Class Two Teaching Award and the National Excellent Course Award. Professor Xu has been awarded the Fulbright Scholar of U.S.A. twice and the visiting scholar of McGill University, Canada. Professor Xu was previously a lecturer at the New York State University at Buffalo, U.S.A., the University of Scranton, U.S.A., the University of Technology, Sydney, the Kyushu University, Japan, Panyapiwat Institute of Management, Thailand and the Hong Kong Polytechnic University. 024 China Telecom Corporation Limited Annual Report 2020
BIOGRAPHICAL DETAILS OF DIRECTORS, SENIOR MANAGEMENT AND SUPERVISORS MADAM WANG HSUEHMING Age 71, is an Independent Non-Executive Director of the Company. She joined the Board of Directors of the Company in May 2014. Madam Wang received a bachelor of arts degree from the University of Massachusetts and attended Columbia University. She was a Senior Advisor and former Chairman of BlackRock China. She was also the former Chairman of China at Goldman Sachs Asset Management. She joined Goldman Sachs in 1994, became a Partner in 2000 and an Advisory Director from 2010 to 2011. With nearly 30 years of experience in financial services, she participated in pioneering efforts in China’s economic reform and development. She was instrumental in advising Ministry of Posts and Telecommunications and Ministry of Information Industry (now known as Ministry of Industry and Information Technology) in the privatisations and listings of its mobile and fixed line businesses. She also participated in advising appropriate operators in strategic investments by international telecom companies. The early cross-border financings of aircraft and other capital equipment in China’s aviation sector, as well as the separate listings of national airlines, and important provincial and municipal credit restructurings also formed part of Madam Wang’s understanding of China’s economic growth in the past three decades. China Telecom Corporation Limited Annual Report 2020 025
BIOGRAPHICAL DETAILS OF DIRECTORS, SENIOR MANAGEMENT AND SUPERVISORS MR. YEUNG CHI WAI, JASON Age 66, is an Independent Non-Executive Director of the Company. He joined the Board of Directors of the Company in October 2018. Mr. Yeung is currently the Group Chief Compliance and Risk Management Officer of Fung Holdings (1937) Limited and its listed companies in Hong Kong, an Independent Non-Executive Director of Bank of Communications Co., Ltd, which is listed on the Main Board of the HKSE and the Shanghai Stock Exchange and a member of Hospital Authority Board of Hong Kong. Mr. Yeung has extensive experience in handling legal, compliance and regulatory matters and previously worked in the Securities and Futures Commission of Hong Kong, law firms and enterprises practising corporate, commercial and securities laws. Mr. Yeung served as a Director and the General Counsel of China Everbright Limited, which is listed on the Main Board of the HKSE and was also a partner of Woo, Kwan, Lee, & Lo. He acted as the Board Secretary of BOC Hong Kong (Holdings) Limited which is listed on the Main Board of the HKSE, from 2001 to 2011 and concurrently acted as the Board Secretary of Bank of China Limited which is listed on the Main Board of the HKSE and the Shanghai Stock Exchange, from 2005 to 2008. He also served as the Deputy Chief Executive (Personal Banking) of Bank of China (Hong Kong) Limited from April 2011 to February 2015. Mr. Yeung received a bachelor degree in social sciences from the University of Hong Kong. He then graduated from The College of Law, United Kingdom and received a bachelor degree in law and a master degree in business administration from the University of Western Ontario, Canada. SUPERVISORS MR. SUI YIXUN Age 57, is a Shareholder Representative Supervisor and the Chairman of the Supervisory Committee of the Company. He joined the Supervisory Committee of the Company in May 2015. Mr. Sui is currently a Supervisor of Tianyi Telecom Terminals Company Limited and a Supervisor of China Tower Corporation Limited which is listed on the Main Board of the HKSE. Mr. Sui received a bachelor degree from Beijing Institute of Posts and Telecommunications and a master degree in business administration from Tsinghua University. Mr. Sui served as Deputy General Manager of China Telecom Shandong branch, Deputy General Manager of the Northern Telecom of China Telecommunications Corporation, General Manager of China Telecom Inner Mongolia Autonomous Region branch and the Managing Director of audit department of the Company. Mr. Sui is a senior economist and has extensive experience in operational and financial management in the telecommunications industry. 026 China Telecom Corporation Limited Annual Report 2020
BIOGRAPHICAL DETAILS OF DIRECTORS, SENIOR MANAGEMENT AND SUPERVISORS MR. ZHANG JIANBIN Age 55, is an Employee Representative Supervisor of the Company. He joined the Supervisory Committee of the Company in October 2012. Mr. Zhang is currently the Deputy Managing Director of the Legal Department (Compliance Management Department) of the Company and the Deputy General Counsel of China Telecommunications Corporation. Mr. Zhang graduated from the Law School of Peking University in 1989 and received a LLM degree. He also had an EMBA degree from the Guanghua School of Management at Peking University in 2006. He previously worked at the Department of Policy and Regulation of the Ministry of Posts and Telecommunications (“MPT”) and the Directorate General of Telecommunications of the MPT. Mr. Zhang has extensive experience in corporate legal affairs. MR. DAI BIN Age 52, is an Employee Representative Supervisor of the Company. He joined the Supervisory Committee of the Company in May 2020. Mr. Dai serves as the Vice Chairman of the Labour Union of China Telecommunications Corporation. Mr. Dai is a senior economist. He graduated from Xiamen University and received a bachelor degree in Chinese language and literature. He also obtained an EMBA degree from the Guanghua School of Management at Peking University. He served as a Deputy Managing Director of the Office of the Board of Directors of the Company and the Deputy Managing Director of the General Affairs Office (Office of the Board of Directors and Security Department) of China Telecommunications Corporation. Mr. Dai has extensive experience in operational management in the telecommunications industry. MR. XU SHIGUANG Age 41, is a Shareholder Representative Supervisor of the Company. He joined the Supervisory Committee of the Company in October 2018. Mr. Xu is currently the Deputy General Manager of Inner Mongolia Autonomous Region branch of the Company. Mr. Xu received a bachelor degree in auditing and a master degree in accounting from the Nankai University. Mr. Xu served at various positions in internal control and auditing at China Telecommunications Corporation for many years and was the Director of general office of audit department of the Company. Mr. Xu is a member of the Chinese Institute of Certified Public Accountants and a Certified Internal Auditor with extensive experience in internal control and auditing. MR. YOU MINQIANG Age 47, is a Shareholder Representative Supervisor of the Company. He joined the Supervisory Committee of the Company in May 2020. Mr. You serves as a Deputy Director of the Organisation Department (Human Resources Department) of Zhejiang Provincial Financial Development Co., Ltd. (one of the domestic shareholders of the Company) and the Chairman of the Supervisory Committee of Zhejiang Nongdu Agricultural Products Co., Ltd. Mr. You is a senior economist. He graduated from Hangzhou University and received a bachelor degree in education. Mr. You served in Armed Police Hangzhou Command School and Zhejiang Provincial Financial Holdings Co., Ltd. He has extensive experience in the field of human resources. China Telecom Corporation Limited Annual Report 2020 027

AI to Inject Intelligence 1 1 0 0 1 8 01 10 0 01 1 0 1 01
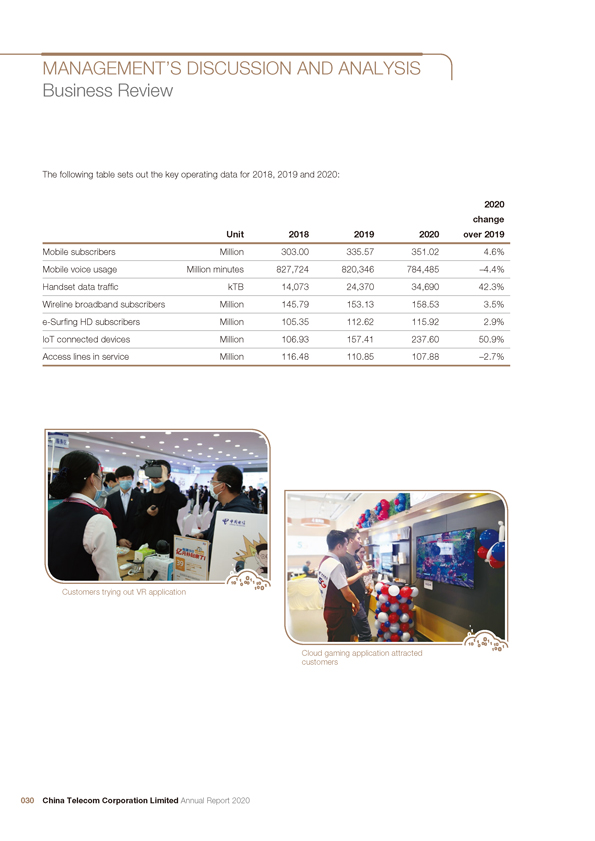
MANAGEMENT’S DISCUSSION AND ANALYSIS Business Review The following table sets out the key operating data for 2018, 2019 and 2020: 2020 change Unit 2018 2019 2020 over 2019 Mobile subscribers Million 303.00 335.57 351.02 4.6% Mobile voice usage Million minutes 827,724 820,346 784,485 –4.4% Handset data traffic kTB 14,073 24,370 34,690 42.3% Wireline broadband subscribers Million 145.79 153.13 158.53 3.5% e-Surfing HD subscribers Million 105.35 112.62 115.92 2.9% IoT connected devices Million 106.93 157.41 237.60 50.9% Access lines in service Million 116.48 110.85 107.88 –2.7% Customers trying out VR application Cloud gaming application attracted customers 030 China Telecom Corporation Limited Annual Report 2020
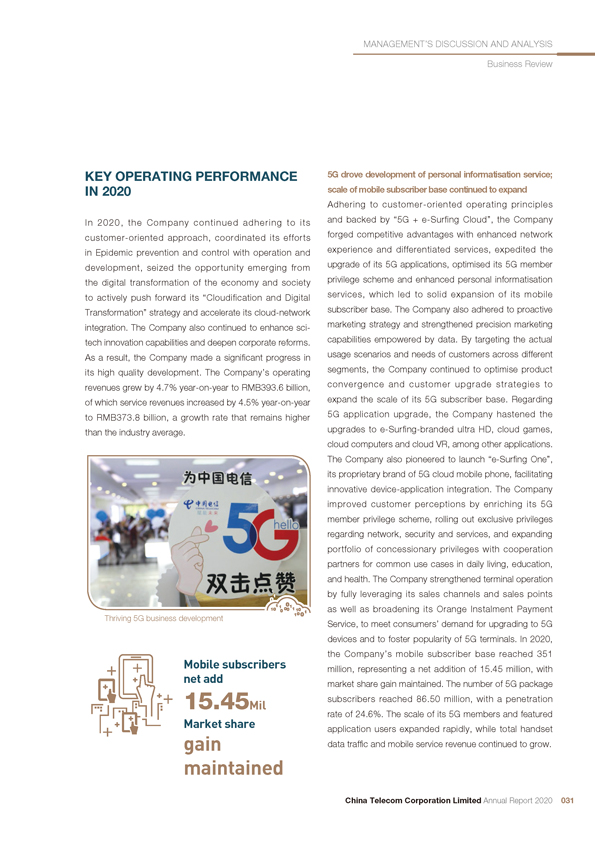
MANAGEMENT’S DISCUSSION AND ANALYSIS Business Review KEY OPERATING PERFORMANCE 5G drove development of personal informatisation service; IN 2020 scale of mobile subscriber base continued to expand Adhering to customer-oriented operating principles In 2020, the Company continued adhering to its and backed by “5G + e-Surfing Cloud”, the Company customer-oriented approach, coordinated its efforts forged competitive advantages with enhanced network in Epidemic prevention and control with operation and experience and differentiated services, expedited the development, seized the opportunity emerging from upgrade of its 5G applications, optimised its 5G member the digital transformation of the economy and society privilege scheme and enhanced personal informatisation to actively push forward its “Cloudification and Digital services, which led to solid expansion of its mobile Transformation” strategy and accelerate its cloud-network subscriber base. The Company also adhered to proactive integration. The Company also continued to enhance sci- marketing strategy and strengthened precision marketing tech innovation capabilities and deepen corporate reforms. capabilities empowered by data. By targeting the actual As a result, the Company made a significant progress in usage scenarios and needs of customers across different its high quality development. The Company’s operating segments, the Company continued to optimise product revenues grew by 4.7% year-on-year to RMB393.6 billion, convergence and customer upgrade strategies to of which service revenues increased by 4.5% year-on-year expand the scale of its 5G subscriber base. Regarding to RMB373.8 billion, a growth rate that remains higher 5G application upgrade, the Company hastened the than the industry average. upgrades to e-Surfing-branded ultra HD, cloud games, cloud computers and cloud VR, among other applications. The Company also pioneered to launch “e-Surfing One”, its proprietary brand of 5G cloud mobile phone, facilitating innovative device-application integration. The Company improved customer perceptions by enriching its 5G member privilege scheme, rolling out exclusive privileges regarding network, security and services, and expanding portfolio of concessionary privileges with cooperation partners for common use cases in daily living, education, and health. The Company strengthened terminal operation by fully leveraging its sales channels and sales points as well as broadening its Orange Instalment Payment Thriving 5G business development Service, to meet consumers’ demand for upgrading to 5G devices and to foster popularity of 5G terminals. In 2020, the Company’s mobile subscriber base reached 351 Mobile subscribers million, representing a net addition of 15.45 million, with net add market share gain maintained. The number of 5G package 15.45 Mil subscribers reached 86.50 million, with a penetration rate of 24.6% . The scale of its 5G members and featured Market share application users expanded rapidly, while total handset gain data traffic and mobile service revenue continued to grow. maintained China Telecom Corporation Limited Annual Report 2020 031
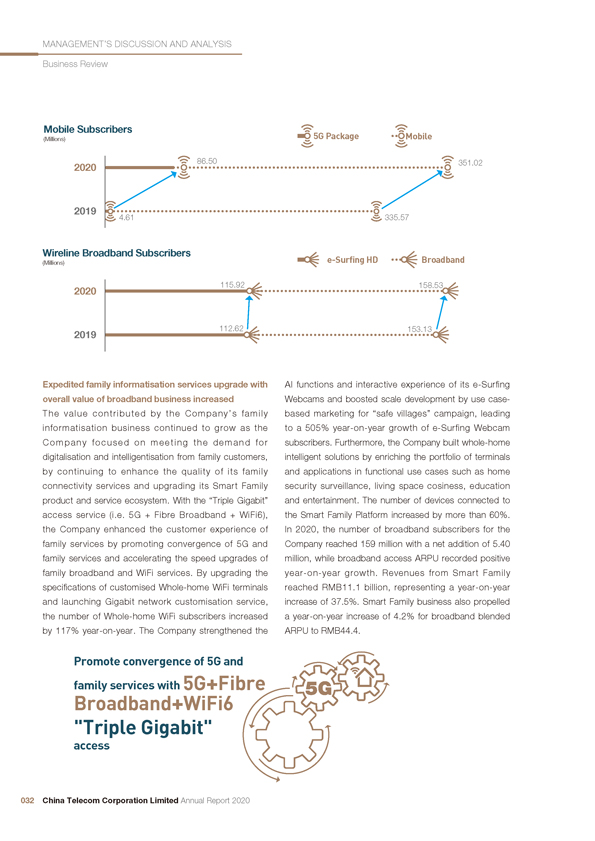
MANAGEMENT’S DISCUSSION AND ANALYSIS Business Review Mobile Subscribers (Millions) 5G Package Mobile 86.50 351.02 2020 2019 4.61 335.57 Wireline Broadband Subscribers (Millions) e-Surfing HD Broadband 115.92 158.53 2020 112.62 153.13 2019 Expedited family informatisation services upgrade with AI functions and interactive experience of its e-Surfing overall value of broadband business increased Webcams and boosted scale development by use case-The value contributed by the Company’s family based marketing for “safe villages” campaign, leading informatisation business continued to grow as the to a 505% year-on-year growth of e-Surfing Webcam Company focused on meeting the demand for subscribers. Furthermore, the Company built whole-home digitalisation and intelligentisation from family customers, intelligent solutions by enriching the portfolio of terminals by continuing to enhance the quality of its family and applications in functional use cases such as home connectivity services and upgrading its Smart Family security surveillance, living space cosiness, education product and service ecosystem. With the “Triple Gigabit” and entertainment. The number of devices connected to access service (i.e. 5G + Fibre Broadband + WiFi6), the Smart Family Platform increased by more than 60%. the Company enhanced the customer experience of In 2020, the number of broadband subscribers for the family services by promoting convergence of 5G and Company reached 159 million with a net addition of 5.40 family services and accelerating the speed upgrades of million, while broadband access ARPU recorded positive family broadband and WiFi services. By upgrading the year-on-year growth. Revenues from Smart Family specifications of customised Whole-home WiFi terminals reached RMB11.1 billion, representing a year-on-year and launching Gigabit network customisation service, increase of 37.5% . Smart Family business also propelled the number of Whole-home WiFi subscribers increased a year-on-year increase of 4.2% for broadband blended by 117% year-on-year. The Company strengthened the ARPU to RMB44.4. Promote convergence of 5G and family services with 5G+Fibre Broadband+WiFi6 “Triple Gigabit” access 032 China Telecom Corporation Limited Annual Report 2020
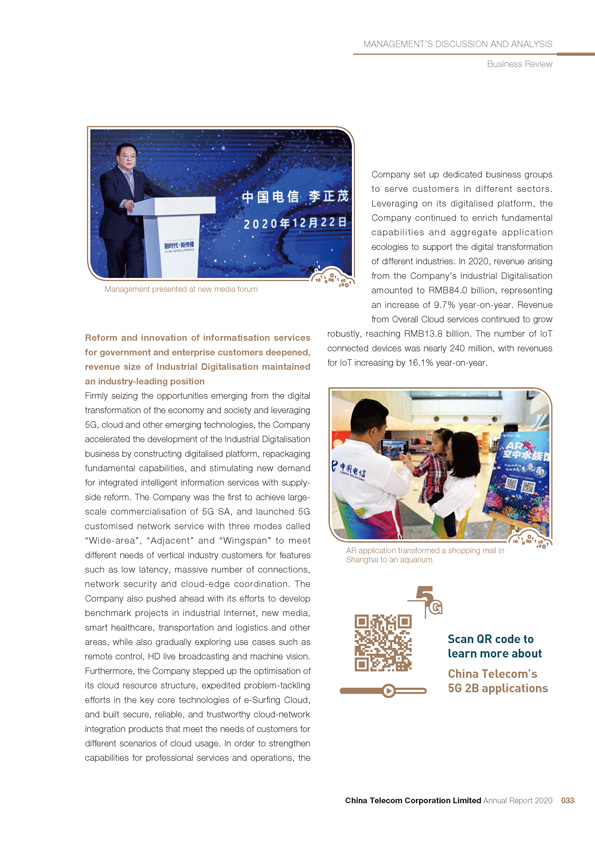
MANAGEMENT’S DISCUSSION AND ANALYSIS Business Review Company set up dedicated business groups to serve customers in different sectors. Leveraging on its digitalised platform, the Company continued to enrich fundamental capabilities and aggregate application ecologies to support the digital transformation of different industries. In 2020, revenue arising from the Company’s Industrial Digitalisation Management presented at new media forum amounted to RMB84.0 billion, representing an increase of 9.7% year-on-year. Revenue from Overall Cloud services continued to grow Reform and innovation of informatisation services robustly, reaching RMB13.8 billion. The number of IoT for government and enterprise customers deepened, connected devices was nearly 240 million, with revenues revenue size of Industrial Digitalisation maintained for IoT increasing by 16.1% year-on-year. an industry-leading position Firmly seizing the opportunities emerging from the digital transformation of the economy and society and leveraging 5G, cloud and other emerging technologies, the Company accelerated the development of the Industrial Digitalisation business by constructing digitalised platform, repackaging fundamental capabilities, and stimulating new demand for integrated intelligent information services with supply-side reform. The Company was the first to achieve large-scale commercialisation of 5G SA, and launched 5G customised network service with three modes called “Wide-area”, “Adjacent” and “Wingspan” to meet AR application transformed a shopping mall in different needs of vertical industry customers for features Shanghai to an aquarium such as low latency, massive number of connections, network security and cloud-edge coordination. The Company also pushed ahead with its efforts to develop benchmark projects in industrial Internet, new media, smart healthcare, transportation and logistics and other Scan QR code to areas, while also gradually exploring use cases such as learn more about remote control, HD live broadcasting and machine vision. Furthermore, the Company stepped up the optimisation of China Telecom’s its cloud resource structure, expedited problem-tackling 5G 2B applications efforts in the key core technologies of e-Surfing Cloud, and built secure, reliable, and trustworthy cloud-network integration products that meet the needs of customers for different scenarios of cloud usage. In order to strengthen capabilities for professional services and operations, the China Telecom Corporation Limited Annual Report 2020 033
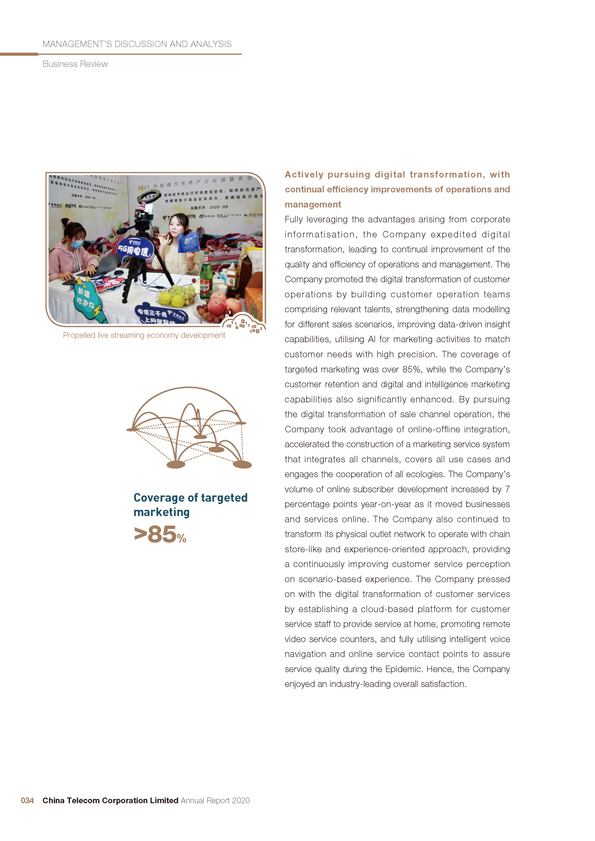
MANAGEMENT’S DISCUSSION AND ANALYSIS Business Review Actively pursuing digital transformation, with continual efficiency improvements of operations and management Fully leveraging the advantages arising from corporate informatisation, the Company expedited digital transformation, leading to continual improvement of the quality and efficiency of operations and management. The Company promoted the digital transformation of customer operations by building customer operation teams comprising relevant talents, strengthening data modelling for different sales scenarios, improving data-driven insight Propelled live streaming economy development capabilities, utilising AI for marketing activities to match customer needs with high precision. The coverage of targeted marketing was over 85%, while the Company’s customer retention and digital and intelligence marketing capabilities also significantly enhanced. By pursuing the digital transformation of sale channel operation, the Company took advantage of online-offline integration, accelerated the construction of a marketing service system that integrates all channels, covers all use cases and engages the cooperation of all ecologies. The Company’s volume of online subscriber development increased by 7 Coverage of targeted percentage points year-on-year as it moved businesses marketing and services online. The Company also continued to >85% transform its physical outlet network to operate with chain store-like and experience-oriented approach, providing a continuously improving customer service perception on scenario-based experience. The Company pressed on with the digital transformation of customer services by establishing a cloud-based platform for customer service staff to provide service at home, promoting remote video service counters, and fully utilising intelligent voice navigation and online service contact points to assure service quality during the Epidemic. Hence, the Company enjoyed an industry-leading overall satisfaction. 034 China Telecom Corporation Limited Annual Report 2020
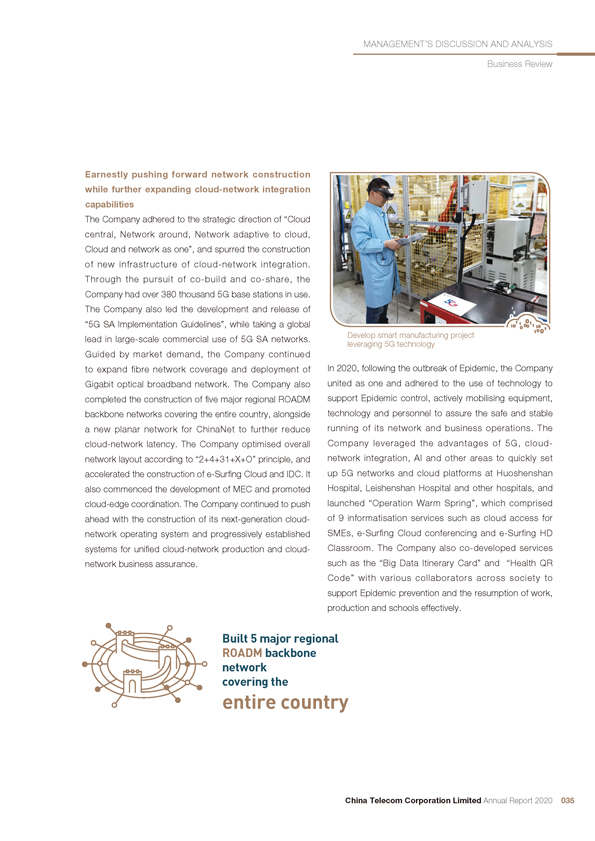
MANAGEMENT’S DISCUSSION AND ANALYSIS Business Review Earnestly pushing forward network construction while further expanding cloud-network integration capabilities The Company adhered to the strategic direction of “Cloud central, Network around, Network adaptive to cloud, Cloud and network as one”, and spurred the construction of new infrastructure of cloud-network integration. Through the pursuit of co-build and co-share, the Company had over 380 thousand 5G base stations in use. The Company also led the development and release of “5G SA Implementation Guidelines”, while taking a global lead in large-scale commercial use of 5G SA networks. Develop smart manufacturing project leveraging 5G technology Guided by market demand, the Company continued to expand fibre network coverage and deployment of In 2020, following the outbreak of Epidemic, the Company Gigabit optical broadband network. The Company also united as one and adhered to the use of technology to completed the construction of five major regional ROADM support Epidemic control, actively mobilising equipment, backbone networks covering the entire country, alongside technology and personnel to assure the safe and stable a new planar network for ChinaNet to further reduce running of its network and business operations. The cloud-network latency. The Company optimised overall Company leveraged the advantages of 5G, cloud-network layout according to “2+4+31+X+O” principle, and network integration, AI and other areas to quickly set accelerated the construction of e-Surfing Cloud and IDC. It up 5G networks and cloud platforms at Huoshenshan also commenced the development of MEC and promoted Hospital, Leishenshan Hospital and other hospitals, and cloud-edge coordination. The Company continued to push launched “Operation Warm Spring”, which comprised ahead with the construction of its next-generation cloud- of 9 informatisation services such as cloud access for network operating system and progressively established SMEs, e-Surfing Cloud conferencing and e-Surfing HD systems for unified cloud-network production and cloud- Classroom. The Company also co-developed services network business assurance. such as the “Big Data Itinerary Card” and “Health QR Code” with various collaborators across society to support Epidemic prevention and the resumption of work, production and schools effectively. Built 5 major regional ROADM backbone network covering the entire country China Telecom Corporation Limited Annual Report 2020 035
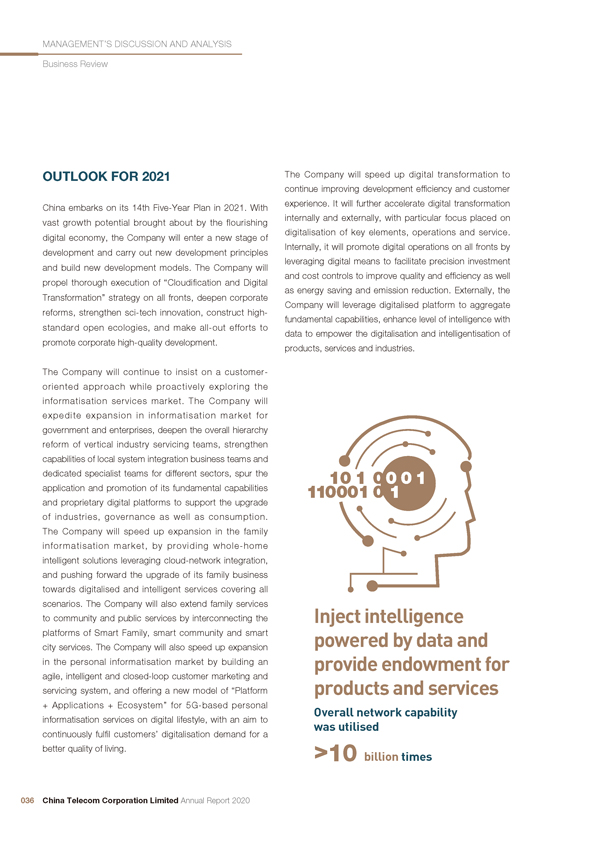
MANAGEMENT’S DISCUSSION AND ANALYSIS Business Review OUTLOOK FOR 2021 The Company will speed up digital transformation to continue improving development efficiency and customer China embarks on its 14th Five-Year Plan in 2021. With experience. It will further accelerate digital transformation internally and externally, with particular focus placed on vast growth potential brought about by the flourishing digitalisation of key elements, operations and service. digital economy, the Company will enter a new stage of Internally, it will promote digital operations on all fronts by development and carry out new development principles leveraging digital means to facilitate precision investment and build new development models. The Company will and cost controls to improve quality and efficiency as well propel thorough execution of “Cloudification and Digital as energy saving and emission reduction. Externally, the Transformation” strategy on all fronts, deepen corporate Company will leverage digitalised platform to aggregate reforms, strengthen sci-tech innovation, construct high-standard open ecologies, and make all-out efforts to fundamental capabilities, enhance level of intelligence with promote corporate high-quality development. data to empower the digitalisation and intelligentisation of products, services and industries. The Company will continue to insist on a customer-oriented approach while proactively exploring the informatisation services market. The Company will expedite expansion in informatisation market for government and enterprises, deepen the overall hierarchy reform of vertical industry servicing teams, strengthen capabilities of local system integration business teams and dedicated specialist teams for different sectors, spur the application and promotion of its fundamental capabilities and proprietary digital platforms to support the upgrade of industries, governance as well as consumption. The Company will speed up expansion in the family informatisation market, by providing whole-home intelligent solutions leveraging cloud-network integration, and pushing forward the upgrade of its family business towards digitalised and intelligent services covering all scenarios. The Company will also extend family services to community and public services by interconnecting the Inject intelligence platforms of Smart Family, smart community and smart powered by data and city services. The Company will also speed up expansion in the personal informatisation market by building an provide endowment for agile, intelligent and closed-loop customer marketing and servicing system, and offering a new model of “Platform products and services + Applications + Ecosystem” for 5G-based personal Overall network capability informatisation services on digital lifestyle, with an aim to was utilised continuously fulfil customers’ digitalisation demand for a better quality of living. > 10 billion times 036 China Telecom Corporation Limited Annual Report 2020
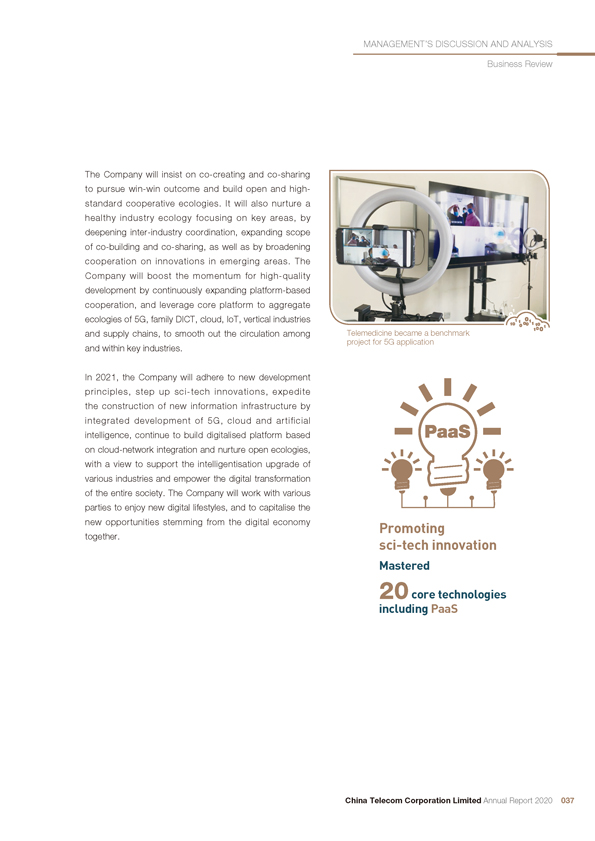
MANAGEMENT’S DISCUSSION AND ANALYSIS Business Review The Company will insist on co-creating and co-sharing to pursue win-win outcome and build open and high-standard cooperative ecologies. It will also nurture a healthy industry ecology focusing on key areas, by deepening inter-industry coordination, expanding scope of co-building and co-sharing, as well as by broadening cooperation on innovations in emerging areas. The Company will boost the momentum for high-quality development by continuously expanding platform-based cooperation, and leverage core platform to aggregate ecologies of 5G, family DICT, cloud, IoT, vertical industries and supply chains, to smooth out the circulation among Telemedicine became a benchmark project for 5G application and within key industries. In 2021, the Company will adhere to new development principles, step up sci-tech innovations, expedite the construction of new information infrastructure by integrated development of 5G, cloud and artificial intelligence, continue to build digitalised platform based on cloud-network integration and nurture open ecologies, with a view to support the intelligentisation upgrade of various industries and empower the digital transformation of the entire society. The Company will work with various parties to enjoy new digital lifestyles, and to capitalise the new opportunities stemming from the digital economy Promoting together. sci-tech innovation Mastered 20 core technologies including PaaS China Telecom Corporation Limited Annual Report 2020 037
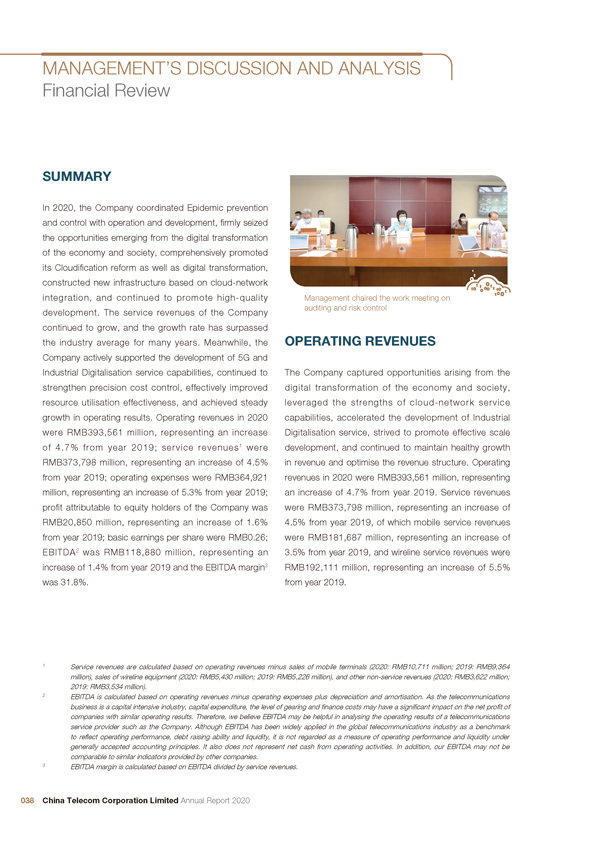
MANAGEMENT’S DISCUSSION AND ANALYSIS Financial Review SUMMARY In 2020, the Company coordinated Epidemic prevention and control with operation and development, firmly seized the opportunities emerging from the digital transformation of the economy and society, comprehensively promoted its Cloudification reform as well as digital transformation, constructed new infrastructure based on cloud-network integration, and continued to promote high-quality Management chaired the work meeting on auditing and risk control development. The service revenues of the Company continued to grow, and the growth rate has surpassed the industry average for many years. Meanwhile, the OPERATING REVENUES Company actively supported the development of 5G and Industrial Digitalisation service capabilities, continued to The Company captured opportunities arising from the strengthen precision cost control, effectively improved digital transformation of the economy and society, resource utilisation effectiveness, and achieved steady leveraged the strengths of cloud-network service growth in operating results. Operating revenues in 2020 capabilities, accelerated the development of Industrial were RMB393,561 million, representing an increase Digitalisation service, strived to promote effective scale of 4.7% from year 2019; service revenues1 were development, and continued to maintain healthy growth RMB373,798 million, representing an increase of 4.5% in revenue and optimise the revenue structure. Operating from year 2019; operating expenses were RMB364,921 revenues in 2020 were RMB393,561 million, representing million, representing an increase of 5.3% from year 2019; an increase of 4.7% from year 2019. Service revenues profit attributable to equity holders of the Company was were RMB373,798 million, representing an increase of RMB20,850 million, representing an increase of 1.6% 4.5% from year 2019, of which mobile service revenues from year 2019; basic earnings per share were RMB0.26; were RMB181,687 million, representing an increase of EBITDA2 was RMB118,880 million, representing an 3.5% from year 2019, and wireline service revenues were increase of 1.4% from year 2019 and the EBITDA margin3 RMB192,111 million, representing an increase of 5.5% was 31.8% . from year 2019. 1 Service revenues are calculated based on operating revenues minus sales of mobile terminals (2020: RMB10,711 million; 2019: RMB9,364 million), sales of wireline equipment (2020: RMB5,430 million; 2019: RMB5,226 million), and other non-service revenues (2020: RMB3,622 million; 2019: RMB3,534 million). 2 EBITDA is calculated based on operating revenues minus operating expenses plus depreciation and amortisation. As the telecommunications business is a capital intensive industry, capital expenditure, the level of gearing and finance costs may have a significant impact on the net profit of companies with similar operating results. Therefore, we believe EBITDA may be helpful in analysing the operating results of a telecommunications service provider such as the Company. Although EBITDA has been widely applied in the global telecommunications industry as a benchmark to reflect operating performance, debt raising ability and liquidity, it is not regarded as a measure of operating performance and liquidity under generally accepted accounting principles. It also does not represent net cash from operating activities. In addition, our EBITDA may not be comparable to similar indicators provided by other companies. 3 EBITDA margin is calculated based on EBITDA divided by service revenues. 038 China Telecom Corporation Limited Annual Report 2020
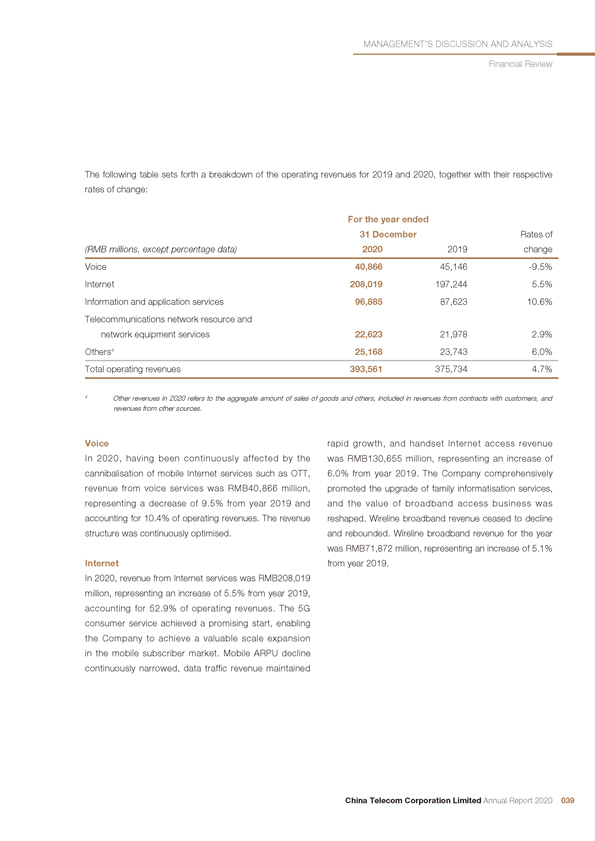
MANAGEMENT’S DISCUSSION AND ANALYSIS Financial Review The following table sets forth a breakdown of the operating revenues for 2019 and 2020, together with their respective rates of change: For the year ended 31 December Rates of (RMB millions, except percentage data) 2020 2019 change Voice 40,866 45,146 -9.5% Internet 208,019 197,244 5.5% Information and application services 96,885 87,623 10.6% Telecommunications network resource and network equipment services 22,623 21,978 2.9% Others4 25,168 23,743 6.0% Total operating revenues 393,561 375,734 4.7% 4 Other revenues in 2020 refers to the aggregate amount of sales of goods and others, included in revenues from contracts with customers, and revenues from other sources. Voice rapid growth, and handset Internet access revenue In 2020, having been continuously affected by the was RMB130,655 million, representing an increase of cannibalisation of mobile Internet services such as OTT, 6.0% from year 2019. The Company comprehensively revenue from voice services was RMB40,866 million, promoted the upgrade of family informatisation services, representing a decrease of 9.5% from year 2019 and and the value of broadband access business was accounting for 10.4% of operating revenues. The revenue reshaped. Wireline broadband revenue ceased to decline structure was continuously optimised. and rebounded. Wireline broadband revenue for the year was RMB71,872 million, representing an increase of 5.1% Internet from year 2019. In 2020, revenue from Internet services was RMB208,019 million, representing an increase of 5.5% from year 2019, accounting for 52.9% of operating revenues. The 5G consumer service achieved a promising start, enabling the Company to achieve a valuable scale expansion in the mobile subscriber market. Mobile ARPU decline continuously narrowed, data traffic revenue maintained China Telecom Corporation Limited Annual Report 2020 039
MANAGEMENT’S DISCUSSION AND ANALYSIS Financial Review Information and Application Services Others In 2020, the Company sped up the integration and In 2020, other revenues were RMB25,168 million, innovation of emerging technologies. Industrial representing an increase of 6.0% from year 2019 and Digitalisation service was developed at a quicker speed. accounting for 6.4% of operating revenues. The increase Revenue from information and application services was was mainly due to the increase in the scale of mobile RMB96,885 million, representing an increase of 10.6% terminals sold. from year 2019 and accounting for 24.6% of operating revenues which benefited from the rapid development OPERATING EXPENSES of emerging businesses such as IDC, Industry Cloud, e-Surfing HD and Internet Finance. The Company seized the opportunity of 5G scale development, accelerated digital transformation Telecommunications Network Resource and development, and continued to increase investment Equipment Services in government and enterprise business and research In 2020, revenue from telecommunications network and development system. Concurrently, the Company resource and equipment services was RMB22,623 million, internally strengthened the deployment of the digital representing an increase of 2.9% from year 2019 and platform, took various measures to continue to strengthen accounting for 5.7% of operating revenues. The growth precision cost control, further carried out multi-dimensional was mainly due to favourable growth in revenues from subdivision, and effectively improved the effectiveness of cloud dedicated lines and IP-VPN service. resource utilisation. In 2020, operating expenses were RMB364,921 million, representing an increase of 5.3% from year 2019. Operating expenses accounted for 92.7% of operating revenues, representing an increase of 0.4 percentage point from year 2019. The following table sets forth a breakdown of the operating expenses in 2019 and 2020 and their respective rates of change: For the year ended 31 December Rates of (RMB millions, except percentage data) 2020 2019 change Depreciation and amortisation 90,240 88,145 2.4% Network operations and support 119,517 109,799 8.9% Selling, general and administrative 55,059 57,361 -4.0% Personnel expenses 65,989 63,567 3.8% Other operating expenses 29,074 27,792 4.6% Impairment loss on property, plant and equipment 5,042 – Not Applicable Total operating expenses 364,921 346,664 5.3% 040 China Telecom Corporation Limited Annual Report 2020
MANAGEMENT’S DISCUSSION AND ANALYSIS Financial Review Depreciation and Amortisation Personnel Expenses In 2020, depreciation and amortisation amounted to In 2020, personnel expenses amounted to RMB65,989 RMB90,240 million, representing an increase of 2.4% million, representing an increase of 3.8% from year 2019 from year 2019 and accounting for 22.9% of operating and accounting for 16.8% of operating revenues. The revenues. The main reason for the increase was that increase was mainly due to the Company’s continued the Company increased its capital expenditure in order introduction of high-tech talents and increased incentives to support the scale construction of 5G network and for front-line employees and high performance team, constantly strengthen its competitive advantages in so as to enhance employees’ vitality. Investments in network. personnel expenses are in line with the transformation of the Company towards a sci-tech company in the Network Operations and Support future. Details of the number of employees, remuneration In 2020, network operations and support expenses policies and training programs have been included in amounted to RMB119,517 million, representing an the Environmental, Social and Governance report in this increase of 8.9% from year 2019 and accounting for annual report. 30.4% of operating revenues. The main reason for the increase was because the Company’s continuously Other Operating Expenses optimisation in network quality while improving user In 2020, other operating expenses amounted to perception, actively supporting the development of 5G RMB29,074 million, representing an increase of 4.6% and Industrial Digitalisation service, and appropriately from year 2019 and accounting for 7.4% of operating increasing the deployment in network operation revenues. The increase was mainly due to the increase in expenditures. the scale of mobile terminals sold. Selling, General and Administrative Impairment loss on property, plant and equipment In 2020, selling, general and administrative expenses Following the network evolution and the full coverage of amounted to RMB55,059 million, representing a 4G and 5G scale deployment, the data traffic carried by decrease of 4.0% from year 2019 and accounting for the Company’s 3G network is rapidly shrinking and the 14.0% of operating revenues. Selling expenses were cash flow from the continual use of 3G specific network RMB45,447 million, representing a decrease of 6.2% assets is expected to be so small and even become from year 2019, which was mainly due to the Company negligible. In accordance with the relevant requirements seizing the development opportunities of Internet online of International Financial Reporting Standard, the Group business, accelerating the transformation of sales model conducted an impairment test on the assets such as 3G and the online and offline synergistic development, as specific network assets and recognised an impairment well as enhancing its big data online precision marketing loss of RMB5,042 million at the end of 2020. capabilities and continuously improving the input efficiency of marketing resources. General and administrative expenses amounted to RMB9,612 million, representing Selling expenses an increase of 8.1% from year 2019, which was mainly 6.2 % because of the Company’s active promotion of sci-tech innovation, accelerated transformation to a sci-tech company and increase in the investment in research and development. China Telecom Corporation Limited Annual Report 2020 041
MANAGEMENT’S DISCUSSION AND ANALYSIS Financial Review Net Finance Costs Profit Attributable to Equity Holders of the Company Seizing favourable market opportunities, the Company The Company closely followed the digital transformation implemented low-cost financing and reduced financing progress of the economy and society, deepened reform costs, continued to improve the capability of funds and innovation, and strived to improve quality and increase management, carried out sophisticated management efficiency. In 2020, profit attributable to equity holders of on financing, and competently controlled the scale of the Company was RMB20,850 million, representing an indebtedness. In 2020, net finance costs amounted to increase of 1.6% from 2019. RMB3,014 million, representing a decrease of 17.2% from year 2019. Net exchange loss amounted to RMB163 CAPITAL EXPENDITURE AND CASH million in year 2020 which was mainly due to change in FLOWS the exchange rate of RMB against USD. Capital Expenditure PROFITABILITY LEVEL In 2020, the Company continually promoted the 5G network co-building and co-sharing, Income Tax sped up investment in 5G network construction, and The Company’s statutory income tax rate is 25%. In continuously improved 5G network coverage. Meanwhile, 2020, income tax expenses were RMB6,307 million while the Company accelerated the construction of e-Surfing the effective income tax rate was 23.0% . The difference Cloud and IDC. In 2020, capital expenditure was between the effective income tax rate and the statutory RMB84,800 million, representing an increase of 9.3% income tax rate was mainly due to the low tax rates from year 2019. enjoyed by some subsidiaries and some branches located in the western region of China and the preferential tax Cash Flows policies enjoyed by the Company such as additional tax The net increase in cash and cash equivalents for year deduction on expenses for research and development 2020 was RMB3,076 million and the net increase in proactively implemented by the Company. Meanwhile, cash and cash equivalents for year 2019 was RMB4,098 income from investment in the associate company, China million. Tower Corporation Limited (“China Tower”), was not subject to tax during the period of the investment held. Net finance costs 17.2 % 042 China Telecom Corporation Limited Annual Report 2020
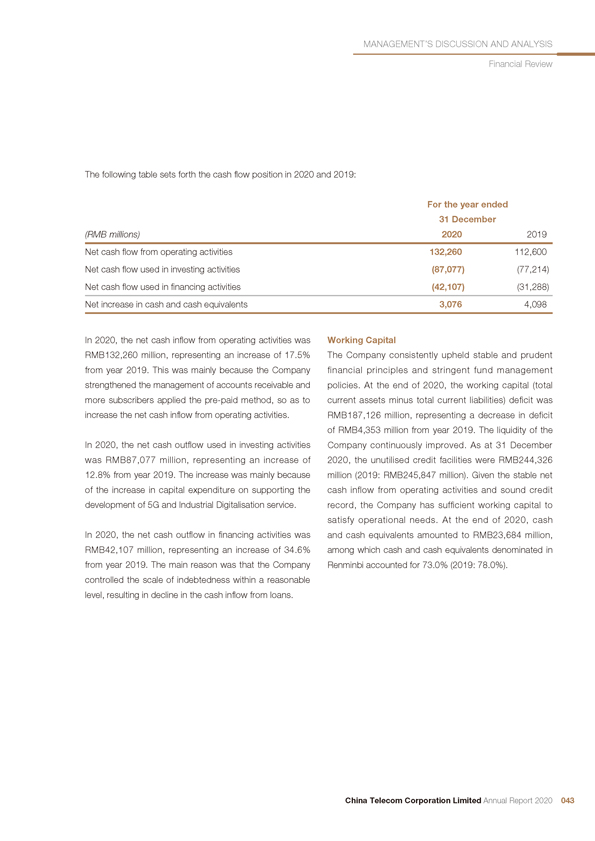
MANAGEMENT’S DISCUSSION AND ANALYSIS Financial Review The following table sets forth the cash flow position in 2020 and 2019: For the year ended 31 December (RMB millions) 2020 2019 Net cash flow from operating activities 132,260 112,600 Net cash flow used in investing activities (87,077) (77,214) Net cash flow used in financing activities (42,107) (31,288) Net increase in cash and cash equivalents 3,076 4,098 In 2020, the net cash inflow from operating activities was Working Capital RMB132,260 million, representing an increase of 17.5% The Company consistently upheld stable and prudent from year 2019. This was mainly because the Company financial principles and stringent fund management strengthened the management of accounts receivable and policies. At the end of 2020, the working capital (total more subscribers applied the pre-paid method, so as to current assets minus total current liabilities) deficit was increase the net cash inflow from operating activities. RMB187,126 million, representing a decrease in deficit of RMB4,353 million from year 2019. The liquidity of the In 2020, the net cash outflow used in investing activities Company continuously improved. As at 31 December was RMB87,077 million, representing an increase of 2020, the unutilised credit facilities were RMB244,326 12.8% from year 2019. The increase was mainly because million (2019: RMB245,847 million). Given the stable net of the increase in capital expenditure on supporting the cash inflow from operating activities and sound credit development of 5G and Industrial Digitalisation service. record, the Company has sufficient working capital to satisfy operational needs. At the end of 2020, cash In 2020, the net cash outflow in financing activities was and cash equivalents amounted to RMB23,684 million, RMB42,107 million, representing an increase of 34.6% among which cash and cash equivalents denominated in from year 2019. The main reason was that the Company Renminbi accounted for 73.0% (2019: 78.0%) . controlled the scale of indebtedness within a reasonable level, resulting in decline in the cash inflow from loans. China Telecom Corporation Limited Annual Report 2020 043
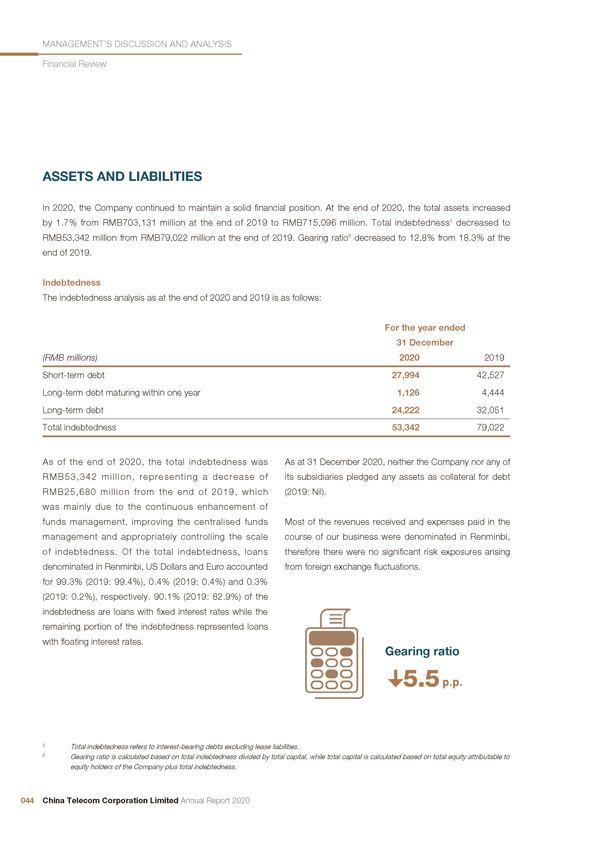
MANAGEMENT’S DISCUSSION AND ANALYSIS Financial Review ASSETS AND LIABILITIES In 2020, the Company continued to maintain a solid financial position. At the end of 2020, the total assets increased by 1.7% from RMB703,131 million at the end of 2019 to RMB715,096 million. Total indebtedness5 decreased to RMB53,342 million from RMB79,022 million at the end of 2019. Gearing ratio6 decreased to 12.8% from 18.3% at the end of 2019. Indebtedness The indebtedness analysis as at the end of 2020 and 2019 is as follows: For the year ended 31 December (RMB millions) 2020 2019 Short-term debt 27,994 42,527 Long-term debt maturing within one year 1,126 4,444 Long-term debt 24,222 32,051 Total indebtedness 53,342 79,022 As of the end of 2020, the total indebtedness was As at 31 December 2020, neither the Company nor any of RMB53,342 million, representing a decrease of its subsidiaries pledged any assets as collateral for debt RMB25,680 million from the end of 2019, which (2019: Nil). was mainly due to the continuous enhancement of funds management, improving the centralised funds Most of the revenues received and expenses paid in the management and appropriately controlling the scale course of our business were denominated in Renminbi, of indebtedness. Of the total indebtedness, loans therefore there were no significant risk exposures arising denominated in Renminbi, US Dollars and Euro accounted from foreign exchange fluctuations. for 99.3% (2019: 99.4%), 0.4% (2019: 0.4%) and 0.3% (2019: 0.2%), respectively. 90.1% (2019: 82.9%) of the indebtedness are loans with fixed interest rates while the remaining portion of the indebtedness represented loans with floating interest rates. Gearing ratio 5.5 p.p. 5 Total indebtedness refers to interest-bearing debts excluding lease liabilities. 6 Gearing ratio is calculated based on total indebtedness divided by total capital, while total capital is calculated based on total equity attributable to equity holders of the Company plus total indebtedness. 044 China Telecom Corporation Limited Annual Report 2020
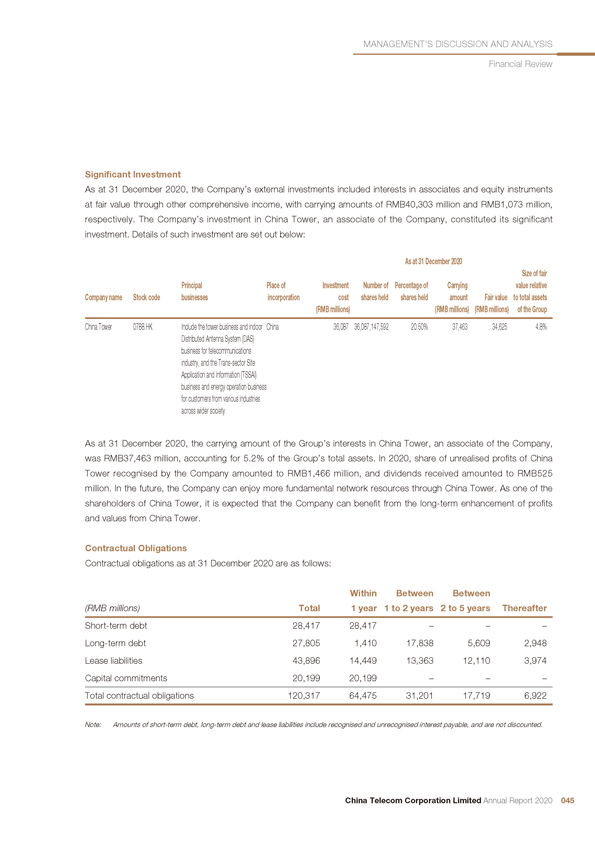
MANAGEMENT’S DISCUSSION AND ANALYSIS Financial Review Significant Investment As at 31 December 2020, the Company’s external investments included interests in associates and equity instruments at fair value through other comprehensive income, with carrying amounts of RMB40,303 million and RMB1,073 million, respectively. The Company’s investment in China Tower, an associate of the Company, constituted its significant investment. Details of such investment are set out below: As at 31 December 2020 Size of fair Principal Place of Investment Number of Percentage of Carrying value relative Company name Stock code businesses incorporation cost shares held shares held amount Fair value to total assets (RMB millions) (RMB millions) (RMB millions) of the Group China Tower 0788.HK Include the tower business and indoor China 36,087 36,087,147,592 20.50% 37,463 34,625 4.8% Distributed Antenna System (DAS) business for telecommunications industry, and the Trans-sector Site Application and Information (TSSAI) business and energy operation business for customers from various industries across wider society As at 31 December 2020, the carrying amount of the Group’s interests in China Tower, an associate of the Company, was RMB37,463 million, accounting for 5.2% of the Group’s total assets. In 2020, share of unrealised profits of China Tower recognised by the Company amounted to RMB1,466 million, and dividends received amounted to RMB525 million. In the future, the Company can enjoy more fundamental network resources through China Tower. As one of the shareholders of China Tower, it is expected that the Company can benefit from the long-term enhancement of profits and values from China Tower. Contractual Obligations Contractual obligations as at 31 December 2020 are as follows: Within Between Between (RMB millions) Total 1 year 1 to 2 years 2 to 5 years Thereafter Short-term debt 28,417 28,417 – – –Long-term debt 27,805 1,410 17,838 5,609 2,948 Lease liabilities 43,896 14,449 13,363 12,110 3,974 Capital commitments 20,199 20,199 – – –Total contractual obligations 120,317 64,475 31,201 17,719 6,922 Note: Amounts of short-term debt, long-term debt and lease liabilities include recognised and unrecognised interest payable, and are not discounted. China Telecom Corporation Limited Annual Report 2020 045

9 1 0 0 0 1 0 1 10 0 1 80 0 3 0 1 2 1 Data-driven 0
REPORT OF THE DIRECTORS The Board of Directors (the “Board”) of China Telecom DIVIDEND POLICY Corporation Limited (the “Company”) hereby presents its report together with the audited consolidated The Company attaches great importance to the financial statements of the Company and its subsidiaries investment returns of shareholders, strives to maintain the (collectively, the “Group”) prepared in accordance with the continuity and stability of the dividend policy taking into International Financial Reporting Standards for the year the consideration the long-term interest and sustainable ended 31 December 2020. development of the Company. The following factors will be considered by the Company when formulating the PRINCIPAL BUSINESS dividend distribution plan: The principal business of the Company and the Group is the 1. the operating results and cash flow level of the provision of fundamental telecommunications businesses Company; including comprehensive wireline telecommunications services, mobile telecommunications services, value- 2. the Company’s future business development added telecommunications businesses such as Internet position and the capital expenditure requirements; access services, information services and other related services within the service area of the Group. 3. capital needs and gearing ratio; RESULTS 4. the expectation from shareholders and investors; and Results of the Group for the year ended 31 December 2020 and the financial position of the Group as at that 5. other factors that the Board deems appropriate. date are set out in the audited consolidated financial statements on pages 164 to 244 of this annual report. The Board is responsible for formulating the dividend distribution plan and will execute the relevant approval procedures in accordance with relevant laws, rules, regulations and articles of association of the Company (the “Articles of Association”) before proceeding with the distribution. In the future, the Company will strive for improvement on profitability and at the same time continue to deliver favourable dividend return for the shareholders. 048 China Telecom Corporation Limited Annual Report 2020
REPORT OF THE DIRECTORS DIVIDEND According to regulations by the State Taxation Administration (Guo Shui Han [2011] No. 348) and The Board proposes a final dividend in the amount relevant laws and regulations, if the individual H share equivalent to HK$0.125 per share (pre-tax), totalling shareholders who are Hong Kong or Macau residents and approximately RMB8,403 million for the year ended those whose country of domicile is a country which has 31 December 2020. The dividend proposal will be entered into a tax treaty with PRC stipulating a dividend submitted for consideration at the annual general meeting tax rate of 10%, the Company will finally withhold and to be held on Friday, 7 May 2021(the “2020 Annual pay individual income tax at the rate of 10% on behalf General Meeting”). Dividends will be denominated and of the individual H share shareholders. If the individual H declared in Renminbi. share shareholders whose country of domicile is a country which has entered into a tax treaty with PRC stipulating Dividends for holders of domestic shares and the investors a dividend tax rate of less than 10%, the Company will of the Shanghai Stock Exchange and Shenzhen Stock finally withhold and pay individual income tax at the rate Exchange (including enterprises and individuals) investing of 10% on behalf of the individual H share shareholders. in the H shares of the Company listed on the Hong If the individual H share shareholders whose country of Kong Stock Exchange (the “Southbound Trading Link”) domicile is a country which has entered into a tax treaty (the “Southbound Investors”) will be paid in Renminbi, with PRC stipulating a dividend tax rate of more than 10% whereas dividends for H share shareholders other than but less than 20%, the Company will withhold and pay Southbound Investors will be paid in Hong Kong dollars. individual income tax at the actual tax rate stipulated in the The relevant exchange rate will be the average median relevant tax treaty. If the individual H share shareholders rate of Renminbi to Hong Kong dollars as announced by whose country of domicile is a country which has entered the People’s Bank of China for the week prior to the date into a tax treaty with PRC stipulating a dividend tax rate of declaration of dividends at the 2020 Annual General of 20%, or a country which has not entered into any tax Meeting. The proposed final dividends are expected to be treaties with PRC, or under any other circumstances, paid on Tuesday, 1 June 2021 upon approval at the 2020 the Company will withhold and pay individual income Annual General Meeting. tax at the rate of 20% on behalf of the individual H share shareholders. If those shareholders need to request Pursuant to the “Enterprise Income Tax Law of the a refund of tax overpaid from the PRC tax authorities People’s Republic of China”, the “Implementation Rules through the Company in accordance with the relevant of the Enterprise Income Tax Law of the People’s requirements of the Announcement [2019] No. 35 of the Republic of China” in 2008 and Guo Shui Han [2008] State Taxation Administration, they shall submit reports No. 897, the Company shall be obliged to withhold and and information as stipulated in the Announcement [2019] pay 10% enterprise income tax when it distributes the No. 35 of the State Taxation Administration, and provide proposed 2020 final dividends to non-resident enterprise supplemental information on their entitlements under the shareholders of overseas H shares (including HKSCC relevant treaties. Nominees Limited, other corporate nominees or trustees, and other entities or organisations) whose names appear on the Company’s H share register of members on Tuesday, 18 May 2021. China Telecom Corporation Limited Annual Report 2020 049
REPORT OF THE DIRECTORS The Company will determine the country of domicile of the Kong Stock Connect Pilot Programme (Cai Shui [2014] individual H share shareholders based on the registered No. 81)” and “Notice on Taxation Policies for Shenzhen-address as recorded in the H share register of members of Hong Kong Stock Connect Pilot Programme (Cai Shui the Company on Tuesday, 18 May 2021 (the “Registered [2016] No. 127)”, the Company shall withhold and pay Address”). If the country of domicile of an individual H individual income tax at the rate of 20% with respect to share shareholder is not the same as the Registered dividends received by the Mainland individual investors Address or if the individual H share shareholder would like for investing in the H shares of the Company listed on the to apply for a refund of the additional amount of tax finally Hong Kong Stock Exchange through the Southbound withheld and paid, the individual H share shareholder shall Trading Link. In respect of the dividends received by notify and provide relevant supporting documents to the Mainland securities investment funds investing in the Company on or before Wednesday, 12 May 2021. Upon H shares of the Company listed on Hong Kong Stock examination of the supporting documents by the relevant Exchange through the Southbound Trading Link, the tax authorities, the Company will follow the guidance given tax levied shall be ascertained by reference to the rules by the tax authorities to implement relevant tax withholding applicable to individual investors. The Company is not and payment provisions and arrangements. Individual required to withhold and pay income tax on dividends H share shareholders may either personally attend or derived by the Mainland enterprise investors under the appoint a representative to attend to the procedures in Southbound Trading Link, and such enterprises shall accordance with the requirements under the tax treaties report the income and make tax payment by themselves. notice if they do not provide the relevant supporting The record date for entitlement to the shareholders’ rights documents to the Company within the time period stated and the relevant arrangements of dividend distribution for above. the Southbound Investors are the same as those for the Company’s H share shareholders. For Southbound Investors (including enterprises and individuals), the Shanghai branch of China Securities The Company assumes no responsibility and disclaims Depository and Clearing Corporation Limited and the all liabilities whatsoever in relation to the tax status or Shenzhen branch of China Securities Depository and tax treatment of the individual H share shareholders and Clearing Corporation Limited, as the nominees of the for any claims arising from any delay in or inaccurate investors of the Southbound Trading Link, will receive determination of the tax status or tax treatment of the all dividends distributed by the Company and will individual H share shareholders or any disputes relating distribute the dividends to the relevant investors under to the tax withholding and payment mechanism or the Southbound Trading Link through its depositary and arrangements. clearing system. According to the relevant provisions under the “Notice on Taxation Policies for Shanghai-Hong 050 China Telecom Corporation Limited Annual Report 2020
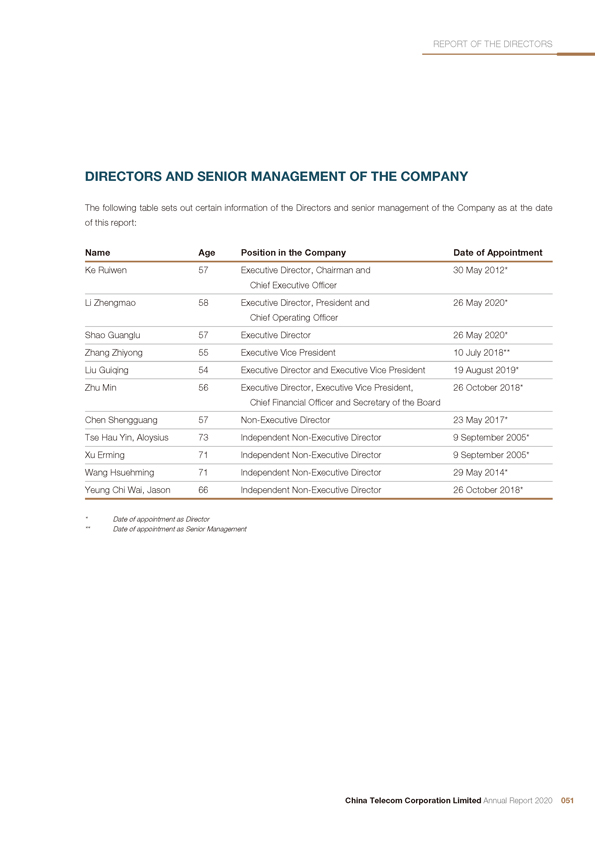
REPORT OF THE DIRECTORS DIRECTORS AND SENIOR MANAGEMENT OF THE COMPANY The following table sets out certain information of the Directors and senior management of the Company as at the date of this report: Name Age Position in the Company Date of Appointment Ke Ruiwen 57 Executive Director, Chairman and 30 May 2012* Chief Executive Officer Li Zhengmao 58 Executive Director, President and 26 May 2020* Chief Operating Officer Shao Guanglu 57 Executive Director 26 May 2020* Zhang Zhiyong 55 Executive Vice President 10 July 2018** Liu Guiqing 54 Executive Director and Executive Vice President 19 August 2019* Zhu Min 56 Executive Director, Executive Vice President, 26 October 2018* Chief Financial Officer and Secretary of the Board Chen Shengguang 57 Non-Executive Director 23 May 2017* Tse Hau Yin, Aloysius 73 Independent Non-Executive Director 9 September 2005* Xu Erming 71 Independent Non-Executive Director 9 September 2005* Wang Hsuehming 71 Independent Non-Executive Director 29 May 2014* Yeung Chi Wai, Jason 66 Independent Non-Executive Director 26 October 2018* * Date of appointment as Director ** Date of appointment as Senior Management China Telecom Corporation Limited Annual Report 2020 051
REPORT OF THE DIRECTORS References are made to the announcements in relation were re-elected as Directors of the seventh session of the to the changes of Directors and senior management Board at the 2019 Annual General Meeting; Mr. Tse Hau published by the Company on the following dates: On Yin, Aloysius, Mr. Xu Erming, Madam Wang Hsuehming 17 January 2020, Mr. Gao Tongqing resigned from and Mr. Yeung Chi Wai, Jason (all as Independent Non-his positions as an Executive Director and Executive Executive Directors) were re-elected as Independent Vice President of the Company due to change in work Directors of the seventh session of the Board at the 2019 arrangement. On 23 March 2020, Mr. Li Zhengmao was Annual General Meeting. Meanwhile, Mr. Li Zhengmao appointed as the President and Chief Operating Officer of and Mr. Shao Guanglu were elected as Directors of the the Company and on the same date, Mr. Ke Ruiwen, an seventh session of the Board at the 2019 Annual General Executive Director, Chairman and Chief Executive Officer Meeting. The appointment of the seventh session of the of the Company ceased to act as the President and Chief members of the Board lasts for a term of three years Operating Officer of the Company. On 26 May 2020, the from 26 May 2020 until the annual general meeting of term of office of the sixth session of the members of the the Company for the year 2022 to be held in year 2023. Board of the Company expired on the date of the 2019 On 4 December 2020, Mr. Wang Guoquan resigned Annual General Meeting of the Company (the “2019 from his positions as an Executive Director and Executive Annual General Meeting”). The members of the sixth Vice President of the Company due to change in work session of the Board of the Company, namely, Mr. Ke arrangement. On 19 January 2021, Mr. Chen Zhongyue Ruiwen, Mr. Chen Zhongyue, Mr. Liu Guiqing, Madam Zhu resigned from his positions as an Executive Director and Min, Mr. Wang Guoquan (all as Executive Directors) and Executive Vice President of the Company due to change Mr. Chen Shengguang (as the Non-Executive Director) in work arrangement. 052 China Telecom Corporation Limited Annual Report 2020
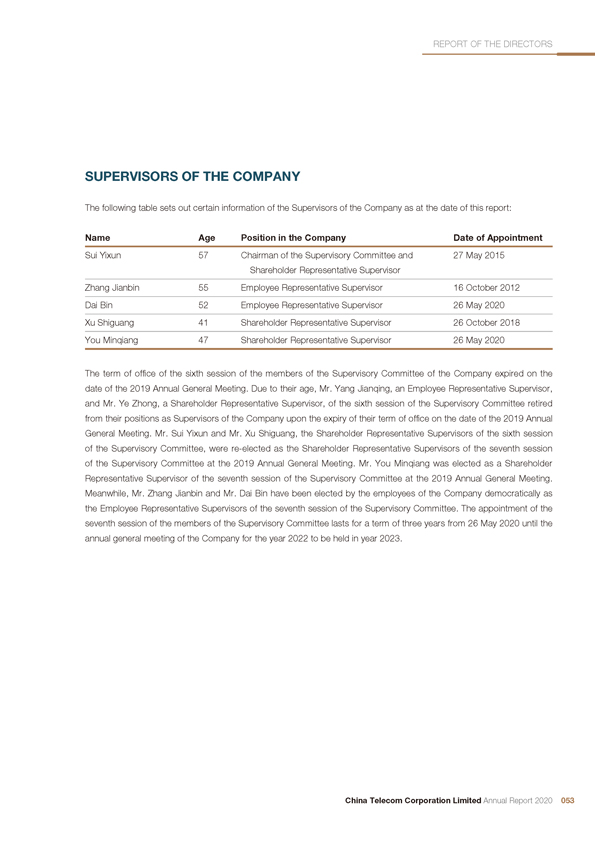
REPORT OF THE DIRECTORS SUPERVISORS OF THE COMPANY The following table sets out certain information of the Supervisors of the Company as at the date of this report: Name Age Position in the Company Date of Appointment Sui Yixun 57 Chairman of the Supervisory Committee and 27 May 2015 Shareholder Representative Supervisor Zhang Jianbin 55 Employee Representative Supervisor 16 October 2012 Dai Bin 52 Employee Representative Supervisor 26 May 2020 Xu Shiguang 41 Shareholder Representative Supervisor 26 October 2018 You Minqiang 47 Shareholder Representative Supervisor 26 May 2020 The term of office of the sixth session of the members of the Supervisory Committee of the Company expired on the date of the 2019 Annual General Meeting. Due to their age, Mr. Yang Jianqing, an Employee Representative Supervisor, and Mr. Ye Zhong, a Shareholder Representative Supervisor, of the sixth session of the Supervisory Committee retired from their positions as Supervisors of the Company upon the expiry of their term of office on the date of the 2019 Annual General Meeting. Mr. Sui Yixun and Mr. Xu Shiguang, the Shareholder Representative Supervisors of the sixth session of the Supervisory Committee, were re-elected as the Shareholder Representative Supervisors of the seventh session of the Supervisory Committee at the 2019 Annual General Meeting. Mr. You Minqiang was elected as a Shareholder Representative Supervisor of the seventh session of the Supervisory Committee at the 2019 Annual General Meeting. Meanwhile, Mr. Zhang Jianbin and Mr. Dai Bin have been elected by the employees of the Company democratically as the Employee Representative Supervisors of the seventh session of the Supervisory Committee. The appointment of the seventh session of the members of the Supervisory Committee lasts for a term of three years from 26 May 2020 until the annual general meeting of the Company for the year 2022 to be held in year 2023. China Telecom Corporation Limited Annual Report 2020 053
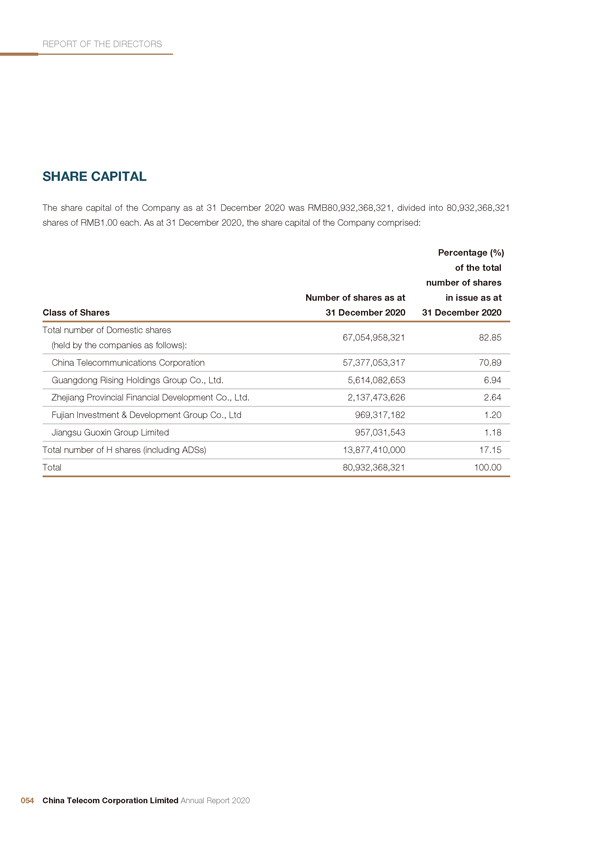
REPORT OF THE DIRECTORS SHARE CAPITAL The share capital of the Company as at 31 December 2020 was RMB80,932,368,321, divided into 80,932,368,321 shares of RMB1.00 each. As at 31 December 2020, the share capital of the Company comprised: Percentage (%) of the total number of shares Number of shares as at in issue as at Class of Shares 31 December 2020 31 December 2020 Total number of Domestic shares 67,054,958,321 82.85 (held by the companies as follows): China Telecommunications Corporation 57,377,053,317 70.89 Guangdong Rising Holdings Group Co., Ltd. 5,614,082,653 6.94 Zhejiang Provincial Financial Development Co., Ltd. 2,137,473,626 2.64 Fujian Investment & Development Group Co., Ltd 969,317,182 1.20 Jiangsu Guoxin Group Limited 957,031,543 1.18 Total number of H shares (including ADSs) 13,877,410,000 17.15 Total 80,932,368,321 100.00 054 China Telecom Corporation Limited Annual Report 2020
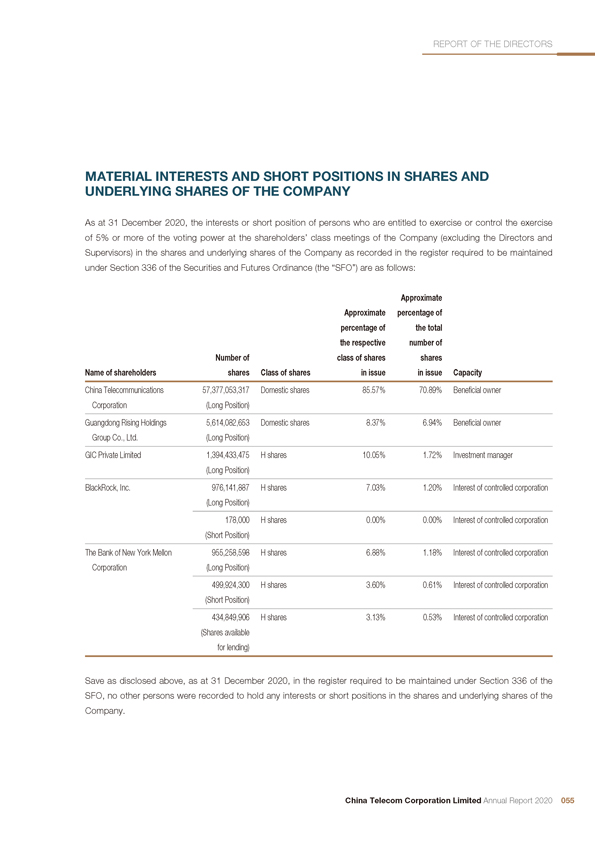
REPORT OF THE DIRECTORS MATERIAL INTERESTS AND SHORT POSITIONS IN SHARES AND UNDERLYING SHARES OF THE COMPANY As at 31 December 2020, the interests or short position of persons who are entitled to exercise or control the exercise of 5% or more of the voting power at the shareholders’ class meetings of the Company (excluding the Directors and Supervisors) in the shares and underlying shares of the Company as recorded in the register required to be maintained under Section 336 of the Securities and Futures Ordinance (the “SFO”) are as follows: Approximate Approximate percentage of percentage of the total the respective number of Number of class of shares shares Name of shareholders shares Class of shares in issue in issue Capacity China Telecommunications 57,377,053,317 Domestic shares 85.57% 70.89% Beneficial owner Corporation (Long Position) Guangdong Rising Holdings 5,614,082,653 Domestic shares 8.37% 6.94% Beneficial owner Group Co., Ltd. (Long Position) GIC Private Limited 1,394,433,475 H shares 10.05% 1.72% Investment manager (Long Position) BlackRock, Inc. 976,141,887 H shares 7.03% 1.20% Interest of controlled corporation (Long Position) 178,000 H shares 0.00% 0.00% Interest of controlled corporation (Short Position) The Bank of New York Mellon 955,258,598 H shares 6.88% 1.18% Interest of controlled corporation Corporation (Long Position) 499,924,300 H shares 3.60% 0.61% Interest of controlled corporation (Short Position) 434,849,906 H shares 3.13% 0.53% Interest of controlled corporation (Shares available for lending) Save as disclosed above, as at 31 December 2020, in the register required to be maintained under Section 336 of the SFO, no other persons were recorded to hold any interests or short positions in the shares and underlying shares of the Company. China Telecom Corporation Limited Annual Report 2020 055
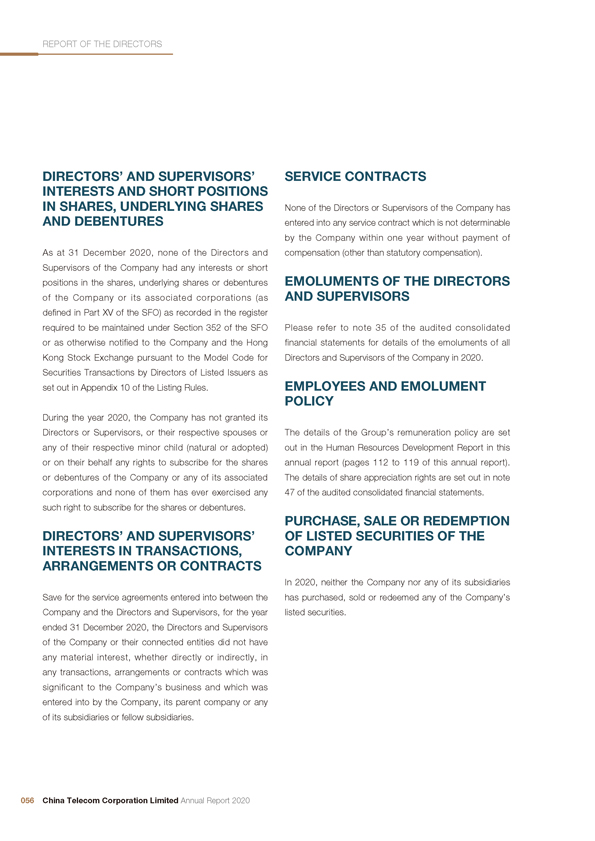
REPORT OF THE DIRECTORS DIRECTORS’ AND SUPERVISORS’ SERVICE CONTRACTS INTERESTS AND SHORT POSITIONS IN SHARES, UNDERLYING SHARES None of the Directors or Supervisors of the Company has AND DEBENTURES entered into any service contract which is not determinable by the Company within one year without payment of As at 31 December 2020, none of the Directors and compensation (other than statutory compensation). Supervisors of the Company had any interests or short positions in the shares, underlying shares or debentures EMOLUMENTS OF THE DIRECTORS of the Company or its associated corporations (as AND SUPERVISORS defined in Part XV of the SFO) as recorded in the register required to be maintained under Section 352 of the SFO Please refer to note 35 of the audited consolidated or as otherwise notified to the Company and the Hong financial statements for details of the emoluments of all Kong Stock Exchange pursuant to the Model Code for Directors and Supervisors of the Company in 2020. Securities Transactions by Directors of Listed Issuers as set out in Appendix 10 of the Listing Rules. EMPLOYEES AND EMOLUMENT POLICY During the year 2020, the Company has not granted its Directors or Supervisors, or their respective spouses or The details of the Group’s remuneration policy are set any of their respective minor child (natural or adopted) out in the Human Resources Development Report in this or on their behalf any rights to subscribe for the shares annual report (pages 112 to 119 of this annual report). or debentures of the Company or any of its associated The details of share appreciation rights are set out in note corporations and none of them has ever exercised any 47 of the audited consolidated financial statements. such right to subscribe for the shares or debentures. PURCHASE, SALE OR REDEMPTION DIRECTORS’ AND SUPERVISORS’ OF LISTED SECURITIES OF THE INTERESTS IN TRANSACTIONS, COMPANY ARRANGEMENTS OR CONTRACTS In 2020, neither the Company nor any of its subsidiaries Save for the service agreements entered into between the has purchased, sold or redeemed any of the Company’s Company and the Directors and Supervisors, for the year listed securities. ended 31 December 2020, the Directors and Supervisors of the Company or their connected entities did not have any material interest, whether directly or indirectly, in any transactions, arrangements or contracts which was significant to the Company’s business and which was entered into by the Company, its parent company or any of its subsidiaries or fellow subsidiaries. 056 China Telecom Corporation Limited Annual Report 2020
REPORT OF THE DIRECTORS ISSUE OF DEBENTURES SUMMARY OF FINANCIAL INFORMATION In 2020, the Company successfully issued (i) one tranche of company bonds to qualified investors with an aggregate Please refer to pages 245 to 246 of this annual report for principal amount of RMB2,000 million with a term of three a summary of the operating results, assets and liabilities years at an annual interest rate of 2.9% on the Shanghai of the Group for each of the years in the five-year period Stock Exchange on 10 March 2020; and (ii) 19 tranches ended 31 December 2020. of super short-term commercial papers with an aggregate principal amount of RMB60.5 billion. The proceeds BANK LOANS AND OTHER were used to repay debt financing instruments due and BORROWINGS replenish the Company’s working capital in the course of business operations. Please refer to note 20 of the audited Please refer to note 20 of the audited consolidated consolidated financial statements for details. financial statements for details of bank loans and other borrowings of the Group. MATERIAL ACQUISITIONS AND DISPOSALS CHARGE ON ASSETS For the year ended 31 December 2020, the Company had As at 31 December 2020, no fixed assets was pledged to no material acquisitions and disposals. banks as loan security (31 December 2019: Nil). PUBLIC FLOAT CAPITALISED INTEREST As at the date of this report, based on the information Please refer to note 33 of the audited consolidated that is publicly available to the Company and within the financial statements for details of the Group’s capitalised knowledge of the Directors, the Company has maintained interest for the year ended 31 December 2020. the prescribed public float under the Listing Rules and as agreed with the Hong Kong Stock Exchange. FIXED ASSETS Please refer to note 4 of the audited consolidated financial statements for movements in the fixed assets of the Group for the year ended 31 December 2020. China Telecom Corporation Limited Annual Report 2020 057
REPORT OF THE DIRECTORS RESERVES SUBSIDIARIES AND ASSOCIATED COMPANIES Pursuant to Article 149 of the Articles of Association, where the financial statements prepared in accordance Please refer to note 9 and note 10 of the audited with the China Accounting Standards for Business consolidated financial statements for details of the Enterprises and regulations materially differ from those Company’s subsidiaries and the Group’s interests in prepared in accordance with either the International associated companies as at 31 December 2020. Financial Reporting Standards or accounting standards at a place outside the PRC where the Company’s shares PERMITTED INDEMNITY are listed, the distributable profit for the relevant fiscal year shall be deemed to be the lesser of the amounts shown For the year ended 31 December 2020 and as at the date in those respective financial statements. Distributable of approval of this report, the Company has arranged reserves of the Company as at 31 December 2020, appropriate insurance cover in respect of legal actions calculated on the above basis and before deducting against the directors of the Group. the proposed final dividends for 2020, amounted to RMB145,351 million. CHANGES IN EQUITY Please refer to note 27 of the audited consolidated Please refer to the consolidated statement of changes in financial statements for details of the movements in the equity as contained in the audited consolidated financial reserves of the Company and the Group for the year statements of the year (page 168 of this annual report). ended 31 December 2020. RETIREMENT BENEFITS EQUITY-LINKED AGREEMENTS Please refer to note 46 of the audited consolidated The Company did not enter into any equity-linked financial statements for details of the retirement benefits agreement, nor did any equity-linked agreement exist provided by the Group. during the year ended 31 December 2020. PRE-EMPTIVE RIGHTS DONATIONS There are no provisions for pre-emptive rights in the For the year ended 31 December 2020, the Group made Articles of Association requiring the Company to offer new charitable and other donations with a total amount of shares to the existing shareholders in proportion to their RMB13 million. shareholdings. 058 China Telecom Corporation Limited Annual Report 2020
REPORT OF THE DIRECTORS MAJOR CUSTOMERS AND instructed by the State-owned Assets Supervision SUPPLIERS and Administration Commission of the State Council of China (“SASAC”)) (the “Proposal”). According to the For the year ended 31 December 2020, revenue Proposal, the Company proposed to grant a maximum generated from the five largest customers of the Group of approximately 2,412 million share appreciation rights accounted for an amount of less than 30% of the total to a maximum of approximately 8,300 Key Personnel operating revenues of the Group. (excluding the Executive Directors, Non-Executive Director, Independent Directors, Supervisors and senior For the year ended 31 December 2020, purchases from management of the Company). The Proposal has been the five largest suppliers of the Group accounted for an submitted to SASAC for approval and was amended as amount of less than 30% of the total annual purchases of requested by SASAC. SASAC has approved the Proposal the Group. on 3 March 2021. SHARE APPRECIATION RIGHTS Please refer to the circular published by the Company on 4 October 2018 and the announcements published by the At the extraordinary general meeting held by the Company on 26 October 2018 and 9 February 2021 and Company on 26 October 2018, the adoption of the share subsequently in this regard for further details. appreciation rights scheme (the “Scheme”) was approved by the shareholders of the Company who also authorised Please refer to note 47 of the audited consolidated the Board to grant share appreciation rights to certain financial statements for details of the share appreciation key personnel of the Company (the “Key Personnel”) and rights scheme of the Company. to formulate implementation rules for each grant of share appreciation rights in accordance with the Scheme and COMPETING BUSINESS relevant legal requirements. None of the Directors of the Company had any interest The Scheme does not involve the grant of options over in any business which competes or may compete, either new shares or other new securities that may be issued by directly or indirectly, with the business of the Group. the Company (or any of its subsidiaries) and therefore, it does not fall within the ambit of, and is not subject to, the MANAGEMENT CONTRACTS requirements under Chapter 17 of the Listing Rules. During the reporting period, the Company had not entered On 9 February 2021, the Board has considered and into any management contracts with respect to the entire approved the resolution in relation to “2021 Share or principal business of the Company. Appreciation Rights Grant Proposal for Key Personnel of China Telecom Corporation Limited” (now renamed as “The Phase II Incentive Scheme for Share Appreciation Rights of China Telecom Corporation Limited” as China Telecom Corporation Limited Annual Report 2020 059
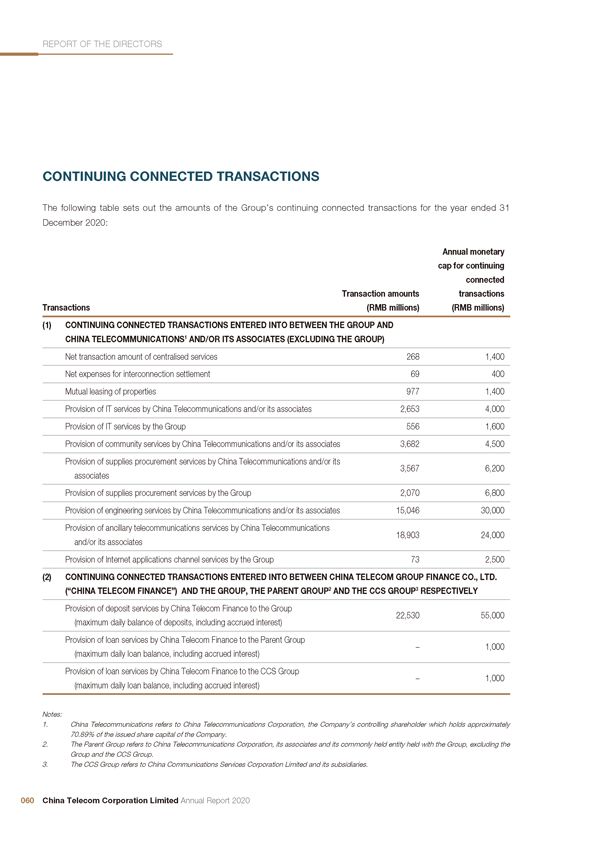
REPORT OF THE DIRECTORS CONTINUING CONNECTED TRANSACTIONS The following table sets out the amounts of the Group’s continuing connected transactions for the year ended 31 December 2020: Annual monetary cap for continuing connected Transaction amounts transactions Transactions (RMB millions) (RMB millions) (1) CONTINUING CONNECTED TRANSACTIONS ENTERED INTO BETWEEN THE GROUP AND CHINA TELECOMMUNICATIONS1 AND/OR ITS ASSOCIATES (EXCLUDING THE GROUP) Net transaction amount of centralised services 268 1,400 Net expenses for interconnection settlement 69 400 Mutual leasing of properties 977 1,400 Provision of IT services by China Telecommunications and/or its associates 2,653 4,000 Provision of IT services by the Group 556 1,600 Provision of community services by China Telecommunications and/or its associates 3,682 4,500 Provision of supplies procurement services by China Telecommunications and/or its 3,567 6,200 associates Provision of supplies procurement services by the Group 2,070 6,800 Provision of engineering services by China Telecommunications and/or its associates 15,046 30,000 Provision of ancillary telecommunications services by China Telecommunications 18,903 24,000 and/or its associates Provision of Internet applications channel services by the Group 73 2,500 (2) CONTINUING CONNECTED TRANSACTIONS ENTERED INTO BETWEEN CHINA TELECOM GROUP FINANCE CO., LTD. (“CHINA TELECOM FINANCE”) AND THE GROUP, THE PARENT GROUP2 AND THE CCS GROUP3 RESPECTIVELY Provision of deposit services by China Telecom Finance to the Group 22,530 55,000 (maximum daily balance of deposits, including accrued interest) Provision of loan services by China Telecom Finance to the Parent Group – 1,000 (maximum daily loan balance, including accrued interest) Provision of loan services by China Telecom Finance to the CCS Group – 1,000 (maximum daily loan balance, including accrued interest) Notes: 1. China Telecommunications refers to China Telecommunications Corporation, the Company’s controlling shareholder which holds approximately 70.89% of the issued share capital of the Company. 2. The Parent Group refers to China Telecommunications Corporation, its associates and its commonly held entity held with the Group, excluding the Group and the CCS Group. 3. The CCS Group refers to China Communications Services Corporation Limited and its subsidiaries. 060 China Telecom Corporation Limited Annual Report 2020

REPORT OF THE DIRECTORS (1) CONTINUING CONNECTED TRANSACTIONS As certain applicable percentage ratios (excluding the ENTERED INTO AMONG THE GROUP AND profits ratio) of the renewed annual caps for the transactions CHINA TELECOMMUNICATIONS AND/OR ITS contemplated under the Engineering Framework Agreement ASSOCIATES (EXCLUDING THE GROUP) and the Ancillary Telecommunications Services Framework On 20 August 2018, the Company and China Tele- Agreement for each of the years ending 31 December 2019, communications Corporation (“China Telecommunications”) 2020 and 2021 exceeds 5%, such continuing connected entered into supplemental agreements and renewed transactions are subject to the reporting, announcement, the Engineering Framework Agreement, the Ancillary annual review and independent shareholders’ approval Telecommunications Services Framework Agreement, the requirements under Chapter 14A of the Listing Rules. The Interconnection Settlement Agreement, the Community independent shareholders of the Company considered Services Framework Agreement, the Centralised Services and approved the renewal of the Engineering Framework Agreement, the Property Leasing Framework Agreement, Agreement and the Ancillary Telecommunications Services the IT Services Framework Agreement, the Supplies Framework Agreement and the renewed annual caps Procurement Services Framework Agreement and the applicable thereto at the extraordinary general meeting Internet Applications Channel Services Framework of the Company held on 26 October 2018. As each of Agreement for a further term of 3 years expiring on 31 the applicable percentage ratios (excluding the profits December 2021. China Telecommunications is the ratio) of the renewed annual caps for the transactions controlling shareholder of the Company. Accordingly, contemplated under other continuing connected pursuant to Chapter 14A of the Listing Rules, China transactions agreements for each of the years ending Telecommunications is a connected person of the 31 December 2019, 2020 and 2021 exceeds 0.1% but is Company and the transactions contemplated under less than 5%, such continuing connected transactions are each of the agreements constitute continuing connected only subject to the reporting, announcement and annual transactions of the Company. review requirements and are exempt from the independent shareholders’ approval requirement under Chapter 14A of the Listing Rules. Details of the respective agreements are shown below: China Telecom Corporation Limited Annual Report 2020 061
REPORT OF THE DIRECTORS Centralised Services Agreement regions, Hong Kong, Macau and Taiwan originating from Pursuant to the centralised services agreement signed each party divided by the proportion of the aggregate between the Company and China Telecommunications volume of the inbound and outbound voice calls to and on 10 September 2002 and the related supplemental from international regions, Hong Kong, Macau and Taiwan agreements subsequently entered into between the originating from both parties. When the two parties use two parties (collectively, the “Centralised Services international telecommunications facilities provided by Agreement”), centralised services include centralised a third party and accept restoration maintenance costs, business management and operational services provided such fees shall be determined according to the actual by the Group to China Telecommunications in relation utilisation fee each year. The utilisation fee associated with to key corporate customers, its network management the shared use of the international telecommunications centre and business support centre. Centralised services facilities provided by China Telecommunications shall be also include the provision of certain premises by China determined through negotiation between the two parties Telecommunications to the Group and the common use based on market rates. Market rates shall mean the rates of international telecommunications facilities by both at which the same or similar type of products or services parties. The aggregate costs incurred by the Group are provided by independent third parties in the ordinary and China Telecommunications for the provision of course of business and under normal commercial terms. management and operation services will be apportioned When determining whether the transaction price for any between the Group and China Telecommunications on transaction under the agreement represents market rates, a pro rata basis according to the revenues generated by to the extent practicable, management of the Company each party. Where the Group uses the premises provided shall take into account the rates of at least two similar by China Telecommunications, the Group will pay and comparable transactions entered into with or carried premises usage fees to China Telecommunications on a out by independent third parties in the ordinary course of pro rata basis according to the apportioned actual area business in the corresponding period for reference. allocated to the Group. The premises usage fees shall be determined through negotiation between the two parties The Company and China Telecommunications have based on comparable market rates. When both parties entered into a supplemental agreement on 20 August use international telecommunications facilities provided 2018 and renewed the Centralised Services Agreement in by third parties and accept services by such third parties accordance with its provisions for a further term of 3 years (for example, restoration maintenance costs, the annual expiring on 31 December 2021. No later than 30 days utilisation fee and related service costs) and when both prior to the expiry of the Centralised Services Agreement, parties use the international telecommunications facilities the Company is entitled to serve a written notice to China of China Telecommunications, the associated costs shall Telecommunications to renew the Centralised Services be shared on a pro rata basis according to volume of the Agreement, and the parties shall consult and decide on inbound and outbound voice calls to and from international matters relating to such renewal. 062 China Telecom Corporation Limited Annual Report 2020
REPORT OF THE DIRECTORS Interconnection Settlement Agreement The Company and China Telecommunications have Pursuant to the interconnection settlement entered into a supplemental agreement on 20 August agreement signed between the Company and China 2018 and renewed the Interconnection Settlement Telecommunications on 10 September 2002 and Agreement in accordance with its provisions for a further the related supplemental agreements subsequently term of 3 years expiring on 31 December 2021. No later entered into between the two parties (collectively, the than 30 days prior to the expiry of the Interconnection “Interconnection Settlement Agreement”), the telephone Settlement Agreement, the Company is entitled to serve a operator connecting a telephone call made to its local written notice to China Telecommunications to renew the access network shall be entitled to receive from the Interconnection Settlement Agreement, and the parties operator from which the telephone call originated a fee shall consult and decide on matters relating to such prescribed by the Ministry of Industry and Information renewal. Technology of the PRC (the “Ministry of Industry and Information Technology”) from time to time. Property Leasing Framework Agreement Interconnection charges are currently RMB0.06 per Pursuant to the property leasing framework minute for local calls originated from the Group to China agreement signed between the Company and China Telecommunications. The interconnection settlement Telecommunications on 30 August 2006 and the related charges will be calculated according to the “Notice supplemental agreement subsequently entered into Concerning the Issue of the Measures on Interconnection between the two parties (collectively, the “Property Settlement between Public Telecommunications Networks Leasing Framework Agreement”), the Group and China and Sharing of Relaying Fees (Xin Bu Dian [2003] Telecommunications and/or its associates can lease No. 454)” promulgated by the Ministry of Information properties from the other party for use as business Industry. The Ministry of Industry and Information premises, offices, equipment storage facilities and sites Technology may, from time to time, take into account for network equipment installation. The rental charges the relevant regulatory rules and market conditions, under the Property Leasing Framework Agreement shall amend or promulgate new rules or regulations in respect be determined according to comparable market rates. of interconnection settlement which will be announced Market rates shall mean the rental charges at which the on its official website at www.miit.gov.cn. If the Ministry same or similar type of properties or adjacent properties of Industry and Information Technology amends the are leased by independent third parties in the ordinary existing, or promulgates new rules or regulations in course of business and on normal commercial terms. respect of interconnection settlement, the parties shall When determining the rental charges for any property apply such amended or new rules and regulations as under the agreement represents market rates, to the acknowledged by both parties. The settlement regions extent practicable, management of the Company shall include Beijing Municipality, Tianjin Municipality, Hebei take into account the rental charges of at least two similar Province, Heilongjiang Province, Jilin Province, Liaoning and comparable transactions entered into with or carried Province, Shanxi Province, Henan Province, Shandong out by independent third parties in the ordinary course of Province, Inner Mongolia Autonomous Region and Xizang business in the corresponding period for reference. The Autonomous Region. rental charges are subject to review every 3 years. China Telecom Corporation Limited Annual Report 2020 063
REPORT OF THE DIRECTORS The Company and China Telecommunications have transaction under the agreement represents market rates, entered into a supplemental agreement on 20 August to the extent practicable, management of the Company 2018 and renewed the Property Leasing Framework shall take into account the rates of at least two similar Agreement in accordance with its provisions for a further and comparable transactions entered into with or carried term of 3 years expiring on 31 December 2021. No later out by independent third parties in the ordinary course of than 30 days prior to the expiry of the Property Leasing business in the corresponding period for reference. Framework Agreement, the Company is entitled to serve a written notice to China Telecommunications to renew the In the circumstances where the relevant laws or Property Leasing Framework Agreement, and the parties regulations in the PRC specify that the prices and/or shall consult and decide on matters relating to such the fee standards for particular services to be provided renewal. pursuant to such agreement are to be determined by a tender process, the charges payable for such services IT Services Framework Agreement shall be finally determined in accordance with the Pursuant to the IT services framework agreement signed “Bidding Law of the PRC” and the “Regulations on the between the Company and China Telecommunications on Implementation of the Bidding Law of the PRC” or the 30 August 2006 and the related supplemental agreements relevant tender procedures. The Group shall solicit at least subsequently entered into between the two parties three tenderers for the tender process. If the terms offered (collectively, the “IT Services Framework Agreement”), by the Group or China Telecommunications and/or its the Group and China Telecommunications and/or its associates are no less favourable than those offered by associates can provide the other party with information an independent third party provider, the Group or China technology services, including office automation Telecommunications and/or its associates may award the and software testing. Each of the Group and China tender to the other party. Telecommunications and/or its associates is entitled to participate in bidding for the right to provide information The Company and China Telecommunications have technology services to the other party in accordance entered into a supplemental agreement on 20 August with the IT Services Framework Agreement. The charges 2018 and renewed the IT Services Framework Agreement payable for such services shall be determined by reference in accordance with its provisions for a further term of 3 to the market rates. Market rates shall mean the rates at years expiring on 31 December 2021. No later than 30 which the same or similar type of products or services days prior to the expiry of the IT Services Framework are provided by independent third parties in the ordinary Agreement, the Company is entitled to serve a written course of business and on normal commercial terms. notice to China Telecommunications to renew the IT When determining whether the transaction price for any Services Framework Agreement, and the parties shall consult and decide on matters relating to such renewal. 064 China Telecom Corporation Limited Annual Report 2020
REPORT OF THE DIRECTORS Community Services Framework Agreement (2) where there is no or it is not possible to determine Pursuant to the community services framework the market prices, the prices are to be agreed agreement signed between the Company and China between the parties based on the reasonable costs Telecommunications on 30 August 2006 and the incurred in providing the services plus the amount related supplemental agreements subsequently of the relevant taxes and reasonable profit margin. entered into between the two parties (collectively, the For this purpose, “reasonable profit margin” is to “Community Services Framework Agreement”), China be fairly determined by negotiations between the Telecommunications and/or its associates provide parties in accordance with the internal policies the Group with community services such as culture, of the Group. When determining the “reasonable education, property management, vehicle service, profit margin” for any transaction under the health and medical care, hotel and conference service, agreement, to the extent practicable, management community and sanitary service. The community services of the Company shall take into account the profit under the Community Services Framework Agreement are margin of at least two similar and comparable provided in accordance with the following pricing terms: transactions entered into with independent third parties in the corresponding period or the relevant (1) market prices, which shall mean the prices at industry profit margin for reference. which the same or similar type of products or services are provided by independent third parties The Company and China Telecommunications have in the ordinary course of business and on normal entered into a supplemental agreement on 20 August commercial terms. When determining whether 2018 and renewed the Community Services Framework the transaction price for any transaction under the Agreement in accordance with its provisions for a further agreement represents market prices, to the extent term of 3 years expiring on 31 December 2021. No practicable, management of the Company shall later than 30 days prior to the expiry of the Community take into account the prices of at least two similar Services Framework Agreement, the Company is entitled and comparable transactions entered into with to serve a written notice to China Telecommunications to or carried out by independent third parties in the renew the Community Services Framework Agreement, ordinary course of business over the corresponding and the parties shall consult and decide on matters period for reference; relating to such renewal. China Telecom Corporation Limited Annual Report 2020 065
REPORT OF THE DIRECTORS Supplies Procurement Services Framework The Company and China Telecommunications have Agreement entered into a supplemental agreement on 20 August Pursuant to the supplies procurement services framework 2018 and renewed the Supplies Procurement Services agreement signed between the Company and China Framework Agreement on the same terms in accordance Telecommunications on 30 August 2006 and the related with its provisions for a further term of 3 years expiring supplemental agreements subsequently entered into on 31 December 2021. No later than 30 days prior to the between the two parties (collectively, the “Supplies expiry of the Supplies Procurement Services Framework Procurement Services Framework Agreement”), China Agreement, the Company is entitled to serve a written Telecommunications and/or its associates and the Group notice to China Telecommunications to renew the provide each other with supplies procurement services, Supplies Procurement Services Framework Agreement, including comprehensive procurement services, the sale of and the parties shall consult and decide on matters proprietary telecommunications equipment, resale of third- relating to such renewal. party equipment, management of tenders, verification of technical specifications, storage, transportation and Engineering Framework Agreement installation services. Pursuant to the engineering framework agreement signed between the Company and China Telecommunications on Where the procurement services are provided on an 30 August 2006 and the related supplemental agreements agency basis, the maximum commission for such subsequently entered into between the two parties procurement services shall be calculated at: (collectively, the “Engineering Framework Agreement”), China Telecommunications and/or its associates through (1) not more than 1% of the contract value for bids provides to the Group services such as construction, procurement of imported telecommunications design, equipment installation and testing and/or supplies; or engineering project supervision services. The charges payable for such engineering services shall be determined (2) not more than 3% of the contract value for the by reference to market rates. Market rates shall mean procurement of domestic telecommunications the rates at which the same or similar type of products or supplies and domestic non-telecommunications services are provided by independent third parties in the supplies. ordinary course of business and on normal commercial terms. When determining whether the transaction price The pricing basis of the services for the provision of for any transaction under the agreement represents supplies procurement other than on an agency basis market rates, to the extent practicable, management of under the Supplies Procurement Services Framework the Company shall take into account the rates of at least Agreement is the same as those set out in the Community two similar and comparable transactions entered into Services Framework Agreement. with or carried out by independent third parties in the ordinary course of business in the corresponding period 066 China Telecom Corporation Limited Annual Report 2020

REPORT OF THE DIRECTORS for reference. The charges payable for the design or Ancillary Telecommunications Services Framework supervision of engineering projects with a value of over Agreement RMB1 million or engineering construction projects with Pursuant to the ancillary telecommunications services a value of over RMB4 million shall be determined by the framework agreement signed between the Company and tender award price, which is determined in accordance China Telecommunications on 30 August 2006 and the with the “Bidding Law of the PRC” and the “Regulations related supplemental agreements subsequently entered on the Implementation of the Bidding Law of the PRC” or into between the two parties (collectively, the “Ancillary the final confirmed price in the relevant tender process. Telecommunications Services Framework Agreement”), The Group shall solicit at least three tenderers for the China Telecommunications and/or its associates provide tender process. In the circumstances there are amended the Group with certain repair and maintenance services, rules or regulations in respect of tender scope and scale including repair of telecommunications equipment, of the engineering construction projects promulgated maintenance of fire equipment and telephone booths, by PRC laws and regulations during the term of the as well as other customer services. The pricing terms agreement, both parties agreed to apply such amended for such services are the same as those set out in the rules and regulations and no amendment to the Community Services Framework Agreement. supplemental agreement is required. The Company and China Telecommunications have The Group does not accord any priority to China entered into a supplemental agreement on 20 August Telecommunications and/or its associates to provide 2018 and renewed the Ancillary Telecommunications such services, and the tender may be awarded to an Services Framework Agreement in accordance with independent third party. However, if the terms of an offer its provisions for a further term of 3 years expiring on from China Telecommunications and/or its associates 31 December 2021. No later than 30 days prior to the are at least as favourable as those offered by other expiry of the Ancillary Telecommunications Services tenderers, the Group may award the tender to China Framework Agreement, the Company is entitled to serve Telecommunications and/or its associates. a written notice to China Telecommunications to renew the Ancillary Telecommunications Services Framework The Company and China Telecommunications have Agreement, and the parties shall consult and decide on entered into a supplemental agreement on 20 August matters relating to such renewal. 2018 and renewed the Engineering Framework Agreement on the same terms (except the pricing terms) for a further term of 3 years expiring on 31 December 2021. No later than 30 days prior to the expiry of the Engineering Framework Agreement, the Company is entitled to serve a written notice to China Telecommunications to renew the Engineering Framework Agreement, and the parties shall consult and decide on matters relating to such renewal. China Telecom Corporation Limited Annual Report 2020 067
REPORT OF THE DIRECTORS Internet Applications Channel Services Framework (2) CONTINUING CONNECTED TRANSACTIONS Agreement ENTERED INTO BETWEEN CHINA Pursuant to the Internet applications channel services TELECOM FINANCE AND THE GROUP, THE framework agreement signed between the Company PARENT GROUP AND THE CCS GROUP and China Telecommunications on 16 December 2013 RESPECTIVELY and the related supplemental agreement subsequently On 1 February 2019, China Telecom Finance entered entered into between the two parties (collectively, the into the financial services framework agreement with “Internet Applications Channel Services Framework each of the Company, China Telecommunications Agreement”), the Company provides Internet applications (together with its associates and its commonly held entity channel services to China Telecommunications and/ held with the Group, excluding the Group and the CCS or its associates. The channel services mainly include Group, the “Parent Group”) and CCS (together with its the provision of telecommunications channel and subsidiaries, “CCS Group”). China Telecommunications, applications support platform, provision of billing and the controlling shareholder of the Company, holds deduction services, coordination of sales promotion and approximately 51.39% of the issued share capital of CCS development of customers services, etc. The pricing and CCS is a subsidiary of China Telecommunications. terms for such services are the same as those set out in Pursuant to Chapter 14A of the Listing Rules, China the Community Services Framework Agreement. Telecommunications and CCS and their associates are connected persons of the Company. As the Company The Company and China Telecommunications have holds 70% of the issued share capital of China Telecom entered into a supplemental agreement on 20 August Finance, China Telecom Finance is a subsidiary of the 2018 and renewed the Internet Applications Channel Company. Meanwhile, China Telecommunications and Services Framework Agreement in accordance with CCS each respectively holds 15% of the issued share its provisions for a further term of 3 years expiring on capital of China Telecom Finance. Pursuant to Chapter 31 December 2021. No later than 30 days prior to the 14A of the Listing Rules, China Telecom Finance is a expiry of the Internet Applications Channel Services connected subsidiary of the Company and an associate Framework Agreement, the Company is entitled to serve of the China Telecommunications and CCS, which is a written notice to China Telecommunications to renew also a connected person of the Company. Accordingly, the Internet Applications Channel Services Framework the transactions under the China Telecom Financial Agreement, and the parties shall consult and decide on Services Framework Agreement entered into between matters relating to such renewal. the Company and China Telecom Finance, the China Telecommunications Corporation Financial Services Framework Agreement entered into between China Telecom Finance and China Telecommunications and the CCS Financial Services Framework Agreement entered into between China Telecom Finance and CCS constitute continuing connected transactions of the Company pursuant to Chapter 14A of the Listing Rules. 068 China Telecom Corporation Limited Annual Report 2020
REPORT OF THE DIRECTORS China Telecom Financial Services Framework As each of the applicable percentage ratios of the Agreement entered into between the Company and annual caps for the service fees of other financial China Telecom Finance services provided by China Telecom Finance to the Pursuant to the financial services framework agreement Group under the China Telecom Financial Services entered into between the Company and China Telecom Framework Agreement for each of the years ending 31 Finance on 1 February 2019 (“China Telecom Financial December 2019, 2020 and 2021 is less than 0.1%, such Services Framework Agreement”), China Telecom Finance other financial services are exempt from all reporting, agreed to provide financial services, including deposit announcement, annual review and independent services, loan services and other financial services to the shareholders’ approval requirements under Chapter 14A Group. As each of the applicable percentage ratios of the of the Listing Rules. annual caps for the deposit services provided by China Telecom Finance to the Group under the China Telecom Pricing Policy: Financial Services Framework Agreement for each of the years ending 31 December 2019, 2020 and 2021 exceeds (i) Deposit Services 5% but is less than 25%, such continuing connected transaction is subject to the reporting, announcement, The deposit interest rates offered by China annual review and independent shareholders’ approval Telecom Finance to the Group shall comply with requirements under Chapters 14A of the Listing the relevant requirements of the People’s Bank Rules. The independent shareholders of the Company of China and be with reference to the deposit considered and approved the deposit services and the benchmark interest rates promulgated by the applicable annual caps under the China Telecom Financial People’s Bank of China from time to time (if any) Services Framework Agreement at the extraordinary and the deposit interest rates of the same type of general meeting of the Company held on 18 April 2019. deposit services for the same period offered by the major cooperative commercial banks of the Group As the loan services provided by China Telecom Finance and are conducted on normal commercial terms or to the Group under the China Telecom Financial Services better. The deposit interest rates offered shall be Framework Agreement are conducted on normal equivalent to or higher than those offered by the commercial terms or better and the relevant loan services major cooperative commercial banks of the Group. will not be secured by the assets of the Group, such loan Under the same conditions, the interest rates and services are exempt from all reporting, announcement, terms for the deposit services offered by China annual review and independent shareholders’ approval Telecom Finance to the Group shall be the same requirements pursuant to Rule 14A.90 of the Listing Rules. as those interest rates and terms of the same type of deposit services for the same period offered by China Telecom Finance to other member units. China Telecom Corporation Limited Annual Report 2020 069
REPORT OF THE DIRECTORS (ii) Loan Services other financial services provided by China Telecom Finance to the Group mentioned above shall The loan interest rates offered by China Telecom comply with the fees standard promulgated by Finance to the Group shall comply with the relevant regulatory departments including the People’s requirements of the People’s Bank of China and be Bank of China or China Banking and Insurance with reference to the loan benchmark interest rates Regulatory Commission (including its designated promulgated by the People’s Bank of China from institution) (“CBIRC”) (if applicable), and be with time to time (if any) and the loan interest rates of reference to the handling fees standard for the the same type of loan services for the same period same type of other financial services charged by offered by the major cooperative commercial the major cooperative commercial banks of the banks of the Group and are conducted on normal Group and are conducted on normal commercial commercial terms or better. The loan interest terms or better. The handling fees standard shall rates offered shall be equivalent to or lower than be equivalent to or lower than those charged those offered by the major cooperative commercial by the major cooperative commercial banks of banks of the Group. Under the same conditions, the Group. Under the same conditions, the fees the interest rates and terms for the loan services standard charged to the Group by China Telecom offered by China Telecom Finance to the Group Finance shall be the same as those fees standard shall be the same as those interest rates and terms for the same type of other financial services of the same type of loan services for the same charged by China Telecom Finance to other period offered by China Telecom Finance to other member units. member units. The above loan services provided by China Telecom Finance to the Group do not For the respective specific transactions under the China require the Group to pledge any security over its Telecom Financial Services Framework Agreement, under assets or make other arrangements for the loan the same conditions, the Group should, in principle, services as guarantee. choose the services provided by China Telecom Finance. If the Group considers it is appropriate and beneficial to (iii) Other Financial Services the Group, the Group has the discretion to engage one or more major cooperative commercial banks of the Group as China Telecom Finance provides other financial its financial services providers. services (other than deposit and loan services) including financial and financing advice, credit The China Telecom Financial Services Framework authentication, guarantees, acceptance of bills Agreement became effective from 1 February 2019 and discounted bills, internal fund transfer and and will expire on 31 December 2021. Subject to the settlement and designs of relevant settlement and compliance of relevant laws and regulations and relevant clearance arrangement proposals to the Group regulatory requirements, both parties will negotiate and under the China Telecom Financial Services agree on the renewal arrangement. Framework Agreement. The fees charged for 070 China Telecom Corporation Limited Annual Report 2020
REPORT OF THE DIRECTORS China Telecommunications Corporation Financial As each of the applicable percentage ratios of the annual Services Framework Agreement entered into caps for the service fees of other financial services between China Telecom Finance and China provided by China Telecom Finance to the Parent Group Telecommunications under the China Telecommunications Corporation Pursuant to the financial services framework agreement Financial Services Framework Agreement for each of entered into between China Telecom Finance and the years ending 31 December 2019, 2020 and 2021 is China Telecommunications on 1 February 2019 (“China less than 0.1%, such other financial services are exempt Telecommunications Corporation Financial Services from all reporting, announcement, annual review and Framework Agreement”), China Telecom Finance independent shareholders’ approval requirements under agreed to provide financial services, including deposit Chapter 14A of the Listing Rules. services, loan services and other financial services to the Parent Group. As the deposit services provided Pricing Policy: by China Telecom Finance to the Parent Group under the China Telecommunications Corporation Financial (i) Deposit Services Services Framework Agreement are conducted on normal commercial terms or better and the relevant The deposit interest rates offered by China deposit services will not be secured by the assets of Telecom Finance to the Parent Group shall comply the Group, such deposit services are exempt from all with the relevant requirements of the People’s reporting, announcement, annual review and independent Bank of China and be with reference to the deposit shareholders’ approval requirements pursuant to Rule benchmark interest rates promulgated by the 14A.90 of the Listing Rules. People’s Bank of China from time to time (if any) and the deposit interest rates of the same type of As each of the applicable percentage ratios of the deposit services for the same period offered by the annual caps for the loan services provided by China major cooperative commercial banks of the Parent Telecom Finance to the Parent Group under the China Group and are conducted on normal commercial Telecommunications Corporation Financial Services terms or better. The deposit interest rates offered Framework Agreement for each of the years ending shall be equivalent to or higher than those offered 31 December 2019, 2020 and 2021 exceeds 0.1% but is by the major cooperative commercial banks of less than 5%, such loan services are only subject to the the Parent Group. Under the same conditions, the reporting, announcement and annual review requirements interest rates and terms for the deposit services but are exempt from the independent shareholders’ offered by China Telecom Finance to the Parent approval requirement under Chapter 14A of the Listing Group shall be the same as those interest rates Rules. and terms of the same type of deposit services for the same period offered by China Telecom Finance to other member units. China Telecom Corporation Limited Annual Report 2020 071
REPORT OF THE DIRECTORS (ii) Loan Services The fees charged for other financial services provided by China Telecom Finance to the Parent The loan interest rates offered by China Telecom Group mentioned above shall comply with the fees Finance to the Parent Group shall comply with standard promulgated by regulatory departments the relevant requirements of the People’s Bank including the People’s Bank of China or the of China and be with reference to the loan CBIRC (if applicable), and be with reference to the benchmark interest rates promulgated by the handling fees standard for the same type of other People’s Bank of China from time to time (if any) financial services charged by the major cooperative and the loan interest rates of the same type of commercial banks of the Parent Group and are loan services for the same period offered by the conducted on normal commercial terms or better. major cooperative commercial banks of the Parent The handling fees standard shall be equivalent to or Group and are conducted on normal commercial lower than those charged by the major cooperative terms or better. The loan interest rates offered shall commercial banks of the Parent Group. Under the be equivalent to or lower than those offered by the same conditions, the fees standard charged to major cooperative commercial banks of the Parent the Parent Group by China Telecom Finance shall Group. Under the same conditions, the interest be the same as those fees standard for the same rates and terms for the loan services offered by type of other financial services charged by China China Telecom Finance to the Parent Group shall Telecom Finance to other member units. be the same as those interest rates and terms of the same type of loan services for the same For the respective specific transactions under the China period offered by China Telecom Finance to other Telecommunications Corporation Financial Services member units. Framework Agreement, under the same conditions, the Parent Group should, in principle, choose the services The above loan services provided by China provided by China Telecom Finance. If the Parent Group Telecom Finance to the Parent Group do not considers it is appropriate and beneficial to the Parent require the Parent Group to pledge any security Group, the Parent Group has the discretion to engage over its assets or make other arrangements for the one or more major cooperative commercial banks of the loan services as guarantee. Parent Group as its financial services providers. (iii) Other Financial Services The China Telecommunications Corporation Financial Services Framework Agreement became effective from China Telecom Finance provides other financial 1 February 2019 and will expire on 31 December 2021. services (other than deposit and loan services) Subject to the compliance of relevant laws and regulations including financial and financing advice, credit and relevant regulatory requirements, both parties will authentication, guarantees, acceptance of bills negotiate and agree on the renewal arrangement. and discounted bills, internal fund transfer and settlement and designs of relevant settlement and clearance arrangement proposals to the Parent Group under the China Telecommunications Corporation Financial Services Framework Agreement. 072 China Telecom Corporation Limited Annual Report 2020
REPORT OF THE DIRECTORS CCS Financial Services Framework Agreement As each of the applicable percentage ratios of the annual entered into between China Telecom Finance and caps for the service fees of other financial services CCS provided by China Telecom Finance to the CCS Group Pursuant to the financial services framework agreement under the CCS Financial Services Framework Agreement entered into between China Telecom Finance and CCS for each of the years ending 31 December 2019, on 1 February 2019 (“CCS Financial Services Framework 2020 and 2021 is less than 0.1%, such other financial Agreement”), China Telecom Finance agreed to provide services are exempt from all reporting, announcement, financial services, including deposit services, loan annual review and independent shareholders’ approval services and other financial services to the CCS Group. requirements under Chapter 14A of the Listing Rules. As the deposit services provided by China Telecom Finance to the CCS Group under the CCS Financial Pricing Policy: Services Framework Agreement are conducted on normal commercial terms or better and the relevant (i) Deposit Services deposit services will not be secured by the assets of the Group, such deposit services are exempt from all The deposit interest rates offered by China reporting, announcement, annual review and independent Telecom Finance to the CCS Group shall comply shareholders’ approval requirements pursuant to Rule with the relevant requirements of the People’s 14A.90 of the Listing Rules. Bank of China and be with reference to the deposit benchmark interest rates promulgated by the As each of the applicable percentage ratios of the annual People’s Bank of China from time to time (if any) caps for loan services provided by China Telecom and the deposit interest rates of the same type of Finance to CCS Group under the CCS Financial Services deposit services for the same period offered by the Framework Agreement for each of the years ending 31 major cooperative commercial banks of the CCS December 2019, 2020 and 2021 exceeds 0.1% but is Group and are conducted on normal commercial less than 5%, such loan services are only subject to the terms or better. The deposit interest rates offered reporting, announcement and annual review requirements shall be equivalent to or higher than those offered but are exempt from the independent shareholders’ by the major cooperative commercial banks of approval requirement under Chapter 14A of the Listing the CCS Group. Under the same conditions, the Rules. interest rates and terms for the deposit services offered by China Telecom Finance to the CCS Group shall be the same as those interest rates and terms of the same type of deposit services for the same period offered by China Telecom Finance to other member units. China Telecom Corporation Limited Annual Report 2020 073
REPORT OF THE DIRECTORS (ii) Loan Services The fees charged for other financial services provided by China Telecom Finance to the CCS The loan interest rates offered by China Telecom Group mentioned above shall comply with the fees Finance to the CCS Group shall comply with standard promulgated by regulatory departments the relevant requirements of the People’s Bank including the People’s Bank of China or the of China and be with reference to the loan CBIRC (if applicable), and be with reference to the benchmark interest rates promulgated by the handling fees standard for the same type of other People’s Bank of China from time to time (if any) financial services charged by the major cooperative and the loan interest rates of the same type of loan commercial banks of the CCS Group and are services for the same period offered by the major conducted on normal commercial terms or better. cooperative commercial banks of the CCS Group The handling fees standard shall be equivalent to or and are conducted on normal commercial terms lower than those charged by the major cooperative or better. The loan interest rates offered shall be commercial banks of the CCS Group. Under the equivalent to or lower than those offered by the same conditions, the fees standard charged to the major cooperative commercial banks of the CCS CCS Group by China Telecom Finance shall be the Group. Under the same conditions, the interest same as those fees standard for the same type of rates and terms for the loan services offered by other financial services charged by China Telecom China Telecom Finance to the CCS Group shall Finance to other member units. be the same as those interest rates and terms of the same type of loan services for the same For the respective specific transactions under the CCS period offered by China Telecom Finance to other Financial Services Framework Agreement, provided that member units. The above loan services provided it is in compliance with the terms and conditions of the by China Telecom Finance to the CCS Group do CCS Financial Services Framework Agreement, China not require the CCS Group to pledge any security Telecom Finance was appointed as one of the financial over its assets or make other arrangements for the institutions providing financial services to the CCS Group. loan services as guarantee. Prior to the signing of any specific agreement with China Telecom Finance in respect of respective transactions (iii) Other Financial Services under the CCS Financial Services Framework Agreement, the CCS Group will compare the interest rates and terms China Telecom Finance provides other financial or fees charged and other relevant transactions terms services (other than deposit and loan services) offered by China Telecom Finance with those interest including financial and financing advice, credit rates and terms of the same type of deposit or loan authentication, guarantees, acceptance of bills services for the same period or fees charged and other and discounted bills, internal fund transfer and relevant transaction terms for the same type of financial settlement and designs of relevant settlement services offered by the major cooperative commercial and clearance arrangement proposals to the banks of the CCS Group. Only when the interest rates CCS Group under the CCS Financial Services and terms or fees charged or other relevant transactions Framework Agreement. 074 China Telecom Corporation Limited Annual Report 2020
REPORT OF THE DIRECTORS terms offered by China Telecom Finance are equivalent The auditors of the Group have reviewed the continuing to or better than those interest rates and terms offered connected transactions of the Group for the year ended or fees charged or other relevant transactions terms (e.g. 31 December 2020 and have confirmed to the Board transaction approval terms, procedures or time limit, etc.) that nothing has come to their attention that causes offered by the major cooperative commercial banks of them to believe that the relevant continuing connected the CCS Group, the CCS Group has the discretion to transactions: enter into the transactions with China Telecom Finance. Under the circumstances which the CCS Group considers (1) have not been approved by the Board of the appropriate, the CCS Group may engage additional or Company; other financial institutions other than China Telecom Finance to provide financial services. (2) (for transactions involving the provision of goods or services by the Group) were not entered into, in all The CCS Financial Services Framework Agreement material respects, in accordance with the pricing became effective from 1 February 2019 and will expire on policies of the Group; 31 December 2021. Subject to the compliance of relevant laws and regulations and relevant regulatory requirements, (3) were not entered into, in all material respects, in both parties will negotiate and agree on the renewal accordance with the terms of the agreements arrangement. governing such transactions; and Review of Continuing Connected Transactions (4) have exceeded the annual caps as set by the The Company confirms that it has complied with the Company. disclosure requirements in accordance with Chapter 14A of the Listing Rules in respect of the connected A copy of the auditors’ letter in relation to the continuing transactions the Company conducted in the year 2020. connected transactions has been provided by the Company to the Hong Kong Stock Exchange. The Company’s external auditor was engaged to report on the Group’s continuing connected transactions for the year ended 31 December 2020 in accordance with the Hong Kong Standard on Assurance Engagements 3000 “Assurance Engagements Other Than Audits or Reviews of Historical Financial Information” and with reference to Practice Note 740 “Auditor’s Letter on Continuing Connected Transactions under the Hong Kong Listing Rules” issued by the Hong Kong Institute of Certified Public Accountants. China Telecom Corporation Limited Annual Report 2020 075
REPORT OF THE DIRECTORS The Independent Non-Executive Directors of the Company RELATED PARTY TRANSACTIONS have confirmed that all continuing connected transactions for the year ended 31 December 2020 to which the Group Details of the related party transactions of the Group was a party: (“Related Party Transactions”) are set out in note 44 of the consolidated financial statements. Only the Related Party (1) had been entered into, and the agreements Transactions set out in note 44(a) of the consolidated governing those transactions were entered into, financial statements constitute continuing connected by the Group in the ordinary and usual course of transactions under Chapter 14A of the Listing Rules, business; the details of which (except for fully exempt continuing connected transactions) have been disclosed in the above (2) had been entered into either: section “Continuing Connected Transactions”. Other Related Party Transactions do not constitute connected (i) on normal commercial terms or better; or transactions or continuing connected transactions under Chapter 14A of the Listing Rules. (ii) if there are not sufficient comparable transactions to judge whether they are BUSINESS REVIEW on normal commercial terms, on terms no less favourable to the Company than Relating to the details of the material development of those available to or (if applicable) from the Group in 2020, a fair review of the business and a independent third parties; and discussion and analysis of the Group’s performance during the year and the material factors underlying (3) had been entered into in accordance with the its results and financial position are provided in the relevant agreements governing those transactions Chairman’s Statement on pages 8 to 18, Business on terms that are fair and reasonable and in the Review on pages 30 to 37 and Financial Review on interests of the shareholders of the Company as a pages 38 to 45 of this annual report. Description of the whole. principal risks and uncertainties faced the Group can be found throughout this annual report, particularly in the The Independent Non-Executive Directors have further Environmental, Social and Governance Report on pages confirmed that: 86 to 157 of this annual report. Particulars of important events affecting the Group that have occurred after The continuing connected transactions for the year ended 31 December 2020, if any, can also be found in the Notes 31 December 2020 entered into between the Group and to the Consolidated Financial Statements. The outlook its connected persons which are subject to annual caps of the Group’s business is discussed throughout this have not exceeded their respective annual caps. annual report including in the Chairman’s Statement and Business Review. 076 China Telecom Corporation Limited Annual Report 2020
REPORT OF THE DIRECTORS Description of the Group’s key relationships with its PROPOSED A SHARE OFFERING employees, customers, suppliers and others that have AND RELATED MATTERS a significant impact on the Company and on which the Company’s success depends can be found throughout In order to seize the opportunities of digitalised this annual report, particularly in the Environmental, development, improve the corporate governance and Social and Governance Report on pages 86 to 157 of broaden financing channels, accelerate reform and this annual report. In addition, more details regarding development, promote the implementation of strategies the Group’s performance by reference to financial key and achieve high-quality development, the Company performance indicators and environmental policies, as well proposed to apply for the offering and listing of A Shares as compliance with relevant laws and regulations which on the Main Board of the Shanghai Stock Exchange, to have a significant impact on the Group, are provided in amend the Article of Association, the Rules of Procedures the Chairman’s Statement, Business Review, Financial of the Meeting of the Board of Directors and the Rules of Review, Environmental, Social and Governance Report of Procedures of the Meeting of the Supervisory Committee, this annual report. Each of the above-mentioned relevant and to adopt the Rules of Procedures of the Shareholders’ contents form an integral part of this Report of the General Meeting, in each case in accordance with relevant Directors. laws, administrative regulations, departmental regulations and regulatory documents. The relevant proposals were COMPLIANCE WITH THE considered and approved by the Board on 9 March 2021 CORPORATE GOVERNANCE CODE and will be proposed for shareholders’ consideration and approval at the Extraordinary General Meeting, Please refer to the Environmental, Social and Governance the Domestic Shareholders’ Class Meeting and the H Report set out on pages 86 to 157 of this 2020 annual Shareholders’ Class Meeting to be held on 9 April 2021. report of the Company for details of our compliance with the Corporate Governance Code. Please refer to the announcements published by the Company on 9 March 2021 and the relevant circular for further details. China Telecom Corporation Limited Annual Report 2020 077
REPORT OF THE DIRECTORS NYSE HAS COMMENCED Regulation had determined to re-commence proceedings DELISTING PROCEEDINGS OF to delist the ADSs to comply with the Executive Order (the AMERICAN DEPOSITARY SHARES “Determination”). This latest decision is based on the new specific guidance that the US Department of Treasury’s The President of the United States of America Office of Foreign Assets Control (“OFAC”) provided to the issued an executive order on 12 November 2020 NYSE. On 20 January 2021 (US Eastern standard time), (US Eastern standard time) (as amended on the Company filed with the NYSE a written request for a 13 January 2021 (US Eastern standard time), the review of the Determination by a Committee of the Board “Executive Order”) to prohibit any transaction in publicly of Directors of the NYSE (the “Committee”). The Company traded securities, or any securities that are derivative requested that the Committee reverse the Determination of, or are designed to provide investment exposure to and stay the trading suspension of the ADSs pending such securities, of the companies concerned which review of the Determination. On 27 January 2021 (US include the Company’s ultimate holding company (being Eastern standard time), OFAC published General License China Telecommunications Corporation), by any United No. 1A in relation to the Executive Order (“GL 1A”), States person (the “Prohibitions”). The Prohibitions dated 26 January 2021 (US Eastern standard time) would become effective beginning 9:30 a.m. on 11 and guidance relating to two related frequently asked January 2021 (US Eastern standard time), and are questions (respectively, “FAQ 878” and “FAQ 879”). GL subject to certain divestiture and other exemptions. On 1A and FAQ 879 provide, among others, that, pursuant to 31 December 2020 (US Eastern standard time), The the Executive Order, the Prohibitions with respect to the New York Stock Exchange LLC (the “NYSE”) announced Company take effect on the date that is 60 days after the that the staff of NYSE Regulation had determined to Company was added to the Restricted List, or 9 March commence proceedings to delist the securities of three 2021 (US Eastern standard time) (instead of 11 January issuers, including the American Depositary Shares (NYSE 2021 (US Eastern standard time)). stock ticker: CHA, the “ADSs”) of the Company, on the basis that the Company is no longer suitable for listing Please refer to the announcements published by the pursuant to the NYSE Listed Company Manual Section Company on 13 November 2020, 4 January 2021, 802.01D in light of the Executive Order. The NYSE will 5 January 2021, 7 January 2021, 21 January 2021 and apply to the SEC to delist the ADSs upon completion 28 January 2021 for further details. of all applicable procedures. On 4 January 2021 (US Eastern standard time), NYSE announced that NYSE MATERIAL LEGAL PROCEEDINGS Regulation no longer intended to move forward with the delisting action in relation to the securities of three issuers, As at 31 December 2020, the Company was not involved including the ADSs of the Company. On 6 January 2021 in any material litigation or arbitration, and as far as the (US Eastern standard time), NYSE announced that it Company is aware, no material litigation or claims were had once again reversed its earlier decision in that NYSE pending or threatened or made against the Company. 078 China Telecom Corporation Limited Annual Report 2020
REPORT OF THE DIRECTORS AUDITORS Deloitte Touche Tohmatsu and Deloitte Touche Tohmatsu Certified Public Accountants LLP have confirmed in Deloitte Touche Tohmatsu and Deloitte Touche Tohmatsu writing that there are no matters in relation to their Certified Public Accountants LLP were appointed as the retirement which should be brought to the attention international and domestic auditors of the Company, of the shareholders of the Company. The Board is not respectively for the year ended 31 December 2020. aware of any matters in relation to the proposed change Deloitte Touche Tohmatsu has audited the consolidated of auditors that need to be brought to the attention of financial statements set out in this report, which have been the shareholders of the Company. The Board and the prepared in accordance with the International Financial Audit Committee have also confirmed that there are Reporting Standards. no disagreement or outstanding matters between the Company and Deloitte Touche Tohmatsu and Deloitte Pursuant to the relevant regulations issued by the Ministry Touche Tohmatsu Certified Public Accountants LLP. of Finance of the People’s Republic of China and SASAC, The proposed appointment of auditors is subject to the service terms of Deloitte Touche Tohmatsu and the approval of the shareholders of the Company at Deloitte Touche Tohmatsu Certified Public Accountants the 2020 Annual General Meeting. Please refer to the LLP will expire soon. They will retire as the international announcement published by the Company on 9 March auditor and domestic auditor of the Company effective 2021 for further details. upon the close of the 2020 Annual General Meeting and will not be re-appointed. Pursuant to the open selection process, and as recommended by the Audit Committee of the Company (the “Audit Committee”), the Board has resolved to propose to the shareholders By Order of the Board of the Company at the 2020 Annual General Meeting to Ke Ruiwen approve the appointments of PricewaterhouseCoopers Chairman and Chief Executive Officer and PricewaterhouseCoopers Zhong Tian LLP as the Company’s external auditors for the year ending Beijing, China 31 December 2021 and to authorise the Board to fix the 9 March 2021 remuneration of the auditors. China Telecom Corporation Limited Annual Report 2020 079
REPORT OF THE SUPERVISORY COMMITTEE During the reporting period, all members of the and passed the relevant resolutions. Regarding the Supervisory Committee acted in accordance with the Company’s operating results, 5G construction, etc., Company Law of the People’s Republic of China and the Supervisory Committee communicated with the the Articles of Association of the Company, followed Finance Department and external auditors and raised the principles of integrity and diligently carried out their certain recommendations. During the reporting period, supervisory function to safeguard the interests of the members of the Supervisory Committee supervised the shareholders, the Company and the employees. major decision-making process of the Company and the performance of duties of the members of the Board and I. THE WORK STATUS OF THE the senior management through their attendance at the SUPERVISORY COMMITTEE 2019 Annual General Meeting, Board meetings and Audit OF THE COMPANY Committee meetings. During the reporting period, the Supervisory Committee II. THE OVERALL ASSESSMENT held two meetings. At the sixth meeting of the sixth OF THE OPERATION session of the Supervisory Committee held on 19 March MANAGEMENT AND 2020, the Supervisory Committee reviewed and approved PERFORMANCE DURING THE six agenda items, including the financial statements for REPORTING PERIOD the year 2019, the auditor’s report issued by the external auditors, the profit distribution and dividend proposal, The Supervisory Committee believed that during the the Supervisory Committee’s report for the year 2019, reporting period, all members of the Board and the the work plan of the Supervisory Committee for the year 2020, election of members to the seventh session of senior management have complied with rules and the Supervisory Committee, and passed the relevant regulations, upheld the principles of diligence and integrity, resolutions. Regarding the impact of the Epidemic on the safeguarded the interests of shareholders, fully fulfilled Company’s business development and the improvement their responsibilities in accordance with the Articles of of resource efficiency, etc., the Supervisory Committee Association of the Company, diligently implemented communicated with the Finance Department and external the resolutions of shareholders’ meetings and the auditors and raised certain recommendations. At the Board meetings, and strictly complied with the relevant first meeting of the seventh session of the Supervisory regulations governing listed companies. The Supervisory Committee held on 13 August 2020, the Supervisory Committee has not observed any behaviours that Committee reviewed and approved the interim financial statements of the Company for the interim report of breached the laws, rules and Articles of Association of the Company, or damaged the interests of shareholders. 2020 and the review report of the external auditors, 080 China Telecom Corporation Limited Annual Report 2020

REPORT OF THE SUPERVISORY COMMITTEE During the reporting period, The Company coordinated its amounted to RMB118.9 billion, representing an increase efforts in Epidemic prevention and control with operation of 1.4% over last year. Net profit4 amounted to RMB20.9 and development, firmly seized opportunities emerging billion, representing an increase of 1.6% over last year, from the digital transformation of the economy and while basic earnings per share were RMB0.26. Capital society, and promoted the “Cloudification and Digital expenditure was RMB84.8 billion and free cash flow5 Transformation” strategy on all fronts. The Company was RMB14.3 billion. The Company’s financial position also strengthened its sci-tech innovation capabilities and remained robust. deepened corporate reforms, achieving steady growth of its operating results, while continuing to share the Overall, the Company built up new information high-quality development results of the Company with infrastructure with 5G and cloud as the core, and its shareholders and the society. In 2020, operating stimulated increasing and diversified customer demand revenues of the Company amounted to RMB393.6 billion, for integrated intelligent information services, sped up representing an increase of 4.7% over last year. Service its Cloudification reform as well as digital transformation, revenues1 amounted to RMB373.8 billion, representing an established the new development pattern from an all-increase of 4.5% over last year, surpassing the industry’s round perspective and strived to enhance its market average growth rate2 over several consecutive years. Of competitiveness and corporate vitality. In addition, while which, mobile service revenues amounted to RMB181.7 diligently fulfilling its responsibilities to shareholders, the billion, representing an increase of 3.5% over last year. Company persisted in integrating social responsibilities Wireline service revenues amounted to RMB192.1 billion, into its own development, and fulfilled its corporate social representing an increase of 5.5% over last year. EBITDA3 responsibilities excellently. 1 Service revenues are calculated based on operating revenues minus sales of mobile terminals, sales of wireline equipment and other non-service revenues. 2 MIIT’s statistical communique of the communications industry in 2020: telecommunications revenue grew by 3.6% year-on-year in 2020. 3 EBITDA is calculated based on operating revenues minus operating expenses plus depreciation and amortisation. 4 Net profit represents profit attributable to equity holders of the Company. 5 Free cash flow is calculated based on EBITDA minus capital expenditure, income tax and depreciation charge for right-of-use assets other than land-use-rights. China Telecom Corporation Limited Annual Report 2020 081
REPORT OF THE SUPERVISORY COMMITTEE III. THE INDEPENDENT OPINION the shareholders as a whole, especially those of the ON THE RELEVANT MATTERS minority shareholders, actively promoted the regulated DURING THE REPORTING operation of the Company, enhanced the level of PERIOD corporate governance of the Company, followed lawful procedures in their decision-making, and implemented 1. The opinion concluded by the Supervisory resolutions approved at the shareholders’ meetings. The Committee on the compliance of the Supervisory Committee was not aware of any behaviours operation of the Company with laws and of the Directors or the senior management which violated regulations the laws, regulations, the Articles of Association of the Pursuant to the relevant laws and regulations of PRC, Company or were detrimental to the interests of the the Supervisory Committee monitored the convening Company. procedures and resolutions resolved at the meetings of the Board, the implementation by the Board of the resolutions 2. The opinion concluded by the Supervisory approved by the shareholders’ meetings, the performance Committee on the financial implementations of duties by the Company’s senior management, and of the Company the Company’s management policies. The Supervisory Through the supervision and inspection of the Company’s Committee is of the view that the Directors and the senior financial policies and financial condition, the Supervisory management, in performing their duties, strictly complied Committee is of the view that the Company is able to with the relevant rules and regulations, safeguarded strictly comply with the regulatory requirements such as the legitimate rights and interests of the Company and section 404 of the US Sarbanes-Oxley Act and to continue 082 China Telecom Corporation Limited Annual Report 2020
REPORT OF THE SUPERVISORY COMMITTEE to enhance its internal controls over financial reporting, Committee will focus on the Company’s implementation while effectively controlling and managing the Company of important measures in the process of comprehensively in accordance with rules and regulations. The Supervisory and deeply promoting “Cloudification and Digital Committee advised the Company to strengthen risk Transformation” strategy, strengthening sci-tech control as well as investment efficiency assessment in innovation, accelerating the integration and development the area of emerging businesses. Upon reviewing the of 5G, cloud and artificial intelligence, empowering financial statements for the year 2020 with unqualified internal and external digital transformation, deepening audit opinion and other relevant information to be tabled and expanding ecological cooperation, and promoting by the Board at the 2020 Annual General Meeting, which corporate high-quality development, and will further were prepared in accordance with the China Accounting broaden the work plan of the Supervisory Committee and Standards for Business Enterprises and the International strengthen its efforts in monitoring so as to protect the Financial Reporting Standards as audited by PRC certified interests of all investors. accountants and international auditors of the Company respectively, the Supervisory Committee is of the opinion that the financial statements truly and fairly reflect the Company’s financial condition, operating results and cash flows. In 2021, the Supervisory Committee will continue to strictly By Order of the Supervisory Committee adhere to the Articles of Association of the Company and Sui Yixun relevant regulations, assume its responsibility to protect Chairman of the Supervisory Committee the interests of the shareholders and the Company, and lay emphasis on monitoring the Company to fulfill Beijing, China its commitment to its shareholders. The Supervisory 9 March 2021 China Telecom Corporation Limited Annual Report 2020 083

RECOGNITION AND AWARDS RECOGNITION AND AWARDS Our Achievements Soar to new height 084 China Telecom Corporation Limited Annual Report 2020 China Telecom Corporation Limited Annual Report 2020 085
ENVIRONMENTAL, SOCIAL AND GOVERNANCE REPORT 086 China Telecom Corporation Limited Annual Report 2020
ENVIRONMENTAL, SOCIAL AND GOVERNANCE REPORT As a large-scale and leading integrated information services operator in the world, China Telecom has always insisted on incorporating environmental, social and governance (“ESG”) responsibilities into corporate operation and management, and has established and continues to optimise effective risk management and internal control systems in relation to ESG. With rapid development of mobile Internet and swift upgrade of information consumption, the Company continues to promote corporate transformation and accelerates business upgrade, endeavouring to provide premium network information services for subscribers and striving to be a leading integrated intelligent information services operator. The Company has strictly complied with the provisions of the Environmental, Social and Governance Reporting Guide as set out in Appendix 27 (“ESG Reporting Guide”) of the Listing Rules of the Hong Kong Stock Exchange in 2020, and considered the concerns of stakeholders and the ESG issues identified by the Company in the course of operations as a basis for reporting. In 2020, the Company further refined its own System of Environmental, Social and Governance (ESG) Indicators, improved the internal process for collecting and monitoring the data on ESG performance and strengthened procedures on ESG data collection, review and application to ensure detailed information on how the Company fulfils its responsibility in the aspect of ESG as required has been disclosed. This report is a yearly report which covers the Company and its subsidiaries (branches) for the period from 1 January 2020 to 31 December 2020. For details of compliance with ESG Reporting Guide, please see the ESG Reporting Guide Index in this report. There are no significant changes in the scope of this report from the ESG Report published in the 2019 annual report. This report has been reviewed and approved by the Board for publication. China Telecom Corporation Limited Annual Report 2020 087
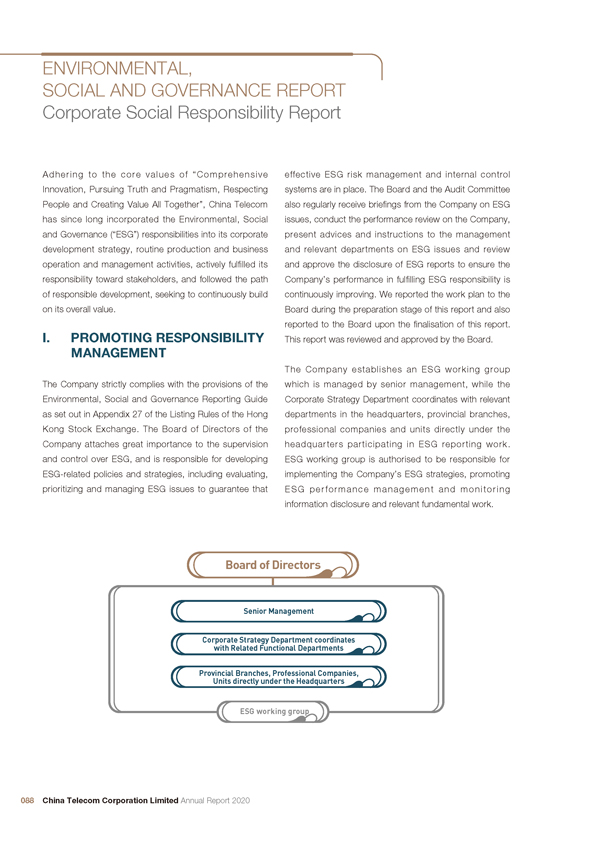
ENVIRONMENTAL, SOCIAL AND GOVERNANCE REPORT Corporate Social Responsibility Report Adhering to the core values of “Comprehensive effective ESG risk management and internal control Innovation, Pursuing Truth and Pragmatism, Respecting systems are in place. The Board and the Audit Committee People and Creating Value All Together”, China Telecom also regularly receive briefings from the Company on ESG has since long incorporated the Environmental, Social issues, conduct the performance review on the Company, and Governance (“ESG”) responsibilities into its corporate present advices and instructions to the management development strategy, routine production and business and relevant departments on ESG issues and review operation and management activities, actively fulfilled its and approve the disclosure of ESG reports to ensure the responsibility toward stakeholders, and followed the path Company’s performance in fulfilling ESG responsibility is of responsible development, seeking to continuously build continuously improving. We reported the work plan to the on its overall value. Board during the preparation stage of this report and also reported to the Board upon the finalisation of this report. I. PROMOTING RESPONSIBILITY This report was reviewed and approved by the Board. MANAGEMENT The Company establishes an ESG working group The Company strictly complies with the provisions of the which is managed by senior management, while the Environmental, Social and Governance Reporting Guide Corporate Strategy Department coordinates with relevant as set out in Appendix 27 of the Listing Rules of the Hong departments in the headquarters, provincial branches, Kong Stock Exchange. The Board of Directors of the professional companies and units directly under the Company attaches great importance to the supervision headquarters participating in ESG reporting work. and control over ESG, and is responsible for developing ESG working group is authorised to be responsible for ESG-related policies and strategies, including evaluating, implementing the Company’s ESG strategies, promoting prioritizing and managing ESG issues to guarantee that ESG performance management and monitoring information disclosure and relevant fundamental work. Board of Directors Senior Management Corporate Strategy Department coordinates with Related Functional Departments Provincial Branches, Professional Companies, Units directly under the Headquarters ESG working group 088 China Telecom Corporation Limited Annual Report 2020
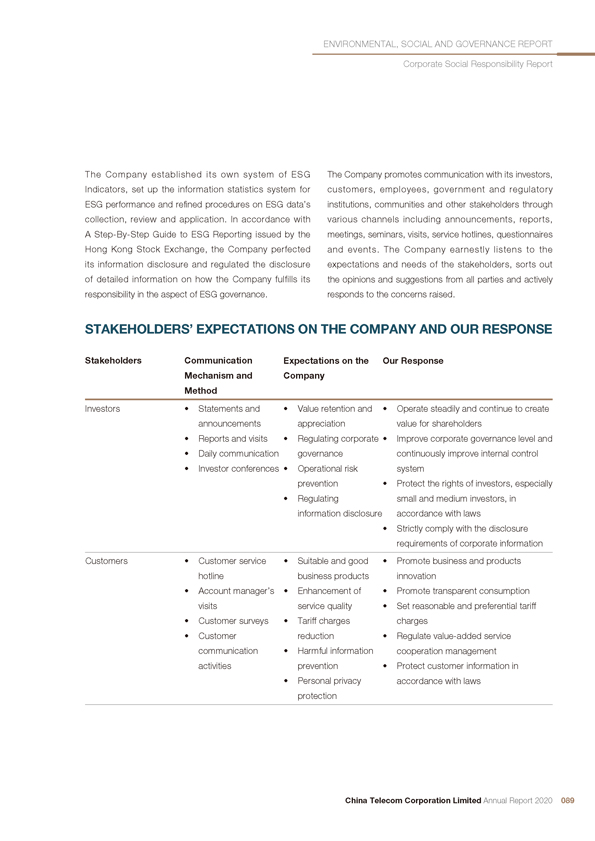
ENVIRONMENTAL, SOCIAL AND GOVERNANCE REPORT Corporate Social Responsibility Report The Company established its own system of ESG The Company promotes communication with its investors, Indicators, set up the information statistics system for customers, employees, government and regulatory ESG performance and refined procedures on ESG data’s institutions, communities and other stakeholders through collection, review and application. In accordance with various channels including announcements, reports, A Step-By-Step Guide to ESG Reporting issued by the meetings, seminars, visits, service hotlines, questionnaires Hong Kong Stock Exchange, the Company perfected and events. The Company earnestly listens to the its information disclosure and regulated the disclosure expectations and needs of the stakeholders, sorts out of detailed information on how the Company fulfills its the opinions and suggestions from all parties and actively responsibility in the aspect of ESG governance. responds to the concerns raised. STAKEHOLDERS’ EXPECTATIONS ON THE COMPANY AND OUR RESPONSE Stakeholders Communication Expectations on the Our Response Mechanism and Company Method Investors • Statements and • Value retention and • Operate steadily and continue to create announcements appreciation value for shareholders • Reports and visits • Regulating corporate • Improve corporate governance level and • Daily communication governance continuously improve internal control • Investor conferences • Operational risk system prevention • Protect the rights of investors, especially • Regulating small and medium investors, in information disclosure accordance with laws • Strictly comply with the disclosure requirements of corporate information Customers • Customer service • Suitable and good • Promote business and products hotline business products innovation • Account manager’s • Enhancement of • Promote transparent consumption visits service quality • Set reasonable and preferential tariff • Customer surveys • Tariff charges charges • Customer reduction • Regulate value-added service communication • Harmful information cooperation management activities prevention • Protect customer information in • Personal privacy accordance with laws protection China Telecom Corporation Limited Annual Report 2020 089
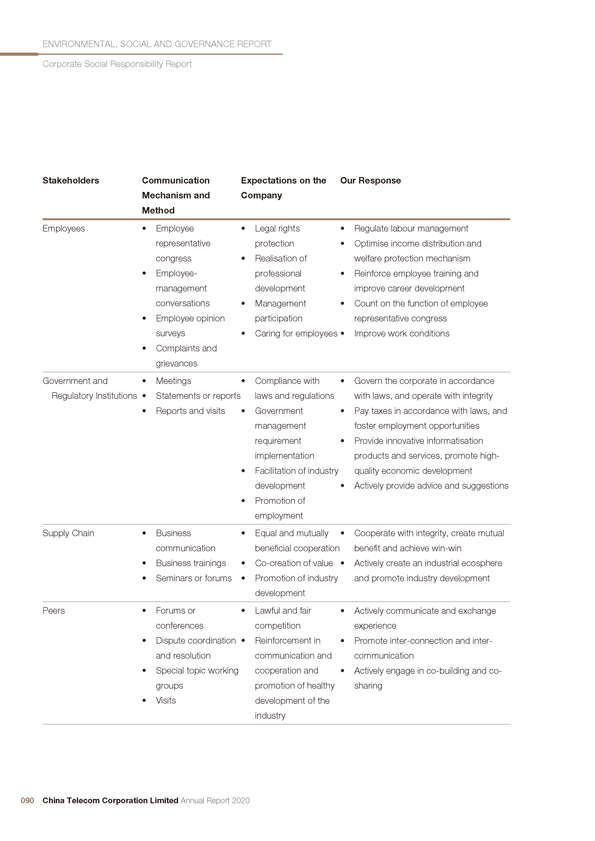
ENVIRONMENTAL, SOCIAL AND GOVERNANCE REPORT Corporate Social Responsibility Report Stakeholders Communication Expectations on the Our Response Mechanism and Company Method Employees • Employee • Legal rights • Regulate labour management representative protection • Optimise income distribution and congress • Realisation of welfare protection mechanism • Employee- professional • Reinforce employee training and management development improve career development conversations • Management • Count on the function of employee • Employee opinion participation representative congress surveys • Caring for employees • Improve work conditions • Complaints and grievances Government and • Meetings • Compliance with • Govern the corporate in accordance Regulatory Institutions • Statements or reports laws and regulations with laws, and operate with integrity • Reports and visits • Government • Pay taxes in accordance with laws, and management foster employment opportunities requirement • Provide innovative informatisation implementation products and services, promote high• Facilitation of industry quality economic development development • Actively provide advice and suggestions • Promotion of employment Supply Chain • Business • Equal and mutually • Cooperate with integrity, create mutual communication beneficial cooperation benefit and achieve win-win • Business trainings • Co-creation of value • Actively create an industrial ecosphere • Seminars or forums • Promotion of industry and promote industry development development Peers • Forums or • Lawful and fair • Actively communicate and exchange conferences competition experience • Dispute coordination • Reinforcement in • Promote inter-connection and inter-and resolution communication and communication • Special topic working cooperation and • Actively engage in co-building and co-groups promotion of healthy sharing • Visits development of the industry 090 China Telecom Corporation Limited Annual Report 2020
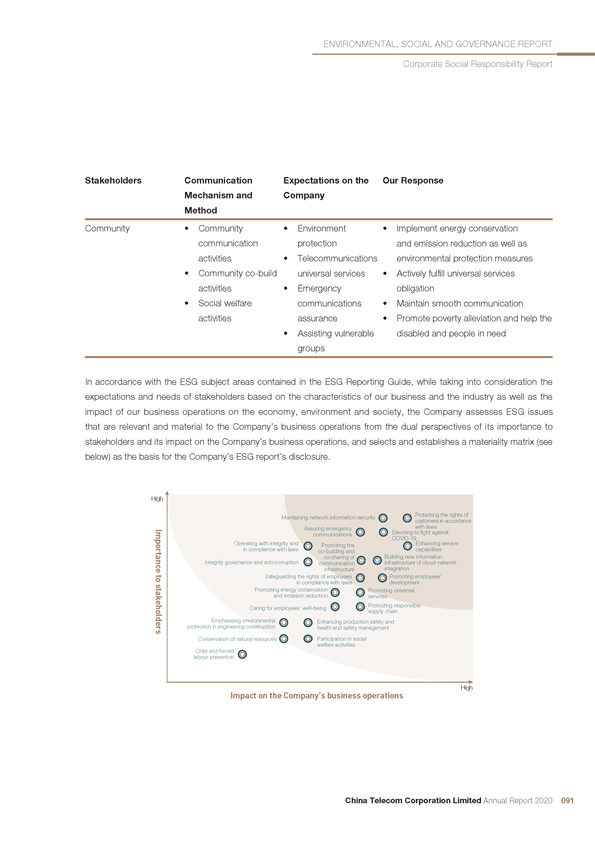
ENVIRONMENTAL, SOCIAL AND GOVERNANCE REPORT Corporate Social Responsibility Report Stakeholders Communication Expectations on the Our Response Mechanism and Company Method Community • Community • Environment • Implement energy conservation communication protection and emission reduction as well as activities • Telecommunications environmental protection measures • Community co-build universal services • Actively fulfill universal services activities • Emergency obligation • Social welfare communications • Maintain smooth communication activities assurance • Promote poverty alleviation and help the • Assisting vulnerable disabled and people in need groups In accordance with the ESG subject areas contained in the ESG Reporting Guide, while taking into consideration the expectations and needs of stakeholders based on the characteristics of our business and the industry as well as the impact of our business operations on the economy, environment and society, the Company assesses ESG issues that are relevant and material to the Company’s business operations from the dual perspectives of its importance to stakeholders and its impact on the Company’s business operations, and selects and establishes a materiality matrix (see below) as the basis for the Company’s ESG report’s disclosure. High Protecting the rights of Maintaining network information security customers in accordance Assuring emergency Devoting to _ght againstwith laws Importance communications Operating with integrity and COVID-19Enhancing service Promoting the in compliance with laws co-building and capabilities Integrity governance and anti-corruption co-sharing of Building new information communication infrastructure of cloud-network infrastructure integration to Safeguarding the rights of employees Promoting employees’ in compliance with laws development stakeholders Promoting energy conservation Promoting universal and emission reduction services Promoting responsible Caring for employees’ well-being supply chain Emphasising environmental Enhancing production safety and protection in engineering construction health and safety management Conservation of natural resources Participation in social welfare activities Child and forced labour prevention Impact on the Company’s business operations High China Telecom Corporation Limited Annual Report 2020 091
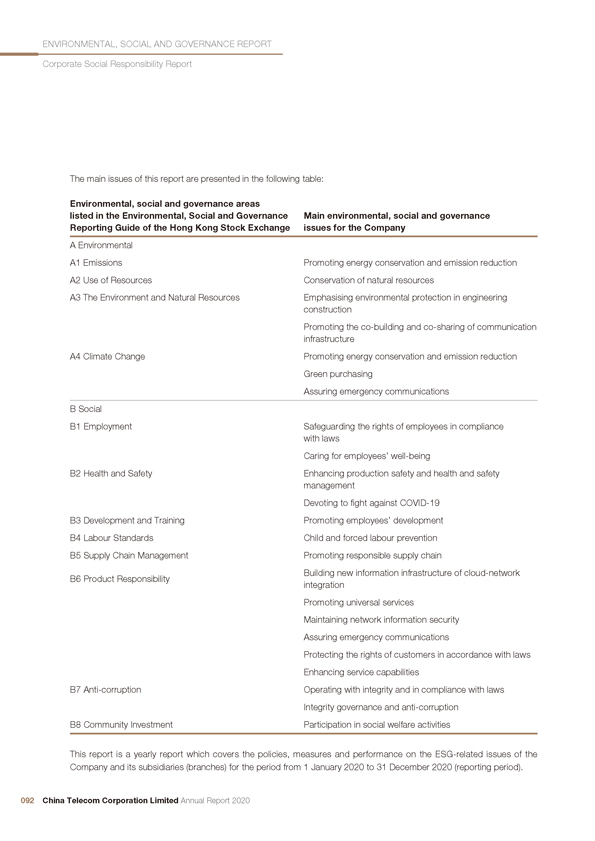
ENVIRONMENTAL, SOCIAL AND GOVERNANCE REPORT Corporate Social Responsibility Report The main issues of this report are presented in the following table: Environmental, social and governance areas listed in the Environmental, Social and Governance Main environmental, social and governance Reporting Guide of the Hong Kong Stock Exchange issues for the Company A Environmental A1 Emissions Promoting energy conservation and emission reduction A2 Use of Resources Conservation of natural resources A3 The Environment and Natural Resources Emphasising environmental protection in engineering construction Promoting the co-building and co-sharing of communication infrastructure A4 Climate Change Promoting energy conservation and emission reduction Green purchasing Assuring emergency communications B Social B1 Employment Safeguarding the rights of employees in compliance with laws Caring for employees’ well-being B2 Health and Safety Enhancing production safety and health and safety management Devoting to fight against COVID-19 B3 Development and Training Promoting employees’ development B4 Labour Standards Child and forced labour prevention B5 Supply Chain Management Promoting responsible supply chain Building new information infrastructure of cloud-network B6 Product Responsibility integration Promoting universal services Maintaining network information security Assuring emergency communications Protecting the rights of customers in accordance with laws Enhancing service capabilities B7 Anti-corruption Operating with integrity and in compliance with laws Integrity governance and anti-corruption B8 Community Investment Participation in social welfare activities This report is a yearly report which covers the policies, measures and performance on the ESG-related issues of the Company and its subsidiaries (branches) for the period from 1 January 2020 to 31 December 2020 (reporting period). 092 China Telecom Corporation Limited Annual Report 2020
ENVIRONMENTAL, SOCIAL AND GOVERNANCE REPORT Corporate Social Responsibility Report This report actively complies with the requirements of the The Company set up the Legal Department (Compliance ESG Reporting Guide of the Hong Kong Stock Exchange Management Department), as a separate unit in 2020, in relation to the reporting principles of “materiality”, to further improve the compliance management system “quantitative”, “balance” and “consistency”. Based on the with three lines of defence consisting of the business materiality principle, the Board of the Company determined department, compliance management department and the importance of ESG issues, and this report disclosed audit supervision department, and collaborated with the our communication with stakeholders, the identification parent company to formulate the Compliance Management process of the material issues and the materiality matrix. Action Program of China Telecommunications Corporation Based on the quantitative principle, the Company strived (2021-2023). The Company has issued the China Telecom to quantify its ESG performance indicators as much as Compliance Initiative for standardising the operation and possible. The statistical standards, methods, assumptions management behaviors of the corporate and its employees, and calculation tools, as well as the sources of conversion actively fostering the compliance culture, and promoting factors for quantifying the key performance indicators the realisation of “compliance in everyone, everything and are all disclosed in this report. Based on the balance every moment”. principle, this report strived to provide an unbiased picture of the Company’s ESG performance during the reporting In accordance with the Company Law of the People’s period and avoided selection, omissions or presentation Republic of China, Accounting Law of the People’s Republic formats that may inappropriately influence the decision of China, Contract Law of the People’s Republic of China, or judgment of the readers. Based on the consistency Cybersecurity Law of the People’s Republic of China, Anti-principle, the Company kept the statistical methods used Monopoly Law of the People’s Republic of China, Anti-for the data disclosed in this report consistent, and if there Unfair Competition Law of the People’s Republic of China, was any inconsistency, explanations were made. For Securities Law of the People’s Republic of China and Code details of compliance with the ESG Reporting Guide of of Corporate Governance for Listed Companies in China the Hong Kong Stock Exchange, please refer to the ESG published by the China Securities Regulatory Commission Reporting Guide Index in this report. and other laws and regulations and the regulatory requirements governing internal control of listed companies II. OPERATING WITH INTEGRITY in capital markets such as the United States and Hong AND IN COMPLIANCE WITH Kong, the Company established its Internal Control Manual LAWS to ensure that the Company’s operation and management is in compliance with laws and regulations, the assets are China Telecom governs the corporate in accordance with secured, and the financial reports and relevant information laws and regulations, persists in operating in compliance are accurate and complete. In 2020, the Company made with laws and integrity through abidance by relevant constant efforts in improving its Internal Control Manual laws and regulations and industry regulations. We have and authority list in accordance with relevant provisions of established an all-rounded and seamless compliance the laws and regulations and regulatory authorities, taking system featuring, among others, internal control, audit changes in business operations etc. into account. The supervision, anti-corruption and comprehensive risk Company has advanced the work of “smart finance”, “smart management. The Company has established a sound, legal affairs” and “smart audit”, and has exploited artificial long-term and effective communication mechanism in intelligence and other new technological means to improve order to regulate the disclosure of corporate information, its risk prevention capacity. No major violations occurred and is open to government supervision and public scrutiny. during the year. China Telecom Corporation Limited Annual Report 2020 093
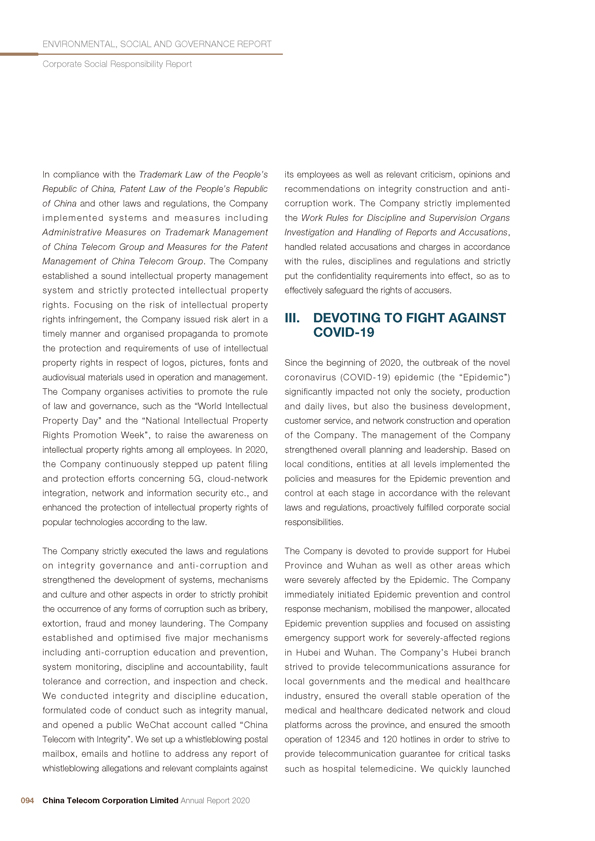
ENVIRONMENTAL, SOCIAL AND GOVERNANCE REPORT Corporate Social Responsibility Report In compliance with the Trademark Law of the People’s its employees as well as relevant criticism, opinions and Republic of China, Patent Law of the People’s Republic recommendations on integrity construction and anti-of China and other laws and regulations, the Company corruption work. The Company strictly implemented implemented systems and measures including the Work Rules for Discipline and Supervision Organs Administrative Measures on Trademark Management Investigation and Handling of Reports and Accusations, of China Telecom Group and Measures for the Patent handled related accusations and charges in accordance Management of China Telecom Group. The Company with the rules, disciplines and regulations and strictly established a sound intellectual property management put the confidentiality requirements into effect, so as to system and strictly protected intellectual property effectively safeguard the rights of accusers. rights. Focusing on the risk of intellectual property rights infringement, the Company issued risk alert in a III. DEVOTING TO FIGHT AGAINST timely manner and organised propaganda to promote COVID-19 the protection and requirements of use of intellectual property rights in respect of logos, pictures, fonts and Since the beginning of 2020, the outbreak of the novel audiovisual materials used in operation and management. coronavirus (COVID-19) epidemic (the “Epidemic”) The Company organises activities to promote the rule significantly impacted not only the society, production of law and governance, such as the “World Intellectual and daily lives, but also the business development, Property Day” and the “National Intellectual Property customer service, and network construction and operation Rights Promotion Week”, to raise the awareness on of the Company. The management of the Company intellectual property rights among all employees. In 2020, strengthened overall planning and leadership. Based on the Company continuously stepped up patent filing local conditions, entities at all levels implemented the and protection efforts concerning 5G, cloud-network policies and measures for the Epidemic prevention and integration, network and information security etc., and control at each stage in accordance with the relevant enhanced the protection of intellectual property rights of laws and regulations, proactively fulfilled corporate social popular technologies according to the law. responsibilities. The Company strictly executed the laws and regulations The Company is devoted to provide support for Hubei on integrity governance and anti-corruption and Province and Wuhan as well as other areas which strengthened the development of systems, mechanisms were severely affected by the Epidemic. The Company and culture and other aspects in order to strictly prohibit immediately initiated Epidemic prevention and control the occurrence of any forms of corruption such as bribery, response mechanism, mobilised the manpower, allocated extortion, fraud and money laundering. The Company Epidemic prevention supplies and focused on assisting established and optimised five major mechanisms emergency support work for severely-affected regions including anti-corruption education and prevention, in Hubei and Wuhan. The Company’s Hubei branch system monitoring, discipline and accountability, fault strived to provide telecommunications assurance for tolerance and correction, and inspection and check. local governments and the medical and healthcare We conducted integrity and discipline education, industry, ensured the overall stable operation of the formulated code of conduct such as integrity manual, medical and healthcare dedicated network and cloud and opened a public WeChat account called “China platforms across the province, and ensured the smooth Telecom with Integrity”. We set up a whistleblowing postal operation of 12345 and 120 hotlines in order to strive to mailbox, emails and hotline to address any report of provide telecommunication guarantee for critical tasks whistleblowing allegations and relevant complaints against such as hospital telemedicine. We quickly launched 094 China Telecom Corporation Limited Annual Report 2020
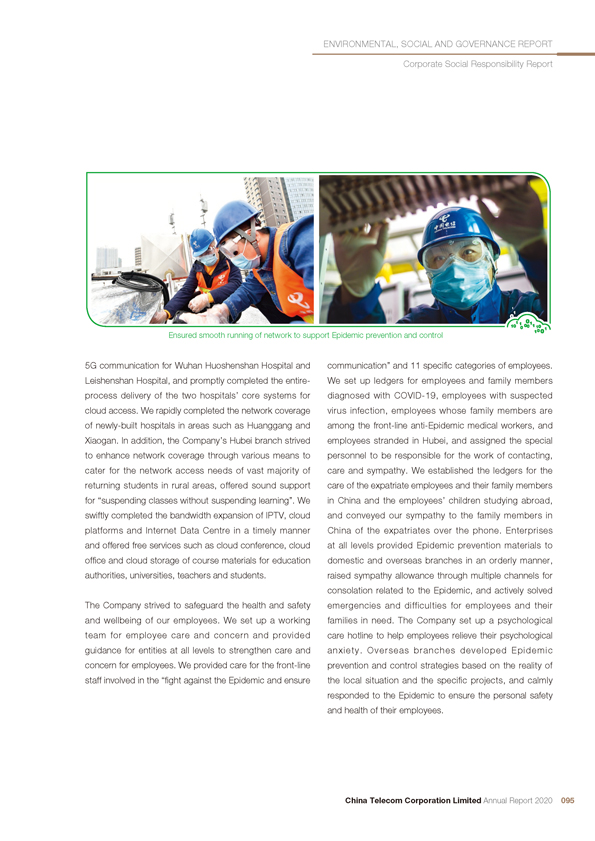
ENVIRONMENTAL, SOCIAL AND GOVERNANCE REPORT Corporate Social Responsibility Report Ensured smooth running of network to support Epidemic prevention and control 5G communication for Wuhan Huoshenshan Hospital and communication” and 11 specific categories of employees. Leishenshan Hospital, and promptly completed the entire- We set up ledgers for employees and family members process delivery of the two hospitals’ core systems for diagnosed with COVID-19, employees with suspected cloud access. We rapidly completed the network coverage virus infection, employees whose family members are of newly-built hospitals in areas such as Huanggang and among the front-line anti-Epidemic medical workers, and Xiaogan. In addition, the Company’s Hubei branch strived employees stranded in Hubei, and assigned the special to enhance network coverage through various means to personnel to be responsible for the work of contacting, cater for the network access needs of vast majority of care and sympathy. We established the ledgers for the returning students in rural areas, offered sound support care of the expatriate employees and their family members for “suspending classes without suspending learning”. We in China and the employees’ children studying abroad, swiftly completed the bandwidth expansion of IPTV, cloud and conveyed our sympathy to the family members in platforms and Internet Data Centre in a timely manner China of the expatriates over the phone. Enterprises and offered free services such as cloud conference, cloud at all levels provided Epidemic prevention materials to office and cloud storage of course materials for education domestic and overseas branches in an orderly manner, authorities, universities, teachers and students. raised sympathy allowance through multiple channels for consolation related to the Epidemic, and actively solved The Company strived to safeguard the health and safety emergencies and difficulties for employees and their and wellbeing of our employees. We set up a working families in need. The Company set up a psychological team for employee care and concern and provided care hotline to help employees relieve their psychological guidance for entities at all levels to strengthen care and anxiety. Overseas branches developed Epidemic concern for employees. We provided care for the front-line prevention and control strategies based on the reality of staff involved in the “fight against the Epidemic and ensure the local situation and the specific projects, and calmly responded to the Epidemic to ensure the personal safety and health of their employees. China Telecom Corporation Limited Annual Report 2020 095
ENVIRONMENTAL, SOCIAL AND GOVERNANCE REPORT Corporate Social Responsibility Report The Company made great efforts to help the society to campus recruitment for the year, signing contracts with resume work and production. Combining the needs of more than 7,000 fresh graduates, and won the praise of Epidemic prevention and control and the society’s new “Top 100 Best Employers in 2020” by Zhaopin and “2020 demand for informatisation services, we fully leveraged Chinese College Students’ Favorite Employers” by 51Job. advantages of cloud-network integration, provided a variety of informatisation applications and services The Company strived to provide excellent customer including e-Surfing Cloud, Cloud Conference, Cloud services. In response to the Epidemic, the Company Streaming, Cloud Classroom, Cloud Dam, e-Surfing promptly launched more than 20 service initiatives such Push-to-Talk, e-Surfing Webcam and e-Surfing Speaker, as non-termination of services, public service and welfare e-Surfing Monitoring Platform for Epidemic Prevention messages, quick activation for key assurance functions and long distance telemedicine counselling system, and and caller display name cards in a timely manner. We also promoted 5G informatisation applications such as 5G+VR, strengthened service management and enhanced online 5G+ thermal imaging temperature measurement/intelligent service capabilities through electronic channels. The disinfection vehicle, so as to help Epidemic prevention and customer service centre “Hotline 10000” implemented control and the resumption of work, production business a work-from-home policy and we steadily promoted the and school. The informatisation applications such as resumption of operation of physical stores on the basis of e-Surfing Monitoring Platform for Epidemic Prevention and implementing Epidemic prevention and control measures long distance telemedicine counselling system provided at differential regional and hierarchical levels, so as to by China Telecom have played a significant role in helping ensure customer services would not be interrupted and fight against the Epidemic, and have been highly praised customer perception is assured. We also strengthened by the society, and the 5G “cloud supervision” has network information security to protect users’ personal won widespread praise. In response to the call of the information. government, the Company was actively stabilising and expanding employment. The Company overfulfilled its Provided effective communications assurance during the Epidemic for hospitals and other key locations 096 China Telecom Corporation Limited Annual Report 2020
ENVIRONMENTAL, SOCIAL AND GOVERNANCE REPORT Corporate Social Responsibility Report The Company commended the anti-Epidemic frontrunners Building new type of information infrastructure of and touching deeds of fighting the Epidemic. In the fight cloud-network integration against the Epidemic, cadres and employees were on In order to fully implement the new development the front-lines making due contributions to ensuring philosophy, China Telecom carried out co-building and the smooth operation of the national economy, social co-sharing of 5G network nationwide with China Unicom, stability and Epidemic prevention and control, leading to accelerated the construction of 5G network capabilities the emergence of a large number of advanced groups with the number of 5G base stations in use exceeding who have overcome difficulties, made innovations and 380,000, achieved continuous outdoor coverage of 343 remarkable achievements, as well as advanced individuals cities in China and completed the world’s largest 5G co-who have the courage to take on responsibility, fear no building and sharing network. Adhering to SA as the lead, difficulties and sacrifice. China Telecom received one the Company promoted the maturity of the SA industry national group commendation and two national individual commendations at Awards Ceremony for COVID-19 chain, took the lead in formulating and releasing the Fighters. The Company commended 24 groups and 34 “5G SA Implementation Guidelines” all over the world, promoted the integrated development of 5G technology, individuals for their outstanding performance in Epidemic and pioneered in building the world’s largest 5G SA prevention and control. network and commenced the commercial launch. With the continuous promotion of fibre network construction, the The Company made due efforts to ensure effective routine Company has practically and primarily achieved optical Epidemic prevention and control. Thus far, the COVID-19 network coverage in 21 provinces (autonomous regions Epidemic is still spreading around the world, with cases and municipalities directly under the central government) and local outbreaks in China from time to time. In in southern China, and deployed gigabit networks in response to the Epidemic, the Company conscientiously implements the requirements of governments at all 280 cities nationwide. In accelerating the pace of IDC levels, coordinates Epidemic prevention and control in construction, the Company added 55,000 cabinets and the domestic and overseas, and resolutely “prevent the 35,000 cloud resource pool servers. The Company has coronavirus from re-entering the country to cause a new completed the connection of all e-Surfing cloud resource Epidemic”. The Company has coordinated the prevention pools with CN2-DCI and government-enterprise OTN and control of the Epidemic as well as the economic networks, and established the shortest optical cable and and social development to support the development of transmission system between neighboring provinces and various sectors and industries with high-quality integrated cities in the Beijing-Tianjin-Hebei region and Yangtze River information services. Delta region. The average delay of ChinaNet decreased by 2.2ms compared with that at the end of 2019. Among IV. PROVIDING HIGH QUALITY them, the delay between neighboring provinces and cities NETWORK ASSURANCE in the Beijing-Tianjin-Hebei region, Yangtze River Delta region and other regions dropped to less than 3ms, so China Telecom promoted the new infrastructure as to provide ubiquitous, high-speed and low-delay basic construction including 5G, data center and Internet network guarantee for all kinds of customers access to of Things, promoted universal services, maintained the cloud and inter-cloud business. The Company initiated network information security and assured emergency the construction of Mobile Edge Computing (MEC) and communications in order to provide high quality network promoted the “Cloud Edge” collaboration. assurance for customers and economic and social development. China Telecom Corporation Limited Annual Report 2020 097
ENVIRONMENTAL, SOCIAL AND GOVERNANCE REPORT Corporate Social Responsibility Report Promoting universal services actively cooperate with government authorities to combat The Company continuously promotes the construction of cybercrimes and decontaminate the cyberspace. communication networks in rural areas. The Company has set up local services points for rural villages adapting to During the year, the Company laid a solid security local conditions and proactively promoted informatisation foundation for cloud-network integration, built on security applications and e-commerce development in rural areas guarantee capabilities, expanded security products and to promote the prosperity of rural villages. The Company services, systematically sorted out more than 60 key vigorously carries out network poverty alleviation by security products and launched a batch of new products accelerating the promotion of universal service projects such as trusted call, security guarder, privacy sentry and in remote and impoverished villages and improving the 5G encrypted call. We promoted the security converged broadband access coverage in those areas. During cloud, aligned e-Surfing Cloud and Group IT Cloud with the year, the fifth batch of universal services and the the national standards for network security protection, construction of around 7,000 4G base stations were and realised the security capability coverage of Content completed; The Company has fulfilled the industrial goal Delivery Network (CDN) edge nodes. We advanced the of providing broadband access to more than 90% of the synchronous development of 5G and security, accelerated registered poverty-stricken villages in the “Three Regions the cultivation of security capabilities, and acquired the and Three Prefectures” (the “Three Regions” refer to the ability to export security capabilities on demand. The Tibet Autonomous Region, four prefectures in southern Company improved the network information security Xinjiang Uyghur Autonomous Region and Tibetan- management and security capabilities, established inhabited regions in Qinghai, Sichuan, Yunnan and Gansu Chief Network Security Officer in the headquarters and provinces, while the “Three Prefectures” refer to Linxia subordinate units, and initially established an expert Autonomous Prefecture in Gansu Province, Liangshan technical team aimed to maintain the network information Autonomous Prefecture in Sichuan Province and Nujiang security. The Company strengthened the real-time Autonomous Prefecture in Yunnan Province) as set by the management of the Internet exposure, actively carried Ministry of Industry and Information Technology ahead of out special actions against pornography and illegal schedule. publications, and continued to step up the establishment of the two-level dispatch and disposal system at the Maintaining network information security headquarters and provincial branches, in order to The Company complies with the Cybersecurity Law promptly respond and deal with illegal and undesirable of the People’s Republic of China and other laws and information. The Company strengthened the protection of regulatory requirements, conscientiously implements the personal data, and carried on the special governance and requirements of the Ministry of Industry and Information regular inspection of the illegal collection and use of users’ Technology, Ministry of Public Security and other personal data by APP. authorities on network and information security. We 098 China Telecom Corporation Limited Annual Report 2020

ENVIRONMENTAL, SOCIAL AND GOVERNANCE REPORT Corporate Social Responsibility Report 5G emergency communications assurance Assuring emergency communications The Company is truly committed to the mission of In accordance with the Code of Practice for Emergency providing safe and smooth communications assurance Communication Support Response of China Telecom and and is devoted to fight against a number of severe natural the Plan Template of Organising Communication Support disasters such as earthquakes, typhoons, floods and for Major Disasters of Provincial Companies of China landslides and to safeguard important events. During Telecom, the Company developed emergency plans for the year, we made every effort to ensure emergency handling natural disasters, organised emergency drills communications in Hubei, Wuhan and other areas most and pre-deployed emergency equipment, anti-disaster affected by the Epidemic, and completed flood and materials and emergency repair teams based on climate typhoon-relief and other disaster relief in the provinces conditions and the severity of the disaster, so as to ensure such as Hubei, Jiangxi, Anhui, Yunnan, Chongqing, that emergency support can be provided swiftly, timely Sichuan and Zhejiang. We also successfully provided and efficiently in case of disasters. Enterprises at all levels telecommunications assurance for important events established leading groups for dealing with disastrous including the 3rd China International Import Expo, the weather and major events, and, by graded responsibilities, 128th China Import and Export Fair (Online Canton Fair), identified the responsible persons and contacts for World Internet Conference and 5G+ Industrial Internet assuring communications for flood control and drought- Conference. During the year, more than 146,000 person-relief efforts. Equipment and supplies were properly times, 55,000 vehicle-times and 29,000 set-times of prepared, and regularly inspected and maintained. Taking communication equipment were deployed for emergency the support demand within the entire network, solid efforts communications. were made in technical support, material maintenance and inspection, resource consolidation, circuit testing and other supports to ensure that the portable emergency communication devices such as satellite phones in all provinces could be available at any time. China Telecom Corporation Limited Annual Report 2020 099
ENVIRONMENTAL, SOCIAL AND GOVERNANCE REPORT Corporate Social Responsibility Report V. PROVIDING HEARTFELT perfects the users’ personal information protection SERVICES TO CUSTOMERS management system, and strengthens the protection of users’ personal information. In 2020, the Company China Telecom has a profound understanding of the thoroughly implemented the Administrative Measures customers’ needs. While being dedicated to providing of China Telecom on Security Management of Personal customers with various communication and information Information of Users and the Administrative Measures application businesses, the Company focuses on of China Telecom on Information Security Management protecting customer rights in accordance with the law, of Users and other systems and supervised enterprises continuously strengthens service awareness, enhances at all levels to implement the division of responsibility on the construction of service capability and comprehensively protection of users’ personal information. We regulated fosters a brand image of “Trustworthy China Telecom”. behaviours of collecting, storing, transmitting, using and destroying user information and strictly controlled Protecting the rights of customers in accordance the authorisation for sales staff to access and process with laws customers account information in order to “collect The Company strictly conforms to the laws and regulations information for a proper purpose, store and use the regarding consumer rights and interests such as Law of information properly, record the use of information, the People’s Republic of China on Protection of Consumer and investigate the abuse of power”. We thoroughly Rights and Interests and Advertising Law of the People’s implemented the systems including the Rules for the Republic of China, dedicates to provide products and Collection and Use of Personal Information for APP of services in compliance with laws and regulations, performs China Telecom and the Administrative Measures for the compliance checks on advertisement campaigns and Compliance Management on the Collection and Use of continuously standardises business tariff management. Personal Information of APP for our Customers to tighten The Company listens to subscribers’ opinions via channels up compliance management concerning the collection like “Hotline 10000”, online and physical stores, etc., and and use of personal information by APP and continuously continuously carries out events such as “Customer Rights improve the compliance level of APP. Taking a solid and Day”, “General Manager’s Service Day” and “Listen to holistic governance approach, the Company kept a close Hotline 10000”. eye on the bottom line problems infringing users’ rights, such as telecommunication fraud, crank calls and junk The Company strictly complies with the Cybersecurity short messages. Compared to the industry average, the Law of the People’s Republic of China and other laws Company had a relatively low number of crank calls and and regulatory requirements, implements the relevant junk short messages reported by the Ministry of Industry regulatory requirements of the government, continuously and Information Technology. 100 China Telecom Corporation Limited Annual Report 2020
ENVIRONMENTAL, SOCIAL AND GOVERNANCE REPORT Corporate Social Responsibility Report In response to customers’ feedback on services, the reflected in customer satisfaction surveys, customer Company made serious analysis and research and complaints, malfunction and complaints throughout actively promoted problem solving. In each quarter the year, and implemented policies and promoted the of 2020, a detailed study was conducted on service- rectification of broadband network in different provinces, related complaints that affected user perception, and in- such as home network, metropolitan and backbone depth analysis was carried out on typical service cases, network, content access and international network and rectification was conducted based on thematic studies other links of broadband network. As regards mobile on key and difficult problems reported by customers, network, the Company has carried out improvement and such as remote service, cloud-network support and upgrading actions for the benchmarking experience of outbound marketing. The Company carried on tracking critical scenes in key areas and communities with poor and analysing the subscribers’ complaints in the process communication quality to enhance user perception and of mobile number portability service and made timely experience, and the complaint rate of 5G subscribers has standardisation and rectification in hoping for keeping decreased significantly compared with the same period the amount and rate of complaints of mobile number last year. As regards cloud-network key perception, portability service at a low level in the industry. the Company has promoted standard optimisation, perception evaluation and targeted improvement of Enhancing services capabilities service capabilities, and increased the delivery satisfaction Insisting on the customer-oriented principle, the rate of government and enterprise customers to over Company continued to enhance service quality. In 2020, 93%. the evaluation system of “whether service is good or not, subscribers have the final say” was established. Adhering to the principle of “wherever the subscriber The Company applied indicators such as subscribers is, the service is”, the Company continued to promote satisfaction, product net promoter score and contact the digital transformation of services and improve the service satisfaction rate, and regarded customer smart service capabilities. During the year, the Company reputation as a service evaluation criterion to promote the deployed and promoted the “home customer service” improvement of service quality. The Company established mode, taking the lead in launching remote counter video a sound customer perception experience and evaluation service by innovative means, to ensure that customers mechanism to recognise problems in network, products could process services easily and without leaving and services from the perspective of subscribers. home. The Company’s intelligent voice navigation has Focusing on key products such as 5G and Smart Family, achieved full coverage in 31 provinces, accounting for and aiming at major issues such as broadband installation 54% of intelligent services. The Company established the and maintenance, online channel services, the Company operation system of new media customer service matrix, performed 19 intensive experiences at the headquarters with 167 million followers of new media accounts such as and more than 300 experiences at provincial branches, WeChat, Weibo and Douyin, and 200 million self-service aimed at in-depth analysis of service shortcomings volume per month, and was awarded the “2020 Most and clarified optimisation and improvement measures Influential Second-tier New Media Account of State-owned by brainstorming. In terms of broadband network, the Enterprises” by the State-owned Assets Supervision and Company has closely tracked and analysed the problems Administration Commission of the State Council. China Telecom Corporation Limited Annual Report 2020 101
ENVIRONMENTAL, SOCIAL AND GOVERNANCE REPORT Corporate Social Responsibility Report VI. CARING FOR EMPLOYEES clearly determines the employment form of each role, standardises the designated agreements signed with China Telecom safeguards the interests of its employees agency workers, checks and supervises these dispatch in accordance with laws, attaches great importance to units and dispatch workers to sign employment contracts, building harmonious labour relations, supports labour and pays remuneration and social security insurances in a unions in carrying out their functions, encourages timely manner in order to protect the rights and interests employees to participate in the management and actively of contract or agency workers. The Company adheres helps employees to improve their capabilities, so that the to principles of gender equality and equal pay for equal Company and the employees can grow together. work, protects the privacy of employees in accordance with laws and implements the paid annual leave system. Safeguarding the rights of employees in compliance The Company prohibits child labour and forced labour in with laws accordance with laws. In 2020, no child labour or forced The Company strictly complies with and implements labour was found. The Company supports the labour the relevant laws and regulations regarding labour unions in carrying out their functions in accordance with and protection of the employees’ rights and interests laws, encourages employee participation in management including the Labour Law of the People’s Republic of and continuously establishes stable and harmonious China, the Labour Contract Law of the People’s Republic relationship with the employees. of China and the Trade Union Law of the People’s Republic of China, and protects the rights and interests Promoting employees’ development of employees with respect to labour rights, democracy The Company strengthens the development of rights and spiritual culture rights in accordance with management talent team. The Company actively takes the laws. The Company strictly implements the Notice measures to choose good cadres, allocate strong teams on Standardisation of Labour Management in Strict and gather talents, adheres to performance orientation Compliance with the Labour Contract Law of the People’s and grassroots orientation, lays emphasis on identifying Republic of China, improves labour management, and and selecting cadres in urgent, difficult, dangerous and conducts workforce employment in accordance with important tasks, and vigorously select and train excellent laws and regulations. The Company also ensures that young cadres. The Company continues to improve the all contract employees have their labour contracts management team structure at all levels to enhance the signed and their remunerations and social security vitality of the cadre talent team, organises specialised insurances paid in full and in a timely manner. The training courses for cadres, increases exchanges and job Company continually implements the Notice on Issues rotation among cadres, assists cadres in improving their concerning Labour Dispatch Management, improves the competence, strengthens oversight and management of business operation models and job role classification, cadres and promotes anti-corruption practices. 102 China Telecom Corporation Limited Annual Report 2020
ENVIRONMENTAL, SOCIAL AND GOVERNANCE REPORT Corporate Social Responsibility Report The Company strengthens the development of The Company strengthens employees’ training. In 2020, professional talent team, and actively introduces well- the Company continued to strengthen the development established specialists in cloud-network integration, 5G of internal trainers, more than 678 internal trainers at MEC, network information security, Internet finance, etc. the group level and more than 775 internal trainers on through the formulation of special policies. The Company probation at the group level were recruited and more formulates the Guiding Opinions on the Construction of than 210,000 hours of lectures were delivered by more Government and Enterprise Industry Expert Team to meet than 13,000 internal trainers at all levels. The Company the needs of the reform and development of government actively responded to the Epidemic, carried out online and enterprise industry business groups. The Company learning and training based on the Online College, and accelerates the construction of expert talent team for implemented well-targeted training courses to improve the industrial informatisation application, Big Data, AI and ability of employees at all levels and positions according cloud-network operation, and cultivates professional and to the training needs, so as to accurately empower high-level talent through the constant implementation frontline employees. More than 220,000 people studied of programs such as “Spark Program” and “Prairie Fire in the Online College and the average learning time per Program”. In line with the development needs of overseas employee exceeded 50 hours. business, the Company cultivates international talents to support Philippine Mobile Communication Operation and The Company actively facilitates employees to develop other relevant projects. skills and increase their values. The Company makes consistent efforts to build innovation workshop and The Company strengthens the construction of front-line vigorously encourages employees in job innovation. skilled talents team. Taking into account the needs of the Within the year, 29 group level demonstration innovation grassroots, the Company launches a series of practical workshops were established and 35 innovation training programs, such as “comprehensively strengthen workshops at and above the group level were rewarded. the training of cloud-network integration talents at the By the end of the year, the Company had established a prefectural and municipal levels”, and vigorously conducts total of more than 1,300 innovation workshops of various training of skilled talents to empower front-line employees. types, including 5 national-level Outstanding Innovation The Company revises the administrative measures of skill Workshops for the Model Workers and Craftsman, 4 certification and organises 41 kinds of skill certification and industry-level innovation workshops, and more than 150 2 professional examinations, covering more than 100,000 innovation workshops named by provincial and prefectural person-times, and carries out tests for Smart Family labour unions. The Company won more than 700 national engineers, service specialists and 5G specialists, covering and provincial achievement awards, and applied for nearly more than 470,000 person-times. 1,000 invention patents and utility model patents. Based on the corporate strategies and business development, the Company organised and launched 15 competition activities to promote production and transformation through competition, sourced innovative talents, and promoted the rapid replication and implementation of successful projects. China Telecom Corporation Limited Annual Report 2020 103
ENVIRONMENTAL, SOCIAL AND GOVERNANCE REPORT Corporate Social Responsibility Report The Company vigorously promotes and encourages and emergency prevention techniques. The Company the spirit of model workers. In 2020, the Company won strengthened the safety management of engineering 282 national, ministerial and provincial-level honors of a projects, strictly implemented licences obtaining system general and specialised nature, including 88 national-level for special operation employees, perfected the accidents honors and 194 ministerial and provincial-level honors. emergency drill and strengthened emergency drills. In 27 employees won the honorary title of “National Model 2020, there was no occurrence of severe work-related Worker” in 2020, setting a record high and fully attesting casualties and accidents. to the high recognition of China Telecom employees by government at all levels and the society as a whole. The The Company attaches great importance to occupational Company publicises the deeds of model workers and tells health and safety management of its employees and the stories of model workers in an all-round way through formulated the Interim Provisions on “Simultaneous multiple channels, showing the elegant demeanour Execution of Three Aspects” of Occupational Safety, of China Telecom’s employees to the entire society, Hygiene Facilities and Main Construction Projects and motivating the majority of employees to vigorously and the Interim Provisions on Personal Protective promote the spirit of model workers. Equipment for Employees, organising supervision and inspections on the work sites of our employees regularly, Enhancing production safety and health and safety supervising the design and installation units to design management and install in accordance with the standards including The Company conscientiously and strictly implements for indoor lighting, noise, temperature and humidity the Work Safety Law of the People’s Republic of and continuously improving the workplace environment China, coordinates the prevention and control of the and work conditions, thus effectively eliminating the Epidemic and production and work safety during occurrences of occupational illness. The Company the resumption of production, fully fulfills the core conducts on-site inspections from time to time, urges responsibilities for corporate safety production, develops units to allocate necessary protective equipment for sound accountability systems, implements safety workers in accordance with the relevant requirements and responsibilities at all levels, strictly implements safety standards and supervises workers to wear and use the production assessment and punishment system and protective equipment properly. The Company attaches continually solidifies the foundation of safety production great importance to the physical and mental health of management. The Company continually carries out employees. Every year, the Company provides free supervision and check on the safety production of the medical examinations for all employees. The Company units and professional categories, and prevents safety continuously conducts counselling activities concerning risks by class and level, so as to timely eliminate hazards. mental health of the employees and assistance work, and The Company widely promotes training and publicity of proactively helps the employees reduce their stress and production safety regulations and safety knowledge and pressures. persistently increases the employees’ awareness on safety 104 China Telecom Corporation Limited Annual Report 2020
ENVIRONMENTAL, SOCIAL AND GOVERNANCE REPORT Corporate Social Responsibility Report Caring for employees’ well-being VII. PRACTICING GREEN The Company perfects the closed-loop management DEVELOPMENT mechanism from gathering, analysing, processing and giving feedback to understand employees’ needs and China Telecom complies with the Environmental Protection establishes communication channels such as seminars, Law of the People’s Republic of China, the Energy surveys, visiting employees’ family, frontline visits, face-to- Conservation Law of the People’s Republic of China face communication, reception visits, handling incoming and other laws and regulations related to environmental mail or email, striving to enhance communication and protection, practises the concept of green development to thoroughly understand the thoughts, working and and proactively devotes itself to the establishment of living conditions of employees as well as the hot topics ecological civilisation. The Company endeavours to and problems that the employees most care about. build a green network, pushes forward green operation, Enterprises at all levels actively helped the employees sets up environmental indicators, analyses and releases solve practical problems or difficulties through regularising collected performance data on a regular basis, proactively visits, responding to hot issues, helping employees in need communicates with the society of its environmental and other measures. We provided convenient services protection actions and effectiveness and willingly opens to employees and strengthened our care for outstanding itself to public scrutiny. The Company carried out model workers, young employees and outsourced publicity activities of energy conservation and emission employees. During the year, the Company tracked and reduction in various forms to enhance the awareness guided all 110 grassroots units at an elevation of 3,500 and consciousness of energy conservation and emission meters or above in five provinces including Tibet to reduction of its employees and the public. There was no construct oxygen supply facilities, improving the working violation of environmental protection laws and regulations and living conditions of employees in high altitude areas. as well as no incident having a material impact on the The Company continually optimised the operation of “Four- environment caused by the Company during the year. Smalls”, namely small canteens, small bathrooms, small washrooms and small activity rooms, in order to improve In response to the national requirements of “reaching a service ability and enrich service contents in the catering peak on carbon dioxide emissions and carbon neutrality”, quality, working environment, activity conditions, quality the Company implements the dual control strategy of of life and other aspects. The Company continually built energy consumption and puts total energy consumption infant rooms according to the special needs of female and energy intensity under strict control. In the future, the employees, organised cultural and sports activities in Company will accelerate the pace of adjusting the energy which the employees were interested, assisting employees use structure, increase the use proportion of clean energy, in achieving work-life balance and increasing their well- control the comprehensive energy consumption and the being. comprehensive energy consumption per unit information flow, in order to ensure the continuous decline of the comprehensive energy consumption per unit information flow, and strive to achieve the carbon emission peak by 2030 and carbon neutrality by 2060. China Telecom Corporation Limited Annual Report 2020 105
ENVIRONMENTAL, SOCIAL AND GOVERNANCE REPORT Corporate Social Responsibility Report Promoting energy conservation and emission In 2020, against the backdrop of vigorous development reduction of “new infrastructure” and the rapid construction of The Company implemented measures such as the 5G networks and with “dual control” on total energy Administrative Measures of China Telecom on Energy consumption and energy consumption intensity as the Conservation and Emission Reduction. Through means basic requirement, the company worked out a rolling like rules and regulations, work plans, work deployment, plan for energy conservation and emission reduction communication and trainings, assessment and evaluation, for the next three years to support the coordinated energy saving promotion etc., the Company applies energy development of various energy conservation and emission conservation and emission reduction requirements to link reduction tasks. The Company refined the evaluation, through various operational activities such as network reward and punishment system, strictly controlled the planning, procurement, construction, operation and office growth of total energy consumption and the PUE (power administration. The Company strengthened its efforts usage effectiveness) value of large– and super-large in monitoring measurements on energy consumption, data centers. While ensuring the orderly development organised training and exchanges on energy conservation of energy conservation and emission reduction using and emission reduction, constantly raised the professional its self-owned special funds, the Company actively level of grassroots personnel, and continued to promote introduced social capital and technology to realise the innovation in energy conservation and emission reduction technical transformation through the continuous use of management. The Company insisted on preferring the use the energy management contracting mode. The Company of energy-efficient and environmental-friendly technology vigorously promoted the energy-saving experience and equipment, actively carried out research and and best practices for intelligent shutdown technology application of new technologies for energy conservation of large 4G base stations, and improved the energy and emission reduction and applied energy-saving consumption efficiency of 4G wireless base stations, in technologies in the facilities of machine rooms, base order to actively explore energy-saving measures for 5G stations and data centers, extended the coverage of the base stations. The Company made constant efforts in energy-saving technological application and promoted the withdrawing inefficient equipment and machine room from upgrade, transformation and withdrawal of old and high the network, promoting the configuration optimisation of energy-consuming equipment. The Company endeavours basic supporting facilities of machine room, eliminating to reduce energy consumptions of all kinds as well as redundancy and reducing allocations, so as to minimise greenhouse gas emission. power consumption and improve power efficiency. In 2020, the unit energy consumption per information flow was 4.61 kgce/TB, representing a decrease of 6.1% over last year. 106 China Telecom Corporation Limited Annual Report 2020
ENVIRONMENTAL, SOCIAL AND GOVERNANCE REPORT Corporate Social Responsibility Report Conservation of natural resources The Company enhances the recycling, disposal and The Company promotes water conservation, strives to utilisation of waste and used materials in order to conserve reduce water consumption per unit operating revenue, resources as much as possible and reduce environmental actively promotes and advocates water conservation by pollution. The Company strictly follows the Law on the posting reminders regarding water conservation near Prevention and Control of Environment Pollution Caused water facilities and appliances. The Company continually by Solid Wastes of the People’s Republic of China and strengthens the management on water usage, carries other laws and regulations regarding waste disposal and out sewage disposal and treatment, promotes the reuse utilisation and carries out waste disposal in accordance of water, actively uses reclaimed water as an alternative with regulatory requirements. The Company implemented source of water in place of tap water while meeting the the Administrative Measures of China Telecom on Reverse requirements on use of water, promotes and popularise Logistics and the Administrative Measures of China the use of water-saving appliances and performs regular Telecom on Waste and Idle Recycling and Disposal, checks and repairs on each part of the water supply specified the guidelines, division of responsibilities and system to prevent occurrences of water leakage and management of the recycling and disposal of waste water wastage. In 2020, the total water consumption materials and the qualifications of recyclers, standardised decreased by 5.66 million tons over last year, representing the forms and procedures of disposal, and refined the a decrease of 13.6% compared to last year while the approval authority and process of disposal decisions to water consumption per unit operating revenue decreased effectively prevent disposal risks. The Company formulated by 17.5% over last year. the incentive policy for cleaning up idle materials which specified the incentive standards, and encouraged all The Company encourages paper saving by actively levels of enterprises to actively dispose, recycle and promoting reduction of paper use in operation and office utilise the waste and used materials based on actual facilities sites. The Company promotes measurements circumstances and relevant regulatory requirements. In on its paper use. The amount of paper used in 2020 2020, the Company continually enhanced the professional was approximately 5,000 tons. The Company, from management of waste, promoted the recycling, utilisation the perspectives of technology and regulations, actively and harmless disposal of such waste and old materials encourages paper saving and reduces paper use. such as batteries, copper cable and devices. Since We continually promoted electronic accounting files traditional lead-acid batteries contain large amounts of management, VAT electronic invoice, e-reimbursement heavy metal, waste acid, waste alkali and other electrolyte and filing of e-invoice and paperless operation, and solutions, the batteries will pollute the environment if promoted automatic process of tax declaration in order to handled inappropriately. The Company, on the one hand, reduce the use of paper. conducted overall on-site inspection of environmental protection practices of the battery suppliers, and China Telecom Corporation Limited Annual Report 2020 107
ENVIRONMENTAL, SOCIAL AND GOVERNANCE REPORT Corporate Social Responsibility Report continually purchased green and energy-saving products In the area of construction impact, areas such as mineral such as lithium iron phosphate batteries; and on the other reserves, forest, grasslands, wildlife habitats, natural and hand, the Company established a management system cultural relics, natural reserves and scenery areas are for battery recycling and disposal to prevent pollution to intentionally avoided when conducting routing roll-out the environment. The Company arranged waste copper deployment for fibre cables, so as to avoid changing the cables to third parties for recycling and disposal. The surrounding environment as much as possible. Company implemented wireline terminals closed-loop management and strengthened the recycling and reuse In the area of electromagnetic radiation, the Company of equipment through measures such as refurbishment monitors and assesses the electromagnetic radiation and cross provincial re-allocation, etc. Waste and used around the base station, enhances communication with materials without recoverable value were properly the community, opens itself to public scrutiny, strictly disposed of in strict accordance with national regulations controls the quality of network equipment by imposing after taking full account of the environmental impact. In controls from the source and actively takes advanced 2020, the Company recycled and disposed of various technical means to refine the layout of base station, types of waste and used materials over 90,000 tons. ensuring the emission standard is stricter than the national emission standards. Emphasising environmental protection in engineering construction Promoting co-building and co-sharing of communication The Company has taken proactive environmental protection infrastructure measures regarding issues in telecommunications The Company earnestly implemented the implementation engineering construction responding to concerns measures of promotion of co-building and co-sharing of the government and the public, such as farmland of telecommunications infrastructure promulgated by protection, equipment pollution, construction impact and the Ministry of Industry and Information Technology and electromagnetic radiation to ensure compliance with the the State-owned Assets Supervision and Administration government’s regulatory requirements and to actively Commission of the State Council. We closely worked with communicate with the public. other telecommunications operators and China Tower Corporation Limited and actively promoted the co-building In the area of farmland protection, the existing residence and co-sharing of communication infrastructures such and barren land will be preferred in site selection for base as base stations, channels and pole lines, to effectively stations, in order to minimise the occupation of additional reduce repeated construction in order to protect the farmland as much as possible. natural environment and landscape, and to reduce the land use, energy, and raw materials consumption. In In the area of equipment pollution, non-polluting 2020, while deepening the co-building and co-sharing equipment with no noise and no electromagnetic radiation of 5G networks with China Unicom, we fully leveraged and free of pollutants is preferred. the complementary advantages of both sides’ network resources, actively carried out the construction and sharing of 4G network, and opened about 170,000 base stations. In 2020, the Company provided more than 11,900 kilometres of co-shared pole line and more than 1,300 kilometres of co-shared pipeline. 108 China Telecom Corporation Limited Annual Report 2020
ENVIRONMENTAL, SOCIAL AND GOVERNANCE REPORT Corporate Social Responsibility Report VIII. PROMOTING RESPONSIBLE and evaluation of suppliers in procurement evaluation so as SUPPLY CHAIN to encourage the suppliers to improve their services and performance. The Company carried out the information The Company strictly follows the Bidding Law of the sharing mechanism of illegal and discredited suppliers People’s Republic of China and procurement-related with major domestic basic telecommunications operators, laws and regulations, implemented regulations such and implemented the newly formulated Interim Provisions as the Administrative Measures of China Telecom on on Supplier Misconduct of China Telecom and Interim Procurement, consistently adhered to supply chain Provisions on Grading Management of Procurement management concepts focusing on value-added, Suppliers of China Telecom. For outstanding suppliers, transparent and green procurement, committed to the Company adopted incentive measures such as a trusted relationship with suppliers to achieve win- publishing lists, increasing the upfront payment proportion win situations and actively communicated with and and prioritising payment. For unqualified suppliers, the encouraged its suppliers to fulfill social responsibilities Company took disciplinary measures such as urging together. improvement and restricting procurement. The Company took disciplinary measures such as degradation, In 2020, the Company strictly complied with requirements adjustment of procurement amount, restrictions on of regulations such as the Administrative Measures procurement, and ban on procurement against suppliers of China Telecom on the Procurement Bidding and with bad behaviors. Through the listing of management Tendering, the Administrative Measures of China Telecom methods, the objectification of identification standards on Tendering Agency and Administrative Measures of and the openness of processing rules, the Company has China Telecom on Tender Evaluation Expert and the Pool gradually built a supplier management system integrating of Tender Evaluation Experts, and the Regulations on positive incentive and negative punishment in order for the Participation of Suppliers in Procurement Activities of enhancing suppliers’ performance awareness of services, China Telecom, and constantly promotes open bidding and promoting suppliers’ good faith in cooperation. and transparent procurement. The Company ensured bidding process for 100% of the projects which it ought The Company actively encourages the supply chain to to have used bidding process for as required by law. jointly respond to climate change, constantly promotes The Company implemented the requirements such the application of green procurement indicators in the as the Administrative Measures of China Telecom on procurement process and preferentially purchases Quality of the Purchased Materials and the Administrative resource saving and environmentally friendly products. Measures of China Telecom on Inspection for the We included environmental impact factors into the Quality of the Purchased Materials in order to improve procurement evaluation and adopted environmental the mechanism for selecting and reviewing suppliers assessment standards such as ISO14000 Environmental including pre-purchase inspections by reviewing Management System Certification, Environmental Impact suppliers’ qualifications, conducting site visits and product Assessment Report issued by the government and evaluation reviews, and post-purchase inspections by the “Green Factory” list of the Ministry of Industry and testing the quality of the products upon arrival, quality Information Technology, so as to identify and control checks, post-purchase review of suppliers and day-to- the products that may pose environmental risks during day evaluation. The Company continuously enhanced the the production process and encourage suppliers to application of procurement data from quality inspection enhance their awareness and capability of environmental China Telecom Corporation Limited Annual Report 2020 109
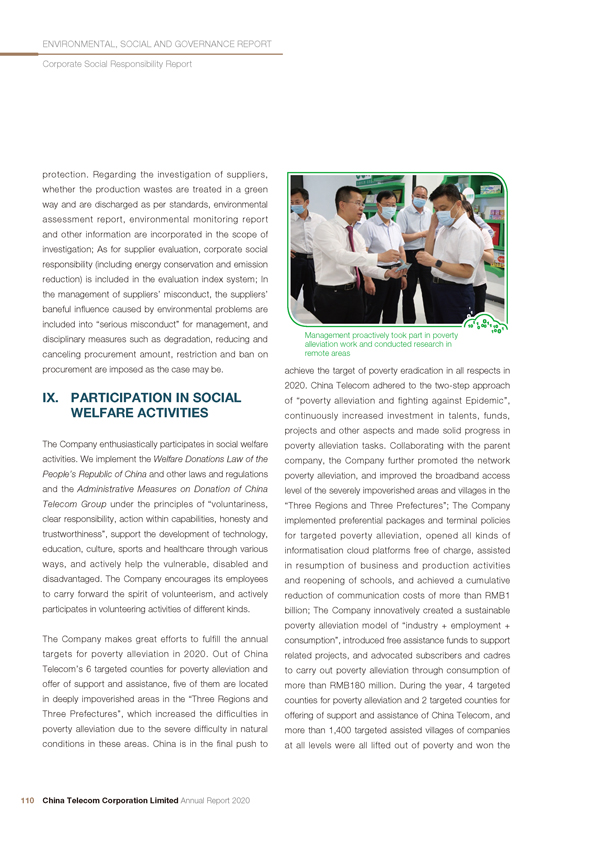
ENVIRONMENTAL, SOCIAL AND GOVERNANCE REPORT Corporate Social Responsibility Report protection. Regarding the investigation of suppliers, whether the production wastes are treated in a green way and are discharged as per standards, environmental assessment report, environmental monitoring report and other information are incorporated in the scope of investigation; As for supplier evaluation, corporate social responsibility (including energy conservation and emission reduction) is included in the evaluation index system; In the management of suppliers’ misconduct, the suppliers’ baneful influence caused by environmental problems are included into “serious misconduct” for management, and disciplinary measures such as degradation, reducing and Management proactively took part in poverty alleviation work and conducted research in canceling procurement amount, restriction and ban on remote areas procurement are imposed as the case may be. achieve the target of poverty eradication in all respects in 2020. China Telecom adhered to the two-step approach IX. PARTICIPATION IN SOCIAL of “poverty alleviation and fighting against Epidemic”, WELFARE ACTIVITIES continuously increased investment in talents, funds, projects and other aspects and made solid progress in The Company enthusiastically participates in social welfare poverty alleviation tasks. Collaborating with the parent activities. We implement the Welfare Donations Law of the company, the Company further promoted the network People’s Republic of China and other laws and regulations poverty alleviation, and improved the broadband access and the Administrative Measures on Donation of China level of the severely impoverished areas and villages in the Telecom Group under the principles of “voluntariness, “Three Regions and Three Prefectures”; The Company clear responsibility, action within capabilities, honesty and implemented preferential packages and terminal policies trustworthiness”, support the development of technology, for targeted poverty alleviation, opened all kinds of education, culture, sports and healthcare through various informatisation cloud platforms free of charge, assisted ways, and actively help the vulnerable, disabled and in resumption of business and production activities disadvantaged. The Company encourages its employees and reopening of schools, and achieved a cumulative to carry forward the spirit of volunteerism, and actively reduction of communication costs of more than RMB1 participates in volunteering activities of different kinds. billion; The Company innovatively created a sustainable poverty alleviation model of “industry + employment + The Company makes great efforts to fulfill the annual consumption”, introduced free assistance funds to support targets for poverty alleviation in 2020. Out of China related projects, and advocated subscribers and cadres Telecom’s 6 targeted counties for poverty alleviation and to carry out poverty alleviation through consumption of offer of support and assistance, five of them are located more than RMB180 million. During the year, 4 targeted in deeply impoverished areas in the “Three Regions and counties for poverty alleviation and 2 targeted counties for Three Prefectures”, which increased the difficulties in offering of support and assistance of China Telecom, and poverty alleviation due to the severe difficulty in natural more than 1,400 targeted assisted villages of companies conditions in these areas. China is in the final push to at all levels were all lifted out of poverty and won the 110 China Telecom Corporation Limited Annual Report 2020
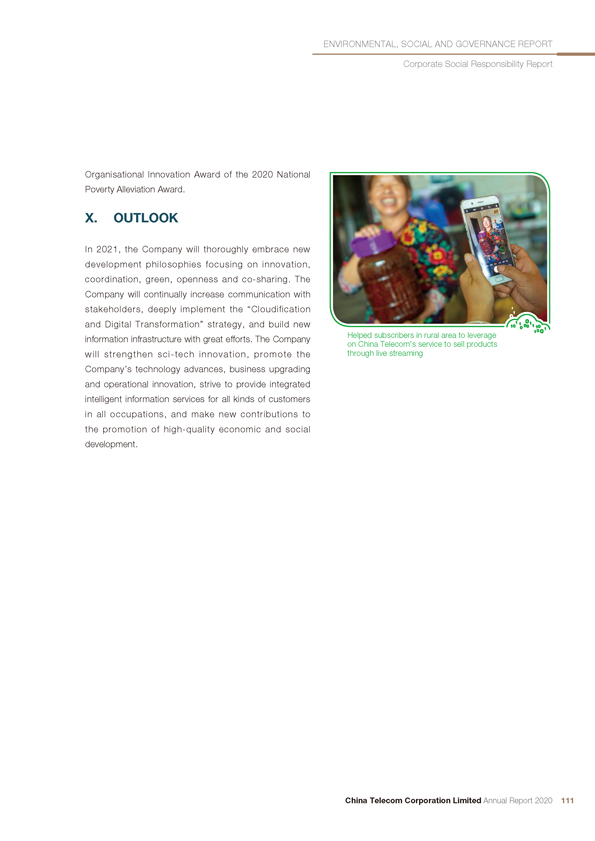
ENVIRONMENTAL, SOCIAL AND GOVERNANCE REPORT Corporate Social Responsibility Report Organisational Innovation Award of the 2020 National Poverty Alleviation Award. X. OUTLOOK In 2021, the Company will thoroughly embrace new development philosophies focusing on innovation, coordination, green, openness and co-sharing. The Company will continually increase communication with stakeholders, deeply implement the “Cloudification and Digital Transformation” strategy, and build new information infrastructure with great efforts. The Company Helped subscribers in rural area to leverage on China Telecom’s service to sell products will strengthen sci-tech innovation, promote the through live streaming Company’s technology advances, business upgrading and operational innovation, strive to provide integrated intelligent information services for all kinds of customers in all occupations, and make new contributions to the promotion of high-quality economic and social development. China Telecom Corporation Limited Annual Report 2020 111
ENVIRONMENTAL, SOCIAL AND GOVERNANCE REPORT Human Resources Development Report In 2020, our work on human resources has closely and enterprise business. The Company adopted fixed-centered around the Company’s requirements for high- term and contractual appointments at the management quality development. We coordinated and promoted level in reform project companies such as E-surfing Pay the optimisation of leadership structure, team building Co., Ltd and system integration company, and actively and the development of human resources mechanism, implemented the three-year action plan for reform of strengthened fundamental management and implemented state-owned enterprises. the project of “Strengthening the Enterprise through Talents” in order to continuously improve human CONTINUOUSLY PROMOTE resources efficiency and provide sound organisational AND IMPLEMENT THE assurance and support for our talents for the corporate’s “STRENGTHENING THE sustainable and healthy development. ENTERPRISE THROUGH TALENTS” PROJECT STRENGTHEN SENIOR MANAGEMENT AND EXECUTIVE The management of the Company and its subsidiaries TEAM BUILDING at all levels continued to strengthen communication and care for professional talents at all levels. The Company Enhancing the building of the management teams at all- implemented the “Hundred, Thousand, and Ten Thousand corporate levels, we continued to promote the training Professional Talent Project” and continued to build a team of a team of outstanding young cadres and selected a of high-level professional talents. Specific mechanisms group of well-recognised cadres with superb qualities, were implemented in the cloud computing branch of the distinguished capabilities and outstanding performance. As Company, which enabled mobility of the projects and its a result, the proportion of young cadres has substantially personnel and the flexibility of compensation. A “Talent increased, the age structure and professional structure of Zone” was established in the Cloud-network Security the management teams have been significantly improved, Technology Co., Ltd, which implemented a market-and the vitality of the management teams has been oriented mechanism where employee incentives can be significantly boosted. We also strengthened the allocation cashed in according to the performance of the business. of the management of the business group serving The Company further promoted its unified “talent cloud” government and enterprise informatisation services, platform, built a talent labelling system, developed a the omni-channel operation centre, the cloud-network talent vision, and enabled talent sharing and flexible development department, the cloud-network operation internal arrangement. We have set up cloud-network department (Big Data and AI center), cloud computing, integration talent workstations, industry application talent system integration, Internet of Things, Smart Family and workstations (including Internet of Thing substations), other units, and strongly supported the “Cloudification Smart Family workstations, etc., to achieve full access to and Digital Transformation” strategy of the Company. The the workstations cloud services. By leveraging the talent Company took part in the national ten major industries workstation, the Company initiated the company-wide of government and enterprises joint leader selection and talent arrangement, and fully leveraged the support from recruitment, further clarified rights and obligations and workstations mode for key projects of the Company such assessment and withdrawal mechanisms, and strived to as cloud-network integration, government and enterprise mobilise the enthusiasm and initiative of the government reform and others and the outsourcing talent to Xinjiang and enterprise industry teams to stimulate new and Ningxia. breakthroughs during the development in the government 112 China Telecom Corporation Limited Annual Report 2020
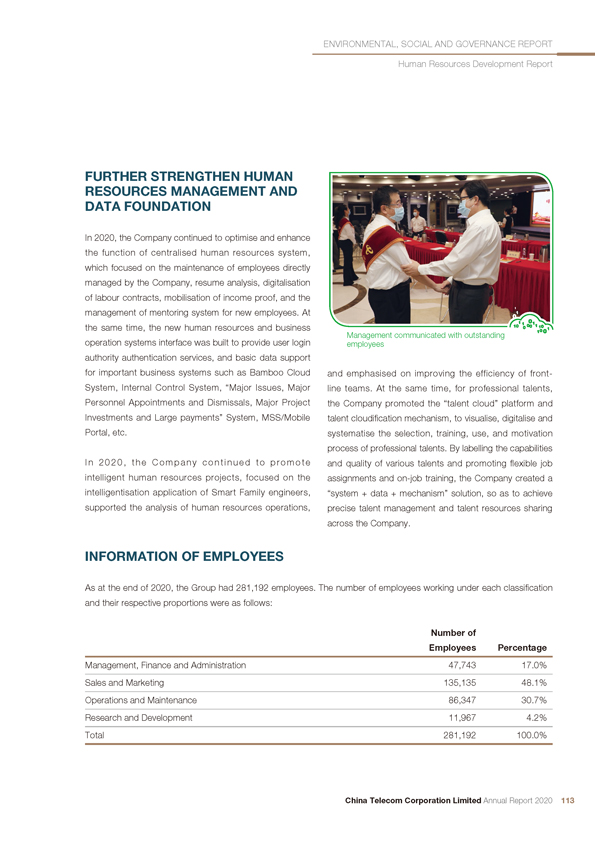
ENVIRONMENTAL, SOCIAL AND GOVERNANCE REPORT Human Resources Development Report FURTHER STRENGTHEN HUMAN RESOURCES MANAGEMENT AND DATA FOUNDATION In 2020, the Company continued to optimise and enhance the function of centralised human resources system, which focused on the maintenance of employees directly managed by the Company, resume analysis, digitalisation of labour contracts, mobilisation of income proof, and the management of mentoring system for new employees. At the same time, the new human resources and business Management communicated with outstanding operation systems interface was built to provide user login employees authority authentication services, and basic data support for important business systems such as Bamboo Cloud and emphasised on improving the efficiency of front-System, Internal Control System, “Major Issues, Major line teams. At the same time, for professional talents, Personnel Appointments and Dismissals, Major Project the Company promoted the “talent cloud” platform and Investments and Large payments” System, MSS/Mobile talent cloudification mechanism, to visualise, digitalise and Portal, etc. systematise the selection, training, use, and motivation process of professional talents. By labelling the capabilities In 2020, the Company continued to promote and quality of various talents and promoting flexible job intelligent human resources projects, focused on the assignments and on-job training, the Company created a intelligentisation application of Smart Family engineers, “system + data + mechanism” solution, so as to achieve supported the analysis of human resources operations, precise talent management and talent resources sharing across the Company. INFORMATION OF EMPLOYEES As at the end of 2020, the Group had 281,192 employees. The number of employees working under each classification and their respective proportions were as follows: Number of Employees Percentage Management, Finance and Administration 47,743 17.0% Sales and Marketing 135,135 48.1% Operations and Maintenance 86,347 30.7% Research and Development 11,967 4.2% Total 281,192 100.0% China Telecom Corporation Limited Annual Report 2020 113
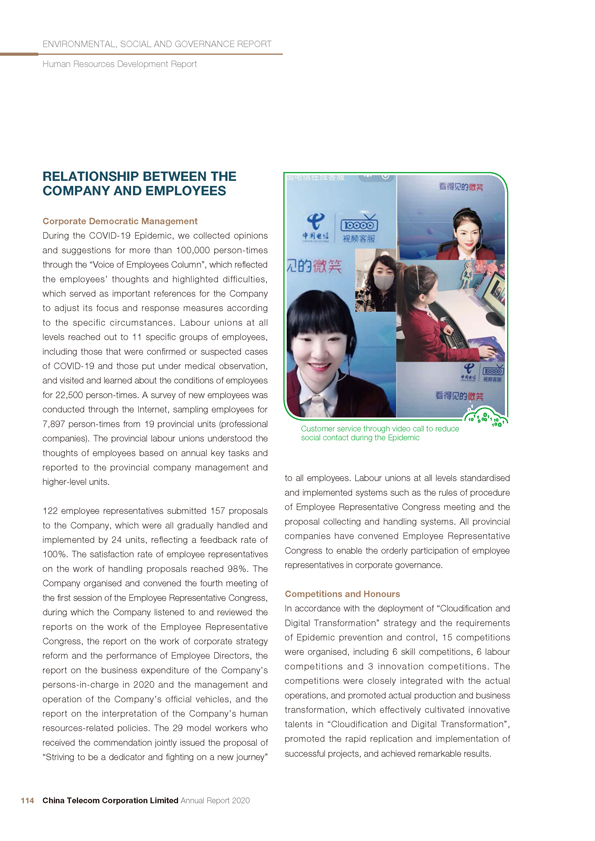
ENVIRONMENTAL, SOCIAL AND GOVERNANCE REPORT Human Resources Development Report RELATIONSHIP BETWEEN THE COMPANY AND EMPLOYEES Corporate Democratic Management During the COVID-19 Epidemic, we collected opinions and suggestions for more than 100,000 person-times through the “Voice of Employees Column”, which reflected the employees’ thoughts and highlighted difficulties, which served as important references for the Company to adjust its focus and response measures according to the specific circumstances. Labour unions at all levels reached out to 11 specific groups of employees, including those that were confirmed or suspected cases of COVID-19 and those put under medical observation, and visited and learned about the conditions of employees for 22,500 person-times. A survey of new employees was conducted through the Internet, sampling employees for 7,897 person-times from 19 provincial units (professional Customer service through video call to reduce companies). The provincial labour unions understood the social contact during the Epidemic thoughts of employees based on annual key tasks and reported to the provincial company management and higher-level units. to all employees. Labour unions at all levels standardised and implemented systems such as the rules of procedure 122 employee representatives submitted 157 proposals of Employee Representative Congress meeting and the to the Company, which were all gradually handled and proposal collecting and handling systems. All provincial implemented by 24 units, reflecting a feedback rate of companies have convened Employee Representative 100%. The satisfaction rate of employee representatives Congress to enable the orderly participation of employee on the work of handling proposals reached 98%. The representatives in corporate governance. Company organised and convened the fourth meeting of the first session of the Employee Representative Congress, Competitions and Honours during which the Company listened to and reviewed the In accordance with the deployment of “Cloudification and reports on the work of the Employee Representative Digital Transformation” strategy and the requirements Congress, the report on the work of corporate strategy of Epidemic prevention and control, 15 competitions reform and the performance of Employee Directors, the were organised, including 6 skill competitions, 6 labour report on the business expenditure of the Company’s competitions and 3 innovation competitions. The persons-in-charge in 2020 and the management and competitions were closely integrated with the actual operation of the Company’s official vehicles, and the operations, and promoted actual production and business report on the interpretation of the Company’s human transformation, which effectively cultivated innovative resources-related policies. The 29 model workers who talents in “Cloudification and Digital Transformation”, received the commendation jointly issued the proposal of promoted the rapid replication and implementation of “Striving to be a dedicator and fighting on a new journey” successful projects, and achieved remarkable results. 114 China Telecom Corporation Limited Annual Report 2020
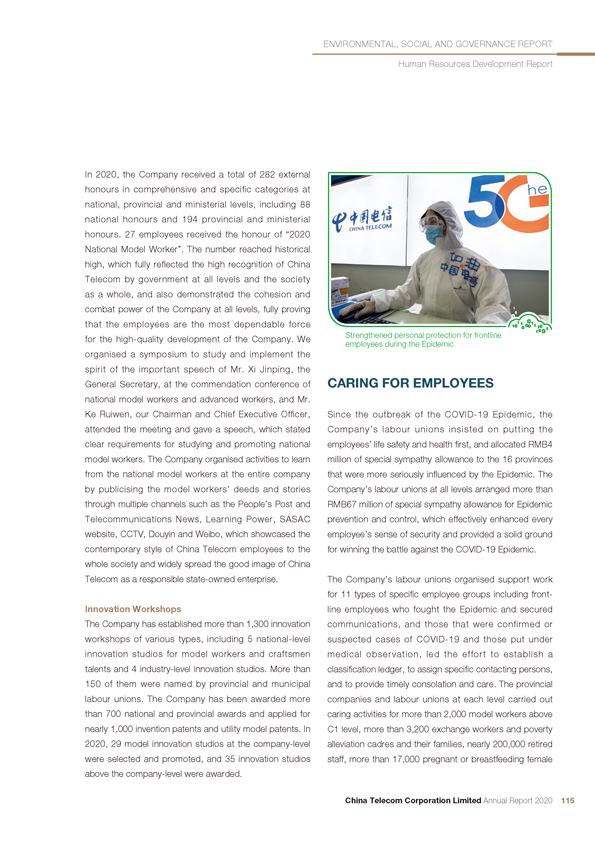
ENVIRONMENTAL, SOCIAL AND GOVERNANCE REPORT Human Resources Development Report In 2020, the Company received a total of 282 external honours in comprehensive and specific categories at national, provincial and ministerial levels, including 88 national honours and 194 provincial and ministerial honours. 27 employees received the honour of “2020 National Model Worker”. The number reached historical high, which fully reflected the high recognition of China Telecom by government at all levels and the society as a whole, and also demonstrated the cohesion and combat power of the Company at all levels, fully proving that the employees are the most dependable force for the high-quality development of the Company. We Strengthened personal protection for frontline employees during the Epidemic organised a symposium to study and implement the spirit of the important speech of Mr. Xi Jinping, the General Secretary, at the commendation conference of CARING FOR EMPLOYEES national model workers and advanced workers, and Mr. Ke Ruiwen, our Chairman and Chief Executive Officer, Since the outbreak of the COVID-19 Epidemic, the attended the meeting and gave a speech, which stated Company’s labour unions insisted on putting the clear requirements for studying and promoting national employees’ life safety and health first, and allocated RMB4 model workers. The Company organised activities to learn million of special sympathy allowance to the 16 provinces from the national model workers at the entire company that were more seriously influenced by the Epidemic. The by publicising the model workers’ deeds and stories Company’s labour unions at all levels arranged more than through multiple channels such as the People’s Post and RMB67 million of special sympathy allowance for Epidemic Telecommunications News, Learning Power, SASAC prevention and control, which effectively enhanced every website, CCTV, Douyin and Weibo, which showcased the employee’s sense of security and provided a solid ground contemporary style of China Telecom employees to the for winning the battle against the COVID-19 Epidemic. whole society and widely spread the good image of China Telecom as a responsible state-owned enterprise. The Company’s labour unions organised support work for 11 types of specific employee groups including front-Innovation Workshops line employees who fought the Epidemic and secured The Company has established more than 1,300 innovation communications, and those that were confirmed or workshops of various types, including 5 national-level suspected cases of COVID-19 and those put under innovation studios for model workers and craftsmen medical observation, led the effort to establish a talents and 4 industry-level innovation studios. More than classification ledger, to assign specific contacting persons, 150 of them were named by provincial and municipal and to provide timely consolation and care. The provincial labour unions. The Company has been awarded more companies and labour unions at each level carried out than 700 national and provincial awards and applied for caring activities for more than 2,000 model workers above nearly 1,000 invention patents and utility model patents. In C1 level, more than 3,200 exchange workers and poverty 2020, 29 model innovation studios at the company-level alleviation cadres and their families, nearly 200,000 retired were selected and promoted, and 35 innovation studios staff, more than 17,000 pregnant or breastfeeding female above the company-level were awarded. China Telecom Corporation Limited Annual Report 2020 115
ENVIRONMENTAL, SOCIAL AND GOVERNANCE REPORT Human Resources Development Report employees, etc., and helped provide protective supplies Company organised provincial labour unions to do more such as masks to show consolation and care. The than 5 practical things for employees in the province, Company established a ledger of 5,167 employees whose continuously optimised ‘Four Smalls’ operations, improved family members participated in the medical supporting service capabilities, and expanded the range of services in teams in Hubei province or fought in the front-line of areas of catering, working environment, activity conditions local Epidemic prevention and medical care works, and and quality of life, etc. conveyed corporate care by issuing sympathy allowance or products and arranging field visits by Company leaders. STRENGTHENING HUMAN CAPITAL The labour unions of the Company took the lead in Supporting National Key Training Programme improving the care ledger of more than 1,200 expatriate In 2020, China Telecom actively undertook the national employees and their domestic family members, and professional and technical talent knowledge upgrading contacted each expatriate employee to assist with their project. In October 2020, China Telecom held the Ministry practical difficulties. The Company has established a of Human Resources and Social Security knowledge mechanism for handling “important matters” of expatriate upgrading project workshop – “Smart Family Advanced employees, and as a result, the relevant departments Workshop”. More than 60 experts and technicians from cooperated and quickly implemented solutions to government agencies, research institutes, etc., attended resolve 66 difficult cases for domestic family members of the workshop. expatriate employees, provided care for 178 employees who had been dispatched to areas with serious Epidemic Efficient Operations of Online College situation or have been abroad for more than one year. The In the context of normalised Epidemic prevention and Company has improved the care ledger for employees’ control, the Company comprehensively coordinated the children that were studying abroad, supplied information enhancement of online learning and internet training, and related to the overseas Epidemic prevention and control, accelerated the improvement of the online training service promoted the development of “China Telecom Health system. Mainly relying on China Telecom Online College, Consultation Program for Overseas Employees”, and the Company expanded the scale of online training, and provided remote medical services for overseas employees provided in-depth personalised and tailored training in and their children for 217 person-times. combination with the ecology, so as to help enterprises to resume work and production. Facing fast-growing digital According to the survey statistics, the employees’ learning demand during the Epidemic, China Telecom satisfaction rate for the Company’s Epidemic prevention Online College completed the construction of an operation and control reached 9.7 points, and the satisfaction rate supporting system at the earliest time possible, and for the Company’s employees’ care work reached 94%. quickly launched various solutions such as live broadcast and online thematic training courses for leading cadres, The Company followed up and guided 110 grass-root sci-tech innovation talents, highly skilled talents and young units located in areas with an altitude of more than 3,500 employees, focusing on key business segments such as meters in five provinces, including Tibet, to build oxygen 5G, cloud-network integration and Smart Family. Relying supply facilities, which greatly improved the working on various online learning tools, the Company also carried and living conditions of employees in high-altitude out various thematic learning programs such as “Leaders areas and was praised by grass-root employees. The and Cadres Learning Month”, “Cloud-Network Operation 116 China Telecom Corporation Limited Annual Report 2020
ENVIRONMENTAL, SOCIAL AND GOVERNANCE REPORT Human Resources Development Report Lecture”, “Operation Warm Spring” and “Spotlight with 1.11 million person-times attending. Two phases of Platform”, which ensured “suspension of work but no the “Dragon Programme” were held to train and exchange suspension of learning” during the Epidemic and helped the international talents. the business development during the work resumption period. Building Employees’ Capacity The first initiative of the Company is to carry out the In 2020, China Telecom Online College had cumulatively training of cloud-network integration talents at municipal covered 52.59 million person-times in various types of levels. The Company promoted talent training through training, with 44,000 students logging in daily on average. online learning, offline training, certification, practical projects, professional coaching, hands-on training, labour 18,567 new courses were added, 1,916 thematic online competitions, etc. The training coverage ratio for municipal classes were organised, 1,341 live broadcasts were level cloud-network integration account managers conducted, 1,998 exams and certifications of various and solution managers reached 60%, and the training kinds were organised covering 2.2 million person-times coverage ratio for municipal level product maintenance through the intelligent learning platform for pushing managers and customer engineers reached 50%. learning resources. The second initiative of the Company is to continuously Building up the Internal Training Team In 2020, the Company continuously enhanced the empower and promote the development of Smart Family building of the internal training team. There were 13,000 capabilities. Focusing on product standardisation and service visualisation, the Company constantly improved internal trainers at all levels of the Company, and the the professional capabilities of the front-line sales and accumulated teaching time of all levels of internal trainers installation and maintenance team. The Company reached 212,000 hours. During the year, the Company prepared a Smart Family marketing manual, consisting recruited 678 company-level internal trainers and 775 of a total of 150,000 words, and carried out 17 series company-level trial internal trainers. The Company held an of live learnings and 2 supporting online classes, with a online training camp for internal trainers. A total of 1,335 total of 145,000 participants and the learners amounting company-level internal trainers participated in community to 880,000 person-times; the Company selected and learning, spending a total of 19,500 learning hours. hired the first batch of more than 90 company-level Smart Family professional internal trainers on a trial basis, and Cultivating Professional Talents organised the first “Genius Cup” Smart Family scenario We conducted large-scale talent trainings at each level sales competition; the Company carried out more than 60 and grade. In 2020, the Company completed the second sessions of Smart Family engineer skill level certifications, phase of the “Spark Programme” for the cultivation of covering 58,000 people in total; it optimised the design of 74 high-end leaders and the “Prairie Fire Programme” the Smart Family Lecture zone, with a total of 48 courses of cyber security training course for 50 people. The updated and more than 2 million person-times took part in Company organised a total of 40 online training sessions the learning in 2020. for backbone professionals at company-level and over 720,000 person-times attended the training courses. The third initiative of the Company is to launch multi-level During the year, 1,916 online training courses were held, “Unit CEO” online learning through online empowerment. with 29.67 million person-times attending. 1,341 live In 2020 the “Unit CEOs” program used Online College broadcasts were held, with 2.38 million person-times Unit CEOs business school as the platform, perfected attending. 31,000 face-to-face training courses were held, the “Unit CEOs” online course system in different layers, China Telecom Corporation Limited Annual Report 2020 117

ENVIRONMENTAL, SOCIAL AND GOVERNANCE REPORT Human Resources Development Report updated more than 20 courses for the corresponding application of “New Employee Tutoring Mechanism”, positions of “Unit CEOs” online learning, and mostly used which won the ATD Excellence in Practice Award, the online learning channel to teach the standard general throughout the Company, organised online special courses. Using the Wings School as the channel, the courses on career mentorship for new employees, Company regularly carried out experience sharing live launched and optimised the function of career mentorship broadcasts for the key business issues, with a total of 45 for new employees in the MSS human resources system, live broadcasts and 256,000 person-times attending. The and promoted the goal of equipping new employees company also held online training camps for Unit CEOs with corresponding professional mentors and counselling internal trainers, which cultivated 316 internal trainers and throughout the process upon their onboarding. For the effectively supported the implementation of Unit CEOs recruitment of mature talents from the society, units at all core courses in all provincial and municipal companies. levels organised induction training in accordance with their Cultivating and Attracting Outstanding Young business development needs. Talents To provide opportunities for employees’ career We continuously enhanced the mechanism for recruitment, development, the Company developed a comprehensive management, cultivation and evaluation of our trainees. dual promotion channel. Promotion is based on the We organised spring internships, summer internships, principles of fairness, justice, openness and transparency. day-to-day internships and other activities to expand The Company fully respects employees’ rights of choice, the channels to attract outstanding young talents for knowledge and scrutiny. campus recruitment. We also continued to carry out the Company’s top college graduate cultivation programme In the recruitment and promotion processes, the Company and organised online special classes for outstanding graduates, which were attended by 7,445 people. The treats all candidates and employees equally regardless of Company innovatively launched a live interactive sharing factors such as gender, age and race. platform for outstanding college graduates, the “Spotlight Platform”, which was opened to all groups of outstanding The Company strictly abides by the national regulations trainee students and would invite industry experts and relating to employees’ working hours and implemented representatives of outstanding graduates to conduct the Regulations on Paid Annual Leave for Employees interactive live lectures. promulgated by the State Council and formulated the relevant policies in relation to employees’ vacations and Recruitment rest periods. The Company recruits fresh university graduates and mature talents from the society. We organised a unified The Company strictly abides by the laws and regulations platform, unified advertising and publicity and unified such as the Labour Law of the People’s Republic of China information sessions in key universities for recruiting fresh and the Labour Contract Law of the People’s Republic of graduates. In 2020, the Company recruited more than China to regulate its employment and dismissal practices. 7,000 new graduates. We normally provide an induction The Company adheres to offering equality of remuneration training of one to two months to fresh graduates after and work for male and female employees and implements they join the Company in order to help them understand special regulations to protect female employees’ rights our corporate strategy, culture and business. In 2020, and interests. There were no discriminatory policies the Company continued to deepen the promotion and or regulations, nor had there been any circumstance 118 China Telecom Corporation Limited Annual Report 2020
ENVIRONMENTAL, SOCIAL AND GOVERNANCE REPORT Human Resources Development Report whereby child labour or forced labour was employed. with project results and personal contributions, so as to Taking into account the actual circumstances of the ensure that key personnel with outstanding ability and Company, the Company strictly abides by relevant labour performance would be better compensated, and truly laws and regulations in China, constantly improves the developed a compensation system where salaries can be relevant employee management systems, and formulates increased or decreased. relevant administrative measures which include detailed provisions stipulated in accordance with the termination of The Company actively promoted medium and long-employment contract. term incentives. The Company further expanded the pilot scope of sci-tech company equity and dividend incentive REMUNERATION AND program, promoted employee shareholding in mixed PERFORMANCE MANAGEMENT ownership enterprises, directly linked the income of key personnel with the development of company and personal Remuneration performance, established an incentive and restraint The Company optimised and improved the labour cost mechanism for interest and risk sharing, which enabled allocation mechanism. The Company continued to adhere the talents to share the benefits of the Company’s growth. to value-driven principles, promoted improvement of scale and efficiency, increased the incentive for efficiency Performance management contribution in labour cost allocation, and encouraged The Company has established a comprehensive revenue increase and efficiency improvement as well performance management system and implemented as cost reduction and efficiency improvement. Based performance appraisal for all employees. Adhering to the on the functional positioning and value contribution of performance-oriented principle, the results of performance each unit, the Company adopted various strategies, appraisal were closely correlated to employees’ formulated policies based on actual circumstances and remuneration. Branches at all levels have established constantly optimised the total labour cost decision making employees’ performance evaluation teams which are mechanism, so as to ensure that incentives are in place led by the respective general managers of the relevant and constraints are effective. branches, and have formulated appraisal methods for deputies, functional departments, subordinate units The Company promoted market-oriented incentives in and employees. The Company improves its employee key areas. The Company promoted the innovation of evaluation and incentive mechanism and the related incentive mechanism by combining the mechanisms scrutiny and supervision system to ensure fair and reliable and systemsreform of the competence centre and the performance evaluation results. At the same time, we R&D system, and constantly promoted the distribution further optimise and improve the performance evaluation mechanism of “market evaluates contribution and system and implement performance evaluation by contribution determines reward”. The Company supported categories of business units, deputies, mid-level cadres the principle of “matching responsibilities, rights and and employees at all levels, enhancing the specificity of rewards”, and “reciprocity of incentives and constraints” the performance evaluation. in key projects and key areas, adopted market-oriented benchmarking method for key personnel, provided market-competitive salary, linked personal income closely China Telecom Corporation Limited Annual Report 2020 119
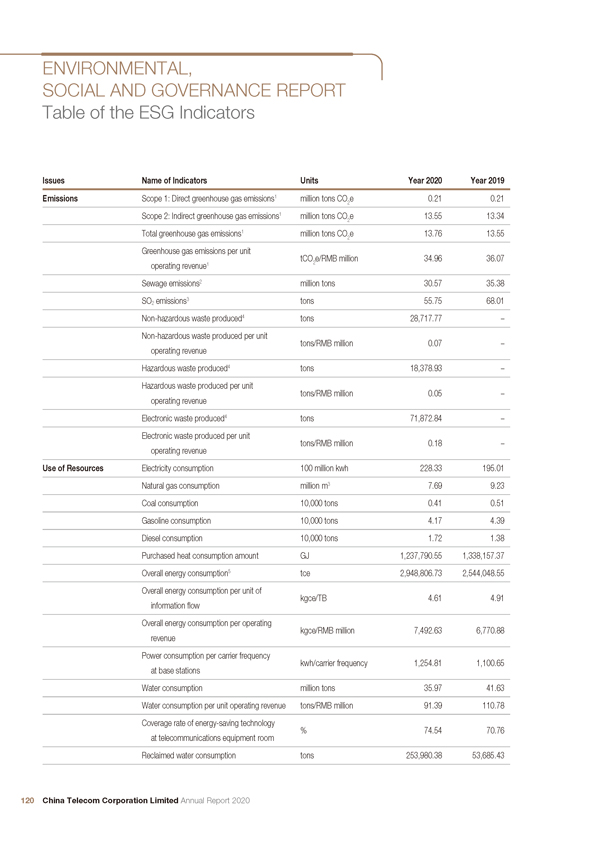
ENVIRONMENTAL, SOCIAL AND GOVERNANCE REPORT Table of the ESG Indicators Issues Name of Indicators Units Year 2020 Year 2019 Emissions Scope 1: Direct greenhouse gas emissions1 million tons CO2e 0.21 0.21 Scope 2: Indirect greenhouse gas emissions1 million tons CO2e 13.55 13.34 Total greenhouse gas emissions1 million tons CO2e 13.76 13.55 Greenhouse gas emissions per unit tCO2e/RMB million 34.96 36.07 operating revenue1 Sewage emissions2 million tons 30.57 35.38 SO emissions3 tons 55.75 68.01 2 Non-hazardous waste produced4 tons 28,717.77 –Non-hazardous waste produced per unit tons/RMB million 0.07 –operating revenue Hazardous waste produced4 tons 18,378.93 –Hazardous waste produced per unit tons/RMB million 0.05 –operating revenue Electronic waste produced4 tons 71,872.84 –Electronic waste produced per unit tons/RMB million 0.18 –operating revenue Use of Resources Electricity consumption 100 million kwh 228.33 195.01 Natural gas consumption million m3 7.69 9.23 Coal consumption 10,000 tons 0.41 0.51 Gasoline consumption 10,000 tons 4.17 4.39 Diesel consumption 10,000 tons 1.72 1.38 Purchased heat consumption amount GJ 1,237,790.55 1,338,157.37 Overall energy consumption5 tce 2,948,806.73 2,544,048.55 Overall energy consumption per unit of kgce/TB 4.61 4.91 information flow Overall energy consumption per operating kgce/RMB million 7,492.63 6,770.88 revenue Power consumption per carrier frequency kwh/carrier frequency 1,254.81 1,100.65 at base stations Water consumption million tons 35.97 41.63 Water consumption per unit operating revenue tons/RMB million 91.39 110.78 Coverage rate of energy-saving technology % 74.54 70.76 at telecommunications equipment room Reclaimed water consumption tons 253,980.38 53,685.43 120 China Telecom Corporation Limited Annual Report 2020
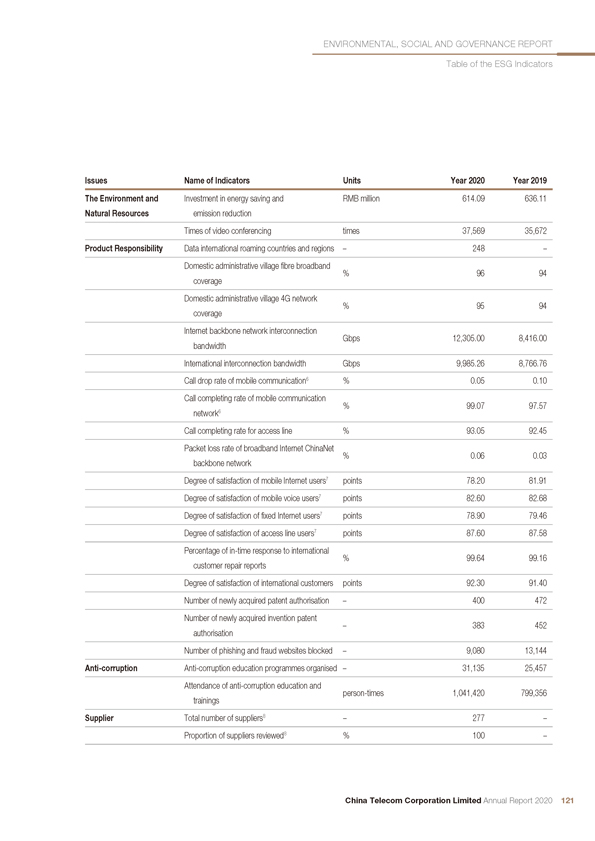
ENVIRONMENTAL, SOCIAL AND GOVERNANCE REPORT Table of the ESG Indicators Issues Name of Indicators Units Year 2020 Year 2019 The Environment and Investment in energy saving and RMB million 614.09 636.11 Natural Resources emission reduction Times of video conferencing times 37,569 35,672 Product Responsibility Data international roaming countries and regions – 248 –Domestic administrative village fibre broadband % 96 94 coverage Domestic administrative village 4G network % 95 94 coverage Internet backbone network interconnection Gbps 12,305.00 8,416.00 bandwidth International interconnection bandwidth Gbps 9,985.26 8,766.76 Call drop rate of mobile communication6 % 0.05 0.10 Call completing rate of mobile communication % 99.07 97.57 network6 Call completing rate for access line % 93.05 92.45 Packet loss rate of broadband Internet ChinaNet % 0.06 0.03 backbone network Degree of satisfaction of mobile Internet users7 points 78.20 81.91 Degree of satisfaction of mobile voice users7 points 82.60 82.68 Degree of satisfaction of fixed Internet users7 points 78.90 79.46 Degree of satisfaction of access line users7 points 87.60 87.58 Percentage of in-time response to international % 99.64 99.16 customer repair reports Degree of satisfaction of international customers points 92.30 91.40 Number of newly acquired patent authorisation – 400 472 Number of newly acquired invention patent – 383 452 authorisation Number of phishing and fraud websites blocked – 9,080 13,144 Anti-corruption Anti-corruption education programmes organised – 31,135 25,457 Attendance of anti-corruption education and person-times 1,041,420 799,356 trainings Supplier Total number of suppliers8 – 277 –Proportion of suppliers reviewed8 % 100 – China Telecom Corporation Limited Annual Report 2020 121
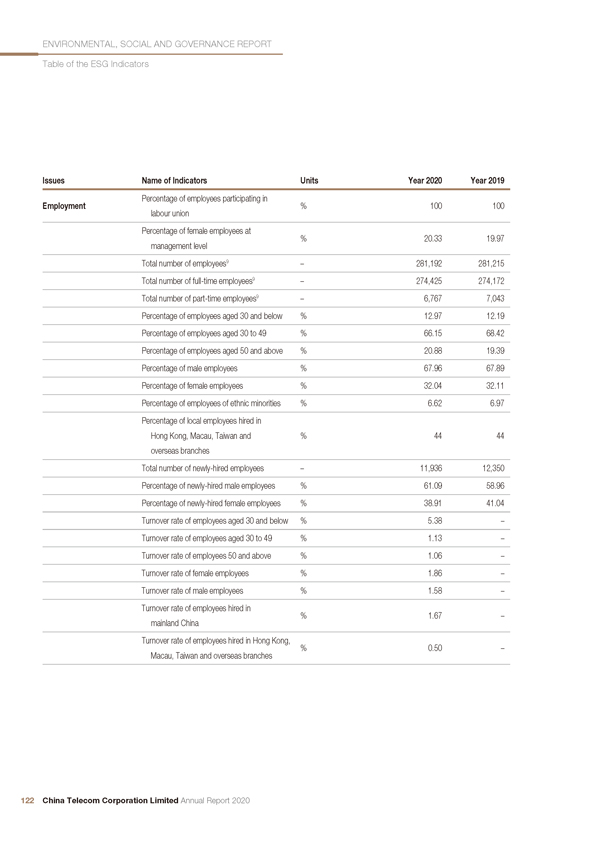
ENVIRONMENTAL, SOCIAL AND GOVERNANCE REPORT Table of the ESG Indicators Issues Name of Indicators Units Year 2020 Year 2019 Percentage of employees participating in Employment % 100 100 labour union Percentage of female employees at % 20.33 19.97 management level Total number of employees9 – 281,192 281,215 Total number of full-time employees9 – 274,425 274,172 Total number of part-time employees9 – 6,767 7,043 Percentage of employees aged 30 and below % 12.97 12.19 Percentage of employees aged 30 to 49 % 66.15 68.42 Percentage of employees aged 50 and above % 20.88 19.39 Percentage of male employees % 67.96 67.89 Percentage of female employees % 32.04 32.11 Percentage of employees of ethnic minorities % 6.62 6.97 Percentage of local employees hired in Hong Kong, Macau, Taiwan and % 44 44 overseas branches Total number of newly-hired employees – 11,936 12,350 Percentage of newly-hired male employees % 61.09 58.96 Percentage of newly-hired female employees % 38.91 41.04 Turnover rate of employees aged 30 and below % 5.38 –Turnover rate of employees aged 30 to 49 % 1.13 –Turnover rate of employees 50 and above % 1.06 –Turnover rate of female employees % 1.86 –Turnover rate of male employees % 1.58 –Turnover rate of employees hired in % 1.67 –mainland China Turnover rate of employees hired in Hong Kong, % 0.50 –Macau, Taiwan and overseas branches 122 China Telecom Corporation Limited Annual Report 2020
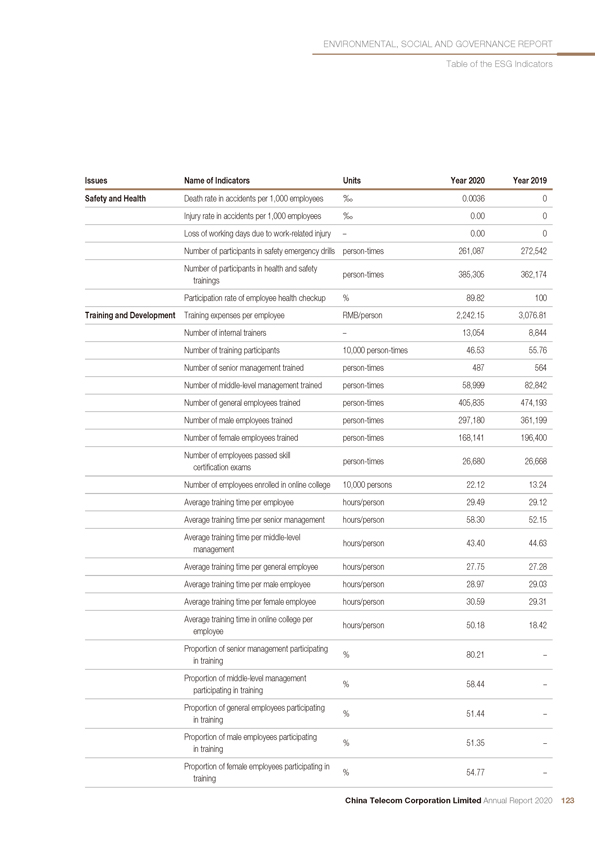
ENVIRONMENTAL, SOCIAL AND GOVERNANCE REPORT Table of the ESG Indicators Issues Name of Indicators Units Year 2020 Year 2019 Safety and Health Death rate in accidents per 1,000 employees ‰ 0.0036 0 Injury rate in accidents per 1,000 employees ‰ 0.00 0 Loss of working days due to work-related injury – 0.00 0 Number of participants in safety emergency drills person-times 261,087 272,542 Number of participants in health and safety person-times 385,305 362,174 trainings Participation rate of employee health checkup % 89.82 100 Training and Development Training expenses per employee RMB/person 2,242.15 3,076.81 Number of internal trainers – 13,054 8,844 Number of training participants 10,000 person-times 46.53 55.76 Number of senior management trained person-times 487 564 Number of middle-level management trained person-times 58,999 82,842 Number of general employees trained person-times 405,835 474,193 Number of male employees trained person-times 297,180 361,199 Number of female employees trained person-times 168,141 196,400 Number of employees passed skill person-times 26,680 26,668 certification exams Number of employees enrolled in online college 10,000 persons 22.12 13.24 Average training time per employee hours/person 29.49 29.12 Average training time per senior management hours/person 58.30 52.15 Average training time per middle-level hours/person 43.40 44.63 management Average training time per general employee hours/person 27.75 27.28 Average training time per male employee hours/person 28.97 29.03 Average training time per female employee hours/person 30.59 29.31 Average training time in online college per hours/person 50.18 18.42 employee Proportion of senior management participating % 80.21 –in training Proportion of middle-level management % 58.44 –participating in training Proportion of general employees participating % 51.44 –in training Proportion of male employees participating % 51.35 –in training Proportion of female employees participating in % 54.77 –training China Telecom Corporation Limited Annual Report 2020 123
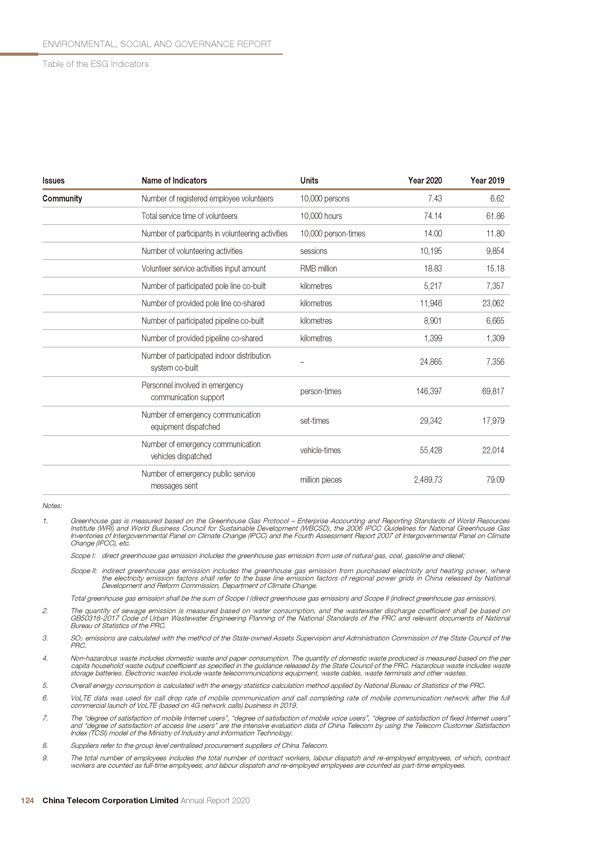
ENVIRONMENTAL, SOCIAL AND GOVERNANCE REPORT Table of the ESG Indicators Issues Name of Indicators Units Year 2020 Year 2019 Community Number of registered employee volunteers 10,000 persons 7.43 6.62 Total service time of volunteers 10,000 hours 74.14 61.86 Number of participants in volunteering activities 10,000 person-times 14.00 11.80 Number of volunteering activities sessions 10,195 9,854 Volunteer service activities input amount RMB million 18.83 15.18 Number of participated pole line co-built kilometres 5,217 7,357 Number of provided pole line co-shared kilometres 11,946 23,062 Number of participated pipeline co-built kilometres 8,901 6,665 Number of provided pipeline co-shared kilometres 1,399 1,309 Number of participated indoor distribution – 24,865 7,356 system co-built Personnel involved in emergency person-times 146,397 69,817 communication support Number of emergency communication set-times 29,342 17,979 equipment dispatched Number of emergency communication vehicle-times 55,428 22,014 vehicles dispatched Number of emergency public service million pieces 2,489.73 79.09 messages sent Notes: 1. Greenhouse gas is measured based on the Greenhouse Gas Protocol – Enterprise Accounting and Reporting Standards of World Resources Institute (WRI) and World Business Council for Sustainable Development (WBCSD), the 2006 IPCC Guidelines for National Greenhouse Gas Inventories of Intergovernmental Panel on Climate Change (IPCC) and the Fourth Assessment Report 2007 of Intergovernmental Panel on Climate Change (IPCC), etc. Scope I: direct greenhouse gas emission includes the greenhouse gas emission from use of natural gas, coal, gasoline and diesel; Scope II: indirect greenhouse gas emission includes the greenhouse gas emission from purchased electricity and heating power, where the electricity emission factors shall refer to the base line emission factors of regional power grids in China released by National Development and Reform Commission, Department of Climate Change. Total greenhouse gas emission shall be the sum of Scope I (direct greenhouse gas emission) and Scope II (indirect greenhouse gas emission). 2. The quantity of sewage emission is measured based on water consumption, and the wastewater discharge coefficient shall be based on GB50318-2017 Code of Urban Wastewater Engineering Planning of the National Standards of the PRC and relevant documents of National Bureau of Statistics of the PRC. 3. SO2 emissions are calculated with the method of the State-owned Assets Supervision and Administration Commission of the State Council of the PRC. 4. Non-hazardous waste includes domestic waste and paper consumption. The quantity of domestic waste produced is measured based on the per capita household waste output coefficient as specified in the guidance released by the State Council of the PRC. Hazardous waste includes waste storage batteries. Electronic wastes include waste telecommunications equipment, waste cables, waste terminals and other wastes. 5. Overall energy consumption is calculated with the energy statistics calculation method applied by National Bureau of Statistics of the PRC. 6. VoLTE data was used for call drop rate of mobile communication and call completing rate of mobile communication network after the full commercial launch of VoLTE (based on 4G network calls) business in 2019. 7. The “degree of satisfaction of mobile Internet users”, “degree of satisfaction of mobile voice users”, “degree of satisfaction of fixed Internet users” and “degree of satisfaction of access line users” are the intensive evaluation data of China Telecom by using the Telecom Customer Satisfaction Index (TCSI) model of the Ministry of Industry and Information Technology. 8. Suppliers refer to the group level centralised procurement suppliers of China Telecom. 9. The total number of employees includes the total number of contract workers, labour dispatch and re-employed employees, of which, contract workers are counted as full-time employees, and labour dispatch and re-employed employees are counted as part-time employees. 124 China Telecom Corporation Limited Annual Report 2020
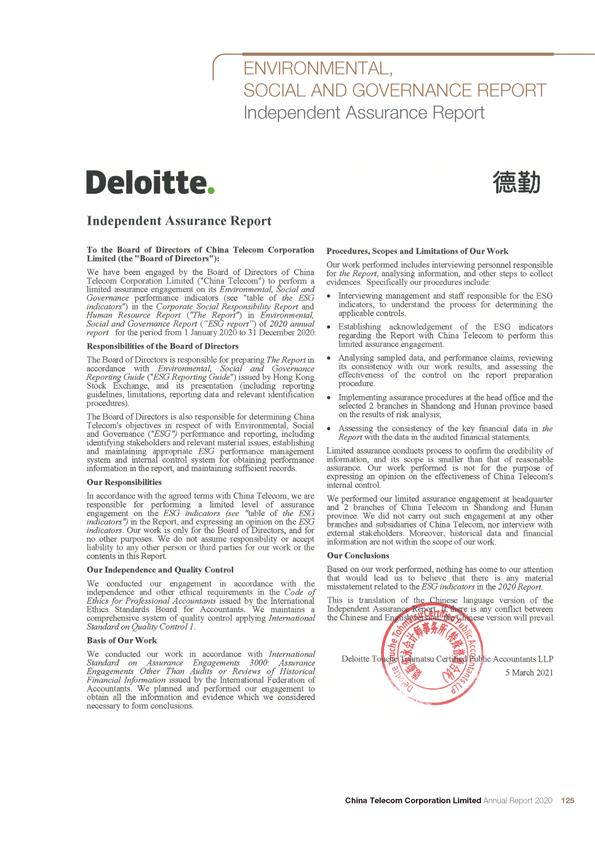
ENVIRONMENTAL, SOCIAL AND GOVERNANCE REPORT Independent Assurance Report Deloitte. Independent Assurance Report To the Board of Directors of China Telecom Corporation Procedures, Scopes and Limitations of Our Work Limited (the “Board of Directors”): , - . _ Our work performed includes interviewing personnel responsible We have been engaged by the Board of Directors of China for the Report, analysing information, and other steps to collect Telecom Corporation Limited (“China Telecom”) to perform a evidences. Specifically our procedures include: limited assurance engagement on its Environmental, Social and Governance performance indicators (see “table of the ESG * Interviewing management and staff responsible for the ESG indicators”) in the Corporate Social Responsibility Reportand indicators, to understand the process for determining the Human Resource Report (“The Report”) in Environmental, applicable controls. Social and Governance Report ( ESG report )of 2020 annual , Establishing acknowledgement of the ESG indicators report for the period from 1 January 2020 to 31 December 2020, regarding the Report with China Telecom to perform this Responsibilities of the Board of Directors limited assurance engagement. The Board of Directors is responsible for prep aring The Reportin * Analysing sampled data, and p erformance claims, reviewin g accordance with Environmental, Social and Governance its consistency with our work results, and assessing the Reporting Guide (“ESG Reporting Guide”) issued hy Hong Kong effectiveness of the control on the report preparation Stock Exchange, and its presentation (including reporting procedure. guidelines, limitations, reporting data and relevant identification , Implementing assurance procedures at the head office and the procedures). selected 2 branches in Shandong and Hunan province based The Board of Directors is also responsible for determining China on results of risk analysis; Telecom’s objectives in respect of with Environmental, Social . Assessing the consistency of the key financial data in and Governance ( ESG )performance and reporting, including R t wlth the data m &e audited flnancial statements. identifying stakeholders and relevant material issues, establishing and maintaining appropriate ESG performance management Limited assurance conducts process to confirm the credibility of system and internal control system for obtaining performance information, and its scope is smaller than that of reasonable information in the report, and maintaining sufficient records. assurance. Our work performed is not for the purpose of _ ... . expressing an opinion on the effectiveness of China Telecom’s Our Responsibilities internal In accordance with the agreed terms with China 1 elecom, we are ys/c nerforaled our limited assurance engagement at headquarter responsible for performing a limited level of assurance 2 branches of China Telecom in Shandong and Hunan engagement .on the ESG indicators (see table of the ESG province. We did not cany out such engagement at any other indicators )in the Report, and expressing an opinion on the ESG branches and subsidiaries of China Telecom, nor interview with ^motors. Our work is only for the Board of Directors, and for extemal stakeholders. Moreover, historical data and financial no other purposes. We do not assume responsibility or accept jnfonnation are not within the scope of our work, liability to any other person or third parties tor our work or the contents in this Report Our Conclusions Our Independence and Quality Control Based on our work performed, nothing has come to our attention , , . , , that would lead us to believe that there is any material We conducted our engagement m accordance with the imsslatcment related to the ESG indicators in the 2020Report. independence and other ethical requirements m the Code of Ethics for Professional Accountants issued by the International This is translation of the .Chinese language version of the Ethics Standards Board for Accountants. We maintains a Independent Assurancji^KHHg’L.jUl^hsre is any conflict between comprehensive system of quality control applying International the Chinese and Engfisljtv’sibmithe Chiiiese version will prevail. Standard on Quality Control 1. Basis of Our Work We conducted our work in accordance with International,, , ... J.- , . ttt, Standard on Assurance Engagements 3000: Assurance Deloitte ToL^-.^iatsu Cer^jrifBittic Accountants LLP Engagements Other Than Audits or Reviews of Historical ) 5 March 2021 Financial Information issued by the International Federation of / Accountants. We planned and performed our engagement to X’, obtain all the information and evidence which we considered ‘s,.. necessary to form conclusions. China Telecom Corporation Limited Annual Report 2020 125
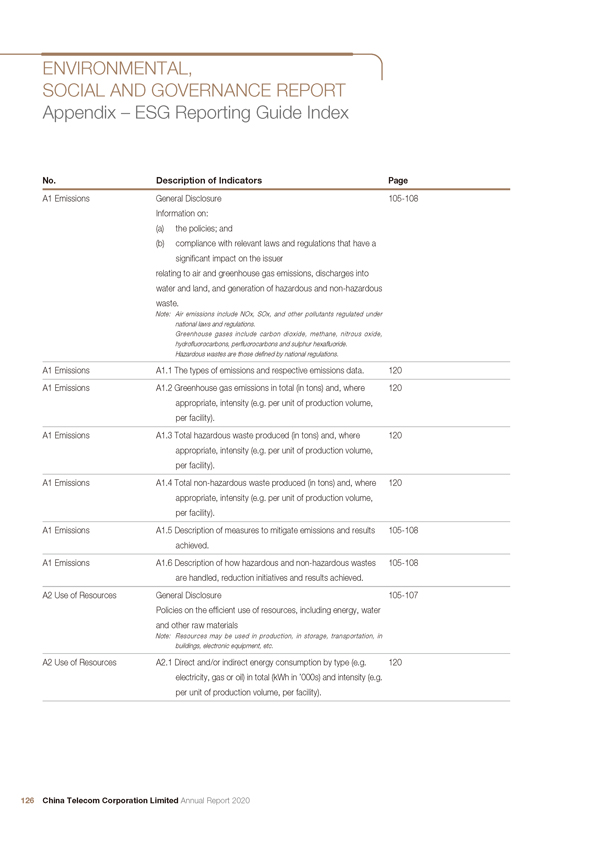
ENVIRONMENTAL, SOCIAL AND GOVERNANCE REPORT Appendix – ESG Reporting Guide Index No. Description of Indicators Page A1 Emissions General Disclosure 105-108 Information on: (a) the policies; and (b) compliance with relevant laws and regulations that have a significant impact on the issuer relating to air and greenhouse gas emissions, discharges into water and land, and generation of hazardous and non-hazardous waste. Note: Air emissions include NOx, SOx, and other pollutants regulated under national laws and regulations. Greenhouse gases include carbon dioxide, methane, nitrous oxide, hydrofluorocarbons, perfluorocarbons and sulphur hexafluoride. Hazardous wastes are those defined by national regulations. A1 Emissions A1.1 The types of emissions and respective emissions data. 120 A1 Emissions A1.2 Greenhouse gas emissions in total (in tons) and, where 120 appropriate, intensity (e.g. per unit of production volume, per facility). A1 Emissions A1.3 Total hazardous waste produced (in tons) and, where 120 appropriate, intensity (e.g. per unit of production volume, per facility). A1 Emissions A1.4 Total non-hazardous waste produced (in tons) and, where 120 appropriate, intensity (e.g. per unit of production volume, per facility). A1 Emissions A1.5 Description of measures to mitigate emissions and results 105-108 achieved. A1 Emissions A1.6 Description of how hazardous and non-hazardous wastes 105-108 are handled, reduction initiatives and results achieved. A2 Use of Resources General Disclosure 105-107 Policies on the efficient use of resources, including energy, water and other raw materials Note: Resources may be used in production, in storage, transportation, in buildings, electronic equipment, etc. A2 Use of Resources A2.1 Direct and/or indirect energy consumption by type (e.g. 120 electricity, gas or oil) in total (kWh in ’000s) and intensity (e.g. per unit of production volume, per facility). 126 China Telecom Corporation Limited Annual Report 2020
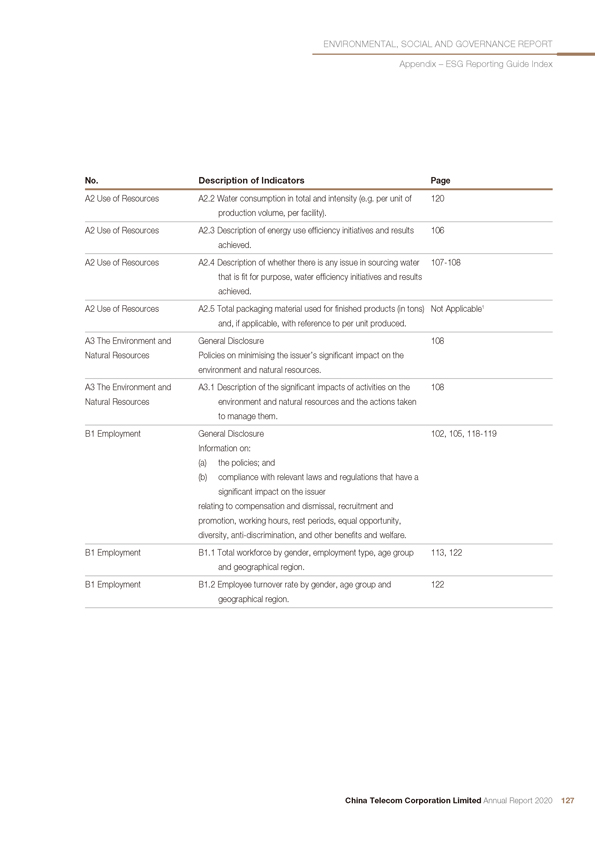
ENVIRONMENTAL, SOCIAL AND GOVERNANCE REPORT Appendix – ESG Reporting Guide Index No. Description of Indicators Page A2 Use of Resources A2.2 Water consumption in total and intensity (e.g. per unit of 120 production volume, per facility). A2 Use of Resources A2.3 Description of energy use efficiency initiatives and results 106 achieved. A2 Use of Resources A2.4 Description of whether there is any issue in sourcing water 107-108 that is fit for purpose, water efficiency initiatives and results achieved. A2 Use of Resources A2.5 Total packaging material used for finished products (in tons) Not Applicable1 and, if applicable, with reference to per unit produced. A3 The Environment and General Disclosure 108 Natural Resources Policies on minimising the issuer’s significant impact on the environment and natural resources. A3 The Environment and A3.1 Description of the significant impacts of activities on the 108 Natural Resources environment and natural resources and the actions taken to manage them. B1 Employment General Disclosure 102, 105, 118-119 Information on: (a) the policies; and (b) compliance with relevant laws and regulations that have a significant impact on the issuer relating to compensation and dismissal, recruitment and promotion, working hours, rest periods, equal opportunity, diversity, anti-discrimination, and other benefits and welfare. B1 Employment B1.1 Total workforce by gender, employment type, age group 113, 122 and geographical region. B1 Employment B1.2 Employee turnover rate by gender, age group and 122 geographical region. China Telecom Corporation Limited Annual Report 2020 127
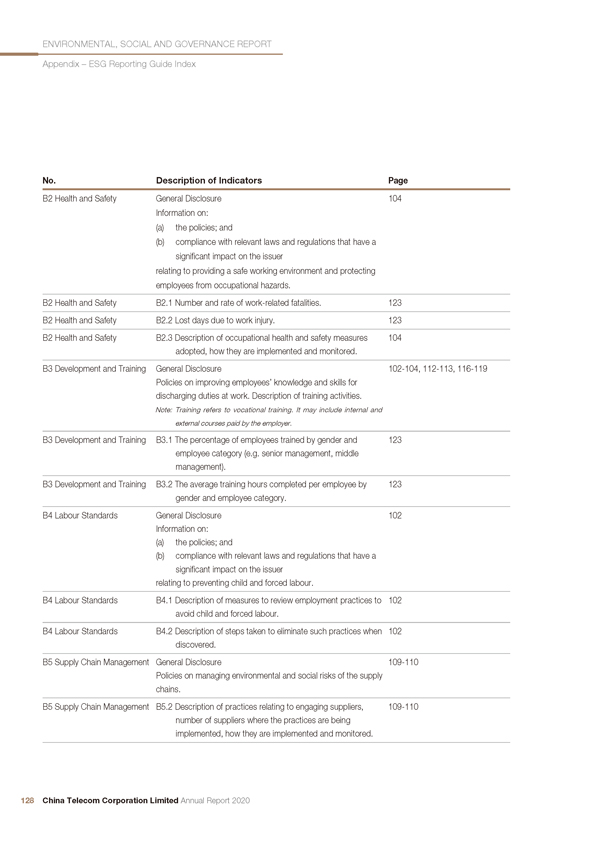
ENVIRONMENTAL, SOCIAL AND GOVERNANCE REPORT Appendix – ESG Reporting Guide Index No. Description of Indicators Page B2 Health and Safety General Disclosure 104 Information on: (a) the policies; and (b) compliance with relevant laws and regulations that have a significant impact on the issuer relating to providing a safe working environment and protecting employees from occupational hazards. B2 Health and Safety B2.1 Number and rate of work-related fatalities. 123 B2 Health and Safety B2.2 Lost days due to work injury. 123 B2 Health and Safety B2.3 Description of occupational health and safety measures 104 adopted, how they are implemented and monitored. B3 Development and Training General Disclosure 102-104, 112-113, 116-119 Policies on improving employees’ knowledge and skills for discharging duties at work. Description of training activities. Note: Training refers to vocational training. It may include internal and external courses paid by the employer. B3 Development and Training B3.1 The percentage of employees trained by gender and 123 employee category (e.g. senior management, middle management). B3 Development and Training B3.2 The average training hours completed per employee by 123 gender and employee category. B4 Labour Standards General Disclosure 102 Information on: (a) the policies; and (b) compliance with relevant laws and regulations that have a significant impact on the issuer relating to preventing child and forced labour. B4 Labour Standards B4.1 Description of measures to review employment practices to 102 avoid child and forced labour. B4 Labour Standards B4.2 Description of steps taken to eliminate such practices when 102 discovered. B5 Supply Chain Management General Disclosure 109-110 Policies on managing environmental and social risks of the supply chains. B5 Supply Chain Management B5.2 Description of practices relating to engaging suppliers, 109-110 number of suppliers where the practices are being implemented, how they are implemented and monitored. 128 China Telecom Corporation Limited Annual Report 2020
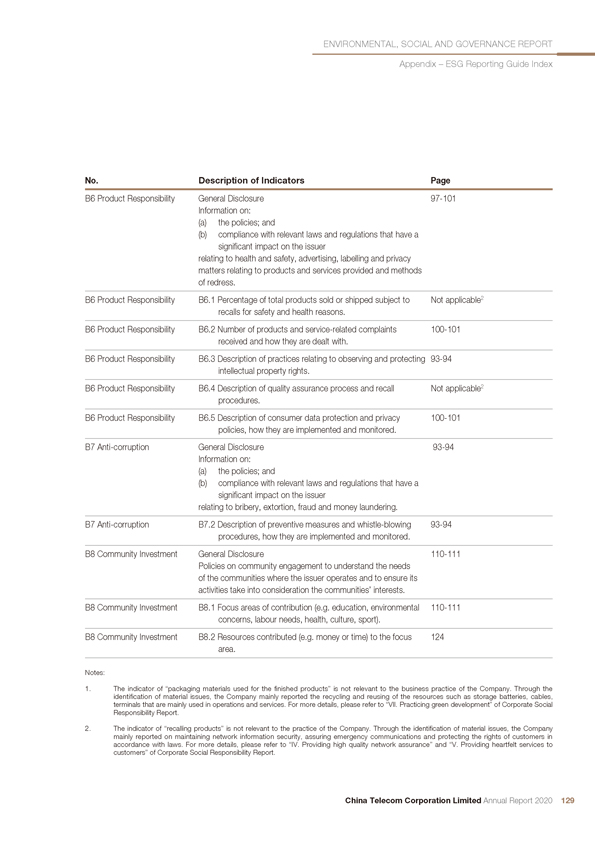
ENVIRONMENTAL, SOCIAL AND GOVERNANCE REPORT Appendix – ESG Reporting Guide Index No. Description of Indicators Page B6 Product Responsibility General Disclosure 97-101 Information on: (a) the policies; and (b) compliance with relevant laws and regulations that have a significant impact on the issuer relating to health and safety, advertising, labelling and privacy matters relating to products and services provided and methods of redress. B6 Product Responsibility B6.1 Percentage of total products sold or shipped subject to Not applicable2 recalls for safety and health reasons. B6 Product Responsibility B6.2 Number of products and service-related complaints 100-101 received and how they are dealt with. B6 Product Responsibility B6.3 Description of practices relating to observing and protecting 93-94 intellectual property rights. B6 Product Responsibility B6.4 Description of quality assurance process and recall Not applicable2 procedures. B6 Product Responsibility B6.5 Description of consumer data protection and privacy 100-101 policies, how they are implemented and monitored. B7 Anti-corruption General Disclosure 93-94 Information on: (a) the policies; and (b) compliance with relevant laws and regulations that have a significant impact on the issuer relating to bribery, extortion, fraud and money laundering. B7 Anti-corruption B7.2 Description of preventive measures and whistle-blowing 93-94 procedures, how they are implemented and monitored. B8 Community Investment General Disclosure 110-111 Policies on community engagement to understand the needs of the communities where the issuer operates and to ensure its activities take into consideration the communities’ interests. B8 Community Investment B8.1 Focus areas of contribution (e.g. education, environmental 110-111 concerns, labour needs, health, culture, sport). B8 Community Investment B8.2 Resources contributed (e.g. money or time) to the focus 124 area. Notes: 1. The indicator of “packaging materials used for the finished products” is not relevant to the business practice of the Company. Through the identification of material issues, the Company mainly reported the recycling and reusing of the resources such as storage batteries, cables, terminals that are mainly used in operations and services. For more details, please refer to “VII. Practicing green development” of Corporate Social Responsibility Report. 2. The indicator of “recalling products” is not relevant to the practice of the Company. Through the identification of material issues, the Company mainly reported on maintaining network information security, assuring emergency communications and protecting the rights of customers in accordance with laws. For more details, please refer to “IV. Providing high quality network assurance” and “V. Providing heartfelt services to customers” of Corporate Social Responsibility Report. China Telecom Corporation Limited Annual Report 2020 129
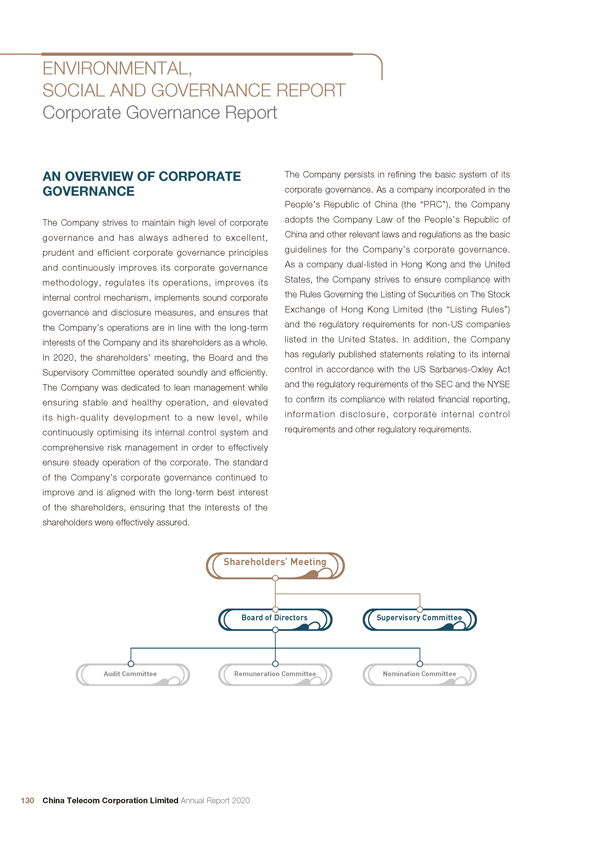
ENVIRONMENTAL, SOCIAL AND GOVERNANCE REPORT Corporate Governance Report AN OVERVIEW OF CORPORATE The Company persists in refining the basic system of its GOVERNANCE corporate governance. As a company incorporated in the People’s Republic of China (the “PRC”), the Company The Company strives to maintain high level of corporate adopts the Company Law of the People’s Republic of governance and has always adhered to excellent, China and other relevant laws and regulations as the basic prudent and efficient corporate governance principles guidelines for the Company’s corporate governance. and continuously improves its corporate governance As a company dual-listed in Hong Kong and the United methodology, regulates its operations, improves its States, the Company strives to ensure compliance with internal control mechanism, implements sound corporate the Rules Governing the Listing of Securities on The Stock governance and disclosure measures, and ensures that Exchange of Hong Kong Limited (the “Listing Rules”) the Company’s operations are in line with the long-term and the regulatory requirements for non-US companies interests of the Company and its shareholders as a whole. listed in the United States. In addition, the Company In 2020, the shareholders’ meeting, the Board and the has regularly published statements relating to its internal Supervisory Committee operated soundly and efficiently. control in accordance with the US Sarbanes-Oxley Act The Company was dedicated to lean management while and the regulatory requirements of the SEC and the NYSE ensuring stable and healthy operation, and elevated to confirm its compliance with related financial reporting, its high-quality development to a new level, while information disclosure, corporate internal control continuously optimising its internal control system and requirements and other regulatory requirements. comprehensive risk management in order to effectively ensure steady operation of the corporate. The standard of the Company’s corporate governance continued to improve and is aligned with the long-term best interest of the shareholders, ensuring that the interests of the shareholders were effectively assured. Shareholders’ Meeting Board of Directors Supervisory Committee Audit Committee Remuneration Committee Nomination Committee 130 China Telecom Corporation Limited Annual Report 2020
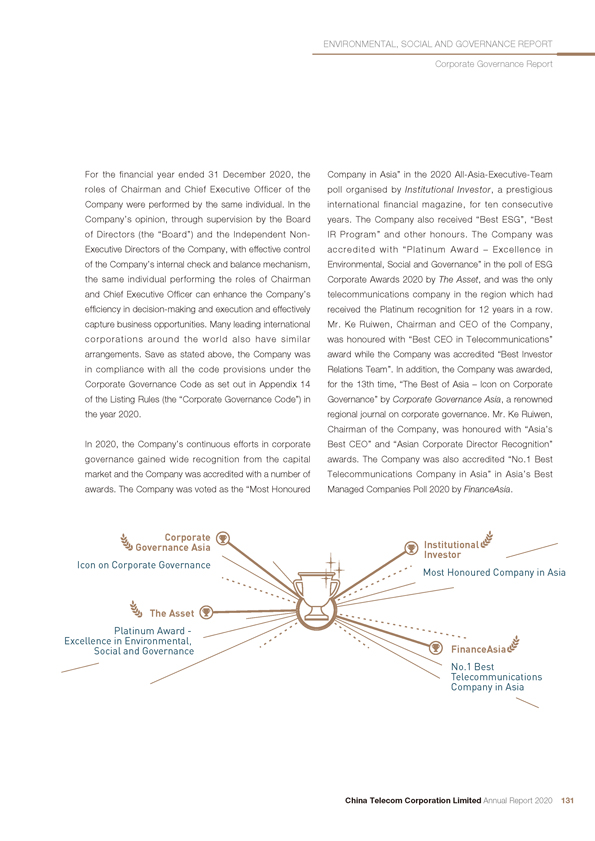
ENVIRONMENTAL, SOCIAL AND GOVERNANCE REPORT Corporate Governance Report For the financial year ended 31 December 2020, the Company in Asia” in the 2020 All-Asia-Executive-Team roles of Chairman and Chief Executive Officer of the poll organised by Institutional Investor, a prestigious Company were performed by the same individual. In the international financial magazine, for ten consecutive Company’s opinion, through supervision by the Board years. The Company also received “Best ESG”, “Best of Directors (the “Board”) and the Independent Non- IR Program” and other honours. The Company was Executive Directors of the Company, with effective control accredited with “Platinum Award – Excellence in of the Company’s internal check and balance mechanism, Environmental, Social and Governance” in the poll of ESG the same individual performing the roles of Chairman Corporate Awards 2020 by The Asset, and was the only and Chief Executive Officer can enhance the Company’s telecommunications company in the region which had efficiency in decision-making and execution and effectively received the Platinum recognition for 12 years in a row. capture business opportunities. Many leading international Mr. Ke Ruiwen, Chairman and CEO of the Company, corporations around the world also have similar was honoured with “Best CEO in Telecommunications” arrangements. Save as stated above, the Company was award while the Company was accredited “Best Investor in compliance with all the code provisions under the Relations Team”. In addition, the Company was awarded, Corporate Governance Code as set out in Appendix 14 for the 13th time, “The Best of Asia – Icon on Corporate of the Listing Rules (the “Corporate Governance Code”) in Governance” by Corporate Governance Asia, a renowned the year 2020. regional journal on corporate governance. Mr. Ke Ruiwen, Chairman of the Company, was honoured with “Asia’s In 2020, the Company’s continuous efforts in corporate Best CEO” and “Asian Corporate Director Recognition” governance gained wide recognition from the capital awards. The Company was also accredited “No.1 Best market and the Company was accredited with a number of Telecommunications Company in Asia” in Asia’s Best awards. The Company was voted as the “Most Honoured Managed Companies Poll 2020 by FinanceAsia. Corporate Governance Asia Investor Institutional Icon on Corporate Governance Most Honoured Company in Asia The Asset Excellence in Environmental,Platinum Award—Social and Governance FinanceAsia Telecommunications No.1 Best Company in Asia China Telecom Corporation Limited Annual Report 2020 131
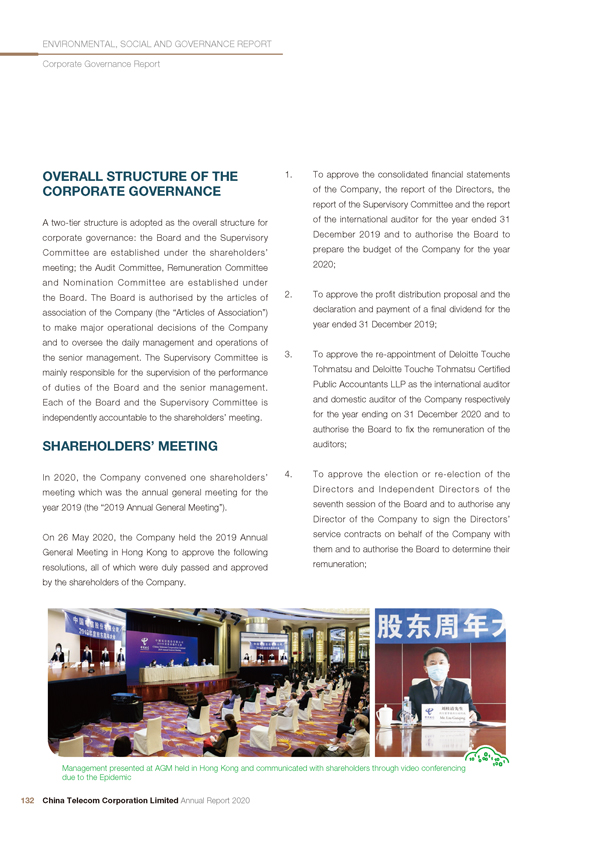
ENVIRONMENTAL, SOCIAL AND GOVERNANCE REPORT Corporate Governance Report OVERALL STRUCTURE OF THE 1. To approve the consolidated financial statements CORPORATE GOVERNANCE of the Company, the report of the Directors, the report of the Supervisory Committee and the report A two-tier structure is adopted as the overall structure for of the international auditor for the year ended 31 corporate governance: the Board and the Supervisory December 2019 and to authorise the Board to Committee are established under the shareholders’ prepare the budget of the Company for the year meeting; the Audit Committee, Remuneration Committee 2020; and Nomination Committee are established under the Board. The Board is authorised by the articles of 2. To approve the profit distribution proposal and the association of the Company (the “Articles of Association”) declaration and payment of a final dividend for the to make major operational decisions of the Company year ended 31 December 2019; and to oversee the daily management and operations of the senior management. The Supervisory Committee is 3. To approve the re-appointment of Deloitte Touche mainly responsible for the supervision of the performance Tohmatsu and Deloitte Touche Tohmatsu Certified of duties of the Board and the senior management. Public Accountants LLP as the international auditor Each of the Board and the Supervisory Committee is and domestic auditor of the Company respectively independently accountable to the shareholders’ meeting. for the year ending on 31 December 2020 and to authorise the Board to fix the remuneration of the SHAREHOLDERS’ MEETING auditors; In 2020, the Company convened one shareholders’ 4. To approve the election or re-election of the meeting which was the annual general meeting for the Directors and Independent Directors of the year 2019 (the “2019 Annual General Meeting”). seventh session of the Board and to authorise any Director of the Company to sign the Directors’ On 26 May 2020, the Company held the 2019 Annual service contracts on behalf of the Company with General Meeting in Hong Kong to approve the following them and to authorise the Board to determine their resolutions, all of which were duly passed and approved remuneration; by the shareholders of the Company. Management presented at AGM held in Hong Kong and communicated with shareholders through video conferencing due to the Epidemic 132 China Telecom Corporation Limited Annual Report 2020
ENVIRONMENTAL, SOCIAL AND GOVERNANCE REPORT Corporate Governance Report 5. To approve the election or re-election of the Since the Company’s listing in 2002, at each of the Shareholder Representative Supervisors of the shareholders’ meetings, a separate shareholders’ seventh session of the Supervisory Committee resolution was proposed by the Company in respect of and to authorise any Director of the Company to each independent item. The circulars to shareholders sign the Supervisors’ service contracts on behalf also provided details of the resolutions. All votes on of the Company with them and to authorise resolutions tabled at the shareholders’ meetings of the the Supervisory Committee to determine their Company were conducted by poll and all voting results remuneration; were published on the websites of the Company and the Hong Kong Stock Exchange. The Company attaches 6. To approve the amendments to the Articles of great importance to the shareholders’ meetings and the Association and to authorise any Director of the communication between Directors and shareholders. The Company to complete registration or filing of the Directors provided detailed and sufficient answers to the amendments to the Articles of Association; questions raised by shareholders at the shareholders’ meetings. The Board implemented the Shareholders 7. To approve the issue of debentures by the Communication Policy to ensure that the shareholders are Company, to authorise the Board to issue provided with comprehensive, equal, understandable and debentures and determine the specific terms, public information of the Company on a timely basis and conditions and other matters of the debentures to facilitate the communication amongst the Company, and to approve the centralised registration of the shareholders and investors. debentures by the Company; COMPOSITION OF BOARD 8. To approve the issue of company bonds in the OF DIRECTORS AND BOARD PRC and to authorise the Board to issue company DIVERSITY POLICY bonds and determine the specific terms, conditions and other matters of the company bonds in the As at 31 December 2020, the Board consisted of 11 PRC; Directors with 6 Executive Directors, 1 Non-Executive Director and 4 Independent Non-Executive Directors. 9. To grant a general mandate to the Board to There is no relationship (including financial, business, issue, allot and deal with additional shares in family or other material or relevant relationship) among the the Company not exceeding 20% of each of the Board members. The Audit Committee, Remuneration existing domestic shares and H shares in issue and Committee and Nomination Committee under the Board to authorise the Board to increase the registered consist solely of Independent Non-Executive Directors, capital of the Company and to amend the Articles which ensures that the Committees are able to provide of Association of the Company to reflect such sufficient checks and balances and make independent increase in the registered capital of the Company judgements to protect the interests of the shareholders under the general mandate. and the Company as a whole. The number of Independent Non-Executive Directors exceeds one-third of the members of the Board. Mr. Tse Hau Yin, Aloysius, the China Telecom Corporation Limited Annual Report 2020 133
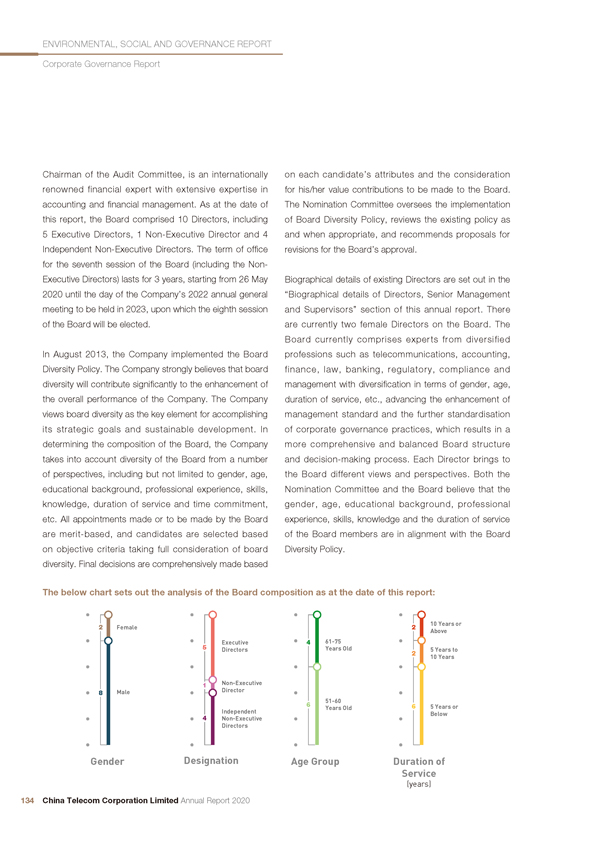
ENVIRONMENTAL, SOCIAL AND GOVERNANCE REPORT Corporate Governance Report Chairman of the Audit Committee, is an internationally on each candidate’s attributes and the consideration renowned financial expert with extensive expertise in for his/her value contributions to be made to the Board. accounting and financial management. As at the date of The Nomination Committee oversees the implementation this report, the Board comprised 10 Directors, including of Board Diversity Policy, reviews the existing policy as 5 Executive Directors, 1 Non-Executive Director and 4 and when appropriate, and recommends proposals for Independent Non-Executive Directors. The term of office revisions for the Board’s approval. for the seventh session of the Board (including the Non-Executive Directors) lasts for 3 years, starting from 26 May Biographical details of existing Directors are set out in the 2020 until the day of the Company’s 2022 annual general “Biographical details of Directors, Senior Management meeting to be held in 2023, upon which the eighth session and Supervisors” section of this annual report. There of the Board will be elected. are currently two female Directors on the Board. The Board currently comprises experts from diversified In August 2013, the Company implemented the Board professions such as telecommunications, accounting, Diversity Policy. The Company strongly believes that board finance, law, banking, regulatory, compliance and diversity will contribute significantly to the enhancement of management with diversification in terms of gender, age, the overall performance of the Company. The Company duration of service, etc., advancing the enhancement of views board diversity as the key element for accomplishing management standard and the further standardisation its strategic goals and sustainable development. In of corporate governance practices, which results in a determining the composition of the Board, the Company more comprehensive and balanced Board structure takes into account diversity of the Board from a number and decision-making process. Each Director brings to of perspectives, including but not limited to gender, age, the Board different views and perspectives. Both the educational background, professional experience, skills, Nomination Committee and the Board believe that the knowledge, duration of service and time commitment, gender, age, educational background, professional etc. All appointments made or to be made by the Board experience, skills, knowledge and the duration of service are merit-based, and candidates are selected based of the Board members are in alignment with the Board on objective criteria taking full consideration of board Diversity Policy. diversity. Final decisions are comprehensively made based The below chart sets out the analysis of the Board composition as at the date of this report: 10 Years or 2 Female 2 Above 5 Executive 4 61-75 Directors Years Old 5 Years to 2 10 Years 1 Non-Executive 8 Male Director 51-60 Independent 6 Years Old 6 5 Years or Below 4 Non-Executive Directors Gender Designation Age Group Duration of Service (years) 134 China Telecom Corporation Limited Annual Report 2020

ENVIRONMENTAL, SOCIAL AND GOVERNANCE REPORT Corporate Governance Report The Company strictly complies with the Corporate maintain highly efficient operations, as well as flexibility Governance Code to rigorously regulate the operating and swiftness in operational decision-making, the Board procedures of the Board and its Committees, and to may delegate its management and administrative powers ensure that the procedures of the Board meetings are to the management when necessary, and shall provide in compliance with related rules in terms of organisation, clear guidance regarding such delegation so as to avoid regulations and personnel. The Board responsibly impeding or undermining the capabilities of the Board and earnestly supervises the preparation of financial when exercising its powers as a whole. statements for each financial period, so that such financial statements truly and fairly reflect the financial condition, All members of the Board and Committees are informed the operating results and cash flows of the Company for of the meeting schedule for the Board and Committees such period. In preparing the financial statements for the for the year at the beginning of each year. In addition, year ended 31 December 2020, the Directors adopted all Directors will receive meeting notice at least 14 days appropriate accounting policies and made prudent, fair prior to the meeting under normal circumstances. The and reasonable judgements and estimates, and prepared Company Secretary is responsible for ensuring that the the financial statements on a going concern basis. Board meetings comply with all procedures, related rules and regulations while all Directors can make enquiries The Articles of Association clearly defines the respective to the Company Secretary for details to ensure that they duties of the Board and the management. The Board have received sufficient information on various matters set is accountable to the shareholders’ meetings, and out in the meeting agendas. its duties mainly include the execution of resolutions, formulation of major operational decisions, financial The Board holds at least 4 meetings in each year. proposals and policies, formulation of the Company���s Additional Board meetings will be held in accordance basic management system and the appointment of with practical needs. In 2020, the Company convened senior management. The management is responsible for 4 Board meetings in total and completed various written leading the production, operation and management of resolutions; the Chairman held a meeting to independently the Company, the implementation of Board resolutions communicate with the Independent Non-Executive and the annual operation plans and investment proposals Directors without the presence of any other Directors to of the Company, formulating the proposal of the ensure their opinions can be fully expressed, which further Company’s internal administrative organisations and sub- facilitated the exchange of different views within the Board. organisations, and performing other duties as authorised In 2020, the Board played a pivotal role in the Company’s by the Articles of Association and the Board. In order to operation, supervision, internal control, risk management China Telecom Corporation Limited Annual Report 2020 135
ENVIRONMENTAL, SOCIAL AND GOVERNANCE REPORT Corporate Governance Report and other significant decisions and corporate governance. DIRECTORS’ TRAINING AND Specifically, the Board reviewed matters including, but CONTINUOUS PROFESSIONAL not limited to, the Company’s annual and interim financial DEVELOPMENT statements, quarterly financial results, risk management and internal control implementation and assessment The Company provides guidelines including on directors’ report, annual proposal for profit distribution, amendments duties, continuing obligations, relevant laws and regulations, to the Articles of Association, approval and authorisation operation and business of the Company to newly appointed of the issuance of debentures, the budget of the Company Directors so that they are provided with tailored induction for the years 2020 and 2021, review of the structure and relating to their appointment. To ensure that the Directors are operations of the Board, proposal for directors and senior familiar with the Company’s latest operations for decision-management liabilities insurance, proposal for election or making, the Company arranges for key financial data re-election of the Directors of the seventh session of the and operational data to be provided to the Directors on a Board, election or re-election of the senior management, monthly basis. Meanwhile, through regular Board meetings chairman and members of the Board Committees, and reports from management, the Directors are able to remuneration proposal for the Directors of the seventh have clearer understanding of the operations, business session of the Board, report on relevant situations under strategy, and the latest development of the Company and the global Epidemic environment, re-appointment and the industry. In addition, the Company reminds the Directors remuneration of auditors, and the progress report on the of their functions and duties by continuously providing them preparation of the Environmental, Social and Governance with information regarding the latest development of the Report. Listing Rules and other applicable regulations, and arranging internal training on topics related to the latest development The Company determines the Directors’ remuneration of the industry and operational focus of the Company for with reference to factors such as their respective duties mutual exchange of ideas and discussion. The Directors and responsibilities in the Company, as well as their actively participate in training and continuous professional experience and market conditions at the relevant time. development to develop and refresh their knowledge and skills in order to contribute to the Company. The Board formulates and reviews the Company’s policies and practices on corporate governance; reviews and monitors the training and continuous professional development of Directors and senior management; reviews and monitors the Company’s policies and practices on compliance with legal and regulatory requirements; formulates, reviews and monitors the code of conduct for employees; and reviews the Company’s compliance with the Corporate Governance Code and disclosure in the Corporate Governance Report. 136 China Telecom Corporation Limited Annual Report 2020
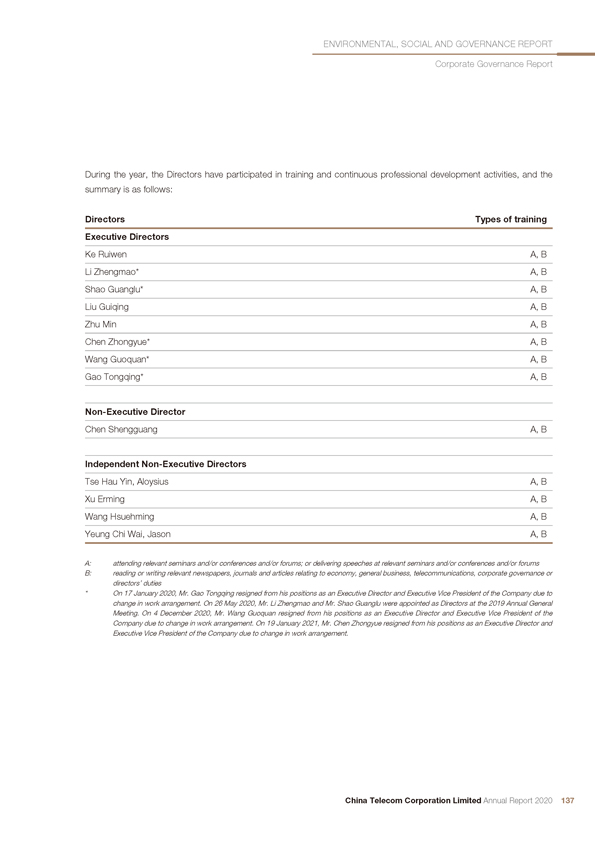
ENVIRONMENTAL, SOCIAL AND GOVERNANCE REPORT Corporate Governance Report During the year, the Directors have participated in training and continuous professional development activities, and the summary is as follows: Directors Types of training Executive Directors Ke Ruiwen A, B Li Zhengmao* A, B Shao Guanglu* A, B Liu Guiqing A, B Zhu Min A, B Chen Zhongyue* A, B Wang Guoquan* A, B Gao Tongqing* A, B Non-Executive Director Chen Shengguang A, B Independent Non-Executive Directors Tse Hau Yin, Aloysius A, B Xu Erming A, B Wang Hsuehming A, B Yeung Chi Wai, Jason A, B A: attending relevant seminars and/or conferences and/or forums; or delivering speeches at relevant seminars and/or conferences and/or forums B: reading or writing relevant newspapers, journals and articles relating to economy, general business, telecommunications, corporate governance or directors’ duties * On 17 January 2020, Mr. Gao Tongqing resigned from his positions as an Executive Director and Executive Vice President of the Company due to change in work arrangement. On 26 May 2020, Mr. Li Zhengmao and Mr. Shao Guanglu were appointed as Directors at the 2019 Annual General Meeting. On 4 December 2020, Mr. Wang Guoquan resigned from his positions as an Executive Director and Executive Vice President of the Company due to change in work arrangement. On 19 January 2021, Mr. Chen Zhongyue resigned from his positions as an Executive Director and Executive Vice President of the Company due to change in work arrangement. China Telecom Corporation Limited Annual Report 2020 137
ENVIRONMENTAL, SOCIAL AND GOVERNANCE REPORT Corporate Governance Report COMPLIANCE WITH THE with the adequacy of the staff’s training programmes and MODEL CODE FOR SECURITIES the related budget. The Audit Committee also has the TRANSACTIONS BY DIRECTORS authority to set up a reporting system on whistleblowing AND SUPERVISORS AND to receive and handle cases of complaints or complaints CONFIRMATION OF INDEPENDENCE made on an anonymous basis regarding the Company’s accounting, internal control and audit matters. EXECUTIVE DIRECTORS BY THE INDEPENDENT NON- In 2020, pursuant to the requirements of the governing laws and regulations of the places of listing and the The Company has adopted the Model Code for Securities Charter of the Audit Committee, the Audit Committee fully Transactions by Directors of Listed Issuers as set out assumed its responsibilities within the scope of the clear in Appendix 10 of the Listing Rules to govern securities mandate from the Board. The Audit Committee proposed transactions by the Directors and Supervisors. Based a number of practical and professional recommendations on the written confirmation from the Directors and for improvement based on the Company’s actual circumstances in order to promote the continuous Supervisors, the Company’s Directors and Supervisors improvement and perfection of corporate management. have strictly complied with the Model Code for Securities The Audit Committee has provided important support to Transactions by Directors of Listed Issuers in Appendix the Board and played a significant role in protecting the 10 of the Listing Rules regarding the requirements in conducting securities transactions for the year interests of the independent shareholders. 2020. Meanwhile, the Company has received annual In 2020, the Audit Committee convened 4 meetings and independence confirmation from each of the Independent passed 2 written resolutions, in which it reviewed matters Non-Executive Directors and considered them to be including but not limited to, the Company’s annual and independent. interim financial statements and quarterly financial results, assessment of the qualifications, independence and AUDIT COMMITTEE performance, appointments and remuneration of the external auditors, effectiveness of risk management and As at 31 December 2020, the Audit Committee comprised internal control systems, internal audit, implementation of 4 Independent Non-Executive Directors, Mr. Tse Hau Yin, continuing connected transactions, selection of external Aloysius as the Chairman and Mr. Xu Erming, Madam auditors, the progress work report of the change of Wang Hsuehming and Mr. Yeung Chi Wai, Jason as the external auditors, review of the operations in 2019 and members. The Audit Committee is responsible to the the Charter of the Audit Committee, and the progress Board. The Charter of the Audit Committee clearly defines report on the preparation of the Environmental, Social and the status, structure and qualifications, work procedures, Governance Report. The Audit Committee reviewed the duties and responsibilities, funding and remuneration, etc. annual auditor’s report, interim review report and quarterly of the Audit Committee. The Audit Committee’s principal agreed-upon procedures reports prepared by the external duties include the supervision of the truthfulness and auditors, communicated with the management and the completeness of the Company’s financial statements, external auditors in regard to the regular financial reports the effectiveness and completeness of the Company’s and proposed them for the Board’s approval after review internal control and risk management systems as well as and approval. The Audit Committee regularly received the work of the Company’s Internal Audit Department. It quarterly reports in relation to the internal audit and is also responsible for the supervision and review of the continuing connected transactions and provided guidance qualifications, selection and appointment, independence to the Internal Audit Department. Additionally, the Audit and services of external independent auditors. The Committee reviewed the internal control assessment and Audit Committee ensures that the management has the attestation report, followed up with the implementation discharged its duty to establish and maintain an effective procedures of the recommendations proposed by the risk management and internal control system including external auditors, reviewed the U.S. annual report, and the adequacy of resources, qualifications and experience communicated independently with the external auditors of staff fulfilling the accounting, internal control and twice a year. financial reporting functions of the Company together 138 China Telecom Corporation Limited Annual Report 2020
ENVIRONMENTAL, SOCIAL AND GOVERNANCE REPORT Corporate Governance Report REMUNERATION COMMITTEE NOMINATION COMMITTEE As at 31 December 2020, the Remuneration Committee As at 31 December 2020, the Nomination Committee comprised 3 Independent Non-Executive Directors, comprised 3 Independent Non-Executive Directors, Mr. Xu Erming as the Chairman and Mr. Tse Hau Yin, Madam Wang Hsuehming as the Chairlady and Mr. Tse Aloysius and Madam Wang Hsuehming as the members. Hau Yin, Aloysius and Mr. Xu Erming as the members. The Remuneration Committee is responsible to the The Nomination Committee is responsible to the Board. Board. The Charter of the Remuneration Committee The Charter of the Nomination Committee clearly defines clearly defines the status, structure and qualifications, the status, structure and qualifications, work procedures, work procedures, duties and responsibilities, funding duties and responsibilities, funding and remuneration, etc. and remuneration, etc. of the Remuneration Committee. of the Nomination Committee, and it specifically requires The Remuneration Committee assists the Board to that the Nomination Committee members shall have no formulate overall remuneration policy and structure for significant connection with the Company, and comply with the Company’s Directors and senior management, and the regulatory requirements related to “independence”. to establish related procedures that are standardised and The Nomination Committee assists the Board to formulate transparent. The Remuneration Committee’s principal standardised, prudent and transparent procedures for duties include giving recommendations to the Board in the appointment and succession plans of Directors, and respect of the overall remuneration policy and structure to further optimise the composition of the Board. The for the Company’s Directors and senior management and principal duties of the Nomination Committee include the establishment of a formal and transparent procedure regularly reviewing the structure, number of members, for developing remuneration policy, and determining, with composition and diversity of the Board; identifying delegated responsibility by the Board, the remuneration candidates and advising the Board with the appropriate packages of individual Executive Directors and senior qualifications for the position of Directors; reviewing management including benefits in kind, pension the Board Diversity Policy as appropriate to ensure its rights and compensation payments (including any effectiveness; evaluating the independence of Independent compensation payable for loss or termination of their Non-Executive Directors; advising the Board on matters office or appointment). Its responsibilities comply with the regarding the appointment or re-appointment of Directors requirements of the Corporate Governance Code. The and succession plans for the Directors (especially Remuneration Committee convened 1 meeting in 2020, Chairman and Chief Executive Officer). The Nomination during which it reviewed and discussed the remuneration Committee convened 1 meeting in 2020, during which proposals for the Directors of the seventh session of the it performed a review of the structure and operations of Board. the Board and considered the recommendation of the proposed candidates for the Directors of the seventh session of the Board. China Telecom Corporation Limited Annual Report 2020 139
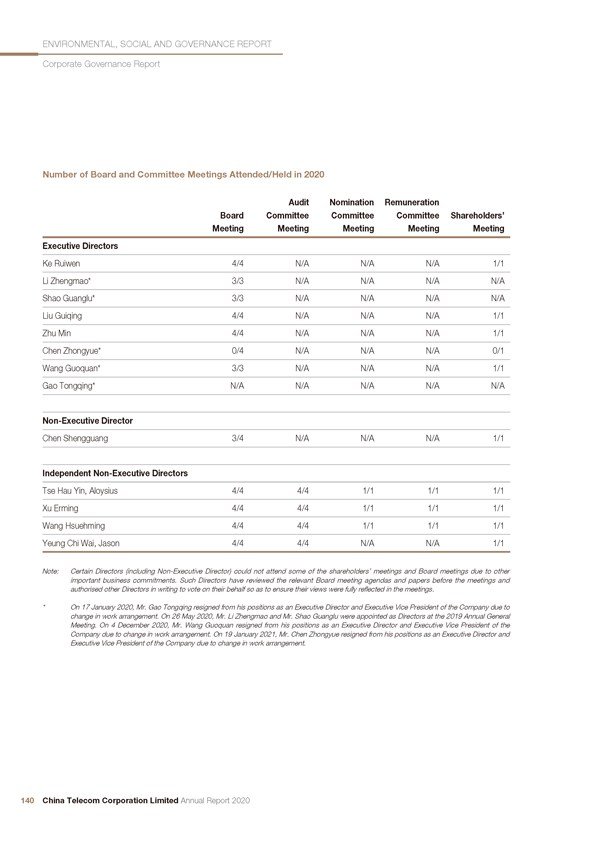
ENVIRONMENTAL, SOCIAL AND GOVERNANCE REPORT Corporate Governance Report Number of Board and Committee Meetings Attended/Held in 2020 Audit Nomination Remuneration Board Committee Committee Committee Shareholders’ Meeting Meeting Meeting Meeting Meeting Executive Directors Ke Ruiwen 4/4 N/A N/A N/A 1/1 Li Zhengmao* 3/3 N/A N/A N/A N/A Shao Guanglu* 3/3 N/A N/A N/A N/A Liu Guiqing 4/4 N/A N/A N/A 1/1 Zhu Min 4/4 N/A N/A N/A 1/1 Chen Zhongyue* 0/4 N/A N/A N/A 0/1 Wang Guoquan* 3/3 N/A N/A N/A 1/1 Gao Tongqing* N/A N/A N/A N/A N/A Non-Executive Director Chen Shengguang 3/4 N/A N/A N/A 1/1 Independent Non-Executive Directors Tse Hau Yin, Aloysius 4/4 4/4 1/1 1/1 1/1 Xu Erming 4/4 4/4 1/1 1/1 1/1 Wang Hsuehming 4/4 4/4 1/1 1/1 1/1 Yeung Chi Wai, Jason 4/4 4/4 N/A N/A 1/1 Note: Certain Directors (including Non-Executive Director) could not attend some of the shareholders’ meetings and Board meetings due to other important business commitments. Such Directors have reviewed the relevant Board meeting agendas and papers before the meetings and authorised other Directors in writing to vote on their behalf so as to ensure their views were fully reflected in the meetings. * On 17 January 2020, Mr. Gao Tongqing resigned from his positions as an Executive Director and Executive Vice President of the Company due to change in work arrangement. On 26 May 2020, Mr. Li Zhengmao and Mr. Shao Guanglu were appointed as Directors at the 2019 Annual General Meeting. On 4 December 2020, Mr. Wang Guoquan resigned from his positions as an Executive Director and Executive Vice President of the Company due to change in work arrangement. On 19 January 2021, Mr. Chen Zhongyue resigned from his positions as an Executive Director and Executive Vice President of the Company due to change in work arrangement. 140 China Telecom Corporation Limited Annual Report 2020
ENVIRONMENTAL, SOCIAL AND GOVERNANCE REPORT Corporate Governance Report The Company will identify suitable Director candidates minimum period during which written notice given to through multiple channels such as internal recruitment and the Company of the intention to propose a person for recruiting from the labour market. The criteria of identifying election as a Director, and during which written notice to candidates include but not limited to their gender, age, the Company by such person of his/her willingness to be educational background, professional experience, elected may be given, will be at least 7 days. Such period skills, knowledge and length of service and capability to will commence no earlier than the day after the despatch commit to the affairs of the Company and, in the case of the notice of the meeting for the purpose of considering of Independent Non-Executive Director, the candidates such election and shall end no later than 7 days prior should fulfill the independence requirements set out in to the date of such meeting. The ordinary resolutions to the Listing Rules from time to time. After the Nomination approve the appointment of Directors shall be passed Committee and the Board have reviewed and resolved to by votes representing more than one-half of the voting appoint the appropriate candidate, the relevant proposal rights represented by the shareholders (including proxies) will be put forward in writing to the shareholders’ meeting present at the meeting. for approval. SUPERVISORY COMMITTEE Directors shall be elected at the shareholders’ meeting for a term of 3 years. At the expiry of a Director’s As at 31 December 2020, the Company’s Supervisory term, the Director may stand for re-election and re- Committee comprised 5 Supervisors, including 2 appointment. According to the Articles of Association, Employee Representative Supervisors. The principal before the convening of the annual general meeting, duties of the Supervisory Committee include supervising, shareholders holding 3% or more of the total voting in accordance with the law, the Company’s financials shares of the Company shall have the right to propose and performance of its Directors, managers and other new motions (such as election of Directors) in writing, senior management so as to prevent them from abusing and the Company shall place such proposed motions their powers. The Supervisory Committee is a standing on the agenda for such annual general meeting if there supervisory organisation within the Company, which are matters falling within the functions and powers of is accountable to and reports to all shareholders. The shareholders in general meetings. According to the Supervisory Committee usually holds meetings at least Articles of Association, shareholders can also request for twice a year. The Supervisory Committee convened 2 the convening of extraordinary general meeting provided meetings in 2020. The term of office for the seventh that 2 or more shareholders holding in aggregate 10% session of the Supervisory Committee lasts for 3 years, or more of the shares carrying the right to vote at the starting from 26 May 2020 until the day of the 2022 meeting sought to be held and they shall sign one or more annual general meeting to be held in year 2023, upon written requisitions in the same format and with the same which the eighth session of the Supervisory Committee content, requiring the Board to convene an extraordinary will be elected. general meeting and stating the resolutions of meeting (such as election of Directors). The Board shall convene an extraordinary general meeting within 2 months. The China Telecom Corporation Limited Annual Report 2020 141
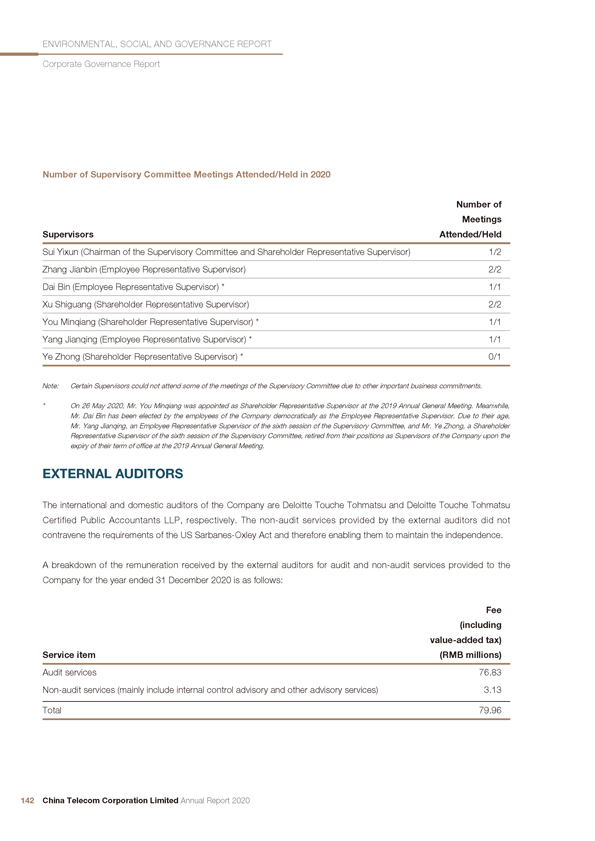
ENVIRONMENTAL, SOCIAL AND GOVERNANCE REPORT Corporate Governance Report Number of Supervisory Committee Meetings Attended/Held in 2020 Number of Meetings Supervisors Attended/Held Sui Yixun (Chairman of the Supervisory Committee and Shareholder Representative Supervisor) 1/2 Zhang Jianbin (Employee Representative Supervisor) 2/2 Dai Bin (Employee Representative Supervisor) * 1/1 Xu Shiguang (Shareholder Representative Supervisor) 2/2 You Minqiang (Shareholder Representative Supervisor) * 1/1 Yang Jianqing (Employee Representative Supervisor) * 1/1 Ye Zhong (Shareholder Representative Supervisor) * 0/1 Note: Certain Supervisors could not attend some of the meetings of the Supervisory Committee due to other important business commitments. * On 26 May 2020, Mr. You Minqiang was appointed as Shareholder Representative Supervisor at the 2019 Annual General Meeting. Meanwhile, Mr. Dai Bin has been elected by the employees of the Company democratically as the Employee Representative Supervisor. Due to their age, Mr. Yang Jianqing, an Employee Representative Supervisor of the sixth session of the Supervisory Committee, and Mr. Ye Zhong, a Shareholder Representative Supervisor of the sixth session of the Supervisory Committee, retired from their positions as Supervisors of the Company upon the expiry of their term of office at the 2019 Annual General Meeting. EXTERNAL AUDITORS The international and domestic auditors of the Company are Deloitte Touche Tohmatsu and Deloitte Touche Tohmatsu Certified Public Accountants LLP, respectively. The non-audit services provided by the external auditors did not contravene the requirements of the US Sarbanes-Oxley Act and therefore enabling them to maintain the independence. A breakdown of the remuneration received by the external auditors for audit and non-audit services provided to the Company for the year ended 31 December 2020 is as follows: Fee (including value-added tax) Service item (RMB millions) Audit services 76.83 Non-audit services (mainly include internal control advisory and other advisory services) 3.13 Total 79.96 142 China Telecom Corporation Limited Annual Report 2020
ENVIRONMENTAL, SOCIAL AND GOVERNANCE REPORT Corporate Governance Report The Directors of the Company are responsible for RISK MANAGEMENT AND the preparation of consolidated financial statements INTERNAL CONTROL SYSTEMS that give a true and fair view in accordance with the International Financial Reporting Standards as issued by The Board attaches great importance to the establishment the International Accounting Standards Board and the and perfection of the risk management and internal control disclosure requirements of the Hong Kong Companies systems. The Board is responsible for evaluating and Ordinance, and for such internal control as the Directors determining the nature and extent of the risks it is willing determine is necessary to enable the preparation of to take in achieving the Company’s strategic objectives, consolidated financial statements that are free from and ensuring that the Company establishes and maintains material misstatement, whether due to fraud or error. The appropriate and effective risk management and internal Directors were not aware of any material uncertainties control systems, and the Board acknowledges that it is relating to any events or conditions which may cast a responsible for the risk management and internal control serious impact upon the Group’s ability to continue as a systems and for reviewing their effectiveness. Such going concern. The statements by the external auditors systems are designed to manage rather than eliminate of the Company, Deloitte Touche Tohmatsu, regarding the risk of failure to achieve business objectives, and their reporting responsibilities on the consolidated financial can only provide reasonable but not absolute assurance statements of the Company is set out in the Independent against material misstatements or losses. The Board Auditor’s Report on pages 160 to 163 of this annual oversees management in the design, implementation report. and monitoring of the risk management and internal control systems. The Board takes effective approaches to Since the approval at the annual general meeting of supervise the implementation of related control measures, the Company for the year 2012, the external auditors, whilst enhancing operation efficiency and effectiveness, Deloitte Touche Tohmatsu and Deloitte Touche Tohmatsu and optimising corporate governance, risk assessment, Certified Public Accountants LLP have provided audit risk management and internal control so that the services for the Company for eight consecutive years. Company can achieve long-term development goals. Pursuant to the relevant regulations issued by the Ministry of Finance of the People’s Republic of China and SASAC, The risk management and internal control systems of the service term of Deloitte Touche Tohmatsu and Deloitte the Company is built on clear organisational structure Touche Tohmatsu Certified Public Accountants LLP will and management duties, an effective delegation and expire soon. They will retire as the international auditors accountability system, definite targets, policies and and domestic auditors of the Company effective upon procedures, comprehensive risk assessment and the close of the forthcoming annual general meeting management, a sound financial accounting system, of the Company for the year 2020 and will not be re- and continuing analysis and supervision of operational appointed. Pursuant to the open selection process, and as performance, etc. which plays a pivotal role in the recommended by the Audit Committee of the Company, Company’s overall operation. The Company has the Board has resolved to propose for the shareholders’ formulated a code of conduct for the senior management approval for the appointment of PricewaterhouseCoopers and employees which ensures their ethical value and and PricewaterhouseCoopers Zhong Tian LLP as the competency. The Company attaches great importance Company’s external auditors for the year ending 31 to the prevention of fraud and has formulated its internal December 2021 at the 2020 Annual General Meeting. reporting system, which encourages anonymous reporting of situations where employees, especially Directors and senior management, breach the rules. China Telecom Corporation Limited Annual Report 2020 143
ENVIRONMENTAL, SOCIAL AND GOVERNANCE REPORT Corporate Governance Report The Company views comprehensive risk management as In 2021, the potential significant risks and the major risk-an important task within the Company’s daily operation. prevention and countering measures are as follows: Pursuant to regulatory requirements in capital markets of the United States and Hong Kong, the Company has Economic and policy environment adaptation risks: formulated a featured 5-step risk management approach Facing the risks and challenges, such as the increasing based on risk management theory and practice to uncertainties in the economy development, the wide-achieve closed-loop management of risk identification, ranging impact of the global COVID-19 Epidemic, the risk assessment, key risk analysis, risk reaction and risk gradual impacts of regulatory policies’ adjustments in the management assessment. In continuously strengthening industry, the official commencement of the 5G era, and the risk process control and management and focusing the apparent increase in the sources of global unrest and on significant risk which may be encountered, the risks, the Company will actively respond to the change in Company established a risk monitoring team, to follow environment, implement the requirements of regulatory and report the status of risk management and control policies, accelerate the construction of information regularly, improve the collection mechanism of risk-related infrastructure represented by 5G, innovate 5G applications information and identify the potential flaws of risk in a and business models, deepen reform and innovation, timely manner. Following the efforts made over the years, expedite “Cloudification and Digital Transformation”, the Company has established a structured and highly expand ecological cooperation, perfect overseas effective comprehensive risk management system and compliance management system and pragmatically has gradually perfected its comprehensive risk monitoring promote corporate high-quality development. and prevention mechanism. Business development risks: Facing the needs to cultivate In 2020, pursuant to the requirement of code provision C2 5G new applications and businesses and the persistent of the Corporate Governance Code promulgated by the upgrade of customers’ needs, the Company will focus Hong Kong Stock Exchange, the Company concentrated on customers’ needs, enhance the quality of service, resources on the prevention of significant potential risks, expand subscriber scale, promote corporate high-quality and strived to reduce negative effect from significant risks. development and in-depth cloud-network integration, The Company was not confronted by any major risk event comprehensively apply new technologies such as the 5G, throughout the whole year. cloud, Big Data, the Internet of Things and AI, implement the upgrades of marketing service strategies for individual, The Company has identified, assessed and analysed family, government and enterprise market and expedite potential major risks faced by the Company in 2021, the expansion in the market for emerging businesses such including economic and policy environment adaptation as DICT, Internet of Things and Internet Finance, marching risks, business development risks and network and steadily towards becoming a leading integrated intelligent information security risks etc., and has put forward information services provider. detailed response plans. Through strict and appropriate risk management procedures, the Company will ensure Network and information security risks: Facing the risks the potential impact from the above risks on the Company and challenges of network and information security, the is limited and within an expected range. Company will enhance the related sci-tech innovation capabilities, speed up the construction of network 144 China Telecom Corporation Limited Annual Report 2020
ENVIRONMENTAL, SOCIAL AND GOVERNANCE REPORT Corporate Governance Report information security integrated system and capabilities The Company highly values the compliance with the laws development, strengthen the protection of key information and regulations of the PRC as well as the places of listing infrastructure and expand the network information security of the Company and where the Company’s business products and services, building network information operations are located, strictly complies with all laws security ecology so as to provide reliable network and regulations and timely and proactively incorporates information security protection for subscribers. the laws and regulations into the Company’s rules and regulations to protect the Company’s legitimate business The American Depositary Shares (the “ADSs”) of the management, maintain the Company’s legitimate rights Company may be subject to the risk of being delisted. and interests and support the corporate to achieve long-On 6 January 2021 (US Eastern standard time), The term healthy development target. NYSE announced that it had determined to re-commence proceedings to delist the ADSs of the Company (the In August 2018, the Standing Committee of the National “Determination”). Trading in the ADSs of the Company People’s Congress (the “NPCSC”) approved the was suspended at 4:00 a.m. (US Eastern standard time) E-Commerce Law of the People’s Republic of China, on 11 January 2021. The Determination may affect the which was formally implemented on 1 January 2019. The trading prices and volumes of the Company’s H shares E-Commerce Law consists of seven chapters and eighty and ADSs and may result in the Company’s ADSs being nine articles which further regulate e-commerce activities delisted. In order to protect the legitimate interests of the conducted by relevant parties including e-commerce Company and its shareholders, the Company filed with the platform operators (“e-commerce platforms”). The NYSE a written request for a review of the Determination E-Commerce Law defines and confirms, for the first by a Committee of the Board of Directors of the NYSE. time, the obligation of e-commerce platforms to protect The Company will continue to pay close attention to the the consumers’ security, and requires them to bear development of related matters and also seek professional the corresponding responsibility when the obligation advice and reserve all rights to protect the legitimate is breached. It further refines the regulation for the interests of the Company. responsibility of intellectual property infringement on the e-commerce platforms, regulates the industrial Furthermore, the Company’s operations of telecommunications and commercial registration and tax collection and services in other jurisdictions are also subject to the licensing management of e-commerce operators, requires and other regulatory requirements and supervision of the e-commerce operators to publish information when local regulatory authorities. The license of the Company’s terminating transactions at their own discretion, prohibits subsidiary to provide telecommunications services in the fabricating transactions and user comments to defraud United States may be subject to actions by the relevant and mislead consumers, prohibits the e-commerce authorities in the United States and the Company cannot platforms from abusing the dominant market position to assure that it will be able to maintain that license in the future. exclude and restrict competition, regulates the rules of The Company’s subsidiary will continue to cooperate with deposits collection and refund, requests the products the regulatory authorities by providing additional details to participating in bidding ranking with the results marked support the Company’s position and address any concerns. therein. China Telecom Corporation Limited Annual Report 2020 145
ENVIRONMENTAL, SOCIAL AND GOVERNANCE REPORT Corporate Governance Report On 23 August 2018, the Ministry of Industry and trade secret infringement. Fourth, the penalty on trade Information Technology promulgated the Notice of secret infringement has been increased. Fifth, in relation Ministry of Industry and Information Technology on Further to the allocation of burden of proof for trade secret Regulating Marketing Activities for Telecommunications infringement in the civil trial procedure, it stipulates that Tariff Schemes (the “Notice”) which became effective from the right holder may only need to provide preliminary 23 August 2018. The Notice encourages fundamental evidences which can prove that the right holder has taken telecommunications enterprises to provide a tiered confidentiality measures and can reasonably indicate that discount pricing formula for tariff plans according to the the trade secret has been infringed. The amendments usage amount of the users and simplify the structure to the Anti-Unfair Competition Law strengthened the of tariff packages. In formulating and implementing the protection of intellectual property rights in China and had tariff plans of bundled packages, the tariff plans for a positive impact on the establishment of a fair market each respective service should also be provided, and order and protection of the legitimate interests of the right the tariff rates disclosure policy should be improved. holders. When promoting the tariff plans, the telecommunications enterprises shall fulfil its obligation to remind the users with On 11 November 2019, the Ministry of Industry and respect to matters they shall pay attention to, including Information Technology promulgated the Notice of the restrictive conditions, the validity period and the the Ministry of Industry and Information Technology charging principles. The same type of users with the same on Printing and Publishing the Regulations on the transaction conditions should be guaranteed with equal Management of Mobile Number Portability Service. The rights to select the tariff plans. Regulations on the Management of Mobile Number Portability Service (the “Regulations”) became effective On 23 April 2019, the NPCSC promulgated the amended on 1 December 2019. The Regulations expressly allow Anti-Unfair Competition Law of the People’s Republic the cellular mobile telecommunication users (excluding of China (the “Anti-Unfair Competition Law”), which was the users of Internet of Things) to apply for a change of formally implemented on the same day. The amendments the contracted fundamental business operator within to the Anti-Unfair Competition Law mainly involve the the same local network area whilst retaining their phone provisions regarding the trade secrets of intellectual numbers unchanged. Telecommunications business property rights. First, the scope of trade secrets has operators should strictly implement the relevant provisions been expanded through the incorporation of a catch-all on the real-name registration of users of mobile number description, which is no longer limited to “technical” or portability service and ensure that the users whose “business operation” information. Second, the scope of mobile numbers have been transferred from other the trade secret infringer has been expanded. Apart from networks should be entitled to the same rights under the business operators, other natural persons, legal persons same conditions. Providing an important basis for the and non-legal entities have been included in the scope of supervision and inspection of the telecommunications the subject of liability for trade secret infringement. Third, regulators, the Regulations explicitly require that in the given the practical situation of evolving infringement means course of providing the mobile number portability service and conducts, it has been clarified that misappropriation telecommunications business operators should not of trade secrets through electronic intrusion or indirect engage in 9 types of prohibited conducts including to means, such as instigating, inducing and aiding others refuse, prevent or delay the provision of mobile number to acquire the right holder’s trade secrets, will constitute portability service to users without justifiable reasons, 146 China Telecom Corporation Limited Annual Report 2020
ENVIRONMENTAL, SOCIAL AND GOVERNANCE REPORT Corporate Governance Report to restrict the users from switching to another network and services that affect or may affect national security. It by means of expanding the scope of the agreement further clarifies the standards and procedures of review in relation the terms of service, to affect the quality of and stipulates that if the reviewers fail to be objective and telecommunications service provided to the mobile fair, or are unable to undertake the obligation to remain number portability service users through technical the confidentiality of the information received during the measures such as interception and restriction, to conduct review, the operators or network product and service a comparative promotion, fabricate or disseminate providers may report this to the Cyber Security Review false or misleading information or discredit other Office or other relevant departments. telecommunication business operators when promoting the mobile number portability service and the relevant On 28 May 2020, the third session of the 13th National tariff plans, to design special tariff plans and marketing People’s Congress passed the Civil Code of the People’s schemes for mobile number portability service users, Republic of China (the “Civil Code”), which was formally continue to occupy the mobile numbers transferred-in implemented on 1 January 2021. The Civil Code, for the while the users have exited the network and to hinder or first time, codifies the right of privacy as an independent disrupt the normal operation of mobile number portability personality right, stipulates a series of specific rules service by means of handling the mobile number transfer and formulates a framework of fundamental rights and maliciously on behalf of the users, making complaints obligations between natural persons and information processors. When conducting businesses, enterprises maliciously on behalf of the users, etc. shall effectively strengthen the awareness of privacy rights of natural persons and personal data protection and On 13 April 2020, the Cyberspace Administration of China, strictly adhere to the principles of legality, justification and the National Development and Reform Commission, necessity. Enterprises shall collect and process personal the Ministry of Industry and Information Technology, the information in strict compliance with the conditions as Ministry of Public Security, the Ministry of State Security stipulated by laws and definitive agreements with the data and other government departments jointly formulated the subject concerned, and shall not over collect or process Cyber Security Review Measures (the “Measures”), which became effective on 1 June 2020. The Measures further the data. The Civil Code provides principle provisions refines the relevant provisions in the Interim Security on the protection of data and online virtual assets. The Company should continue to strengthen the protection Review Measures for Network Products and Services, of intangible assets such as proprietary data, online which requires critical information infrastructures operators virtual assets and intellectual property and enhance the to make declaration when procuring network products compliance on the usage of such intangible assets. China Telecom Corporation Limited Annual Report 2020 147
ENVIRONMENTAL, SOCIAL AND GOVERNANCE REPORT Corporate Governance Report Apart from implementing the relevant latest and newly- internal control, enhancing the safety of the Company’s amended laws and regulations in a timely manner, the information system so that the integrity, timeliness and Company also actively and closely monitors forthcoming reliability of data and information are maintained. At the changes in the relevant laws and regulations in order to same time, the Company attaches great importance to strengthen the management of the relevant business the control and monitoring of network information safety. operation behaviour, and safeguards the effective The Company persistently optimises the relevant rules adherence to relevant laws and regulations so as and guidances, further defines the responsible entities and to ensure that the Company’s operations are in full regularly commences the inspection of network safety and compliance with the laws. information safety in order to promote the enhancement of the awareness of network information safety and relevant Since 2003, based on the requirements of the U.S. skills and knowledge. securities regulatory authorities and the COSO Internal Control Framework, and with the assistance of other In 2020, based on external regulatory supervision, advisory institutions including external auditors, the changes in policy environment and requirements for Company has formulated manuals, implementation rules prevention and control of the Company’s key risks, and related rules in relation to internal control, and has the Company also took into account measures for developed the Policies on Internal Control Management deepened reform and innovation and changes in business and Internal Control Accountability Management to development. In order to focus on responding quickly ensure the effective implementation of the above systems. to market demands and supporting business innovation The Company has all along continuously revises and and operational innovation for enterprises, the Company improves the manuals and implementation rules in view conducted annual revision of internal control manuals, of the ever changing internal and external operation list of authority and implementation guidance. The environment as well as the requirements of business Company also supplemented and improved the contents development over the years. While continuing to improve of information technology strategic plan, cybersecurity the internal control related policies, the Company has deficiency management and management for providing also been strengthening its IT internal control capabilities, services to specific customers for free and optimised which has improved the efficiency and effectiveness of and adjusted business processes such as fixed asset maintenance and compliance with laws and regulations. 148 China Telecom Corporation Limited Annual Report 2020
ENVIRONMENTAL, SOCIAL AND GOVERNANCE REPORT Corporate Governance Report The Internal Audit Department plays a vital role in evaluate the nature of internal control deficiencies and supporting the Board, the management and the risk reach a conclusion as to the effectiveness of the internal management and internal control systems. The functions control system, the Company adopts the following 4 of the Internal Audit Department, which are independent of major steps of assessment: (1) analyse and identify areas the Company’s business operations, are complementary which require assessment, (2) assess the effectiveness with the functions of the external auditors while the Internal of the design of internal control, (3) assess the operating Audit Department plays an important role in the monitoring effectiveness of internal control, (4) analyse the impact of the Company’s internal management. The Internal Audit of deficiencies in internal control, judge the nature of Department is responsible for internal control assessment deficiencies in internal control and conclude on the of the Company, and provides an objective assurance effectiveness of the internal control system. At the same to the Audit Committee and the Board that the risk time, the Company rectifies any deficiencies found during management and internal control systems are maintained the assessment. By formulating the amended “Measures and operated by the management in compliance with for the Internal Control Assessment”, the “Manual for the agreed processes and standards. The Internal Audit Self-Assessment of Internal Control”, the “Manual for the Department regularly reports the internal audit results to Independent Assessment of Internal Control” and other the Audit Committee on a quarterly basis, and reports regulations, the Company has ensured the assessment the internal audit results to the Board through the Audit procedures are in compliance. In 2020, the Company’s Committee. Internal Audit Department initiated and coordinated the assessment of internal control all over the Company, ANNUAL EVALUATION OF RISK and reported the results to the Audit Committee and the MANAGEMENT AND INTERNAL Board. CONTROL SYSTEMS In terms of internal control self-assessment, the The Company has been continuously improving its Company continued to insist on 100% coverage of all risk management and internal control systems so as units (including the newly incorporated professional to meet the regulatory requirements of its places of companies). Through the self-assessment for the listing, including the United States and Hong Kong, and year 2020, management responsibilities were further strengthen its internal control while guarding against strengthened, and top leaders of companies at all levels operational risk. were identified as primary individuals responsible for self-assessment for fulfilment with prime responsibility. The Company has adopted the COSO Internal Control The Company enhanced the self-assessment of the Framework (2013) as the standard for the internal control development and the operation effectiveness of the assessment. With the management’s internal control integrated supervision system for internal control, risk testing guidelines and the Auditing Standard No. 2201 and compliance management, and further intensified that were issued by The Public Company Accounting the self-assessment of cross-level, cross-department Oversight Board (PCAOB) as its directives, the Company’s and cross-system processes. Through collaboration, internal control assessment system is composed of the the Company built the internal control self-assessment self-assessment conducted by the persons responsible for mechanism that was mutually integrated, collaborative internal control together with the independent assessment and efficient. Taking into account changes in internal and conducted by the Internal Audit Department. In order to external environment and risk prevention focuses and China Telecom Corporation Limited Annual Report 2020 149
ENVIRONMENTAL, SOCIAL AND GOVERNANCE REPORT Corporate Governance Report focusing on the integrity and reliability of financial reports, Furthermore, the Company organised the risk management compliance of operation and management and key risk and internal control assessment team and other relevant control areas, the Company assessed the effectiveness departments to closely coordinate with the external of the design and implementation of internal control and auditors’ audit of internal control over financial reporting. focused on the soundness and effectiveness of enterprise The internal control audit performed by the external risk management system and compliance with laws and auditor covered the Company and all of its subsidiaries as regulations in light of increasing downward pressure on well as the key processes and control points in relation to the economy, complex and ever-changing international material financial statements items. The external auditors situation and growing complexity of business environment. regularly communicated with the management in respect In response to the internal control deficiencies identified of the audit results. during the self-assessment, the Company identified the responsibilities one by one, timely rectified the deficiencies, The Company attaches great importance to rectifying and effectively controlled and prevented any potential risks internal control deficiencies. Focusing on deficiencies and to continuously improve the effectiveness of the design problems identified through self-assessment, independent and implementation of internal control. assessment and internal and external audit, particularly cross-departmental and cross-professional problems, the The internal control independent assessment was Company actively mobilised the function of collaborative conducted with full coverage of all relevant units for risk prevention. The relevant business departments jointly a period of three years. On this basis, the scope discussed and formulated rectification measures, specified of assessment was further expanded in 2020 and the acceptance criteria and monitored the rectification independent assessment was conducted on 4 provincial results. Entities at all levels carried out multi-layered and branches and 10 professional companies. In terms full-dimensional reviews of its internal control system of the assessment method, firstly, the Company through self-assessments and independent assessments further enhanced the integration with internal control and put its utmost efforts into rectifying the problems self-assessment and inspected the quality of self- which were identified. Through this method, the Company assessment in the independent assessment, promoted was able to ensure the effectiveness of its internal the improvement of the self-inspection and self-healing control and successfully passed the year-end attestation capabilities of the relevant units. Secondly, several undertaken by the external auditors. departments of the Company jointly conducted special investigations to evaluate the risk areas affecting the The Board oversees the Company’s risk management development of the company from multiple perspectives. and internal control systems on an on-going basis and In terms of assessment areas, the Company focused on the Board, through the Audit Committee, conducted the soundness of internal control system and effectiveness an annual review of the risk management and internal of the design and implementation of internal control, in control systems of the Company and its subsidiaries particular high-risk areas and problems that occurred for the financial year ended 31 December 2020, which frequently and analysed the cause of identified problems, covered all material areas including financial controls, promoting the rectification from point to surface. During operational controls and compliance controls, as well as the year, the independent assessment of internal control its risk management functions. After receiving the reports improved the quality of assessment and effectiveness of from the Internal Audit Department and the confirmation rectification, effectively prevented risks and enhanced the from the management to the Board on the effectiveness corporate self-healing capability, and safeguarded the of the Company’s risk management and internal control healthy corporate development. systems (including Environmental, Social and Governance risk management and internal control systems), the 150 China Telecom Corporation Limited Annual Report 2020
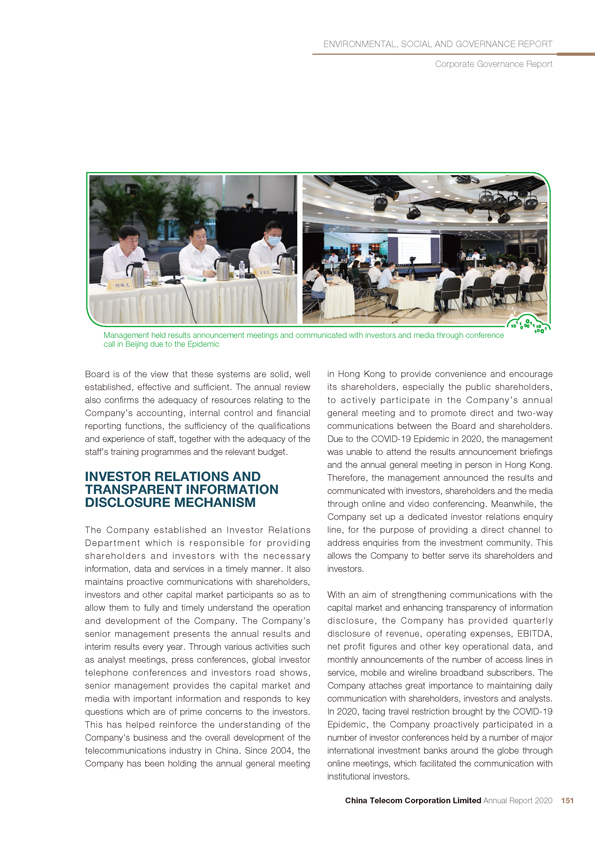
ENVIRONMENTAL, SOCIAL AND GOVERNANCE REPORT Corporate Governance Report Management held results announcement meetings and communicated with investors and media through conference call in Beijing due to the Epidemic Board is of the view that these systems are solid, well in Hong Kong to provide convenience and encourage established, effective and sufficient. The annual review its shareholders, especially the public shareholders, also confirms the adequacy of resources relating to the to actively participate in the Company’s annual Company’s accounting, internal control and financial general meeting and to promote direct and two-way reporting functions, the sufficiency of the qualifications communications between the Board and shareholders. and experience of staff, together with the adequacy of the Due to the COVID-19 Epidemic in 2020, the management staff’s training programmes and the relevant budget. was unable to attend the results announcement briefings and the annual general meeting in person in Hong Kong. INVESTOR RELATIONS AND Therefore, the management announced the results and TRANSPARENT INFORMATION communicated with investors, shareholders and the media DISCLOSURE MECHANISM through online and video conferencing. Meanwhile, the Company set up a dedicated investor relations enquiry The Company established an Investor Relations line, for the purpose of providing a direct channel to Department which is responsible for providing address enquiries from the investment community. This shareholders and investors with the necessary allows the Company to better serve its shareholders and information, data and services in a timely manner. It also investors. maintains proactive communications with shareholders, investors and other capital market participants so as to With an aim of strengthening communications with the allow them to fully and timely understand the operation capital market and enhancing transparency of information and development of the Company. The Company’s disclosure, the Company has provided quarterly senior management presents the annual results and disclosure of revenue, operating expenses, EBITDA, interim results every year. Through various activities such net profit figures and other key operational data, and as analyst meetings, press conferences, global investor monthly announcements of the number of access lines in telephone conferences and investors road shows, service, mobile and wireline broadband subscribers. The senior management provides the capital market and Company attaches great importance to maintaining daily media with important information and responds to key communication with shareholders, investors and analysts. questions which are of prime concerns to the investors. In 2020, facing travel restriction brought by the COVID-19 This has helped reinforce the understanding of the Epidemic, the Company proactively participated in a Company’s business and the overall development of the number of investor conferences held by a number of major telecommunications industry in China. Since 2004, the international investment banks around the globe through Company has been holding the annual general meeting online meetings, which facilitated the communication with institutional investors. China Telecom Corporation Limited Annual Report 2020 151
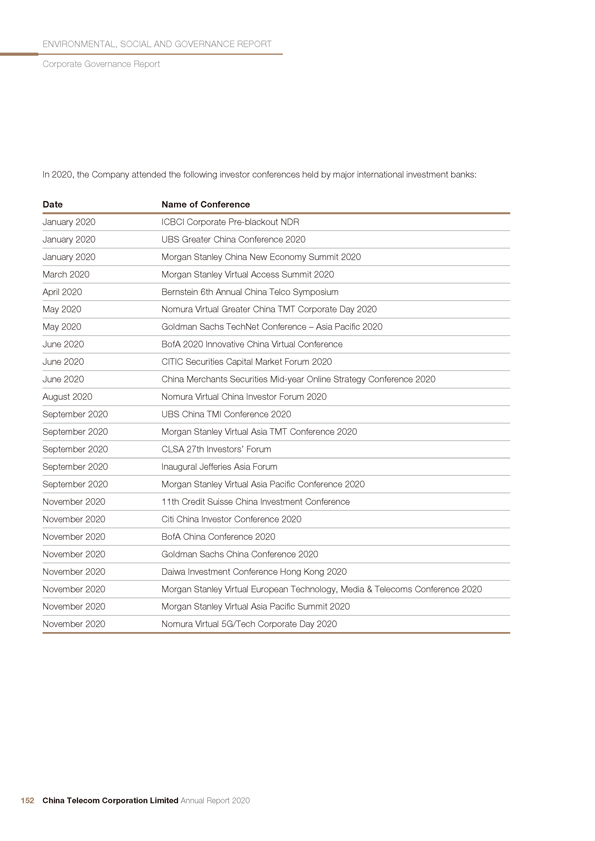
ENVIRONMENTAL, SOCIAL AND GOVERNANCE REPORT Corporate Governance Report In 2020, the Company attended the following investor conferences held by major international investment banks: Date Name of Conference January 2020 ICBCI Corporate Pre-blackout NDR January 2020 UBS Greater China Conference 2020 January 2020 Morgan Stanley China New Economy Summit 2020 March 2020 Morgan Stanley Virtual Access Summit 2020 April 2020 Bernstein 6th Annual China Telco Symposium May 2020 Nomura Virtual Greater China TMT Corporate Day 2020 May 2020 Goldman Sachs TechNet Conference – Asia Pacific 2020 June 2020 BofA 2020 Innovative China Virtual Conference June 2020 CITIC Securities Capital Market Forum 2020 June 2020 China Merchants Securities Mid-year Online Strategy Conference 2020 August 2020 Nomura Virtual China Investor Forum 2020 September 2020 UBS China TMI Conference 2020 September 2020 Morgan Stanley Virtual Asia TMT Conference 2020 September 2020 CLSA 27th Investors’ Forum September 2020 Inaugural Jefferies Asia Forum September 2020 Morgan Stanley Virtual Asia Pacific Conference 2020 November 2020 11th Credit Suisse China Investment Conference November 2020 Citi China Investor Conference 2020 November 2020 BofA China Conference 2020 November 2020 Goldman Sachs China Conference 2020 November 2020 Daiwa Investment Conference Hong Kong 2020 November 2020 Morgan Stanley Virtual European Technology, Media & Telecoms Conference 2020 November 2020 Morgan Stanley Virtual Asia Pacific Summit 2020 November 2020 Nomura Virtual 5G/Tech Corporate Day 2020 152 China Telecom Corporation Limited Annual Report 2020
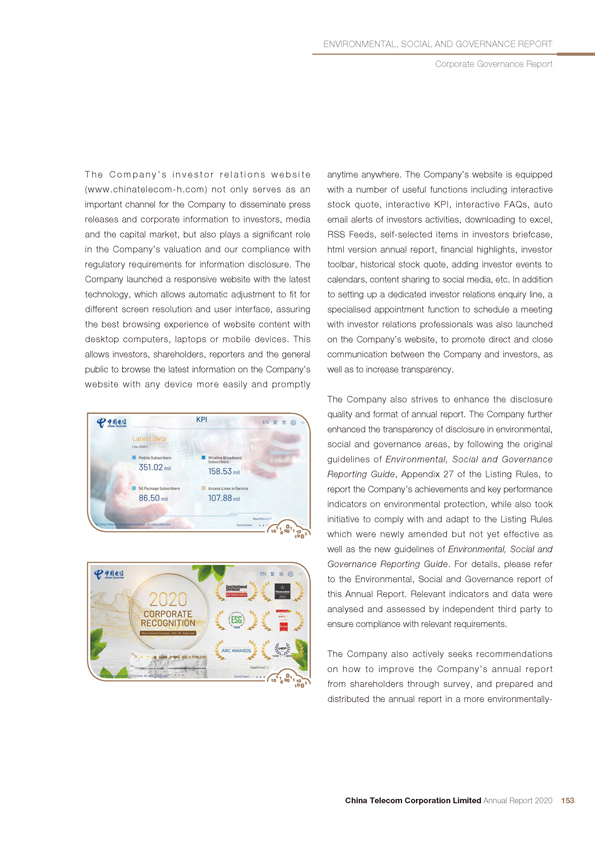
ENVIRONMENTAL, SOCIAL AND GOVERNANCE REPORT Corporate Governance Report The Company’s investor relations website anytime anywhere. The Company’s website is equipped (www.chinatelecom-h.com) not only serves as an with a number of useful functions including interactive important channel for the Company to disseminate press stock quote, interactive KPI, interactive FAQs, auto releases and corporate information to investors, media email alerts of investors activities, downloading to excel, and the capital market, but also plays a significant role RSS Feeds, self-selected items in investors briefcase, in the Company’s valuation and our compliance with html version annual report, financial highlights, investor regulatory requirements for information disclosure. The toolbar, historical stock quote, adding investor events to Company launched a responsive website with the latest calendars, content sharing to social media, etc. In addition technology, which allows automatic adjustment to fit for to setting up a dedicated investor relations enquiry line, a different screen resolution and user interface, assuring specialised appointment function to schedule a meeting the best browsing experience of website content with with investor relations professionals was also launched desktop computers, laptops or mobile devices. This on the Company’s website, to promote direct and close allows investors, shareholders, reporters and the general communication between the Company and investors, as public to browse the latest information on the Company’s well as to increase transparency. website with any device more easily and promptly The Company also strives to enhance the disclosure quality and format of annual report. The Company further enhanced the transparency of disclosure in environmental, social and governance areas, by following the original guidelines of Environmental, Social and Governance Reporting Guide, Appendix 27 of the Listing Rules, to report the Company’s achievements and key performance indicators on environmental protection, while also took initiative to comply with and adapt to the Listing Rules which were newly amended but not yet effective as well as the new guidelines of Environmental, Social and Governance Reporting Guide. For details, please refer to the Environmental, Social and Governance report of this Annual Report. Relevant indicators and data were analysed and assessed by independent third party to ensure compliance with relevant requirements. The Company also actively seeks recommendations on how to improve the Company’s annual report from shareholders through survey, and prepared and distributed the annual report in a more environmentally- China Telecom Corporation Limited Annual Report 2020 153
ENVIRONMENTAL, SOCIAL AND GOVERNANCE REPORT Corporate Governance Report friendly and cost-saving manner according to the The Company has always maintained a sound and recommendations received. Shareholders can ascertain effective information disclosure mechanism while keeping their choice of receiving the annual reports and highly transparent communications with media, analysts communications by electronic means, or receiving printed and investors. Meanwhile, we attach great importance version in English and/or Chinese. The Company clearly to the handling of inside information and have formulated and precisely delivered the messages about its strategies rules on information disclosures and guidelines on inside and goals in its 2019 Annual Report “Connecting Infinity, information which encompass (including but not limited to) Empowering Future”, so that shareholders and investors disclosure of sensitive information and rules on confidential can easily understand the Company’s development information, identifying the scope of inside information, directions and focus. The print and online versions of procedure and management guidelines on handling 2019 Annual Report won a number of top accolades in inside information. In general, the authorised speakers international competitions, including being ranked No.7 only clarify and explain on information that is available of “Top 100 Reports Worldwide” (No.1 in Asia Pacific) in on the market, and avoid providing or divulging any “LACP 2019 Vision Awards”. They also received a number unpublished inside information either as an individual or of platinum and gold awards in categories including as a team. Before conducting any external interview, if the telecommunications and technology industries, among authorised speaker has any doubt about the information others. In addition, the Company’s print Annual Report to be disclosed, he/she would seek verification from the has earned the gold award in “2020 International ARC relevant person or the person-in-charge of the relevant Awards”. These prestigious honours reflect the unanimous department, so as to determine if such information is worldwide recognition towards China Telecom’s tireless accurate. In addition, discussions on the Company’s key pursuit of excellence and globally leading performance financial data or other financial indicators are avoided on corporate governance and disclosure, on both during the blackout periods. conventional and digital channels. 154 China Telecom Corporation Limited Annual Report 2020
ENVIRONMENTAL, SOCIAL AND GOVERNANCE REPORT Corporate Governance Report SHAREHOLDERS Process of forwarding shareholders’ enquiries to the Board or requesting for convening of an Details of shareholders by class and shareholding extraordinary general meeting or a class meeting or structure can be referred to the Report of the Directors on proposing new motions pages 48 to 79 of this annual report. Shareholders may at any time send their enquiries, requests, proposals and concerns to the Board in SHAREHOLDERS’ RIGHTS writing through the Company Secretary and the Investor Relations Department. Procedures for convening of an extraordinary general meeting or a class meeting To conform with the operation needs for corporate According to the Articles of Association, shareholders governance after the A Share Offering, the Company is who request for the convening of an extraordinary general required to amend the Articles of Association pursuant to meeting or a class meeting shall comply with the following the Securities Law and the Guidelines for the Articles of procedures: Association and other relevant laws and regulations. The relevant amendments (including those articles applicable 2 or more shareholders holding in aggregate 10% or to shareholders’ rights) will be submitted for the approval more of the shares carrying the right to vote at the by the shareholders of the Company at the extraordinary meeting sought to be held shall sign one or more written general meeting to be held on 9 April 2021. The new requisitions in the same format and with the same applicable Articles of Association will take effect from the content, stating the proposed matters to be discussed date of the A Share Offering and Listing upon approval by at the meeting, and requiring the Board to convene an the shareholders of the Company and fulfilment of relevant extraordinary general meeting or a class meeting thereof. procedures of the regulatory authorities. The Board shall convene an extraordinary general meeting within 2 months. If the Board fails to issue a notice of such Please refer to the announcement published by the a meeting within 30 days from the date of receipt of the Company on 9 March 2021 and the relevant circular for requisitions, the shareholders who make the requisitions further details. may themselves convene such a meeting (in a manner as similar as possible to the manner in which shareholders’ The contact details of the Company Secretary are as meetings are convened by the Board) within 4 months follows: from the date of receipt of the requisitions by the Board. The Company Secretary Procedures for proposing resolutions at the annual China Telecom Corporation Limited general meeting 28th Floor, Everbright Centre, When the Company convenes an annual general meeting, 108 Gloucester Road, Wanchai, shareholders holding 3% or more of the total voting Hong Kong shares of the Company shall have the right to propose Email: ir@chinatelecom-h.com new motions in writing, and the Company shall place such Tel No.: (852) 2877 9777 proposed motions on the agenda for such annual general IR Enquiry: (852) 2582 0388 meeting if they are matters falling within the functions and Fax No.: (852) 2877 0988 powers of shareholders’ meetings. China Telecom Corporation Limited Annual Report 2020 155
ENVIRONMENTAL, SOCIAL AND GOVERNANCE REPORT Corporate Governance Report A dedicated “Investor” section is available on the amend notice period, shareholders’ proposal rights and Company’s website (www.chinatelecom-h.com). There convening procedures for general meetings applicable is a FAQ function in the “Investor” section designated to to joint stock companies incorporated in the PRC and enable timely, effective and interactive communication listed overseas, the Company amended the relevant between the Company, shareholders and investors. provisions in the Articles of Association regarding notice Company Secretary and the Investor Relations period, shareholders’ proposal rights and convening Department of the Company handle both telephone and procedures for the general meetings. Please refer to written enquiries from shareholders of the Company from the announcement published by the Company on 24 time to time. Shareholders’ enquiries and concerns will March 2020 in relation to the proposed amendments be forwarded to the Board and/or the relevant Board to the Articles of Association and the circular published Committees of the Company, where appropriate, which by the Company on 9 April 2020 for the details of the will answer the shareholders’ questions. Information on amendments. the Company’s website is updated regularly. SIGNIFICANT DIFFERENCES AMENDMENTS TO ARTICLES OF BETWEEN THE CORPORATE ASSOCIATION GOVERNANCE PRACTICES FOLLOWED BY THE COMPANY At the 2019 Annual General Meeting held on 26 May 2020, AND THOSE FOLLOWED BY NYSE-the shareholders approved the amendments to the Articles LISTED U.S. COMPANIES of Association. Pursuant to the requirements of regulatory authorities and the actual operational needs of the The Company was established in the PRC and is currently Company, the Company amended the relevant provisions listed on the Hong Kong Stock Exchange and the NYSE. of the Articles of Association regarding the scope of As a foreign private issuer in respect of its listing on the business to reflect the amendments to the contents of NYSE, the Company is not required to comply with all the operation permit for value-added telecommunications corporate governance rules of Section 303A of the NYSE businesses. Pursuant to the requirements of “Reply of the Listed Company Manual. However, the Company is State Council on the Adjustment of the Notice Period of required to disclose the significant differences between the the General Meeting and Other Matters Applicable to the corporate governance practices of the Company and the Overseas Listed Companies (Guo Han [2019] No. 97)” to listing standards followed by NYSE-listed U.S. companies. 156 China Telecom Corporation Limited Annual Report 2020
ENVIRONMENTAL, SOCIAL AND GOVERNANCE REPORT Corporate Governance Report Pursuant to the requirements of the NYSE Listed for corporate governance; therefore, the Company has Company Manual, the Board of all NYSE-listed U.S. not formulated any separate corporate governance companies must be made up by a majority of Independent guidelines. However, the Company has implemented the Directors. Under currently applicable PRC and Hong code provisions under the Corporate Governance Code Kong laws and regulations, the Board is not required to and Corporate Governance Report as set out in Appendix be formed with a majority of Independent Directors. As a 14 of the Listing Rules for the financial year ended 31 listed company on the Hong Kong Stock Exchange, the December 2020. Company needs to comply with the Listing Rules. The Listing Rules require that at least one-third of the Board CONTINUOUS EVOLUTION OF of a listed company in Hong Kong be Independent Non- CORPORATE GOVERNANCE Executive Directors. As at the date of this report, the Board comprises 10 Directors, of which 4 are Independent The Company continuously analyses the corporate Directors, making the number of Independent Directors governance development of international advanced exceeds one-third of the total number of Directors on enterprises and the investors’ desires, constantly examines the Board, in compliance with the requirements of the and strengthens the corporate governance measures Listing Rules. These Independent Directors also satisfy the and practice, and improves the current practices at the requirements on “independence” under the Listing Rules. appropriate time; we strongly believe that by adhering to However, the related standard set out in the Listing Rules is good corporate governance principles, and improving the different from the requirements in Section 303A.02 of the transparency of operations, as well as the establishment NYSE Listed Company Manual. of the effective accountability system, we can ensure the long-term stable development of the Company and seek Pursuant to the requirements of the NYSE Listed sustainable returns for the shareholders and investors. Company Manual, companies shall formulate separate corporate governance guidelines. Under the currently For further information, please browse our website at applicable PRC and Hong Kong laws and regulations, the Company is not required to formulate any guidelines www.chinatelecom-h.com China Telecom Corporation Limited Annual Report 2020 157

7 4 16 Digitalisation for the Future 0 96 2130
INDEPENDENT AUDITOR’S REPORT TO THE SHAREHOLDERS OF CHINA TELECOM CORPORATION LIMITED (Incorporated in The People’s Republic of China with limited liability) OPINION We have audited the consolidated financial statements of China Telecom Corporation Limited (the “Company”) and its subsidiaries (collectively referred to as the “Group”) set out on pages 164 to 244, which comprise the consolidated statement of financial position as at 31 December 2020, and the consolidated statement of comprehensive income, consolidated statement of changes in equity and consolidated statement of cash flows for the year then ended, and notes to the consolidated financial statements, including a summary of significant accounting policies. In our opinion, the consolidated financial statements give a true and fair view of the consolidated financial position of the Group as at 31 December 2020, and of its consolidated financial performance and its consolidated cash flows for the year then ended in accordance with International Financial Reporting Standards (“IFRSs”) and have been properly prepared in compliance with the disclosure requirements of the Hong Kong Companies Ordinance. BASIS FOR OPINION We conducted our audit in accordance with Hong Kong Standards on Auditing (“HKSAs”) issued by the Hong Kong Institute of Certified Public Accountants (“HKICPA”). Our responsibilities under those standards are further described in the Auditor’s Responsibilities for the Audit of the Consolidated Financial Statements section of our report. We are independent of the Group in accordance with the HKICPA’s Code of Ethics for Professional Accountants (the “Code”), and we have fulfilled our other ethical responsibilities in accordance with the Code. We believe that the audit evidence we have obtained is sufficient and appropriate to provide a basis for our opinion. KEY AUDIT MATTERS Key audit matters are those matters that, in our professional judgment, were of most significance in our audit of the consolidated financial statements of the current period. These matters were addressed in the context of our audit of the consolidated financial statements as a whole, and in forming our opinion thereon, and we do not provide a separate opinion on these matters. China Telecom Corporation Limited Annual Report 2020
INDEPENDENT AUDITOR’S REPORT KEY AUDIT MATTERS (continued) Key audit matter How our audit addressed the key audit matter Revenue recognition We identified revenue recognition as a key audit matter because Our procedures in relation to revenue recognition comprising both there is an inherent industry risk around the accuracy of revenue control testing and substantive procedures on a sample basis, recorded by the IT billing systems given the complexity of the included involving our internal IT specialists to assist with: systems and the significance of volumes of data processed by the systems. • Testing the IT environment in which the billing systems reside, including interface controls between different IT Revenues from the provision of telecommunications services are, applications. in general, recognised as performance obligations are satisfied. Fees for telecommunications packages are recognised for each • Testing the key controls over the calculation of the service type in the packages. The data records are captured and amounts billed to customers and the capturing and the revenue transactions are recorded by the IT billing systems. recording of the revenue transactions. Details of the accounting policies for revenue recognition and • Testing the key controls over the authorisation of the rate an analysis of revenues are disclosed in Notes 3(m) and 28, changes and the input of such rates to the billing systems. respectively, to the consolidated financial statements. • Testing the end-to-end reconciliations from data records to the billing systems and to the general ledger. • Testing material journals processed between the billing systems and the general ledger. • Testing the accuracy of customer bill calculations and the respective revenue transactions recorded. Impairment of goodwill and long-lived assets within the cash-generating unit We identified the impairment of goodwill and long-lived assets Our procedures in relation to the impairment of goodwill and long-within the cash-generating unit as a key audit matter because lived assets within the cash-generating unit included: the impairment assessment of cash-generating unit requires the management to exercise significant judgments relating to the • With the assistance of our internal valuation specialists, estimation of level of revenue, amount of operating costs and assessing the discount rate and assumptions used by the applicable discount rate. management in the value in use model and comparing the discount rate used by the management to externally Details of the accounting policies for impairment of goodwill derived data and our own assessments of key inputs used and long-lived assets and the related accounting estimates are in deriving the discount rate. disclosed in Notes 3(h) and 48, respectively, to the consolidated financial statements. Details of goodwill impairment assessment • With the assistance of our internal valuation specialists, are disclosed in Note 7 to the consolidated financial statements. comparing the key inputs to the projected cash flows, such as the number of subscribers, the average revenue per subscriber and amount of operating costs, with corresponding historical data to evaluate the reasonableness of the management’s projections. • Assessing and challenging the significant judgments and estimates used in the management’s impairment assessment and evaluating the sensitivity analysis performed by the management. China Telecom Corporation Limited Annual Report 2020
INDEPENDENT AUDITOR’S REPORT OTHER INFORMATION The directors of the Company are responsible for the other information. The other information comprises the information included in the annual report, but does not include the consolidated financial statements and our auditor’s report thereon. Our opinion on the consolidated financial statements does not cover the other information and we do not express any form of assurance conclusion thereon. In connection with our audit of the consolidated financial statements, our responsibility is to read the other information and, in doing so, consider whether the other information is materially inconsistent with the consolidated financial statements or our knowledge obtained in the audit or otherwise appears to be materially misstated. If, based on the work we have performed, we conclude that there is a material misstatement of this other information, we are required to report that fact. We have nothing to report in this regard. RESPONSIBILITIES OF DIRECTORS AND THOSE CHARGED WITH GOVERNANCE FOR THE CONSOLIDATED FINANCIAL STATEMENTS The directors of the Company are responsible for the preparation of the consolidated financial statements that give a true and fair view in accordance with IFRSs and the disclosure requirements of the Hong Kong Companies Ordinance, and for such internal control as the directors determine is necessary to enable the preparation of consolidated financial statements that are free from material misstatement, whether due to fraud or error. In preparing the consolidated financial statements, the directors are responsible for assessing the Group’s ability to continue as a going concern, disclosing, as applicable, matters related to going concern and using the going concern basis of accounting unless the directors either intend to liquidate the Group or to cease operations, or have no realistic alternative but to do so. Those charged with governance are responsible for overseeing the Group’s financial reporting process. AUDITOR’S RESPONSIBILITIES FOR THE AUDIT OF THE CONSOLIDATED FINANCIAL STATEMENTS Our objectives are to obtain reasonable assurance about whether the consolidated financial statements as a whole are free from material misstatement, whether due to fraud or error, and to issue an auditor’s report that includes our opinion solely to you, as a body, in accordance with our agreed terms of engagement, and for no other purpose. We do not assume responsibility towards or accept liability to any other person for the contents of this report. Reasonable assurance is a high level of assurance, but is not a guarantee that an audit conducted in accordance with HKSAs will always detect a material misstatement when it exists. Misstatements can arise from fraud or error and are considered material if, individually or in the aggregate, they could reasonably be expected to influence the economic decisions of users taken on the basis of these consolidated financial statements. As part of an audit in accordance with HKSAs, we exercise professional judgment and maintain professional skepticism throughout the audit. We also: • Identify and assess the risks of material misstatement of the consolidated financial statements, whether due to fraud or error, design and perform audit procedures responsive to those risks, and obtain audit evidence that is sufficient and appropriate to provide a basis for our opinion. The risk of not detecting a material misstatement resulting from fraud is higher than for one resulting from error, as fraud may involve collusion, forgery, intentional omissions, misrepresentations, or the override of internal control. • Obtain an understanding of internal control relevant to the audit in order to design audit procedures that are appropriate in the circumstances, but not for the purpose of expressing an opinion on the effectiveness of the Group’s internal control. China Telecom Corporation Limited Annual Report 2020
INDEPENDENT AUDITOR’S REPORT AUDITOR’S RESPONSIBILITIES FOR THE AUDIT OF THE CONSOLIDATED FINANCIAL STATEMENTS (continued) As part of an audit in accordance with HKSAs, we exercise professional judgment and maintain professional skepticism throughout the audit. We also: (continued) • Evaluate the appropriateness of accounting policies used and the reasonableness of accounting estimates and related disclosures made by the directors. • Conclude on the appropriateness of the directors’ use of the going concern basis of accounting and, based on the audit evidence obtained, whether a material uncertainty exists related to events or conditions that may cast significant doubt on the Group’s ability to continue as a going concern. If we conclude that a material uncertainty exists, we are required to draw attention in our auditor’s report to the related disclosures in the consolidated financial statements or, if such disclosures are inadequate, to modify our opinion. Our conclusions are based on the audit evidence obtained up to the date of our auditor’s report. However, future events or conditions may cause the Group to cease to continue as a going concern. • Evaluate the overall presentation, structure and content of the consolidated financial statements, including the disclosures, and whether the consolidated financial statements represent the underlying transactions and events in a manner that achieves fair presentation. • Obtain sufficient appropriate audit evidence regarding the financial information of the entities or business activities within the Group to express an opinion on the consolidated financial statements. We are responsible for the direction, supervision and performance of the group audit. We remain solely responsible for our audit opinion. We communicate with those charged with governance regarding, among other matters, the planned scope and timing of the audit and significant audit findings, including any significant deficiencies in internal control that we identify during our audit. We also provide those charged with governance with a statement that we have complied with relevant ethical requirements regarding independence, and to communicate with them all relationships and other matters that may reasonably be thought to bear on our independence, and where applicable, actions taken to eliminate threats or safeguards applied. From the matters communicated with those charged with governance, we determine those matters that were of most significance in the audit of the consolidated financial statements of the current period and are therefore the key audit matters. We describe these matters in our auditor’s report unless law or regulation precludes public disclosure about the matter or when, in extremely rare circumstances, we determine that a matter should not be communicated in our report because the adverse consequences of doing so would reasonably be expected to outweigh the public interest benefits of such communication. The engagement partner on the audit resulting in the independent auditor’s report is Ip Kan Wah. Deloitte Touche Tohmatsu Certified Public Accountants Hong Kong 9 March 2021 China Telecom Corporation Limited Annual Report 2020
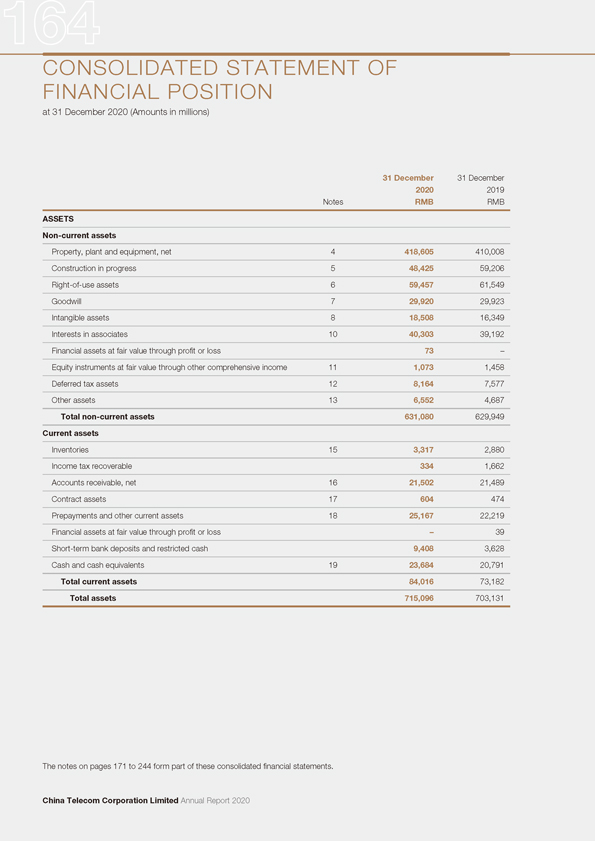
CONSOLIDATED STATEMENT OF FINANCIAL POSITION at 31 December 2020 (Amounts in millions) 31 December 31 December 2020 2019 Notes RMB RMB ASSETS Non-current assets Property, plant and equipment, net 4 418,605 410,008 Construction in progress 5 48,425 59,206 Right-of-use assets 6 59,457 61,549 Goodwill 7 29,920 29,923 Intangible assets 8 18,508 16,349 Interests in associates 10 40,303 39,192 Financial assets at fair value through profit or loss 73 –Equity instruments at fair value through other comprehensive income 11 1,073 1,458 Deferred tax assets 12 8,164 7,577 Other assets 13 6,552 4,687 Total non-current assets 631,080 629,949 Current assets Inventories 15 3,317 2,880 Income tax recoverable 334 1,662 Accounts receivable, net 16 21,502 21,489 Contract assets 17 604 474 Prepayments and other current assets 18 25,167 22,219 Financial assets at fair value through profit or loss – 39 Short-term bank deposits and restricted cash 9,408 3,628 Cash and cash equivalents 19 23,684 20,791 Total current assets 84,016 73,182 Total assets 715,096 703,131 The notes on pages 171 to 244 form part of these consolidated financial statements. China Telecom Corporation Limited Annual Report 2020
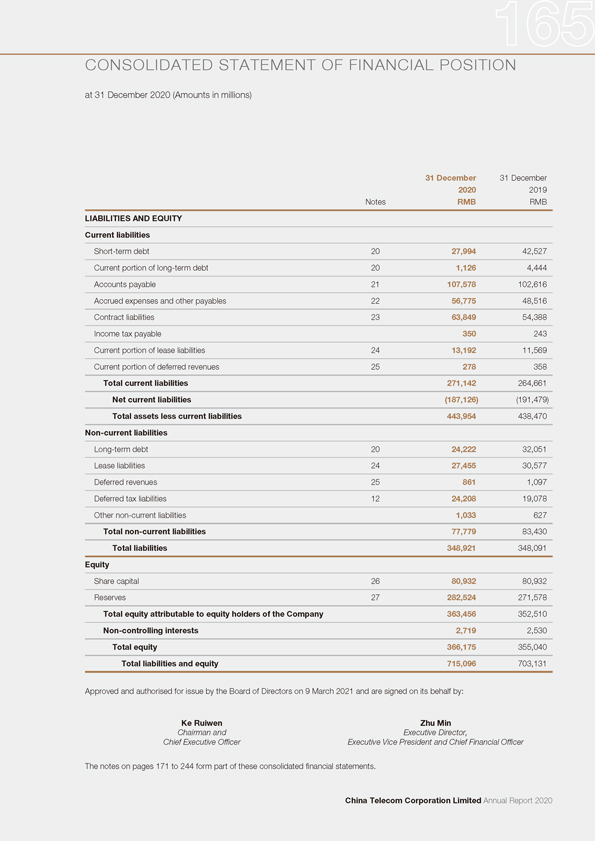
CONSOLIDATED STATEMENT OF FINANCIAL POSITION at 31 December 2020 (Amounts in millions) 31 December 31 December 2020 2019 Notes RMB RMB LIABILITIES AND EQUITY Current liabilities Short-term debt 20 27,994 42,527 Current portion of long-term debt 20 1,126 4,444 Accounts payable 21 107,578 102,616 Accrued expenses and other payables 22 56,775 48,516 Contract liabilities 23 63,849 54,388 Income tax payable 350 243 Current portion of lease liabilities 24 13,192 11,569 Current portion of deferred revenues 25 278 358 Total current liabilities 271,142 264,661 Net current liabilities (187,126) (191,479) Total assets less current liabilities 443,954 438,470 Non-current liabilities Long-term debt 20 24,222 32,051 Lease liabilities 24 27,455 30,577 Deferred revenues 25 861 1,097 Deferred tax liabilities 12 24,208 19,078 Other non-current liabilities 1,033 627 Total non-current liabilities 77,779 83,430 Total liabilities 348,921 348,091 Equity Share capital 26 80,932 80,932 Reserves 27 282,524 271,578 Total equity attributable to equity holders of the Company 363,456 352,510 Non-controlling interests 2,719 2,530 Total equity 366,175 355,040 Total liabilities and equity 715,096 703,131 Approved and authorised for issue by the Board of Directors on 9 March 2021 and are signed on its behalf by: Ke Ruiwen Zhu Min Chairman and Executive Director, Chief Executive Officer Executive Vice President and Chief Financial Officer The notes on pages 171 to 244 form part of these consolidated financial statements. China Telecom Corporation Limited Annual Report 2020
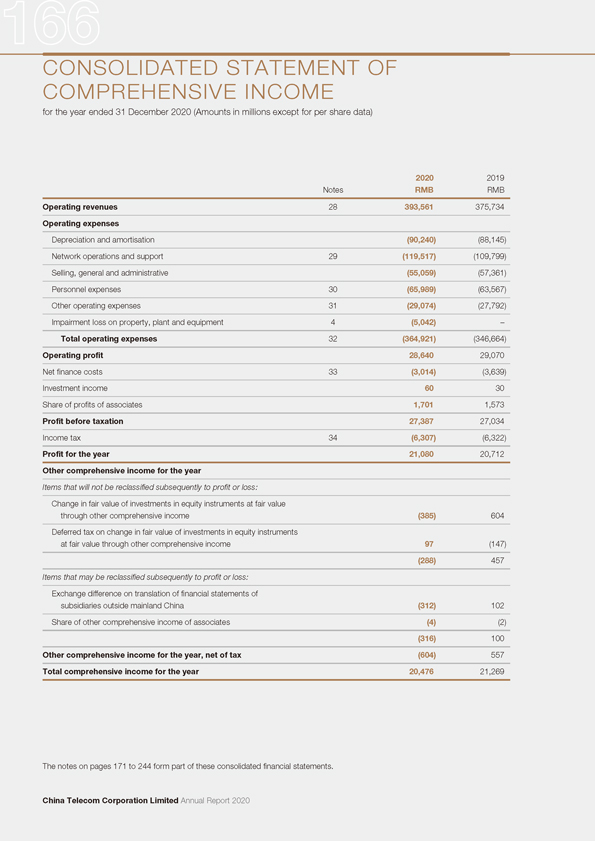
CONSOLIDATED STATEMENT OF COMPREHENSIVE INCOME for the year ended 31 December 2020 (Amounts in millions except for per share data) 2020 2019 Notes RMB RMB Operating revenues 28 393,561 375,734 Operating expenses Depreciation and amortisation (90,240) (88,145) Network operations and support 29 (119,517) (109,799) Selling, general and administrative (55,059) (57,361) Personnel expenses 30 (65,989) (63,567) Other operating expenses 31 (29,074) (27,792) Impairment loss on property, plant and equipment 4 (5,042) –Total operating expenses 32 (364,921) (346,664) Operating profit 28,640 29,070 Net finance costs 33 (3,014) (3,639) Investment income 60 30 Share of profits of associates 1,701 1,573 Profit before taxation 27,387 27,034 Income tax 34 (6,307) (6,322) Profit for the year 21,080 20,712 Other comprehensive income for the year Items that will not be reclassified subsequently to profit or loss: Change in fair value of investments in equity instruments at fair value through other comprehensive income (385) 604 Deferred tax on change in fair value of investments in equity instruments at fair value through other comprehensive income 97 (147) (288) 457 Items that may be reclassified subsequently to profit or loss: Exchange difference on translation of financial statements of subsidiaries outside mainland China (312) 102 Share of other comprehensive income of associates (4) (2) (316) 100 Other comprehensive income for the year, net of tax (604) 557 Total comprehensive income for the year 20,476 21,269 The notes on pages 171 to 244 form part of these consolidated financial statements. China Telecom Corporation Limited Annual Report 2020
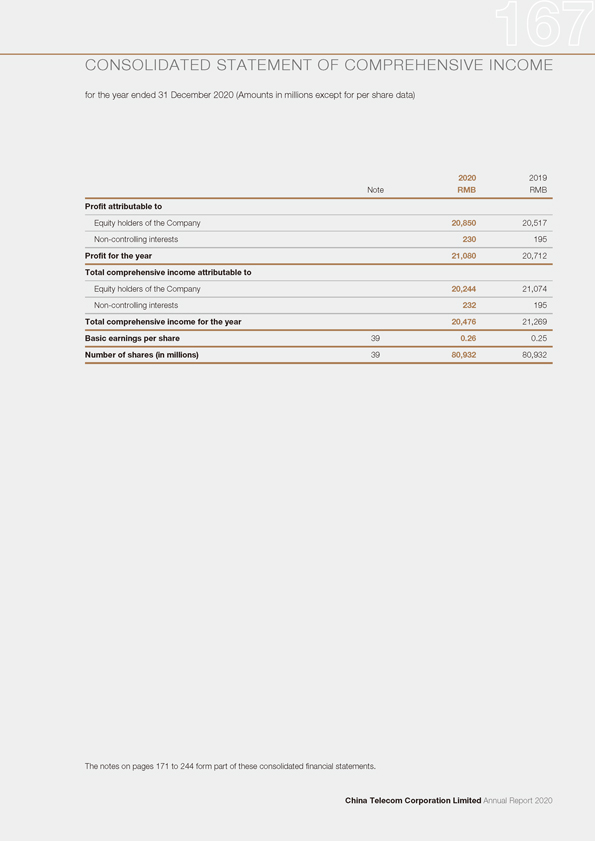
CONSOLIDATED STATEMENT OF COMPREHENSIVE INCOME for the year ended 31 December 2020 (Amounts in millions except for per share data) 2020 2019 Note RMB RMB Profit attributable to Equity holders of the Company 20,850 20,517 Non-controlling interests 230 195 Profit for the year 21,080 20,712 Total comprehensive income attributable to Equity holders of the Company 20,244 21,074 Non-controlling interests 232 195 Total comprehensive income for the year 20,476 21,269 Basic earnings per share 39 0.26 0.25 Number of shares (in millions) 39 80,932 80,932 The notes on pages 171 to 244 form part of these consolidated financial statements. China Telecom Corporation Limited Annual Report 2020
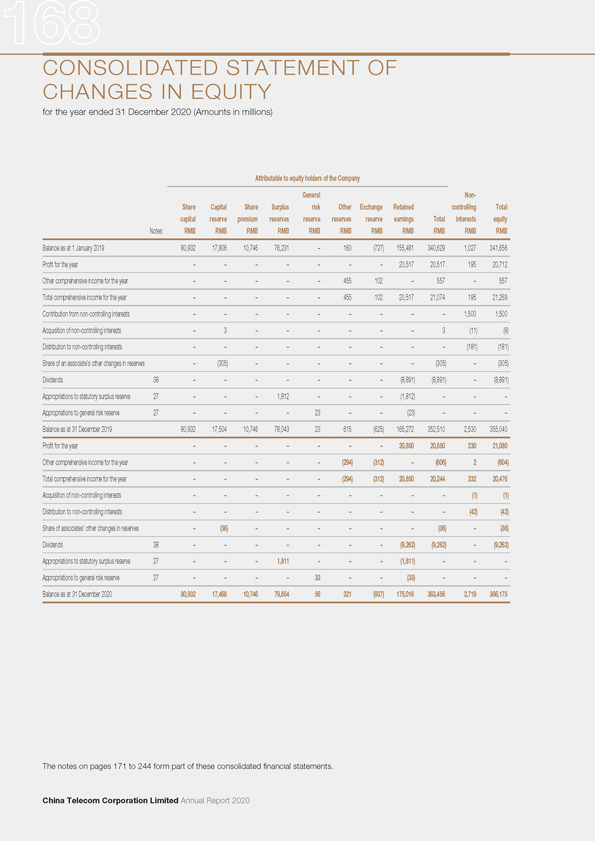
CONSOLIDATED STATEMENT OF CHANGES IN EQUITY for the year ended 31 December 2020 (Amounts in millions) Attributable to equity holders of the Company General Non-Share Capital Share Surplus risk Other Exchange Retained controlling Total capital reserve premium reserves reserve reserves reserve earnings Total interests equity Notes RMB RMB RMB RMB RMB RMB RMB RMB RMB RMB RMB Balance as at 1 January 2019 80,932 17,806 10,746 76,231 – 160 (727) 155,481 340,629 1,027 341,656 Profit for the year – – – – – – – 20,517 20,517 195 20,712 Other comprehensive income for the year – – – – – 455 102 – 557 – 557 Total comprehensive income for the year – – – – – 455 102 20,517 21,074 195 21,269 Contribution from non-controlling interests – – – – – – – – – 1,500 1,500 Acquisition of non-controlling interests – 3 – – – – – – 3 (11) (8) Distribution to non-controlling interests – – – – – – – – – (181) (181) Share of an associate’s other changes in reserves – (305) – – – – – – (305) – (305) Dividends 38 – – – – – – – (8,891) (8,891) – (8,891) Appropriations to statutory surplus reserve 27 – – – 1,812 – – – (1,812) – – –Appropriations to general risk reserve 27 – – – – 23 – – (23) – – –Balance as at 31 December 2019 80,932 17,504 10,746 78,043 23 615 (625) 165,272 352,510 2,530 355,040 Profit for the year – – – – – – – 20,850 20,850 230 21,080 Other comprehensive income for the year – – – – – (294) (312) – (606) 2 (604) Total comprehensive income for the year – – – – – (294) (312) 20,850 20,244 232 20,476 Acquisition of non-controlling interests – – – – – – – – – (1) (1) Distribution to non-controlling interests – – – – – – – – – (42) (42) Share of associates’ other changes in reserves – (36) – – – – – – (36) – (36) Dividends 38 – – – – – – – (9,262) (9,262) – (9,262) Appropriations to statutory surplus reserve 27 – – – 1,811 – – – (1,811) – – –Appropriations to general risk reserve 27 – – – – 33 – – (33) – – – Balance as at 31 December 2020 80,932 17,468 10,746 79,854 56 321 (937) 175,016 363,456 2,719 366,175 The notes on pages 171 to 244 form part of these consolidated financial statements. China Telecom Corporation Limited Annual Report 2020
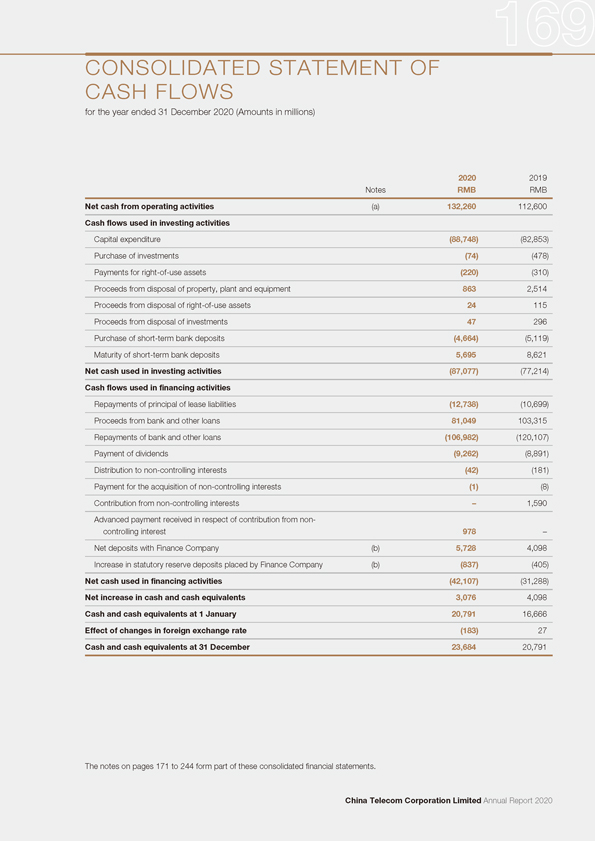
CONSOLIDATED STATEMENT OF CASH FLOWS for the year ended 31 December 2020 (Amounts in millions) 2020 2019 Notes RMB RMB Net cash from operating activities (a) 132,260 112,600 Cash flows used in investing activities Capital expenditure (88,748) (82,853) Purchase of investments (74) (478) Payments for right-of-use assets (220) (310) Proceeds from disposal of property, plant and equipment 863 2,514 Proceeds from disposal of right-of-use assets 24 115 Proceeds from disposal of investments 47 296 Purchase of short-term bank deposits (4,664) (5,119) Maturity of short-term bank deposits 5,695 8,621 Net cash used in investing activities (87,077) (77,214) Cash flows used in financing activities Repayments of principal of lease liabilities (12,738) (10,699) Proceeds from bank and other loans 81,049 103,315 Repayments of bank and other loans (106,982) (120,107) Payment of dividends (9,262) (8,891) Distribution to non-controlling interests (42) (181) Payment for the acquisition of non-controlling interests (1) (8) Contribution from non-controlling interests – 1,590 Advanced payment received in respect of contribution from non-controlling interest 978 –Net deposits with Finance Company (b) 5,728 4,098 Increase in statutory reserve deposits placed by Finance Company (b) (837) (405) Net cash used in financing activities (42,107) (31,288) Net increase in cash and cash equivalents 3,076 4,098 Cash and cash equivalents at 1 January 20,791 16,666 Effect of changes in foreign exchange rate (183) 27 Cash and cash equivalents at 31 December 23,684 20,791 The notes on pages 171 to 244 form part of these consolidated financial statements. China Telecom Corporation Limited Annual Report 2020
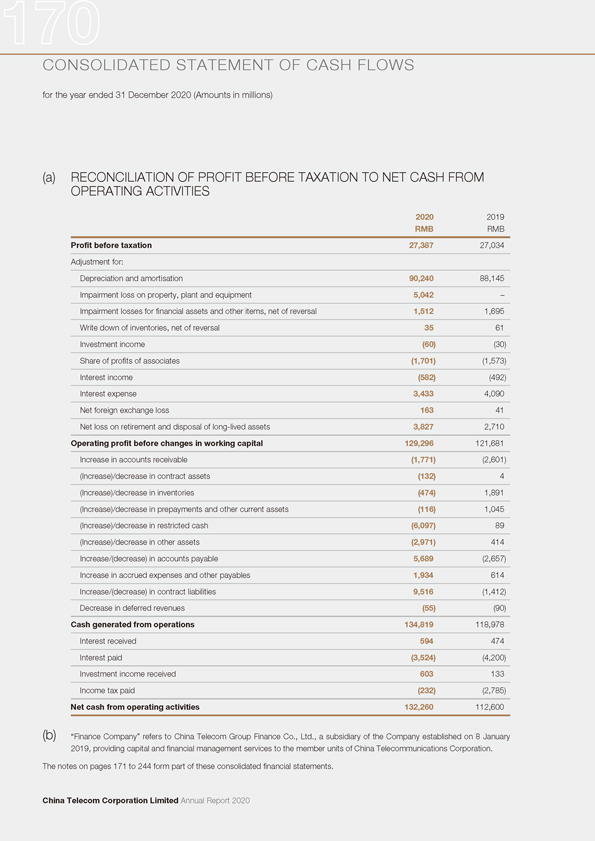
CONSOLIDATED STATEMENT OF CASH FLOWS for the year ended 31 December 2020 (Amounts in millions) (a) RECONCILIATION OF PROFIT BEFORE TAXATION TO NET CASH FROM OPERATING ACTIVITIES 2020 2019 RMB RMB Profit before taxation 27,387 27,034 Adjustment for: Depreciation and amortisation 90,240 88,145 Impairment loss on property, plant and equipment 5,042 –Impairment losses for financial assets and other items, net of reversal 1,512 1,695 Write down of inventories, net of reversal 35 61 Investment income (60) (30) Share of profits of associates (1,701) (1,573) Interest income (582) (492) Interest expense 3,433 4,090 Net foreign exchange loss 163 41 Net loss on retirement and disposal of long-lived assets 3,827 2,710 Operating profit before changes in working capital 129,296 121,681 Increase in accounts receivable (1,771) (2,601) (Increase)/decrease in contract assets (132) 4 (Increase)/decrease in inventories (474) 1,891 (Increase)/decrease in prepayments and other current assets (116) 1,045 (Increase)/decrease in restricted cash (6,097) 89 (Increase)/decrease in other assets (2,971) 414 Increase/(decrease) in accounts payable 5,689 (2,657) Increase in accrued expenses and other payables 1,934 614 Increase/(decrease) in contract liabilities 9,516 (1,412) Decrease in deferred revenues (55) (90) Cash generated from operations 134,819 118,978 Interest received 594 474 Interest paid (3,524) (4,200) Investment income received 603 133 Income tax paid (232) (2,785) Net cash from operating activities 132,260 112,600 (b) “Finance Company” refers to China Telecom Group Finance Co., Ltd., a subsidiary of the Company established on 8 January 2019, providing capital and financial management services to the member units of China Telecommunications Corporation. The notes on pages 171 to 244 form part of these consolidated financial statements. China Telecom Corporation Limited Annual Report 2020
NOTES TO THE CONSOLIDATED FINANCIAL STATEMENTS for the year ended 31 December 2020 1. PRINCIPAL ACTIVITIES, ORGANISATION AND BASIS OF PRESENTATION Principal activities China Telecom Corporation Limited (the “Company”) and its subsidiaries (hereinafter, collectively referred to as the “Group”) offers a comprehensive range of wireline and mobile telecommunications services including voice, Internet, telecommunications network resource and equipment services, information and application services and other related services. The Group provides wireline telecommunications services and related services in Beijing Municipality, Shanghai Municipality, Guangdong Province, Jiangsu Province, Zhejiang Province, Anhui Province, Fujian Province, Jiangxi Province, Guangxi Zhuang Autonomous Region, Chongqing Municipality, Sichuan Province, Hubei Province, Hunan Province, Hainan Province, Guizhou Province, Yunnan Province, Shaanxi Province, Gansu Province, Qinghai Province, Ningxia Hui Autonomous Region and Xinjiang Uygur Autonomous Region of the People’s Republic of China (the “PRC”). The Group also provides mobile telecommunications and related services in the mainland China and Macau Special Administrative Region (“Macau”) of the PRC. The Group also provides international telecommunications services, including network services, Internet access and transit, Internet Data Centre and mobile virtual network services in certain countries and regions of the Asia Pacific, Europe, Africa, South America and North America. The operations of the Group in the mainland China are subject to the supervision by the PRC government and relevant regulation. Organisation As part of the reorganisation (the “Restructuring”) of China Telecommunications Corporation, the Company was incorporated in the PRC on 10 September 2002. In connection with the Restructuring, China Telecommunications Corporation transferred to the Company the wireline telecommunications business and related operations in Shanghai Municipality, Guangdong Province, Jiangsu Province and Zhejiang Province together with the related assets and liabilities in consideration for 68,317 million ordinary domestic shares of the Company. The shares issued to China Telecommunications Corporation have a par value of RMB1.00 each and represented the entire registered and issued share capital of the Company at that date. On 31 December 2003, the Company acquired the entire equity interests in Anhui Telecom Company Limited, Fujian Telecom Company Limited, Jiangxi Telecom Company Limited, Guangxi Telecom Company Limited, Chongqing Telecom Company Limited and Sichuan Telecom Company Limited (collectively the “First Acquired Group”) and certain network management and research and development facilities from China Telecommunications Corporation for a total purchase price of RMB46,000 million (hereinafter, referred to as the “First Acquisition”). On 30 June 2004, the Company acquired the entire equity interests in Hubei Telecom Company Limited, Hunan Telecom Company Limited, Hainan Telecom Company Limited, Guizhou Telecom Company Limited, Yunnan Telecom Company Limited, Shaanxi Telecom Company Limited, Gansu Telecom Company Limited, Qinghai Telecom Company Limited, Ningxia Telecom Company Limited and Xinjiang Telecom Company Limited (collectively the “Second Acquired Group”) from China Telecommunications Corporation for a total purchase price of RMB27,800 million (hereinafter, referred to as the “Second Acquisition”). On 30 June 2007, the Company acquired the entire equity interests in China Telecom System Integration Co., Ltd. (“CTSI”), China Telecom Global Limited (“CT Global”) and China Telecom (Americas) Corporation (“CT Americas”) (collectively the “Third Acquired Group”) from China Telecommunications Corporation for a total purchase price of RMB1,408 million (hereinafter, referred to as the “Third Acquisition”). On 30 June 2008, the Company acquired the entire equity interest in China Telecom Group Beijing Corporation (“Beijing Telecom” or the “Fourth Acquired Company”) from China Telecommunications Corporation for a total purchase price of RMB5,557 million (hereinafter, referred to as the “Fourth Acquisition”). China Telecom Corporation Limited Annual Report 2020
NOTES TO THE CONSOLIDATED FINANCIAL STATEMENTS for the year ended 31 December 2020 1. PRINCIPAL ACTIVITIES, ORGANISATION AND BASIS OF PRESENTATION (continued) Organisation (continued) On 1 August 2011 and 1 December 2011, the subsidiaries of the Company, E-surfing Pay Co., Ltd (“E-surfing Pay”) and E-surfing Media Co., Ltd. (“E-surfing Media”), acquired the e-commerce business and video media business (collectively the “Fifth Acquired Group”) from China Telecommunications Corporation and its subsidiaries for a total purchase price of RMB61 million (hereinafter, referred to as the “Fifth Acquisition”). The Company disposed the equity interest in E-surfing Media to China Telecommunications Corporation in 2013. On 30 April 2012, the Company acquired the digital trunking business (the “Sixth Acquired Business”) from Besttone Holding Co., Ltd. (“Besttone Holding”), a subsidiary of China Telecommunications Corporation, at a purchase price of RMB48 million (hereinafter, referred to as the “Sixth Acquisition”). On 31 December 2013, CT Global, a subsidiary of the Company, acquired 100% equity interest in China Telecom (Europe) Limited (“CT Europe” or the “Seventh Acquired Company”), a wholly owned subsidiary of China Telecommunications Corporation, from China Telecommunications Corporation for a total purchase price of RMB278 million (hereinafter, referred to as the “Seventh Acquisition”). On 31 October 2017, the Company disposed of the 100% equity interest in Chengdu E-store Technology Co., Ltd (“E-store”), a subsidiary of the Company, to Besttone Holding. The final consideration for the disposal of the equity interest in E-store was arrived at RMB251 million, among which RMB249 million was received on 16 November 2017 and the remaining balance of RMB2 million was received in 2018. In December 2017, the Company acquired the satellite communications business (the “Satcom Business”) from China Telecom Satellite Communication Co., Ltd., a wholly owned subsidiary of China Telecommunications Corporation, at a purchase price of RMB70 million. In the same month, E-surfing Pay acquired a 100% interest in Shaanxi Zhonghe Hengtai Insurance Agent Limited (currently known as Orange Insurance Agent Limited) (“Orange Insurance”), a wholly owned subsidiary of Shaanxi Communications Services Company Limited (“Shaanxi Comservice”, a company ultimately held by China Telecommunications Corporation), from Shaanxi Comservice, at a purchase price of RMB17 million. The acquisitions of the Satcom Business and Orange Insurance (collectively referred to as the “Eighth Acquired Group”) are two separate transactions, which are collectively referred to as the “Eighth Acquisition”. The total final consideration of the Eighth Acquisition was paid by 30 June 2018. Hereinafter, the First Acquired Group, the Second Acquired Group, the Third Acquired Group, the Fourth Acquired Company, the Fifth Acquired Group, the Sixth Acquired Business, the Seventh Acquired Company and the Eighth Acquired Group are collectively referred to as the “Acquired Groups”. Basis of presentation Since the Group and the Acquired Groups are under common control of China Telecommunications Corporation, the Group’s acquisitions of the Acquired Groups have been accounted for as a combination of entities under common control in a manner similar to a pooling-of-interests. Accordingly, the assets and liabilities of these entities have been accounted for at historical amounts and the consolidated financial statements of the Group prior to the acquisitions are combined with the financial statements of the Acquired Groups. The considerations for the acquisition of the Acquired Groups are accounted for as an equity transaction in the consolidated statement of changes in equity. China Telecom Corporation Limited Annual Report 2020
NOTES TO THE CONSOLIDATED FINANCIAL STATEMENTS for the year ended 31 December 2020 1. PRINCIPAL ACTIVITIES, ORGANISATION AND BASIS OF PRESENTATION (continued) Merger with subsidiaries Pursuant to the resolution passed by the Company’s shareholders at an extraordinary general meeting held on 25 February 2008, the Company entered into merger agreements with each of the following subsidiaries: Shanghai Telecom Company Limited, Guangdong Telecom Company Limited, Jiangsu Telecom Company Limited, Zhejiang Telecom Company Limited, Anhui Telecom Company Limited, Fujian Telecom Company Limited, Jiangxi Telecom Company Limited, Guangxi Telecom Company Limited, Chongqing Telecom Company Limited, Sichuan Telecom Company Limited, Hubei Telecom Company Limited, Hunan Telecom Company Limited, Hainan Telecom Company Limited, Guizhou Telecom Company Limited, Yunnan Telecom Company Limited, Shaanxi Telecom Company Limited, Gansu Telecom Company Limited, Qinghai Telecom Company Limited, Ningxia Telecom Company Limited and Xinjiang Telecom Company Limited. In addition, the Company entered into merger agreement with Beijing Telecom on 1 July 2008. Pursuant to these merger agreements, the Company merged with these subsidiaries and the assets, liabilities and business operations of these subsidiaries were transferred to the Company’s branches in the respective regions. 2. APPLICATION OF AMENDMENTS TO INTERNATIONAL FINANCIAL REPORTING STANDARDS (“IFRSs”) In the current year, the Group has applied, for the first time, the Amendments to References to the Conceptual Framework in IFRS Standards and the following amendments to IFRSs issued by the International Accounting Standards Board (the “IASB”) that are mandatorily effective for the current year: Amendments to IAS 1 and IAS 8, “Definition of Material” Amendments to IFRS 3, “Definition of a Business” Amendments to IFRS 9, IAS 39 and IFRS 7, “Interest Rate Benchmark Reform” In addition, the Group has early applied the Amendment to IFRS 16, “Covid-19-Related Rent Concessions”. Except as described below, the application of the Amendments to References to the Conceptual Framework in IFRS Standards and the above amendments to IFRSs in the current year has had no material effect on the Group’s consolidated financial statements. China Telecom Corporation Limited Annual Report 2020
NOTES TO THE CONSOLIDATED FINANCIAL STATEMENTS for the year ended 31 December 2020 2. APPLICATION OF AMENDMENTS TO INTERNATIONAL FINANCIAL REPORTING STANDARDS (“IFRSs”) (continued) 2.1 Impacts on early application of Amendment to IFRS 16, “Covid-19-Related Rent Concessions” The Group has applied the amendment for the first time in the current year. The amendment introduces a new practical expedient for lessees to elect not to assess whether a Covid-19-related rent concession is a lease modification. The practical expedient only applies to rent concessions occurring as a direct consequence of the Covid-19 that meets all of the following conditions: • the change in lease payments results in revised consideration for the lease that is substantially the same as, or less than, the consideration for the lease immediately preceding the change; • any reduction in lease payments affects only payments originally due on or before 30 June 2021; and • there is no substantive change to other terms and conditions of the lease. As a result of applying the practical expedient, the Group accounts for changes in lease payments resulting from rent concessions the same way it would account for the changes applying IFRS 16, “Leases” (“IFRS 16”) if the changes were not a lease modification. Forgiveness or waiver of lease payments are accounted for as variable lease payments. The related lease liabilities are adjusted to reflect the amounts forgiven or waived with a corresponding adjustment recognised in the profit or loss in the period in which the event occurs. The application has no impact to the opening reserves as at 1 January 2020. The amounts related to changes in lease payments that resulted from rent concessions in the profit or loss for the current year was not material to the consolidated financial statements. 3. SIGNIFICANT ACCOUNTING POLICIES (a) Basis of preparation The accompanying consolidated financial statements have been prepared in accordance with IFRSs as issued by the IASB. For the purpose of preparation of the consolidated financial statements, information is considered material if such information is reasonably expected to influence decisions made by primary users. The consolidated financial statements also comply with the disclosure requirements of the Hong Kong Companies Ordinance and the applicable disclosure provisions of the Rules Governing the Listing of Securities on The Stock Exchange of Hong Kong Limited (“Listing Rules”). The consolidated financial statements of the Group have been prepared on a going concern basis. The consolidated financial statements are prepared on the historical cost basis as modified by the revaluation of certain financial instruments measured at fair value (Note 3(k)). China Telecom Corporation Limited Annual Report 2020

NOTES TO THE CONSOLIDATED FINANCIAL STATEMENTS for the year ended 31 December 2020 3. SIGNIFICANT ACCOUNTING POLICIES (continued) (a) Basis of preparation (continued) The preparation of consolidated financial statements in conformity with IFRSs requires management to make judgments, estimates and assumptions that affect the application of policies and the reported amounts of assets and liabilities and disclosure of contingent assets and liabilities at the date of the consolidated financial statements and the reported amounts of revenues and expenses during the reporting period. The estimates and associated assumptions are based on historical experience and various other factors that management believes are reasonable under the circumstances, the results of which form the basis of making the judgments about carrying values of assets and liabilities that are not readily apparent from other sources. Actual results may differ from those estimates. The estimates and underlying assumptions are reviewed on an ongoing basis. Revisions to accounting estimates are recognised in the period in which the estimate is revised if the revision affects only that period or in the period of the revision and future periods if the revision affects both current and future periods. Judgments made by management in the application of IFRSs that have significant effect on the consolidated financial statements and major sources of estimation uncertainty are discussed in Note 48. (b) Basis of consolidation The consolidated financial statements comprise the Company and its subsidiaries and the Group’s interests in associates. A subsidiary is an entity controlled by the Company. When fulfilling the following conditions, the Company has control over an entity: (a) has power over the investee, (b) has exposure, or rights, to variable returns from its involvement with the investee, and (c) has the ability to use its power over the investee to affect the amount of the investor’s returns. When assessing whether the Company has power over that entity, only substantive rights (held by the Company and other parties) are considered. The financial results of subsidiaries are included in the consolidated financial statements from the date that control commences until the date that control ceases, and the profit attributable to non-controlling interests is separately presented on the face of the consolidated statement of comprehensive income as an allocation of the profit or loss for the year between the non-controlling interests and the equity holders of the Company. Non-controlling interests represent the equity in subsidiaries not attributable directly or indirectly to the Company. For each business combination, other than business combination under common control, the Group measures the non-controlling interests at the proportionate share, of the acquisition date, of fair value of the subsidiary’s net identifiable assets. Non-controlling interests at the end of the reporting period are presented in the consolidated statement of financial position within equity and consolidated statement of changes in equity, separately from the equity of the Company’s equity holders. Changes in the Group’s interests in a subsidiary that do not result in a loss of control are accounted for as equity transactions, whereby adjustments are made to the amounts of controlling and non-controlling interests within consolidated equity to reflect the change in relative interests, but no adjustments are made to goodwill and no gain or loss is recognised. When the Group loses control of a subsidiary, it is accounted for as a disposal of the entire interest in that subsidiary, with a resulting gain or loss being recognised in profit or loss. Any interest retained in that former subsidiary at the date when control is lost is recognised at fair value and this amount is regarded as the fair value on initial recognition of a financial asset or, when appropriate, the cost on initial recognition of an investment in an associate or a joint venture. China Telecom Corporation Limited Annual Report 2020
NOTES TO THE CONSOLIDATED FINANCIAL STATEMENTS for the year ended 31 December 2020 3. SIGNIFICANT ACCOUNTING POLICIES (continued) (b) Basis of consolidation (continued) An associate is an entity, not being a subsidiary, in which the Group exercises significant influence, but not control, over its management. Significant influence is the power to participate in the financial and operating policy decisions of the investee but is not control or joint control over those policies. An investment in an associate is accounted for in the consolidated financial statements under the equity method and is initially recorded at cost, adjusted for any excess of the Group’s share of the acquisition-date fair values of the investee’s net identifiable assets over the cost of the investment (if any) after reassessment. Thereafter, the investment is adjusted for the Group’s equity share of the post-acquisition changes in the associate’s net assets and any impairment loss relating to the investment. When the Group ceases to have significant influence over an associate, it is accounted for as a disposal of the entire interest in that investee, with a resulting gain or loss being recognised in profit or loss. Any interest retained in that former investee at the date when significant influence is lost is recognised at fair value and this amount is regarded as the fair value on initial recognition of a financial asset. All significant intercompany balances and transactions and unrealised gains arising from intercompany transactions are eliminated on consolidation. Unrealised gains arising from transactions with associates are eliminated to the extent of the Group’s interest in the entity. Unrealised losses are eliminated in the same way as unrealised gains, but only to the extent that there is no evidence of impairment. (c) Foreign currencies The accompanying consolidated financial statements are presented in Renminbi (“RMB”). The functional currency of the Company and its subsidiaries in mainland China is RMB. The functional currency of the Group’s foreign operations is the currency of the primary economic environment in which the foreign operations operate. Transactions denominated in currencies other than the functional currency during the year are translated into the functional currency at the applicable rates of exchange prevailing on the transaction dates. Foreign currency monetary assets and liabilities are translated into the functional currency using the applicable exchange rates at the end of the reporting period. The resulting exchange differences, other than those capitalised as construction in progress (Note 3(e)), are recognised as income or expense in profit or loss. For the periods presented, no exchange differences were capitalised. When preparing the Group’s consolidated financial statements, the results of operations of the Group’s foreign operations are translated into RMB at average rate prevailing during the year. Assets and liabilities of the Group’s foreign operations are translated into RMB at the foreign exchange rates ruling at the end of the reporting period. The resulting exchange differences are recognised in other comprehensive income and accumulated separately in equity in the exchange reserve. China Telecom Corporation Limited Annual Report 2020

NOTES TO THE CONSOLIDATED FINANCIAL STATEMENTS for the year ended 31 December 2020 3. SIGNIFICANT ACCOUNTING POLICIES (continued) (d) Property, plant and equipment Property, plant and equipment are initially recorded at cost, less subsequent accumulated depreciation and impairment losses (Note 3(h)). The cost of an asset comprises its purchase price, any costs directly attributable to bringing the asset to working condition and location for its intended use and the cost of borrowed funds used during the periods of construction. Expenditure incurred after the asset has been put into operation, including cost of replacing part of such an item, is capitalised only when it increases the future economic benefits embodied in the item of property, plant and equipment and the cost can be measured reliably. All other expenditure is expensed as it is incurred. Gains or losses arising from retirement or disposal of property, plant and equipment are determined as the difference between the net disposal proceeds and the carrying amount of the respective asset and are recognised as income or expense in the profit or loss on the date of disposal. Depreciation is provided to write off the cost of each asset over its estimated useful life on a straight-line basis, after taking into account its estimated residual value, as follows: Depreciable lives primarily range from Buildings and improvements 8 to 30 years Telecommunications network plant and equipment 5 to 10 years Furniture, fixture, motor vehicles and other equipment 5 to 10 years Where parts of an item of property, plant and equipment have different useful lives, the cost of the item is allocated on a reasonable basis between the parts and each part is depreciated separately. Both the useful life of an asset and its residual value are reviewed annually. (e) Construction in progress Construction in progress represents buildings, telecommunications network plant and equipment and other equipment and intangible assets under construction and pending installation, and is stated at cost less impairment losses (Note 3(h)). The cost of an item comprises direct costs of construction, capitalisation of interest charge, and foreign exchange differences on related borrowed funds to the extent that they are regarded as an adjustment to interest charges during the periods of construction. Capitalisation of these costs ceases and the construction in progress is transferred to property, plant and equipment and intangible assets when the asset is substantially ready for its intended use. No depreciation is provided in respect of construction in progress. (f) Goodwill Goodwill represents the excess of the cost over the Group’s interest in the fair value of the net assets acquired in the CDMA business (as defined in Note 7) acquisition. Goodwill is stated at cost less any accumulated impairment losses. Goodwill is allocated to cash-generating units and is tested annually for impairment (Note 3(h)). On disposal of a cash generating unit during the year, any attributable amount of the goodwill is included in the calculation of the profit or loss on disposal. China Telecom Corporation Limited Annual Report 2020
NOTES TO THE CONSOLIDATED FINANCIAL STATEMENTS for the year ended 31 December 2020 3. SIGNIFICANT ACCOUNTING POLICIES (continued) (g) Intangible assets The Group’s intangible assets are primarily software. Software that is not an integral part of any tangible assets, is recorded at cost less subsequent accumulated amortisation and impairment losses (Note 3(h)). Amortisation of software is mainly calculated on a straight-line basis over the estimated useful lives, which range from 3 to 5 years. (h) Impairment of goodwill and long-lived assets The carrying amounts of the Group’s long-lived assets, including property, plant and equipment, right-of-use assets, intangible assets with finite useful lives, construction in progress and contract costs included in other assets are reviewed periodically to determine whether there is any indication of impairment. These assets are tested for impairment whenever events or changes in circumstances indicate that their recorded carrying amounts may not be recoverable. For goodwill, the impairment testing is performed annually at each year end. Before the Group recognises an impairment loss for assets capitalised as contract costs under IFRS 15, “Revenue from Contracts with Customers” (“IFRS 15”), the Group assesses and recognises any impairment loss on other assets related to the relevant contracts in accordance with applicable standards. Then, impairment loss, if any, for assets capitalised as contract costs is recognised to the extent the carrying amounts exceeds the remaining amount of consideration that the Group expects to receive in exchange for related goods or services less the costs which relate directly to providing those goods or services that have not been recognised as expenses. The assets capitalised as contract costs are then included in the carrying amount of the cash-generating unit to which they belong for the purpose of evaluating impairment of that cash-generating unit. The recoverable amount of an asset or cash-generating unit is the greater of its fair value less costs of disposal and value in use. The recoverable amount of a tangible and an intangible asset is estimated individually. When an asset does not generate cash flows largely independent of those from other assets, the recoverable amount is determined for the smallest group of assets that generates cash inflows independently (i.e. a cash-generating unit). In determining the value in use, expected future cash flows generated by the assets are discounted to their present value using a pre-tax discount rate that reflects current market assessments of time value of money and the risks specific to the asset for which the estimates of future cash flows have not been adjusted. The goodwill arising from a business combination, for the purpose of impairment testing, is allocated to cash-generating units that are expected to benefit from the synergies of the combination. An impairment loss is recognised if the carrying amount of an asset or its cash-generating unit exceeds its estimated recoverable amount. Impairment loss is recognised as an expense in profit or loss. Impairment loss recognised in respect of cash-generating units is allocated first to reduce the carrying amount of any goodwill allocated to the units and then to reduce the carrying amounts of the other assets in the unit (group of units) on a pro rata basis. The Group assesses at the end of each reporting period whether there is any indication that an impairment loss recognised for an asset in prior years may no longer exist. An impairment loss is reversed if there has been a favourable change in the estimates used to determine the recoverable amount. A subsequent increase in the recoverable amount of an asset, when the circumstances and events that led to the write-down cease to exist, is recognised as an income in profit or loss. The reversal is reduced by the amount that would have been recognised as depreciation and amortisation had the write-down not occurred. An impairment loss in respect of goodwill is not reversed. For the years presented, no reversal of impairment loss was recognised in profit or loss. China Telecom Corporation Limited Annual Report 2020
NOTES TO THE CONSOLIDATED FINANCIAL STATEMENTS for the year ended 31 December 2020 3. SIGNIFICANT ACCOUNTING POLICIES (continued) (i) Interests in joint operations A joint operation is a joint arrangement whereby the parties that have joint control of the arrangement have the rights to the assets, and obligation for the liabilities, relating to the joint arrangement. Joint control is the contractually agreed sharing of control of an arrangement, which exists only when decisions about the relevant activities require unanimous consent of the parties sharing control. The Group accounts for the assets, liabilities, revenues and expenses relating to its interest in a joint operation in accordance with the IFRSs applicable to the particular assets, liabilities, revenues and expenses. When a group entity transacts with a joint operation in which a group entity is a joint operator (such as a sale or contribution of assets), the Group is considered to be conducting the transaction with the other parties to the joint operation, and gains and losses resulting from the transactions are recognised in the consolidated financial statements only to the extent of other parties’ interests in the joint operation. When a group entity transacts with a joint operation in which a group entity is a joint operator (such as a purchase of assets), the Group does not recognise its share of the gains and losses until it resells those assets to a third party. (j) Inventories Inventories consist of materials and supplies used in maintaining the telecommunications network and goods for resale. Inventories are valued at cost using the specific identification method or the weighted average cost method, less a provision for obsolescence. Inventories are stated at the lower of cost and net realisable value. Net realisable value is the estimated selling price in the ordinary course of business less the estimated costs of completion, the estimated costs to make the sale and the related tax expenses. (k) Financial instruments Financial assets and financial liabilities are recognised when the Group becomes a party to the contractual provisions of the instrument. All regular way purchases or sales of financial assets are recognised and derecognised on a trade date basis. Regular way purchases or sales are purchases or sales of financial assets that require delivery of assets within the time frame established by regulation or convention in the market place. Financial assets and financial liabilities are initially measured at fair value except for accounts receivable arising from contracts with customers which are initially measured in accordance with IFRS 15. Transaction costs that are directly attributable to the acquisition or issue of financial assets and financial liabilities (other than financial assets or financial liabilities at fair value through profit or loss (“FVTPL”)) are added to or deducted from the fair value of the financial assets or financial liabilities, as appropriate, on initial recognition. Transaction costs directly attributable to the acquisition of financial assets or financial liabilities at FVTPL are recognised immediately in profit or loss. The effective interest method is a method of calculating the amortised cost of a financial asset or financial liability and of allocating interest income and interest expense over the relevant period. The effective interest rate is the rate that exactly discounts estimated future cash receipts and payments (including all fees and points paid or received that form an integral part of the effective interest rate, transaction costs and other premiums or discounts) through the expected life of the financial asset or financial liability, or, where appropriate, a shorter period, to the net carrying amount on initial recognition. China Telecom Corporation Limited Annual Report 2020
NOTES TO THE CONSOLIDATED FINANCIAL STATEMENTS for the year ended 31 December 2020 3. SIGNIFICANT ACCOUNTING POLICIES (continued) (k) Financial instruments (continued) Financial assets Classification and subsequent measurement of financial assets (i) Financial assets measured subsequently at amortised cost Financial assets that meet the following conditions are subsequently measured at amortised cost: • the financial asset is held within a business model whose objective is to collect contractual cash flows; and • the contractual terms give rise on specified dates to cash flows that are solely payments of principal and interest on the principal amount outstanding. Interest income is recognised using the effective interest method for financial assets measured subsequently at amortised cost. Interest income is calculated by applying the effective interest rate to the gross carrying amount of a financial asset, except for financial assets that have subsequently become credit-impaired (see below). For financial assets that have subsequently become credit-impaired, interest income is recognised by applying the effective interest rate to the amortised cost of the financial asset from the next reporting period. If the credit risk on the credit-impaired financial instrument improves so that the financial asset is no longer credit-impaired, interest income is recognised by applying the effective interest rate to the gross carrying amount of the financial asset from the beginning of the reporting period following the determination that the asset is no longer credit-impaired. (ii) Equity instruments designated as at fair value through other comprehensive income (“FVTOCI”) At initial recognition of a financial asset, the Group may irrevocably elect to present subsequent changes in fair value of an equity investment in other comprehensive income, and accumulate in other reserves, if that equity investment is neither held for trading nor contingent consideration recognised by an acquirer in a business combination to which IFRS 3, “Business Combinations” applies. These equity instruments are not subject to impairment assessment. The cumulative gain or loss will not be reclassified to profit or loss on disposal of the equity investments, and will be transferred to retained earnings. Dividend from these investments in equity instruments are recognised in profit or loss when the Group’s right to receive the dividends is established, unless the dividends clearly represent a recovery of part of the cost of the investment. Dividends are included in the “investment income” line item in profit or loss. (iii) Financial assets at FVTPL Financial assets that do not meet the criteria for being measured at amortised cost or FVTOCI or designated as FVTOCI are measured at FVTPL. Financial assets at FVTPL are measured at fair value at the end of each reporting period, with any fair value gains or losses recognised in profit or loss. The net gain or loss recognised in profit or loss includes any dividend or interest earned on the financial asset and is included in the “investment income” line item. China Telecom Corporation Limited Annual Report 2020

NOTES TO THE CONSOLIDATED FINANCIAL STATEMENTS for the year ended 31 December 2020 3. SIGNIFICANT ACCOUNTING POLICIES (continued) (k) Financial instruments (continued) Financial assets (continued) Impairment of financial assets and other items subject to impairment assessment under IFRS 9, “Financial Instruments” (“IFRS 9”) The Group performs impairment assessment under expected credit loss (“ECL”) model on financial assets (including accounts receivable, financial assets included in prepayments and other current assets, short-term bank deposits and restricted cash, cash and cash equivalents) and other item (contract assets) which are subject to impairment assessment under IFRS 9. The amount of ECL is updated at each reporting date to reflect changes in credit risk since initial recognition. Lifetime ECL represents the ECL that will result from all possible default events over the expected life of the relevant instrument. In contrast, 12-month ECL (“12m ECL”) represents the portion of lifetime ECL that is expected to result from default events that are possible within 12 months after the reporting date. Assessments are done based on the Group’s historical credit loss experience, adjusted for factors that are specific to the debtors, general economic conditions and an assessment of both the current conditions at the reporting date as well as the forecast of future conditions. The Group always recognises lifetime ECL for accounts receivable and contract assets. The ECL on these assets are assessed individually for debtors with significant balances or credit-impaired debtors, and collectively using a provision matrix with appropriate groupings based on shared credit risk characteristics, nature of services provided as well as type of customers, such as receivable from telephone and Internet subscribers and from enterprise customers. For all other instruments, the Group measures the loss allowance equal to 12m ECL, unless when there has been a significant increase in credit risk since initial recognition, the Group recognises lifetime ECL. The assessment of whether lifetime ECL should be recognised is based on significant increases in the likelihood or risk of a default occurring since initial recognition. (i) Significant increase in credit risk In assessing whether the credit risk has increased significantly since initial recognition, the Group compares the risk of a default occurring on the financial instrument as at the reporting date with the risk of a default occurring on the financial instrument as at the date of initial recognition. In making this assessment, the Group considers both quantitative and qualitative information that is reasonable and supportable, including historical experience and forward-looking information that is available without undue cost or effort. In particular, the following information is taken into account when assessing whether credit risk has increased significantly: • failure to make payments of principal or interest on their contractually due dates; • an actual or expected significant deterioration in a financial instrument’s external or internal credit rating (if available); • an actual or expected significant deterioration in the operating results of the debtor; and • existing or forecast changes in the technological, market, economic or legal environment that have a significant adverse effect on the debtor’s ability to meet its obligation to the Group. China Telecom Corporation Limited Annual Report 2020
NOTES TO THE CONSOLIDATED FINANCIAL STATEMENTS for the year ended 31 December 2020 3. SIGNIFICANT ACCOUNTING POLICIES (continued) (k) Financial instruments (continued) Financial assets (continued) Impairment of financial assets and other items subject to impairment assessment under IFRS 9, “Financial Instruments” (“IFRS 9”) (continued) (ii) Definition of default For internal credit risk management, the Group considers an event of default occurs when information developed internally or obtained from external sources indicates that the debtor is unlikely to pay its creditors, including the Group, in full (without taking into account any collaterals held by the Group). (iii) Credit-impaired financial assets A financial asset is credit-impaired when one or more events that have a detrimental impact on the estimated future cash flows of that financial asset have occurred. Evidence that a financial asset is credit-impaired includes observable data about the following events: • significant financial difficulty of the issuer or the borrower; • a breach of contract, such as a default or past due event; • the lender(s) of the borrower, for economic or contractual reasons relating to the borrower’s financial difficulty, having granted to the borrower a concession(s) that the lender(s) would not otherwise consider; • it is becoming probable that the borrower will enter bankruptcy or other financial reorganisation; or • the disappearance of an active market for that financial asset because of financial difficulties. (iv) Write-off policy The Group writes off a financial asset when there is information indicating that the counterparty is in severe financial difficulty and there is no realistic prospect of recovery, for example, when the counterparty has been placed under liquidation or has entered into bankruptcy proceedings. Financial assets written off may still be subject to enforcement activities under the Group’s recovery procedures, taking into account legal advice where appropriate. A write-off constitutes a derecognition event. Any subsequent recoveries are recognised in profit or loss. (v) Measurement and recognition of ECL The measurement of ECL is a function of the probability of default, loss given default (i.e. the magnitude of the loss if there is a default) and the exposure at default. The assessment of the probability of default and loss given default is based on the historical data and forward-looking information. The Group uses a practical expedient in estimating ECL on accounts receivable using a provision matrix taking into consideration historical credit loss experience, adjusted for forward-looking information that is available without undue cost or effort. Generally, the ECL is the difference between all contractual cash flows that are due to the Group in accordance with the contract and all the cash flows that the Group expects to receive, discounted at the effective interest rate determined at initial recognition. China Telecom Corporation Limited Annual Report 2020
NOTES TO THE CONSOLIDATED FINANCIAL STATEMENTS for the year ended 31 December 2020 3. SIGNIFICANT ACCOUNTING POLICIES (continued) (k) Financial instruments (continued) Financial assets (continued) Impairment of financial assets and other items subject to impairment assessment under IFRS 9, “Financial Instruments” (“IFRS 9”) (continued) (v) Measurement and recognition of ECL (continued) Lifetime ECL for accounts receivable and contract assets are considered on a collective basis taking into consideration past due information and relevant credit information such as forward-looking macroeconomic information. For collective assessment, the Group takes into consideration the following characteristics when formulating the grouping: • Past-due status; • Nature, size and industry of debtors; and • External credit ratings where available. The grouping is regularly reviewed by management to ensure the constituents of each group continue to share similar credit risk characteristics. The Group recognises an impairment gain or loss in profit or loss for all financial instruments measured at amortised cost by adjusting their carrying amount, with the exception of accounts receivable and other receivables where the corresponding adjustment is recognised through a loss allowance account. Derecognition of financial assets The Group derecognises a financial asset only when the contractual rights to the cash flows from the asset expire, or when it transfers the financial asset and substantially all the risks and rewards of ownership of the asset to another entity. On derecognition of a financial asset measured at amortised cost, the difference between the asset’s carrying amount and the sum of the consideration received and receivable is recognised in profit or loss. On derecognition of an investment in equity instrument which the Group has elected on initial recognition to measure at FVTOCI, the cumulative gain or loss previously accumulated in other reserves is not reclassified to profit or loss, but is transferred to retained earnings. Financial liabilities and equity Classification as debt or equity Debt and equity instruments are classified as either financial liabilities or as equity in accordance with the substance of the contractual arrangements and the definitions of a financial liability and an equity instrument. Equity instruments An equity instrument is any contract that evidences a residual interest in the assets of an entity after deducting all of its liabilities. Equity instruments issued by the Company are recognised at the proceeds received, net of direct issue costs. China Telecom Corporation Limited Annual Report 2020
NOTES TO THE CONSOLIDATED FINANCIAL STATEMENTS for the year ended 31 December 2020 3. SIGNIFICANT ACCOUNTING POLICIES (continued) (k) Financial instruments (continued) Financial liabilities and equity (continued) Financial liabilities All financial liabilities are subsequently measured at amortised cost using the effective interest method. Financial liabilities including short-term and long-term debt, accounts payable and financial liabilities included in accrued expenses and other payables are subsequently measured at amortised cost, using the effective interest method. Offsetting a financial asset and a financial liability A financial asset and a financial liability are offset and the net amount presented in the consolidated statement of financial position when, and only when, the Group currently has a legally enforceable right to set off the recognised amounts; and intends either to settle on a net basis, or to realise the asset and settle the liability simultaneously. (l) Cash and cash equivalents Cash and cash equivalents comprise cash at bank and in hand and time deposits with original maturities of three months or less when purchased. Cash equivalents are stated at cost, which approximates fair value. (m) Revenue from contract with customers The Group recognises revenue when (or as) a performance obligation is satisfied. i.e. when “control” of the goods or services underlying the particular performance obligation is transferred to the customer. A performance obligation represents a good or service (or a bundle of goods or services) that is distinct or a series of distinct goods or services that are substantially the same. Control is transferred over time and revenue is recognised over time by reference to the progress towards complete satisfaction of the relevant performance obligation if one of the following criteria is met: • the customer simultaneously receives and consumes the benefits provided by the Group’s performance as the Group performs; • the Group’s performance creates or enhances an asset that the customer controls as the Groups performs; or • the Group’s performance does not create an asset with an alternative use to the Group and the Group has an enforceable right to payment for performance completed to date. As such, revenues from contracts with customers of telecommunications services, including voice, Internet, information and application and telecommunications network resource and equipment services, resale of mobile services (MVNO) and repair and maintenance of equipment are generally recognised over time during which the services are provided to customers. Otherwise, revenue is recognised at a point in time when the customer obtains control of the distinct good or service. As such, revenues from sales of equipment are recognise at a point in time when the equipment is delivered to the customers and when the control over the equipment have been transferred to the customers. China Telecom Corporation Limited Annual Report 2020
NOTES TO THE CONSOLIDATED FINANCIAL STATEMENTS for the year ended 31 December 2020 3. SIGNIFICANT ACCOUNTING POLICIES (continued) (m) Revenue from contract with customers (continued) A contract asset represents the Group’s right to consideration in exchange for goods or services that the Group has transferred to a customer but the right is conditioned on the Group’s future performance. A contract asset is transferred to accounts receivable when the right becomes unconditional. A contract asset is assessed for impairment in accordance with IFRS 9. In contrast, a receivable represents the Group’s unconditional right to consideration, i.e. only the passage of time is required before payment of that consideration is due. A contract liability represents the Group’s obligation to transfer goods or services to a customer for which the Group has received consideration (or an amount of consideration is due) from the customer. When the Group receives an advance payment before the performance obligation is satisfied, this will give rise to a contract liability, until the operating revenues recognised on the relevant contract exceed the amount of the advance payment. A contract asset and a contract liability relating to the same contract are accounted for and presented on a net basis. Contracts with multiple performance obligations (including allocation of transaction price) For contracts that contain more than one performance obligations, such as the Group’s direct sales of promotional packages bundling terminal equipment, e.g. mobile handsets, and the telecommunications services, the Group allocates the transaction price to each performance obligation on a relative stand-alone selling price basis. The stand-alone selling price of the distinct good or service underlying each performance obligation is determined at contract inception. It represents the price at which the Group would sell a promised good or service separately to a customer. If a stand-alone selling price is not directly observable, the Group estimates it using appropriate techniques such that the transaction price ultimately allocated to any performance obligation reflects the amount of consideration to which the Group expects to be entitled in exchange for transferring the promised goods or services to the customer. Over time revenue recognition: measurement of progress towards complete satisfaction of a performance obligation The progress towards complete satisfaction of a performance obligation is generally measured based on output method, which is to recognise revenue on the basis of direct measurements of the value of the goods or services transferred to the customer to date relative to the remaining goods or services promised under the contract. Principal versus agent When another party is involved in providing goods or services to a customer, the Group determines whether the nature of its promise is a performance obligation to provide the specified goods or services itself (i.e. the Group is a principal) or to arrange for those goods or services to be provided by the other party (i.e. the Group is an agent). The Group is a principal if it controls the specified good or service before that good or service is transferred to a customer. The Group is an agent if its performance obligation is to arrange for the provision of the specified good or service by another party. In this case, the Group does not control the specified good or service provided by another party before that good or service is transferred to the customer. When the Group acts as an agent, it recognises revenue in the amount of any fee or commission to which it expects to be entitled in exchange for arranging for the specified goods or services to be provided by the other party. China Telecom Corporation Limited Annual Report 2020
NOTES TO THE CONSOLIDATED FINANCIAL STATEMENTS for the year ended 31 December 2020 3. SIGNIFICANT ACCOUNTING POLICIES (continued) (m) Revenue from contract with customers (continued) Consideration payable to a customer Consideration payable to a customer includes cash amounts that the Group pays, or expects to pay, to the customer, and also includes credit or other items that can be applied against amounts owed to the Group. The Group accounted for such consideration payable to a customer as a reduction of the transaction price and, therefore, of revenue unless the payment to the customer is in exchange for a distinct good or service that the customer transfers to the Group and the fair value of the good or service received from the customer can be reasonably estimated. Certain subsidies payable to third party agent incurred by the Group in respect of customer contracts, which will be ultimately enjoyed by end customers, and other subsidies incurred by the Group directly payable to its customers, are qualified as consideration payable to a customer and accounted for as a reduction of operating revenues. Incremental costs of obtaining a contract Incremental costs of obtaining a contract are those costs that the Group incurs to obtain a contract with a customer that it would not have incurred if the contract had not been obtained. Certain commissions incurred by the Group paid or payable to third party agents, whose selling activities resulted in customers entering into telecommunications service agreements with the Group, are qualified as incremental costs. The Group recognises such costs as an asset, included in other assets, if it expects to recover these costs. The asset so recognised is subsequently amortised to profit or loss on a systematic basis that is consistent with the transfer to the customer of the goods or services to which the assets relate. The asset is subject to impairment review. The Group applies the practical expedient of expensing all incremental costs to obtain a contract if these costs would otherwise have been fully amortised to profit or loss within one year. Costs to fulfil a contract When the Group incurs costs to fulfil a contract, it first assesses whether these costs qualify for recognition as an asset in terms of other relevant standards, failing which it recognises an asset for these costs only if they meet all of the following criteria: • the costs relate directly to a contract or to an anticipated contract that the Group can specifically identify; • the costs generate or enhance resources of the Group that will be used in satisfying (or in continuing to satisfy) performance obligations in the future; and • the costs are expected to be recovered. The asset so recognised is subsequently amortised to profit or loss on a systematic basis that is consistent with the transfer to the customer of the goods or services to which the assets relate. The asset is subject to impairment review. China Telecom Corporation Limited Annual Report 2020
NOTES TO THE CONSOLIDATED FINANCIAL STATEMENTS for the year ended 31 December 2020 3. SIGNIFICANT ACCOUNTING POLICIES (continued) (n) Leases Definition of a lease A contract is, or contains, a lease if the contract conveys the right to control the use of an identified asset for a period of time in exchange for consideration. The Group assesses whether a contract is or contains a lease based on the definition under IFRS 16 at inception or modification date. Such contract will not be reassessed unless the terms and conditions of the contract are subsequently changed. The Group as a lessee As a practical expedient, leases with similar characteristics are accounted on a portfolio basis when the Group reasonably expects that the effects on the consolidated financial statements would not differ materially from individual leases within the portfolio. Allocation of consideration to components of a contract For a contract that contains a lease component and one or more additional lease or non-lease components, the Group allocates the consideration in the contract to each lease component on the basis of the relative stand-alone price of the lease component and the aggregate stand-alone price of the non-lease components. Short-term leases and leases of low-value assets The Group applies the short-term lease recognition exemption to leases that have a lease term of 12 months or less from the commencement date and do not contain a purchase option. It also applies the recognition exemption for lease of low-value assets. Lease payments on short-term leases and leases of low-value assets are recognised as expenses on a straight-line basis over the lease term. Right-of-use assets The cost of right-of-use asset includes: • the amount of the initial measurement of the lease liability; • any lease payments made at or before the commencement date, less any lease incentives received; • any initial direct costs incurred by the lessee; and • an estimate of costs to be incurred by the lessee in dismantling and removing the underlying assets, restoring the site on which it is located or restoring the underlying asset to the condition required by the terms and conditions of the lease. Right-of-use assets are measured at cost, less any accumulated depreciation and impairment losses, and adjusted for any remeasurement of lease liabilities other than adjustments to lease liabilities resulting from Covid-19-related rent concessions in which the Group applied the practical expedient. Right-of-use assets in which the Group is reasonably certain to obtain ownership of the underlying leased assets at the end of the lease term is depreciated from commencement date to the end of the useful life. Otherwise, right-of-use assets are depreciated on a straight-line basis over the shorter of its estimated useful life and the lease term. The Group presents right-of-use assets as a separate line item on the consolidated statement of financial position. China Telecom Corporation Limited Annual Report 2020
NOTES TO THE CONSOLIDATED FINANCIAL STATEMENTS for the year ended 31 December 2020 3. SIGNIFICANT ACCOUNTING POLICIES (continued) (n) Leases (continued) The Group as a lessee (continued) Lease liabilities At the commencement date of a lease, the Group recognises and measures the lease liability at the present value of lease payments that are unpaid at that date. In calculating the present value of lease payments, the Group uses the incremental borrowing rate at the lease commencement date if the interest rate implicit in the lease is not readily determinable. The lease payments include: • fixed payments (including in-substance fixed payments) less any lease incentives receivable; • variable lease payments that depend on an index or a rate; • the exercise price of a purchase option reasonably certain to be exercised by the Group; and • payments of penalties for terminating a lease, if the lease term reflects the Group exercising an option to terminate the lease. Variable lease payments that depend on an index or a rate are initially measured using the index or rate as at the commencement date. Variable lease payments that do not depend on an index or a rate are not included in the measurement of lease liabilities and right-of-use assets, and are recognised as expense in the period on which the event or condition that triggers the payment occurs. After the commencement date, lease liabilities are adjusted by interest accretion and lease payments. The Group remeasures lease liabilities (and makes a corresponding adjustment to the related right-of-use assets) whenever: • the lease term has changed or there is a change in the assessment of exercise of a purchase option, in which case the related lease liability is remeasured by discounting the revised lease payments using a revised discount rate at the date of assessment. • the lease payments change due to changes in market rental rates following a market rent review, in which cases the related lease liability is remeasured by discounting the revised lease payments using the initial discount rate. China Telecom Corporation Limited Annual Report 2020
NOTES TO THE CONSOLIDATED FINANCIAL STATEMENTS for the year ended 31 December 2020 3. SIGNIFICANT ACCOUNTING POLICIES (continued) (n) Leases (continued) The Group as a lessee (continued) Lease modifications Except for Covid-19-related rent concessions in which the Group applied the practical expedient, the Group accounts for a lease modification as a separate lease if: • the modification increases the scope of the lease by adding the right to use one or more underlying assets; and • the consideration for the leases increases by an amount commensurate with the stand-alone price for the increase in scope and any appropriate adjustments to that stand-alone price to reflect the circumstances of the particular contract. For a lease modification that is not accounted for as a separate lease, the Group remeasures the lease liability based on the lease term of the modified lease by discounting the revised lease payments using a revised discount rate at the effective date of the modification. The Group accounts for the remeasurement of lease liabilities by making corresponding adjustments to the relevant right-of-use asset. When the modified contract contains a lease component and one or more additional lease or non-lease components, the Group allocates the consideration in the modified contract to each lease component on the basis of the relative stand-alone price of the lease component and the aggregate stand-alone price of the non-lease components. Covid-19-related rent concessions In relation to rent concessions that occurred as a direct consequence of the Covid-19 pandemic, the Group has elected to apply the practical expedient not to assess whether the change is a lease modification if all of the following conditions are met: • the change in lease payments results in revised consideration for the lease that is substantially the same as, or less than, the consideration for the lease immediately preceding the change; • any reduction in lease payments affects only payments originally due on or before 30 June 2021; and • there is no substantive change to other terms and conditions of the lease. As a result of applying the practical expedient, the Group accounts for changes in lease payments resulting from rent concessions the same way it would account for the changes applying IFRS 16 if the changes were not a lease modification. Forgiveness or waiver of lease payments are accounted for as variable lease payments. The related lease liabilities are adjusted to reflect the amounts forgiven or waived with a corresponding adjustment recognised in the profit or loss in the period in which the event occurs. China Telecom Corporation Limited Annual Report 2020
NOTES TO THE CONSOLIDATED FINANCIAL STATEMENTS for the year ended 31 December 2020 3. SIGNIFICANT ACCOUNTING POLICIES (continued) (n) Leases (continued) The Group as a lessor Classification and measurement of leases Leases for which the Group is a lessor are classified as finance or operating leases. Whenever the terms of the lease transfer substantially all the risks and rewards incidental to ownership of an underlying asset to the lessee, the contract is classified as a finance lease. All other leases are classified as operating leases. Amounts due from lessees under finance leases are recognised as receivables at commencement date at amounts equal to net investments in the leases, measured using the interest rate implicit in the respective leases. Initial direct costs (other than those incurred by manufacturer or dealer lessors) are included in the initial measurement of the net investments in the leases. Interest income is allocated to accounting periods so as to reflect a constant periodic rate of return on the Group’s net investment outstanding in respect of the leases. Rental income from operating leases is recognised in profit or loss on a straight-line basis over the term of the relevant lease. Initial direct costs incurred in negotiating and arranging an operating lease are added to the carrying amount of the leased asset, and such costs are recognised as an expense on a straight-line basis over the lease term. Variable lease payments for operating leases that depend on an index or a rate are estimated and included in the total lease payments to be recognised on a straight-line basis over the lease term. Variable lease payments that do not depend on an index or a rate are recognised as income when they arise. Allocation of consideration to components of a contract When a contract includes both leases and non-lease components, the Group applies IFRS 15 to allocate consideration in a contract to lease and non-lease components. Non-lease components are separated from lease component on the basis of their relative stand-alone selling prices. Refundable rental deposits Refundable rental deposits received are accounted under IFRS 9 and initially measured at fair value. Adjustments to fair value at initial recognition are considered as additional lease payments from lessees. Sublease When the Group is an intermediate lessor, it accounts for the head lease and the sublease as two separate contracts. The sub-lease is classified as a finance or operating lease by reference to the right-of-use asset arising from the head lease, not with reference to the underlying asset. Lease modification Changes in considerations of lease contracts that were not part of the original terms and conditions are accounted for as lease modifications, including lease incentives provided through forgiveness or reduction of rentals. The Group accounts for a modification to an operating lease as a new lease from the effective date of the modification, considering any prepaid or accrued lease payments relating to the original lease as part of the lease payments for the new lease. China Telecom Corporation Limited Annual Report 2020
NOTES TO THE CONSOLIDATED FINANCIAL STATEMENTS for the year ended 31 December 2020 3. SIGNIFICANT ACCOUNTING POLICIES (continued) (o) Net finance costs Net finance costs comprise interest income on bank deposits, interest costs on borrowings, interest expense on lease liabilities and foreign exchange gains and losses. Interest income from bank deposits is recognised as it accrues using the effective interest method. Interest costs incurred in connection with borrowings are calculated using the effective interest method and are expensed as incurred, except to the extent that they are capitalised as being directly attributable to the construction of an asset which necessarily takes a substantial period of time to get ready for its intended use. (p) Research and development expense Research and development expenditure is expensed as incurred if the criteria of recognition as intangible assets were not met. For the year ended 31 December 2020, research and development expense, other than those related personnel expenses and depreciation was RMB2,215 million (2019: RMB2,105 million). Research and development related personnel expenses and depreciation for the year ended 31 December 2020 amounted to RMB2,392 million (2019: RMB1,950 million) and RMB130 million (2019: RMB141 million), respectively. (q) Employee benefits The Group’s contributions to defined contribution retirement plans administered by the PRC government and defined contribution retirement plans administered by independent external parties are recognised in profit or loss as incurred. Further information is set out in Note 46. Compensation expense in respect of the share appreciation rights granted is accrued as a charge to the profit or loss over the applicable vesting period based on the fair value of the share appreciation rights. The liability of the accrued compensation expense is re-measured to fair value at the end of each reporting period with the effect of changes in the fair value of the liability charged or credited to profit or loss. Further details of the Group’s share appreciation rights scheme are set out in Note 47. (r) Government grants The Group’s government grants are mainly related to the government loans with below-market rate of interest. Government grants shall only be recognised until there is reasonable assurance that: • the Group will comply with all the conditions attaching to them; and • the grants will be received. Government grants that compensate expenses incurred are recognised in the consolidated statement of comprehensive income in the same periods in which the expenses are incurred. Government grants relating to assets are recognised in deferred revenue and are credited to the consolidated statement of comprehensive income on a straight-line basis over the expected lives of the related assets. China Telecom Corporation Limited Annual Report 2020
NOTES TO THE CONSOLIDATED FINANCIAL STATEMENTS for the year ended 31 December 2020 3. SIGNIFICANT ACCOUNTING POLICIES (continued) (s) Provisions and contingent liabilities A provision is recognised in the consolidated statement of financial position when the Group has a legal or constructive obligation as a result of a past event, it is probable that an outflow of economic benefits will be required to settle the obligation and a reliable estimate can be made of the amount of the obligation. The amount recognised as a provision is the best estimate of the consideration required to settle the present obligation at the end of the reporting period. Where the time value of money is material, provisions are stated at the present value of the expenditure expected to settle the obligation. Where it is not probable that an outflow of economic benefits will be required, or the amount cannot be estimated reliably, the obligation is disclosed as a contingent liability, unless the probability of outflow of economic benefits is remote. Possible obligations, whose existence will only be confirmed by the occurrence or non-occurrence of one or more future events, are also disclosed as contingent liabilities unless the probability of outflow of economic benefits is remote. (t) Value-added tax (“VAT”) Output VAT rate for basic telecommunications services (including voice communication, lease or sale of network resources) is 9% since 1 April 2019, 10% between 1 May 2018 and 1 April 2019, or 11% before 1 May 2018, while the output VAT rate for value-added telecommunications services (including Internet access services, short and multimedia messaging services, transmission and application service of electronic data and information) is 6%, and the output VAT for sales of telecommunications terminals and equipment is 13% since 1 April 2019, 16% between 1 May 2018 and 1 April 2019, or 17% before 1 May 2018. Input VAT rate depends on the type of services received and the assets purchased as well as the VAT rate applicable to a specific industry, and ranges from 3% to 13% since 1 April 2019, 3% to 16% between 1 May 2018 and 1 April 2019, or 3% to 17% before 1 May 2018. Output VAT is excluded from operating revenues while input VAT is excluded from operating expenses or the original cost of equipment purchased and can be netted against the output VAT, arriving at the net amount of VAT recoverable or payable. As the VAT obligations are borne by branches and subsidiaries of the Company, input and output VAT are set off at branches and subsidiaries levels which are not offset at the consolidation level. Such net amount of VAT recoverable or payable is recorded in the line items of prepayments and other current assets and accrued expenses and other payables, respectively, on the face of consolidated statement of financial position. (u) Income tax Income tax for the year comprises current tax and movement in deferred tax assets and liabilities. Income tax is recognised in profit or loss except to the extent that it relates to items recognised in other comprehensive income, or directly in equity, in which case the relevant amounts of tax are recognised in other comprehensive income or directly in equity respectively. Current tax is the expected tax payable on the taxable income for the year, using tax rates enacted or substantively enacted at the end of the reporting period, and any adjustment to tax payable in respect of previous years. Deferred tax is provided using the balance sheet liability method, providing for all temporary differences between the carrying amounts of assets and liabilities for financial reporting purposes and their tax bases. The amount of deferred tax is calculated on the basis of the enacted or substantively enacted tax rates that are expected to apply in the period when the asset is realised or the liability is settled. The effect on deferred tax of any changes in tax rates is charged or credited to profit or loss, except for the effect of a change in tax rate on the carrying amount of deferred tax assets and liabilities which were previously recognised in other comprehensive income, in such case the effect of a change in tax rate is also recognised in other comprehensive income. China Telecom Corporation Limited Annual Report 2020
NOTES TO THE CONSOLIDATED FINANCIAL STATEMENTS for the year ended 31 December 2020 3. SIGNIFICANT ACCOUNTING POLICIES (continued) (u) Income tax (continued) A deferred tax asset is recognised only to the extent that it is probable that future taxable income will be available against which the asset can be utilised. Deferred tax assets are reduced to the extent that it is no longer probable that the related tax benefit will be realised. Deferred tax liabilities are generally recognised for all taxable temporary differences. Deferred tax liabilities are recognised for taxable temporary differences associated with investments in subsidiaries and associates, except where the Group is able to control the reversal of the temporary difference and it is probable that the temporary difference will not reverse in the foreseeable future. For the purposes of measuring deferred tax for leasing transactions in which the Group recognises the right-of-use assets and the related lease liabilities, the Group first determines whether the tax deductions are attributable to the right-of-use assets or the lease liabilities. The tax deductions of the Group’s leasing transactions are attributable to the lease liabilities. The Group applies IAS 12, “Income Taxes” requirements to the leasing transaction as a whole. Temporary differences relating to right-of-use assets and lease liabilities are assessed on a net basis. Excess of depreciation on right-of-use assets over the lease payments for the principal portion of lease liabilities resulting in net deductible temporary differences. (v) Dividends Dividends are recognised as a liability in the period in which they are declared. (w) Related parties (a) A person, or a close member of that person’s family, is related to the Group if that person: (i) has control or joint control over the Group; (ii) has significant influence over the Group; or (iii) is a member of the key management personnel of the Group or the Group’s parent. China Telecom Corporation Limited Annual Report 2020
NOTES TO THE CONSOLIDATED FINANCIAL STATEMENTS for the year ended 31 December 2020 3. SIGNIFICANT ACCOUNTING POLICIES (continued) (w) Related parties (continued) (b) An entity is related to the Group if any of the following conditions applies: (i) The entity and the Group are members of the same group (which means that each parent, subsidiary and fellow subsidiary is related to the others); (ii) The entity is an associate or joint venture of the Group (or an associate or joint venture of a member of a group of which the Group is a member); or the Group is an associate or joint venture of the entity (or an associate or joint venture of a member of a group of which the entity is a member); (iii) The entity and the Group are joint ventures of the same third party; (iv) The entity is a joint venture of a third entity and the Group is an associate of the third entity; or the Group is a joint venture of a third entity and the entity is an associate of the third entity; (v) The entity is controlled or jointly controlled by a person identified in (a); (vi) A person identified in (a)(i) has significant influence over the entity or is a member of the key management personnel of the entity (or of a parent of the entity). Close members of the family of a person are those family members who may be expected to influence, or be influenced by, that person in their dealings with the entity. (x) Segmental reporting An operating segment is a component of an entity that engages in business activities from which revenues are earned and expenses are incurred, and is identified on the basis of the internal financial reports that are regularly reviewed by the chief operating decision maker in order to allocate resources and assess performance of the segment. For the periods presented, management has determined that the Group has one operating segment as the Group is only engaged in the integrated telecommunications business. The Group’s assets located outside mainland China and operating revenues derived from activities outside mainland China are less than 10% of the Group’s assets and operating revenues, respectively. No geographical area information has been presented as such amount is immaterial. No single external customer accounts for 10% or more of the Group’s operating revenues. China Telecom Corporation Limited Annual Report 2020
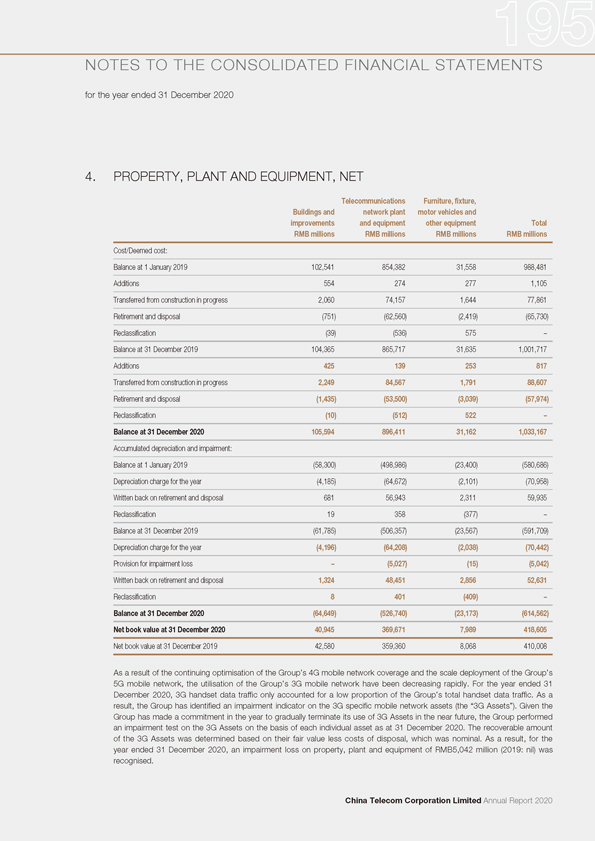
NOTES TO THE CONSOLIDATED FINANCIAL STATEMENTS for the year ended 31 December 2020 4. PROPERTY, PLANT AND EQUIPMENT, NET Telecommunications Furniture, fixture, Buildings and network plant motor vehicles and improvements and equipment other equipment Total RMB millions RMB millions RMB millions RMB millions Cost/Deemed cost: Balance at 1 January 2019 102,541 854,382 31,558 988,481 Additions 554 274 277 1,105 Transferred from construction in progress 2,060 74,157 1,644 77,861 Retirement and disposal (751) (62,560) (2,419) (65,730) Reclassification (39) (536) 575 –Balance at 31 December 2019 104,365 865,717 31,635 1,001,717 Additions 425 139 253 817 Transferred from construction in progress 2,249 84,567 1,791 88,607 Retirement and disposal (1,435) (53,500) (3,039) (57,974) Reclassification (10) (512) 522 –Balance at 31 December 2020 105,594 896,411 31,162 1,033,167 Accumulated depreciation and impairment: Balance at 1 January 2019 (58,300) (498,986) (23,400) (580,686) Depreciation charge for the year (4,185) (64,672) (2,101) (70,958) Written back on retirement and disposal 681 56,943 2,311 59,935 Reclassification 19 358 (377) –Balance at 31 December 2019 (61,785) (506,357) (23,567) (591,709) Depreciation charge for the year (4,196) (64,208) (2,038) (70,442) Provision for impairment loss – (5,027) (15) (5,042) Written back on retirement and disposal 1,324 48,451 2,856 52,631 Reclassification 8 401 (409) –Balance at 31 December 2020 (64,649) (526,740) (23,173) (614,562) Net book value at 31 December 2020 40,945 369,671 7,989 418,605 Net book value at 31 December 2019 42,580 359,360 8,068 410,008 As a result of the continuing optimisation of the Group’s 4G mobile network coverage and the scale deployment of the Group’s 5G mobile network, the utilisation of the Group’s 3G mobile network have been decreasing rapidly. For the year ended 31 December 2020, 3G handset data traffic only accounted for a low proportion of the Group’s total handset data traffic. As a result, the Group has identified an impairment indicator on the 3G specific mobile network assets (the “3G Assets”). Given the Group has made a commitment in the year to gradually terminate its use of 3G Assets in the near future, the Group performed an impairment test on the 3G Assets on the basis of each individual asset as at 31 December 2020. The recoverable amount of the 3G Assets was determined based on their fair value less costs of disposal, which was nominal. As a result, for the year ended 31 December 2020, an impairment loss on property, plant and equipment of RMB5,042 million (2019: nil) was recognised. China Telecom Corporation Limited Annual Report 2020
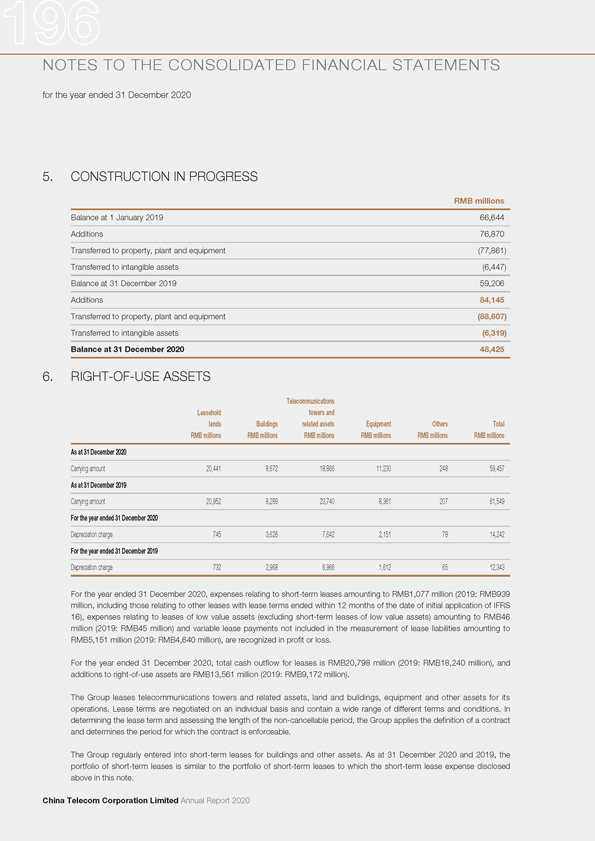
NOTES TO THE CONSOLIDATED FINANCIAL STATEMENTS for the year ended 31 December 2020 5. CONSTRUCTION IN PROGRESS RMB millions Balance at 1 January 2019 66,644 Additions 76,870 Transferred to property, plant and equipment (77,861) Transferred to intangible assets (6,447) Balance at 31 December 2019 59,206 Additions 84,145 Transferred to property, plant and equipment (88,607) Transferred to intangible assets (6,319) Balance at 31 December 2020 48,425 6. RIGHT-OF-USE ASSETS Telecommunications Leasehold towers and lands Buildings related assets Equipment Others Total RMB millions RMB millions RMB millions RMB millions RMB millions RMB millions As at 31 December 2020 Carrying amount 20,441 8,672 18,866 11,230 248 59,457 As at 31 December 2019 Carrying amount 20,952 8,289 23,740 8,361 207 61,549 For the year ended 31 December 2020 Depreciation charge 745 3,626 7,642 2,151 78 14,242 For the year ended 31 December 2019 Depreciation charge 732 2,968 6,966 1,612 65 12,343 For the year ended 31 December 2020, expenses relating to short-term leases amounting to RMB1,077 million (2019: RMB939 million, including those relating to other leases with lease terms ended within 12 months of the date of initial application of IFRS 16), expenses relating to leases of low value assets (excluding short-term leases of low value assets) amounting to RMB46 million (2019: RMB45 million) and variable lease payments not included in the measurement of lease liabilities amounting to RMB5,151 million (2019: RMB4,640 million), are recognized in profit or loss. For the year ended 31 December 2020, total cash outflow for leases is RMB20,798 million (2019: RMB18,240 million), and additions to right-of-use assets are RMB13,561 million (2019: RMB9,172 million). The Group leases telecommunications towers and related assets, land and buildings, equipment and other assets for its operations. Lease terms are negotiated on an individual basis and contain a wide range of different terms and conditions. In determining the lease term and assessing the length of the non-cancellable period, the Group applies the definition of a contract and determines the period for which the contract is enforceable. The Group regularly entered into short-term leases for buildings and other assets. As at 31 December 2020 and 2019, the portfolio of short-term leases is similar to the portfolio of short-term leases to which the short-term lease expense disclosed above in this note. China Telecom Corporation Limited Annual Report 2020
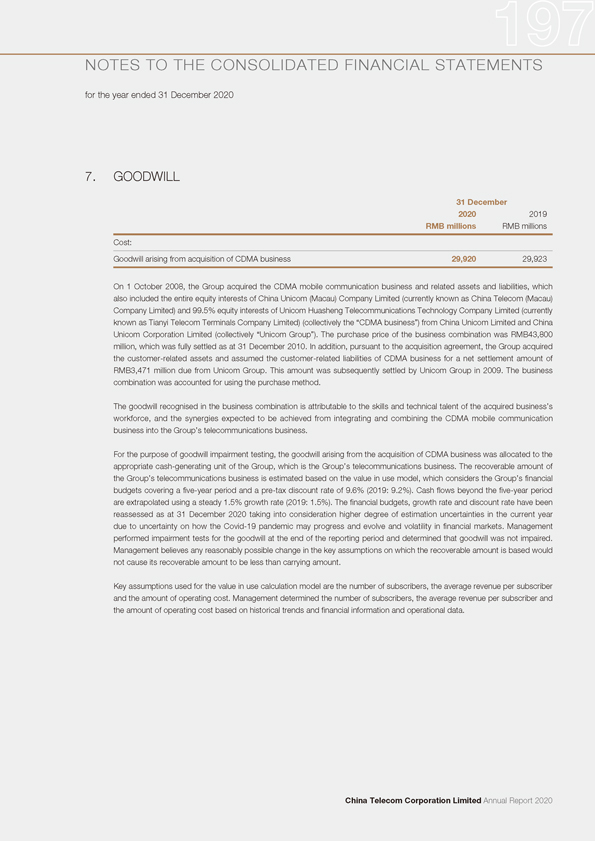
NOTES TO THE CONSOLIDATED FINANCIAL STATEMENTS for the year ended 31 December 2020 7. GOODWILL 31 December 2020 2019 RMB millions RMB millions Cost: Goodwill arising from acquisition of CDMA business 29,920 29,923 On 1 October 2008, the Group acquired the CDMA mobile communication business and related assets and liabilities, which also included the entire equity interests of China Unicom (Macau) Company Limited (currently known as China Telecom (Macau) Company Limited) and 99.5% equity interests of Unicom Huasheng Telecommunications Technology Company Limited (currently known as Tianyi Telecom Terminals Company Limited) (collectively the “CDMA business”) from China Unicom Limited and China Unicom Corporation Limited (collectively “Unicom Group”). The purchase price of the business combination was RMB43,800 million, which was fully settled as at 31 December 2010. In addition, pursuant to the acquisition agreement, the Group acquired the customer-related assets and assumed the customer-related liabilities of CDMA business for a net settlement amount of RMB3,471 million due from Unicom Group. This amount was subsequently settled by Unicom Group in 2009. The business combination was accounted for using the purchase method. The goodwill recognised in the business combination is attributable to the skills and technical talent of the acquired business’s workforce, and the synergies expected to be achieved from integrating and combining the CDMA mobile communication business into the Group’s telecommunications business. For the purpose of goodwill impairment testing, the goodwill arising from the acquisition of CDMA business was allocated to the appropriate cash-generating unit of the Group, which is the Group’s telecommunications business. The recoverable amount of the Group’s telecommunications business is estimated based on the value in use model, which considers the Group’s financial budgets covering a five-year period and a pre-tax discount rate of 9.6% (2019: 9.2%) . Cash flows beyond the five-year period are extrapolated using a steady 1.5% growth rate (2019: 1.5%) . The financial budgets, growth rate and discount rate have been reassessed as at 31 December 2020 taking into consideration higher degree of estimation uncertainties in the current year due to uncertainty on how the Covid-19 pandemic may progress and evolve and volatility in financial markets. Management performed impairment tests for the goodwill at the end of the reporting period and determined that goodwill was not impaired. Management believes any reasonably possible change in the key assumptions on which the recoverable amount is based would not cause its recoverable amount to be less than carrying amount. Key assumptions used for the value in use calculation model are the number of subscribers, the average revenue per subscriber and the amount of operating cost. Management determined the number of subscribers, the average revenue per subscriber and the amount of operating cost based on historical trends and financial information and operational data. China Telecom Corporation Limited Annual Report 2020
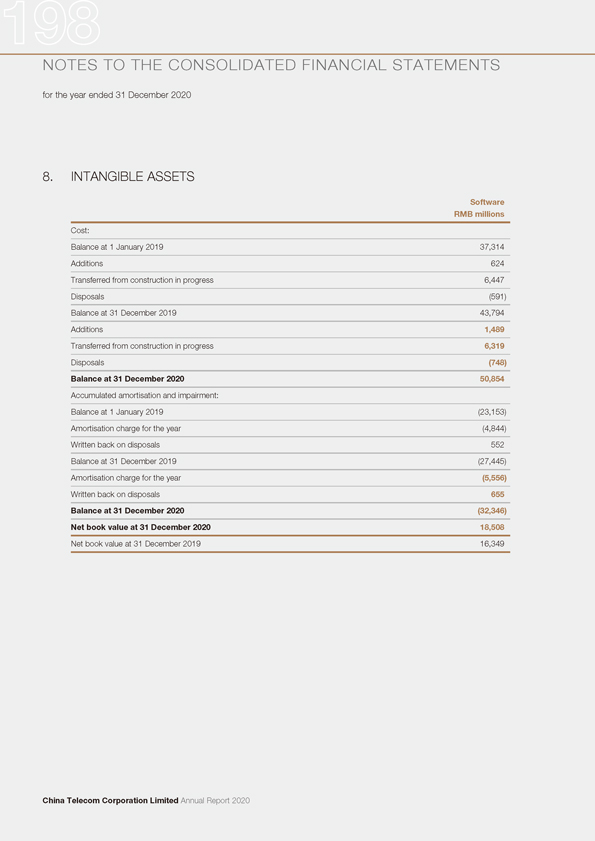
NOTES TO THE CONSOLIDATED FINANCIAL STATEMENTS for the year ended 31 December 2020 8. INTANGIBLE ASSETS Software RMB millions Cost: Balance at 1 January 2019 37,314 Additions 624 Transferred from construction in progress 6,447 Disposals (591) Balance at 31 December 2019 43,794 Additions 1,489 Transferred from construction in progress 6,319 Disposals (748) Balance at 31 December 2020 50,854 Accumulated amortisation and impairment: Balance at 1 January 2019 (23,153) Amortisation charge for the year (4,844) Written back on disposals 552 Balance at 31 December 2019 (27,445) Amortisation charge for the year (5,556) Written back on disposals 655 Balance at 31 December 2020 (32,346) Net book value at 31 December 2020 18,508 Net book value at 31 December 2019 16,349 China Telecom Corporation Limited Annual Report 2020
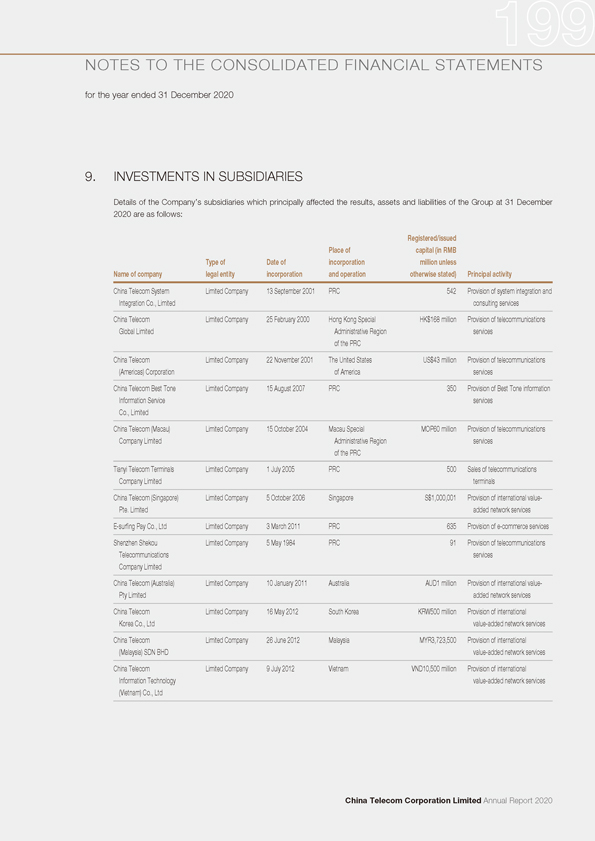
NOTES TO THE CONSOLIDATED FINANCIAL STATEMENTS for the year ended 31 December 2020 9. INVESTMENTS IN SUBSIDIARIES Details of the Company’s subsidiaries which principally affected the results, assets and liabilities of the Group at 31 December 2020 are as follows: Registered/issued Place of capital (in RMB Type of Date of incorporation million unless Name of company legal entity incorporation and operation otherwise stated) Principal activity China Telecom System Limited Company 13 September 2001 PRC 542 Provision of system integration and Integration Co., Limited consulting services China Telecom Limited Company 25 February 2000 Hong Kong Special HK$168 million Provision of telecommunications Global Limited Administrative Region services of the PRC China Telecom Limited Company 22 November 2001 The United States US$43 million Provision of telecommunications (Americas) Corporation of America services China Telecom Best Tone Limited Company 15 August 2007 PRC 350 Provision of Best Tone information Information Service services Co., Limited China Telecom (Macau) Limited Company 15 October 2004 Macau Special MOP60 million Provision of telecommunications Company Limited Administrative Region services of the PRC Tianyi Telecom Terminals Limited Company 1 July 2005 PRC 500 Sales of telecommunications Company Limited terminals China Telecom (Singapore) Limited Company 5 October 2006 Singapore S$1,000,001 Provision of international value-Pte. Limited added network services E-surfing Pay Co., Ltd Limited Company 3 March 2011 PRC 635 Provision of e-commerce services Shenzhen Shekou Limited Company 5 May 1984 PRC 91 Provision of telecommunications Telecommunications services Company Limited China Telecom (Australia) Limited Company 10 January 2011 Australia AUD1 million Provision of international value-Pty Limited added network services China Telecom Limited Company 16 May 2012 South Korea KRW500 million Provision of international Korea Co., Ltd value-added network services China Telecom Limited Company 26 June 2012 Malaysia MYR3,723,500 Provision of international (Malaysia) SDN BHD value-added network services China Telecom Limited Company 9 July 2012 Vietnam VND10,500 million Provision of international Information Technology value-added network services (Vietnam) Co., Ltd China Telecom Corporation Limited Annual Report 2020
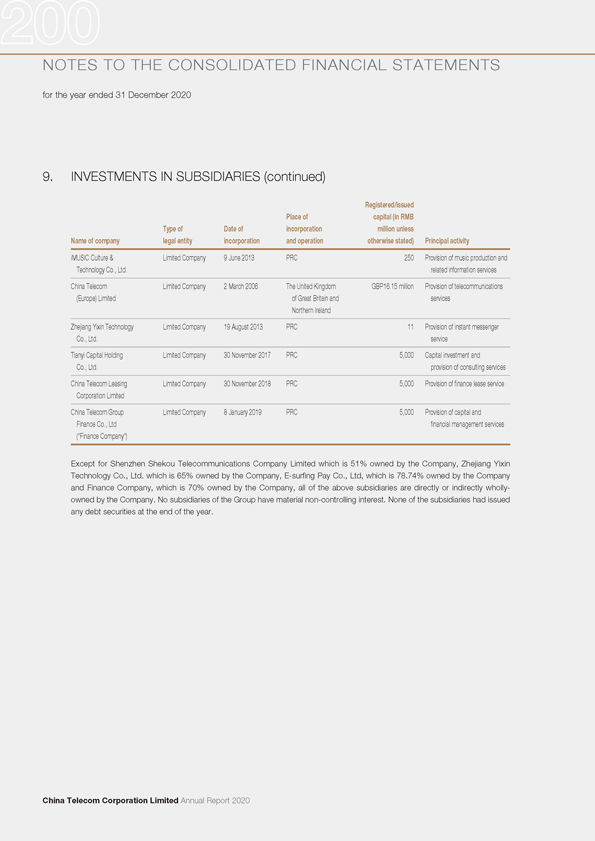
NOTES TO THE CONSOLIDATED FINANCIAL STATEMENTS for the year ended 31 December 2020 9. INVESTMENTS IN SUBSIDIARIES (continued) Registered/issued Place of capital (in RMB Type of Date of incorporation million unless Name of company legal entity incorporation and operation otherwise stated) Principal activity iMUSIC Culture & Limited Company 9 June 2013 PRC 250 Provision of music production and Technology Co., Ltd. related information services China Telecom Limited Company 2 March 2006 The United Kingdom GBP16.15 million Provision of telecommunications (Europe) Limited of Great Britain and services Northern Ireland Zhejiang Yixin Technology Limited Company 19 August 2013 PRC 11 Provision of instant messenger Co., Ltd. service Tianyi Capital Holding Limited Company 30 November 2017 PRC 5,000 Capital investment and Co., Ltd. provision of consulting services China Telecom Leasing Limited Company 30 November 2018 PRC 5,000 Provision of finance lease service Corporation Limited China Telecom Group Limited Company 8 January 2019 PRC 5,000 Provision of capital and Finance Co., Ltd financial management services (“Finance Company”) Except for Shenzhen Shekou Telecommunications Company Limited which is 51% owned by the Company, Zhejiang Yixin Technology Co., Ltd. which is 65% owned by the Company, E-surfing Pay Co., Ltd, which is 78.74% owned by the Company and Finance Company, which is 70% owned by the Company, all of the above subsidiaries are directly or indirectly wholly-owned by the Company. No subsidiaries of the Group have material non-controlling interest. None of the subsidiaries had issued any debt securities at the end of the year. China Telecom Corporation Limited Annual Report 2020
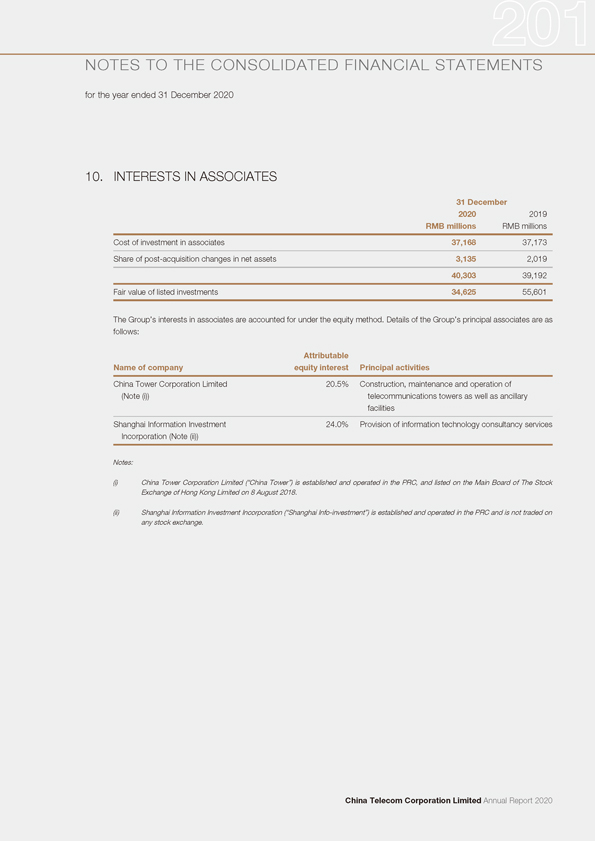
NOTES TO THE CONSOLIDATED FINANCIAL STATEMENTS for the year ended 31 December 2020 10. INTERESTS IN ASSOCIATES 31 December 2020 2019 RMB millions RMB millions Cost of investment in associates 37,168 37,173 Share of post-acquisition changes in net assets 3,135 2,019 40,303 39,192 Fair value of listed investments 34,625 55,601 The Group’s interests in associates are accounted for under the equity method. Details of the Group’s principal associates are as follows: Attributable Name of company equity interest Principal activities China Tower Corporation Limited 20.5% Construction, maintenance and operation of (Note (i)) telecommunications towers as well as ancillary facilities Shanghai Information Investment 24.0% Provision of information technology consultancy services Incorporation (Note (ii)) Notes: (i) China Tower Corporation Limited (“China Tower”) is established and operated in the PRC, and listed on the Main Board of The Stock Exchange of Hong Kong Limited on 8 August 2018. (ii) Shanghai Information Investment Incorporation (“Shanghai Info-investment”) is established and operated in the PRC and is not traded on any stock exchange. China Telecom Corporation Limited Annual Report 2020
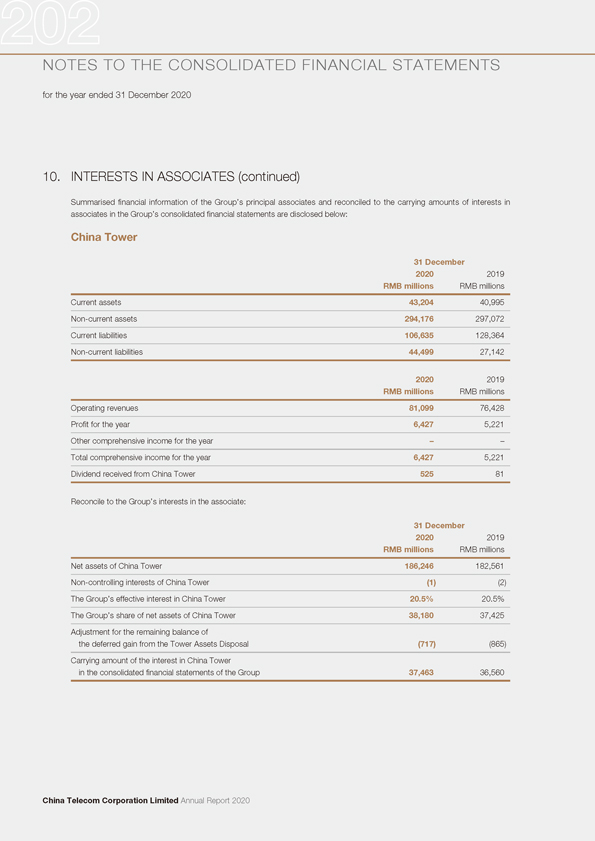
NOTES TO THE CONSOLIDATED FINANCIAL STATEMENTS for the year ended 31 December 2020 10. INTERESTS IN ASSOCIATES (continued) Summarised financial information of the Group’s principal associates and reconciled to the carrying amounts of interests in associates in the Group’s consolidated financial statements are disclosed below: China Tower 31 December 2020 2019 RMB millions RMB millions Current assets 43,204 40,995 Non-current assets 294,176 297,072 Current liabilities 106,635 128,364 Non-current liabilities 44,499 27,142 2020 2019 RMB millions RMB millions Operating revenues 81,099 76,428 Profit for the year 6,427 5,221 Other comprehensive income for the year – –Total comprehensive income for the year 6,427 5,221 Dividend received from China Tower 525 81 Reconcile to the Group’s interests in the associate: 31 December 2020 2019 RMB millions RMB millions Net assets of China Tower 186,246 182,561 Non-controlling interests of China Tower (1) (2) The Group’s effective interest in China Tower 20.5% 20.5% The Group’s share of net assets of China Tower 38,180 37,425 Adjustment for the remaining balance of the deferred gain from the Tower Assets Disposal (717) (865) Carrying amount of the interest in China Tower in the consolidated financial statements of the Group 37,463 36,560 China Telecom Corporation Limited Annual Report 2020
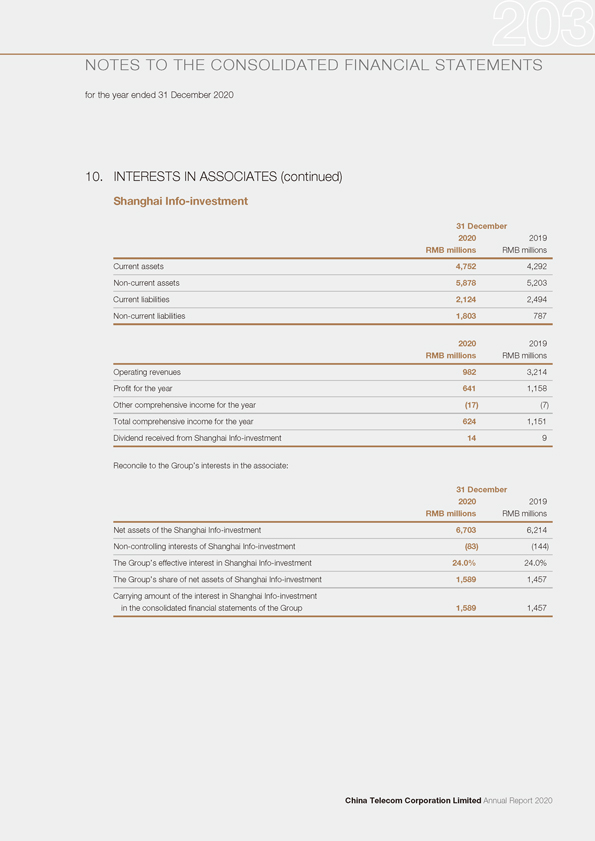
NOTES TO THE CONSOLIDATED FINANCIAL STATEMENTS for the year ended 31 December 2020 10. INTERESTS IN ASSOCIATES (continued) Shanghai Info-investment 31 December 2020 2019 RMB millions RMB millions Current assets 4,752 4,292 Non-current assets 5,878 5,203 Current liabilities 2,124 2,494 Non-current liabilities 1,803 787 2020 2019 RMB millions RMB millions Operating revenues 982 3,214 Profit for the year 641 1,158 Other comprehensive income for the year (17) (7) Total comprehensive income for the year 624 1,151 Dividend received from Shanghai Info-investment 14 9 Reconcile to the Group’s interests in the associate: 31 December 2020 2019 RMB millions RMB millions Net assets of the Shanghai Info-investment 6,703 6,214 Non-controlling interests of Shanghai Info-investment (83) (144) The Group’s effective interest in Shanghai Info-investment 24.0% 24.0% The Group’s share of net assets of Shanghai Info-investment 1,589 1,457 Carrying amount of the interest in Shanghai Info-investment in the consolidated financial statements of the Group 1,589 1,457 China Telecom Corporation Limited Annual Report 2020
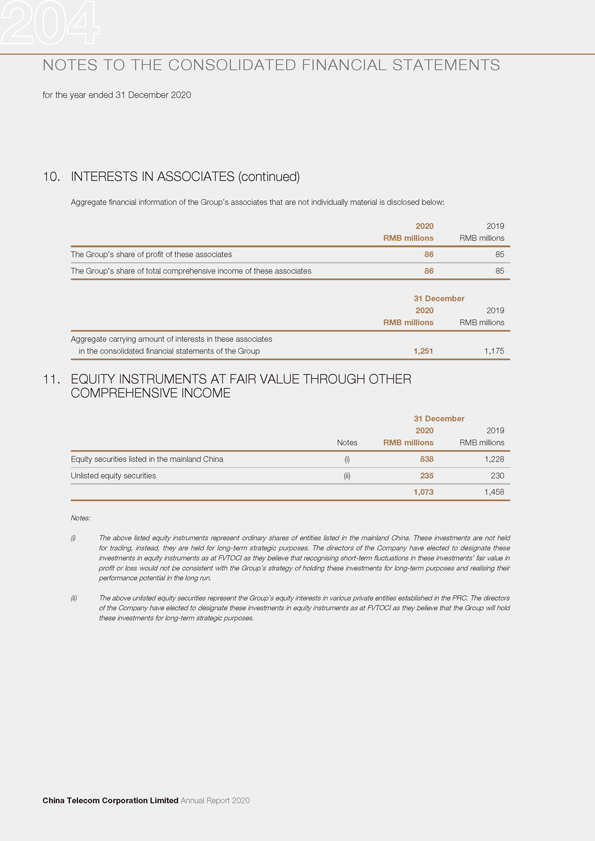
NOTES TO THE CONSOLIDATED FINANCIAL STATEMENTS for the year ended 31 December 2020 10. INTERESTS IN ASSOCIATES (continued) Aggregate financial information of the Group’s associates that are not individually material is disclosed below: 2020 2019 RMB millions RMB millions The Group’s share of profit of these associates 86 85 The Group’s share of total comprehensive income of these associates 86 85 31 December 2020 2019 RMB millions RMB millions Aggregate carrying amount of interests in these associates in the consolidated financial statements of the Group 1,251 1,175 11. EQUITY INSTRUMENTS AT FAIR VALUE THROUGH OTHER COMPREHENSIVE INCOME 31 December 2020 2019 Notes RMB millions RMB millions Equity securities listed in the mainland China (i) 838 1,228 Unlisted equity securities (ii) 235 230 1,073 1,458 Notes: (i) The above listed equity instruments represent ordinary shares of entities listed in the mainland China. These investments are not held for trading, instead, they are held for long-term strategic purposes. The directors of the Company have elected to designate these investments in equity instruments as at FVTOCI as they believe that recognising short-term fluctuations in these investments’ fair value in profit or loss would not be consistent with the Group’s strategy of holding these investments for long-term purposes and realising their performance potential in the long run. (ii) The above unlisted equity securities represent the Group’s equity interests in various private entities established in the PRC. The directors of the Company have elected to designate these investments in equity instruments as at FVTOCI as they believe that the Group will hold these investments for long-term strategic purposes. China Telecom Corporation Limited Annual Report 2020
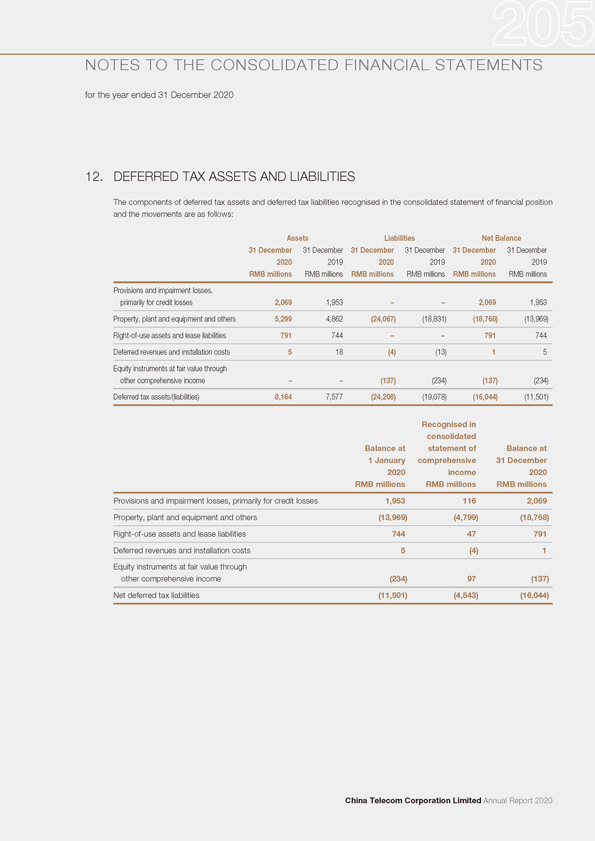
NOTES TO THE CONSOLIDATED FINANCIAL STATEMENTS for the year ended 31 December 2020 12. DEFERRED TAX ASSETS AND LIABILITIES The components of deferred tax assets and deferred tax liabilities recognised in the consolidated statement of financial position and the movements are as follows: Assets Liabilities Net Balance 31 December 31 December 31 December 31 December 31 December 31 December 2020 2019 2020 2019 2020 2019 RMB millions RMB millions RMB millions RMB millions RMB millions RMB millions Provisions and impairment losses, primarily for credit losses 2,069 1,953 – – 2,069 1,953 Property, plant and equipment and others 5,299 4,862 (24,067) (18,831) (18,768) (13,969) Right-of-use assets and lease liabilities 791 744 – – 791 744 Deferred revenues and installation costs 5 18 (4) (13) 1 5 Equity instruments at fair value through other comprehensive income – – (137) (234) (137) (234) Deferred tax assets/(liabilities) 8,164 7,577 (24,208) (19,078) (16,044) (11,501) Recognised in consolidated Balance at statement of Balance at 1 January comprehensive 31 December 2020 income 2020 RMB millions RMB millions RMB millions Provisions and impairment losses, primarily for credit losses 1,953 116 2,069 Property, plant and equipment and others (13,969) (4,799) (18,768) Right-of-use assets and lease liabilities 744 47 791 Deferred revenues and installation costs 5 (4) 1 Equity instruments at fair value through other comprehensive income (234) 97 (137) Net deferred tax liabilities (11,501) (4,543) (16,044) China Telecom Corporation Limited Annual Report 2020
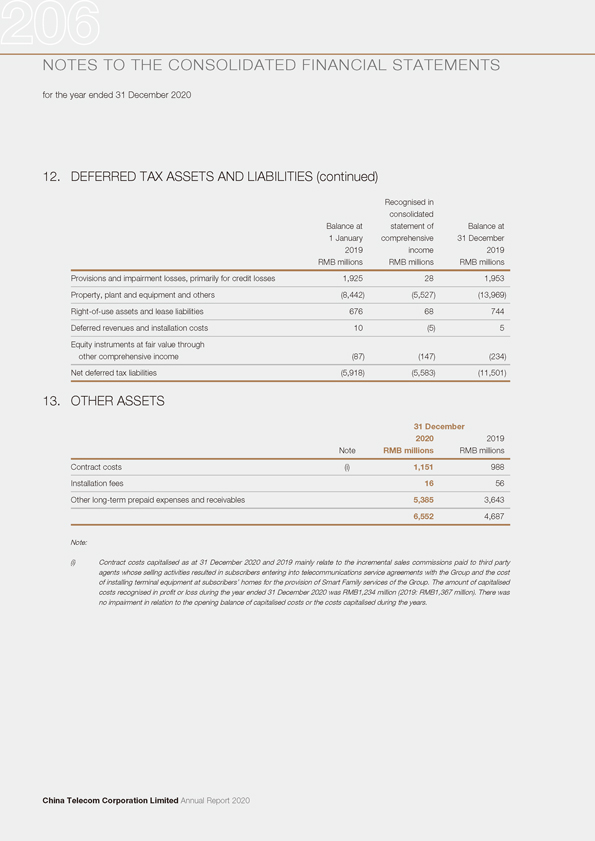
NOTES TO THE CONSOLIDATED FINANCIAL STATEMENTS for the year ended 31 December 2020 12. DEFERRED TAX ASSETS AND LIABILITIES (continued) Recognised in consolidated Balance at statement of Balance at 1 January comprehensive 31 December 2019 income 2019 RMB millions RMB millions RMB millions Provisions and impairment losses, primarily for credit losses 1,925 28 1,953 Property, plant and equipment and others (8,442) (5,527) (13,969) Right-of-use assets and lease liabilities 676 68 744 Deferred revenues and installation costs 10 (5) 5 Equity instruments at fair value through other comprehensive income (87) (147) (234) Net deferred tax liabilities (5,918) (5,583) (11,501) 13. OTHER ASSETS 31 December 2020 2019 Note RMB millions RMB millions Contract costs (i) 1,151 988 Installation fees 16 56 Other long-term prepaid expenses and receivables 5,385 3,643 6,552 4,687 Note: (i) Contract costs capitalised as at 31 December 2020 and 2019 mainly relate to the incremental sales commissions paid to third party agents whose selling activities resulted in subscribers entering into telecommunications service agreements with the Group and the cost of installing terminal equipment at subscribers’ homes for the provision of Smart Family services of the Group. The amount of capitalised costs recognised in profit or loss during the year ended 31 December 2020 was RMB1,234 million (2019: RMB1,367 million). There was no impairment in relation to the opening balance of capitalised costs or the costs capitalised during the years. China Telecom Corporation Limited Annual Report 2020
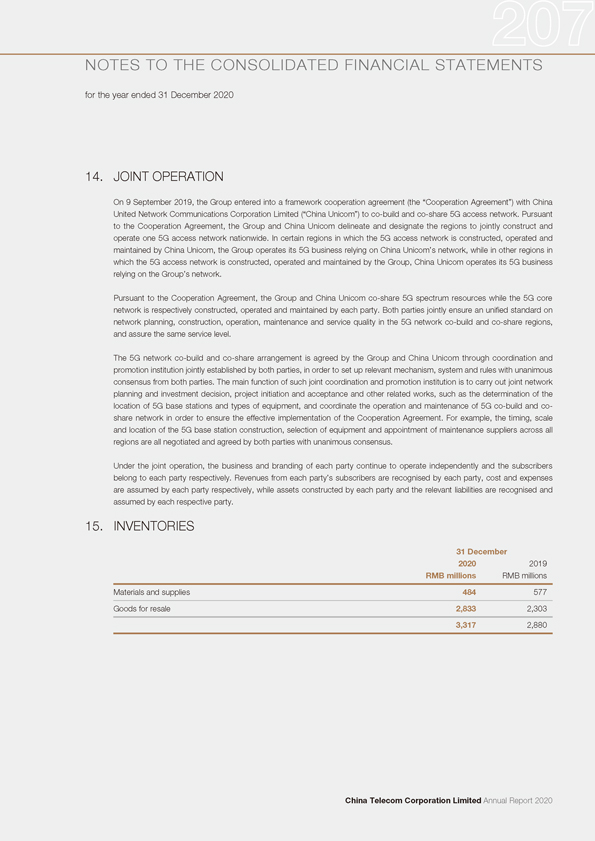
NOTES TO THE CONSOLIDATED FINANCIAL STATEMENTS for the year ended 31 December 2020 14. JOINT OPERATION On 9 September 2019, the Group entered into a framework cooperation agreement (the “Cooperation Agreement”) with China United Network Communications Corporation Limited (“China Unicom”) to co-build and co-share 5G access network. Pursuant to the Cooperation Agreement, the Group and China Unicom delineate and designate the regions to jointly construct and operate one 5G access network nationwide. In certain regions in which the 5G access network is constructed, operated and maintained by China Unicom, the Group operates its 5G business relying on China Unicom’s network, while in other regions in which the 5G access network is constructed, operated and maintained by the Group, China Unicom operates its 5G business relying on the Group’s network. Pursuant to the Cooperation Agreement, the Group and China Unicom co-share 5G spectrum resources while the 5G core network is respectively constructed, operated and maintained by each party. Both parties jointly ensure an unified standard on network planning, construction, operation, maintenance and service quality in the 5G network co-build and co-share regions, and assure the same service level. The 5G network co-build and co-share arrangement is agreed by the Group and China Unicom through coordination and promotion institution jointly established by both parties, in order to set up relevant mechanism, system and rules with unanimous consensus from both parties. The main function of such joint coordination and promotion institution is to carry out joint network planning and investment decision, project initiation and acceptance and other related works, such as the determination of the location of 5G base stations and types of equipment, and coordinate the operation and maintenance of 5G co-build and co-share network in order to ensure the effective implementation of the Cooperation Agreement. For example, the timing, scale and location of the 5G base station construction, selection of equipment and appointment of maintenance suppliers across all regions are all negotiated and agreed by both parties with unanimous consensus. Under the joint operation, the business and branding of each party continue to operate independently and the subscribers belong to each party respectively. Revenues from each party’s subscribers are recognised by each party, cost and expenses are assumed by each party respectively, while assets constructed by each party and the relevant liabilities are recognised and assumed by each respective party. 15. INVENTORIES 31 December 2020 2019 RMB millions RMB millions Materials and supplies 484 577 Goods for resale 2,833 2,303 3,317 2,880 China Telecom Corporation Limited Annual Report 2020
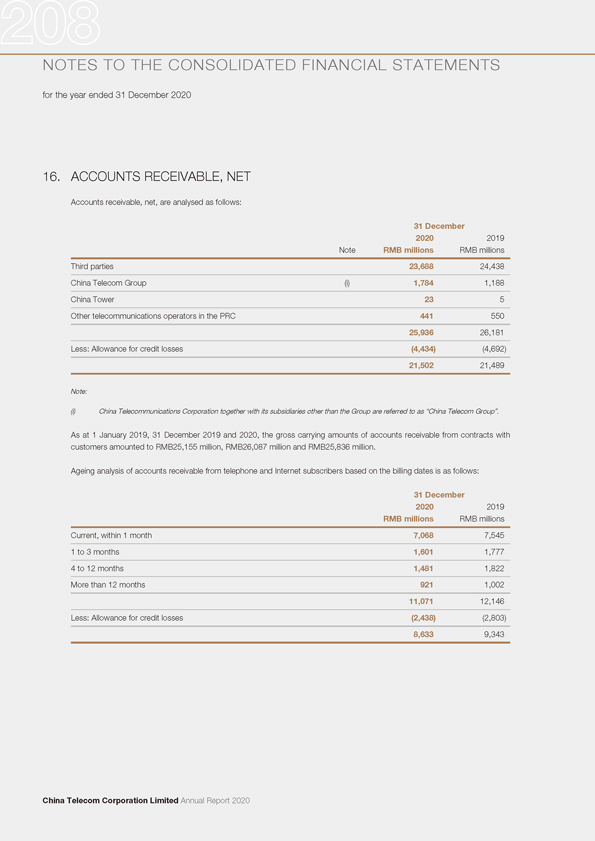
NOTES TO THE CONSOLIDATED FINANCIAL STATEMENTS for the year ended 31 December 2020 16. ACCOUNTS RECEIVABLE, NET Accounts receivable, net, are analysed as follows: 31 December 2020 2019 Note RMB millions RMB millions Third parties 23,688 24,438 China Telecom Group (i) 1,784 1,188 China Tower 23 5 Other telecommunications operators in the PRC 441 550 25,936 26,181 Less: Allowance for credit losses (4,434) (4,692) 21,502 21,489 Note: (i) China Telecommunications Corporation together with its subsidiaries other than the Group are referred to as “China Telecom Group”. As at 1 January 2019, 31 December 2019 and 2020, the gross carrying amounts of accounts receivable from contracts with customers amounted to RMB25,155 million, RMB26,087 million and RMB25,836 million. Ageing analysis of accounts receivable from telephone and Internet subscribers based on the billing dates is as follows: 31 December 2020 2019 RMB millions RMB millions Current, within 1 month 7,068 7,545 1 to 3 months 1,601 1,777 4 to 12 months 1,481 1,822 More than 12 months 921 1,002 11,071 12,146 Less: Allowance for credit losses (2,438) (2,803) 8,633 9,343 China Telecom Corporation Limited Annual Report 2020
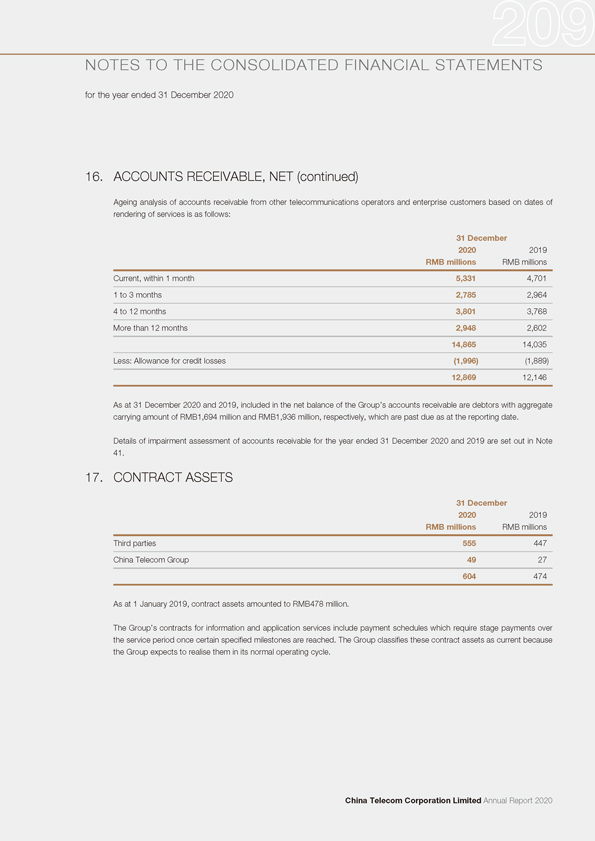
NOTES TO THE CONSOLIDATED FINANCIAL STATEMENTS for the year ended 31 December 2020 16. ACCOUNTS RECEIVABLE, NET (continued) Ageing analysis of accounts receivable from other telecommunications operators and enterprise customers based on dates of rendering of services is as follows: 31 December 2020 2019 RMB millions RMB millions Current, within 1 month 5,331 4,701 1 to 3 months 2,785 2,964 4 to 12 months 3,801 3,768 More than 12 months 2,948 2,602 14,865 14,035 Less: Allowance for credit losses (1,996) (1,889) 12,869 12,146 As at 31 December 2020 and 2019, included in the net balance of the Group’s accounts receivable are debtors with aggregate carrying amount of RMB1,694 million and RMB1,936 million, respectively, which are past due as at the reporting date. Details of impairment assessment of accounts receivable for the year ended 31 December 2020 and 2019 are set out in Note 41. 17. CONTRACT ASSETS 31 December 2020 2019 RMB millions RMB millions Third parties 555 447 China Telecom Group 49 27 604 474 As at 1 January 2019, contract assets amounted to RMB478 million. The Group’s contracts for information and application services include payment schedules which require stage payments over the service period once certain specified milestones are reached. The Group classifies these contract assets as current because the Group expects to realise them in its normal operating cycle. China Telecom Corporation Limited Annual Report 2020
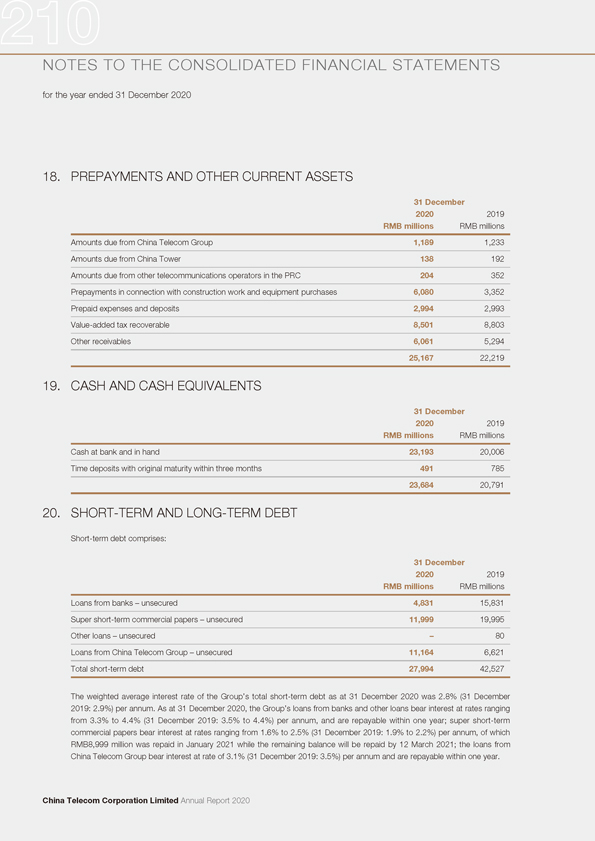
NOTES TO THE CONSOLIDATED FINANCIAL STATEMENTS for the year ended 31 December 2020 18. PREPAYMENTS AND OTHER CURRENT ASSETS 31 December 2020 2019 RMB millions RMB millions Amounts due from China Telecom Group 1,189 1,233 Amounts due from China Tower 138 192 Amounts due from other telecommunications operators in the PRC 204 352 Prepayments in connection with construction work and equipment purchases 6,080 3,352 Prepaid expenses and deposits 2,994 2,993 Value-added tax recoverable 8,501 8,803 Other receivables 6,061 5,294 25,167 22,219 19. CASH AND CASH EQUIVALENTS 31 December 2020 2019 RMB millions RMB millions Cash at bank and in hand 23,193 20,006 Time deposits with original maturity within three months 491 785 23,684 20,791 20. SHORT-TERM AND LONG-TERM DEBT Short-term debt comprises: 31 December 2020 2019 RMB millions RMB millions Loans from banks – unsecured 4,831 15,831 Super short-term commercial papers – unsecured 11,999 19,995 Other loans – unsecured – 80 Loans from China Telecom Group – unsecured 11,164 6,621 Total short-term debt 27,994 42,527 The weighted average interest rate of the Group’s total short-term debt as at 31 December 2020 was 2.8% (31 December 2019: 2.9%) per annum. As at 31 December 2020, the Group’s loans from banks and other loans bear interest at rates ranging from 3.3% to 4.4% (31 December 2019: 3.5% to 4.4%) per annum, and are repayable within one year; super short-term commercial papers bear interest at rates ranging from 1.6% to 2.5% (31 December 2019: 1.9% to 2.2%) per annum, of which RMB8,999 million was repaid in January 2021 while the remaining balance will be repaid by 12 March 2021; the loans from China Telecom Group bear interest at rate of 3.1% (31 December 2019: 3.5%) per annum and are repayable within one year. China Telecom Corporation Limited Annual Report 2020
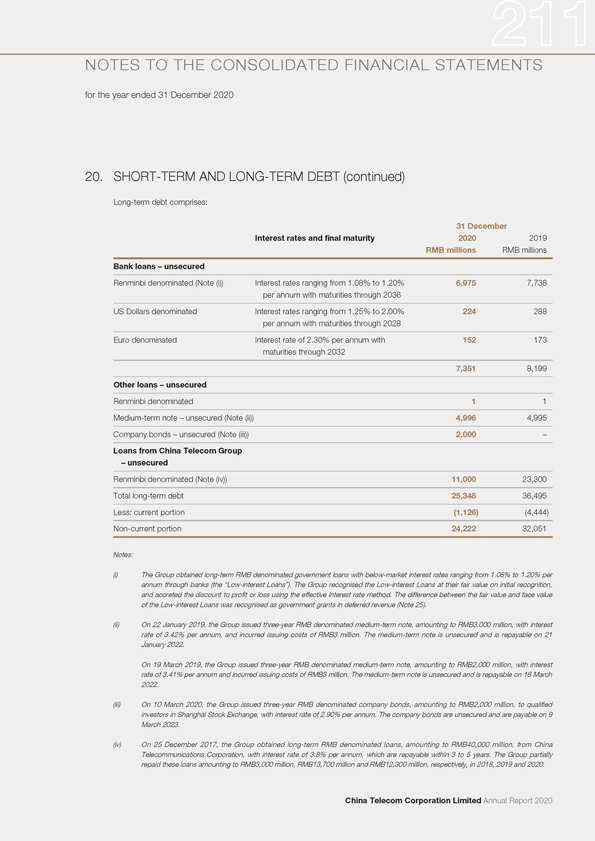
NOTES TO THE CONSOLIDATED FINANCIAL STATEMENTS for the year ended 31 December 2020 20. SHORT-TERM AND LONG-TERM DEBT (continued) Long-term debt comprises: 31 December Interest rates and final maturity 2020 2019 RMB millions RMB millions Bank loans – unsecured Renminbi denominated (Note (i)) Interest rates ranging from 1.08% to 1.20% 6,975 7,738 per annum with maturities through 2036 US Dollars denominated Interest rates ranging from 1.25% to 2.00% 224 288 per annum with maturities through 2028 Euro denominated Interest rate of 2.30% per annum with 152 173 maturities through 2032 7,351 8,199 Other loans – unsecured Renminbi denominated 1 1 Medium-term note – unsecured (Note (ii)) 4,996 4,995 Company bonds – unsecured (Note (iii)) 2,000 –Loans from China Telecom Group – unsecured Renminbi denominated (Note (iv)) 11,000 23,300 Total long-term debt 25,348 36,495 Less: current portion (1,126) (4,444) Non-current portion 24,222 32,051 Notes: (i) The Group obtained long-term RMB denominated government loans with below-market interest rates ranging from 1.08% to 1.20% per annum through banks (the “Low-interest Loans”). The Group recognised the Low-interest Loans at their fair value on initial recognition, and accreted the discount to profit or loss using the effective interest rate method. The difference between the fair value and face value of the Low-interest Loans was recognised as government grants in deferred revenue (Note 25). (ii) On 22 January 2019, the Group issued three-year RMB denominated medium-term note, amounting to RMB3,000 million, with interest rate of 3.42% per annum, and incurred issuing costs of RMB3 million. The medium-term note is unsecured and is repayable on 21 January 2022. On 19 March 2019, the Group issued three-year RMB denominated medium-term note, amounting to RMB2,000 million, with interest rate of 3.41% per annum and incurred issuing costs of RMB3 million. The medium-term note is unsecured and is repayable on 18 March 2022. (iii) On 10 March 2020, the Group issued three-year RMB denominated company bonds, amounting to RMB2,000 million, to qualified investors in Shanghai Stock Exchange, with interest rate of 2.90% per annum. The company bonds are unsecured and are payable on 9 March 2023. (iv) On 25 December 2017, the Group obtained long-term RMB denominated loans, amounting to RMB40,000 million, from China Telecommunications Corporation, with interest rate of 3.8% per annum, which are repayable within 3 to 5 years. The Group partially repaid these loans amounting to RMB3,000 million, RMB13,700 million and RMB12,300 million, respectively, in 2018, 2019 and 2020. China Telecom Corporation Limited Annual Report 2020
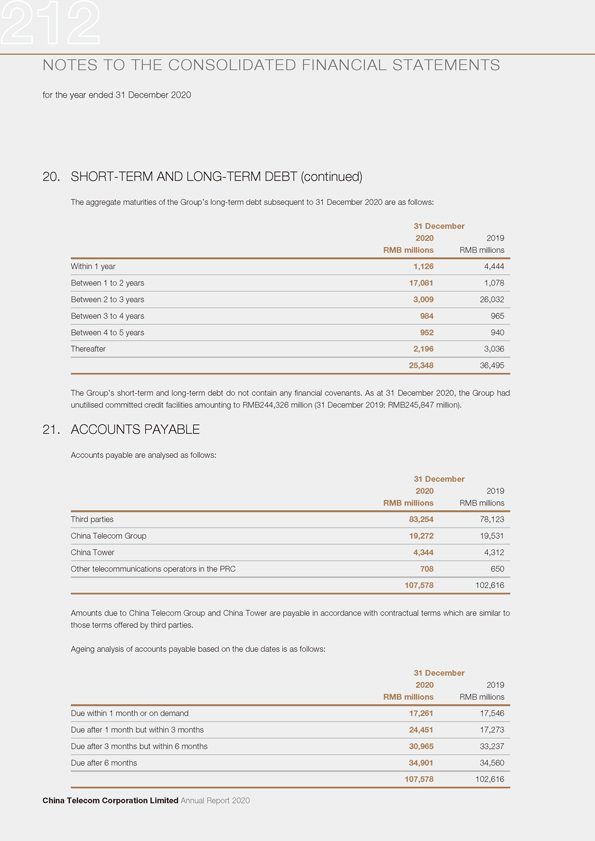
NOTES TO THE CONSOLIDATED FINANCIAL STATEMENTS for the year ended 31 December 2020 20. SHORT-TERM AND LONG-TERM DEBT (continued) The aggregate maturities of the Group’s long-term debt subsequent to 31 December 2020 are as follows: 31 December 2020 2019 RMB millions RMB millions Within 1 year 1,126 4,444 Between 1 to 2 years 17,081 1,078 Between 2 to 3 years 3,009 26,032 Between 3 to 4 years 984 965 Between 4 to 5 years 952 940 Thereafter 2,196 3,036 25,348 36,495 The Group’s short-term and long-term debt do not contain any financial covenants. As at 31 December 2020, the Group had unutilised committed credit facilities amounting to RMB244,326 million (31 December 2019: RMB245,847 million). 21. ACCOUNTS PAYABLE Accounts payable are analysed as follows: 31 December 2020 2019 RMB millions RMB millions Third parties 83,254 78,123 China Telecom Group 19,272 19,531 China Tower 4,344 4,312 Other telecommunications operators in the PRC 708 650 107,578 102,616 Amounts due to China Telecom Group and China Tower are payable in accordance with contractual terms which are similar to those terms offered by third parties. Ageing analysis of accounts payable based on the due dates is as follows: 31 December 2020 2019 RMB millions RMB millions Due within 1 month or on demand 17,261 17,546 Due after 1 month but within 3 months 24,451 17,273 Due after 3 months but within 6 months 30,965 33,237 Due after 6 months 34,901 34,560 107,578 102,616 China Telecom Corporation Limited Annual Report 2020
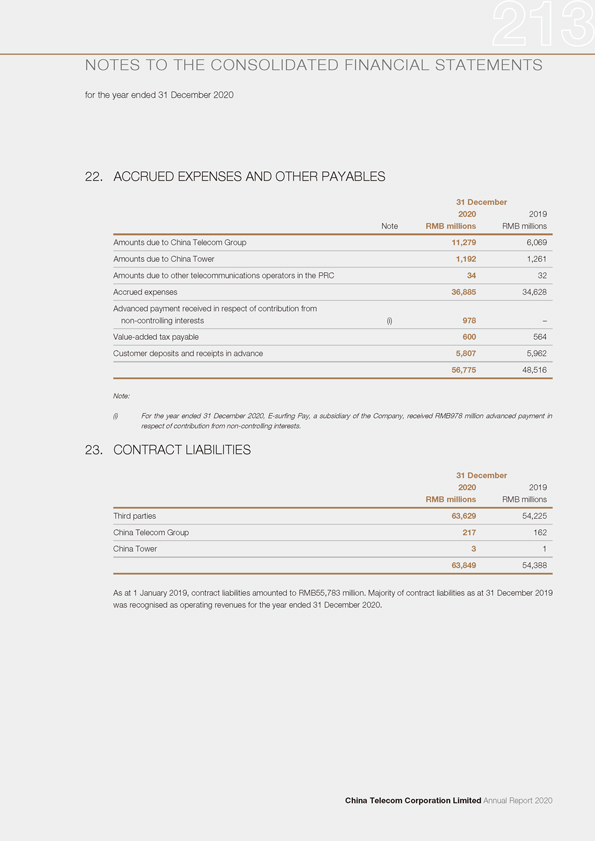
NOTES TO THE CONSOLIDATED FINANCIAL STATEMENTS for the year ended 31 December 2020 22. ACCRUED EXPENSES AND OTHER PAYABLES 31 December 2020 2019 Note RMB millions RMB millions Amounts due to China Telecom Group 11,279 6,069 Amounts due to China Tower 1,192 1,261 Amounts due to other telecommunications operators in the PRC 34 32 Accrued expenses 36,885 34,628 Advanced payment received in respect of contribution from non-controlling interests (i) 978 –Value-added tax payable 600 564 Customer deposits and receipts in advance 5,807 5,962 56,775 48,516 Note: (i) For the year ended 31 December 2020, E-surfing Pay, a subsidiary of the Company, received RMB978 million advanced payment in respect of contribution from non-controlling interests. 23. CONTRACT LIABILITIES 31 December 2020 2019 RMB millions RMB millions Third parties 63,629 54,225 China Telecom Group 217 162 China Tower 3 1 63,849 54,388 As at 1 January 2019, contract liabilities amounted to RMB55,783 million. Majority of contract liabilities as at 31 December 2019 was recognised as operating revenues for the year ended 31 December 2020. China Telecom Corporation Limited Annual Report 2020

NOTES TO THE CONSOLIDATED FINANCIAL STATEMENTS for the year ended 31 December 2020 24. LEASE LIABILITIES 31 December 2020 2019 RMB millions RMB millions Within one year 13,192 11,569 Within a period of more than one year but not more than two years 12,585 10,887 Within a period of more than two year but not more than five years 11,138 16,255 Within a period of more than five years 3,732 3,435 40,647 42,146 Less: Current portion (13,192) (11,569) Non-current portion 27,455 30,577 25. DEFERRED REVENUES Deferred revenues as at 31 December 2020 and 2019 mainly represent the unearned portion of installation fees for wireline services received from customers (Note 13), and the unamortised portion of government grants (Note 20). 2020 2019 RMB millions RMB millions Balance at beginning of the year 1,455 1,829 Reductions for the year: Amortisation of installation fees (55) (90) Amortisation of government grants (261) (284) Balance at end of year 1,139 1,455 Representing: Current portion 278 358 Non-current portion 861 1,097 1,139 1,455 26. SHARE CAPITAL 31 December 2020 2019 RMB millions RMB millions Registered, issued and fully paid 67,054,958,321 ordinary domestic shares of RMB1.00 each 67,055 67,055 13,877,410,000 overseas listed H shares of RMB1.00 each 13,877 13,877 80,932 80,932 All ordinary domestic shares and H shares rank pari passu in all material respects. China Telecom Corporation Limited Annual Report 2020
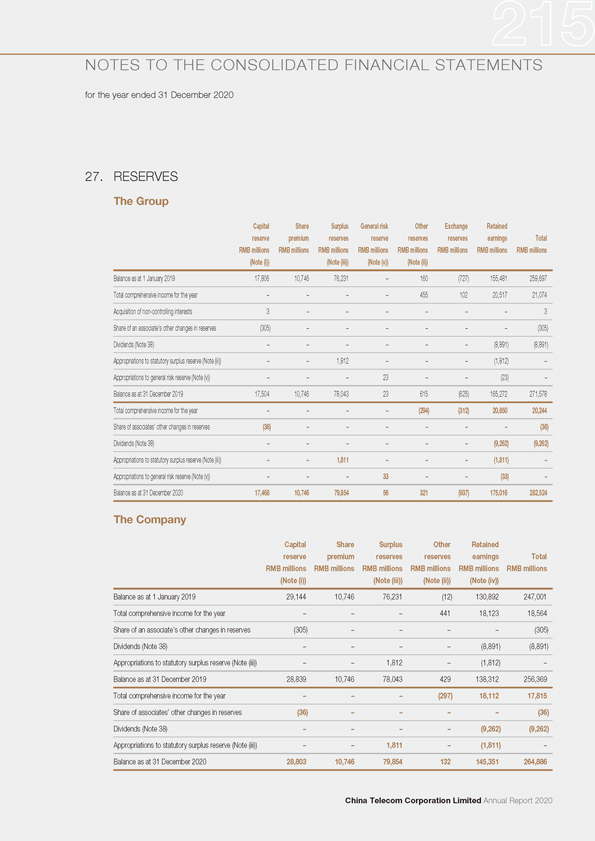
NOTES TO THE CONSOLIDATED FINANCIAL STATEMENTS for the year ended 31 December 2020 27. RESERVES The Group Capital Share Surplus General risk Other Exchange Retained reserve premium reserves reserve reserves reserves earnings Total RMB millions RMB millions RMB millions RMB millions RMB millions RMB millions RMB millions RMB millions (Note (i)) (Note (iii)) (Note (v)) (Note (ii)) Balance as at 1 January 2019 17,806 10,746 76,231 – 160 (727) 155,481 259,697 Total comprehensive income for the year – – – – 455 102 20,517 21,074 Acquisition of non-controlling interests 3 – – – – – – 3 Share of an associate’s other changes in reserves (305) – – – – – – (305) Dividends (Note 38) – – – – – – (8,891) (8,891) Appropriations to statutory surplus reserve (Note (iii)) – – 1,812 – – – (1,812) –Appropriations to general risk reserve (Note (v)) – – – 23 – – (23) –Balance as at 31 December 2019 17,504 10,746 78,043 23 615 (625) 165,272 271,578 Total comprehensive income for the year – – – – (294) (312) 20,850 20,244 Share of associates’ other changes in reserves (36) – – – – – – (36) Dividends (Note 38) – – – – – – (9,262) (9,262) Appropriations to statutory surplus reserve (Note (iii)) – – 1,811 – – – (1,811) –Appropriations to general risk reserve (Note (v)) – – – 33 – – (33) – Balance as at 31 December 2020 17,468 10,746 79,854 56 321 (937) 175,016 282,524 The Company Capital Share Surplus Other Retained reserve premium reserves reserves earnings Total RMB millions RMB millions RMB millions RMB millions RMB millions RMB millions (Note (i)) (Note (iii)) (Note (ii)) (Note (iv)) Balance as at 1 January 2019 29,144 10,746 76,231 (12) 130,892 247,001 Total comprehensive income for the year – – – 441 18,123 18,564 Share of an associate’s other changes in reserves (305) – – – – (305) Dividends (Note 38) – – – – (8,891) (8,891) Appropriations to statutory surplus reserve (Note (iii)) – – 1,812 – (1,812) –Balance as at 31 December 2019 28,839 10,746 78,043 429 138,312 256,369 Total comprehensive income for the year – – – (297) 18,112 17,815 Share of associates’ other changes in reserves (36) – – – – (36) Dividends (Note 38) – – – – (9,262) (9,262) Appropriations to statutory surplus reserve (Note (iii)) – – 1,811 – (1,811) – Balance as at 31 December 2020 28,803 10,746 79,854 132 145,351 264,886 China Telecom Corporation Limited Annual Report 2020
NOTES TO THE CONSOLIDATED FINANCIAL STATEMENTS for the year ended 31 December 2020 27. RESERVES (continued) Notes: (i) Capital reserve of the Group mainly represents the sum of (a) the difference between the carrying amount of the Company’s net assets and the par value of the Company’s shares issued upon its formation; (b) the difference between the consideration paid by the Group for the entities acquired, other than the Fifth Acquired Group, from China Telecommunications Corporation, which were accounted for as equity transactions as disclosed in Note 1, and the historical carrying amount of the net assets of these acquired entities; and (c) the difference between the consideration paid by the Group for the acquisition of non-controlling interests and the carrying amount of the non-controlling interests acquired. The difference between the consideration paid by the Group and the historical carrying amount of the net assets of the Fifth Acquisition was recorded as a deduction of retained earnings. Capital reserve of the Company represents the difference between the carrying amount of the Company’s net assets and the par value of the Company’s shares issued upon its formation. (ii) Other reserves of the Group and the Company represent primarily the change in the fair value of investment in equity instruments at FVTOCI and the deferred tax liabilities recognised due to the change in fair value of those investment in equity instruments. (iii) The surplus reserves consist of statutory surplus reserve and discretionary surplus reserve. According to the Company’s Articles of Association, the Company is required to transfer 10% of its net profit, as determined in accordance with the lower of the amount determined under the PRC Accounting Standards for Business Enterprises and the amount determined under IFRSs, to the statutory surplus reserve until such reserve balance reaches 50% of the registered capital. The transfer to this reserve must be made before distribution of any dividend to shareholders. For the years ended 31 December 2020 and 2019, the net profit of the Company determined in accordance with the PRC Accounting Standards for Business Enterprises and IFRSs are the same. For the year ended 31 December 2020, the Company transferred RMB1,811 million (2019: RMB1,812 million), being 10% of the year’s net profit, to this reserve. As at 31 December 2020, the amount of statutory surplus reserve was RMB33,775 million (31 December 2019: RMB31,964 million). The Company did not transfer any discretionary surplus reserve for the years ended 31 December 2020 and 2019. As at 31 December 2020 and 2019, the amount of discretionary surplus reserve was RMB46,079 million. The statutory and discretionary surplus reserves are non-distributable other than in liquidation and can be used to make good of previous years’ losses, if any, and may be utilised for business expansion or converted into share capital by issuing new shares to existing shareholders in proportion to their shareholdings or by increasing the par value of the shares currently held by them, provided that the remaining statutory surplus reserve balance after such issue is not less than 25% of the registered capital. (iv) According to the Company’s Articles of Association, the amount of retained earnings available for distribution to shareholders of the Company is the lower of the amount of the Company’s retained earnings determined in accordance with the PRC Accounting Standards for Business Enterprises and the amount determined in accordance with IFRSs. As at 31 December 2020, the amount of retained earnings available for distribution was RMB145,351 million (31 December 2019: RMB138,312 million), being the amount determined in accordance with IFRSs. Final dividend of approximately RMB8,403 million in respect of the financial year 2020 proposed after the end of the reporting period has not been recognised as a liability in the consolidated financial statements at the end of the reporting period (Note 38). (v) Pursuant to “Requirements on Impairment Allowance for Financial Institutions” (Caijin [2012] No. 20) issued by the Ministry of Finance of the PRC effective on 1 July 2012 (the “Requirements”), the Group’s subsidiaries, mainly Finance Company, establish a general risk reserve within equity, through appropriation of retained earnings, to address unidentified potential losses relating to risk assets. The general risk reserve balance should not be less than 1.5% of the ending balance of risk assets, as defined in the Requirements. China Telecom Corporation Limited Annual Report 2020
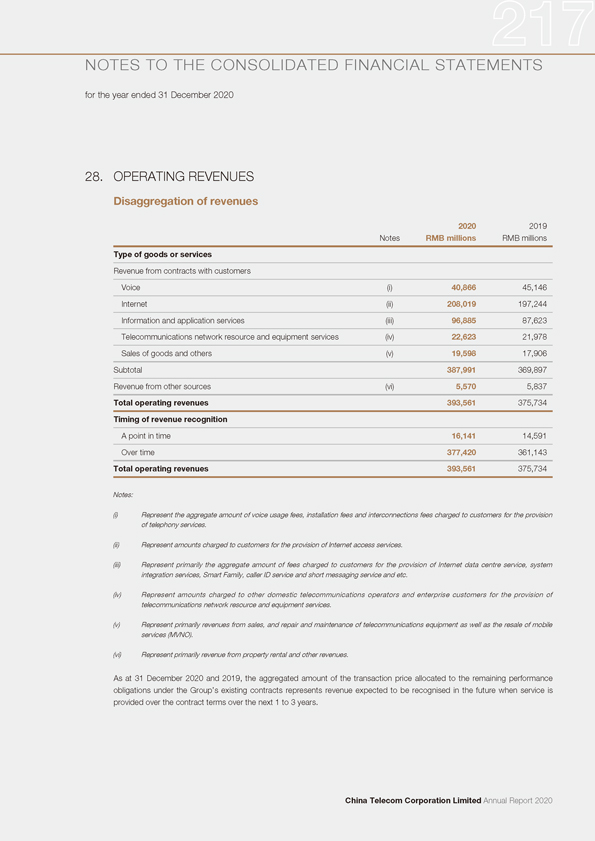
NOTES TO THE CONSOLIDATED FINANCIAL STATEMENTS for the year ended 31 December 2020 28. OPERATING REVENUES Disaggregation of revenues 2020 2019 Notes RMB millions RMB millions Type of goods or services Revenue from contracts with customers Voice (i) 40,866 45,146 Internet (ii) 208,019 197,244 Information and application services (iii) 96,885 87,623 Telecommunications network resource and equipment services (iv) 22,623 21,978 Sales of goods and others (v) 19,598 17,906 Subtotal 387,991 369,897 Revenue from other sources (vi) 5,570 5,837 Total operating revenues 393,561 375,734 Timing of revenue recognition A point in time 16,141 14,591 Over time 377,420 361,143 Total operating revenues 393,561 375,734 Notes: (i) Represent the aggregate amount of voice usage fees, installation fees and interconnections fees charged to customers for the provision of telephony services. (ii) Represent amounts charged to customers for the provision of Internet access services. (iii) Represent primarily the aggregate amount of fees charged to customers for the provision of Internet data centre service, system integration services, Smart Family, caller ID service and short messaging service and etc. (iv) Represent amounts charged to other domestic telecommunications operators and enterprise customers for the provision of telecommunications network resource and equipment services. (v) Represent primarily revenues from sales, and repair and maintenance of telecommunications equipment as well as the resale of mobile services (MVNO). (vi) Represent primarily revenue from property rental and other revenues. As at 31 December 2020 and 2019, the aggregated amount of the transaction price allocated to the remaining performance obligations under the Group’s existing contracts represents revenue expected to be recognised in the future when service is provided over the contract terms over the next 1 to 3 years. China Telecom Corporation Limited Annual Report 2020
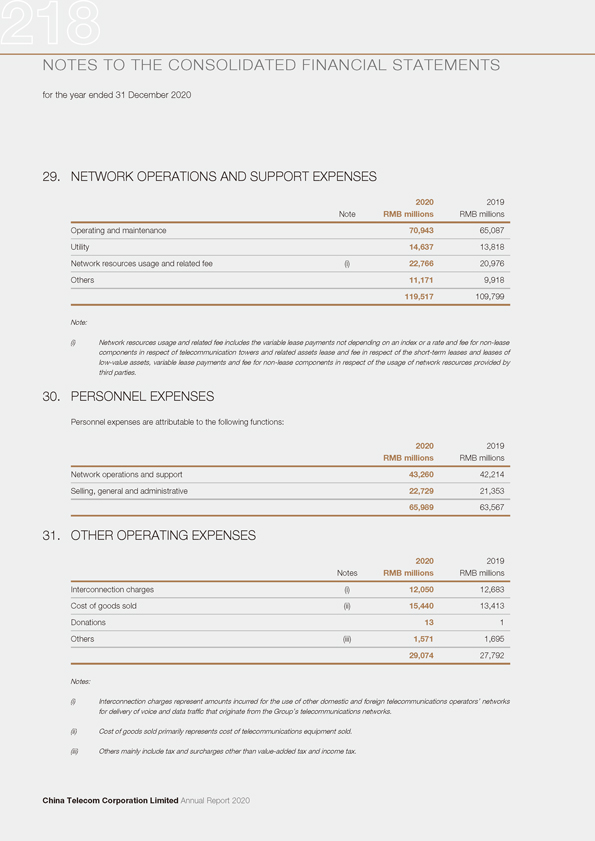
NOTES TO THE CONSOLIDATED FINANCIAL STATEMENTS for the year ended 31 December 2020 29. NETWORK OPERATIONS AND SUPPORT EXPENSES 2020 2019 Note RMB millions RMB millions Operating and maintenance 70,943 65,087 Utility 14,637 13,818 Network resources usage and related fee (i) 22,766 20,976 Others 11,171 9,918 119,517 109,799 Note: (i) Network resources usage and related fee includes the variable lease payments not depending on an index or a rate and fee for non-lease components in respect of telecommunication towers and related assets lease and fee in respect of the short-term leases and leases of low-value assets, variable lease payments and fee for non-lease components in respect of the usage of network resources provided by third parties. 30. PERSONNEL EXPENSES Personnel expenses are attributable to the following functions: 2020 2019 RMB millions RMB millions Network operations and support 43,260 42,214 Selling, general and administrative 22,729 21,353 65,989 63,567 31. OTHER OPERATING EXPENSES 2020 2019 Notes RMB millions RMB millions Interconnection charges (i) 12,050 12,683 Cost of goods sold (ii) 15,440 13,413 Donations 13 1 Others (iii) 1,571 1,695 29,074 27,792 Notes: (i) Interconnection charges represent amounts incurred for the use of other domestic and foreign telecommunications operators’ networks for delivery of voice and data traffic that originate from the Group’s telecommunications networks. (ii) Cost of goods sold primarily represents cost of telecommunications equipment sold. (iii) Others mainly include tax and surcharges other than value-added tax and income tax. China Telecom Corporation Limited Annual Report 2020
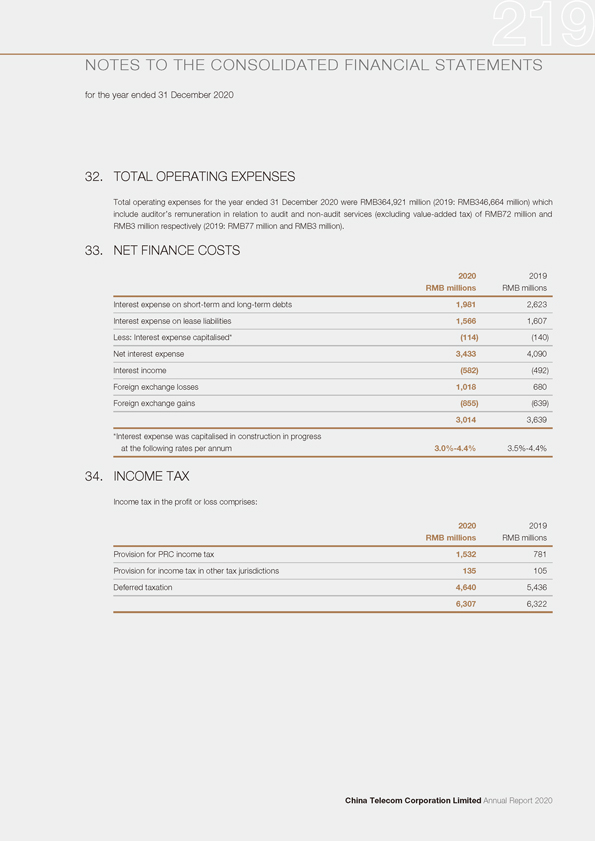
NOTES TO THE CONSOLIDATED FINANCIAL STATEMENTS for the year ended 31 December 2020 32. TOTAL OPERATING EXPENSES Total operating expenses for the year ended 31 December 2020 were RMB364,921 million (2019: RMB346,664 million) which include auditor’s remuneration in relation to audit and non-audit services (excluding value-added tax) of RMB72 million and RMB3 million respectively (2019: RMB77 million and RMB3 million). 33. NET FINANCE COSTS 2020 2019 RMB millions RMB millions Interest expense on short-term and long-term debts 1,981 2,623 Interest expense on lease liabilities 1,566 1,607 Less: Interest expense capitalised* (114) (140) Net interest expense 3,433 4,090 Interest income (582) (492) Foreign exchange losses 1,018 680 Foreign exchange gains (855) (639) 3,014 3,639 *Interest expense was capitalised in construction in progress at the following rates per annum 3.0% -4.4% 3.5% -4.4% 34. INCOME TAX Income tax in the profit or loss comprises: 2020 2019 RMB millions RMB millions Provision for PRC income tax 1,532 781 Provision for income tax in other tax jurisdictions 135 105 Deferred taxation 4,640 5,436 6,307 6,322 China Telecom Corporation Limited Annual Report 2020
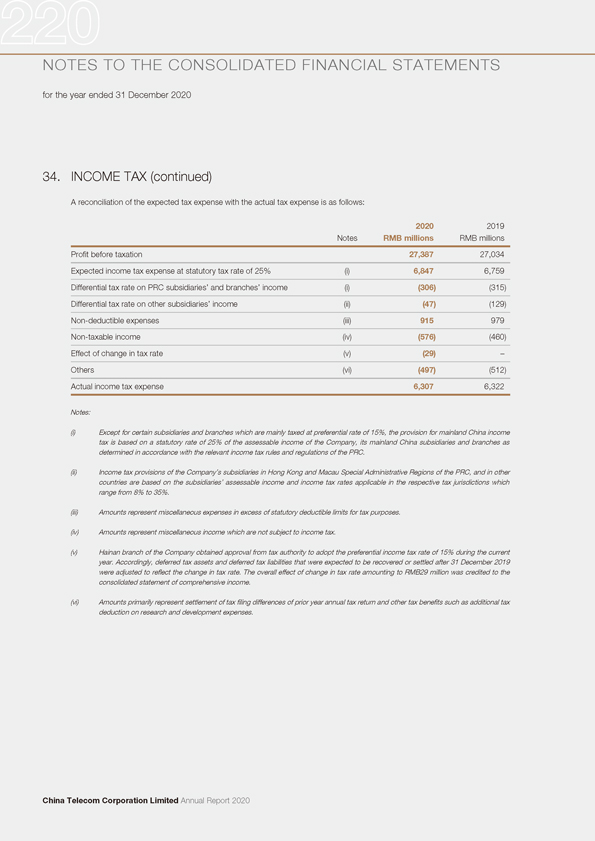
NOTES TO THE CONSOLIDATED FINANCIAL STATEMENTS for the year ended 31 December 2020 34. INCOME TAX (continued) A reconciliation of the expected tax expense with the actual tax expense is as follows: 2020 2019 Notes RMB millions RMB millions Profit before taxation 27,387 27,034 Expected income tax expense at statutory tax rate of 25% (i) 6,847 6,759 Differential tax rate on PRC subsidiaries’ and branches’ income (i) (306) (315) Differential tax rate on other subsidiaries’ income (ii) (47) (129) Non-deductible expenses (iii) 915 979 Non-taxable income (iv) (576) (460) Effect of change in tax rate (v) (29) –Others (vi) (497) (512) Actual income tax expense 6,307 6,322 Notes: (i) Except for certain subsidiaries and branches which are mainly taxed at preferential rate of 15%, the provision for mainland China income tax is based on a statutory rate of 25% of the assessable income of the Company, its mainland China subsidiaries and branches as determined in accordance with the relevant income tax rules and regulations of the PRC. (ii) Income tax provisions of the Company’s subsidiaries in Hong Kong and Macau Special Administrative Regions of the PRC, and in other countries are based on the subsidiaries’ assessable income and income tax rates applicable in the respective tax jurisdictions which range from 8% to 35%. (iii) Amounts represent miscellaneous expenses in excess of statutory deductible limits for tax purposes. (iv) Amounts represent miscellaneous income which are not subject to income tax. (v) Hainan branch of the Company obtained approval from tax authority to adopt the preferential income tax rate of 15% during the current year. Accordingly, deferred tax assets and deferred tax liabilities that were expected to be recovered or settled after 31 December 2019 were adjusted to reflect the change in tax rate. The overall effect of change in tax rate amounting to RMB29 million was credited to the consolidated statement of comprehensive income. (vi) Amounts primarily represent settlement of tax filing differences of prior year annual tax return and other tax benefits such as additional tax deduction on research and development expenses. China Telecom Corporation Limited Annual Report 2020
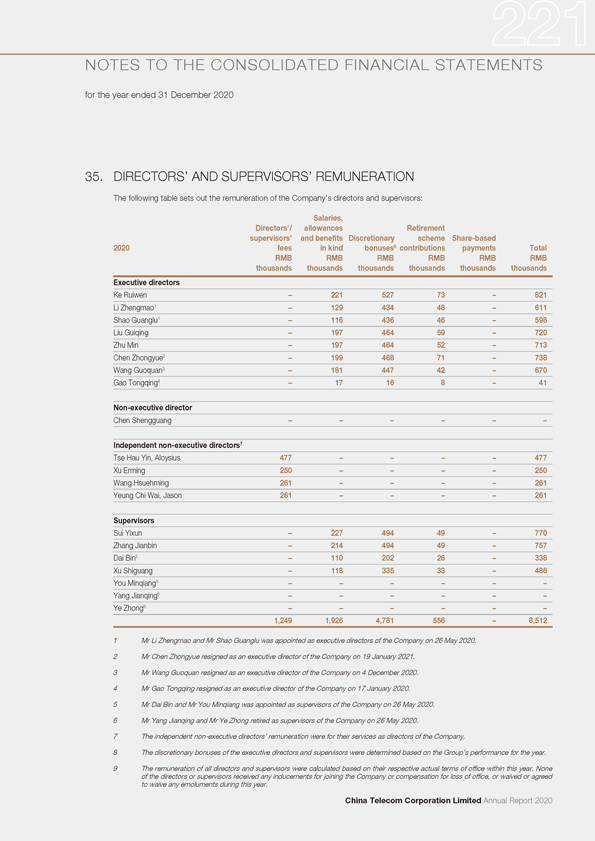
NOTES TO THE CONSOLIDATED FINANCIAL STATEMENTS for the year ended 31 December 2020 35. DIRECTORS’ AND SUPERVISORS’ REMUNERATION The following table sets out the remuneration of the Company’s directors and supervisors: Salaries, Directors’/ allowances Retirement supervisors’ and benefits Discretionary scheme Share-based 2020 fees in kind bonuses8 contributions payments Total RMB RMB RMB RMB RMB RMB thousands thousands thousands thousands thousands thousands Executive directors Ke Ruiwen – 221 527 73 – 821 Li Zhengmao1 – 129 434 48 – 611 Shao Guanglu1 – 116 436 46 – 598 Liu Guiqing – 197 464 59 – 720 Zhu Min – 197 464 52 – 713 Chen Zhongyue2 – 199 468 71 – 738 Wang Guoquan3 – 181 447 42 – 670 Gao Tongqing4 – 17 16 8 – 41 Non-executive director Chen Shengguang – – – – – – Independent non-executive directors7 Tse Hau Yin, Aloysius 477 – – – – 477 Xu Erming 250 – – – – 250 Wang Hsuehming 261 – – – – 261 Yeung Chi Wai, Jason 261 – – – – 261 Supervisors Sui Yixun – 227 494 49 – 770 Zhang Jianbin – 214 494 49 – 757 Dai Bin5 – 110 202 26 – 338 Xu Shiguang – 118 335 33 – 486 You Minqiang5 – – – – – –Yang Jianqing6 – – – – – –Ye Zhong6 – – – – – –1,249 1,926 4,781 556 – 8,512 1 Mr Li Zhengmao and Mr Shao Guanglu was appointed as executive directors of the Company on 26 May 2020. 2 Mr Chen Zhongyue resigned as an executive director of the Company on 19 January 2021. 3 Mr Wang Guoquan resigned as an executive director of the Company on 4 December 2020. 4 Mr Gao Tongqing resigned as an executive director of the Company on 17 January 2020. 5 Mr Dai Bin and Mr You Minqiang was appointed as supervisors of the Company on 26 May 2020. 6 Mr Yang Jianqing and Mr Ye Zhong retired as supervisors of the Company on 26 May 2020. 7 The independent non-executive directors’ remuneration were for their services as directors of the Company. 8 The discretionary bonuses of the executive directors and supervisors were determined based on the Group’s performance for the year. 9 The remuneration of all directors and supervisors were calculated based on their respective actual terms of office within this year. None of the directors or supervisors received any inducements for joining the Company or compensation for loss of office, or waived or agreed to waive any emoluments during this year. China Telecom Corporation Limited Annual Report 2020
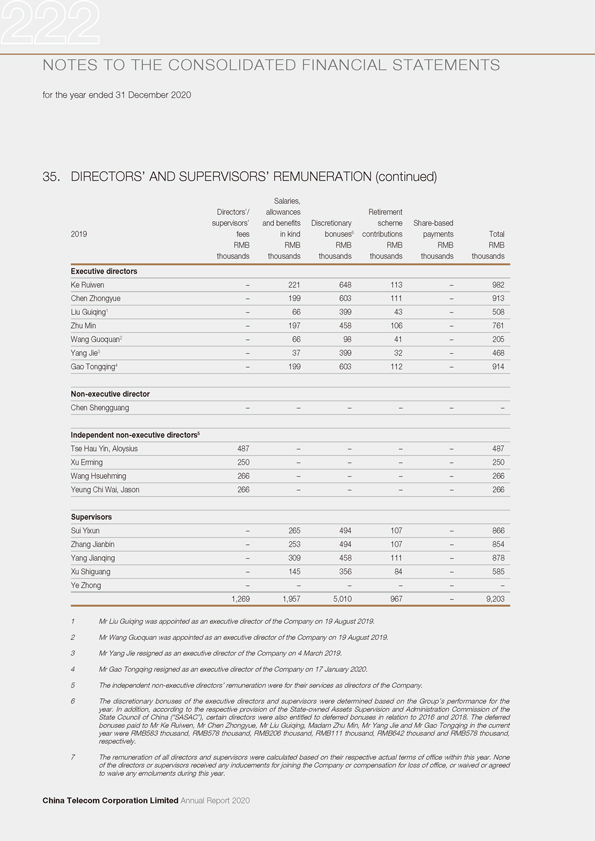
NOTES TO THE CONSOLIDATED FINANCIAL STATEMENTS for the year ended 31 December 2020 35. DIRECTORS’ AND SUPERVISORS’ REMUNERATION (continued) Salaries, Directors’/ allowances Retirement supervisors’ and benefits Discretionary scheme Share-based 2019 fees in kind bonuses6 contributions payments Total RMB RMB RMB RMB RMB RMB thousands thousands thousands thousands thousands thousands Executive directors Ke Ruiwen – 221 648 113 – 982 Chen Zhongyue – 199 603 111 – 913 Liu Guiqing1 – 66 399 43 – 508 Zhu Min – 197 458 106 – 761 Wang Guoquan2 – 66 98 41 – 205 Yang Jie3 – 37 399 32 – 468 Gao Tongqing4 – 199 603 112 – 914 Non-executive director Chen Shengguang – – – – – – Independent non-executive directors5 Tse Hau Yin, Aloysius 487 – – – – 487 Xu Erming 250 – – – – 250 Wang Hsuehming 266 – – – – 266 Yeung Chi Wai, Jason 266 – – – – 266 Supervisors Sui Yixun – 265 494 107 – 866 Zhang Jianbin – 253 494 107 – 854 Yang Jianqing – 309 458 111 – 878 Xu Shiguang – 145 356 84 – 585 Ye Zhong – – – – – –1,269 1,957 5,010 967 – 9,203 1 Mr Liu Guiqing was appointed as an executive director of the Company on 19 August 2019. 2 Mr Wang Guoquan was appointed as an executive director of the Company on 19 August 2019. 3 Mr Yang Jie resigned as an executive director of the Company on 4 March 2019. 4 Mr Gao Tongqing resigned as an executive director of the Company on 17 January 2020. 5 The independent non-executive directors’ remuneration were for their services as directors of the Company. 6 The discretionary bonuses of the executive directors and supervisors were determined based on the Group’s performance for the year. In addition, according to the respective provision of the State-owned Assets Supervision and Administration Commission of the State Council of China (“SASAC”), certain directors were also entitled to deferred bonuses in relation to 2016 and 2018. The deferred bonuses paid to Mr Ke Ruiwen, Mr Chen Zhongyue, Mr Liu Guiqing, Madam Zhu Min, Mr Yang Jie and Mr Gao Tongqing in the current year were RMB583 thousand, RMB578 thousand, RMB206 thousand, RMB111 thousand, RMB642 thousand and RMB578 thousand, respectively. 7 The remuneration of all directors and supervisors were calculated based on their respective actual terms of office within this year. None of the directors or supervisors received any inducements for joining the Company or compensation for loss of office, or waived or agreed to waive any emoluments during this year. China Telecom Corporation Limited Annual Report 2020
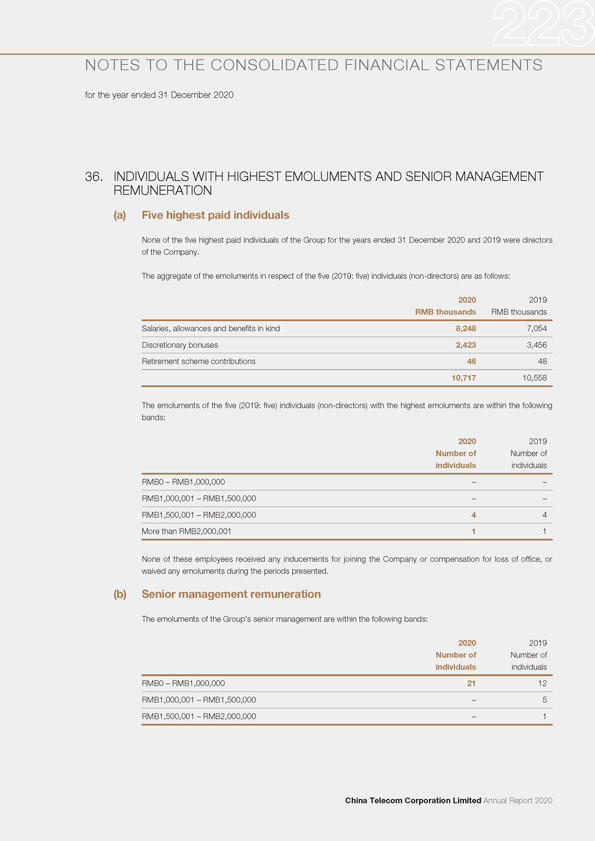
NOTES TO THE CONSOLIDATED FINANCIAL STATEMENTS for the year ended 31 December 2020 36. INDIVIDUALS WITH HIGHEST EMOLUMENTS AND SENIOR MANAGEMENT REMUNERATION (a) Five highest paid individuals None of the five highest paid individuals of the Group for the years ended 31 December 2020 and 2019 were directors of the Company. The aggregate of the emoluments in respect of the five (2019: five) individuals (non-directors) are as follows: 2020 2019 RMB thousands RMB thousands Salaries, allowances and benefits in kind 8,248 7,054 Discretionary bonuses 2,423 3,456 Retirement scheme contributions 46 48 10,717 10,558 The emoluments of the five (2019: five) individuals (non-directors) with the highest emoluments are within the following bands: 2020 2019 Number of Number of individuals individuals RMB0 – RMB1,000,000 – –RMB1,000,001 – RMB1,500,000 – –RMB1,500,001 – RMB2,000,000 4 4 More than RMB2,000,001 1 1 None of these employees received any inducements for joining the Company or compensation for loss of office, or waived any emoluments during the periods presented. (b) Senior management remuneration The emoluments of the Group’s senior management are within the following bands: 2020 2019 Number of Number of individuals individuals RMB0 – RMB1,000,000 21 12 RMB1,000,001 – RMB1,500,000 – 5 RMB1,500,001 – RMB2,000,000 – 1 China Telecom Corporation Limited Annual Report 2020

NOTES TO THE CONSOLIDATED FINANCIAL STATEMENTS for the year ended 31 December 2020 37. PROFIT ATTRIBUTABLE TO EQUITY HOLDERS OF THE COMPANY For the year ended 31 December 2020, the consolidated profit attributable to equity holders of the Company includes a profit of RMB18,112 million which has been dealt with in the stand-alone financial statements of the Company. For the year ended 31 December 2019, the consolidated profit attributable to equity holders of the Company includes a profit of RMB18,123 million which has been dealt with in the stand-alone financial statements of the Company. 38. DIVIDENDS Pursuant to a resolution passed at the Board of Directors’ meeting on 9 March 2021, a final dividend of equivalent to HK$0.125 per share totaling approximately RMB8,403 million for the year ended 31 December 2020 was proposed for shareholders’ approval at the Annual General Meeting. The dividend has not been provided for in the consolidated financial statements for the year ended 31 December 2020. Pursuant to the shareholders’ approval at the Annual General Meeting held on 26 May 2020, a final dividend of RMB0.114441 (equivalent to HK$0.125) per share totaling RMB9,262 million in respect of the year ended 31 December 2019 was declared, and paid on 31 July 2020. Pursuant to the shareholders’ approval at the Annual General Meeting held on 29 May 2019, a final dividend of RMB0.109851 (equivalent to HK$0.125) per share totaling RMB8,891 million in respect of the year ended 31 December 2018 was declared, and paid on 26 July 2019. 39. BASIC EARNINGS PER SHARE The calculation of basic earnings per share for the years ended 31 December 2020 and 2019 is based on the profit attributable to equity holders of the Company of RMB20,850 million and RMB20,517 million respectively, divided by 80,932,368,321 shares. Diluted earnings per share were equivalent to basic earnings per share, as there were no potential ordinary shares in existence for the periods presented. China Telecom Corporation Limited Annual Report 2020
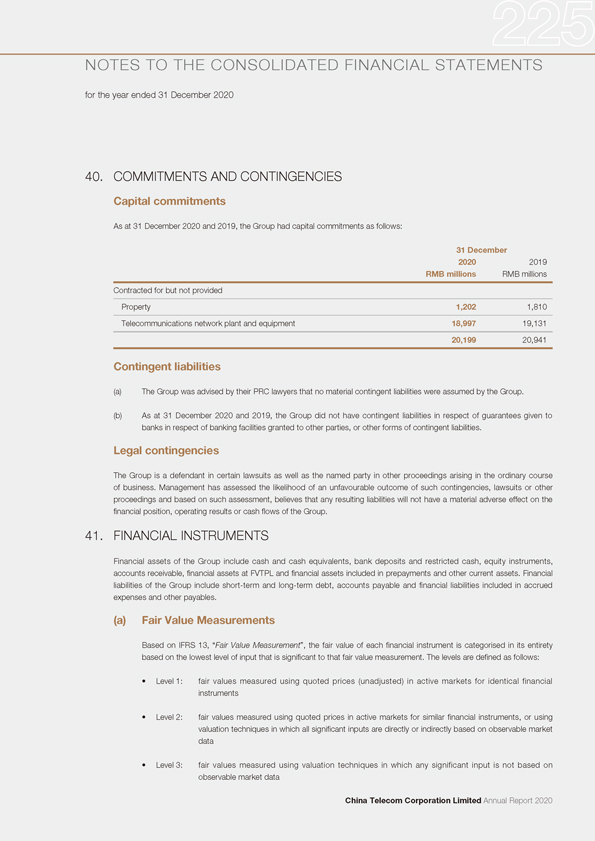
NOTES TO THE CONSOLIDATED FINANCIAL STATEMENTS for the year ended 31 December 2020 40. COMMITMENTS AND CONTINGENCIES Capital commitments As at 31 December 2020 and 2019, the Group had capital commitments as follows: 31 December 2020 2019 RMB millions RMB millions Contracted for but not provided Property 1,202 1,810 Telecommunications network plant and equipment 18,997 19,131 20,199 20,941 Contingent liabilities (a) The Group was advised by their PRC lawyers that no material contingent liabilities were assumed by the Group. (b) As at 31 December 2020 and 2019, the Group did not have contingent liabilities in respect of guarantees given to banks in respect of banking facilities granted to other parties, or other forms of contingent liabilities. Legal contingencies The Group is a defendant in certain lawsuits as well as the named party in other proceedings arising in the ordinary course of business. Management has assessed the likelihood of an unfavourable outcome of such contingencies, lawsuits or other proceedings and based on such assessment, believes that any resulting liabilities will not have a material adverse effect on the financial position, operating results or cash flows of the Group. 41. FINANCIAL INSTRUMENTS Financial assets of the Group include cash and cash equivalents, bank deposits and restricted cash, equity instruments, accounts receivable, financial assets at FVTPL and financial assets included in prepayments and other current assets. Financial liabilities of the Group include short-term and long-term debt, accounts payable and financial liabilities included in accrued expenses and other payables. (a) Fair Value Measurements Based on IFRS 13, “Fair Value Measurement”, the fair value of each financial instrument is categorised in its entirety based on the lowest level of input that is significant to that fair value measurement. The levels are defined as follows: • Level 1: fair values measured using quoted prices (unadjusted) in active markets for identical financial instruments • Level 2: fair values measured using quoted prices in active markets for similar financial instruments, or using valuation techniques in which all significant inputs are directly or indirectly based on observable market data • Level 3: fair values measured using valuation techniques in which any significant input is not based on observable market data China Telecom Corporation Limited Annual Report 2020
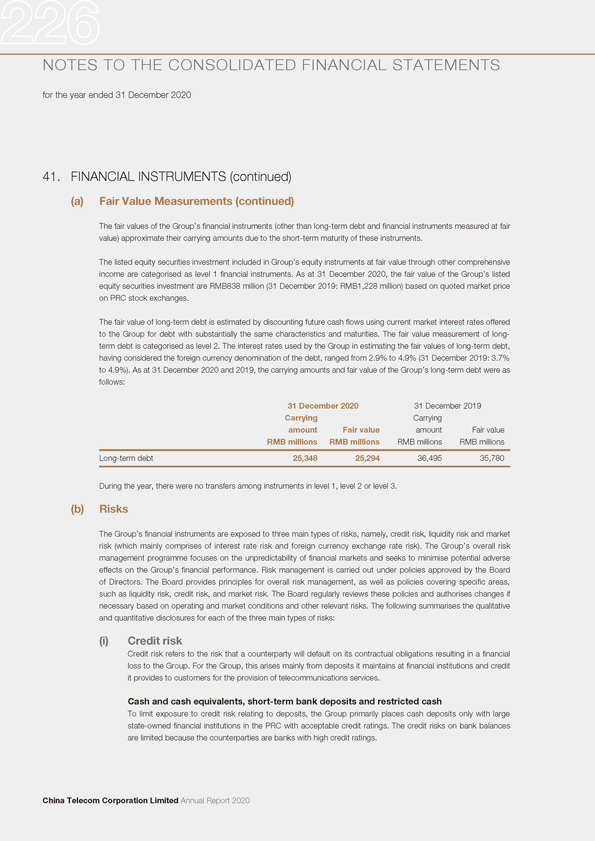
NOTES TO THE CONSOLIDATED FINANCIAL STATEMENTS for the year ended 31 December 2020 41. FINANCIAL INSTRUMENTS (continued) (a) Fair Value Measurements (continued) The fair values of the Group’s financial instruments (other than long-term debt and financial instruments measured at fair value) approximate their carrying amounts due to the short-term maturity of these instruments. The listed equity securities investment included in Group’s equity instruments at fair value through other comprehensive income are categorised as level 1 financial instruments. As at 31 December 2020, the fair value of the Group’s listed equity securities investment are RMB838 million (31 December 2019: RMB1,228 million) based on quoted market price on PRC stock exchanges. The fair value of long-term debt is estimated by discounting future cash flows using current market interest rates offered to the Group for debt with substantially the same characteristics and maturities. The fair value measurement of long-term debt is categorised as level 2. The interest rates used by the Group in estimating the fair values of long-term debt, having considered the foreign currency denomination of the debt, ranged from 2.9% to 4.9% (31 December 2019: 3.7% to 4.9%) . As at 31 December 2020 and 2019, the carrying amounts and fair value of the Group’s long-term debt were as follows: 31 December 2020 31 December 2019 Carrying Carrying amount Fair value amount Fair value RMB millions RMB millions RMB millions RMB millions Long-term debt 25,348 25,294 36,495 35,780 During the year, there were no transfers among instruments in level 1, level 2 or level 3. (b) Risks The Group’s financial instruments are exposed to three main types of risks, namely, credit risk, liquidity risk and market risk (which mainly comprises of interest rate risk and foreign currency exchange rate risk). The Group’s overall risk management programme focuses on the unpredictability of financial markets and seeks to minimise potential adverse effects on the Group’s financial performance. Risk management is carried out under policies approved by the Board of Directors. The Board provides principles for overall risk management, as well as policies covering specific areas, such as liquidity risk, credit risk, and market risk. The Board regularly reviews these policies and authorises changes if necessary based on operating and market conditions and other relevant risks. The following summarises the qualitative and quantitative disclosures for each of the three main types of risks: (i) Credit risk Credit risk refers to the risk that a counterparty will default on its contractual obligations resulting in a financial loss to the Group. For the Group, this arises mainly from deposits it maintains at financial institutions and credit it provides to customers for the provision of telecommunications services. Cash and cash equivalents, short-term bank deposits and restricted cash To limit exposure to credit risk relating to deposits, the Group primarily places cash deposits only with large state-owned financial institutions in the PRC with acceptable credit ratings. The credit risks on bank balances are limited because the counterparties are banks with high credit ratings. China Telecom Corporation Limited Annual Report 2020
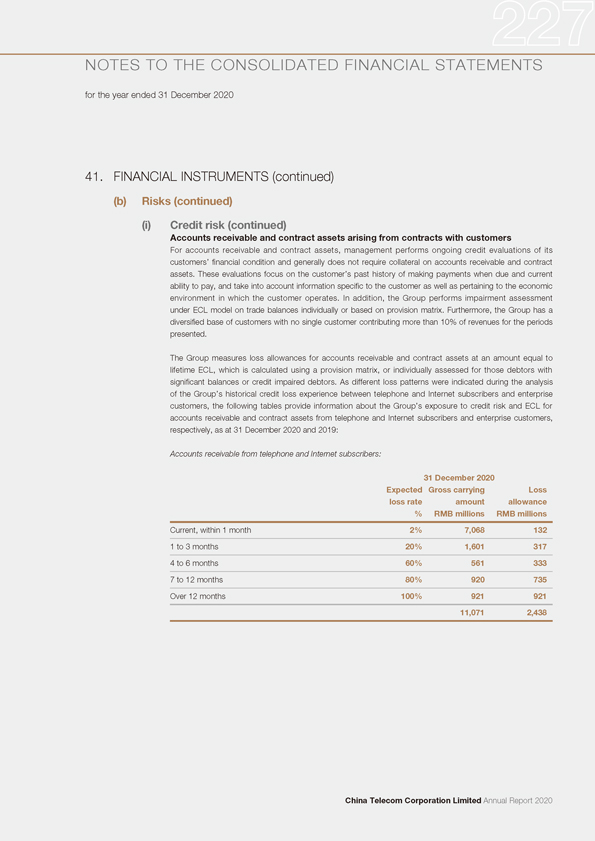
NOTES TO THE CONSOLIDATED FINANCIAL STATEMENTS for the year ended 31 December 2020 41. FINANCIAL INSTRUMENTS (continued) (b) Risks (continued) (i) Credit risk (continued) Accounts receivable and contract assets arising from contracts with customers For accounts receivable and contract assets, management performs ongoing credit evaluations of its customers’ financial condition and generally does not require collateral on accounts receivable and contract assets. These evaluations focus on the customer’s past history of making payments when due and current ability to pay, and take into account information specific to the customer as well as pertaining to the economic environment in which the customer operates. In addition, the Group performs impairment assessment under ECL model on trade balances individually or based on provision matrix. Furthermore, the Group has a diversified base of customers with no single customer contributing more than 10% of revenues for the periods presented. The Group measures loss allowances for accounts receivable and contract assets at an amount equal to lifetime ECL, which is calculated using a provision matrix, or individually assessed for those debtors with significant balances or credit impaired debtors. As different loss patterns were indicated during the analysis of the Group’s historical credit loss experience between telephone and Internet subscribers and enterprise customers, the following tables provide information about the Group’s exposure to credit risk and ECL for accounts receivable and contract assets from telephone and Internet subscribers and enterprise customers, respectively, as at 31 December 2020 and 2019: Accounts receivable from telephone and Internet subscribers: 31 December 2020 Expected Gross carrying Loss loss rate amount allowance % RMB millions RMB millions Current, within 1 month 2% 7,068 132 1 to 3 months 20% 1,601 317 4 to 6 months 60% 561 333 7 to 12 months 80% 920 735 Over 12 months 100% 921 921 11,071 2,438 China Telecom Corporation Limited Annual Report 2020
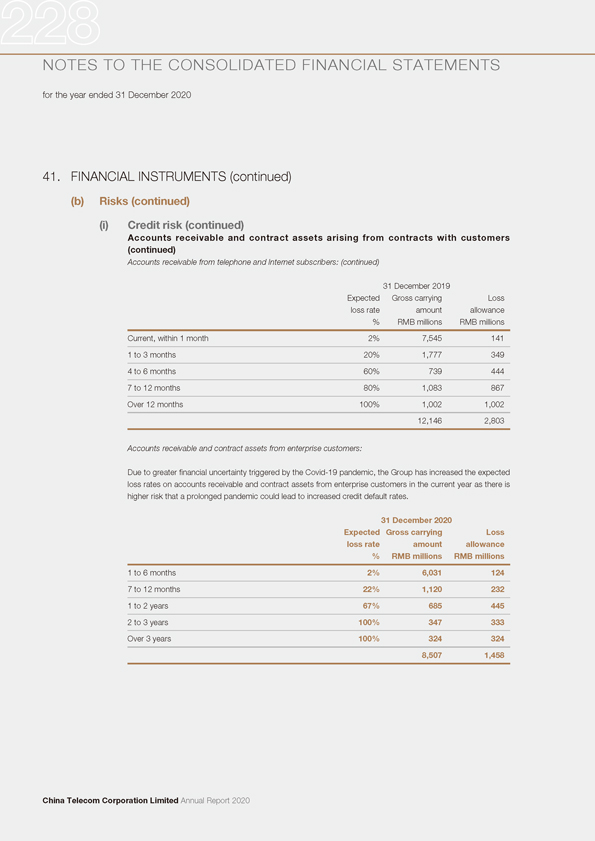
NOTES TO THE CONSOLIDATED FINANCIAL STATEMENTS for the year ended 31 December 2020 41. FINANCIAL INSTRUMENTS (continued) (b) Risks (continued) (i) Credit risk (continued) Accounts receivable and contract assets arising from contracts with customers (continued) Accounts receivable from telephone and Internet subscribers: (continued) 31 December 2019 Expected Gross carrying Loss loss rate amount allowance % RMB millions RMB millions Current, within 1 month 2% 7,545 141 1 to 3 months 20% 1,777 349 4 to 6 months 60% 739 444 7 to 12 months 80% 1,083 867 Over 12 months 100% 1,002 1,002 12,146 2,803 Accounts receivable and contract assets from enterprise customers: Due to greater financial uncertainty triggered by the Covid-19 pandemic, the Group has increased the expected loss rates on accounts receivable and contract assets from enterprise customers in the current year as there is higher risk that a prolonged pandemic could lead to increased credit default rates. 31 December 2020 Expected Gross carrying Loss loss rate amount allowance % RMB millions RMB millions 1 to 6 months 2% 6,031 124 7 to 12 months 22% 1,120 232 1 to 2 years 67% 685 445 2 to 3 years 100% 347 333 Over 3 years 100% 324 324 8,507 1,458 China Telecom Corporation Limited Annual Report 2020

NOTES TO THE CONSOLIDATED FINANCIAL STATEMENTS for the year ended 31 December 2020 41. FINANCIAL INSTRUMENTS (continued) (b) Risks (continued) (i) Credit risk (continued) Accounts receivable and contract assets arising from contracts with customers (continued) Accounts receivable and contract assets from enterprise customers: (continued) 31 December 2019 Expected Gross carrying Loss loss rate amount allowance % RMB millions RMB millions 1 to 6 months 2% 5,452 102 7 to 12 months 20% 1,428 239 1 to 2 years 60% 621 353 2 to 3 years 90% 258 224 Over 3 years 100% 371 364 8,130 1,282 As at 31 December 2020, the loss allowance for accounts receivable and contract assets was RMB4,434 million and RMB9 million (2019: RMB4,692 million and RMB8 million), respectively. Loss allowance of RMB547 million as at 31 December 2020 (2019: RMB615 million), which was not calculated collectively in the above tables, was made individually on debtors with significant balances or credit impaired debtors. Expected loss rates are based on actual loss experience over the past 1 to 3 years. These rates are adjusted to reflect differences between economic conditions during the period over which the historical data has been collected, current conditions and the Group’s view of economic conditions over the expected lives of the receivables. Movement in the loss allowance account in respect of accounts receivable is as follows: 2020 2019 RMB millions RMB millions At beginning of year 4,692 4,680 Impairment losses for ECL 1,382 1,653 Amounts written off (1,640) (1,641) At end of year 4,434 4,692 China Telecom Corporation Limited Annual Report 2020
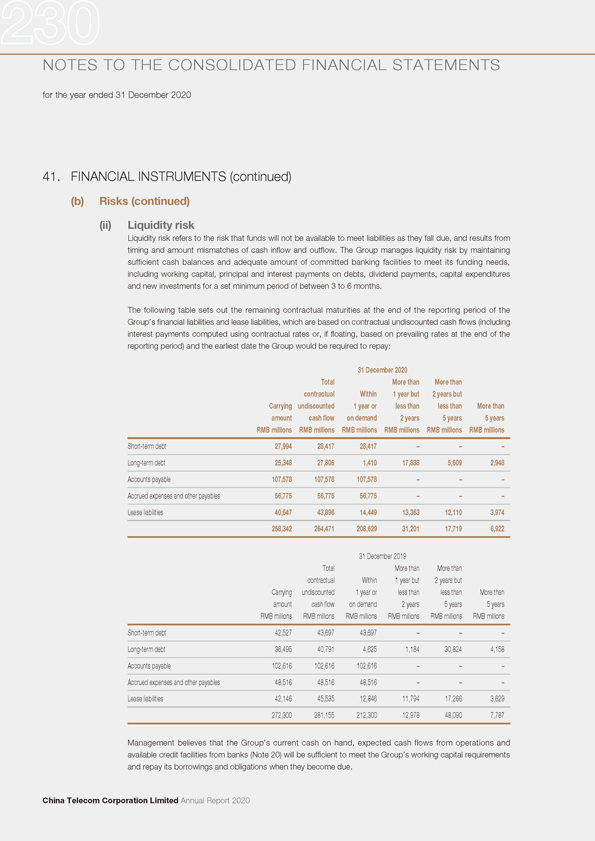
NOTES TO THE CONSOLIDATED FINANCIAL STATEMENTS for the year ended 31 December 2020 41. FINANCIAL INSTRUMENTS (continued) (b) Risks (continued) (ii) Liquidity risk Liquidity risk refers to the risk that funds will not be available to meet liabilities as they fall due, and results from timing and amount mismatches of cash inflow and outflow. The Group manages liquidity risk by maintaining sufficient cash balances and adequate amount of committed banking facilities to meet its funding needs, including working capital, principal and interest payments on debts, dividend payments, capital expenditures and new investments for a set minimum period of between 3 to 6 months. The following table sets out the remaining contractual maturities at the end of the reporting period of the Group’s financial liabilities and lease liabilities, which are based on contractual undiscounted cash flows (including interest payments computed using contractual rates or, if floating, based on prevailing rates at the end of the reporting period) and the earliest date the Group would be required to repay: 31 December 2020 Total More than More than contractual Within 1 year but 2 years but Carrying undiscounted 1 year or less than less than More than amount cash flow on demand 2 years 5 years 5 years RMB millions RMB millions RMB millions RMB millions RMB millions RMB millions Short-term debt 27,994 28,417 28,417 – – –Long-term debt 25,348 27,805 1,410 17,838 5,609 2,948 Accounts payable 107,578 107,578 107,578 – – – Accrued expenses and other payables 56,775 56,775 56,775 – – – Lease liabilities 40,647 43,896 14,449 13,363 12,110 3,974 258,342 264,471 208,629 31,201 17,719 6,922 31 December 2019 Total More than More than contractual Within 1 year but 2 years but Carrying undiscounted 1 year or less than less than More than amount cash flow on demand 2 years 5 years 5 years RMB millions RMB millions RMB millions RMB millions RMB millions RMB millions Short-term debt 42,527 43,697 43,697 – – –Long-term debt 36,495 40,791 4,625 1,184 30,824 4,158 Accounts payable 102,616 102,616 102,616 – – –Accrued expenses and other payables 48,516 48,516 48,516 – – –Lease liabilities 42,146 45,535 12,846 11,794 17,266 3,629 272,300 281,155 212,300 12,978 48,090 7,787 Management believes that the Group’s current cash on hand, expected cash flows from operations and available credit facilities from banks (Note 20) will be sufficient to meet the Group’s working capital requirements and repay its borrowings and obligations when they become due. China Telecom Corporation Limited Annual Report 2020
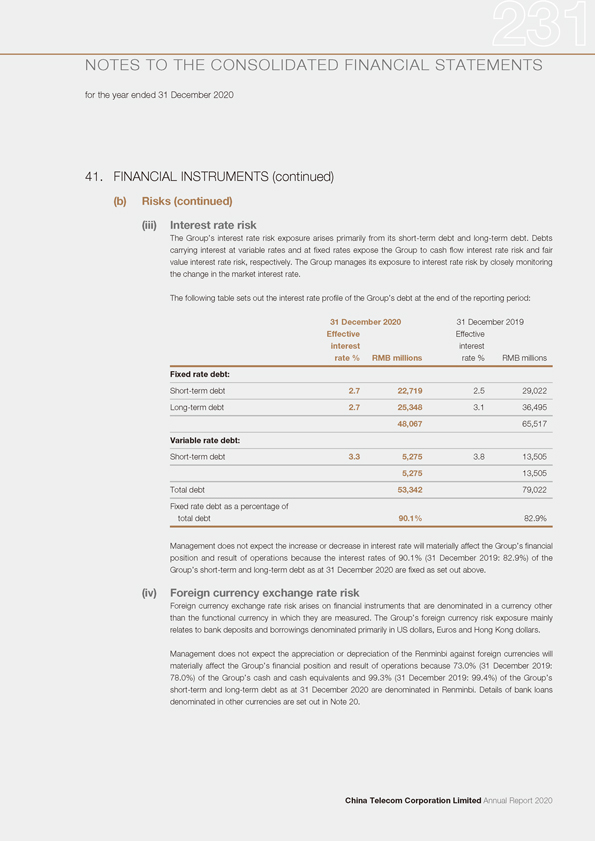
NOTES TO THE CONSOLIDATED FINANCIAL STATEMENTS for the year ended 31 December 2020 41. FINANCIAL INSTRUMENTS (continued) (b) Risks (continued) (iii) Interest rate risk The Group’s interest rate risk exposure arises primarily from its short-term debt and long-term debt. Debts carrying interest at variable rates and at fixed rates expose the Group to cash flow interest rate risk and fair value interest rate risk, respectively. The Group manages its exposure to interest rate risk by closely monitoring the change in the market interest rate. The following table sets out the interest rate profile of the Group’s debt at the end of the reporting period: 31 December 2020 31 December 2019 Effective Effective interest interest rate % RMB millions rate % RMB millions Fixed rate debt: Short-term debt 2.7 22,719 2.5 29,022 Long-term debt 2.7 25,348 3.1 36,495 48,067 65,517 Variable rate debt: Short-term debt 3.3 5,275 3.8 13,505 5,275 13,505 Total debt 53,342 79,022 Fixed rate debt as a percentage of total debt 90.1% 82.9% Management does not expect the increase or decrease in interest rate will materially affect the Group’s financial position and result of operations because the interest rates of 90.1% (31 December 2019: 82.9%) of the Group’s short-term and long-term debt as at 31 December 2020 are fixed as set out above. (iv) Foreign currency exchange rate risk Foreign currency exchange rate risk arises on financial instruments that are denominated in a currency other than the functional currency in which they are measured. The Group’s foreign currency risk exposure mainly relates to bank deposits and borrowings denominated primarily in US dollars, Euros and Hong Kong dollars. Management does not expect the appreciation or depreciation of the Renminbi against foreign currencies will materially affect the Group’s financial position and result of operations because 73.0% (31 December 2019: 78.0%) of the Group’s cash and cash equivalents and 99.3% (31 December 2019: 99.4%) of the Group’s short-term and long-term debt as at 31 December 2020 are denominated in Renminbi. Details of bank loans denominated in other currencies are set out in Note 20. China Telecom Corporation Limited Annual Report 2020
NOTES TO THE CONSOLIDATED FINANCIAL STATEMENTS for the year ended 31 December 2020 42. CAPITAL MANAGEMENT The Group’s primary objectives when managing capital are to safeguard the Group’s ability to continue as a going concern, so that it can continue to provide investment returns for shareholders and benefits for other stakeholders, by pricing products and services commensurately with the level of risk and by securing access to finance at a reasonable cost. Management regularly reviews and manages its capital structure to maintain a balance between the higher shareholder returns that might be possible with higher levels of borrowings and the advantages and security afforded by a sound capital position, and makes adjustments to the capital structure in light of changes in economic conditions. Management monitors its capital structure on the basis of total debt-to-total assets ratio. For this purpose the Group defines total debt as the sum of short-term debt and long-term debt. Total debts do not include balance of deposits received by Finance Company from China Telecom Group amounting to RMB9,826 million and lease liabilities amounting to RMB40,647 million as at 31 December 2020 (31 December 2019: RMB4,098 million and RMB42,146 million). As at 31 December 2020, the Group’s total debt-to-total assets ratio was 7.5% (31 December 2019: 11.2%), which is within the range of management’s expectation. Except Finance Company is subject to certain capital requirements imposed by China Banking and Insurance Regulatory Commission, neither the Company nor any of its subsidiaries are subject to externally imposed capital requirements. China Telecom Corporation Limited Annual Report 2020
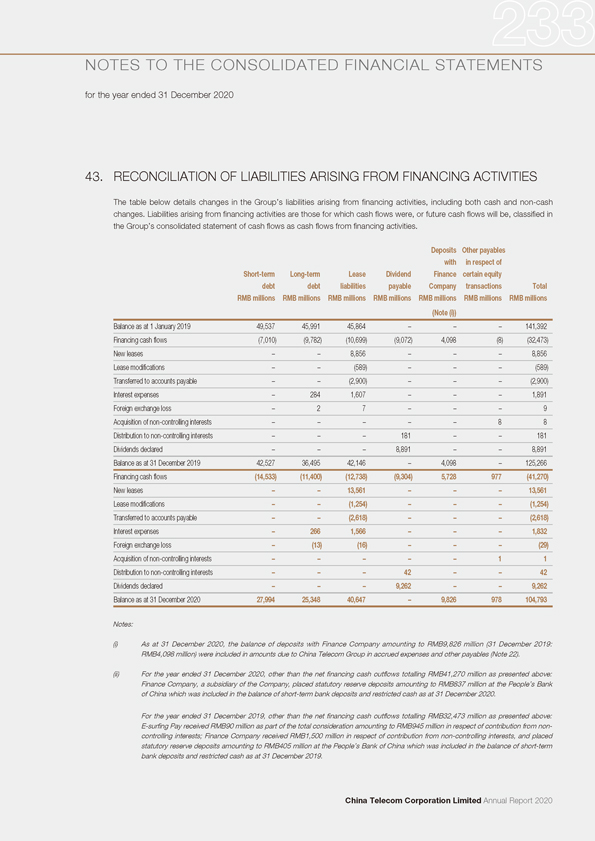
NOTES TO THE CONSOLIDATED FINANCIAL STATEMENTS for the year ended 31 December 2020 43. RECONCILIATION OF LIABILITIES ARISING FROM FINANCING ACTIVITIES The table below details changes in the Group’s liabilities arising from financing activities, including both cash and non-cash changes. Liabilities arising from financing activities are those for which cash flows were, or future cash flows will be, classified in the Group’s consolidated statement of cash flows as cash flows from financing activities. Deposits Other payables with in respect of Short-term Long-term Lease Dividend Finance certain equity debt debt liabilities payable Company transactions Total RMB millions RMB millions RMB millions RMB millions RMB millions RMB millions RMB millions (Note (i)) Balance as at 1 January 2019 49,537 45,991 45,864 – – – 141,392 Financing cash flows (7,010) (9,782) (10,699) (9,072) 4,098 (8) (32,473) New leases – – 8,856 – – – 8,856 Lease modifications – – (589) – – – (589) Transferred to accounts payable – – (2,900) – – – (2,900) Interest expenses – 284 1,607 – – – 1,891 Foreign exchange loss – 2 7 – – – 9 Acquisition of non-controlling interests – – – – – 8 8 Distribution to non-controlling interests – – – 181 – – 181 Dividends declared – – – 8,891 – – 8,891 Balance as at 31 December 2019 42,527 36,495 42,146 – 4,098 – 125,266 Financing cash flows (14,533) (11,400) (12,738) (9,304) 5,728 977 (41,270) New leases – – 13,561 – – – 13,561 Lease modifications – – (1,254) – – – (1,254) Transferred to accounts payable – – (2,618) – – – (2,618) Interest expenses – 266 1,566 – – – 1,832 Foreign exchange loss – (13) (16) – – – (29) Acquisition of non-controlling interests – – – – – 1 1 Distribution to non-controlling interests – – – 42 – – 42 Dividends declared – – – 9,262 – – 9,262 Balance as at 31 December 2020 27,994 25,348 40,647 – 9,826 978 104,793 Notes: (i) As at 31 December 2020, the balance of deposits with Finance Company amounting to RMB9,826 million (31 December 2019: RMB4,098 million) were included in amounts due to China Telecom Group in accrued expenses and other payables (Note 22). (ii) For the year ended 31 December 2020, other than the net financing cash outflows totalling RMB41,270 million as presented above: Finance Company, a subsidiary of the Company, placed statutory reserve deposits amounting to RMB837 million at the People’s Bank of China which was included in the balance of short-term bank deposits and restricted cash as at 31 December 2020. For the year ended 31 December 2019, other than the net financing cash outflows totalling RMB32,473 million as presented above: E-surfing Pay received RMB90 million as part of the total consideration amounting to RMB945 million in respect of contribution from non-controlling interests; Finance Company received RMB1,500 million in respect of contribution from non-controlling interests, and placed statutory reserve deposits amounting to RMB405 million at the People’s Bank of China which was included in the balance of short-term bank deposits and restricted cash as at 31 December 2019. China Telecom Corporation Limited Annual Report 2020
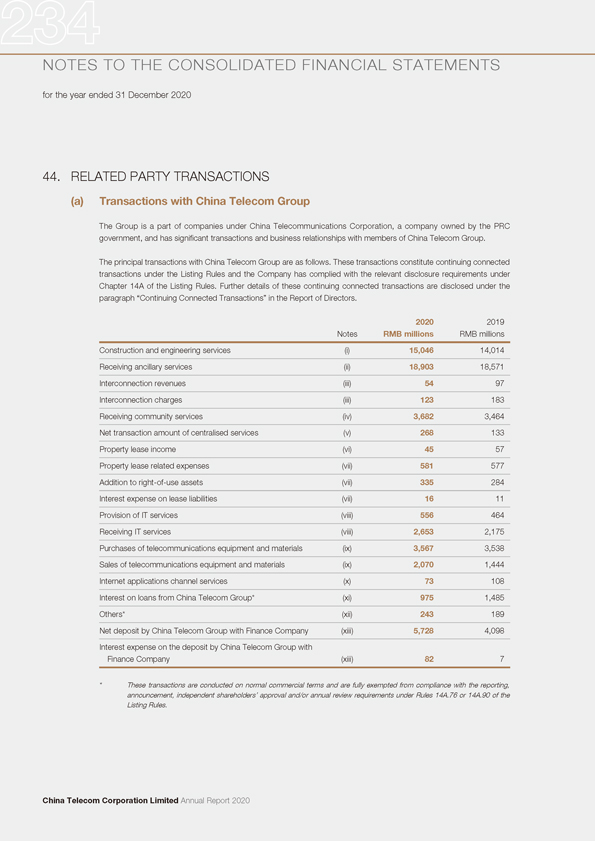
NOTES TO THE CONSOLIDATED FINANCIAL STATEMENTS for the year ended 31 December 2020 44. RELATED PARTY TRANSACTIONS (a) Transactions with China Telecom Group The Group is a part of companies under China Telecommunications Corporation, a company owned by the PRC government, and has significant transactions and business relationships with members of China Telecom Group. The principal transactions with China Telecom Group are as follows. These transactions constitute continuing connected transactions under the Listing Rules and the Company has complied with the relevant disclosure requirements under Chapter 14A of the Listing Rules. Further details of these continuing connected transactions are disclosed under the paragraph “Continuing Connected Transactions” in the Report of Directors. 2020 2019 Notes RMB millions RMB millions Construction and engineering services (i) 15,046 14,014 Receiving ancillary services (ii) 18,903 18,571 Interconnection revenues (iii) 54 97 Interconnection charges (iii) 123 183 Receiving community services (iv) 3,682 3,464 Net transaction amount of centralised services (v) 268 133 Property lease income (vi) 45 57 Property lease related expenses (vii) 581 577 Addition to right-of-use assets (vii) 335 284 Interest expense on lease liabilities (vii) 16 11 Provision of IT services (viii) 556 464 Receiving IT services (viii) 2,653 2,175 Purchases of telecommunications equipment and materials (ix) 3,567 3,538 Sales of telecommunications equipment and materials (ix) 2,070 1,444 Internet applications channel services (x) 73 108 Interest on loans from China Telecom Group* (xi) 975 1,485 Others* (xii) 243 189 Net deposit by China Telecom Group with Finance Company (xiii) 5,728 4,098 Interest expense on the deposit by China Telecom Group with Finance Company (xiii) 82 7 * These transactions are conducted on normal commercial terms and are fully exempted from compliance with the reporting, announcement, independent shareholders’ approval and/or annual review requirements under Rules 14A.76 or 14A.90 of the Listing Rules. China Telecom Corporation Limited Annual Report 2020
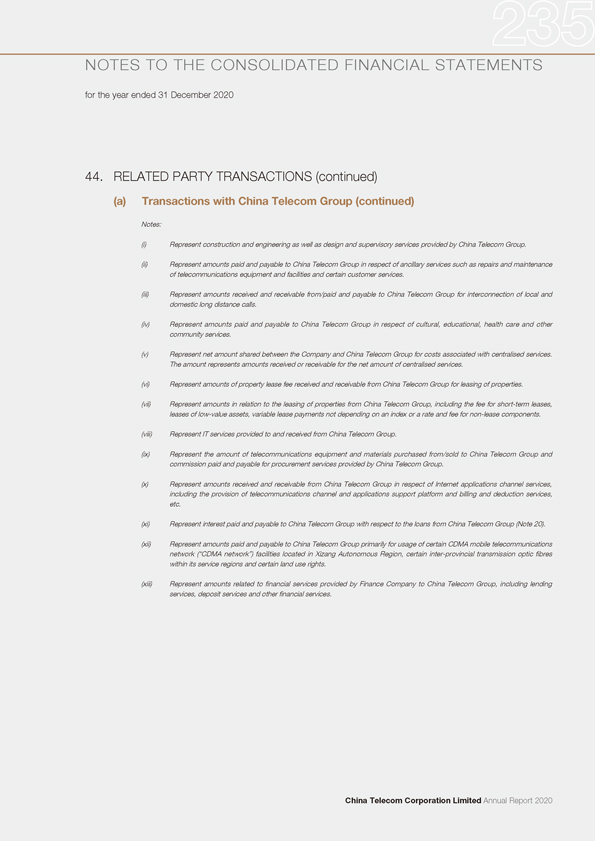
NOTES TO THE CONSOLIDATED FINANCIAL STATEMENTS for the year ended 31 December 2020 44. RELATED PARTY TRANSACTIONS (continued) (a) Transactions with China Telecom Group (continued) Notes: (i) Represent construction and engineering as well as design and supervisory services provided by China Telecom Group. (ii) Represent amounts paid and payable to China Telecom Group in respect of ancillary services such as repairs and maintenance of telecommunications equipment and facilities and certain customer services. (iii) Represent amounts received and receivable from/paid and payable to China Telecom Group for interconnection of local and domestic long distance calls. (iv) Represent amounts paid and payable to China Telecom Group in respect of cultural, educational, health care and other community services. (v) Represent net amount shared between the Company and China Telecom Group for costs associated with centralised services. The amount represents amounts received or receivable for the net amount of centralised services. (vi) Represent amounts of property lease fee received and receivable from China Telecom Group for leasing of properties. (vii) Represent amounts in relation to the leasing of properties from China Telecom Group, including the fee for short-term leases, leases of low-value assets, variable lease payments not depending on an index or a rate and fee for non-lease components. (viii) Represent IT services provided to and received from China Telecom Group. (ix) Represent the amount of telecommunications equipment and materials purchased from/sold to China Telecom Group and commission paid and payable for procurement services provided by China Telecom Group. (x) Represent amounts received and receivable from China Telecom Group in respect of Internet applications channel services, including the provision of telecommunications channel and applications support platform and billing and deduction services, etc. (xi) Represent interest paid and payable to China Telecom Group with respect to the loans from China Telecom Group (Note 20). (xii) Represent amounts paid and payable to China Telecom Group primarily for usage of certain CDMA mobile telecommunications network (“CDMA network”) facilities located in Xizang Autonomous Region, certain inter-provincial transmission optic fibres within its service regions and certain land use rights. (xiii) Represent amounts related to financial services provided by Finance Company to China Telecom Group, including lending services, deposit services and other financial services. China Telecom Corporation Limited Annual Report 2020
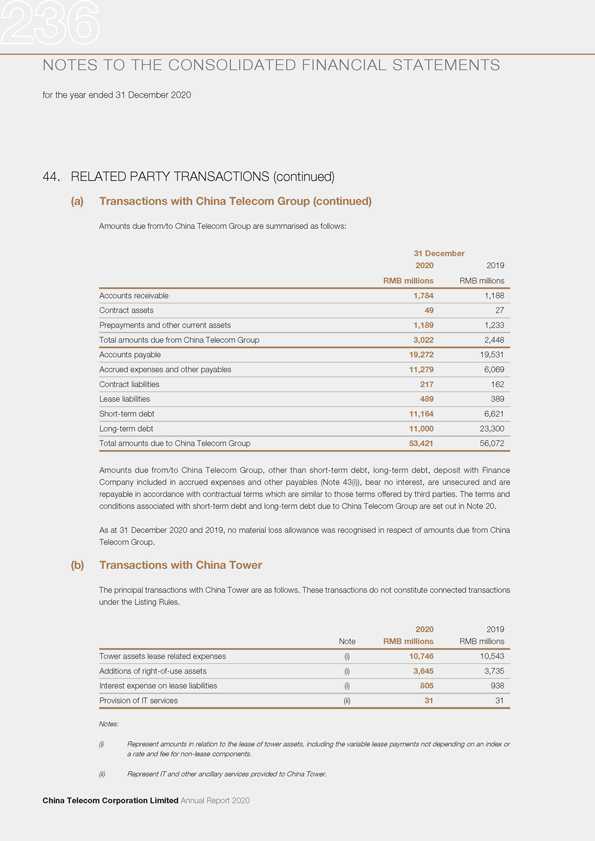
NOTES TO THE CONSOLIDATED FINANCIAL STATEMENTS for the year ended 31 December 2020 44. RELATED PARTY TRANSACTIONS (continued) (a) Transactions with China Telecom Group (continued) Amounts due from/to China Telecom Group are summarised as follows: 31 December 2020 2019 RMB millions RMB millions Accounts receivable 1,784 1,188 Contract assets 49 27 Prepayments and other current assets 1,189 1,233 Total amounts due from China Telecom Group 3,022 2,448 Accounts payable 19,272 19,531 Accrued expenses and other payables 11,279 6,069 Contract liabilities 217 162 Lease liabilities 489 389 Short-term debt 11,164 6,621 Long-term debt 11,000 23,300 Total amounts due to China Telecom Group 53,421 56,072 Amounts due from/to China Telecom Group, other than short-term debt, long-term debt, deposit with Finance Company included in accrued expenses and other payables (Note 43(i)), bear no interest, are unsecured and are repayable in accordance with contractual terms which are similar to those terms offered by third parties. The terms and conditions associated with short-term debt and long-term debt due to China Telecom Group are set out in Note 20. As at 31 December 2020 and 2019, no material loss allowance was recognised in respect of amounts due from China Telecom Group. (b) Transactions with China Tower The principal transactions with China Tower are as follows. These transactions do not constitute connected transactions under the Listing Rules. 2020 2019 Note RMB millions RMB millions Tower assets lease related expenses (i) 10,746 10,543 Additions of right-of-use assets (i) 3,645 3,735 Interest expense on lease liabilities (i) 805 938 Provision of IT services (ii) 31 31 Notes: (i) Represent amounts in relation to the lease of tower assets, including the variable lease payments not depending on an index or a rate and fee for non-lease components. (ii) Represent IT and other ancillary services provided to China Tower. China Telecom Corporation Limited Annual Report 2020
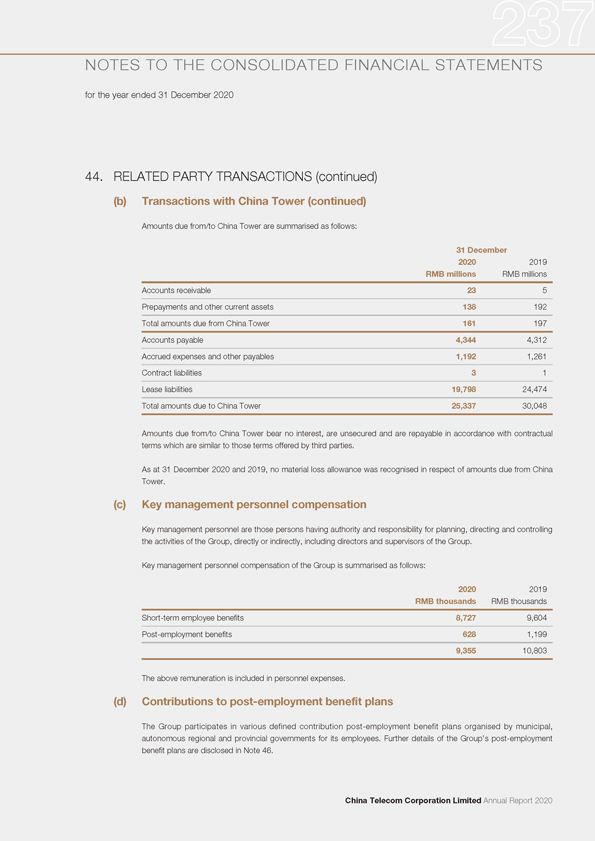
NOTES TO THE CONSOLIDATED FINANCIAL STATEMENTS for the year ended 31 December 2020 44. RELATED PARTY TRANSACTIONS (continued) (b) Transactions with China Tower (continued) Amounts due from/to China Tower are summarised as follows: 31 December 2020 2019 RMB millions RMB millions Accounts receivable 23 5 Prepayments and other current assets 138 192 Total amounts due from China Tower 161 197 Accounts payable 4,344 4,312 Accrued expenses and other payables 1,192 1,261 Contract liabilities 3 1 Lease liabilities 19,798 24,474 Total amounts due to China Tower 25,337 30,048 Amounts due from/to China Tower bear no interest, are unsecured and are repayable in accordance with contractual terms which are similar to those terms offered by third parties. As at 31 December 2020 and 2019, no material loss allowance was recognised in respect of amounts due from China Tower. (c) Key management personnel compensation Key management personnel are those persons having authority and responsibility for planning, directing and controlling the activities of the Group, directly or indirectly, including directors and supervisors of the Group. Key management personnel compensation of the Group is summarised as follows: 2020 2019 RMB thousands RMB thousands Short-term employee benefits 8,727 9,604 Post-employment benefits 628 1,199 9,355 10,803 The above remuneration is included in personnel expenses. (d) Contributions to post-employment benefit plans The Group participates in various defined contribution post-employment benefit plans organised by municipal, autonomous regional and provincial governments for its employees. Further details of the Group’s post-employment benefit plans are disclosed in Note 46. China Telecom Corporation Limited Annual Report 2020
NOTES TO THE CONSOLIDATED FINANCIAL STATEMENTS for the year ended 31 December 2020 44. RELATED PARTY TRANSACTIONS (continued) (e) Transactions with other government-related entities in the PRC The Group is a government-related enterprise and operates in an economic regime currently dominated by entities directly or indirectly controlled by the People’s Republic of China through government authorities, agencies, affiliations and other organisations (collectively referred to as “government-related entities”). Apart from transactions with parent company and its fellow subsidiaries (Note 44(a)), the Group has transactions that are collectively but not individually significant with other government-related entities, which include but not limited to the following: • rendering and receiving services, including but not limited to telecommunications services • sales and purchases of goods, properties and other assets • lease of assets • depositing and borrowing • use of public utilities These transactions are conducted in the ordinary course of the Group’s business on terms comparable to the terms of transactions with other entities that are not government-related. The Group prices its telecommunications services and products based on government-regulated tariff rates, where applicable, or based on commercial negotiations. The Group has also established procurement policies and approval processes for purchases of products and services, which do not depend on whether the counterparties are government-related entities or not. The directors of the Company believe the above information provides appropriate disclosure of related party transactions. China Telecom Corporation Limited Annual Report 2020
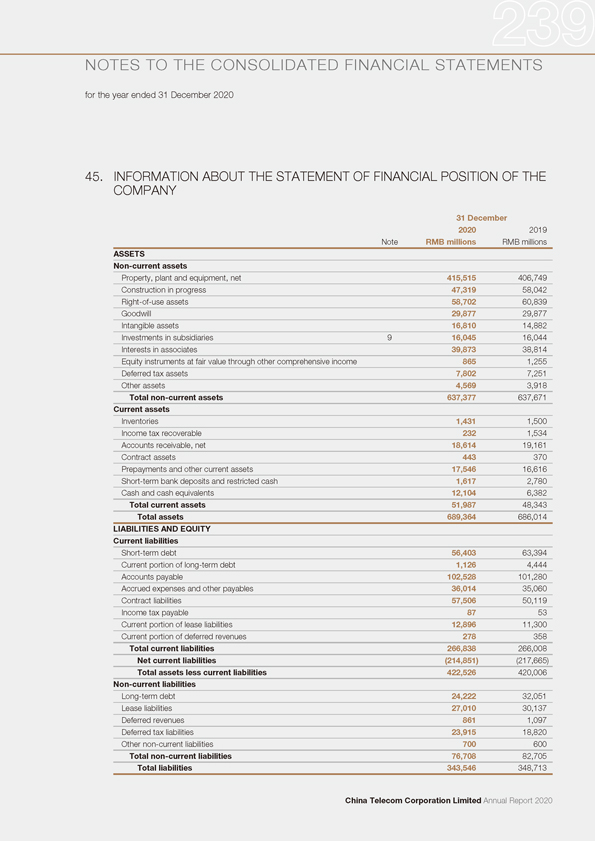
NOTES TO THE CONSOLIDATED FINANCIAL STATEMENTS for the year ended 31 December 2020 45. INFORMATION ABOUT THE STATEMENT OF FINANCIAL POSITION OF THE COMPANY 31 December 2020 2019 Note RMB millions RMB millions ASSETS Non-current assets Property, plant and equipment, net 415,515 406,749 Construction in progress 47,319 58,042 Right-of-use assets 58,702 60,839 Goodwill 29,877 29,877 Intangible assets 16,810 14,882 Investments in subsidiaries 9 16,045 16,044 Interests in associates 39,873 38,814 Equity instruments at fair value through other comprehensive income 865 1,255 Deferred tax assets 7,802 7,251 Other assets 4,569 3,918 Total non-current assets 637,377 637,671 Current assets Inventories 1,431 1,500 Income tax recoverable 232 1,534 Accounts receivable, net 18,614 19,161 Contract assets 443 370 Prepayments and other current assets 17,546 16,616 Short-term bank deposits and restricted cash 1,617 2,780 Cash and cash equivalents 12,104 6,382 Total current assets 51,987 48,343 Total assets 689,364 686,014 LIABILITIES AND EQUITY Current liabilities Short-term debt 56,403 63,394 Current portion of long-term debt 1,126 4,444 Accounts payable 102,528 101,280 Accrued expenses and other payables 36,014 35,060 Contract liabilities 57,506 50,119 Income tax payable 87 53 Current portion of lease liabilities 12,896 11,300 Current portion of deferred revenues 278 358 Total current liabilities 266,838 266,008 Net current liabilities (214,851) (217,665) Total assets less current liabilities 422,526 420,006 Non-current liabilities Long-term debt 24,222 32,051 Lease liabilities 27,010 30,137 Deferred revenues 861 1,097 Deferred tax liabilities 23,915 18,820 Other non-current liabilities 700 600 Total non-current liabilities 76,708 82,705 Total liabilities 343,546 348,713 China Telecom Corporation Limited Annual Report 2020
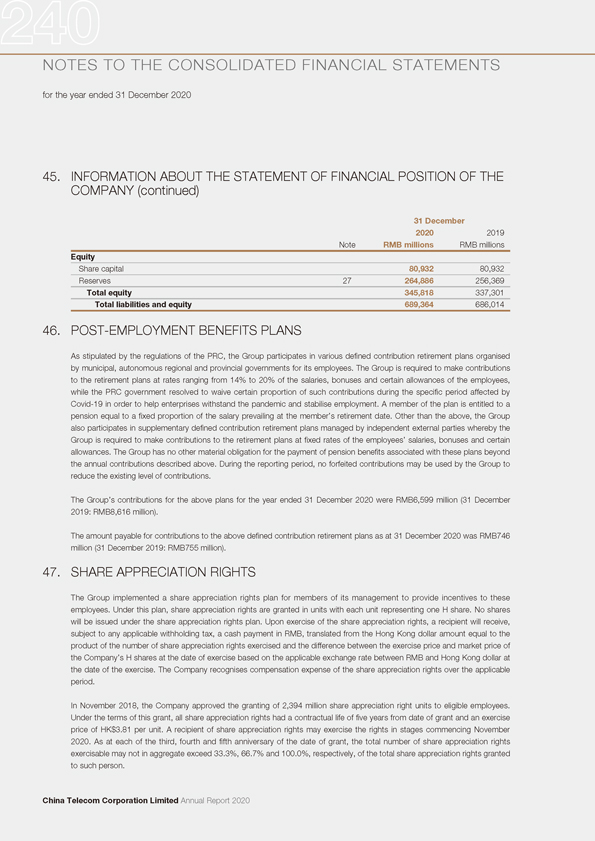
NOTES TO THE CONSOLIDATED FINANCIAL STATEMENTS for the year ended 31 December 2020 45. INFORMATION ABOUT THE STATEMENT OF FINANCIAL POSITION OF THE COMPANY (continued) 31 December 2020 2019 Note RMB millions RMB millions Equity Share capital 80,932 80,932 Reserves 27 264,886 256,369 Total equity 345,818 337,301 Total liabilities and equity 689,364 686,014 46. POST-EMPLOYMENT BENEFITS PLANS As stipulated by the regulations of the PRC, the Group participates in various defined contribution retirement plans organised by municipal, autonomous regional and provincial governments for its employees. The Group is required to make contributions to the retirement plans at rates ranging from 14% to 20% of the salaries, bonuses and certain allowances of the employees, while the PRC government resolved to waive certain proportion of such contributions during the specific period affected by Covid-19 in order to help enterprises withstand the pandemic and stabilise employment. A member of the plan is entitled to a pension equal to a fixed proportion of the salary prevailing at the member’s retirement date. Other than the above, the Group also participates in supplementary defined contribution retirement plans managed by independent external parties whereby the Group is required to make contributions to the retirement plans at fixed rates of the employees’ salaries, bonuses and certain allowances. The Group has no other material obligation for the payment of pension benefits associated with these plans beyond the annual contributions described above. During the reporting period, no forfeited contributions may be used by the Group to reduce the existing level of contributions. The Group’s contributions for the above plans for the year ended 31 December 2020 were RMB6,599 million (31 December 2019: RMB8,616 million). The amount payable for contributions to the above defined contribution retirement plans as at 31 December 2020 was RMB746 million (31 December 2019: RMB755 million). 47. SHARE APPRECIATION RIGHTS The Group implemented a share appreciation rights plan for members of its management to provide incentives to these employees. Under this plan, share appreciation rights are granted in units with each unit representing one H share. No shares will be issued under the share appreciation rights plan. Upon exercise of the share appreciation rights, a recipient will receive, subject to any applicable withholding tax, a cash payment in RMB, translated from the Hong Kong dollar amount equal to the product of the number of share appreciation rights exercised and the difference between the exercise price and market price of the Company’s H shares at the date of exercise based on the applicable exchange rate between RMB and Hong Kong dollar at the date of the exercise. The Company recognises compensation expense of the share appreciation rights over the applicable period. In November 2018, the Company approved the granting of 2,394 million share appreciation right units to eligible employees. Under the terms of this grant, all share appreciation rights had a contractual life of five years from date of grant and an exercise price of HK$3.81 per unit. A recipient of share appreciation rights may exercise the rights in stages commencing November 2020. As at each of the third, fourth and fifth anniversary of the date of grant, the total number of share appreciation rights exercisable may not in aggregate exceed 33.3%, 66.7% and 100.0%, respectively, of the total share appreciation rights granted to such person. China Telecom Corporation Limited Annual Report 2020
NOTES TO THE CONSOLIDATED FINANCIAL STATEMENTS for the year ended 31 December 2020 47. SHARE APPRECIATION RIGHTS (continued) During the year ended 31 December 2020 and 2019, no share appreciation right units were exercised. For the year ended 31 December 2020, compensation expense of RMB101 million was reversed by the Group in respect of share appreciation rights. For the year ended 31 December 2019, compensation expense of RMB136 million was recognised by the Group in respect of share appreciation rights. As at 31 December 2020, the carrying amount of the liability arising from share appreciation rights was RMB65 million (2019: RMB166 million). 48. ACCOUNTING ESTIMATES AND JUDGMENTS The Group’s financial position and results of operations are sensitive to accounting methods, assumptions and estimates that underlie the preparation of the consolidated financial statements. Management bases the assumptions and estimates on historical experience and on other factors that the management believes to be reasonable and which form the basis for making judgments about matters that are not readily apparent from other sources. On an on-going basis, management evaluates its estimates. Actual results may differ from those estimates as facts, circumstances and conditions change. The selection of significant accounting policies, the judgments and other uncertainties affecting application of those policies and the sensitivity of reported results to changes in conditions and assumptions are factors to be considered when reviewing the consolidated financial statements. The significant accounting policies are set forth in Note 3. Management believes the following significant accounting policies involve the most significant judgments and estimates used in the preparation of the consolidated financial statements. Provision of ECL for accounts receivable The Group uses provision matrix to calculate ECL for the accounts receivable. The provision rates are based on customer’s past history of making payments when due and current ability to pay by groupings of various debtors that have similar loss patterns. The provision matrix is based on the Group’s historical credit loss experience taking into consideration reasonable and supportable forward-looking information that is available without undue cost or effort. The historical loss rates are reassessed annually, and changes in the forward-looking information are considered. In addition, accounts receivable with significant balances or credit-impaired are assessed for ECL individually. The provision of ECL is sensitive to changes in estimates. Due to greater financial uncertainty triggered by the Covid-19 pandemic, the Group has increased the expected loss rates in the current year as there is higher risk that a prolonged pandemic could lead to increased credit default rate. The information about the ECL and the Group’s accounts receivable are disclosed in Notes 41 and 16. China Telecom Corporation Limited Annual Report 2020
NOTES TO THE CONSOLIDATED FINANCIAL STATEMENTS for the year ended 31 December 2020 48. ACCOUNTING ESTIMATES AND JUDGMENTS (continued) Impairment of goodwill and long-lived assets If circumstances indicate that the carrying amount of a long-lived asset may not be recoverable, the asset may be considered “impaired”, and an impairment loss would be recognised in accordance with accounting policy for impairment of long-lived assets as described in Note 3(h). The carrying amounts of the Group’s long-lived assets, including property, plant and equipment, intangible assets with finite useful lives, construction in progress, right-of-use assets and contract costs are reviewed periodically to determine whether there is any indication of impairment. These assets are tested for impairment whenever events or changes in circumstances indicate that their recorded carrying amounts may not be recoverable. For goodwill, the impairment testing is performed annually at the end of each reporting period. The recoverable amount of an asset or cash-generating unit is the greater of its value in use and fair value less costs of disposal. When an asset does not generate cash flows largely independent of those from other assets, the recoverable amount is determined for the smallest group of assets that generates cash inflows independently (i.e. a cash-generating unit). In determining the value in use, expected future cash flows generated by the assets are discounted to their present value. An impairment loss is recognised if the carrying amount of an asset or its cash-generating unit exceeds its estimated recoverable amount. It is difficult to precisely estimate fair value of the Group’s long-lived assets because quoted market prices for such assets may not be readily available. In determining the value in use, expected future cash flows generated by the asset are discounted to their present value, which requires significant judgment relating to level of revenue, amount of operating costs and applicable discount rate. Management uses all readily available information in determining an amount that is a reasonable approximation of recoverable amount. For the year ended 31 December 2020, provision for impairment loss of RMB5,042 million was made against the carrying value of property, plant and equipment (Note 4), mainly based on the impairment test on the 3G Assets on the basis of each individual asset. For the year ended 31 December 2019, no provision for impairment loss was made against the carrying value of long-lived assets. In determining the recoverable amount of the assets within the cash-generating unit, significant judgments were required in estimating future cash flows, level of revenue, amount of operating costs and applicable discount rate. Changes in these estimates could have a significant impact on the carrying value of the assets and could result in additional impairment charge or reversal of impairment in future periods. Furthermore, the financial budgets, growth rate and discount rate are subject to greater uncertainties in the current year due to uncertainty on how the Covid-19 pandemic may progress and evolve and volatility in financial markets. Depreciation and amortisation Property, plant and equipment and intangible assets with finite useful lives are depreciated and amortised on a straight-line basis over the estimated useful lives of the assets, after taking into account their estimated residual value. Management reviews the estimated useful lives and residual values of the assets annually in order to determine the amount of depreciation and amortisation expense to be recorded during any reporting period. The useful lives and residual values are based on the Group’s historical experience with similar assets and take into account anticipated technological changes. The depreciation and amortisation expense for future periods is adjusted if there are significant changes from previous estimates. China Telecom Corporation Limited Annual Report 2020
NOTES TO THE CONSOLIDATED FINANCIAL STATEMENTS for the year ended 31 December 2020 49. POSSIBLE IMPACT OF NEW AND AMENDMENTS TO STANDARDS ISSUED BUT NOT YET EFFECTIVE FOR THE ANNUAL ACCOUNTING PERIOD ENDED 31 DECEMBER 2020 Up to the date of issue of the consolidated financial statements, the IASB has issued the following new and amendments to standards which are not yet effective and not early adopted by the Group for the annual accounting period ended 31 December 2020: Effective for accounting period beginning on or after Amendments to IFRS 9, IAS 39, IFRS 7, IFRS 4 and IFRS 16 “Interest Rate Benchmark Reform – Phase 2” 1 January 2021 Amendments to IFRS 3, “Reference to the Conceptual Framework” 1 January 2022 Amendments to IAS 16, “Property, Plant and Equipment: Proceeds before Intended Use” 1 January 2022 Amendments to IAS 37, “Onerous Contracts – Cost of Fulfilling a Contract” 1 January 2022 Amendments to IFRS Standards, “Annual Improvements to IFRS Standards 2018-2020” 1 January 2022 IFRS 17, “Insurance Contracts and the related Amendments” 1 January 2023 Amendments to IAS 1, “Classification of Liabilities as Current or Non-current” 1 January 2023 Amendments to IAS 1 and IFRS Practice Statement 2, “Disclosure of Accounting Policies” 1 January 2023 Amendments to IAS 8, “Definition of Accounting Estimates” 1 January 2023 Amendments to IFRS 10 and IAS 28, “Sale or Contribution of Assets between an Investor and its Associate or Joint Venture” To be determined The Group is in the process of making an assessment of the impact that will result from adopting the new and amendments to standards issued by the IASB which are not yet effective for the accounting period ended on 31 December 2020. So far the Group believes that the adoption of these new and amendments to standards is unlikely to have a significant impact on its financial position and the results of operations. 50. EVENTS AFTER THE REPORTING PERIOD (i) NYSE determination to delist American Depositary Shares of the Company The New York Stock Exchange LLC (the “NYSE”) announced on 31 December 2020 (US Eastern standard time) that the staff of NYSE Regulation had determined to commence proceedings to delist the securities of three issuers, including the American Depositary Shares (the “ADSs”) of the Company, on the basis that the Company is no longer suitable for listing pursuant to the NYSE Listed Company Manual Section 802.01D in light of the Executive Order issued on 12 November 2020 (as amended on 13 January 2021 (US Eastern standard time)) by the then President of the United States. On 4 January 2021(US Eastern standard time), NYSE announced that NYSE Regulation no longer intended to move forward with the delisting action in relation to the ADSs, and then on 6 January 2021 (US Eastern standard time), NYSE announced that NYSE Regulation determined to re-commence delisting proceedings of the ADSs (the “Determination”), following which trading of the ADSs was suspended at 4:00 a.m. (US Eastern standard time) on 11 January 2021. In addition, on 8 January 2021 (US Eastern standard time), the US Department of the Treasury’s Office of Foreign Assets Control (“OFAC”) added the Company to the “Issuer Name” column of a list of companies identified as a Restricted Company (the “Restricted List”). China Telecom Corporation Limited Annual Report 2020
NOTES TO THE CONSOLIDATED FINANCIAL STATEMENTS for the year ended 31 December 2020 50. EVENTS AFTER THE REPORTING PERIOD (continued) (i) NYSE determination to delist American Depositary Shares of the Company (continued) In order to protect the legitimate interests of the Company and its shareholders, on 20 January 2021 (US Eastern standard time), the Company filed with the NYSE a written request for a review of the Determination by a Committee of the Board of Directors of the NYSE (the “Committee”) and stay of the trading suspension of the ADSs pending review of the Determination. On 27 January 2021 (US Eastern standard time), OFAC published General License No. 1A in relation to the Executive Order (“GL 1A”), dated 26 January 2021 (US Eastern standard time), and guidance relating to two related frequently asked questions (respectively, “FAQ 878” and “FAQ 879”). GL 1A and FAQ 879 provide, among others, that, pursuant to the Executive Order, the Prohibitions with respect to the Company take effect on the date that is 60 days after the Company was added to the Restricted List, or 9 March 2021 (US Eastern standard time) (instead of 11 January 2021 (US Eastern standard time)). The Company will continue to pay close attention to the development of related matters and also seek professional advice and reserve all rights to protect the legitimate interests of the Company. (ii) Proposal of share appreciation rights grant for key personnel On 9 February 2021, the Board of Directors of the Company has considered and approved the resolution in relation to the “2021 Share Appreciation Rights Grant Proposal for Key Personnel of China Telecom Corporation Limited” (now renamed as “The Phase II Incentive Scheme for Share Appreciation Rights of China Telecom Corporation Limited” as instructed by the SASAC) (the “Proposal”). According to the Proposal, the Company proposed to grant a maximum of approximately 2,412 million share appreciation rights to a maximum of approximately 8,300 Key Personnel (excluding the Executive Directors, Non-Executive Director, Independent Directors, Supervisors and senior management of the Company). The Proposal has been approved by SASAC on 3 March 2021. (iii) Proposed A share offering On 9 March 2021, the Company announced it plans to apply for the offering and listing of A shares on the Main Board of the Shanghai Stock Exchange. 51. PARENT AND ULTIMATE HOLDING COMPANY The parent and ultimate holding company of the Company as at 31 December 2020 is China Telecommunications Corporation, a state-owned enterprise established in the PRC. China Telecom Corporation Limited Annual Report 2020
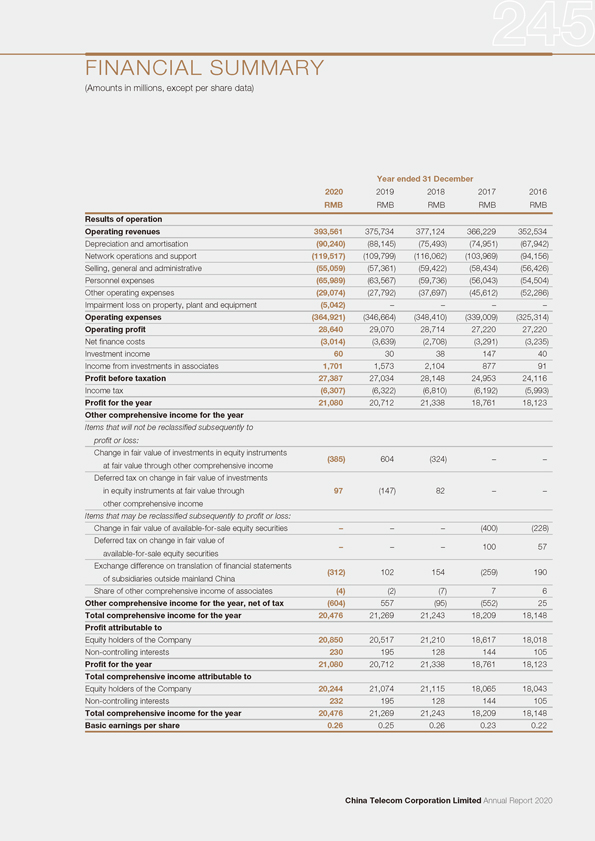
FINANCIAL SUMMARY (Amounts in millions, except per share data) Year ended 31 December 2020 2019 2018 2017 2016 RMB RMB RMB RMB RMB Results of operation Operating revenues 393,561 375,734 377,124 366,229 352,534 Depreciation and amortisation (90,240) (88,145) (75,493) (74,951) (67,942) Network operations and support (119,517) (109,799) (116,062) (103,969) (94,156) Selling, general and administrative (55,059) (57,361) (59,422) (58,434) (56,426) Personnel expenses (65,989) (63,567) (59,736) (56,043) (54,504) Other operating expenses (29,074) (27,792) (37,697) (45,612) (52,286) Impairment loss on property, plant and equipment (5,042) – – – –Operating expenses (364,921) (346,664) (348,410) (339,009) (325,314) Operating profit 28,640 29,070 28,714 27,220 27,220 Net finance costs (3,014) (3,639) (2,708) (3,291) (3,235) Investment income 60 30 38 147 40 Income from investments in associates 1,701 1,573 2,104 877 91 Profit before taxation 27,387 27,034 28,148 24,953 24,116 Income tax (6,307) (6,322) (6,810) (6,192) (5,993) Profit for the year 21,080 20,712 21,338 18,761 18,123 Other comprehensive income for the year Items that will not be reclassified subsequently to profit or loss: Change in fair value of investments in equity instruments (385) 604 (324) – –at fair value through other comprehensive income Deferred tax on change in fair value of investments in equity instruments at fair value through 97 (147) 82 – –other comprehensive income Items that may be reclassified subsequently to profit or loss: Change in fair value of available-for-sale equity securities – – – (400) (228) Deferred tax on change in fair value of – – – 100 57 available-for-sale equity securities Exchange difference on translation of financial statements (312) 102 154 (259) 190 of subsidiaries outside mainland China Share of other comprehensive income of associates (4) (2) (7) 7 6 Other comprehensive income for the year, net of tax (604) 557 (95) (552) 25 Total comprehensive income for the year 20,476 21,269 21,243 18,209 18,148 Profit attributable to Equity holders of the Company 20,850 20,517 21,210 18,617 18,018 Non-controlling interests 230 195 128 144 105 Profit for the year 21,080 20,712 21,338 18,761 18,123 Total comprehensive income attributable to Equity holders of the Company 20,244 21,074 21,115 18,065 18,043 Non-controlling interests 232 195 128 144 105 Total comprehensive income for the year 20,476 21,269 21,243 18,209 18,148 Basic earnings per share 0.26 0.25 0.26 0.23 0.22 China Telecom Corporation Limited Annual Report 2020
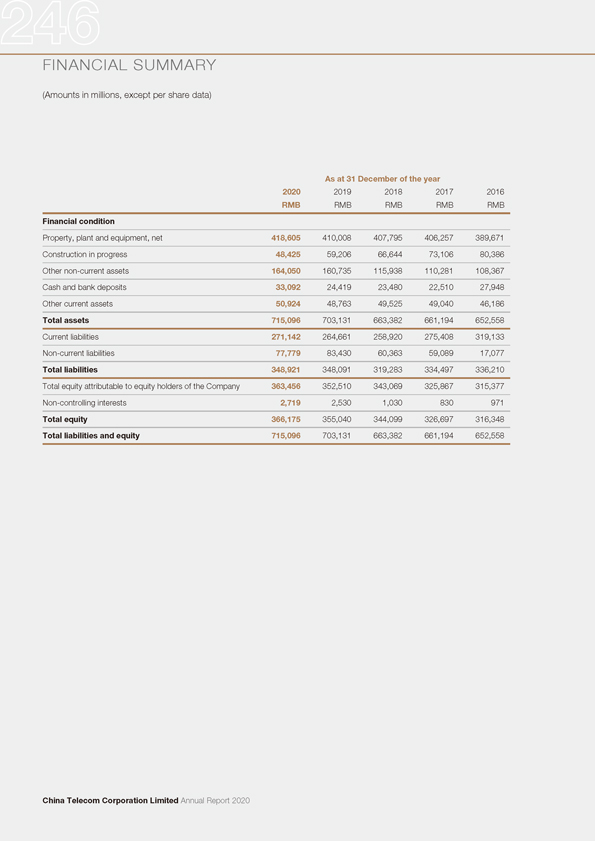
FINANCIAL SUMMARY (Amounts in millions, except per share data) As at 31 December of the year 2020 2019 2018 2017 2016 RMB RMB RMB RMB RMB Financial condition Property, plant and equipment, net 418,605 410,008 407,795 406,257 389,671 Construction in progress 48,425 59,206 66,644 73,106 80,386 Other non-current assets 164,050 160,735 115,938 110,281 108,367 Cash and bank deposits 33,092 24,419 23,480 22,510 27,948 Other current assets 50,924 48,763 49,525 49,040 46,186 Total assets 715,096 703,131 663,382 661,194 652,558 Current liabilities 271,142 264,661 258,920 275,408 319,133 Non-current liabilities 77,779 83,430 60,363 59,089 17,077 Total liabilities 348,921 348,091 319,283 334,497 336,210 Total equity attributable to equity holders of the Company 363,456 352,510 343,069 325,867 315,377 Non-controlling interests 2,719 2,530 1,030 830 971 Total equity 366,175 355,040 344,099 326,697 316,348 Total liabilities and equity 715,096 703,131 663,382 661,194 652,558 China Telecom Corporation Limited Annual Report 2020
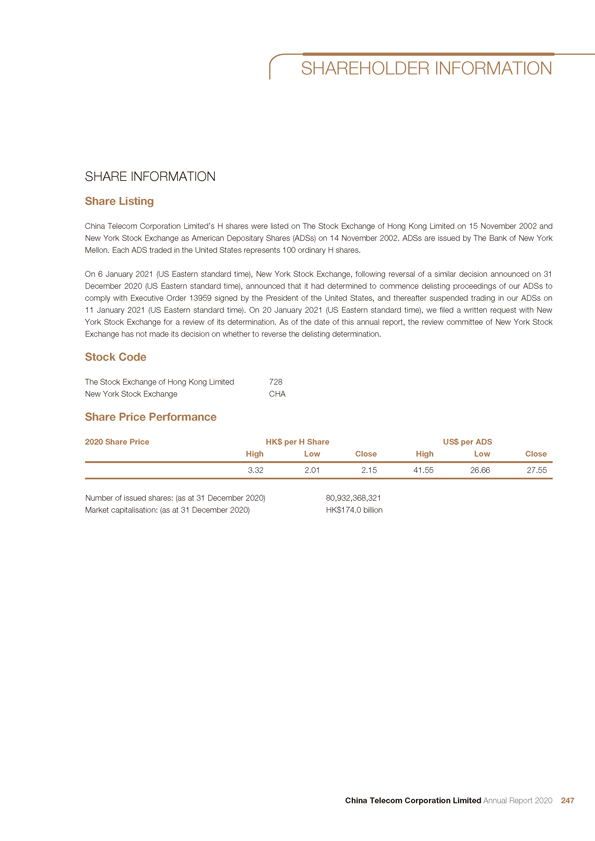
SHAREHOLDER INFORMATION SHARE INFORMATION Share Listing China Telecom Corporation Limited’s H shares were listed on The Stock Exchange of Hong Kong Limited on 15 November 2002 and New York Stock Exchange as American Depositary Shares (ADSs) on 14 November 2002. ADSs are issued by The Bank of New York Mellon. Each ADS traded in the United States represents 100 ordinary H shares. On 6 January 2021 (US Eastern standard time), New York Stock Exchange, following reversal of a similar decision announced on 31 December 2020 (US Eastern standard time), announced that it had determined to commence delisting proceedings of our ADSs to comply with Executive Order 13959 signed by the President of the United States, and thereafter suspended trading in our ADSs on 11 January 2021 (US Eastern standard time). On 20 January 2021 (US Eastern standard time), we filed a written request with New York Stock Exchange for a review of its determination. As of the date of this annual report, the review committee of New York Stock Exchange has not made its decision on whether to reverse the delisting determination. Stock Code The Stock Exchange of Hong Kong Limited 728 New York Stock Exchange CHA Share Price Performance 2020 Share Price HK$ per H Share US$ per ADS High Low Close High Low Close 3.32 2.01 2.15 41.55 26.66 27.55 Number of issued shares: (as at 31 December 2020) 80,932,368,321 Market capitalisation: (as at 31 December 2020) HK$174.0 billion China Telecom Corporation Limited Annual Report 2020 247

SHAREHOLDER INFORMATION Share price performance of China Telecom on The Stock Exchange of Hong Kong Limited versus Hang Seng Index (HSI) and MSCI World Telecom Service Sector Index (MSCI) from IPO on 15 November 2002 to 31 December 2020. 600 500 400 300 China Telecom (+48%) HSI (+176%) MSCI (+118%) 200 100 0 11/2002 11/2003 11/2004 11/2005 11/2006 11/2007 11/2008 11/2009 11/2010 11/2011 11/2012 11/2013 11/2014 11/2015 11/2016 11/2017 11/2018 11/2019 11/2020 248 China Telecom Corporation Limited Annual Report 2020
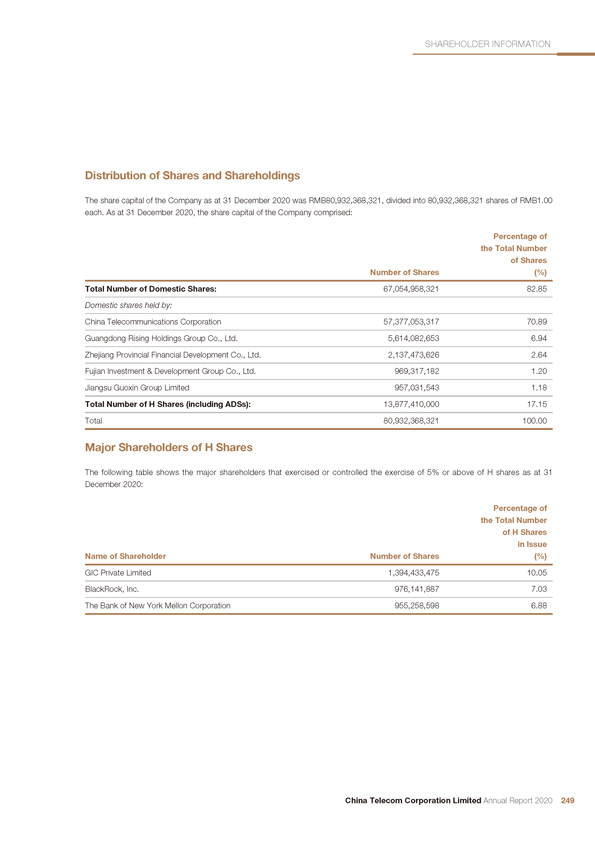
SHAREHOLDER INFORMATION Distribution of Shares and Shareholdings The share capital of the Company as at 31 December 2020 was RMB80,932,368,321, divided into 80,932,368,321 shares of RMB1.00 each. As at 31 December 2020, the share capital of the Company comprised: Percentage of the Total Number of Shares Number of Shares (%) Total Number of Domestic Shares: 67,054,958,321 82.85 Domestic shares held by: China Telecommunications Corporation 57,377,053,317 70.89 Guangdong Rising Holdings Group Co., Ltd. 5,614,082,653 6.94 Zhejiang Provincial Financial Development Co., Ltd. 2,137,473,626 2.64 Fujian Investment & Development Group Co., Ltd. 969,317,182 1.20 Jiangsu Guoxin Group Limited 957,031,543 1.18 Total Number of H Shares (including ADSs): 13,877,410,000 17.15 Total 80,932,368,321 100.00 Major Shareholders of H Shares The following table shows the major shareholders that exercised or controlled the exercise of 5% or above of H shares as at 31 December 2020: Percentage of the Total Number of H Shares in Issue Name of Shareholder Number of Shares (%) GIC Private Limited 1,394,433,475 10.05 BlackRock, Inc. 976,141,887 7.03 The Bank of New York Mellon Corporation 955,258,598 6.88 China Telecom Corporation Limited Annual Report 2020 249
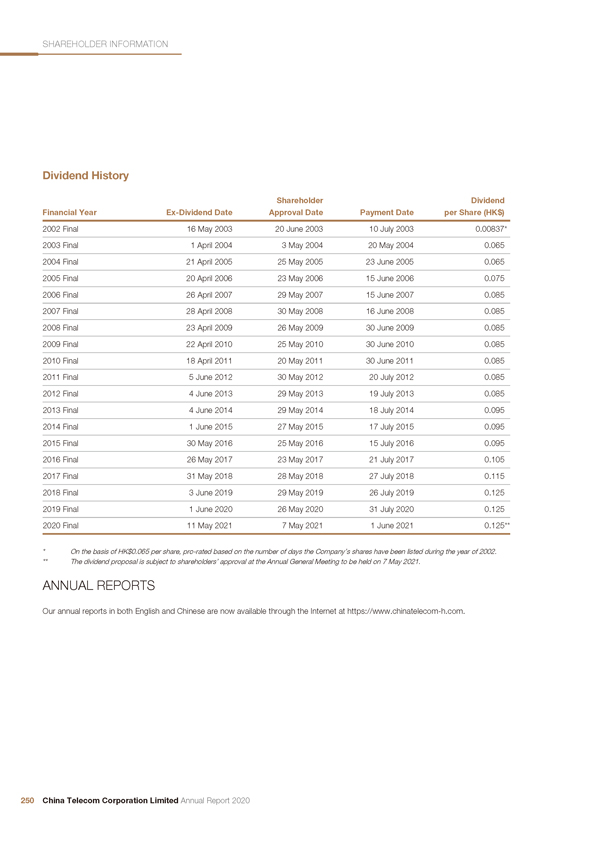
SHAREHOLDER INFORMATION Dividend History Shareholder Dividend Financial Year Ex-Dividend Date Approval Date Payment Date per Share (HK$) 2002 Final 16 May 2003 20 June 2003 10 July 2003 0.00837* 2003 Final 1 April 2004 3 May 2004 20 May 2004 0.065 2004 Final 21 April 2005 25 May 2005 23 June 2005 0.065 2005 Final 20 April 2006 23 May 2006 15 June 2006 0.075 2006 Final 26 April 2007 29 May 2007 15 June 2007 0.085 2007 Final 28 April 2008 30 May 2008 16 June 2008 0.085 2008 Final 23 April 2009 26 May 2009 30 June 2009 0.085 2009 Final 22 April 2010 25 May 2010 30 June 2010 0.085 2010 Final 18 April 2011 20 May 2011 30 June 2011 0.085 2011 Final 5 June 2012 30 May 2012 20 July 2012 0.085 2012 Final 4 June 2013 29 May 2013 19 July 2013 0.085 2013 Final 4 June 2014 29 May 2014 18 July 2014 0.095 2014 Final 1 June 2015 27 May 2015 17 July 2015 0.095 2015 Final 30 May 2016 25 May 2016 15 July 2016 0.095 2016 Final 26 May 2017 23 May 2017 21 July 2017 0.105 2017 Final 31 May 2018 28 May 2018 27 July 2018 0.115 2018 Final 3 June 2019 29 May 2019 26 July 2019 0.125 2019 Final 1 June 2020 26 May 2020 31 July 2020 0.125 2020 Final 11 May 2021 7 May 2021 1 June 2021 0.125** * On the basis of HK$0.065 per share, pro-rated based on the number of days the Company’s shares have been listed during the year of 2002. ** The dividend proposal is subject to shareholders’ approval at the Annual General Meeting to be held on 7 May 2021. ANNUAL REPORTS Our annual reports in both English and Chinese are now available through the Internet at https://www.chinatelecom-h.com. 250 China Telecom Corporation Limited Annual Report 2020
SHAREHOLDER INFORMATION 2020 Annual Report Survey Annual Report is a key communication channel between shareholders and the Company. Last year, we received around 100 questionnaires of “Your Views on Annual Report 2019”. Each of these responses benefited us in enhancing and further improving our annual reports. We are deeply indebted to the respondents for their constructive responses. In accordance with our commitment, we have to contribute HK$50 to a charitable organisation for each questionnaire received. In this regard, we have given a sum of HK$10,000 to the charitable organisation, WWF, in 2020. In addition, we have already implemented the suggestion of allowing shareholders to choose means of receipt and language of corporate communication to enhance environmental protection and cost savings. We value and are eager to keep hearing your comments on our annual report for our further improvement in the future. It is highly appreciated if you could spare your precious time to complete the questionnaire of “Your Views on Annual Report 2020”, as attached in this annual report, and return it by post or fax to us at +852 2877 0988. You can also fill in the electronic form at our website, www.chinatelecom-h.com. Annual General Meeting To be held at 11:00 a.m. on 7 May 2021 in Grand Hyatt Hong Kong. Registered office Address: 31 Jinrong Street Xicheng District Beijing PRC 100033 Tel: 86 10 5850 1800 Fax: 86 10 6601 0728 Any enquiries relating to the strategic development or operations of China Telecom Corporation Limited, please contact the Investor Relations Department: Investor Relations Department Tel: 852 2877 9777 IR Enquiry: 852 2582 0388 Fax: 852 2877 0988 Email: ir@chinatelecom-h.com China Telecom Corporation Limited Annual Report 2020 251
SHAREHOLDER INFORMATION Any enquiries relating to your shareholding, for example transfers of shares, change of name or address, loss of share certificates, please contact the H share registrar: H share registrar Computershare Hong Kong Investor Services Limited Address: Shops 1712-1716, 17th Floor Hopewell Centre 183 Queen’s Road East Wanchai Hong Kong Tel: 852 2862 8555 Fax: 852 2865 0990 Website: www.computershare.com/hk/contact Any enquiries relating to ADSs, please contact the depositary: ADS depositary The Bank of New York Mellon Address: BNY Mellon Shareowner Services P.O. Box 505000 Louisville KY 40233-5000 Tel: 1-866-240-8333 (toll free in USA) 1-201-680-6825 (international) Email: shrrelations@cpushareownerservices.com 252 China Telecom Corporation Limited Annual Report 2020
CORPORATE CULTURE Corporate Mission Let the customers fully enjoy a new information life Strategic Goal Be a leading integrated intelligent information services operator Core Value Comprehensive innovation, pursuing truth and pragmatism, respecting people and creating value all together Operation Philosophy Pursue mutual growth of corporate value and customer value Service Philosophy Customer First Service Foremost Code of Corporate Practice Keep promise and provide excellent service for customers Cooperate honestly and seek win-win result in joint innovation Operate prudently and enhance corporate value continuously Manage precisely and allocate resources scientifically Care the staff and tap their potential to the full Reward the society and be a responsible corporate citizen Corporate Slogan Connecting the World

China Telecom Corporation Limited 31 Jinrong Street, Xicheng District, Beijing, PRC, 100033 www.chinatelecom-h.com Concept, design and printing: iOne Financial Press Limited.Website: www.ione.com.hk
Hong Kong Exchanges and Clearing Limited and The Stock Exchange of Hong Kong Limited take no responsibility for the contents of this announcement, make no representation as to its accuracy or completeness and expressly disclaim any liability whatsoever for any loss howsoever arising from or in reliance upon the whole or any part of the contents of this announcement.

China Telecom Corporation Limited
中国电信股份有限公司
(A joint stock limited company incorporated in the People’s Republic of China with limited liability)
(Stock Code: 728)
NOTICE OF ANNUAL GENERAL MEETING
NOTICE IS HEREBY GIVEN that the annual general meeting of China Telecom Corporation Limited (the “Company”) for the year 2020 will be held at 11:00 a.m. on Friday, 7 May 2021 at Grand Ballroom, the Lobby Floor, Grand Hyatt Hong Kong, 1 Harbour Road, Wanchai, Hong Kong for the purpose of considering and, if thought fit, passing the following resolutions:
ORDINARY RESOLUTIONS
| 1. | THAT the consolidated financial statements of the Company, the report of the Board of Directors, the report of the Supervisory Committee and the report of the international auditor for the year ended 31 December 2020 be considered and approved, and the Board be authorised to prepare the budget of the Company for the year 2021. |
| 2. | THAT the profit distribution proposal and the declaration and payment of a final dividend for the year ended 31 December 2020 be considered and approved. |
| 3. | THAT the appointment of PricewaterhouseCoopers and PricewaterhouseCoopers Zhong Tian LLP as the external auditors of the Company for the year ending on 31 December 2021 be considered and approved, and the Board be authorised to fix the remuneration of the auditors. |
and to consider and approve other businesses (if any).
And as a special business, to consider and, if thought fit, pass the following as special resolutions:
SPECIAL RESOLUTIONS
| 4. | THAT the granting of a general mandate to the Board to issue debentures denominated in local or foreign currencies, in one or more tranches in the PRC and overseas, including but not limited to, super short-term commercial papers, short-term commercial papers, medium term notes, perpetual bonds, company bonds, corporate bonds, convertible bonds, private placement notes, asset securitisation products and asset-backed notes (the “Debentures”), from the date of this meeting until the date on which the annual general meeting of the Company for the year 2021 is held, with a maximum aggregate outstanding repayment amount of up to RMB90 billion be and is hereby approved; THAT the Board or any two or more Directors of the Company duly authorised by the Board, taking into account the specific needs of the Company and market conditions, be and are hereby generally and unconditionally authorised to: |
| (a) | approve the type, specific terms and conditions of, and other matters relating to, the issue of debentures, including but not limited to, the determination of the type, amount, interest rate, term, rating, security, any repurchase or redemption provisions, any placing arrangements to the shareholders of the Company, any options to adjust the nominal interest rates, the use of proceeds, the application of the quota of unissued company bonds and corporate bonds to the issuance of other Debentures, as well as matters including securing approvals, engaging professional advisors, disseminating relevant application documents to the regulatory authorities, obtaining approvals from the regulatory authorities, executing all requisite legal documentation relating to the issue as requested by the regulatory authorities and making relevant disclosure; |
– 1 –
| (b) | do all such acts which are necessary and incidental to the issue of debentures (including, but not limited to, the securing of approvals, the determination of underwriting arrangements, preparation and dissemination of relevant application documents to the regulatory authorities, and the securing of approvals from the regulatory authorities); and |
| (c) | take all such steps which are necessary for the purposes of executing the issue of debentures (including, but not limited to, the execution of all requisite documentation and the disclosure of relevant information in accordance with applicable laws) and to the extent that any of the aforementioned acts and steps that have already been undertaken by the Board or the duly authorised Directors in connection with the issue of debentures, be and are hereby approved, confirmed and ratified; |
and THAT with respect to the Company’s issue of the aforementioned Debentures with an aggregate amount of RMB90 billion, do the centralised registration of super short-term commercial papers, short-term commercial papers, medium term notes and perpetual bonds in accordance with the registration rules published by the National Association of Financial Market Institutional Investors; THAT with respect to the Company’s issue of the aforementioned Debentures with an aggregate amount of RMB90 billion, register high quality entity corporate bonds with an aggregate amount not exceeding RMB30 billion in accordance with the relevant rules of the National Development and Reform Commission.
| 5. | THAT with respect to the Company’s issue of the aforementioned Debentures with an aggregate amount of RMB90 billion, within which the issue of company bonds in the PRC in one or more tranches not exceeding RMB30 billion be and is hereby approved with: |
| (a) | Size of issue: Up to RMB30 billion. |
– 2 –
| (b) | Placing arrangements to the shareholders of the Company: The company bonds will not be issued to existing shareholders of the Company on a preferred basis by way of placing. |
| (c) | Term: The company bonds will have a term not exceeding 10 years and may have one fixed term, or a mix of different terms, which will be determined in accordance with the market conditions and the Company’s capital requirements. |
| (d) | Use of proceeds: The issuance of company bonds shall meet the requirements for repayment of interest-bearing debts, replenishing the operating working capital of the Company or for the purposes of investments in fixed assets and projects, etc. |
| (e) | Effective period: The resolution will be effective from the date on which this resolution is passed until the date on which the annual general meeting of the Company for the year 2021 is held; |
and THAT the Board or any two or more Directors of the Company duly authorised by the Board be and are hereby generally and unconditionally authorised to:
| (a) | approve the type, specific terms and conditions of, and other matters relating to, the issue (including but not limited to, the determination of the type, amount, interest rate, term, rating, security, whether there will be repurchase or redemption provisions, whether there will be an option to adjust the nominal interest rate, the application of the quota of unissued company bonds to the issuance of other Debentures, specific arrangements relating to the use of proceeds within the scope approved by the Shareholders in this meeting and all matters relating to the issue); |
| (b) | do all such acts which are necessary and incidental to the issue (including, but not limited to, the securing of approvals, engaging professional advisors, the determination of underwriting arrangements, preparation and dissemination of relevant application documents to the regulatory authorities, and the securing of approvals from the regulatory authorities); |
| (c) | take all such steps which are necessary for the purposes of executing the issue (including, but not limited to, the execution of all requisite documentation and the disclosure of relevant information in accordance with applicable laws), and to the extent that any of the above acts and steps that have already been undertaken by the Board or the Directors in connection with the issue, be and are hereby approved, confirmed and ratified; |
| (d) | if there are changes in the regulatory policies or market conditions, adjust the specific proposal relating to the issue and related matters in accordance with the opinion of the regulatory authorities; and |
| (e) | after completion of the issue, determine and approve matters relating to the listing of the relevant debentures. |
– 3 –
| 6. | THAT: |
| (a) | subject to paragraph (c) below, the exercise by the Board during the Relevant Period (as hereinafter defined) of all the powers of the Company to allot, issue and deal with additional shares of the Company and to make or grant offers, agreements and options which might require the exercise of such powers be hereby generally and unconditionally approved; |
| (b) | the approval in paragraph (a) shall authorise the Board during the Relevant Period to make or grant offers, agreements and options which might require the exercise of such powers after the end of the Relevant Period; |
| (c) | the amount of additional domestic shares or overseas-listed foreign-invested shares (“H Shares”) (as the case may be) allotted, issued and dealt with or agreed conditionally or unconditionally to be allotted, issued and dealt with either separately or concurrently by the Board pursuant to the approval in paragraph (a), otherwise than pursuant to (i) a Rights Issue (as hereinafter defined); or (ii) any scrip dividend or similar arrangement providing for the allotment of shares in lieu of the whole or part of a dividend on shares in accordance with the Articles of Association of the Company, shall not exceed 20% of each of the Company’s existing domestic shares and H Shares (as the case may be) in issue at the date of passing this special resolution; and |
| (d) | for the purpose of this special resolution numbered 6: |
“Relevant Period” means the period from the passing of this special resolution numbered 6 until the earliest of:
| (i) | the conclusion of the next annual general meeting of the Company; |
| (ii) | the expiration of the 12 month-period following the passing of these special resolutions; and |
| (iii) | the date of revocation or variation of the authority given to the Board under these special resolutions by a special resolution of the Company’s Shareholders in a general meeting. |
“Rights Issue” means an offer of shares open for a period fixed by the Board to holders of shares on the register of members on a fixed record date in proportion to their holdings of such shares (subject to such exclusion or other arrangements as the Board may deem necessary or expedient in relation to fractional entitlements or having regard to any legal or practical restrictions or obligations under the laws of, or the requirement of, any recognised regulatory body or any stock exchange in any territory applicable to the Company) and an offer, allotment or issue of shares by way of rights shall be construed accordingly.
– 4 –
| (e) | the Board be authorised to increase the registered capital of the Company as to reflect the issue of shares in the Company authorised under this special resolution numbered 6, and to make such appropriate and necessary amendments to the Articles of Association of the Company as they think fit to reflect such increases in the registered capital of the Company and to take any other action and complete any formality required to effect such increase in the registered capital of the Company. |
By Order of the Board
China Telecom Corporation Limited
Wong Yuk Har
Company Secretary
Beijing, China, 8 April 2021
Notes:
| (1) | Details of the resolutions stated above are set out in the 2020 annual report and the circular dated 8 April 2021 of the Company. |
| (2) | The H Share Register of Members of the Company will be closed, for the purpose of determining shareholders’ entitlement to attend the annual general meeting, from Monday, 3 May 2021 to Friday, 7 May 2021 (both days inclusive), during which period no transfer of H Shares will be registered. In order to attend the annual general meeting, all share transfers, accompanied by the relevant share certificates, must be lodged for registration with Computershare Hong Kong Investor Services Limited at Shops 1712-1716, 17th Floor, Hopewell Centre, 183 Queen’s Road East, Wanchai, Hong Kong, not later than 4:30 p.m. on Friday, 30 April 2021. Holders of H Shares who are registered with Computershare Hong Kong Investor Services Limited on Friday, 7 May 2021 are entitled to attend the annual general meeting. |
| (3) | The Board of Directors of the Company has recommended a final dividend of HK$0.125 per share (pre-tax) for the year ended 31 December 2020 and, if such proposed dividend distribution set out in resolution numbered 2 is approved by the shareholders, the final dividend will be distributed to those shareholders whose names appear on the Register of Members of the Company on Tuesday, 18 May 2021. The H Share Register of Members will be closed from Thursday, 13 May 2021 to Tuesday, 18 May 2021 (both days inclusive). In order to be entitled to the final dividend, holders of H Shares who have not registered the transfer documents are required to deposit the transfer documents together with the relevant share certificates at Computershare Hong Kong Investor Services Limited, at Shops 1712-1716, 17th Floor, Hopewell Centre, 183 Queen’s Road East, Wanchai, Hong Kong at or before 4:30 p.m.on Wednesday, 12 May 2021. |
| (4) | Each shareholder entitled to attend and vote at the annual general meeting may appoint one or more proxies to attend and vote on his behalf at the annual general meeting. A proxy need not be a shareholder of the Company. Each shareholder who wishes to appoint one or more proxies should read through the 2020 annual report and the circular dated 8 April 2021 of the Company. |
| (5) | To be valid, the form of proxy together with the power of attorney or other authorisation document (if any) signed by the authorised person or notarially certified power of attorney must be delivered to the Office of the Board of Directors of the Company (for holders of domestic shares) and to Computershare Hong Kong Investor Services Limited (for holders of H Shares) not less than 24 hours before the designated time for the holding of the annual general meeting or any adjournment thereof. The Office of the Board of Directors of the Company is located at 31 Jinrong Street, Xicheng District, Beijing 100033, PRC (Telephone: (8610) 5850 1800). Computershare Hong Kong Investor Services Limited is located at 17M Floor, Hopewell Centre, 183 Queen’s Road East, Wanchai, Hong Kong. Completion and return of a form of proxy will not preclude a shareholder from attending in person and voting at the annual general meeting if he so wishes. |
– 5 –
| (6) | Shareholders attending the annual general meeting in person or by proxy shall present their proof of identity. If the attending shareholder is a corporation, its legal representative or person authorised by the board of directors or other decision making authority shall present a copy of the relevant resolution of the board of directors or other decision making authority in order to attend the annual general meeting. |
| (7) | All resolutions proposed at the annual general meeting will be voted by poll. |
| (8) | The annual general meeting is expected to last for half a day and shareholders (in person or by proxy) attending the annual general meeting shall be responsible for their own transport and accommodation expenses. |
| (9) | PRECAUTIONARY MEASURES FOR THE ANNUAL GENERAL MEETING |
In light of the continuing risks posed by the COVID-19 epidemic, and recent requirements for prevention and control of its spread, the Company will implement precautionary measures against COVID-19 at the Annual General Meeting for the sake of health and safety of our Shareholders, Directors, staff and other participants which include but not limited to:
| • | compulsory body temperature checks at the main entrance of Grand Hyatt Hong Kong’s lobby where the Annual General Meeting will be held. Any person who has a fever, i.e. with a body temperature shown on the hotel’s thermometer above 37 degrees Celsius, would not be allowed to access to the venue. Any denied entry to the venue shall also mean the person would not be allowed to attend the Annual General Meeting |
| • | mandatory use of surgical face masks during the attendance at the Annual General Meeting |
| • | the Company shall have the absolute discretion to refuse anyone who does not comply with the above precautionary measures, is subject to quarantine, has any flu-like symptoms or has travelled overseas within 14 days immediately before the Annual General Meeting, or has close contact with any person under quarantine or with recent overseas travel history access to the venue of the Annual General Meeting and attend the Annual General Meeting |
| • | appropriate distance and space will be maintained and as such, the Company may limit the number of attendees at the Annual General Meeting as appropriate to avoid over-crowding |
| • | the Company will not distribute corporate gifts or provide refreshments |
The Company recommends Shareholders to appoint the Chairman of the Annual General Meeting as their proxy to vote according to their indicated voting instructions in lieu of attending the Annual General Meeting in person. Depending on the development of the COVID-19 epidemic, the Company may implement further precautionary measures and may make relevant adjustments and arrangements for the Annual General Meeting and will issue further announcement as appropriate.
| (10) | Shareholders are advised to call the Company’s hotline at (852) 2877 9777 or browse the Company’s website (www.chinatelecom-h.com) for the latest arrangements of the annual general meeting in the event that a Typhoon Signal No. 8 (or above), a Black Rainstorm Warning Signal or extreme conditions are in force on the day of the annual general meeting. |
| (11) | The English translation of this Notice is for reference only, and in case of any inconsistency, the Chinese version shall prevail. |
As at the date of this notice, the Board of Directors of the Company consists of Mr. Ke Ruiwen (as the Chairman and Chief Executive Officer); Mr. Li Zhengmao (as the President and Chief Operating Officer); Mr. Shao Guanglu; Mr. Liu Guiqing and Madam Zhu Min (as the Chief Financial Officer) (all as the Executive Vice Presidents); Mr. Chen Shengguang (as the Non-Executive Director); Mr. Tse Hau Yin, Aloysius, Mr. Xu Erming, Madam Wang Hsuehming and Mr. Yeung Chi Wai, Jason (all as the Independent Non-Executive Directors).
– 6 –
THIS CIRCULAR IS IMPORTANT AND REQUIRES YOUR IMMEDIATE ATTENTION
If you are in any doubt as to any aspect of this circular or as to the action to be taken, you should consult your stockbroker or other registered dealer in securities, bank manager, solicitor, professional accountant or other professional adviser.
If you have sold or transferred all your shares in China Telecom Corporation Limited, you should at once hand this circular together with the accompanying form of proxy to the purchaser or other transferee or to the bank, stockbroker or other agent through whom the sale or transfer was effected for transmission to the purchaser or transferee.
Hong Kong Exchanges and Clearing Limited and The Stock Exchange of Hong Kong Limited take no responsibility for the contents of this circular, make no representation as to its accuracy or completeness and expressly disclaim any liability whatsoever for any loss howsoever arising from or in reliance upon the whole or any part of the contents of this circular.
This circular is solely for the purpose of providing shareholders with certain information in connection with an annual general meeting of the Company and is not an offer to sell or a solicitation of an offer to buy any securities. Any sale of the Company’s securities in the United States will be made only by means of a prospectus relating to such securities.
China Telecom Corporation Limited
中国电信股份有限公司
(A joint stock limited company incorporated in the People’s Republic of China with limited liability)
(Stock Code: 728)
PROPOSED APPOINTMENT OF AUDITORS
AND
NOTICE OF ANNUAL GENERAL MEETING
A notice dated 8 April 2021 convening the Annual General Meeting of China Telecom Corporation Limited for the year 2020 to be held at Grand Ballroom, the Lobby Floor, Grand Hyatt Hong Kong, 1 Harbour Road, Wanchai, Hong Kong on Friday, 7 May 2021 at 11:00 a.m. is set out on pages 5 to 11 of this circular.
Whether or not you are able to attend the Annual General Meeting, you are requested to complete and return the enclosed form of proxy in accordance with the instructions printed thereon as soon as practicable and in any event by not later than 24 hours before the time appointed for holding the meeting or any adjournment thereof. Completion and return of the form of proxy will not preclude you from attending and voting in person at the meeting or at any adjournment thereof should you so wish.
PRECAUTIONARY MEASURES FOR THE ANNUAL GENERAL MEETING
In light of the continuing risks posed by the COVID-19 epidemic, and recent requirements for prevention and control of its spread, the Company will implement precautionary measures against COVID-19 at the Annual General Meeting for the sake of health and safety of our Shareholders, Directors, staff and other participants which include but not limited to:
| • | compulsory body temperature checks at the main entrance of Grand Hyatt Hong Kong’s lobby where the Annual General Meeting will be held. Any person who has a fever, i.e. with a body temperature shown on the hotel’s thermometer above 37 degrees Celsius, would not be allowed to access to the venue. Any denied entry to the venue shall also mean the person would not be allowed to attend the Annual General Meeting |
| • | mandatory use of surgical face masks during the attendance at the Annual General Meeting |
| • | the Company shall have the absolute discretion to refuse anyone who does not comply with the above precautionary measures, is subject to quarantine, has any flu-like symptoms or has travelled overseas within 14 days immediately before the Annual General Meeting, or has close contact with any person under quarantine or with recent overseas travel history access to the venue of the Annual General Meeting and attend the Annual General Meeting |
| • | appropriate distance and space will be maintained and as such, the Company may limit the number of attendees at the Annual General Meeting as appropriate to avoid over-crowding |
| • | the Company will not distribute corporate gifts or provide refreshments |
The Company recommends Shareholders to appoint the Chairman of the Annual General Meeting as their proxy to vote according to their indicated voting instructions in lieu of attending the Annual General Meeting in person. Depending on the development of the COVID-19 epidemic, the Company may implement further precautionary measures and may make relevant adjustments and arrangements for the Annual General Meeting and will issue further announcement as appropriate.
8 April 2021
CONTENTS
| Pages | ||||
Definitions | 1 | |||
Letter from the Board | 2 | |||
Notice of Annual General Meeting | 5 | |||
– i –
DEFINITIONS
In this circular, unless the context otherwise requires, the following terms and expressions have the following meanings:
“AGM” or “Annual General Meeting” | the annual general meeting of the Company to be convened on Friday, 7 May 2021, or any adjournment thereof, the notice of which is set out in this circular | |
“Articles of Association” | the articles of association of the Company, as amended, modified or otherwise supplemented from time to time | |
“Audit Committee” | the audit committee of the Company | |
“Board” | the board of Directors of the Company | |
“Company” | China Telecom Corporation Limited (中國電信股份有限公司), a joint stock limited company incorporated in the PRC with limited liability on 10 September 2002, with its H shares listed on the Main Board of the Stock Exchange and whose principal business is the provision of fundamental telecommunications services including comprehensive wireline telecommunications services, mobile telecommunications services, value-added services such as Internet access services, information services and other related services | |
“Directors” | the directors of the Company | |
“Group” | the Company and its subsidiaries | |
“Hong Kong” | Hong Kong Special Administrative Region of the PRC | |
“Listing Rules” | the Rules Governing the Listing of Securities on The Stock Exchange of Hong Kong Limited | |
“PRC” | the People’s Republic of China (excluding, for the purposes of this circular, Hong Kong, the Macau Special Administrative Region and Taiwan) | |
“RMB” | Renminbi, the lawful currency of the PRC | |
“Shareholders” | the shareholders of the Company | |
“Stock Exchange” or “HKSE” | The Stock Exchange of Hong Kong Limited | |
– 1 –
LETTER FROM THE BOARD
China Telecom Corporation Limited
中国电信股份有限公司
(A joint stock limited company incorporated in the People’s Republic of China with limited liability)
(Stock Code: 728)
Executive Directors: | Registered office: | |||
Ke Ruiwen | 31 Jinrong Street | |||
Li Zhengmao | Xicheng District | |||
Shao Guanglu | Beijing 100033, PRC | |||
Liu Guiqing | ||||
Zhu Min | Principal place of business in Hong Kong: | |||
| 28th Floor | ||||
Non-Executive Director: | Everbright Centre | |||
Chen Shengguang | 108 Gloucester Road | |||
| Wanchai, Hong Kong | ||||
Independent Non-Executive Directors: | ||||
Tse Hau Yin, Aloysius | ||||
Xu Erming | ||||
Wang Hsuehming | ||||
Yeung Chi Wai, Jason | ||||
| 8 April 2021 |
To the Shareholders
Dear Sir or Madam,
PROPOSED APPOINTMENT OF AUDITORS
AND
NOTICE OF ANNUAL GENERAL MEETING
| 1. | INTRODUCTION |
The purpose of this circular is to provide you with information regarding certain resolutions to be proposed at the AGM and to set out the notice of AGM.
At the AGM, amongst other things, an ordinary resolution will be proposed to approve the proposed appointment of auditors.
– 2 –
LETTER FROM THE BOARD
| 2. | PROPOSED APPOINTMENT OF AUDITORS |
Reference is made to the announcement with regard to the proposed change of auditors published by the Company on 9 March 2021.
Pursuant to the relevant regulations issued by the Ministry of Finance of the People’s Republic of China and the State-owned Assets Supervision and Administration Commission of the State Council, the service terms of Deloitte Touche Tohmatsu and Deloitte Touche Tohmatsu Certified Public Accountants LLP will expire soon. They will retire as the international auditor and domestic auditor of the Company effective upon the close of the AGM and will not be re-appointed. Pursuant to the open selection process and as recommended by the Audit Committee, the Board has resolved to propose to the Shareholders at the AGM to approve the appointments of PricewaterhouseCoopers and PricewaterhouseCoopers Zhong Tian LLP as the Company’s external auditors for the year ending 31 December 2021 and to authorise the Board to fix the remuneration of the auditors. The Audit Committee and the Board consider that the resolution regarding the proposed appointment of auditors is in the interests of the Company and the Shareholders as a whole. Accordingly, the Audit Committee and the Board recommend that all Shareholders vote in favour of the resolution to be proposed at the AGM.
Deloitte Touche Tohmatsu and Deloitte Touche Tohmatsu Certified Public Accountants LLP have confirmed in writing that there are no matters in relation to their retirement which should be brought to the attention of the Shareholders. The Board is not aware of any matters in relation to the proposed change of auditors that need to be brought to the attention of the Shareholders. The Board and the Audit Committee have also confirmed that there are no disagreement or outstanding matters between the Company and Deloitte Touche Tohmatsu and Deloitte Touche Tohmatsu Certified Public Accountants LLP.
| 3. | RECOMMENDATION |
The Board considers that all resolutions proposed at the AGM are in the interests of the Company and the Shareholders as a whole. Accordingly, the Board recommends that all Shareholders vote in favour of the resolutions to be proposed at the AGM.
| 4. | AGM |
A notice convening the AGM is set out on pages 5 to 11 of this circular. The relevant form of proxy is enclosed.
Whether or not Shareholders are able to attend the AGM, they are requested to complete and return the enclosed form of proxy to the Office of the Board of Directors of the Company for holders of domestic shares and to Computershare Hong Kong Investor Services Limited for holders of H Shares as soon as practicable and in any event by not later than 24 hours before the time designated for holding the AGM or any adjournment thereof. The Office of the Board of Directors of the Company is located at 31 Jinrong Street, Xicheng District, Beijing 100033, PRC. Computershare Hong Kong Investor Services Limited is located at 17M Floor, Hopewell Centre, 183 Queen’s Road East, Wanchai, Hong Kong. Completion and return of the form of proxy will not preclude Shareholders from attending and voting in person at the AGM should they so wish.
– 3 –
LETTER FROM THE BOARD
| 5. | PRECAUTIONARY MEASURES FOR THE ANNUAL GENERAL MEETING |
The Company will implement appropriate precautionary measures against the COVID-19 epidemic at the Annual General Meeting, details of which have been disclosed on the cover of this circular and page 11 of the notice of annual general meeting. Besides, in light of the continuing risks posed by the COVID-19 epidemic, the Company recommends Shareholders to appoint the Chairman of the Annual General Meeting as their proxy to vote according to their indicated voting instructions in lieu of attending the Annual General Meeting in person. In view of the travelling restrictions imposed by various jurisdictions including Hong Kong to prevent the spread of COVID-19, certain Director(s), Board Committees member(s), senior management and Supervisor(s) of the Company may attend the Annual General Meeting through video conference or other electronic means to answer Shareholders’ enquiries. The Company will closely monitor the development of COVID-19 and may make relevant adjustments and arrangements for the Annual General Meeting to the extent as permitted by applicable laws and regulations and will issue further announcement(s) for such adjustments or re-arrangements, if any, as appropriate.
By Order of the Board
China Telecom Corporation Limited
Ke Ruiwen
Chairman and Chief Executive Officer
– 4 –
NOTICE OF ANNUAL GENERAL MEETING
China Telecom Corporation Limited
中国电信股份有限公司
(A joint stock limited company incorporated in the People’s Republic of China with limited liability)
(Stock Code: 728)
NOTICE OF ANNUAL GENERAL MEETING
NOTICE IS HEREBY GIVEN that the annual general meeting of China Telecom Corporation Limited (the “Company”) for the year 2020 will be held at 11:00 a.m. on Friday, 7 May 2021 at Grand Ballroom, the Lobby Floor, Grand Hyatt Hong Kong, 1 Harbour Road, Wanchai, Hong Kong for the purpose of considering and, if thought fit, passing the following resolutions:
ORDINARY RESOLUTIONS
| 1. | THAT the consolidated financial statements of the Company, the report of the Board of Directors, the report of the Supervisory Committee and the report of the international auditor for the year ended 31 December 2020 be considered and approved, and the Board be authorised to prepare the budget of the Company for the year 2021. |
| 2. | THAT the profit distribution proposal and the declaration and payment of a final dividend for the year ended 31 December 2020 be considered and approved. |
| 3. | THAT the appointment of PricewaterhouseCoopers and PricewaterhouseCoopers Zhong Tian LLP as the external auditors of the Company for the year ending on 31 December 2021 be considered and approved, and the Board be authorised to fix the remuneration of the auditors. |
and to consider and approve other businesses (if any).
And as a special business, to consider and, if thought fit, pass the following as special resolutions:
– 5 –
NOTICE OF ANNUAL GENERAL MEETING
SPECIAL RESOLUTIONS
| 4. | THAT the granting of a general mandate to the Board to issue debentures denominated in local or foreign currencies, in one or more tranches in the PRC and overseas, including but not limited to, super short-term commercial papers, short-term commercial papers, medium term notes, perpetual bonds, company bonds, corporate bonds, convertible bonds, private placement notes, asset securitisation products and asset-backed notes (the “Debentures”), from the date of this meeting until the date on which the annual general meeting of the Company for the year 2021 is held, with a maximum aggregate outstanding repayment amount of up to RMB90 billion be and is hereby approved; THAT the Board or any two or more Directors of the Company duly authorised by the Board, taking into account the specific needs of the Company and market conditions, be and are hereby generally and unconditionally authorised to: |
| (a) | approve the type, specific terms and conditions of, and other matters relating to, the issue of debentures, including but not limited to, the determination of the type, amount, interest rate, term, rating, security, any repurchase or redemption provisions, any placing arrangements to the shareholders of the Company, any options to adjust the nominal interest rates, the use of proceeds, the application of the quota of unissued company bonds and corporate bonds to the issuance of other Debentures, as well as matters including securing approvals, engaging professional advisors, disseminating relevant application documents to the regulatory authorities, obtaining approvals from the regulatory authorities, executing all requisite legal documentation relating to the issue as requested by the regulatory authorities and making relevant disclosure; |
| (b) | do all such acts which are necessary and incidental to the issue of debentures (including, but not limited to, the securing of approvals, the determination of underwriting arrangements, preparation and dissemination of relevant application documents to the regulatory authorities, and the securing of approvals from the regulatory authorities); and |
| (c) | take all such steps which are necessary for the purposes of executing the issue of debentures (including, but not limited to, the execution of all requisite documentation and the disclosure of relevant information in accordance with applicable laws) and to the extent that any of the aforementioned acts and steps that have already been undertaken by the Board or the duly authorised Directors in connection with the issue of debentures, be and are hereby approved, confirmed and ratified; |
and THAT with respect to the Company’s issue of the aforementioned Debentures with an aggregate amount of RMB90 billion, do the centralised registration of super short-term commercial papers, short-term commercial papers, medium term notes and perpetual bonds in accordance with the registration rules published by the National Association of Financial Market Institutional Investors; THAT with respect to the Company’s issue of the aforementioned Debentures with an aggregate amount of RMB90 billion, register high quality entity corporate bonds with an aggregate amount not exceeding RMB30 billion in accordance with the relevant rules of the National Development and Reform Commission.
– 6 –
NOTICE OF ANNUAL GENERAL MEETING
| 5. | THAT with respect to the Company’s issue of the aforementioned Debentures with an aggregate amount of RMB90 billion, within which the issue of company bonds in the PRC in one or more tranches not exceeding RMB30 billion be and is hereby approved with: |
| (a) | Size of issue: Up to RMB30 billion. |
| (b) | Placing arrangements to the shareholders of the Company: The company bonds will not be issued to existing shareholders of the Company on a preferred basis by way of placing. |
| (c) | Term: The company bonds will have a term not exceeding 10 years and may have one fixed term, or a mix of different terms, which will be determined in accordance with the market conditions and the Company’s capital requirements. |
| (d) | Use of proceeds: The issuance of company bonds shall meet the requirements for repayment of interest-bearing debts, replenishing the operating working capital of the Company or for the purposes of investments in fixed assets and projects, etc. |
| (e) | Effective period: The resolution will be effective from the date on which this resolution is passed until the date on which the annual general meeting of the Company for the year 2021 is held; |
and THAT the Board or any two or more Directors of the Company duly authorised by the Board be and are hereby generally and unconditionally authorised to:
| (a) | approve the type, specific terms and conditions of, and other matters relating to, the issue (including but not limited to, the determination of the type, amount, interest rate, term, rating, security, whether there will be repurchase or redemption provisions, whether there will be an option to adjust the nominal interest rate, the application of the quota of unissued company bonds to the issuance of other Debentures, specific arrangements relating to the use of proceeds within the scope approved by the Shareholders in this meeting and all matters relating to the issue); |
– 7 –
NOTICE OF ANNUAL GENERAL MEETING
| (b) | do all such acts which are necessary and incidental to the issue (including, but not limited to, the securing of approvals, engaging professional advisors, the determination of underwriting arrangements, preparation and dissemination of relevant application documents to the regulatory authorities, and the securing of approvals from the regulatory authorities); |
| (c) | take all such steps which are necessary for the purposes of executing the issue (including, but not limited to, the execution of all requisite documentation and the disclosure of relevant information in accordance with applicable laws), and to the extent that any of the above acts and steps that have already been undertaken by the Board or the Directors in connection with the issue, be and are hereby approved, confirmed and ratified; |
| (d) | if there are changes in the regulatory policies or market conditions, adjust the specific proposal relating to the issue and related matters in accordance with the opinion of the regulatory authorities; and |
| (e) | after completion of the issue, determine and approve matters relating to the listing of the relevant debentures. |
| 6. | THAT: |
| (a) | subject to paragraph (c) below, the exercise by the Board during the Relevant Period (as hereinafter defined) of all the powers of the Company to allot, issue and deal with additional shares of the Company and to make or grant offers, agreements and options which might require the exercise of such powers be hereby generally and unconditionally approved; |
| (b) | the approval in paragraph (a) shall authorise the Board during the Relevant Period to make or grant offers, agreements and options which might require the exercise of such powers after the end of the Relevant Period; |
| (c) | the amount of additional domestic shares or overseas-listed foreign-invested shares (“H Shares”) (as the case may be) allotted, issued and dealt with or agreed conditionally or unconditionally to be allotted, issued and dealt with either separately or concurrently by the Board pursuant to the approval in paragraph (a), otherwise than pursuant to (i) a Rights Issue (as hereinafter defined); or (ii) any scrip dividend or similar arrangement providing for the allotment of shares in lieu of the whole or part of a dividend on shares in accordance with the Articles of Association of the Company, shall not exceed 20% of each of the Company’s existing domestic shares and H Shares (as the case may be) in issue at the date of passing this special resolution; and |
– 8 –
NOTICE OF ANNUAL GENERAL MEETING
| (d) | for the purpose of this special resolution numbered 6: |
“Relevant Period” means the period from the passing of this special resolution numbered 6 until the earliest of:
| (i) | the conclusion of the next annual general meeting of the Company; |
| (ii) | the expiration of the 12 month-period following the passing of these special resolutions; and |
| (iii) | the date of revocation or variation of the authority given to the Board under these special resolutions by a special resolution of the Company’s Shareholders in a general meeting. |
“Rights Issue” means an offer of shares open for a period fixed by the Board to holders of shares on the register of members on a fixed record date in proportion to their holdings of such shares (subject to such exclusion or other arrangements as the Board may deem necessary or expedient in relation to fractional entitlements or having regard to any legal or practical restrictions or obligations under the laws of, or the requirement of, any recognised regulatory body or any stock exchange in any territory applicable to the Company) and an offer, allotment or issue of shares by way of rights shall be construed accordingly.
| (e) | the Board be authorised to increase the registered capital of the Company as to reflect the issue of shares in the Company authorised under this special resolution numbered 6, and to make such appropriate and necessary amendments to the Articles of Association of the Company as they think fit to reflect such increases in the registered capital of the Company and to take any other action and complete any formality required to effect such increase in the registered capital of the Company. |
By Order of the Board
China Telecom Corporation Limited
Wong Yuk Har
Company Secretary
Beijing, China, 8 April 2021
– 9 –
NOTICE OF ANNUAL GENERAL MEETING
Notes:
| (1) | Details of the resolutions stated above are set out in the 2020 annual report and the circular dated 8 April 2021 of the Company. |
| (2) | The H Share Register of Members of the Company will be closed, for the purpose of determining shareholders’ entitlement to attend the annual general meeting, from Monday, 3 May 2021 to Friday, 7 May 2021 (both days inclusive), during which period no transfer of H Shares will be registered. In order to attend the annual general meeting, all share transfers, accompanied by the relevant share certificates, must be lodged for registration with Computershare Hong Kong Investor Services Limited at Shops 1712-1716, 17th Floor, Hopewell Centre, 183 Queen’s Road East, Wanchai, Hong Kong, not later than 4:30 p.m. on Friday, 30 April 2021. Holders of H Shares who are registered with Computershare Hong Kong Investor Services Limited on Friday, 7 May 2021 are entitled to attend the annual general meeting. |
| (3) | The Board of Directors of the Company has recommended a final dividend of HK$0.125 per share (pre-tax) for the year ended 31 December 2020 and, if such proposed dividend distribution set out in resolution numbered 2 is approved by the shareholders, the final dividend will be distributed to those shareholders whose names appear on the Register of Members of the Company on Tuesday, 18 May 2021. The H Share Register of Members will be closed from Thursday, 13 May 2021 to Tuesday, 18 May 2021 (both days inclusive). In order to be entitled to the final dividend, holders of H Shares who have not registered the transfer documents are required to deposit the transfer documents together with the relevant share certificates at Computershare Hong Kong Investor Services Limited, at Shops 1712-1716, 17th Floor, Hopewell Centre, 183 Queen’s Road East, Wanchai, Hong Kong at or before 4:30 p.m.on Wednesday, 12 May 2021. |
| (4) | Each shareholder entitled to attend and vote at the annual general meeting may appoint one or more proxies to attend and vote on his behalf at the annual general meeting. A proxy need not be a shareholder of the Company. Each shareholder who wishes to appoint one or more proxies should read through the 2020 annual report and the circular dated 8 April 2021 of the Company. |
| (5) | To be valid, the form of proxy together with the power of attorney or other authorisation document (if any) signed by the authorised person or notarially certified power of attorney must be delivered to the Office of the Board of Directors of the Company (for holders of domestic shares) and to Computershare Hong Kong Investor Services Limited (for holders of H Shares) not less than 24 hours before the designated time for the holding of the annual general meeting or any adjournment thereof. The Office of the Board of Directors of the Company is located at 31 Jinrong Street, Xicheng District, Beijing 100033, PRC (Telephone: (8610) 5850 1800). Computershare Hong Kong Investor Services Limited is located at 17M Floor, Hopewell Centre, 183 Queen’s Road East, Wanchai, Hong Kong. Completion and return of a form of proxy will not preclude a shareholder from attending in person and voting at the annual general meeting if he so wishes. |
| (6) | Shareholders attending the annual general meeting in person or by proxy shall present their proof of identity. If the attending shareholder is a corporation, its legal representative or person authorised by the board of directors or other decision making authority shall present a copy of the relevant resolution of the board of directors or other decision making authority in order to attend the annual general meeting. |
| (7) | All resolutions proposed at the annual general meeting will be voted by poll. |
| (8) | The annual general meeting is expected to last for half a day and shareholders (in person or by proxy) attending the annual general meeting shall be responsible for their own transport and accommodation expenses. |
– 10 –
NOTICE OF ANNUAL GENERAL MEETING
| (9) | PRECAUTIONARY MEASURES FOR THE ANNUAL GENERAL MEETING |
In light of the continuing risks posed by the COVID-19 epidemic, and recent requirements for prevention and control of its spread, the Company will implement precautionary measures against COVID-19 at the Annual General Meeting for the sake of health and safety of our Shareholders, Directors, staff and other participants which include but not limited to:
| • | compulsory body temperature checks at the main entrance of Grand Hyatt Hong Kong’s lobby where the Annual General Meeting will be held. Any person who has a fever, i.e. with a body temperature shown on the hotel’s thermometer above 37 degrees Celsius, would not be allowed to access to the venue. Any denied entry to the venue shall also mean the person would not be allowed to attend the Annual General Meeting |
| • | mandatory use of surgical face masks during the attendance at the Annual General Meeting |
| • | the Company shall have the absolute discretion to refuse anyone who does not comply with the above precautionary measures, is subject to quarantine, has any flu-like symptoms or has travelled overseas within 14 days immediately before the Annual General Meeting, or has close contact with any person under quarantine or with recent overseas travel history access to the venue of the Annual General Meeting and attend the Annual General Meeting |
| • | appropriate distance and space will be maintained and as such, the Company may limit the number of attendees at the Annual General Meeting as appropriate to avoid over-crowding |
| • | the Company will not distribute corporate gifts or provide refreshments |
The Company recommends Shareholders to appoint the Chairman of the Annual General Meeting as their proxy to vote according to their indicated voting instructions in lieu of attending the Annual General Meeting in person. Depending on the development of the COVID-19 epidemic, the Company may implement further precautionary measures and may make relevant adjustments and arrangements for the Annual General Meeting and will issue further announcement as appropriate.
| (10) | Shareholders are advised to call the Company’s hotline at (852) 2877 9777 or browse the Company’s website (www.chinatelecom-h.com) for the latest arrangements of the annual general meeting in the event that a Typhoon Signal No. 8 (or above), a Black Rainstorm Warning Signal or extreme conditions are in force on the day of the annual general meeting. |
| (11) | The English translation of this Notice is for reference only, and in case of any inconsistency, the Chinese version shall prevail. |
As at the date of this notice, the Board of Directors of the Company consists of Mr. Ke Ruiwen (as the Chairman and Chief Executive Officer); Mr. Li Zhengmao (as the President and Chief Operating Officer); Mr. Shao Guanglu; Mr. Liu Guiqing and Madam Zhu Min (as the Chief Financial Officer) (all as the Executive Vice Presidents); Mr. Chen Shengguang (as the Non-Executive Director); Mr. Tse Hau Yin, Aloysius, Mr. Xu Erming, Madam Wang Hsuehming and Mr. Yeung Chi Wai, Jason (all as the Independent Non-Executive Directors).
– 11 –