UNITED STATES
SECURITIES AND EXCHANGE COMMISSION
WASHINGTON, D.C. 20549
FORM N-CSR
CERTIFIED SHAREHOLDER REPORT OF REGISTERED
MANAGEMENT INVESTMENT COMPANIES
Investment Company Act file number 811-21208
Oppenheimer Dividend Opportunity Fund
(Exact name of registrant as specified in charter)
6803 South Tucson Way, Centennial, Colorado 80112-3924
(Address of principal executive offices) (Zip code)
Arthur S. Gabinet
OFI Global Asset Management, Inc.
225 Liberty Street, New York, New York 10281-1008
(Name and address of agent for service)
Registrant’s telephone number, including area code: (303) 768-3200
Date of fiscal year end: April 30
Date of reporting period: 10/31/2014
Item 1. Reports to Stockholders.
Table of Contents
Class A Shares
AVERAGE ANNUAL TOTAL RETURNS AT 10/31/14
| | | | | | | | | | | | |
| | | Class A Shares of the Fund | | | | |
| | | Without Sales Charge | | | | With Sales Charge | | | | Russell 3000 Value
Index | | S&P 500 Index |
6-Month | | 3.63% | | | | -2.33% | | | | 5.97% | | 8.22% |
1-Year | | 9.29 | | | | 3.01 | | | | 15.76 | | 17.27 |
5-Year | | 10.27 | | | | 8.97 | | | | 16.47 | | 16.69 |
10-Year | | 5.78 | | | | 5.15 | | | | 7.89 | | 8.20 |
Performance data quoted represents past performance, which does not guarantee future results. The investment return and principal value of an investment in the Fund will fluctuate so that an investor’s shares, when redeemed, may be worth more or less than their original cost. Fund returns include changes in share price, reinvested distributions, and a 5.75% maximum applicable sales charge except where “without sales charge” is indicated. Current performance may be lower or higher than the performance quoted. Returns do not consider capital gains or income taxes on an individual’s investment. Returns for periods of less than one year are cumulative and not annualized. For performance data current to the most recent month-end, visit oppenheimerfunds.com or call 1.800.CALL OPP (225.5677).
2 OPPENHEIMER DIVIDEND OPPORTUNITY FUND
Fund Performance Discussion
The Fund’s Class A shares (without sales charge) produced a return of 3.63% during the reporting period, underperforming the Russell 3000 Value Index, which returned 5.97% during the same period. The Fund’s underperformance stemmed primarily from less favorable stock selection in the health care and financials sectors. The Fund outperformed the Index in the industrials and telecommunication services sectors due to stronger relative stock selection, and in the information technology sector, where stronger stock selection and an overweight position benefited performance. In addition, the Fund’s exposure to international companies also detracted from performance as the U.S. market significantly outperformed other global markets during the reporting period.
MARKET OVERVIEW
Equity markets were choppy for the six-month reporting period ended October 31, 2014. U.S. equities generally ended the reporting period with positive returns, and outperformed foreign equities, including European and emerging market equities. Over the first half of the reporting period, equity markets in the U.S. rebounded as economic data released in the second quarter was positive, with the economy finally regaining all of the jobs lost during the 2008 recession, and the U.S. stock market achieving record highs. The U.S. Department of Commerce later announced that U.S. Gross Domestic Product (“GDP”) rebounded at a robust 4.6% annualized rate during the second quarter. Markets were also buoyed by additional stimulative monetary policies enacted by central banks throughout the world, including the European Central Bank (the “ECB”).
The upward march of U.S. equity prices then paused in the third quarter of 2014, with large capitalization stocks mostly moving sideways, mid-capitalization stocks declining modestly, and small-capitalization stocks falling significantly. Smaller capitalization stocks generally exhibit greater sensitivity to the domestic economy and as the noise around expected Fed tightening got louder, the market worried that a slowing in domestic growth would negatively impact these stocks. Other macroeconomic concerns over the third quarter included geopolitical tensions in Ukraine and the Middle East, and falling oil prices. However, domestic equity markets rallied again in the closing weeks of the reporting period. In addition, the reporting period ended with the U.S. Department of Commerce announcing that U.S. GDP grew at an estimated 3.5% over the third quarter of 2014. That figure was later revised to 3.9%.
3 OPPENHEIMER DIVIDEND OPPORTUNITY FUND
FUND REVIEW
Top performing stocks for the Fund this reporting period included information technology holdings Intel Corp., Apple, Inc. and Microsoft Corp. Intel is a producer of microprocessors for desktop and notebook computers, smartphones, tablets, and computer servers. The company reported strong financial results during the reporting period, and benefited from solid growth in notebooks and convertible notebooks, which are tablets that convert to laptops. Apple benefited as excitement surrounding the introduction of two new iPhones, and the upcoming introduction of a new iWatch product, resulted in strong performance. Microsoft, the world’s largest software maker, announced cost cutting measures and has discontinued unpromising products, placing more emphasis on cloud-computing software delivered via the web. Microsoft also saw signs of improvement in the PC market, which drives sales of Windows and Office software.
Detractors from performance this reporting period included energy stocks BP plc, Seadrill Ltd. and HollyFrontier Corp. The companies, along with the broader energy sector, were negatively impacted by the sharp decline in oil prices during the reporting period. This price drop negatively impacted investor sentiment and made energy the worst performing sector in the Index.
STRATEGY & OUTLOOK
We remain optimistic about the U.S. economy and believe that, although there may be bumps along the road, the U.S. is on a path to sustainable recovery. As part of that view, we believe investment back into growth opportunities has the potential to benefit companies in the industrials sector focused on non-residential construction and housing. In addition, innovation and cyclical improvements have the potential to positively impact information technology; and we believe attractive investment opportunities exist within health care. Conversely, we remain less sanguine about the outlook for materials. Risk factors have increased recently around global growth – particularly in emerging economies but also now in certain developed economies – where we believe at period end that markets are in the process of adjusting expectations. In that light, we remain cautious about the longer term outlook for stocks with similar characteristics to bonds, such as real estate investment trusts (REITs) and those in the utilities sector, but believe a balanced approach is required. Though they have performed well recently, these stocks have historically reacted negatively to rises in interest rates which are at historically low levels. Management behavior towards the use of free cash flow continues to guide our investment decisions, and our search for companies poised for an unanticipated acceleration in return on invested capital is our constant imperative.
4 OPPENHEIMER DIVIDEND OPPORTUNITY FUND
While many investors focus on a short-term view when considering potential investments, the Fund utilizes in-depth fundamental research to identify companies that we believe are poised for an unanticipated acceleration in return on invested capital over a multi-year time horizon. We believe this longer-term
approach provides a more comprehensive outlook of potential investments by focusing on all three financial statements – income statement, balance sheet and statement of cash flows – and aids in finding companies whose generation and use of free cash flow we deem as yet to be fully reflected in the current stock price.
| | |
 | | 
Laton Spahr, CFA Portfolio Manager |
5 OPPENHEIMER DIVIDEND OPPORTUNITY FUND
Top Holdings and Allocations
TOP TEN COMMON STOCK HOLDINGS
| | | | |
Verizon Communications, Inc. | | | 4.0 | % |
Lorillard, Inc. | | | 4.0 | |
Merck & Co., Inc. | | | 3.6 | |
Microsoft Corp. | | | 2.7 | |
Intesa Sanpaolo SpA | | | 2.7 | |
Intel Corp. | | | 2.5 | |
Lockheed Martin Corp. | | | 2.3 | |
Apple, Inc. | | | 2.1 | |
JPMorgan Chase & Co. | | | 2.0 | |
BP plc, Sponsored ADR | | | 2.0 | |
Portfolio holdings and allocations are subject to change. Percentages are as of October 31, 2014, and are based on net assets. For more current Fund holdings, please visit oppenheimerfunds.com.
TOP TEN COMMON STOCK INDUSTRIES
| | | | |
Commercial Banks | | | 11.2 | % |
Oil, Gas & Consumable Fuels | | | 10.8 | |
Pharmaceuticals | | | 8.6 | |
Diversified Telecommunication Services | | | 7.5 | |
Electric Utilities | | | 4.4 | |
Tobacco | | | 4.3 | |
Technology Hardware, Storage & Peripherals | | | 3.3 | |
Food Products | | | 3.1 | |
Semiconductors & Semiconductor Equipment | | | 2.9 | |
Commercial Services & Supplies | | | 2.7 | |
Portfolio holdings and allocations are subject to change. Percentages are as of October 31, 2014, and are based on net assets.
SECTOR ALLOCATION
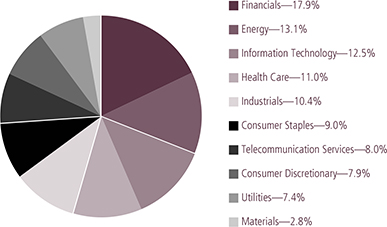
Portfolio holdings and allocations are subject to change. Percentages are as of October 31, 2014, and are based on the total market value of common stocks.
6 OPPENHEIMER DIVIDEND OPPORTUNITY FUND
Share Class Performance
AVERAGE ANNUAL RETURNS WITHOUT SALES CHARGE AS OF 10/31/14
| | | | | | | | | | | | | | | | | | | | |
| | | Inception Date | | | 6-Month | | | 1-Year | | | 5-Year | | | 10-Year | |
Class A (OSVAX) | | | 11/26/02 | | | | 3.63% | | | | 9.29% | | | | 10.27% | | | | 5.78% | |
Class B (OSVBX) | | | 2/27/04 | | | | 3.27% | | | | 8.50% | | | | 9.37% | | | | 5.23% | |
Class C (OSCVX) | | | 2/27/04 | | | | 3.27% | | | | 8.51% | | | | 9.41% | | | | 4.94% | |
Class I (OSVIX) | | | 8/28/14 | | | | -1.25% | * | | | N/A | | | | N/A | | | | N/A | |
Class R (OSVNX) | | | 2/27/04 | | | | 3.53% | | | | 9.09% | | | | 10.00% | | | | 5.49% | |
Class Y (OSVYX) | | | 2/27/04 | | | | 3.76% | | | | 9.58% | | | | 10.72% | | | | 6.19% | |
AVERAGE ANNUAL RETURNS WITH SALES CHARGE AS OF 10/31/14
| | | | | | | | | | | | | | | | | | | | |
| | | Inception Date | | | 6-Month | | | 1-Year | | | 5-Year | | | 10-Year | |
Class A (OSVAX) | | | 11/26/02 | | | | -2.33% | | | | 3.01% | | | | 8.97% | | | | 5.15% | |
Class B (OSVBX) | | | 2/27/04 | | | | -1.73% | | | | 3.50% | | | | 9.09% | | | | 5.23% | |
Class C (OSCVX) | | | 2/27/04 | | | | 2.27% | | | | 7.51% | | | | 9.41% | | | | 4.94% | |
Class I (OSVIX) | | | 8/28/14 | | | | -1.25% | * | | | N/A | | | | N/A | | | | N/A | |
Class R (OSVNX) | | | 2/27/04 | | | | 2.53% | | | | 8.09% | | | | 10.00% | | | | 5.49% | |
Class Y (OSVYX) | | | 2/27/04 | | | | 3.76% | | | | 9.58% | | | | 10.72% | | | | 6.19% | |
* Shows performance since inception.
Performance data quoted represents past performance, which does not guarantee future results. The investment return and principal value of an investment in the Fund will fluctuate so that an investor’s shares, when redeemed, may be worth more or less than their original cost. Current performance may be lower or higher than the performance quoted. Returns do not consider capital gains or income taxes on an individual’s investment. For performance data current to the most recent month-end, visit oppenheimerfunds.com or call 1.800.CALL OPP (225.5677). Fund returns include changes in share price, reinvested distributions, and the applicable sales charge: for Class A shares, the current maximum initial sales charge of 5.75%; for Class B shares, the contingent deferred sales charge of 5% (1-year) and 2% (5-year); and for Class C shares, the contingent deferred sales charge (“CDSC”) of 1% for the 1-year period. Prior to 7/1/14, Class R shares were named Class N shares. Beginning 7/1/14, new purchases of Class R shares will no longer be subject to a CDSC upon redemption (any CDSC will remain in effect for purchases prior to 7/1/14). There is no sales charge for Class I and Class Y shares. Because Class B shares convert to Class A shares 72 months after purchase, the 10-year return for Class B shares uses Class A performance for the period after conversion.
The Fund’s performance is compared to the Russell 3000 Value Index and the S&P 500 Index. The Russell 3000 Value Index measures the performance of the broad value segment of the U.S. equity universe. It includes those Russell 3000 companies with lower price-to-book ratios and lower forecasted growth values. The S&P 500 Index is a capitalization-weighted index of 500 stocks intended to be a representative sample of leading companies in leading industries within the U.S. economy. The indices are unmanaged and cannot be purchased directly by
7 OPPENHEIMER DIVIDEND OPPORTUNITY FUND
investors. While index comparisons may be useful to provide a benchmark for the Fund’s performance, it must be noted that the Fund’s investments are not limited to the investments comprising the indices. Index performance includes reinvestment of income, but does not reflect transaction costs, fees, expenses or taxes. Index performance is shown for illustrative purposes only as a benchmark for the Fund’s performance, and does not predict or depict performance of the Fund. The Fund’s performance reflects the effects of the Fund’s business and operating expenses.
The Fund’s investment strategy and focus can change over time. The mention of specific fund holdings does not constitute a recommendation by OppenheimerFunds, Inc. or its affiliates.
Before investing in any of the Oppenheimer funds, investors should carefully consider a fund’s investment objectives, risks, charges and expenses. Fund prospectuses and summary prospectuses contain this and other information about the funds, and may be obtained by asking your financial advisor, visiting oppenheimerfunds.com, or calling 1.800.CALL OPP (225.5677). Read prospectuses and summary prospectuses carefully before investing.
Shares of Oppenheimer funds are not deposits or obligations of any bank, are not guaranteed by any bank, are not insured by the FDIC or any other agency, and involve investment risks, including the possible loss of the principal amount invested.
8 OPPENHEIMER DIVIDEND OPPORTUNITY FUND
Fund Expenses
Fund Expenses. As a shareholder of the Fund, you incur two types of costs: (1) transaction costs, which may include sales charges (loads) on purchase payments, contingent deferred sales charges on redemptions; and (2) ongoing costs, including management fees; distribution and service fees; and other Fund expenses. These examples are intended to help you understand your ongoing costs (in dollars) of investing in the Fund and to compare these costs with the ongoing costs of investing in other mutual funds.
The examples are based on an investment of $1,000.00 invested at the beginning of the period and held for the entire 6-month period ended October 31, 2014.
Actual Expenses. The first section of the table provides information about actual account values and actual expenses. You may use the information in this section for the class of shares you hold, together with the amount you invested, to estimate the expense that you paid over the period. Simply divide your account value by $1,000.00 (for example, an $8,600.00 account value divided by $1,000.00 = 8.60), then multiply the result by the number in the first section under the heading entitled “Expenses Paid During 6 Months Ended October 31, 2014” to estimate the expenses you paid on your account during this period.
Hypothetical Example for Comparison Purposes. The second section of the table provides information about hypothetical account values and hypothetical expenses based on the Fund’s actual expense ratio for each class of shares, and an assumed rate of return of 5% per year for each class before expenses, which is not the Fund’s actual return. The hypothetical account values and expenses may not be used to estimate the actual ending account balance or expenses you paid for the period. You may use this information to compare the ongoing costs of investing in the Fund and other funds. To do so, compare this 5% hypothetical example for the class of shares you hold with the 5% hypothetical examples that appear in the shareholder reports of the other funds.
Please note that the expenses shown in the table are meant to highlight your ongoing costs only and do not reflect any transactional costs, such as front-end or contingent deferred sales charges (loads). Therefore, the “hypothetical” section of the table is useful in comparing ongoing costs only, and will not help you determine the relative total costs of owning different funds. In addition, if these transactional costs were included, your costs would have been higher.
9 OPPENHEIMER DIVIDEND OPPORTUNITY FUND
| | | | |
| | |
| | FUND EXPENSES (Continued) | | |
| | | | | | | | | | | | | | |
| Actual | | Beginning
Account
Value
May 1, 2014 | | | Ending Account Value October 31, 2014 | | | Expenses
Paid During 6 Months Ended
October 31, 2014 | | | |
|
Class A | | $ | 1,000.00 | | | $ | 1,036.30 | | | $ | 5.97 | | | |
|
Class B | | | 1,000.00 | | | | 1,032.70 | | | | 9.88 | | | |
|
Class C | | | 1,000.00 | | | | 1,032.70 | | | | 9.88 | | | |
|
Class I | | | 1,000.00 | | | | 987.50 | * | | | 1.27 | | | |
|
Class R | | | 1,000.00 | | | | 1,035.30 | | | | 7.26 | | | |
|
Class Y | | | 1,000.00 | | | | 1,037.60 | | | | 4.63 | | | |
* Shows performance since inception on 8/28/14. | | | | | | | | | | | | | | |
| | | | |
Hypothetical | | | | | | | | | | | | | | |
(5% return before expenses) | | | | | | | | | | | | | | |
|
Class A | | | 1,000.00 | | | | 1,019.36 | | | | 5.92 | | | |
|
Class B | | | 1,000.00 | | | | 1,015.53 | | | | 9.80 | | | |
|
Class C | | | 1,000.00 | | | | 1,015.53 | | | | 9.80 | | | |
|
Class I | | | 1,000.00 | | | | 1,021.58 | | | | 3.68 | | | |
|
Class R | | | 1,000.00 | | | | 1,018.10 | | | | 7.20 | | | |
|
Class Y | | | 1,000.00 | | | | 1,020.67 | | | | 4.59 | | | |
Expenses are equal to the Fund’s annualized expense ratio for that class, multiplied by the average account value over the period, multiplied by 184/365 (to reflect the one-half year period). Those annualized expense ratios, excluding indirect expenses from affiliated funds, based on the 6-month period ended October 31, 2014 are as follows:
| | | | |
| Class | | Expense Ratios | |
| |
Class A | | | 1.16% | |
| |
Class B | | | 1.92 | |
| |
Class C | | | 1.92 | |
| |
Class I | | | 0.72 | |
| |
Class R | | | 1.41 | |
| |
Class Y | | | 0.90 | |
The expense ratios reflect voluntary and/or contractual waivers and/or reimbursements of expenses by the Fund’s Manager and Transfer Agent. Some of these undertakings may be modified or terminated at any time, as indicated in the Fund’s prospectus. The “Financial Highlights” tables in the Fund’s financial statements, included in this report, also show the gross expense ratios, without such waivers or reimbursements and reduction to custodian expenses, if applicable.
10 OPPENHEIMER DIVIDEND OPPORTUNITY FUND
STATEMENT OF INVESTMENTS October 31, 2014 Unaudited
| | | | | | | | | | |
| | | Shares | | | | Value | | | |
| | | |
Common Stocks—93.7% | | | |
| | | |
Consumer Discretionary—7.4% | | | |
| | | |
Automobiles—1.1% | | | |
Ford Motor Co. | | | 160,240 | | | $ | 2,257,782 | | | |
| | | | | | | | | | |
| | | |
Hotels, Restaurants & Leisure—0.7% | | | | | | | |
McDonald’s Corp. | | | 14,340 | | | | 1,344,088 | | | |
| | | | | | | | | | |
| | | |
Household Durables—2.4% | | | | | | | | | | |
Garmin Ltd. | | | 18,930 | | | | 1,050,237 | | | |
| | | |
Newell Rubbermaid, Inc. | | | 84,140 | | | | 2,804,386 | | | |
| | | |
Sekisui House Ltd. | | | 84,000 | | | | 1,051,055 | | | |
| | | | | | | | | | |
| | | | 4,905,678 | | | |
| | | | | | | | | | |
| | | |
Media—2.1% | | | | | | | | | | |
Cinemark Holdings, Inc. | | | 48,490 | | | | 1,712,667 | | | |
| | | |
Gannett Co., Inc. | | | 39,880 | | | | 1,256,220 | | | |
| | | |
National CineMedia, Inc. | | | 85,230 | | | | 1,355,157 | | | |
| | | | | | | | | | |
| | | | 4,324,044 | | | |
| | | | | | | | | | |
| | | |
Specialty Retail—1.1% | | | | | | | | | | |
GameStop Corp., Cl. A | | | 26,850 | | | | 1,148,106 | | | |
| | | |
Staples, Inc. | | | 79,880 | | | | 1,012,878 | | | |
| | | | | | | | | | |
| | | | 2,160,984 | | | |
| | | | | | | |
| | | |
Consumer Staples—8.5% | | | | | | | | | | |
| | | |
Food Products—3.1% | | | | | | | | | | |
B&G Foods, Inc. | | | 47,990 | | | | 1,413,785 | | | |
| | | |
ConAgra Foods, Inc. | | | 52,560 | | | | 1,805,436 | | | |
| | | |
Kraft Foods Group, Inc. | | | 53,040 | | | | 2,988,804 | | | |
| | | | | | | | | | |
| | | | 6,208,025 | | | |
| | | | | | | | | | |
| | | |
Household Products—1.1% | | | | | | | | | | |
Reckitt Benckiser Group plc | | | 27,850 | | | | 2,341,071 | | | |
| | | | | | | | | | |
| | | |
Tobacco—4.3% | | | | | | | | | | |
Lorillard, Inc. | | | 132,130 | | | | 8,125,995 | | | |
| | | |
Reynolds American, Inc. | | | 8,370 | | | | 526,557 | | | |
| | | | | | | | | | |
| | | | 8,652,552 | | | |
| | | | | | | | | | |
| | | |
Energy—12.2% | | | | | | | | | | |
| | | |
Energy Equipment & Services—1.4% | | | | | | | |
Diamond Offshore Drilling, Inc. | | | 22,540 | | | | 849,984 | | | |
| | | |
Seadrill Ltd. | | | 47,840 | | | | 1,100,320 | | | |
| | | | | | | | |
| | | Shares | | | | Value | |
| |
Energy Equipment & Services (Continued) | |
| |
Transocean Ltd. | | | 31,310 | | | $ | 933,977 | |
| | | | | | | | |
| | | | 2,884,281 | |
| | | | | | | | |
| |
Oil, Gas & Consumable Fuels—10.8% | |
BP plc, Sponsored ADR | | | 93,040 | | | | 4,043,518 | |
| |
Enbridge, Inc. | | | 52,920 | | | | 2,506,291 | |
| |
HollyFrontier Corp. | | | 42,110 | | | | 1,910,952 | |
| |
Occidental Petroleum Corp. | | | 36,850 | | | | 3,277,070 | |
| |
| Royal Dutch Shell plc, Cl. A, Sponsored ADR | | | 42,972 | | | | 3,084,960 | |
| |
Ship Finance International Ltd. | | | 119,950 | | | | 2,061,941 | |
| |
Statoil ASA, ADR | | | 50,620 | | | | 1,161,729 | |
| |
Suncor Energy, Inc. | | | 110,010 | | | | 3,909,755 | |
| | | | | | | | |
| | | | 21,956,216 | |
| | | | | |
| |
Financials—16.8% | | | | | | | | |
| |
Capital Markets—1.0% | | | | | | | | |
Apollo Global Management LLC, Cl. A | | | 50,468 | | | | 1,148,147 | |
| |
Ares Management LP | | | 60,288 | | | | 957,373 | |
| | | | | | | | |
| | | | 2,105,520 | |
| | | | | |
| |
Commercial Banks—11.2% | | | | | | | | |
| Banco Bilbao Vizcaya Argentaria SA, Sponsored ADR | | | 251,800 | | | | 2,810,088 | |
| |
Bank of Montreal | | | 21,860 | | | | 1,587,036 | |
| |
BB&T Corp. | | | 44,730 | | | | 1,694,373 | |
| |
Fifth Third Bancorp | | | 126,030 | | | | 2,519,340 | |
| |
HSBC Holdings plc, Sponsored ADR | | | 38,430 | | | | 1,960,699 | |
| |
Intesa Sanpaolo SpA | | | 1,870,783 | | | | 5,491,878 | |
| |
JPMorgan Chase & Co. | | | 66,880 | | | | 4,044,902 | |
| |
Sumitomo Mitsui Financial Group, Inc. | | | 25,600 | | | | 1,040,648 | |
| |
Umpqua Holdings Corp. | | | 90,060 | | | | 1,585,056 | |
| | | | | | | | |
| | | | 22,734,020 | |
| | | | | | | | |
| |
Consumer Finance—0.6% | | | | | | | | |
Navient Corp. | | | 58,906 | | | | 1,165,161 | |
11 OPPENHEIMER DIVIDEND OPPORTUNITY FUND
STATEMENT OF INVESTMENTS Unaudited / Continued
| | | | | | | | | | |
| | | Shares | | | Value | | | |
| | | |
Diversified Financial Services—1.1% | | | | | | | |
CME Group, Inc. | | | 25,540 | | | $ | 2,140,507 | | | |
| | | | | | | | | | |
| | | |
Insurance—0.8% | | | | | | | | | | |
Sampo Oyj, Cl. A | | | 33,220 | | | | 1,591,463 | | | |
| | | | | | | | | | |
| | | |
Real Estate Investment Trusts (REITs)—2.1% | | | |
Equity Residential | | | 33,430 | | | | 2,325,391 | | | |
| | | |
Omega Healthcare Investors, Inc. | | | 51,720 | | | | 1,973,635 | | | |
| | | | | | | | | | |
| | | | 4,299,026 | | | |
| | | | | | | |
| | | |
Health Care—10.3% | | | |
| | | |
Health Care Equipment & Supplies—1.7% | | | |
Baxter International, Inc. | | | 49,100 | | | | 3,443,874 | | | |
| | | | | | | | | | |
| | | |
Pharmaceuticals—8.6% | | | | | | | | | | |
Eli Lilly & Co. | | | 15,210 | | | | 1,008,879 | | | |
| | | |
Merck & Co., Inc. | | | 126,530 | | | | 7,331,148 | | | |
| | | |
Pfizer, Inc. | | | 52,550 | | | | 1,573,873 | | | |
| | | |
Roche Holding AG, Sponsored ADR | | | 70,790 | | | | 2,605,780 | | | |
| | | |
Sanofi, ADR | | | 57,110 | | | | 2,640,766 | | | |
| | | |
Takeda Pharmaceutical Co. Ltd. | | | 51,500 | | | | 2,246,491 | | | |
| | | | | | | | | | |
| | | | 17,406,937 | | | |
| | | | | | | | | | |
| | | |
Industrials—9.8% | | | | | | | | | | |
| | | |
Aerospace & Defense—2.3% | | | | | | | | | | |
Lockheed Martin Corp. | | | 24,840 | | | | 4,733,759 | | | |
| | | | | | | | | | |
| | | |
Commercial Services & Supplies—2.7% | | | |
Deluxe Corp. | | | 34,530 | | | | 2,099,424 | | | |
| | | | | | | | | | |
| | | |
Waste Management, Inc. | | | 69,950 | | | | 3,419,856 | | | |
| | | | | | | | | | |
| | | | 5,519,280 | | | |
| | | | | | | | | | |
| | | |
Electrical Equipment—0.8% | | | |
Eaton Corp. plc | | | 24,690 | | | | 1,688,549 | | | |
| | | | | | | | | | |
| | | |
Industrial Conglomerates—1.3% | | | | | | | | | | |
General Electric Co. | | | 97,670 | | | | 2,520,863 | | | |
| | | | | | | | | | |
| | | |
Machinery—1.2% | | | | | | | | | | |
Caterpillar, Inc. | | | 23,790 | | | | 2,412,544 | | | |
| | | | | | | | | | |
| | | |
Trading Companies & Distributors—1.5% | | | |
ITOCHU Corp. | | | 243,100 | | | | 2,976,393 | | | |
| | | | | | | | | | |
| | | |
Information Technology—11.7% | | | | | | | | | | |
| | | |
Communications Equipment—1.5% | | | |
Cisco Systems, Inc. | | | 78,260 | | | | 1,915,022 | | | |
| | | | | | | | |
| | | Shares | | | Value | |
| |
Communications Equipment (Continued) | |
| |
Nokia OYJ, Sponsored ADR | | | 124,721 | | | $ | 1,031,443 | |
| | | | | | | | |
| | | | 2,946,465 | |
| | | | | | | | |
| |
Electronic Equipment, Instruments, & Components—1.3% | |
Hitachi Ltd. | | | 323,000 | | | | 2,593,488 | |
| | | | | | | | |
| |
Semiconductors & Semiconductor Equipment—2.9% | |
Intel Corp. | | | 148,350 | | | | 5,045,384 | |
| |
Microchip Technology, Inc. | | | 21,440 | | | | 924,278 | |
| | | | | | | | |
| | | | 5,969,662 | |
| | | | | | | | |
| |
Software—2.7% | | | | | | | | |
Microsoft Corp. | | | 117,310 | | | | 5,507,705 | |
| | | | | | | | |
| |
Technology Hardware, Storage & Peripherals—3.3% | |
Apple, Inc. | | | 40,292 | | | | 4,351,536 | |
| |
Seagate Technology plc | | | 38,480 | | | | 2,417,698 | |
| | | | | | | | |
| | | | 6,769,234 | |
| | | | | | | | |
| |
Materials—2.6% | | | | | | | | |
| |
Chemicals—2.6% | | | | | | | | |
LyondellBasell Industries NV, Cl. A | | | 16,729 | | | | 1,532,878 | |
| |
Nissan Chemical Industries Ltd. | | | 84,882 | | | | 1,601,988 | |
| |
Potash Corp. of Saskatchewan, Inc. | | | 63,683 | | | | 2,176,048 | |
| | | | | | | | |
| | | | 5,310,914 | |
| | | | | | | | |
| |
Telecommunication Services—7.5% | |
| |
Diversified Telecommunication Services—7.5% | |
AT&T, Inc. | | | 52,600 | | | | 1,832,584 | |
| |
CenturyLink, Inc. | | | 44,350 | | | | 1,839,638 | |
| |
Inmarsat plc | | | 122,270 | | | | 1,331,681 | |
| |
Verizon Communications, Inc. | | | 162,370 | | | | 8,159,093 | |
| |
Windstream Holdings, Inc. | | | 190,810 | | | | 1,999,689 | |
| | | | | | | | |
| | | | 15,162,685 | |
| | | | | | | | |
| |
Utilities—6.9% | | | | | | | | |
| |
Electric Utilities—4.4% | | | | | | | | |
American Electric Power Co., Inc. | | | 31,890 | | | | 1,860,462 | |
| |
Duke Energy Corp. | | | 24,480 | | | | 2,011,032 | |
| |
Edison International | | | 24,310 | | | | 1,521,320 | |
| |
Entergy Corp. | | | 24,030 | | | | 2,019,001 | |
12 OPPENHEIMER DIVIDEND OPPORTUNITY FUND
STATEMENT OF INVESTMENTS Unaudited / Continued
| | | | | | | | | | |
| | | Shares | | | Value | | | |
| | | |
Electric Utilities (Continued) | | | |
| | | |
Iberdrola SA | | | 141,411 | | | $ | 1,000,371 | | | |
| | | |
UIL Holdings Corp. | | | 12,110 | | | | 498,205 | | | |
| | | | | | | | | | |
| | | | 8,910,391 | | | |
| | | | | | | |
| | | |
Multi-Utilities—2.5% | | | | | | | | | | |
Ameren Corp. | | | 63,990 | | | | 2,709,336 | | | |
| | | |
PG&E Corp. | | | 18,480 | | | | 929,914 | | | |
| | | |
SCANA Corp. | | | 27,420 | | | | 1,505,084 | | | |
| | | | | | | | | | |
| | | | 5,144,334 | | | |
| | | | | | | | | | |
Total Common Stocks (Cost $170,663,720) | | | | 190,087,495 | | | |
| | | | | | | | | | |
| | | |
Structured Security—2.5% | | | |
| | | |
Goldman Sachs Group, Inc. (The), Bank of American Corp., Broadcom Corp., Rite Aid Corp., Semtech Corp. Equity Linked Nts., 12/15/141,2 (Cost $5,002,000) | | | 50,000 | | | | 5,099,990 | | | |
| | | | | | | | | | |
| | | | | | | | |
| | | Shares | | | Value | |
| |
Investment Company—2.7% | |
| |
| Oppenheimer Institutional Money Market Fund, Cl. E, 0.08%3,4 (Cost $5,534,803) | | | 5,534,803 | | | $ | 5,534,803 | |
| |
| Total Investments, at Value (Cost $181,200,523) | | | 98.9 | % | | | 200,722,288 | |
| |
Net Other Assets (Liabilities) | | | 1.1 | | | | 2,133,020 | |
| | | | |
Net Assets | | | 100.0 | % | | $ | 202,855,308 | |
| | | | |
| | | | |
Footnotes to Statement of Investments
1. Non-income producing security.
2. Represents securities sold under Rule 144A, which are exempt from registration under the Securities Act of 1933, as amended. These securities have been determined to be liquid under guidelines established by the Board of Trustees. These securities amount to $5,099,990 or 2.51% of the Fund’s net assets as of October 31, 2014.
3. Rate shown is the 7-day yield as of October 31, 2014.
4. Is or was an affiliate, as defined in the Investment Company Act of 1940, as amended, at or during the period ended October 31, 2014, by virtue of the Fund owning at least 5% of the voting securities of the issuer or as a result of the Fund and the issuer having the same investment adviser. Transactions during the period in which the issuer was an affiliate are as follows:
| | | | | | | | | | | | | | | | |
| | | Shares
April 30, 2014 | | | Gross
Additions | | | Gross Reductions | | | Shares
October 31, 2014 | |
| |
Oppenheimer Institutional Money Market Fund, Cl. E | | | 2,835,339 | | | | 29,665,783 | | | | 26,966,319 | | | | 5,534,803 | |
| | | | |
| | | | | | | | | Value | | | Income | |
| |
Oppenheimer Institutional Money Market Fund, Cl. E | | | | | | | $ | 5,534,803 | | | $ | 1,156 | |
| | | | | | | | | | | | | | | | | | | | | | | | | | | | |
Forward Currency Exchange Contracts as of October 31, 2014 | |
| Counterparty | | Settlement
Month(s) | | | Currency
Purchased
(000’s) | | | Currency Sold
(000’s) | | | Unrealized
Appreciation | | | Unrealized
Depreciation | |
CITNA-B | | | 11/2014 | | | | USD | | | | 6,733 | | | | EUR | | | | 5,100 | | | $ | 341,084 | | | $ | — | |
JPM | | | 01/2015 | | | | JPY | | | | 310,000 | | | | USD | | | | 2,926 | | | | — | | | | 164,265 | |
RBS | | | 01/2015 | | | | USD | | | | 13,365 | | | | JPY | | | | 1,443,000 | | | | 507,772 | | | | — | |
| | | | | | | | | | | | | | | | | | | | | | | | |
Total Unrealized Appreciation and Depreciation | | | | | | | | | | | | | | | | | | | | | | $ | 848,856 | | | $ | 164,265 | |
| | | | | | | | | | | | | | | | | | | | | | | | |
| | | | | | | | | | | | | | | | | | | | | | | | |
13 OPPENHEIMER DIVIDEND OPPORTUNITY FUND
STATEMENT OF INVESTMENTS Unaudited / Continued
| | |
Glossary: | | |
Counterparty Abbreviations |
CITNA-B | | Citibank NA |
JPM | | JPMorgan Chase Bank NA |
RBS | | Royal Bank of Scotland plc (The) |
|
Currency abbreviations indicate amounts reporting in currencies |
EUR | | Euro |
JPY | | Japanese Yen |
See accompanying Notes to Financial Statements.
14 OPPENHEIMER DIVIDEND OPPORTUNITY FUND
STATEMENT OF ASSETS AND LIABILITIES October 31, 2014 Unaudited
| | | | |
Assets | | | | |
Investments, at value—see accompanying statement of investments: | | | | |
Unaffiliated companies (cost $175,665,720) | | $ | 195,187,485 | |
Affiliated companies (cost $5,534,803) | | | 5,534,803 | |
| | | | |
| | | 200,722,288 | |
| |
Cash | | | 100,000 | |
| |
Unrealized appreciation on foreign currency exchange contracts | | | 848,856 | |
| |
Receivables and other assets: | | | | |
Shares of beneficial interest sold | | | 1,276,660 | |
Dividends | | | 417,691 | |
Other | | | 23,059 | |
| | | | |
Total assets | | | 203,388,554 | |
Liabilities | | | | |
Unrealized depreciation on foreign currency exchange contracts | | | 164,265 | |
| |
Payables and other liabilities: | | | | |
Shares of beneficial interest redeemed | | | 162,659 | |
Investments purchased | | | 101,198 | |
Distribution and service plan fees | | | 42,219 | |
Trustees’ compensation | | | 40,588 | |
Shareholder communications | | | 9,583 | |
Other | | | 12,734 | |
| | | | |
Total liabilities | | | 533,246 | |
|
| |
Net Assets | | $ | 202,855,308 | |
| | | | |
|
| |
Composition of Net Assets | | | | |
Par value of shares of beneficial interest | | $ | 10,115 | |
| |
Additional paid-in capital | | | 366,272,335 | |
| |
Accumulated net investment income | | | 280,386 | |
| |
Accumulated net realized loss on investments and foreign currency transactions | | | (183,907,902) | |
| |
Net unrealized appreciation on investments and translation of assets and liabilities denominated in foreign currencies | | | 20,200,374 | |
| | | | |
Net Assets | | $ | 202,855,308 | |
| | | | |
15 OPPENHEIMER DIVIDEND OPPORTUNITY FUND
STATEMENT OF ASSETS AND LIABILITIES Unaudited / Continued
| | | | |
Net Asset Value Per Share | | | | |
| |
Class A Shares: | | | | |
| |
| Net asset value and redemption price per share (based on net assets of $137,573,178 and 6,805,669 shares of beneficial interest outstanding) | | $ | 20.21 | |
Maximum offering price per share (net asset value plus sales charge of 5.75% of offering price) | | $ | 21.44 | |
| |
| |
Class B Shares: | | | | |
| |
| Net asset value, redemption price (excludes applicable contingent deferred sales charge) and offering price per share (based on net assets of $4,667,229 and 238,146 shares of beneficial interest outstanding) | | $ | 19.60 | |
| |
| |
Class C Shares: | | | | |
| |
| Net asset value, redemption price (excludes applicable contingent deferred sales charge) and offering price per share (based on net assets of $41,048,175 and 2,097,929 shares of beneficial interest outstanding) | | $ | 19.57 | |
| |
| |
Class I Shares: | | | | |
| |
| Net asset value, redemption price and offering price per share (based on net assets of $9,796 and 485 shares of beneficial interest outstanding) | | $ | 20.19 | |
| |
| |
Class R Shares: | | | | |
| |
| Net asset value, redemption price (excludes applicable contingent deferred sales charge) and offering price per share (based on net assets of $9,374,248 and 468,033 shares of beneficial interest outstanding) | | $ | 20.03 | |
| |
| |
Class Y Shares: | | | | |
| |
| Net asset value, redemption price and offering price per share (based on net assets of $10,182,682 and 504,301 shares of beneficial interest outstanding) | | $ | 20.19 | |
See accompanying Notes to Financial Statements.
16 OPPENHEIMER DIVIDEND OPPORTUNITY FUND
STATEMENT OF
OPERATIONS For the Six Months Ended October 31, 2014 Unaudited
| | | | |
Investment Income | | | | |
| |
Dividends: | | | | |
Unaffiliated companies (net of foreign withholding taxes of $145,907) | | $ | 3,984,994 | |
Affiliated companies | | | 1,156 | |
| |
Interest | | | 26 | |
| | | | |
Total investment income | | | 3,986,176 | |
Expenses | | | | |
Management fees | | | 671,800 | |
| |
Distribution and service plan fees: | | | | |
Class A | | | 171,751 | |
Class B | | | 27,974 | |
Class C | | | 208,713 | |
Class R1 | | | 25,172 | |
| |
Transfer and shareholder servicing agent fees: | | | | |
Class A | | | 154,212 | |
Class B | | | 6,164 | |
Class C | | | 46,042 | |
Class I | | | 1 | |
Class R1 | | | 11,113 | |
Class Y | | | 9,843 | |
| |
Shareholder communications: | | | | |
Class A | | | 4,827 | |
Class B | | | 223 | |
Class C | | | 1,194 | |
Class R1 | | | 238 | |
Class Y | | | 103 | |
| |
Custodian fees and expenses | | | 2,221 | |
| |
Trustees’ compensation | | | 1,564 | |
| |
Other | | | 20,305 | |
| | | | |
Total expenses | | | 1,363,460 | |
Less waivers and reimbursements of expenses | | | (2,312) | |
| | | | |
Net expenses | | | 1,361,148 | |
|
| |
Net Investment Income | | | 2,625,028 | |
|
| |
Realized and Unrealized Gain (Loss) | | | | |
Net realized gain on: | | | | |
Investments from unaffiliated companies | | | 1,562,121 | |
Foreign currency transactions | | | 882,959 | |
| | | | |
Net realized gain | | | 2,445,080 | |
| |
Net change in unrealized appreciation/depreciation on: | | | | |
Investments | | | 2,898,644 | |
Translation of assets and liabilities denominated in foreign currencies | | | (906,535) | |
| | | | |
Net change in unrealized appreciation/depreciation | | | 1,992,109 | |
|
| |
Net Increase in Net Assets Resulting from Operations | | $ | 7,062,217 | |
| | | | |
1. Effective July 1, 2014, Class N shares were renamed Class R. See Note 1 of the accompanying Notes.
See accompanying Notes to Financial Statements.
17 OPPENHEIMER DIVIDEND OPPORTUNITY FUND
STATEMENT OF CHANGES IN NET ASSETS
| | | | | | | | |
| | | Six Months Ended
October 31, 2014
(Unaudited) | | | Year Ended
April 30, 2014 | |
Operations | | | | | | | | |
Net investment income | | $ | 2,625,028 | | | $ | 4,002,097 | |
| |
Net realized gain | | | 2,445,080 | | | | 22,230,442 | |
| |
Net change in unrealized appreciation/depreciation | | | 1,992,109 | | | | (1,086,688) | |
| | | | | | | | |
Net increase in net assets resulting from operations | | | 7,062,217 | | | | 25,145,851 | |
|
| |
Dividends and/or Distributions to Shareholders | | | | | | | | |
Dividends from net investment income: | | | | | | | | |
Class A | | | (2,034,478) | | | | (2,939,034) | |
Class B | | | (63,200) | | | | (56,168) | |
Class C | | | (480,982) | | | | (468,249) | |
Class I | | | (80) | | | | — | |
Class R1 | | | (136,489) | | | | (170,065) | |
Class Y | | | (139,373) | | | | (237,911) | |
| | | | |
| | | (2,854,602) | | | | (3,871,427) | |
| |
Beneficial Interest Transactions | | | | | | | | |
Net increase (decrease) in net assets resulting from beneficial interest transactions: | | | | | | | | |
Class A | | | (630,509) | | | | (11,719,578) | |
Class B | | | (2,009,488) | | | | (4,895,989) | |
Class C | | | (549,564) | | | | (2,904,815) | |
Class I | | | 10,000 | | | | — | |
Class R1 | | | (871,511) | | | | (4,591,320) | |
Class Y | | | 1,951,369 | | | | (363,684) | |
| | | | | | | | |
| | | (2,099,703) | | | | (24,475,386) | |
|
| |
Net Assets | | | | | | | | |
Total increase (decrease) | | | 2,107,912 | | | | (3,200,962) | |
| |
Beginning of period | | | 200,747,396 | | | | 203,948,358 | |
| | | | | | | | |
End of period (including accumulated net investment income of $280,386 and $509,960, respectively) | | $ | 202,855,308 | | | $ | 200,747,396 | |
| | | | |
1. Effective July 1, 2014, Class N shares were renamed Class R. See Note 1 of the accompanying Notes
See accompanying Notes to Financial Statements.
18 OPPENHEIMER DIVIDEND OPPORTUNITY FUND
FINANCIAL HIGHLIGHTS
| | | | | | | | | | | | | | | | | | | | | | | | |
| Class A | | Six Months Ended October 31, 2014 (Unaudited) | | | Year Ended April 30, 2014 | | | Year Ended April 30, 2013 | | | Year Ended April 30, 2012 | | | Year Ended April 29, 20111 | | | Year Ended April 30, 2010 | |
| |
Per Share Operating Data | | | | | | | | | | | | | | | | | | | | | | | | |
Net asset value, beginning of period | | $ | 19.79 | | | $ | 17.80 | | | $ | 15.60 | | | $ | 17.88 | | | $ | 14.81 | | | $ | 10.44 | |
| |
Income (loss) from investment operations: | | | | | | | | | | | | | | | | | | | | | | | | |
Net investment income (loss)2 | | | 0.28 | | | | 0.42 | | | | 0.11 | | | | 0.07 | | | | (0.01) | | | | 0.06 | |
Net realized and unrealized gain (loss) | | | 0.44 | | | | 2.00 | | | | 2.19 | | | | (2.30) | | | | 3.08 | | | | 4.45 | |
| | | | |
Total from investment operations | | | 0.72 | | | | 2.42 | | | | 2.30 | | | | (2.23) | | | | 3.07 | | | | 4.51 | |
| |
Dividends and/or distributions to shareholders: | | | | | | | | | | | | | | | | | | | | | | | | |
Dividends from net investment income | | | (0.30) | | | | (0.43) | | | | (0.10) | | | | (0.05) | | | | 0.00 | | | | (0.11) | |
Tax return of capital distribution | | | 0.00 | | | | 0.00 | | | | 0.00 | | | | 0.00 | | | | 0.00 | | | | (0.03) | |
| |
Total dividends and/or distributions to shareholders | | | (0.30) | | | | (0.43) | | | | (0.10) | | | | (0.05) | | | | 0.00 | | | | (0.14) | |
| |
| | | | |
Net asset value, end of period | | $ | 20.21 | | | $ | 19.79 | | | $ | 17.80 | | | $ | 15.60 | | | $ | 17.88 | | | $ | 14.81 | |
| | | | |
| |
Total Return, at Net Asset Value3 | | | 3.63% | | | | 13.71% | | | | 14.79% | | | | (12.46)% | | | | 20.73% | | | | 43.30% | |
| |
Ratios/Supplemental Data | | | | | | | | | | | | | | | | | | | | | | | | |
Net assets, end of period (in thousands) | | $ | 137,573 | | | $ | 135,325 | | | $ | 133,099 | | | $ | 153,135 | | | $ | 231,757 | | | $ | 238,398 | |
| |
Average net assets (in thousands) | | $ | 137,673 | | | $ | 130,894 | | | $ | 136,118 | | | $ | 177,304 | | | $ | 221,830 | | | $ | 227,571 | |
| |
Ratios to average net assets:4 | | | | | | | | | | | | | | | | | | | | | | | | |
Net investment income (loss) | | | 2.74% | | | | 2.21% | | | | 0.67% | | | | 0.47% | | | | (0.09)% | | | | 0.42% | |
Total expenses5 | | | 1.16% | | | | 1.26% | | | | 1.36% | | | | 1.33% | | | | 1.31% | | | | 1.35% | |
| Expenses after payments, waivers and/or reimbursements and reduction to custodian expenses | | | 1.16% | | | | 1.26% | | | | 1.35% | | | | 1.33% | | | | 1.31% | | | | 1.35% | |
| |
Portfolio turnover rate | | | 25% | | | | 73% | | | | 140% | | | | 101% | | | | 125% | | | | 120% | |
1. April 29, 2011 represents the last business day of the Fund’s 2011 reporting period.
2. Per share amounts calculated based on the average shares outstanding during the period.
3. Assumes an initial investment on the business day before the first day of the fiscal period, with all dividends and distributions reinvested in additional shares on the reinvestment date, and redemption at the net asset value calculated on the last business day of the fiscal period. Sales charges are not reflected in the total returns. Total returns are not annualized for periods less than one full year. Returns do not reflect the deduction of taxes that a shareholder would pay on fund distributions or the redemption of fund shares.
4. Annualized for periods less than one full year.
5. Total expenses including indirect expenses from affiliated fund fees and expenses were as follows:
| | | | |
Six Months Ended October 31, 2014 | | | 1.16 | % |
Year Ended April 30, 2014 | | | 1.26 | % |
Year Ended April 30, 2013 | | | 1.36 | % |
Year Ended April 30, 2012 | | | 1.33 | % |
Year Ended April 29, 2011 | | | 1.31 | % |
Year Ended April 30, 2010 | | | 1.35 | % |
See accompanying Notes to Financial Statements.
19 OPPENHEIMER DIVIDEND OPPORTUNITY FUND
| | | | | | | | | | | | | | | | | | | | | | | | |
| Class B | | Six Months
Ended
October 31,
2014
(Unaudited) | | | Year Ended
April 30,
2014 | | | Year Ended
April 30,
2013 | | | Year Ended
April 30,
2012 | | | Year Ended
April 29,
20111 | | | Year Ended
April 30,
2010 | |
Per Share Operating Data | | | | | | | | | | | | | | | | | | | | | | | | |
Net asset value, beginning of period | | $ | 19.19 | | | $ | 17.15 | | | $ | 15.07 | | | $ | 17.36 | | | $ | 14.50 | | | $ | 10.23 | |
Income (loss) from investment operations: | | | | | | | | | | | | | | | | | | | | | | | | |
Net investment income (loss)2 | | | 0.20 | | | | 0.25 | | | | (0.03) | | | | (0.06) | | | | (0.14) | | | | (0.05) | |
Net realized and unrealized gain (loss) | | | 0.43 | | | | 1.94 | | | | 2.11 | | | | (2.23) | | | | 3.00 | | | | 4.36 | |
| | | | |
Total from investment operations | | | 0.63 | | | | 2.19 | | | | 2.08 | | | | (2.29) | | | | 2.86 | | | | 4.31 | |
Dividends and/or distributions to shareholders: | | | | | | | | | | | | | | | | | | | | | | | | |
Dividends from net investment income | | | (0.22) | | | | (0.15) | | | | 0.00 | | | | 0.00 | | | | 0.00 | | | | (0.03) | |
Tax return of capital distribution | | | 0.00 | | | | 0.00 | | | | 0.00 | | | | 0.00 | | | | 0.00 | | | | (0.01) | |
Total dividends and/or distributions to shareholders | | | (0.22) | | | | (0.15) | | | | 0.00 | | | | 0.00 | | | | 0.00 | | | | (0.04) | |
| | | | |
Net asset value, end of period | | $ | 19.60 | | | $ | 19.19 | | | $ | 17.15 | | | $ | 15.07 | | | $ | 17.36 | | | $ | 14.50 | |
| | | | |
| | | | |
| | | | | | | | | | | | | | | | | | | | | | | | |
Total Return, at Net Asset Value3 | | | 3.27% | | | | 12.79% | | | | 13.80% | | | | (13.19)% | | | | 19.73% | | | | 42.13% | |
| | | | | | | | | | | | | | | | | | | | | | | | |
Ratios/Supplemental Data | | | | | | | | | | | | | | | | | | | | | | | | |
Net assets, end of period (in thousands) | | $ | 4,667 | | | $ | 6,535 | | | $ | 10,531 | | | $ | 13,636 | | | $ | 20,806 | | | $ | 21,708 | |
Average net assets (in thousands) | | $ | 5,498 | | | $ | 8,271 | | | $ | 11,660 | | | $ | 15,547 | | | $ | 19,599 | | | $ | 21,006 | |
Ratios to average net assets:4 | | | | | | | | | | | | | | | | | | | | | | | | |
Net investment income (loss) | | | 2.05% | | | | 1.36% | | | | (0.17)% | | | | (0.39)% | | | | (0.95)% | | | | (0.40)% | |
Total expenses5 | �� | | 1.92% | | | | 2.20% | | | | 2.45% | | | | 2.42% | | | | 2.36% | | | | 2.44% | |
| Expenses after payments, waivers and/or reimbursements and reduction to custodian expenses | | | 1.92% | | | | 2.08% | | | | 2.19% | | | | 2.19% | | | | 2.18% | | | | 2.18% | |
Portfolio turnover rate | | | 25% | | | | 73% | | | | 140% | | | | 101% | | | | 125% | | | | 120% | |
1. April 29, 2011 represents the last business day of the Fund’s 2011 reporting period.
2. Per share amounts calculated based on the average shares outstanding during the period.
3. Assumes an initial investment on the business day before the first day of the fiscal period, with all dividends and distributions reinvested in additional shares on the reinvestment date, and redemption at the net asset value calculated on the last business day of the fiscal period. Sales charges are not reflected in the total returns. Total returns are not annualized for periods less than one full year. Returns do not reflect the deduction of taxes that a shareholder would pay on fund distributions or the redemption of fund shares.
4. Annualized for periods less than one full year.
5. Total expenses including indirect expenses from affiliated fund fees and expenses were as follows:
| | | | | | |
| | Six Months Ended October 31, 2014 | | | 1.92 | % |
| | Year Ended April 30, 2014 | | | 2.20 | % |
| | Year Ended April 30, 2013 | | | 2.45 | % |
| | Year Ended April 30, 2012 | | | 2.42 | % |
| | Year Ended April 29, 2011 | | | 2.36 | % |
| | Year Ended April 30, 2010 | | | 2.44 | % |
See accompanying Notes to Financial Statements.
20 OPPENHEIMER DIVIDEND OPPORTUNITY FUND
FINANCIAL HIGHLIGHTS Continued
| | | | | | | | | | | | | | | | | | | | | | | | |
| Class C | | Six Months
Ended
October 31,
2014
(Unaudited) | | | Year Ended
April 30,
2014 | | | Year Ended
April 30,
2013 | | | Year Ended
April 30,
2012 | | | Year Ended
April 29,
20111 | | | Year Ended
April 30,
2010 | |
Per Share Operating Data | | | | | | | | | | | | | | | | | | | | | | | | |
Net asset value, beginning of period | | $ | 19.17 | | | $ | 17.19 | | | $ | 15.10 | | | $ | 17.39 | | | $ | 14.51 | | | $ | 10.25 | |
Income (loss) from investment operations: | | | | | | | | | | | | | | | | | | | | | | | | |
Net investment income (loss)2 | | | 0.20 | | | | 0.26 | | | | (0.02) | | | | (0.05) | | | | (0.13) | | | | (0.05) | |
Net realized and unrealized gain (loss) | | | 0.43 | | | | 1.94 | | | | 2.11 | | | | (2.24) | | | | 3.01 | | | | 4.36 | |
Total from investment operations | | | 0.63 | | | | 2.20 | | | | 2.09 | | | | (2.29) | | | | 2.88 | | | | 4.31 | |
Dividends and/or distributions to shareholders: | | | | | | | | | | | | | | | | | | | | | | | | |
Dividends from net investment income | | | (0.23) | | | | (0.22) | | | | 0.00 | | | | 0.00 | | | | 0.00 | | | | (0.04) | |
Tax return of capital distribution | | | 0.00 | | | | 0.00 | | | | 0.00 | | | | 0.00 | | | | 0.00 | | | | (0.01) | |
Total dividends and/or distributions to shareholders | | | (0.23) | | | | (0.22) | | | | 0.00 | | | | 0.00 | | | | 0.00 | | | | (0.05) | |
| | | | |
Net asset value, end of period | | $ | 19.57 | | | $ | 19.17 | | | $ | 17.19 | | | $ | 15.10 | | | $ | 17.39 | | | $ | 14.51 | |
| | | | |
| | | | |
| | | | | | | | | | | | | | | | | | | | | | | | |
Total Return, at Net Asset Value3 | | | 3.27% | | | | 12.84% | | | | 13.84% | | | | (13.17)% | | | | 19.85% | | | | 42.04% | |
Ratios/Supplemental Data | | | | | | | | | | | | | | | | | | | | | | | | |
Net assets, end of period (in thousands) | | $ | 41,048 | | | $ | 40,789 | | | $ | 39,347 | | | $ | 46,459 | | | $ | 69,369 | | | $ | 68,923 | |
Average net assets (in thousands) | | $ | 41,093 | | | $ | 39,570 | | | $ | 39,873 | | | $ | 52,344 | | | $ | 63,562 | | | $ | 65,325 | |
Ratios to average net assets:4 | | | | | | | | | | | | | | | | | | | | | | | | |
Net investment income (loss) | | | 1.98% | | | | 1.45% | | | | (0.14)% | | | | (0.36)% | | | | (0.90)% | | | | (0.37)% | |
Total expenses5 | | | 1.92% | | | | 2.02% | | | | 2.16% | | | | 2.14% | | | | 2.13% | | | | 2.19% | |
| Expenses after payments, waivers and/or reimbursements and reduction to custodian expenses | | | 1.92% | | | | 2.02% | | | | 2.15% | | | | 2.14% | | | | 2.12% | | | | 2.14% | |
Portfolio turnover rate | | | 25% | | | | 73% | | | | 140% | | | | 101% | | | | 125% | | | | 120% | |
1. April 29, 2011 represents the last business day of the Fund’s 2011 reporting period.
2. Per share amounts calculated based on the average shares outstanding during the period.
3. Assumes an initial investment on the business day before the first day of the fiscal period, with all dividends and distributions reinvested in additional shares on the reinvestment date, and redemption at the net asset value calculated on the last business day of the fiscal period. Sales charges are not reflected in the total returns. Total returns are not annualized for periods less than one full year. Returns do not reflect the deduction of taxes that a shareholder would pay on fund distributions or the redemption of fund shares.
4. Annualized for periods less than one full year.
5. Total expenses including indirect expenses from affiliated fund fees and expenses were as follows:
| | | | | | |
| | Six Months Ended October 31, 2014 | | | 1.92 | % |
| | Year Ended April 30, 2014 | | | 2.02 | % |
| | Year Ended April 30, 2013 | | | 2.16 | % |
| | Year Ended April 30, 2012 | | | 2.14 | % |
| | Year Ended April 29, 2011 | | | 2.13 | % |
| | Year Ended April 30, 2010 | | | 2.19 | % |
See accompanying Notes to Financial Statements.
21 OPPENHEIMER DIVIDEND OPPORTUNITY FUND
FINANCIAL HIGHLIGHTS Continued
| | | | |
| Class I | | Period Ended
October 31,
20141
(Unaudited) | |
Per Share Operating Data | | | | |
Net asset value, beginning of period | | $ | 20.61 | |
| |
Income (loss) from investment operations: | | | | |
Net investment income2 | | | 0.09 | |
Net realized and unrealized loss | | | (0.35) | |
| | | | |
Total from investment operations | | | (0.26) | |
| |
Dividends and/or distributions to shareholders: | | | | |
Dividends from net investment income | | | (0.16) | |
Tax return of capital distribution | | | 0.00 | |
| |
Total dividends and/or distributions to shareholders | | | (0.16) | |
| |
| | | | |
Net asset value, end of period | | $ | 20.19 | |
| | | | |
|
| |
Total Return, at Net Asset Value3 | | | (1.25)% | |
|
| |
Ratios/Supplemental Data | | | | |
Net assets, end of period (in thousands) | | $ | 10 | |
| |
Average net assets (in thousands) | | $ | 10 | |
| |
Ratios to average net assets:4 | | | | |
Net investment income | | | 0.89% | |
Total expenses5 | | | 0.72% | |
Expenses after payments, waivers and/or reimbursements and reduction to custodian expenses | | | 0.72% | |
| |
Portfolio turnover rate | | | 25% | |
1. For the period from August 28, 2012 (inception of offering) to October 31, 2014.
2. Per share amounts calculated based on the average shares outstanding during the period.
3. Assumes an initial investment on the business day before the first day of the fiscal period, with all dividends and distributions reinvested in additional shares on the reinvestment date, and redemption at the net asset value calculated on the last business day of the fiscal period. Sales charges are not reflected in the total returns. Total returns are not annualized for periods less than one full year. Returns do not reflect the deduction of taxes that a shareholder would pay on fund distributions or the redemption of fund shares.
4. Annualized for periods less than one full year.
5. Total expenses including indirect expenses from affiliated fund fees and expenses were as follows:
| | |
| Period Ended October 31, 2014 | | 0.25% |
See accompanying Notes to Financial Statements.
22 OPPENHEIMER DIVIDEND OPPORTUNITY FUND
| | | | | | | | | | | | | | | | | | | | | | | | |
| Class R | | Six Months
Ended
October 31,
2014
(Unaudited) | | | Year Ended
April 30,
2014 | | | Year Ended
April 30,
2013 | | | Year Ended
April 30,
2012 | | | Year Ended
April 29,
20111 | | | Year Ended
April 30,
2010 | |
Per Share Operating Data | | | | | | | | | | | | | | | | | | | | | | | | |
| Net asset value, beginning of period | | $ | 19.61 | | | $ | 17.57 | | | $ | 15.40 | | | $ | 17.65 | | | $ | 14.65 | | | $ | 10.35 | |
| Income (loss) from investment operations: | | | | | | | | | | | | | | | | | | | | | | | | |
| Net investment income (loss)2 | | | 0.25 | | | | 0.36 | | | | 0.07 | | | | 0.04 | | | | (0.05 | ) | | | 0.02 | |
| Net realized and unrealized gain (loss) | | | 0.44 | | | | 1.99 | | | | 2.15 | | | | (2.27 | ) | | | 3 .05 | | | | 4.39 | |
| Total from investment operations | | | 0.69 | | | | 2.35 | | | | 2.22 | | | | (2.23 | ) | | | 3 .00 | | | | 4.41 | |
| Dividends and/or distributions to shareholders: | | | | | | | | | | | | | | | | | | | | | | | | |
| Dividends from net investment income | | | (0.27 | ) | | | (0.31 | ) | | | (0.05 | ) | | | (0.02 | ) | | | 0.00 | | | | (0.09) | |
| Tax return of capital distribution | | | 0.00 | | | | 0.00 | | | | 0.00 | | | | 0.00 | | | | 0.00 | | | | (0.02) | |
| Total dividends and/or distributions to shareholders | | | (0.27 | ) | | | (0.31 | ) | | | (0.05 | ) | | | (0.02 | ) | | | 0.00 | | | | (0.11) | |
| | | | |
| Net asset value, end of period | | $ | 20.03 | | | $ | 19.61 | | | $ | 17.57 | | | $ | 15.40 | | | $ | 17.65 | | | $ | 14.65 | |
| | | | |
| | | | |
| | | | | | | | | | | | | | | | | | | | | | | | |
| Total Return, at Net Asset Value3 | | | 3.53% | | | | 13.46% | | | | 14.48% | | | | (12.63)% | | | | 20.48% | | | | 42.71% | |
Ratios/Supplemental Data | | | | | | | | | | | | | | | | | | | | | | | | |
| Net assets, end of period (in thousands) | | $ | 9,374 | | | $ | 10,034 | | | $ | 13,327 | | | $ | 16,984 | | | $ | 23,598 | | | $ | 24,641 | |
| Average net assets (in thousands) | | $ | 9,920 | | | $ | 11,300 | | | $ | 14,391 | | | $ | 18,662 | | | $ | 22,409 | | | $ | 23,087 | |
| Ratios to average net assets:4 | | | | | | | | | | | | | | | | | | | | | | | | |
| Net investment income (loss) | | | 2.50% | | | | 1.95% | | | | 0.44% | | | | 0.24% | | | | (0.36)% | | | | 0.13% | |
| Total expenses5 | | | 1.41% | | | | 1.48% | | | | 1.57% | | | | 1.56% | | | | 1.61% | | | | 1.71% | |
| Expenses after payments, waivers and/or reimbursements and reduction to custodian expenses | | | 1.41% | | | | 1.48% | | | | 1.57% | | | | 1.56% | | | | 1.58% | | | | 1.63% | |
| Portfolio turnover rate | | | 25% | | | | 73% | | | | 140% | | | | 101% | | | | 125% | | | | 120% | |
1. April 29, 2011 represents the last business day of the Fund’s reporting period.
2. Per share amounts calculated based on the average shares outstanding during the period.
3. Assumes an initial investment on the business day before the first day of the fiscal period, with all dividends and distributions reinvested in additional shares on the reinvestment date, and redemption at the net asset value calculated on the last business day of the fiscal period. Sales charges are not reflected in the total returns. Total returns are not annualized for periods less than one full year. Returns do not reflect the deduction of taxes that a shareholder would pay on fund distributions or the redemption of fund shares.
4. Annualized for periods less than one full year.
5. Total expenses including indirect expenses from affiliated fund fees and expenses were as follows:
| | | | | | |
| | Six Months Ended October 31, 2014 | | | 1.41 | % |
| | Year Ended April 30, 2014 | | | 1.48 | % |
| | Year Ended April 30, 2013 | | | 1.57 | % |
| | Year Ended April 30, 2012 | | | 1.56 | % |
| | Year Ended April 29, 2011 | | | 1.61 | % |
| | Year Ended April 30, 2010 | | | 1.71 | % |
See accompanying Notes to Financial Statements.
23 OPPENHEIMER DIVIDEND OPPORTUNITY FUND
FINANCIAL HIGHLIGHTS Continued
| | | | | | | | | | | | | | | | | | | | | | | | |
| Class Y | | Six Months
Ended
October 31,
2014
(Unaudited) | | | Year Ended
April 30,
2014 | | | Year Ended
April 30,
2013 | | | Year Ended
April 30,
2012 | | | Year Ended
April 29,
20111 | | | Year Ended
April 30,
2010 | |
Per Share Operating Data | | | | | | | | | | | | | | | | | | | | | | | | |
| Net asset value, beginning of period | | $ | 19.77 | | | $ | 17.87 | | | $ | 15.66 | | | $ | 17.97 | | | $ | 14.87 | | | $ | 10.48 | |
| Income (loss) from investment operations: | | | | | | | | | | | | | | | | | | | | | | | | |
| Net investment income2 | | | 0.30 | | | | 0.48 | | | | 0.18 | | | | 0.13 | | | | 0.05 | | | | 0.13 | |
Net realized and unrealized gain (loss) | | | 0.45 | | | | 2.01 | | | | 2.20 | | | | (2.32 | ) | | | 3.11 | | | | 4.46 | |
| | | | |
| Total from investment operations | | | 0.75 | | | | 2.49 | | | | 2.38 | | | | (2.19 | ) | | | 3.16 | | | | 4.59 | |
| Dividends and/or distributions to shareholders: | | | | | | | | | | | | | | | | | | | | | | | | |
| Dividends from net investment income | | | (0.33 | ) | | | (0.59 | ) | | | (0.17 | ) | | | (0.12 | ) | | | (0.06 | ) | | | (0.16) | |
| Tax return of capital distribution | | | 0.00 | | | | 0.00 | | | | 0.00 | | | | 0.00 | | | | 0.00 | | | | (0.04) | |
| Total dividends and/or distributions to shareholders | | | (0.33 | ) | | | (0.59 | ) | | | (0.17 | ) | | | (0.12 | ) | | | (0.06 | ) | | | (0.20) | |
| | | | |
| Net asset value, end of period | | $ | 20.19 | | | $ | 19.77 | | | $ | 17.87 | | | $ | 15.66 | | | $ | 17.97 | | | $ | 14.87 | |
| | | | |
| | | | |
| | | | | | | | | | | | | | | | | | | | | | | | |
| Total Return, at Net Asset Value3 | | | 3.76 | % | | | 14.07 | % | | | 15.30 | % | | | (12.09 | )% | | | 21.32 | % | | | 43.99% | |
| Ratios/Supplemental Data | | | | | | | | | | | | | | | | | | | | | | | | |
| Net assets, end of period (in thousands) | | $ | 10,183 | | | $ | 8,064 | | | $ | 7,644 | | | $ | 13,560 | | | $ | 14,557 | | | $ | 14,936 | |
| Average net assets (in thousands) | | $ | 8,792 | | | $ | 7,693 | | | $ | 8,889 | | | $ | 13,024 | | | $ | 13,176 | | | $ | 10,902 | |
| Ratios to average net assets:4 | | | | | | | | | | | | | | | | | | | | | | | | |
| Net investment income | | | 2.95 | % | | | 2.53 | % | | | 1.11 | % | | | 0.85 | % | | | 0.32 | % | | | 0.96% | |
| Total expenses5 | | | 0.90 | % | | | 0.94 | % | | | 0.90 | % | | | 0.92 | % | | | 0.88 | % | | | 0.73% | |
| Expenses after payments, waivers and/or reimbursements and reduction to custodian expenses | | | 0.90 | % | | | 0.94 | % | | | 0.90 | % | | | 0.92 | % | | | 0.88 | % | | | 0.73% | |
| Portfolio turnover rate | | | 25 | % | | | 73 | % | | | 140 | % | | | 101 | % | | | 125 | % | | | 120% | |
1. April 29, 2011 represents the last business day of the Fund’s 2011 reporting period.
2. Per share amounts calculated based on the average shares outstanding during the period.
3. Assumes an initial investment on the business day before the first day of the fiscal period, with all dividends and distributions reinvested in additional shares on the reinvestment date, and redemption at the net asset value calculated on the last business day of the fiscal period. Sales charges are not reflected in the total returns. Total returns are not annualized for periods less than one full year. Returns do not reflect the deduction of taxes that a shareholder would pay on fund distributions or the redemption of fund shares.
4. Annualized for periods less than one full year.
5. Total expenses including indirect expenses from affiliated fund fees and expenses were as follows:
| | | | | | |
| | Six Months Ended October 31, 2014 | | | 0.90 | % |
| | Year Ended April 30, 2014 | | | 0.94 | % |
| | Year Ended April 30, 2013 | | | 0.90 | % |
| | Year Ended April 30, 2012 | | | 0.92 | % |
| | Year Ended April 29, 2011 | | | 0.88 | % |
| | Year Ended April 30, 2010 | | | 0.73 | % |
See accompanying Notes to Financial Statements.
24 OPPENHEIMER DIVIDEND OPPORTUNITY FUND
NOTES TO FINANCIAL STATEMENTS October 31, 2014 Unaudited
1. Significant Accounting Policies
Oppenheimer Dividend Opportunity Fund (the “Fund”) is registered under the Investment Company Act of 1940 (“1940 Act”), as amended, as a diversified open-end management investment company. The Fund’s investment objective is to seek total return. The Fund’s investment adviser is OFI Global Asset Management, Inc. (“OFI Global” or the “Manager”), a wholly-owned subsidiary of OppenheimerFunds, Inc. (“OFI” or “the “Sub-Adviser”). The Manager has entered into a sub-advisory agreement with OFI.
The Fund offers Class A, Class C, Class R and Class Y shares, and previously offered Class B shares for new purchase through June 29, 2012. Subsequent to that date, no new purchases of Class B shares are permitted, however reinvestment of dividend and/or capital gain distributions and exchanges of Class B shares into and from other Oppenheimer funds will be allowed. As of July 1, 2014, Class N shares were renamed Class R shares. Class N shares subject to a CDSC on July 1, 2014, will continue to be subject to a CDSC after the shares are renamed. Purchases of Class R shares occurring on or after July 1, 2014, will not be subject to a CDSC upon redemption. Class A shares are sold at their offering price, which is normally net asset value plus a front-end sales charge. Class C and Class R shares are sold, and Class B shares were sold, without a front-end sales charge but may be subject to a contingent deferred sales charge (“CDSC”). Class R shares are sold only through retirement plans. Retirement plans that offer Class R shares may impose charges on those accounts. Class Y shares are sold to certain institutional investors or intermediaries without either a front-end sales charge or a CDSC, however, the intermediaries may impose charges on their accountholders who beneficially own Class Y shares. All classes of shares have identical rights and voting privileges with respect to the Fund in general and exclusive voting rights on matters that affect that class alone. Earnings, net assets and net asset value per share may differ due to each class having its own expenses, such as transfer and shareholder servicing agent fees and shareholder communications, directly attributable to that class. Class A, B, C and R shares have separate distribution and/or service plans under which they pay fees. Class Y shares do not pay such fees. Class B shares will automatically convert to Class A shares 72 months after the date of purchase.
The following is a summary of significant accounting policies consistently followed by the Fund.
Structured Securities. The Fund invests in structured securities whose market values, interest rates and/or redemption prices are linked to the performance of underlying foreign currencies, interest rate spreads, stock market indices, prices of individual securities, commodities or other financial instruments or the occurrence of other specific events. The structured securities are often leveraged, increasing the volatility of each note’s market value relative to the change in the underlying linked financial element or event. Fluctuations in value of these securities are recorded as unrealized gains and losses in the accompanying Statement of Operations. The Fund records a realized gain or loss when a structured security is sold or matures.
25 OPPENHEIMER DIVIDEND OPPORTUNITY FUND
| | | | |
| NOTES TO FINANCIAL STATEMENTS Unaudited / Continued | | |
| | |
| 1. Significant Accounting Policies (Continued) | | |
Equity Security Risk. Stocks and other equity securities fluctuate in price. The value of the Fund’s portfolio may be affected by changes in the equity markets generally. Equity markets may experience significant short-term volatility and may fall sharply at times. Different markets may behave differently from each other and U.S. equity markets may move in the opposite direction from one or more foreign stock markets.
The prices of individual equity securities generally do not all move in the same direction at the same time and a variety of factors can affect the price of a particular company’s securities. These factors may include, but are not limited to, poor earnings reports, a loss of customers, litigation against the company, general unfavorable performance of the company’s sector or industry, or changes in government regulations affecting the company or its industry.
Investment in Oppenheimer Institutional Money Market Fund. The Fund is permitted to invest daily available cash balances in an affiliated money market fund. The Fund may invest the available cash in Class E shares of Oppenheimer Institutional Money Market Fund (“IMMF”) to seek current income while preserving liquidity or for defensive purposes. IMMF is a registered open-end management investment company, regulated as a money market fund under the 1940 Act. The Manager is the investment adviser of IMMF, and the Sub-Adviser provides investment and related advisory services to IMMF. When applicable, the Fund’s investment in IMMF is included in the Statement of Investments. Shares of IMMF are valued at their net asset value per share. As a shareholder, the Fund is subject to its proportional share of IMMF’s Class E expenses, including its management fee. The Manager will waive fees and/or reimburse Fund expenses in an amount equal to the indirect management fees incurred through the Fund’s investment in IMMF.
Foreign Currency Translation. The Fund’s accounting records are maintained in U.S. dollars. The values of securities denominated in foreign currencies and amounts related to the purchase and sale of foreign securities and foreign investment income are translated into U.S. dollars as of the close of the New York Stock Exchange (the “Exchange”), normally 4:00 P.M. Eastern time, on each day the Exchange is open for trading. Foreign exchange rates may be valued primarily using a reliable bank, dealer or service authorized by the Board of Trustees.
Reported net realized gains and losses from foreign currency transactions arise from sales of portfolio securities, sales and maturities of short-term securities, sales of foreign currencies, exchange rate fluctuations between the trade and settlement dates on securities transactions, and the difference between the amounts of dividends, interest, and foreign withholding taxes recorded on the Fund’s books and the U.S. dollar equivalent of the amounts actually received or paid. Net unrealized appreciation and depreciation on the translation of assets and liabilities denominated in foreign currencies arise from changes in the values of assets and liabilities, including investments in securities at fiscal period end, resulting from changes in exchange rates.
The effect of changes in foreign currency exchange rates on investments is separately identified from the fluctuations arising from changes in market values of securities held and reported with all other foreign currency gains and losses in the Fund’s Statement of Operations.
26 OPPENHEIMER DIVIDEND OPPORTUNITY FUND
| | | | |
| 1. Significant Accounting Policies (Continued) | | |
Allocation of Income, Expenses, Gains and Losses. Income, expenses (other than those attributable to a specific class), gains and losses are allocated on a daily basis to each class of shares based upon the relative proportion of net assets represented by such class. Operating expenses directly attributable to a specific class are charged against the operations of that class.
Federal Taxes. The Fund intends to comply with provisions of the Internal Revenue Code applicable to regulated investment companies and to distribute substantially all of its investment company taxable income to shareholders. Therefore, no federal income or excise tax provision is required. The Fund files income tax returns in U.S. federal and applicable state jurisdictions. The statute of limitations on the Fund’s tax return filings generally remain open for the three preceding fiscal reporting period ends.
During the fiscal year ended April 30, 2014, the Fund utilized $20,266,752 of capital loss carryforward to offset capital gains realized in that fiscal year. Details of the fiscal year ended April 30, 2014 capital loss carryforwards are included in the table below. Capital loss carryforwards with no expiration, if any, must be utilized prior to those with expiration dates. Capital losses with no expiration will be carried forward to future years if not offset by gains.
| | | | |
Expiring | |
2017 | | $ | 42,247,077 | |
2018 | | | 143,967,874 | |
| | | | |
Total | | $ | 186,214,951 | |
| | | | |
As of October 31, 2014, it is estimated that the capital loss carryforwards would be $183,796,871 expiring by 2018. The estimated capital loss carryforward represents the carryforward as of the end of the last fiscal year, increased or decreased by capital losses or gains realized in the first six months of the current fiscal year. During the six months ended October 31, 2014, it is estimated that the Fund will utilize $2,445,080 of capital loss carryforward to offset realized capital gains.
Net investment income (loss) and net realized gain (loss) may differ for financial statement and tax purposes. The character of dividends and distributions made during the fiscal year from net investment income or net realized gains may differ from their ultimate characterization for federal income tax purposes. Also, due to timing of dividends and distributions, the fiscal year in which amounts are distributed may differ from the fiscal year in which the income or net realized gain was recorded by the Fund.
The aggregate cost of securities and other investments and the composition of unrealized appreciation and depreciation of securities and other investments for federal income tax purposes as of October 31, 2014 are noted in the following table. The primary difference between book and tax appreciation or depreciation of securities and other investments, if applicable, is attributable to the tax deferral of losses or tax realization of financial statement unrealized gain or loss.
27 OPPENHEIMER DIVIDEND OPPORTUNITY FUND
| | | | |
| NOTES TO FINANCIAL STATEMENTS Unaudited / Continued | | |
| | |
| 1. Significant Accounting Policies (Continued) | | |
| | | | |
Federal tax cost of securities | | $ | 181,338,556 | |
| | | | |
Gross unrealized appreciation | | $ | 24,059,310 | |
Gross unrealized depreciation | | | (4,675,578 | ) |
| | | | |
Net unrealized appreciation | | $ | 19,383,732 | |
| | | | |
Dividends and Distributions to Shareholders. Dividends and distributions to shareholders, which are determined in accordance with income tax regulations and may differ from U.S. generally accepted accounting principles, are recorded on the ex-dividend date. Income distributions, if any, are declared and paid quarterly. Capital gain distributions, if any, are declared and paid annually.
The tax character of distributions is determined as of the Fund’s fiscal year end. Therefore, a portion of the Fund’s distributions made to shareholders prior to the Fund’s fiscal year end may ultimately be categorized as a tax return of capital.
Investment Income. Dividend income is recorded on the ex-dividend date or upon ex-dividend notification in the case of certain foreign dividends where the ex-dividend date may have passed. Non-cash dividends included in dividend income, if any, are recorded at the fair market value of the securities received. Interest income is recognized on an accrual basis. Discount and premium, which are included in interest income on the Statement of Operations, are amortized or accreted daily.
Custodian Fees. “Custodian fees and expenses” in the Statement of Operations may include interest expense incurred by the Fund on any cash overdrafts of its custodian account during the period. Such cash overdrafts may result from the effects of failed trades in portfolio securities and from cash outflows resulting from unanticipated shareholder redemption activity. The Fund pays interest to its custodian on such cash overdrafts, to the extent they are not offset by positive cash balances maintained by the Fund, at a rate equal to the Federal Funds Rate plus 0.50%. The “Reduction to custodian expenses” line item, if applicable, represents earnings on cash balances maintained by the Fund during the period. Such interest expense and other custodian fees may be paid with these earnings.
Security Transactions. Security transactions are recorded on the trade date. Realized gains and losses on securities sold are determined on the basis of identified cost.
Indemnifications. The Fund’s organizational documents provide current and former Trustees and officers with a limited indemnification against liabilities arising in connection with the performance of their duties to the Fund. In the normal course of business, the Fund may also enter into contracts that provide general indemnifications. The Fund’s maximum exposure under these arrangements is unknown as this would be dependent on future claims that may be made against the Fund. The risk of material loss from such claims is considered remote.
28 OPPENHEIMER DIVIDEND OPPORTUNITY FUND
| | | | |
1. Significant Accounting Policies (Continued) | | |
Other. The preparation of financial statements in conformity with accounting principles generally accepted in the United States of America requires management to make estimates and assumptions that affect the reported amounts of assets and liabilities and disclosure of contingent assets and liabilities at the date of the financial statements and the reported amounts of increases and decreases in net assets from operations during the reporting period. Actual results could differ from those estimates.
2. Securities Valuation
The Fund calculates the net asset value of its shares as of the close of the New York Stock Exchange (the “Exchange”), normally 4:00 P.M. Eastern time, on each day the Exchange is open for trading.
The Fund’s Board has adopted procedures for the valuation of the Fund’s securities and has delegated the day-to-day responsibility for valuation determinations under those procedures to the Manager. The Manager has established a Valuation Committee which is responsible for determining a “fair valuation” for any security for which market quotations are not “readily available.” The Valuation Committee’s fair valuation determinations are subject to review, approval and ratification by the Fund’s Board at its next regularly scheduled meeting covering the calendar quarter in which the fair valuation was determined.
Valuation Methods and Inputs
Securities are valued using unadjusted quoted market prices, when available, as supplied primarily by third party pricing services or dealers.
The following methodologies are used to determine the market value or the fair value of the types of securities described below:
Securities traded on a registered U.S. securities exchange (including exchange-traded derivatives other than futures and futures options) are valued based on the last sale price of the security reported on the principal exchange on which it is traded, prior to the time when the Fund’s assets are valued. In the absence of a sale, the security is valued at the last sale price on the prior trading day, if it is within the spread of the current day’s closing “bid” and “asked” prices, and if not, at the current day’s closing bid price. A security of a foreign issuer traded on a foreign exchange, but not listed on a registered U.S. securities exchange, is valued based on the last sale price on the principal exchange on which the security is traded, as identified by the third party pricing service used by the Manager, prior to the time when the Fund’s assets are valued. If the last sale price is unavailable, the security is valued at the most recent official closing price on the principal exchange on which it is traded. If the last sales price or official closing price for a foreign security is not available, the security is valued at the mean between the bid and asked price per the exchange or, if not available from the exchange, obtained from two dealers. If bid and asked prices are not available from either the exchange or two dealers, the security is valued by using one of the following methodologies (listed in order of priority): (1) using a bid from the exchange, (2) the mean between the bid and asked price as provided by a single dealer, or (3) a bid from a single dealer.
Shares of a registered investment company that are not traded on an exchange are valued at that investment company’s net asset value per share.
29 OPPENHEIMER DIVIDEND OPPORTUNITY FUND
| | | | |
| NOTES TO FINANCIAL STATEMENTS Unaudited / Continued | | |
| | |
| 2. Securities Valuation (Continued) | | |
Corporate and government debt securities (of U.S. or foreign issuers) and municipal debt securities, event-linked bonds, loans, mortgage-backed securities, collateralized mortgage obligations, and asset-backed securities are valued at the mean between the “bid” and “asked” prices utilizing evaluated prices obtained from third party pricing services or broker-dealers who may use matrix pricing methods to determine the evaluated prices.
Short-term money market type debt securities with a remaining maturity of sixty days or less are valued at cost adjusted by the amortization of discount or premium to maturity (amortized cost), which approximates market value. Short-term debt securities with a remaining maturity in excess of sixty days are valued at the mean between the “bid” and “asked” prices utilizing evaluated prices obtained from third party pricing services or broker-dealers.
Structured securities, swaps, swaptions, and other over-the-counter derivatives are valued utilizing evaluated prices obtained from third party pricing services or broker-dealers.
Forward foreign currency exchange contracts are valued utilizing current and forward currency rates obtained from third party pricing services. When the settlement date of a contract is an interim date for which a quotation is not available, interpolated values are derived using the nearest dated forward currency rate.
A description of the standard inputs that may generally be considered by the third party pricing vendors in determining their evaluated prices is provided below.
| | |
| Security Type | | Standard inputs generally considered by third-party pricing vendors |
|
Corporate debt, government debt, municipal, mortgage-backed and asset-backed securities | | Reported trade data, broker-dealer price quotations, benchmark yields, issuer spreads on comparable securities, the credit quality, yield, maturity, and other appropriate factors. |
|
| Loans | | Information obtained from market participants regarding reported trade data and broker-dealer price quotations. |
|
| Event-linked bonds | | Information obtained from market participants regarding reported trade data and broker-dealer price quotations. |
|
| Structured securities | | Relevant market information such as the price of underlying financial instruments, stock market indices, foreign currencies, interest rate spreads, commodities, or the occurrence of other specific events. |
If a market value or price cannot be determined for a security using the methodologies described above, or if, in the “good faith” opinion of the Manager, the market value or price obtained does not constitute a “readily available market quotation,” or a significant event has occurred that would materially affect the value of the security the security is fair valued either (i) by a standardized fair valuation methodology applicable to the security type or the significant event as previously approved by the Valuation Committee and the Fund’s Board or (ii) as determined in good faith by the Manager’s Valuation Committee. The Valuation Committee considers all relevant facts that are reasonably available, through either public information or information available to the Manager, when determining the fair value of a security. Fair value determinations by the Manager are subject to review, approval and ratification by the Fund’s Board at its next regularly scheduled meeting covering the calendar quarter in which the fair valuation was determined. Those fair valuation standardized
30 OPPENHEIMER DIVIDEND OPPORTUNITY FUND
| | | | |
2. Securities Valuation (Continued) | | |
methodologies include, but are not limited to, valuing securities at the last sale price or initially at cost and subsequently adjusting the value based on: changes in company specific fundamentals, changes in an appropriate securities index, or changes in the value of similar securities which may be further adjusted for any discounts related to security-specific resale restrictions. When possible, such methodologies use observable market inputs such as unadjusted quoted prices of similar securities, observable interest rates, currency rates and yield curves. The methodologies used for valuing securities are not necessarily an indication of the risks associated with investing in those securities nor can it be assured that the Fund can obtain the fair value assigned to a security if it were to sell the security.
To assess the continuing appropriateness of security valuations, the Manager, or its third party service provider who is subject to oversight by the Manager, regularly compares prior day prices, prices on comparable securities, and sale prices to the current day prices and challenges those prices exceeding certain tolerance levels with the third party pricing service or broker source. For those securities valued by fair valuations, whether through a standardized fair valuation methodology or a fair valuation determination, the Valuation Committee reviews and affirms the reasonableness of the valuations based on such methodologies and fair valuation determinations on a regular basis after considering all relevant information that is reasonably available.
Classifications
Each investment asset or liability of the Fund is assigned a level at measurement date based on the significance and source of the inputs to its valuation. Various data inputs are used in determining the value of each of the Fund’s investments as of the reporting period end. These data inputs are categorized in the following hierarchy under applicable financial accounting standards:
1) Level 1-unadjusted quoted prices in active markets for identical assets or liabilities (including securities actively traded on a securities exchange)
2) Level 2-inputs other than unadjusted quoted prices that are observable for the asset or liability (such as unadjusted quoted prices for similar assets and market corroborated inputs such as interest rates, prepayment speeds, credit risks, etc.)
3) Level 3-significant unobservable inputs (including the Manager’s own judgments about assumptions that market participants would use in pricing the asset or liability).
The inputs used for valuing securities are not necessarily an indication of the risks associated with investing in those securities.
The table below categorizes amounts that are included in the Fund’s Statement of Assets and Liabilities as of October 31, 2014 based on valuation input level:
31 OPPENHEIMER DIVIDEND OPPORTUNITY FUND
| | | | |
| NOTES TO FINANCIAL STATEMENTS Unaudited / Continued | | |
| | |
| 2. Securities Valuation (Continued) | | |
| | | | | | | | | | | | | | | | |
| | | Level 1—
Unadjusted
Quoted Prices | | | Level 2—
Other Significant
Observable Inputs | | | Level 3—
Significant
Unobservable
Inputs | | | Value | |
| |
Assets Table | | | | | | | | | | | | | | | | |
Investments, at Value: | | | | | | | | | | | | | | | | |
Common Stocks | | | | | | | | | | | | | | | | |
Consumer Discretionary | | $ | 13,941,521 | | | $ | 1,051,055 | | | $ | — | | | $ | 14,992,576 | |
Consumer Staples | | | 14,860,577 | | | | 2,341,071 | | | | — | | | | 17,201,648 | |
Energy | | | 24,840,497 | | | | — | | | | — | | | | 24,840,497 | |
Financials | | | 25,911,708 | | | | 8,123,989 | | | | — | | | | 34,035,697 | |
Health Care | | | 18,604,320 | | | | 2,246,491 | | | | — | | | | 20,850,811 | |
Industrials | | | 16,874,995 | | | | 2,976,393 | | | | — | | | | 19,851,388 | |
Information Technology | | | 21,193,066 | | | | 2,593,488 | | | | — | | | | 23,786,554 | |
Materials | | | 3,708,926 | | | | 1,601,988 | | | | — | | | | 5,310,914 | |
Telecommunication Services | | | 13,831,004 | | | | 1,331,681 | | | | — | | | | 15,162,685 | |
Utilities | | | 13,054,354 | | | | 1,000,371 | | | | — | | | | 14,054,725 | |
Structured Security | | | — | | | | 5,099,990 | | | | — | | | | 5,099,990 | |
Investment Company | | | 5,534,803 | | | | — | | | | — | | | | 5,534,803 | |
| | | | |
Total Investments, at Value | | | 172,355,771 | | | | 28,366,517 | | | | — | | | | 200,722,288 | |
Other Financial Instruments: | | | | | | | | | | | | | | | | |
Foreign currency exchange contracts | | | — | | | | 848,856 | | | | — | | | | 848,856 | |
| | | | |
Total Assets | | $ | 172,355,771 | | | $ | 29,215,373 | | | $ | — | | | $ | 201,571,144 | |
| | | | |
| | | | |
Liabilities Table | | | | | | | | | | | | | | | | |
Other Financial Instruments: | | | | | | | | | | | | | | | | |
Foreign currency exchange contracts | | $ | — | | | $ | (164,265) | | | $ | — | | | $ | (164,265) | |
| | | | |
Total Liabilities | | $ | — | | | $ | (164,265) | | | $ | — | | | $ | (164,265) | |
| | | | |
Forward currency exchange contracts and futures contracts, if any, are reported at their unrealized appreciation/depreciation at measurement date, which represents the change in the contract’s value from trade date. All additional assets and liabilities included in the above table are reported at their market value at measurement date.
3. Shares of Beneficial Interest
The Fund has authorized an unlimited number of $0.001 par value shares of beneficial interest of each class. Transactions in shares of beneficial interest were as follows:
| | | | | | | | | | | | | | | | |
| | | Six Months Ended October 31, 2014 1 | | | Year Ended April 30, 2014 | |
| | | Shares | | | Amount | | | Shares | | | Amount | |
| |
Class A | | | | | | | | | | | | | | | | |
Sold | | | 565,503 | | | $ | 11,419,517 | | | | 997,406 | | | $ | 18,761,619 | |
Dividends and/or distributions reinvested | | | 96,718 | | | | 1,972,361 | | | | 148,744 | | | | 2,851,373 | |
Redeemed | | | (693,954 | ) | | | (14,022,387 | ) | | | (1,785,625 | ) | | | (33,332,570) | |
| | | | |
Net decrease | | | (31,733 | ) | | $ | (630,509 | ) | | | (639,475 | ) | | $ | (11,719,578) | |
| | | | |
32 OPPENHEIMER DIVIDEND OPPORTUNITY FUND
| | | | |
3. Shares of Beneficial Interest (Continued) | | |
| | | | | | | | | | | | | | | | |
| | | Six Months Ended October 31, 2014 1 | | | Year Ended April 30, 2014 | |
| | | Shares | | | Amount | | | Shares | | | Amount | |
| |
Class B | | | | | | | | | | | | | | | | |
| | | | |
Sold | | | 5,541 | | | $ | 108,421 | | | | 14,836 | | | $ | 265,111 | |
Dividends and/or distributions reinvested | | | 3,122 | | | | 61,788 | | | | 2,964 | | | | 54,990 | |
Redeemed | | | (111,000 | ) | | | (2,179,697 | ) | | | (291,409 | ) | | | (5,216,090) | |
| | | | |
Net decrease | | | (102,337 | ) | | $ | (2,009,488 | ) | | | (273,609 | ) | | $ | (4,895,989) | |
| | | | |
|
| |
Class C | | | | | | | | | | | | | | | | |
| | | | |
Sold | | | 164,054 | | | $ | 3,209,816 | | | | 302,394 | | | $ | 5,483,807 | |
Dividends and/or distributions reinvested | | | 23,365 | | | | 461,867 | | | | 24,240 | | | | 448,917 | |
Redeemed | | | (217,195 | ) | | | (4,221,247 | ) | | | (487,918 | ) | | | (8,837,539) | |
| | | | |
Net decrease | | | (29,776 | ) | | $ | (549,564 | ) | | | (161,284 | ) | | $ | (2,904,815) | |
| | | | |
|
| |
Class I | | | | | | | | | | | | | | | | |
| | | | |
Sold | | | 485 | | | $ | 10,000 | | | | — | | | $ | — | |
Dividends and/or distributions reinvested | | | — | | | | — | | | | — | | | | — | |
Redeemed | | | — | | | | — | | | | — | | | | — | |
| | | | |
Net increase | | | 485 | | | $ | 10,000 | | | | — | | | $ | — | |
| | | | |
|
| |
Class R2 | | | | | | | | | | | | | | | | |
| | | | |
Sold | | | 41,746 | | | $ | 827,771 | | | | 100,507 | | | $ | 1,851,414 | |
Dividends and/or distributions reinvested | | | 6,380 | | | | 128,946 | | | | 8,543 | | | | 161,698 | |
Redeemed | | | (91,661 | ) | | | (1,828,228 | ) | | | (355,866 | ) | | | (6,604,432) | |
| | | | |
Net decrease | | | (43,535 | ) | | $ | (871,511 | ) | | | (246,816 | ) | | $ | (4,591,320) | |
| | | | |
|
| |
Class Y | | | | | | | | | | | | | | | | |
| | | | |
Sold | | | 128,632 | | | $ | 2,600,024 | | | | 58,841 | | | $ | 1,107,504 | |
Dividends and/or distributions reinvested | | | 6,143 | | | | 125,158 | | | | 10,933 | | | | 210,093 | |
Redeemed | | | (38,387 | ) | | | (773,813 | ) | | | (89,657 | ) | | | (1,681,281) | |
| | | | |
Net increase (decrease) | | | 96,388 | | | $ | 1,951,369 | | | | (19,883 | ) | | $ | (363,684) | |
| | | | |
1. For the six months ended October 31, 2014, for Class A, Class B, Class C, Class R and for Class Y, and for the period from August 28, 2014 (inception of offering) to October 31, 2014, Class I shares.
2. Effective July 1, 2014, Class N shares were renamed Class R.
4. Purchases and sales of Securities
The aggregate cost of purchases and proceeds from sales of securities, other than short-term obligations and investments in IMMF, for the six months ended October 31, 2014 were as follows:
33 OPPENHEIMER DIVIDEND OPPORTUNITY FUND
| | | | |
| NOTES TO FINANCIAL STATEMENTS Unaudited / Continued | | |
|
| 4. Purchases and sales of Securities (Continued) | | |
| | | | | | | | |
| | | Purchases | | | Sales | |
| |
Investment securities | | $ | 50,404,914 | | | $ | 55,883,503 | |
5. Fees and Other Transactions with Affiliates
Management Fees. Under the investment advisory agreement, the Fund pays the Manager a management fee based on the daily net assets of the Fund at an annual rate as shown in the following table:
| | | | |
| Fee Schedule | | | |
Up to $500 million | | | 0.65% | |
Next $500 million | | | 0.63 | |
Next $4 billion | | | 0.60 | |
Over $5 billion | | | 0.58 | |
The Fund’s management fee for the six months ended October 31, 2014 was 0.66% of average annual net assets before any applicable waivers.
Sub-Adviser Fees. The Manager has retained the Sub-Adviser to provide the day-to-day portfolio management of the Fund. Under the Sub-Advisory Agreement, the Manager pays the Sub-Adviser an annual fee in monthly installments, equal to a percentage of the investment management fee collected by the Manager from the Fund, which shall be calculated after any investment management fee waivers. The fee paid to the Sub-Adviser is paid by the Manager, not by the Fund.
Transfer Agent Fees. OFI Global (the “Transfer Agent”) serves as the transfer and shareholder servicing agent for the Fund. The Fund pays the Transfer Agent a fee based on annual net assets. Fees incurred and average net assets for each class with respect to these services are detailed in the Statement of Operations and Financial Highlights, respectively.
Sub-Transfer Agent Fees. The Transfer Agent has retained Shareholder Services, Inc., a wholly-owned subsidiary of OFI (the “Sub-Transfer Agent”), to provide the day-to-day transfer agent and shareholder servicing of the Fund. Under the Sub-Transfer Agency Agreement, the Transfer Agent pays the Sub-Transfer Agent an annual fee in monthly installments, equal to a percentage of the transfer agent fee collected by the Transfer Agent from the Fund, which shall be calculated after any applicable fee waivers. The fee paid to the Sub-Transfer Agent is paid by the Transfer Agent, not by the Fund.
Trustees’ Compensation. The Fund has adopted an unfunded retirement plan (the “Plan”) for the Fund’s Independent Trustees. Benefits are based on years of service and fees paid to each Trustee during their period of service. The Plan was frozen with respect to adding new participants effective December 31, 2006 (the “Freeze Date”) and existing Plan Participants as of the Freeze Date will continue to receive accrued benefits under the Plan. Active Independent Trustees as of the Freeze Date have each elected a distribution method with
34 OPPENHEIMER DIVIDEND OPPORTUNITY FUND
| | | | |
5. Fees and Other Transactions with Affiliates (Continued) | | |
respect to their benefits under the Plan. During the six months ended October 31, 2014, the Fund’s projected benefit obligations, payments to retired Trustees and accumulated liability were as follows:
| | | | |
Projected Benefit Obligations Decreased | | $ | 2,714 | |
Payments Made to Retired Trustees | | | 333 | |
Accumulated Liability as of October 31, 2014 | | | 18,980 | |
The Fund’s Board of Trustees (“Board”) has adopted a compensation deferral plan for Independent Trustees that enables Trustees to elect to defer receipt of all or a portion of the annual compensation they are entitled to receive from the Fund. For purposes of determining the amount owed to the Trustee under the plan, deferred amounts are treated as though equal dollar amounts had been invested in shares of the Fund or in other Oppenheimer funds selected by the Trustee. The Fund purchases shares of the funds selected for deferral by the Trustee in amounts equal to his or her deemed investment, resulting in a Fund asset equal to the deferred compensation liability. Such assets are included as a component of “Other” within the asset section of the Statement of Assets and Liabilities. Deferral of Trustees’ fees under the plan will not affect the net assets of the Fund and will not materially affect the Fund’s assets, liabilities or net investment income per share. Amounts will be deferred until distributed in accordance with the compensation deferral plan.
Distribution and Service Plan (12b-1) Fees. Under its General Distributor’s Agreement with the Fund, OppenheimerFunds Distributor, Inc. (the “Distributor”) acts as the Fund’s principal underwriter in the continuous public offering of the Fund’s classes of shares.
Service Plan for Class A Shares. The Fund has adopted a Service Plan (the “Plan”) for Class A shares pursuant to Rule 12b-1 under the 1940 Act. Under the Plan, the Fund reimburses the Distributor for a portion of its costs incurred for services provided to accounts that hold Class A shares. Reimbursement is made periodically at an annual rate of up to 0.25% of the daily net assets of Class A shares of the Fund. The Distributor currently uses all of those fees to pay dealers, brokers, banks and other financial institutions periodically for providing personal service and maintenance of accounts of their customers that hold Class A shares. Any unreimbursed expenses the Distributor incurs with respect to Class A shares in any fiscal year cannot be recovered in subsequent periods. Fees incurred by the Fund under the Plan are detailed in the Statement of Operations.
Distribution and Service Plans for Class B, Class C and Class R Shares. The Fund has adopted Distribution and Service Plans (the “Plans”) for Class B, Class C and Class R shares pursuant to Rule 12b-1 under the 1940 Act to compensate the Distributor for distributing those share classes, maintaining accounts and providing shareholder services. Under the Plans, the Fund pays the Distributor an annual asset-based sales charge of 0.75% on Class B and Class C shares daily net assets and 0.25% on Class R shares daily net assets. The Fund also pays a service fee under the Plans at an annual rate of 0.25% of daily net assets. The
35 OPPENHEIMER DIVIDEND OPPORTUNITY FUND
| | | | |
| NOTES TO FINANCIAL STATEMENTS Unaudited / Continued | | |
| | |
| 5. Fees and Other Transactions with Affiliates (Continued) | | |
Plans continue in effect from year to year only if the Fund’s Board of Trustees vote annually to approve its continuance at an in person meeting called for that purpose. Fees incurred by the Fund under the Plans are detailed in the Statement of Operations.
Sales Charges. Front-end sales charges and CDSC do not represent expenses of the Fund. They are deducted from the proceeds of sales of Fund shares prior to investment or from redemption proceeds prior to remittance, as applicable. The sales charges retained by the Distributor from the sale of shares and the CDSC retained by the Distributor on the redemption of shares is shown in the following table for the period indicated.
| | | | | | | | |
| Six Months Ended | | Class A Front-End Sales Charges Retained by Distributor | | Class B Contingent Deferred Sales Charges Retained by Distributor | | Class C Contingent Deferred Sales Charges Retained by Distributor | | Class R Contingent Deferred Sales Charges Retained by Distributor |
|
October 31, 2014 | | $31,748 | | $3,431 | | $887 | | $87 |
Waivers and Reimbursements of Expenses. The Manager will waive fees and/or reimburse Fund expenses in an amount equal to the indirect management fees incurred through the Fund’s investment in IMMF. During the six months ended October 31, 2014, the Manager waived fees and/or reimbursed the Fund $1,334 for IMMF management fees.
The Transfer Agent has contractually agreed to limit transfer and shareholder servicing agent fees for Classes B, C, R and Y shares to 0.35% of average annual net assets per class and for Class A shares to 0.30% of average annual net assets of the class. The limit was removed on August 28, 2014.
During the six months ended October 31, 2014, the Transfer Agent waived transfer and shareholder servicing agent fees as follows:
| | | | |
Class A | | $ | 690 | |
Class C | | | 174 | |
Class R | | | 114 | |
These undertakings may be modified or terminated as set forth according to the terms in the prospectus.
6. Risk Exposures and the Use of Derivative Instruments
The Fund’s investment objective not only permits the Fund to purchase investment securities, it also allows the Fund to enter into various types of derivatives contracts, including, but not limited to, futures contracts, forward currency exchange contracts, credit default swaps, interest rate swaps, total return swaps, variance swaps and purchased and written options. In doing so, the Fund will employ strategies in differing combinations to permit it to increase, decrease, or change the level or types of exposure to market risk factors. These instruments may allow the Fund to pursue its objectives more quickly and efficiently than if it were to
36 OPPENHEIMER DIVIDEND OPPORTUNITY FUND
| | | | |
6. Risk Exposures and the Use of Derivative Instruments (Continued) | | |
make direct purchases or sales of securities capable of effecting a similar response to market factors. Such contracts may be entered into through a bilateral over-the-counter (“OTC”) transaction, or through a securities or futures exchange and cleared through a clearinghouse.
Market Risk Factors. In accordance with its investment objectives, the Fund may use derivatives to increase or decrease its exposure to one or more of the following market risk factors:
Commodity Risk. Commodity risk relates to the change in value of commodities or commodity indexes as they relate to increases or decreases in the commodities market. Commodities are physical assets that have tangible properties. Examples of these types of assets are crude oil, heating oil, metals, livestock, and agricultural products.
Credit Risk. Credit risk relates to the ability of the issuer to meet interest and principal payments, or both, as they come due. In general, lower-grade, higher-yield bonds are subject to credit risk to a greater extent than lower-yield, higher-quality bonds.
Equity Risk. Equity risk relates to the change in value of equity securities as they relate to increases or decreases in the general market.
Foreign Exchange Rate Risk. Foreign exchange rate risk relates to the change in the U.S. dollar value of a security held that is denominated in a foreign currency. The U.S. dollar value of a foreign currency denominated security will decrease as the dollar appreciates against the currency, while the U.S. dollar value will increase as the dollar depreciates against the currency.
Interest Rate Risk. Interest rate risk refers to the fluctuations in value of fixed-income securities resulting from the inverse relationship between price and yield. For example, an increase in general interest rates will tend to reduce the market value of already issued fixed-income investments, and a decline in general interest rates will tend to increase their value. In addition, debt securities with longer maturities, which tend to have higher yields, are subject to potentially greater fluctuations in value from changes in interest rates than obligations with shorter maturities.
Volatility Risk. Volatility risk refers to the magnitude of the movement, but not the direction of the movement, in a financial instrument’s price over a defined time period. Large increases or decreases in a financial instrument’s price over a relative time period typically indicate greater volatility risk, while small increases or decreases in its price typically indicate lower volatility risk.
Derivatives may have little or no initial cash investment relative to their market value exposure and therefore can produce significant gains or losses in excess of their cost due to unanticipated changes in the market risk factors and the overall market. This use of embedded leverage allows the Fund to increase its market value exposure relative to its net assets and can substantially increase the volatility of the Fund’s performance. In instances where the Fund is using derivatives to decrease, or hedge, exposures to market risk factors for securities held by the Fund, there are also risks that those derivatives may not perform as expected resulting in losses for the combined or hedged positions. Some derivatives have the potential for unlimited loss, regardless of the size of the Fund’s initial investment.
37 OPPENHEIMER DIVIDEND OPPORTUNITY FUND
| | | | |
| NOTES TO FINANCIAL STATEMENTS Unaudited / Continued | | |
| | |
| 6. Risk Exposures and the Use of Derivative Instruments (Continued) | | |
Additional associated risks from investing in derivatives also exist and potentially could have significant effects on the valuation of the derivative and the Fund. Typically, the associated risks are not the risks that the Fund is attempting to increase or decrease exposure to, per its investment objectives, but are the additional risks from investing in derivatives. Examples of these associated risks are liquidity risk, which is the risk that the Fund will not be able to sell the derivative in the open market in a timely manner, and counterparty credit risk, which is the risk that the counterparty will not fulfill its obligation to the Fund.
The Fund’s actual exposures to these market risk factors and associated risks during the period are discussed in further detail, by derivative type, below.
Forward Currency Exchange Contracts
The Fund may enter into forward currency exchange contracts (“forward contracts”) for the purchase or sale of a foreign currency at a negotiated rate at a future date. Such contracts are traded in the OTC inter-bank currency dealer market.
Forward contracts are reported on a schedule following the Statement of Investments. The unrealized appreciation (depreciation) is reported in the Statement of Assets and Liabilities as a receivable (or payable) and in the Statement of Operations within the change in unrealized appreciation (depreciation). At contract close, the difference between the original cost of the contract and the value at the close date is recorded as a realized gain (loss) in the Statement of Operations.
The Fund has entered into forward contracts with the obligation to purchase specified foreign currencies in the future at a currently negotiated forward rate in order to take a positive investment perspective on the related currency. These forward contracts seek to increase exposure to foreign exchange rate risk.
The Fund has entered into forward contracts with the obligation to sell specified foreign currencies in the future at a currently negotiated forward rate in order to decrease exposure to foreign exchange rate risk associated with foreign currency denominated securities held by the Fund.
During the six months ended October 31, 2014, the Fund had daily average contract amounts on forward contracts to buy and sell of $1,849,135 and $18,346,536, respectively.
Additional associated risk to the Fund includes counterparty credit risk. Counterparty credit risk arises from the possibility that the counterparty to a forward contract will default and fail to perform its obligations to the Fund.
Counterparty Credit Risk. Derivative positions are subject to the risk that the counterparty will not fulfill its obligation to the Fund. The Fund intends to enter into derivative transactions with counterparties that the Manager believes to be creditworthy at the time of the transaction.
The Fund’s risk of loss from counterparty credit risk on OTC derivatives is generally limited to the aggregate unrealized gain netted against any collateral held by the Fund. For OTC options purchased, the Fund bears the risk of loss of the amount of the premiums paid plus the positive change in market values net of any collateral held by the Fund should the counterparty fail to perform under the contracts. Options written by the Fund do not typically give rise to counterparty credit risk, as options written generally obligate the Fund and not the counterparty to perform.
38 OPPENHEIMER DIVIDEND OPPORTUNITY FUND
| | | | |
6. Risk Exposures and the Use of Derivative Instruments (Continued) | | |
To reduce counterparty risk with respect to OTC transactions, the Fund has entered into master netting arrangements, established within the Fund’s International Swap and Derivatives Association, Inc. (“ISDA”) master agreements, which allow the Fund to make (or to have an entitlement to receive) a single net payment in the event of default (close-out netting) for outstanding payables and receivables with respect to certain OTC positions in swaps, options, swaptions, and forward currency exchange contracts for each individual counterparty. In addition, the Fund may require that certain counterparties post cash and/or securities in collateral accounts to cover their net payment obligations for those derivative contracts subject to ISDA master agreements. If the counterparty fails to perform under these contracts and agreements, the cash and/or securities will be made available to the Fund.
As of October 31, 2014, the Fund has not required certain counterparties to post collateral.
ISDA master agreements include credit related contingent features which allow counterparties to OTC derivatives to terminate derivative contracts prior to maturity in the event that, for example, the Fund’s net assets decline by a stated percentage or the Fund fails to meet the terms of its ISDA master agreements, which would cause the Fund to accelerate payment of any net liability owed to the counterparty.
For financial reporting purposes, the Fund does not offset derivative assets and derivative liabilities that are subject to netting arrangements in the Statement of Assets and Liabilities. Bankruptcy or insolvency laws of a particular jurisdiction may impose restrictions on or prohibitions against the right of offset in bankruptcy, insolvency or other events.
The Fund’s risk of loss from counterparty credit risk on exchange-traded derivatives cleared through a clearinghouse and for centrally cleared swaps is generally considered lower than as compared to OTC derivatives. However, counterparty credit risk exists with respect to initial and variation margin deposited/paid by the Fund that is held in futures commission merchant, broker and/or clearinghouse accounts for such exchange-traded derivatives and for centrally cleared swaps.
With respect to centrally cleared swaps, such transactions will be submitted for clearing, and if cleared, will be held in accounts at futures commission merchants or brokers that are members of clearinghouses. While brokers, futures commission merchants and clearinghouses are required to segregate customer margin from their own assets, in the event that a broker, futures commission merchant or clearinghouse becomes insolvent or goes into bankruptcy and at that time there is a shortfall in the aggregate amount of margin held by the broker, futures commission merchant or clearinghouse for all its customers, U.S. bankruptcy laws will typically allocate that shortfall on a pro-rata basis across all the broker’s, futures commission merchant’s or clearinghouse’s customers, potentially resulting in losses to the Fund.
There is the risk that a broker, futures commission merchant or clearinghouse will decline to clear a transaction on the Fund’s behalf, and the Fund may be required to pay a termination fee to the executing broker with whom the Fund initially enters into the transaction. Clearinghouses may also be permitted to terminate centrally cleared swaps at any time. The Fund is also subject to the risk that the broker or futures commission merchant will
39 OPPENHEIMER DIVIDEND OPPORTUNITY FUND
| | | | |
| NOTES TO FINANCIAL STATEMENTS Unaudited / Continued | | |
| | |
| 6. Risk Exposures and the Use of Derivative Instruments (Continued) | | |
improperly use the Fund’s assets deposited/paid as initial or variation margin to satisfy payment obligations of another customer. In the event of a default by another customer of the broker or futures commission merchant, the Fund might not receive its variation margin payments from the clearinghouse, due to the manner in which variation margin payments are aggregated for all customers of the broker/futures commission merchant.
Collateral and margin requirements differ by type of derivative. Margin requirements are established by the broker, futures commission merchant or clearinghouse for exchange-traded and cleared derivatives, including centrally cleared swaps. Brokers, futures commission merchants and clearinghouses can ask for margin in excess of the regulatory minimum, or increase the margin amount, in certain circumstances.
Collateral terms are contract specific for OTC derivatives. For derivatives traded under an ISDA master agreement, the collateral requirements are typically calculated by netting the mark to market amount for each transaction under such agreement and comparing that amount to the value of any collateral currently pledged by the Fund or the counterparty.
For financial reporting purposes, cash collateral that has been pledged to cover obligations of the Fund, if any, is reported separately on the Statement of Assets and Liabilities as cash pledged as collateral. Non-cash collateral pledged by the Fund, if any, is noted in the Statement of Investments. Generally, the amount of collateral due from or to a party must exceed a minimum transfer amount threshold (e.g. $250,000) before a transfer has to be made. To the extent amounts due to the Fund from its counterparties are not fully collateralized, contractually or otherwise, the Fund bears the risk of loss from counterparty nonperformance.
The following table presents by counterparty the Fund’s OTC derivative assets net of the related collateral posted for the benefit of the Fund at October 31, 2014:
| | | | | | | | | | | | | | | | | | | | |
| | | | | | Gross Amounts Not Offset in the Statement
of Assets & Liabilities | | | | |
| Counterparty | | Gross Amount
of Assets in the
Statement of
Assets &
Liabilities* | | | Financial
Instruments
Available for
Offset | | | Financial
Instruments
Collateral
Received** | | | Cash Collateral
Received** | | | Net Amount | |
| |
| Citibank NA | | $ | 341,084 | | | $ | — | | | $ | — | | | $ | — | | | $ | 341,084 | |
| Royal Bank of Scotland plc (The) | | | 507,772 | | | | — | | | | — | | | | — | | | $ | 507,772 | |
| | | | |
Total | | $ | 848,856 | | | $ | — | | | $ | — | | | $ | — | | | $ | 848,856 | |
| | | | |
* OTC derivatives are reported gross on the Statement of Assets and Liabilities. Exchange traded options and margin related to cleared swaps and futures are excluded from these reported amounts.
** Reported collateral posted for the benefit of the Fund within this table is limited to the net outstanding amount due from an individual counterparty. The collateral posted for the benefit of the Fund may exceed these amounts.
The following table presents by counterparty the Fund’s OTC derivative liabilities net of the related collateral pledged by the Fund at October 31, 2014:
40 OPPENHEIMER DIVIDEND OPPORTUNITY FUND
| | | | |
6. Risk Exposures and the Use of Derivative Instruments (Continued) | | |
| | | | | | | | | | | | | | | | | | | | |
| | | | | | Gross Amounts Not Offset in the Statement
of Assets & Liabilities | | | | |
| Counterparty | | Gross Amount
of Liabilities in
the Statement
of Assets &
Liabilities* | | | Financial
Instruments
Available for
Offset | | | Financial
Instruments
Collateral
Pledged** | | | Cash Collateral
Pledged** | | | Net Amount | |
| |
JPMorgan Chase Bank NA | | $ | (164,265) | | | $ | — | | | $ | — | | | $ | — | | | $ | (164,265) | |
* OTC derivatives are reported gross on the Statement of Assets and Liabilities. Exchange traded options and margin related to cleared swaps and futures are excluded from these reported amounts.
** Reported collateral pledged within this table is limited to the net outstanding amount due from the Fund. The securities pledged as collateral by the Fund as reported on the Consolidated Statements of investments may exceed these amounts.
The following table presents the valuations of derivative instruments by risk exposure as reported within the Statement of Assets and Liabilities as of October 31, 2014:
| | | | | | | | |
| | | Asset Derivatives | | Liability Derivatives |
Derivatives Not Accounted for as Hedging Instruments | | Statement of Assets and
Liabilities Location | | Value | | Statement of Assets and
Liabilities Location | | Value |
|
Foreign exchange contracts | | Unrealized appreciation on foreign currency exchange contracts | | $ 848,856 | | Unrealized depreciation on foreign currency exchange contracts | | $ 164,265 |
The effect of derivative instruments on the Statement of Operations is as follows:
| | | | |
| Amount of Realized Gain or (Loss) Recognized on Derivatives | |
| |
Derivatives Not Accounted for as Hedging Instruments | | Foreign currency transactions | |
| |
Foreign exchange contracts | | $ | 880,016 | |
|
| Amount of Change in Unrealized Gain or (Loss) Recognized on Derivatives | |
| |
Derivatives Not Accounted for as Hedging Instruments | | Translation of assets and
liabilities denominated in
foreign currencies | |
| |
Foreign exchange contracts | | $ | 670,030 | |
7. Pending Litigation
In 2009, seven class action lawsuits were filed in the U.S. District Court for the District of Colorado against OppenheimerFunds, Inc. (“OFI”), OppenheimerFunds Distributor, Inc., the Fund’s principal underwriter and distributor (the “Distributor”), and certain funds (but not including the Fund) advised by OFI Global Asset Management, Inc. and distributed by the Distributor (the “Defendant Funds”). The lawsuits also named as defendants certain officers and current and former trustees of the respective Defendant Funds. The lawsuits raised claims under federal securities laws and alleged, among other things, that the disclosure documents of the respective Defendant Funds contained misrepresentations and omissions and that the respective Defendant Funds’ investment policies were not followed. The plaintiffs in these
41 OPPENHEIMER DIVIDEND OPPORTUNITY FUND
| | | | |
| NOTES TO FINANCIAL STATEMENTS Unaudited / Continued | | |
| | |
| 7. Pending Litigation (Continued) | | |
actions sought unspecified damages, equitable relief and awards of attorneys’ fees and litigation expenses. The Defendant Funds’ Boards of Trustees also engaged counsel to represent the Funds and the present and former Independent Trustees named in those suits. In March 2014, the parties in six of these lawsuits executed stipulations and agreements of settlement resolving those actions. In July 2014, the court entered an order and final judgment approving the settlements as fair, reasonable and adequate. The settlements do not resolve a seventh outstanding lawsuit relating to Oppenheimer Rochester California Municipal Fund (the “California Fund Suit”). OFI believes the California Fund Suit is without legal merit and is defending the suit vigorously. While it is premature to render any opinion as to the outcome in the California Fund Suit, or whether any costs that OFI may bear in defending the California Fund Suit might not be reimbursed by insurance, OFI believes the California Fund Suit should not impair the ability of OFI or the Distributor to perform their respective duties to the Fund, and that the outcome of the California Fund Suit should not have any material effect on the operations of any of the Oppenheimer Funds.
42 OPPENHEIMER DIVIDEND OPPORTUNITY FUND
BOARD APPROVAL OF THE FUND’S INVESTMENT ADVISORY AND
SUB-ADVISORY AGREEMENTS Unaudited
The Fund has entered into an investment advisory agreement with OFI Global Asset Management, Inc. (“OFI Global” or the “Adviser”), a wholly-owned subsidiary of OppenheimerFunds, Inc. (“OFI” or the “Sub-Adviser”) (“OFI Global” and “OFI” together the “Managers”) and OFI Global has entered into a sub-advisory agreement with OFI whereby OFI provides investment sub-advisory services to the Fund (collectively, the “Agreements”). Each year, the Board of Trustees (the “Board”), including a majority of the independent Trustees, is required to determine whether to renew the Agreements. The Investment Company Act of 1940, as amended, requires that the Board request and evaluate, and that the Managers provide, such information as may be reasonably necessary to evaluate the terms of the Agreements. The Board employs an independent consultant to prepare a report that provides information, including comparative information that the Board requests for that purpose. In addition to in-person meetings focused on this evaluation, the Board receives information throughout the year regarding Fund services, fees, expenses and performance.
The Adviser, Sub-Adviser and the independent consultant provided information to the Board on the following factors: (i) the nature, quality and extent of the Managers’ services, (ii) the investment performance of the Fund and the Managers, (iii) the fees and expenses of the Fund, including comparative expense information, (iv) the profitability of the Managers and their affiliates, including an analysis of the cost of providing services, (v) whether economies of scale are realized as the Fund grows and whether fee levels reflect these economies of scale for Fund investors and (vi) other benefits to the Managers from their relationship with the Fund. The Board was aware that there are alternatives to retaining the Managers.
Outlined below is a summary of the principal information considered by the Board as well as the Board’s conclusions.
Nature, Quality and Extent of Services. The Board considered information about the nature, quality and extent of the services provided to the Fund and information regarding the Managers’ key personnel who provide such services. The Sub-Adviser’s duties include providing the Fund with the services of the portfolio manager and the Sub-Adviser’s investment team, who provide research, analysis and other advisory services in regard to the Fund’s investments; securities trading services; oversight of third-party service providers; monitoring compliance with applicable Fund policies and procedures and adherence to the Fund’s investment restrictions; and risk management. The Managers are responsible for providing certain administrative services to the Fund as well. Those services include providing and supervising all administrative and clerical personnel who are necessary in order to provide effective corporate administration for the Fund; compiling and maintaining records with respect to the Fund’s operations; preparing and filing reports required by the Securities and Exchange Commission; preparing periodic reports regarding the operations of the Fund for its shareholders; preparing proxy materials for shareholder meetings; and preparing the registration statements required by Federal and state securities laws for the sale of the Fund’s shares. The Managers also provide the Fund with office space, facilities and equipment.
The Board also considered the quality of the services provided and the quality of the Managers’ resources that are available to the Fund. The Board took account of the fact that the Sub-Adviser has had over fifty years of experience as an investment adviser and that its assets under management rank it among the top mutual fund managers in the United States. The Board evaluated the Sub-Adviser’s advisory, administrative, accounting, legal, compliance
43 OPPENHEIMER DIVIDEND OPPORTUNITY FUND
BOARD APPROVAL OF THE FUND’S INVESTMENT ADVISORY AND
SUB-ADVISORY AGREEMENTS Unaudited / Continued
services and risk management, and information the Board has received regarding the experience and professional qualifications of the Managers’ key personnel and the size and functions of its staff. In its evaluation of the quality of the portfolio management services provided, the Board considered the experience of Laton Spahr, the portfolio manager for the Fund, and the Sub-Adviser’s investment team and analysts. The Board members also considered the totality of their experiences with the Managers as directors or trustees of the Fund and other funds advised by the Managers. The Board considered information regarding the quality of services provided by affiliates of the Managers, which its members have become knowledgeable about in connection with the renewal of the Fund’s service agreements. The Board concluded, in light of the Managers’ experience, reputation, personnel, operations and resources that the Fund benefits from the services provided under the Agreements.
Investment Performance of the Adviser and the Fund. Throughout the year, the Adviser provided information on the investment performance of the Fund, including comparative performance information. The Board also reviewed information, prepared by the Adviser and by the independent consultant, comparing the Fund’s historical performance to relevant market indices and to the performance of other retail funds in the Large Value category. The Board noted that the Fund’s one-year, three-year, five-year and ten-year performance was below its category median.
Costs of Services by the Adviser. The Board reviewed the fees paid to the Adviser and the other expenses borne by the Fund. Also, reviewed other accounts managed by the Sub-Adviser. The independent consultant provided comparative data in regard to the fees and expenses of the Fund and other retail front-end load Large Value funds with comparable asset levels and distribution features. The Fund’s contractual management fees and total expenses were lower than its peer group median and category median.
Economies of Scale and Profits Realized by the Managers. The Board considered information regarding OFI Global’s costs in serving as the Fund’s investment adviser, including the costs associated with the personnel and systems necessary to manage the Fund, and information regarding the Managers’ profitability from their relationship with the Fund. The Board reviewed whether the Managers may realize economies of scale in managing and supporting the Fund. The Board noted that the Fund currently has management fee breakpoints, which are intended to share with Fund shareholders economies of scale that may exist as the Fund’s assets grow.
Other Benefits to the Managers. In addition to considering the profits realized by the Managers, the Board considered information that was provided regarding the direct and indirect benefits the Managers receive as a result of their relationship with the Fund, including compensation paid to the Managers’ affiliates. and research provided to the Adviser in connection with permissible brokerage arrangements (soft dollar arrangements).The Board also considered that the Managers must be able to pay and retain experienced professional personnel at competitive rates to provide quality services to the Fund.
Conclusions. These factors were also considered by the independent Trustees meeting separately from the full Board, assisted by experienced counsel to the Fund and to the independent Trustees. Fund counsel and the independent Trustees’ counsel are independent of the Managers within the meaning and intent of the Securities and Exchange Commission Rules.
44 OPPENHEIMER DIVIDEND OPPORTUNITY FUND
Based on its review of the information it received and its evaluations described above, the Board, including a majority of the independent Trustees, decided to continue the Agreements through September 30, 2015. In arriving at its decision, the Board did not identify any factor or factors as being more important than others, but considered all of the above information, and considered the terms and conditions of the Agreements, including the management fees, in light of all the surrounding circumstances.
45 OPPENHEIMER DIVIDEND OPPORTUNITY FUND
PORTFOLIO PROXY VOTING POLICIES AND PROCEDURES;
UPDATES TO STATEMENTS OF INVESTMENTS Unaudited
The Fund has adopted Portfolio Proxy Voting Policies and Procedures under which the Fund votes proxies relating to securities (“portfolio proxies”) held by the Fund. A description of the Fund’s Portfolio Proxy Voting Policies and Procedures is available (i) without charge, upon request, by calling the Fund toll-free at 1.800.CALL OPP (225.5677), (ii) on the Fund’s website at www.oppenheimerfunds.com, and (iii) on the SEC’s website at www.sec.gov. In addition, the Fund is required to file Form N-PX, with its complete proxy voting record for the 12 months ended June 30th, no later than August 31st of each year. The Fund’s voting record is available (i) without charge, upon request, by calling the Fund toll-free at 1.800.CALL OPP (225.5677), and (ii) in the Form N-PX filing on the SEC’s website at www.sec.gov.
The Fund files its complete schedule of portfolio holdings with the SEC for the first quarter and the third quarter of each fiscal year on Form N-Q. The Fund’s Form N-Q filings are available on the SEC’s website at www.sec.gov. Those forms may be reviewed and copied at the SEC’s Public Reference Room in Washington, D.C. Information on the operation of the Public Reference Room may be obtained by calling 1-800-SEC-0330.
Householding—Delivery of Shareholder Documents
This is to inform you about OppenheimerFunds’ “householding” policy. If more than one member of your household maintains an account in a particular fund, OppenheimerFunds will mail only one copy of the fund’s prospectus (or, if available, the fund’s summary prospectus), annual and semiannual report and privacy policy. The consolidation of these mailings, called householding, benefits your fund through reduced mailing expense, and benefits you by reducing the volume of mail you receive from OppenheimerFunds. Householding does not affect the delivery of your account statements.
Please note that we will continue to household these mailings for as long as you remain an OppenheimerFunds shareholder, unless you request otherwise. If you prefer to receive multiple copies of these materials, please call us at 1.800.CALL-OPP (225-5677). You may also notify us in writing or via email. We will begin sending you individual copies of the prospectus (or, if available, the summary prospectus), reports and privacy policy within 30 days of receiving your request to stop householding.
46 OPPENHEIMER DIVIDEND OPPORTUNITY FUND
OPPENHEIMER DIVIDEND OPPORTUNITY FUND
| | |
| Trustees and Officers | | Brian F. Wruble, Chairman of the Board of Trustees and Trustee |
| | David K. Downes, Trustee |
| | Matthew P. Fink, Trustee |
| | Edmund P. Giambastiani, Jr., Trustee |
| | Mary F. Miller, Trustee |
| | Joel W. Motley, Trustee |
| | Joanne Pace, Trustee |
| | Peter I. Wold, Trustee |
| | William F. Glavin, Jr., Trustee |
| | Laton Spahr, Vice President |
| | Arthur P. Steinmetz, President and Principal Executive Officer |
| | Arthur S. Gabinet, Secretary and Chief Legal Officer |
| | Jennifer Sexton, Vice President and Chief Business Officer |
| | Mary Ann Picciotto, Chief Compliance Officer and Chief Anti-Money |
| | Laundering Officer |
| | Brian W. Wixted, Treasurer and Principal Financial & Accounting Officer |
| |
| Manager | | OppenheimerFunds, Inc. |
| |
| Distributor | | OppenheimerFunds Distributor, Inc. |
| |
Transfer and Shareholder Servicing Agent | | OppenheimerFunds Services |
| |
Independent Registered Public Accounting Firm | | KPMGLLP |
| |
| Legal Counsel | | Kramer Levin Naftalis & Frankel LLP |
| |
| | The financial statements included herein have been taken from the records of the Fund without examination of those records by the independent registered public accounting firm. |
| |
| | © 2014 OppenheimerFunds, Inc. All rights reserved |
47 OPPENHEIMER DIVIDEND OPPORTUNITY FUND
PRIVACY POLICY NOTICE
As an Oppenheimer fund shareholder, you are entitled to know how we protect your personal information and how we limit its disclosure.
Information Sources
We obtain nonpublic personal information about our shareholders from the following sources:
| • | | Applications or other forms |
| • | | When you create a user ID and password for online account access |
| • | | When you enroll in eDocs Direct, our electronic document delivery service |
| • | | Your transactions with us, our affiliates or others |
| • | | A software program on our website, often referred to as a “cookie,” which indicates which parts of our site you’ve visited |
| • | | When you set up challenge questions to reset your password online |
If you visit oppenheimerfunds.com and do not log on to the secure account information areas, we do not obtain any personal information about you. When you do log on to a secure area, we do obtain your user ID and password to identify you. We also use this information to provide you with products and services you have requested, to inform you about products and services that you may be interested in and assist you in other ways.
We do not collect personal information through our website unless you willingly provide it to us, either directly by email or in those areas of the website that request information. In order to update your personal information (including your mailing address, email address and phone number) you must first log on and visit your user profile.
If you have set your browser to warn you before accepting cookies, you will receive the warning message with each cookie. You can refuse cookies by turning them off in your browser. However, doing so may limit your access to certain sections of our website.
We use cookies to help us improve and manage our website. For example, cookies help us recognize new versus repeat visitors to the site, track the pages visited, and enable some special features on the website. This data helps us provide a better service for our website visitors.
Protection of Information
We do not disclose any non-public personal information (such as names on a customer list) about current or former customers to anyone, except as permitted by law.
Disclosure of Information
Copies of confirmations, account statements and other documents reporting activity in your fund accounts are made available to your financial advisor (as designated by you). We may also use details about you and your investments to help us, our financial service affiliates, or firms that jointly market their financial products and services with ours, to better serve your investment needs or suggest financial services or educational material that may be of interest to you. If this requires us to provide you with an opportunity to “opt in” or “opt out” of such information sharing with a firm not affiliated with us, you will receive notification on how to do so, before any such sharing takes place.
Right of Refusal
We will not disclose your personal information to unaffiliated third parties (except as permitted by law), unless we first offer you a reasonable opportunity to refuse or “opt out” of such disclosure.
48 OPPENHEIMER DIVIDEND OPPORTUNITY FUND
Internet Security and Encryption
In general, the email services provided by our website are encrypted and provide a secure and private means of communication with us. To protect your own privacy, confidential and/or personal information should only be communicated via email when you are advised that you are using a secure website. As a security measure, we do not include personal or account information in non-secure emails, and we advise you not to send such information to us in non-secure emails. Instead, you may take advantage of the secure features of our website to encrypt your email correspondence. To do this, you will need to use a browser that supports Secure Sockets Layer (SSL) protocol.
We do not guarantee or warrant that any part of our website, including files available for download, are free of viruses or other harmful code. It is your responsibility to take appropriate precautions, such as use of an anti-virus software package, to protect your computer hardware and software.
| • | | All transactions, including redemptions, exchanges and purchases, are secured by SSL and 128-bit encryption. SSL is used to establish a secure connection between your PC and OppenheimerFunds’ server. It transmits information in an encrypted and scrambled format. |
| • | | Encryption is achieved through an electronic scrambling technology that uses a “key” to code and then decode the data. Encryption acts like the cable converter box you may have on your television set. It scrambles data with a secret code so that no one can make sense of it while it is being transmitted. When the data reaches its destination, the same software unscrambles the data. |
| • | | You can exit the secure area by either closing your browser, or for added security, you can use the Log Out button before you close your browser. |
Other Security Measures
We maintain physical, electronic and procedural safeguards to protect your personal account information. Our employees and agents have access to that information only so that they may offer you products or provide services, for example, when responding to your account questions.
How You Can Help
You can also do your part to keep your account information private and to prevent unauthorized transactions. If you obtain a user ID and password for your account, do not allow it to be used by anyone else. Also, take special precautions when accessing your account on a computer used by others.
Who We Are
This joint notice describes the privacy policies of the Oppenheimer funds, OppenheimerFunds, Inc., each of its investment adviser subsidiaries, OppenheimerFunds Distributor, Inc. and OFI Global Trust Co. It applies to all Oppenheimer fund accounts you presently have, or may open in the future, using your Social Security number—whether or not you remain a shareholder of our funds. This notice was last updated November 2014. In the event it is updated or changed, we will post an updated notice on our website at oppenheimerfunds.com. If you have any questions about this privacy policy, write to us at P.O. Box 5270, Denver, CO 80217-5270, email us by clicking on the Contact Us section of our website at oppenheimerfunds.com or call us at 1.800.CALL OPP (225.5677).
49 OPPENHEIMER DIVIDEND OPPORTUNITY FUND
THIS PAGE INTENTIONALLY LEFT BLANK.
50 OPPENHEIMER DIVIDEND OPPORTUNITY FUND
THIS PAGE INTENTIONALLY LEFT BLANK.
51 OPPENHEIMER DIVIDEND OPPORTUNITY FUND
THIS PAGE INTENTIONALLY LEFT BLANK.
52 OPPENHEIMER DIVIDEND OPPORTUNITY FUND
THIS PAGE INTENTIONALLY LEFT BLANK.
53 OPPENHEIMER DIVIDEND OPPORTUNITY FUND
THIS PAGE INTENTIONALLY LEFT BLANK.
54 OPPENHEIMER DIVIDEND OPPORTUNITY FUND
THIS PAGE INTENTIONALLY LEFT BLANK.
55 OPPENHEIMER DIVIDEND OPPORTUNITY FUND

Item 2. Code of Ethics.
Not applicable to semiannual reports.
Item 3. Audit Committee Financial Expert.
Not applicable to semiannual reports.
Item 4. Principal Accountant Fees and Services.
Not applicable to semiannual reports.
Item 5. Audit Committee of Listed Registrants
Not applicable.
Item 6. Schedule of Investments.
a) Not applicable. The complete schedule of investments is included in Item 1 of this Form N-CSR.
b) Not applicable.
Item 7. Disclosure of Proxy Voting Policies and Procedures for Closed-End Management Investment Companies.
Not applicable.
Item 8. Portfolio Managers of Closed-End Management Investment Companies.
Not applicable.
Item 9. Purchases of Equity Securities by Closed-End Management Investment Company and Affiliated Purchasers.
Not applicable.
Item 10. Submission of Matters to a Vote of Security Holders.
The Fund’s Governance Committee Provisions with Respect to Nominations of Directors/Trustees to the Respective Boards
None
Item 11. Controls and Procedures.
Based on their evaluation of the registrant’s disclosure controls and procedures (as defined in rule 30a-3(c) under the Investment Company Act of 1940 (17 CFR 270.30a-3(c)) as of 10/31/2014, the registrant’s principal executive officer and principal financial officer found the registrant’s disclosure controls and procedures to provide reasonable assurances that information required to be disclosed by the registrant in the reports that it files under the Securities Exchange Act of 1934 (a) is accumulated and communicated to registrant’s management, including its principal executive officer and principal financial officer, to allow timely decisions regarding required disclosure, and (b) is recorded, processed, summarized and reported, within the time periods specified in the rules and forms adopted by the U.S. Securities and Exchange Commission.
There have been no changes in the registrant’s internal controls over financial reporting that occurred during the registrant’s second fiscal quarter of the period covered by this report that have materially affected, or are reasonably likely to materially affect, the registrant’s internal control over financial reporting.
Item 12. Exhibits.
| (a) | (1) Not applicable to semiannual reports. |
| | (2) | Exhibits attached hereto. |
| (b) | Exhibit attached hereto. |
SIGNATURES
Pursuant to the requirements of the Securities Exchange Act of 1934 and the Investment Company Act of 1940, the registrant has duly caused this report to be signed on its behalf by the undersigned, thereunto duly authorized.
Oppenheimer Dividend Opportunity Fund
| | |
| By: | | /s/ Arthur P. Steinmetz |
| | Arthur P. Steinmetz |
| | Principal Executive Officer |
|
| Date: 12/12/2014 |
Pursuant to the requirements of the Securities Exchange Act of 1934 and the Investment Company Act of 1940, this report has been signed below by the following persons on behalf of the registrant and in the capacities and on the dates indicated.
| | |
| By: | | /s/ Arthur P. Steinmetz |
| | Arthur P. Steinmetz |
| | Principal Executive Officer |
|
| Date: 12/12/2014 |
| | |
| By: | | /s/ Brian W. Wixted |
| | Brian W. Wixted |
| | Principal Financial Officer |
|
| Date: 12/12/2014 |