UNITED STATES
SECURITIES AND EXCHANGE COMMISSION
WASHINGTON, D.C. 20549
FORM N-CSR
CERTIFIED SHAREHOLDER REPORT OF REGISTERED MANAGEMENT
INVESTMENT COMPANIES
Investment Company Act file number 811-21208
Oppenheimer Dividend Opportunity Fund
(Exact name of registrant as specified in charter)
6803 South Tucson Way, Centennial, Colorado 80112-3924
(Address of principal executive offices) (Zip code)
Cynthia Lo Bessette
OFI Global Asset Management, Inc.
225 Liberty Street, New York, New York 10281-1008
(Name and address of agent for service)
Registrant’s telephone number, including area code: (303) 768-3200
Date of fiscal year end: April 30
Date of reporting period: 4/30/2017
Item 1. Reports to Stockholders.

Table of Contents
Class A Shares
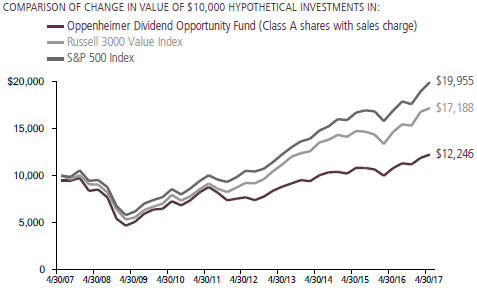
AVERAGE ANNUAL TOTAL RETURNS AT 4/30/17
| | | | | | | | |
| | | Class A Shares of the Fund | | | | |
| | | Without Sales Charge | | With Sales Charge | | Russell 3000 Value
Index | | S&P 500 Index |
1-Year | | 13.40% | | 6.88% | | 17.33% | | 17.92% |
|
5-Year | | 9.75 | | 8.46 | | 13.28 | | 13.68 |
|
10-Year | | 2.65 | | 2.05 | | 5.57 | | 7.15 |
|
Performance data quoted represents past performance, which does not guarantee future results. The investment return and principal value of an investment in the Fund will fluctuate so that an investor’s shares, when redeemed, may be worth more or less than their original cost. Fund returns include changes in share price, reinvested distributions, and a 5.75% maximum applicable sales charge except where “without sales charge” is indicated. Current performance may be lower or higher than the performance quoted. Returns do not consider capital gains or income taxes on an individual’s investment. For performance data current to the most recent month-end, visit oppenheimerfunds.com or call 1.800. CALL OPP (225.5677). See Fund prospectuses and summary prospectuses for more information on share classes and sales charges.
2 OPPENHEIMER DIVIDEND OPPORTUNITY FUND
Fund Performance Discussion
The Fund’s Class A shares (without sales charge) produced a return of 13.40% during the reporting period, versus the Russell 3000 Value Index (the “Index”), which returned 17.33% during the same period. The Fund underperformed the Index primarily within the health care, financials and consumer discretionary sectors. The Fund underperformed in these three sectors due to stock selection. An underweight position in the financials sector and an overweight position in the consumer discretionary sector also detracted from performance. The Fund outperformed the Index in the information technology, real estate and materials sectors. Stock selection drove the performance in these sectors. An underweight position in the real estate sector and an overweight position in the materials sector also benefited performance.
MARKET OVERVIEW
It would be an understatement to refer to 2016 as an eventful year, and the fourth quarter provided an exclamation point. Not only did the Chicago Cubs win their first world series in 108 years, the results of the Presidential election marked
a significant change in market sentiment that was widely unexpected. Similar to the surprise Brexit vote in June, expectations of a negative market reaction proved to be overly pessimistic, and the U.S. equity market reacted in a positive manner, with the Index
3 OPPENHEIMER DIVIDEND OPPORTUNITY FUND
gaining almost 8% between the election and mid-December, when the Federal Reserve increased the Federal Funds Rate by another quarter percent, only the second such move since the Financial Crisis.
Investors became optimistic that an incoming Trump administration would pursue a pro-growth economic agenda, specifically around corporate tax reform and deregulation. The primary beneficiary of the equity market’s year-end optimism was the financials sector, led by bank stocks. Rising interest rates, coupled with the prospect of lower corporate tax rates and a reduced regulatory burden could all benefit bank profitability, which drove valuation multiples higher for the group. Cyclical sectors such as energy, industrials, and materials also stood out as beneficiaries of potential higher economic growth rates. Historically defensive sectors such as consumer staples, health care, and real estate investment trusts (REITs) underperformed. The only defensive sector to buck the trend was telecommunication services, which stands to benefit from potential tax reform.
The first quarter of 2017 was, for the most part, a mirror image of the fourth quarter of 2016 with regards to sector performance. During this time, the Index was led by those sectors that had underperformed after the election. Information technology, health care, consumer staples, and utilities were notable outperformers. Financials, the standout from the fourth quarter, was relatively flat, and the biggest sector loser was energy.
Uncertainty about the implementation of the Trump pro-growth agenda arose in March, as Congress struggled to pass a bill meant to replace the Affordable Care Act. It became apparent that the likelihood of the more ambitious proposals passing was, at the very least, less likely than previously assumed.
Overall, all 11 sectors in the Index finished with gains for the one-year reporting period, with the strongest performers being information technology, financials, industrials and materials. The weakest performers were energy, telecommunication services, real estate and consumer discretionary.
FUND REVIEW
Top contributors to performance this reporting period included JPMorgan Chase & Co., Seagate Technology plc and Microchip Technology, Inc. While the Fund underperformed in the financials sector overall, the top performing holding for the Fund on an absolute basis was JPMorgan Chase & Co. As mentioned earlier, bank stocks drove the lion’s share of performance in financials. The prospect of tax and regulatory reform and a steeper yield curve led investors to wager that Returns on Equity (ROE) would improve for the group, which sent price-to-book multiples higher. As a result, we increased our position in JPMorgan.
Information technology was a strong performing sector this reporting period, with both Seagate and Microchip performing well. Seagate, a manufacturer of computer
4 OPPENHEIMER DIVIDEND OPPORTUNITY FUND
storage solutions, has seen surprisingly strong demand for its hard disk drives. Microchip Technology is a manufacturer of microcontroller, memory and analog semiconductors. The company acquired Atmel during the reporting period. The acquisition has generated accretion to earnings more quickly than anticipated, which has led to increased expectations for earnings growth going forward.
Detractors from performance included Teva Pharmaceutical Industries Ltd., Intesa Sanpaolo S.p.A. and Helmerich & Payne, Inc. We established a position in Teva Pharmaceuticals during the reporting period. Teva, a global provider of generic and specialty pharmaceuticals, detracted from performance as a result of concern over generic competition for its multiple sclerosis drug Copaxone. Our exposure to Intesa Sanpaolo, a large Italian bank, detracted from performance as the market called into question capital levels following the Brexit decision. Shares of land driller Helmerich & Payne detracted as the company reported lower margins than expected despite seeing strong improvements in overall drilling activity.
STRATEGY & OUTLOOK
The first quarter of 2017 saw modest gains in U.S. equity markets and was also categorized by a resurgence of growth as a style. Despite this turnaround in the first quarter, we remain optimistic for value as a style for a number of reasons.
First, we believe the results of the presidential election, along with the Federal Reserve’s shift in policy, represent a significant change in the U.S. equity market, which introduces an increasing number of variables that can impact a company’s fundamentals. Global central banks are running out of arrows in their quivers that can be used to support asset markets generally, and investors will need to determine how things like corporate tax reform, regulatory changes, and potential changes to trade agreements might impact individual companies. We have seen evidence of this trend through lower equity correlations. Stocks are no longer trading as a group. Stock-specific fundamental analysis should once again help separate the so-called “wheat” from the “chaff.”
Second, valuations among value stocks as a group remain attractive relative to growth. Notwithstanding value’s outperformance in 2016, the price/book premium attached to growth stocks is once again above normal levels when compared to the past 25 years. This relationship tends to favor value on a going forward basis. Finally, despite strong performance in 2016, value has underperformed growth since the end of 2006. Academic research over time has shown that value tends to win in the long run, and rarely has one style remained in favor for a 10-year period without seeing that trend revert.
While many investors focus on a short-term view when considering potential investments, the Fund utilizes in-depth
5 OPPENHEIMER DIVIDEND OPPORTUNITY FUND
fundamental research to identify dividend-paying companies that we believe are poised for an unanticipated acceleration in return on invested capital over a multi-year time horizon. We believe this longer-term approach provides a more comprehensive outlook of potential investments by focusing on all three financial statements–income statement, balance sheet and statement of cash flows–and helps us uncover companies whose generation and use of free cash flow we deem as yet to be fully reflected in the current stock price.
| | |
 | | 
Laton Spahr, CFA Portfolio Manager |
6 OPPENHEIMER DIVIDEND OPPORTUNITY FUND
Top Holdings and Allocations
TOP TEN COMMON STOCK HOLDINGS
| | |
| JPMorgan Chase & Co. | | 4.6% |
| Chevron Corp. | | 2.8 |
| Pfizer, Inc. | | 2.4 |
| Lockheed Martin Corp. | | 2.3 |
| Cisco Systems, Inc. | | 2.0 |
| AT&T, Inc. | | 1.9 |
| Prudential Financial, Inc. | | 1.8 |
| BP plc, Sponsored ADR | | 1.8 |
| GlaxoSmithKline plc, Sponsored ADR | | 1.8 |
| Eaton Corp. plc | | 1.8 |
Portfolio holdings and allocations are subject to change. Percentages are as of April 30, 2017, and are based on net assets. For more current Fund holdings, please visit oppenheimerfunds.com.
TOP TEN COMMON STOCK INDUSTRIES
| | |
| Commercial Banks | | 12.3% |
| Oil, Gas & Consumable Fuels | | 9.3 |
| Pharmaceuticals | | 7.3 |
| Diversified Telecommunication Services | | 4.6 |
| Capital Markets | | 4.3 |
| Insurance | | 4.3 |
| Technology Hardware, Storage & Peripherals | | 3.9 |
| Electric Utilities | | 3.2 |
| Metals & Mining | | 2.7 |
| Tobacco | | 2.5 |
Portfolio holdings and allocations are subject to change. Percentages are as of April 30, 2017, and are based on net assets.
SECTOR ALLOCATION
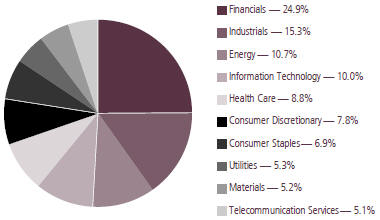
Portfolio holdings and allocations are subject to change. Percentages are as of April 30, 2017, and are based on the total market value of common stocks.
7 OPPENHEIMER DIVIDEND OPPORTUNITY FUND
Share Class Performance
AVERAGE ANNUAL TOTAL RETURNS WITHOUT SALES CHARGE AS OF 4/30/17
| | | | | | | | |
| | | Inception Date | | 1-Year | | 5-Year | | 10-Year |
Class A (OSVAX) | | 11/26/02 | | 13.40% | | 9.75% | | 2.65% |
Class B (OSVBX) | | 2/27/04 | | 12.54 | | 8.88 | | 2.13 |
Class C (OSCVX) | | 2/27/04 | | 12.59 | | 8.91 | | 1.86 |
Class I (OSVIX) | | 8/28/14 | | 13.91 | | 6.25* | | N/A |
Class R (OSVNX) | | 2/27/04 | | 13.17 | | 9.49 | | 2.39 |
Class Y (OSVYX) | | 2/27/04 | | 13.70 | | 10.08 | | 3.02 |
AVERAGE ANNUAL TOTAL RETURNS WITH SALES CHARGE AS OF 4/30/17
| | | | | | | | |
| | | Inception Date | | 1-Year | | 5-Year | | 10-Year |
Class A (OSVAX) | | 11/26/02 | | 6.88% | | 8.46% | | 2.05% |
Class B (OSVBX) | | 2/27/04 | | 7.54 | | 8.59 | | 2.13 |
Class C (OSCVX) | | 2/27/04 | | 11.59 | | 8.91 | | 1.86 |
Class I (OSVIX) | | 8/28/14 | | 13.91 | | 6.25* | | N/A |
Class R (OSVNX) | | 2/27/04 | | 13.17 | | 9.49 | | 2.39 |
Class Y (OSVYX) | | 2/27/04 | | 13.70 | | 10.08 | | 3.02 |
*Shows performance since inception.
Performance data quoted represents past performance, which does not guarantee future results. The investment return and principal value of an investment in the Fund will fluctuate so that an investor’s shares, when redeemed, may be worth more or less than their original cost. Current performance may be lower or higher than the performance quoted. Returns do not consider capital gains or income taxes on an individual’s investment. For performance data current to the most recent month-end, visit oppenheimerfunds.com or call 1.800. CALL OPP (225.5677). Fund returns include changes in share price, reinvested distributions, and the applicable sales charge: for Class A shares, the current maximum initial sales charge of 5.75%; for Class B shares, the contingent deferred sales charge of 5% (1-year) and 2% (5-year); and for Class C shares, the contingent deferred sales charge (“CDSC”) of 1% for the 1-year period. There is no sales charge for Class I, Class R and Class Y shares. Because Class B shares convert to Class A shares 72 months after purchase, the 10-year return for Class B shares uses Class A performance for the period after conversion. See Fund prospectuses and summary prospectuses for more information on share classes and sales charges
The Fund’s performance is compared to the Russell 3000 Value Index and the S&P 500 Index. The Russell 3000 Value Index measures the performance of the broad value segment of the U.S. equity universe. It includes those Russell 3000 companies with lower price-to-book ratios and lower forecasted growth values. The S&P 500 Index is a capitalization-weighted index of 500 stocks intended to be a representative sample of leading companies in leading industries within the U.S. economy. The indices are unmanaged and cannot be purchased directly by investors. While index comparisons may be useful to provide a benchmark for the Fund’s performance, it must be noted that the Fund’s investments are not limited to the investments
8 OPPENHEIMER DIVIDEND OPPORTUNITY FUND
comprising the indices. Index performance includes reinvestment of income, but does not reflect transaction costs, fees, expenses or taxes. Index performance is shown for illustrative purposes only as a benchmark for the Fund’s performance, and does not predict or depict performance of the Fund. The Fund’s performance reflects the effects of the Fund’s business and operating expenses.
The Fund’s investment strategy and focus can change over time. The mention of specific fund holdings does not constitute a recommendation by OppenheimerFunds, Inc. or its affiliates.
Before investing in any of the Oppenheimer funds, investors should carefully consider a fund’s investment objectives, risks, charges and expenses. Fund prospectuses and summary prospectuses contain this and other information about the funds, and may be obtained by asking your financial advisor, visiting oppenheimerfunds.com, or calling 1.800. CALL OPP (225.5677). Read prospectuses and summary prospectuses carefully before investing.
Shares of Oppenheimer funds are not deposits or obligations of any bank, are not guaranteed by any bank, are not insured by the FDIC or any other agency, and involve investment risks, including the possible loss of the principal amount invested.
9 OPPENHEIMER DIVIDEND OPPORTUNITY FUND
Fund Expenses
Fund Expenses. As a shareholder of the Fund, you incur two types of costs: (1) transaction costs, which may include sales charges (loads) on purchase payments and/or contingent deferred sales charges on redemptions; and (2) ongoing costs, including management fees; distribution and service fees; and other Fund expenses. These examples are intended to help you understand your ongoing costs (in dollars) of investing in the Fund and to compare these costs with the ongoing costs of investing in other mutual funds.
The examples are based on an investment of $1,000.00 invested at the beginning of the period and held for the entire 6-month period ended April 30, 2017.
Actual Expenses. The first section of the table provides information about actual account values and actual expenses. You may use the information in this section for the class of shares you hold, together with the amount you invested, to estimate the expense that you paid over the period. Simply divide your account value by $1,000.00 (for example, an $8,600.00 account value divided by $1,000.00 = 8.60), then multiply the result by the number in the first section under the heading entitled “Expenses Paid During 6 Months Ended April 30, 2017” to estimate the expenses you paid on your account during this period.
Hypothetical Example for Comparison Purposes. The second section of the table provides information about hypothetical account values and hypothetical expenses based on the Fund’s actual expense ratio for each class of shares, and an assumed rate of return of 5% per year for each class before expenses, which is not the Fund’s actual return. The hypothetical account values and expenses may not be used to estimate the actual ending account balance or expenses you paid for the period. You may use this information to compare the ongoing costs of investing in the Fund and other funds. To do so, compare this 5% hypothetical example for the class of shares you hold with the 5% hypothetical examples that appear in the shareholder reports of the other funds.
Please note that the expenses shown in the table are meant to highlight your ongoing costs only and do not reflect any transactional costs, such as front-end or contingent deferred sales charges (loads). Therefore, the “hypothetical” section of the table is useful in comparing ongoing costs only, and will not help you determine the relative total costs of owning different funds. In addition, if these transactional costs were included, your costs would have been higher.
10 OPPENHEIMER DIVIDEND OPPORTUNITY FUND
| | | | | | |
| Actual | | Beginning Account Value November 1, 2016 | | Ending Account Value April 30, 2017 | | Expenses Paid During 6 Months Ended
April 30, 2017 |
|
Class A | | $ 1,000.00 | | $ 1,093.90 | | $ 5.99 |
|
Class B | | 1,000.00 | | 1,089.40 | | 10.10 |
|
Class C | | 1,000.00 | | 1,089.80 | | 9.84 |
|
Class I | | 1,000.00 | | 1,096.40 | | 3.70 |
|
Class R | | 1,000.00 | | 1,092.60 | | 7.24 |
|
Class Y | | 1,000.00 | | 1,095.40 | | 4.69 |
| | | |
Hypothetical (5% return before expenses) | | | | | | |
|
Class A | | 1,000.00 | | 1,019.09 | | 5.77 |
|
Class B | | 1,000.00 | | 1,015.17 | | 9.74 |
|
Class C | | 1,000.00 | | 1,015.42 | | 9.49 |
|
Class I | | 1,000.00 | | 1,021.27 | | 3.56 |
|
Class R | | 1,000.00 | | 1,017.90 | | 6.98 |
|
Class Y | | 1,000.00 | | 1,020.33 | | 4.52 |
Expenses are equal to the Fund’s annualized expense ratio for that class, multiplied by the average account value over the period, multiplied by 181/365 (to reflect the one-half year period). Those annualized expense ratios, excluding indirect expenses from affiliated funds, based on the 6-month period ended April 30, 2017 are as follows:
| | |
| Class | | Expense Ratios |
|
Class A | | 1.15% |
|
Class B | | 1.94 |
|
Class C | | 1.89 |
|
Class I | | 0.71 |
|
Class R | | 1.39 |
|
Class Y | | 0.90 |
The expense ratios reflect voluntary and/or contractual waivers and/or reimbursements of expenses by the Fund’s Manager and Transfer Agent. Some of these undertakings may be modified or terminated at any time, as indicated in the Fund’s prospectus. The “Financial Highlights” tables in the Fund’s financial statements, included in this report, also show the gross expense ratios, without such waivers or reimbursements and reduction to custodian expenses, if applicable.
11 OPPENHEIMER DIVIDEND OPPORTUNITY FUND
STATEMENT OF INVESTMENTS April 30, 2017
| | | | | | | | |
| | | Shares | | | Value | |
| Common Stocks—96.9% | | | | | | | | |
| Consumer Discretionary—7.6% | | | | | | | | |
| Automobiles—1.0% | | | | | | | | |
| Honda Motor Co. Ltd. | | | 91,400 | | | $ | 2,651,337 | |
| | | | | | | | | |
| Hotels, Restaurants & Leisure—2.2% | | | | | | | | |
| Las Vegas Sands Corp. | | | 39,360 | | | | 2,321,846 | |
| McDonald’s Corp. | | | 24,700 | | | | 3,456,271 | |
| | | | | | | 5,778,117 | |
| | | | | | | | | |
| Household Durables—0.6% | | | | | | | | |
| Sekisui House Ltd. | | | 96,000 | | | | 1,594,588 | |
| | | | | | | | | |
| Media—1.3% | | | | | | | | |
| Cinemark Holdings, Inc. | | | 44,190 | | | | 1,909,008 | |
| National CineMedia, Inc. | | | 119,950 | | | | 1,423,807 | |
| | | | | | | 3,332,815 | |
| | | | | | | | | |
| Multiline Retail—0.7% | | | | | | | | |
| Marks & Spencer Group plc | | | 365,940 | | | | 1,737,749 | |
| | | | | | | | | |
| Specialty Retail—0.7% | | | | | | | | |
| Buckle, Inc. (The) | | | 102,280 | | | | 1,912,636 | |
| | | | | | | | | |
| Textiles, Apparel & Luxury Goods—1.1% | | | | | | | | |
| Coach, Inc. | | | 71,310 | | | | 2,808,901 | |
| | | | | | | | | |
| Consumer Staples—6.7% | | | | | | | | |
| Beverages—0.8% | �� | | | | | | | |
| Coca-Cola European Partners plc | | | 51,720 | | | | 1,997,426 | |
| | | | | | | | | |
| Food Products—2.3% | | | | | | | | |
| B&G Foods, Inc. | | | 55,040 | | | | 2,311,680 | |
| Hershey Co. (The) | | | 23,130 | | | | 2,502,666 | |
| Tate & Lyle plc | | | 121,870 | | | | 1,194,047 | |
| | | | | | | 6,008,393 | |
| | | | | | | | | |
| Household Products—1.1% | | | | | | | | |
| Procter & Gamble Co. (The) | | | 32,200 | | | | 2,812,026 | |
| | | | | | | | | |
| Tobacco—2.5% | | | | | | | | |
| British American Tobacco plc | | | 41,660 | | | | 2,819,010 | |
| Philip Morris International, Inc. | | | 34,870 | | | | 3,864,991 | |
| | | | | | | 6,684,001 | |
| | | | | | | | |
| | | Shares | | | Value | |
| Energy—10.3% | | | | | | | | |
| Energy Equipment & Services—1.0% | | | | | | | | |
| Helmerich & Payne, Inc. | | | 44,213 | | | $ | 2,681,076 | |
| | | | | | | | | |
| Oil, Gas & Consumable Fuels—9.3% | | | | | | | | |
| BP plc, Sponsored ADR | | | 137,386 | | | | 4,715,088 | |
| Chevron Corp. | | | 68,998 | | | | 7,362,087 | |
| Enbridge, Inc. | | | 74,597 | | | | 3,092,046 | |
| Royal Dutch Shell plc, Cl. A, Sponsored ADR | | | 70,442 | | | | 3,676,368 | |
| Ship Finance International Ltd. | | | 147,410 | | | | 2,071,110 | |
| Suncor Energy, Inc. | | | 113,190 | | | | 3,549,638 | |
| | | | | | | 24,466,337 | |
| | | | | | | | | |
| Financials—24.2% | | | | | | | | |
| Capital Markets—4.3% | | | | | | | | |
| Ameriprise Financial, Inc. | | | 21,510 | | | | 2,750,053 | |
| Apollo Global Management LLC, Cl. A1 | | | 54,843 | | | | 1,468,147 | |
| Ares Management LP1 | | | 152,549 | | | | 2,997,588 | |
| Bank of New York Mellon Corp. (The) | | | 57,360 | | | | 2,699,362 | |
| Moelis & Co., Cl. A | | | 37,430 | | | | 1,373,681 | |
| | | | | | | 11,288,831 | |
| | | | | | | | | |
| Commercial Banks—12.3% | | | | | | | | |
| Banco de Chile, ADR | | | 21,755 | | | | 1,593,989 | |
| Bank of Montreal | | | 34,380 | | | | 2,435,823 | |
| BB&T Corp. | | | 60,630 | | | | 2,618,003 | |
| Danske Bank AS | | | 39,487 | | | | 1,434,017 | |
| Fifth Third Bancorp | | | 73,720 | | | | 1,800,979 | |
| Glacier Bancorp, Inc. | | | 52,850 | | | | 1,785,273 | |
| HSBC Holdings plc | | | 151,170 | | | | 1,244,869 | |
| Huntington Bancshares, Inc. | | | 143,500 | | | | 1,845,410 | |
| Intesa Sanpaolo SpA | | | 901,149 | | | | 2,620,612 | |
| JPMorgan Chase & Co. | | | 139,850 | | | | 12,166,950 | |
| KeyCorp. | | | 153,540 | | | | 2,800,570 | |
| | | | | | | 32,346,495 | |
12 OPPENHEIMER DIVIDEND OPPORTUNITY FUND
| | | | | | | | |
| | | Shares | | | Value | |
| Consumer Finance—1.1% | | | | | | | | |
| American Express Co. | | | 16,930 | | | $ | 1,341,703 | |
| Navient Corp. | | | 101,806 | | | | 1,547,451 | |
| | | | | | | 2,889,154 | |
| | | | | | | | | |
| Insurance—4.3% | | | | | | | | |
| MetLife, Inc. | | | 59,240 | | | | 3,069,225 | |
| Prudential Financial, Inc. | | | 44,590 | | | | 4,772,468 | |
| Sampo OYJ, Cl. A | | | 39,109 | | | | 1,874,515 | |
| T&D Holdings, Inc. | | | 102,700 | | | | 1,528,383 | |
| | | | | | | 11,244,591 | |
| | | | | | | | | |
| Real Estate Investment Trusts (REITs)—2.2% | | | | | |
| HCP, Inc. | | | 64,270 | | | | 2,014,864 | |
| Potlatch Corp. | | | 35,750 | | | | 1,610,538 | |
| Uniti Group, Inc. | | | 73,218 | | | | 2,010,566 | |
| | | | | | | 5,635,968 | |
| | | | | | | | | |
| Health Care—8.5% | | | | | | | | |
| Health Care Equipment & Supplies—1.2% | | | | | | | | |
| Medtronic plc | | | 38,890 | | | | 3,231,370 | |
| | | | | | | | | |
| Pharmaceuticals—7.3% | | | | | | | | |
| AstraZeneca plc, Sponsored ADR | | | 106,370 | | | | 3,217,693 | |
| Bristol-Myers Squibb Co. | | | 31,720 | | | | 1,777,906 | |
| GlaxoSmithKline plc, Sponsored ADR | | | 115,220 | | | | 4,712,498 | |
| Pfizer, Inc. | | | 184,310 | | | | 6,251,795 | |
| Roche Holding AG, Sponsored ADR | | | 61,080 | | | | 1,997,194 | |
| Teva Pharmaceutical Industries Ltd., Sponsored ADR | | | 37,980 | | | | 1,199,408 | |
| | | | | | | 19,156,494 | |
| | | | | | | | | |
| Industrials—14.8% | | | | | | | | |
| Aerospace & Defense—2.3% | | | | | | | | |
| Lockheed Martin Corp. | | | 22,270 | | | | 6,000,651 | |
| | | | | | | | | |
| Airlines—1.3% | | | | | | | | |
| Delta Air Lines, Inc. | | | 39,290 | | | | 1,785,338 | |
| International Consolidated Airlines Group SA | | | 214,550 | | | | 1,555,198 | |
| | | | | | | 3,340,536 | |
| | | | | | | | | |
| Commercial Services & Supplies—2.2% | | | | | | | | |
| Johnson Controls International plc | | | 78,751 | | | | 3,273,679 | |
| | | | | | | | |
| | | Shares | | | Value | |
| Commercial Services & Supplies (Continued) | | | | |
| Waste Management, Inc. | | | 33,560 | | | $ | 2,442,497 | |
| | | | | | | 5,716,176 | |
| | | | | | | | | |
| Construction & Engineering—0.5% | | | | | | | | |
| Ferrovial SA | | | 69,061 | | | | 1,469,467 | |
| | | | | | | | | |
| Electrical Equipment—2.3% | | | | | | | | |
| ABB Ltd. | | | 56,633 | | | | 1,385,378 | |
| Eaton Corp. plc | | | 62,100 | | | | 4,697,244 | |
| | | | | | | 6,082,622 | |
| | | | | | | | | |
| Industrial Conglomerates—1.4% | | | | | | | | |
| Siemens AG | | | 25,077 | | | | 3,594,490 | |
| | | | | | | | | |
| Machinery—2.5% | | | | | | | | |
| Caterpillar, Inc. | | | 11,640 | | | | 1,190,306 | |
| IMI plc | | | 170,660 | | | | 2,826,058 | |
| Mitsubishi Heavy Industries Ltd. | | | 661,000 | | | | 2,648,306 | |
| | | | | | | 6,664,670 | |
| | | | | | | | | |
| Trading Companies & Distributors—2.3% | | | | | | | | |
| ITOCHU Corp. | | | 286,800 | | | | 4,059,136 | |
| Rexel SA | | | 114,220 | | | | 2,040,259 | |
| | | | | | | 6,099,395 | |
| | | | | | | | | |
| Information Technology—9.7% | | | | | | | | |
| Communications Equipment—2.0% | | | | | | | | |
| Cisco Systems, Inc. | | | 148,070 | | | | 5,044,745 | |
| | | | | | | | | |
| Semiconductors & Semiconductor Equipment—2.2% | |
| Intel Corp. | | | 68,120 | | | | 2,462,538 | |
| Microchip Technology, Inc. | | | 44,560 | | | | 3,367,845 | |
| | | | | | | 5,830,383 | |
| | | | | | | | | |
| Software—1.6% | | | | | | | | |
| Microsoft Corp. | | | 61,620 | | | | 4,218,505 | |
| | | | | | | | | |
| Technology Hardware, Storage & Peripherals—3.9% | |
| Apple, Inc. | | | 29,352 | | | | 4,216,415 | |
| HP, Inc. | | | 224,980 | | | | 4,234,123 | |
| Seagate Technology plc | | | 42,770 | | | | 1,801,900 | |
| | | | | | | 10,252,438 | |
| | | | | | | | | |
| Materials—5.0% | | | | | | | | |
| Chemicals—2.0% | | | | | | | | |
| Huntsman Corp. | | | 64,660 | | | | 1,601,628 | |
| LyondellBasell Industries NV, Cl. A | | | 30,261 | | | | 2,564,922 | |
13 OPPENHEIMER DIVIDEND OPPORTUNITY FUND
STATEMENT OF INVESTMENTS Continued
| | | | | | | | |
| | | Shares | | | Value | |
| Chemicals (Continued) | | | | | | | | |
| Nissan Chemical Industries Ltd. | | | 39,182 | | | $ | 1,214,820 | |
| | | | | | | 5,381,370 | |
| | | | | | | | | |
| Containers & Packaging—0.3% | | | | | | | | |
| International Paper Co. | | | 14,980 | | | | 808,471 | |
| | | | | | | | | |
| Metals & Mining—2.7% | | | | | | | | |
| Barrick Gold Corp. | | | 110,930 | | | | 1,854,749 | |
| Goldcorp, Inc. | | | 113,530 | | | | 1,584,879 | |
| Nucor Corp. | | | 57,760 | | | | 3,542,421 | |
| | | | | | | 6,982,049 | |
| | | | | | | | | |
| Telecommunication Services—5.0% | | | | | | | | |
| Diversified Telecommunication Services—4.6% | | | | | |
| AT&T, Inc. | | | 123,420 | | | | 4,891,135 | |
| Bezeq The Israeli Telecommunication Corp. Ltd. | | | 602,145 | | | | 1,006,169 | |
| CenturyLink, Inc. | | | 113,460 | | | | 2,912,518 | |
| Inmarsat plc | | | 123,040 | | | | 1,302,624 | |
| Spark New Zealand Ltd. | | | 745,383 | | | | 1,891,566 | |
| | | | | | | 12,004,012 | |
| | | | | | | | | |
| Wireless Telecommunication Services—0.4% | | | | | |
| Vodafone Group plc, Sponsored ADR | | | 40,890 | | | | 1,070,909 | |
| | | | | | | | | |
| Utilities—5.1% | | | | | | | | |
| Electric Utilities—3.2% | | | | | | | | |
| American Electric Power Co., Inc. | | | 22,760 | | | | 1,543,811 | |
| Avangrid, Inc. | | | 20,960 | | | | 911,760 | |
| | | | | | | | |
| | | Shares | | | Value | |
| Electric Utilities (Continued) | | | | | | | | |
| Edison International | | | 32,870 | | | $ | 2,628,614 | |
| Entergy Corp. | | | 21,090 | | | | 1,608,323 | |
| Iberdrola SA | | | 259,867 | | | | 1,868,441 | |
| | | | | | | 8,560,949 | |
| | | | | | | | | |
| Multi-Utilities—1.9% | | | | | | | | |
| Ameren Corp. | | | 50,180 | | | | 2,744,344 | |
| CenterPoint Energy, Inc. | | | 76,550 | | | | 2,183,972 | |
| | | | | | | 4,928,316 | |
Total Common Stocks (Cost $229,366,354) | | | | | | | 254,308,459 | |
| | |
| | | | | | | | |
| Preferred Stock—0.5% | | | | | | | | |
Belden, Inc., 6.75% Cv. (Cost $1,451,708) | | | 14,000 | | | | 1,378,580 | |
| | |
| | | | | | | | |
| Investment Company—2.7% | | | | | | | | |
| Oppenheimer Institutional Government Money Market Fund, Cl. E, 0.71%2,3 (Cost $7,011,919) | | | 7,011,919 | | | | 7,011,919 | |
| | | | | | | | | |
Total Investments, at Value (Cost $237,829,981) | | | 100.1 | % | | | 262,698,958 | |
| Net Other Assets (Liabilities) | | | (0.1 | ) | | | (197,595 | ) |
| Net Assets | | | 100.0 | % | | $ | 262,501,363 | |
| | | | | | | | |
Footnotes to Statement of Investments
1. Security is a Master Limited Partnership.
2. Rate shown is the 7-day yield at period end.
3. Is or was an affiliate, as defined in the Investment Company Act of 1940, as amended, at or during the reporting period, by virtue of the Fund owning at least 5% of the voting securities of the issuer or as a result of the Fund and the issuer having the same investment adviser. Transactions during the reporting period in which the issuer was an affiliate are as follows:
| | | | | | | | | | | | | | | | |
| | | Shares April 29, 2016a | | | Gross Additions | | | Gross Reductions | | | Shares April 30, 2017 | |
| Oppenheimer Institutional Government Money Market Fund, Cl. Eb | | | 9,063,661 | | | | 78,251,262 | | | | 80,303,004 | | | | 7,011,919 | |
14 OPPENHEIMER DIVIDEND OPPORTUNITY FUND
Footnotes to Statement of Investments (Continued)
| | | | | | | | |
| | | Value | | | Income | |
| Oppenheimer Institutional Government Money Market Fund, Cl. Eb | | $ | 7,011,919 | | | $ | 38,584 | |
a. Represents the last business day of the Fund’s reporting period.
b. Prior to September 28, 2016 this fund was named Oppenheimer Institutional Money Market Fund.
| | | | | | | | | | | | | | | | |
| Forward Currency Exchange Contracts as of April 30, 2017 | | | | |
| | | | | | | | | | | | | | | | | | | | | | | | | | | | |
| Counterparty | | Settlement
Month(s) | | | Currency
Purchased
(000’s) | | | Currency Sold
(000’s) | | | Unrealized
Appreciation | | | Unrealized
Depreciation | |
| BOA | | | 05/2017 | | | | EUR | | | | 3,420 | | | | USD | | | | 3,683 | | | $ | 46,369 | | | $ | — | |
| GSCO-OT | | | 05/2017 | | | | USD | | | | 10,229 | | | | GBP | | | | 8,080 | | | | — | | | | 236,222 | |
| HSBC | | | 05/2017 | | | | USD | | | | 11,873 | | | | EUR | | | | 11,080 | | | | — | | | | 208,671 | |
| HSBC | | | 07/2017 | | | | USD | | | | 9,513 | | | | JPY | | | | 1,050,000 | | | | 67,698 | | | | — | |
| JPM | | | 05/2017 | | | | GBP | | | | 8,080 | | | | USD | | | | 10,423 | | | | 42,575 | | | | — | |
| JPM | | | 07/2017 | | | | USD | | | | 12,704 | | | | GBP | | | | 9,825 | | | | — | | | | 53,271 | |
| Total Unrealized Appreciation and Depreciation | | | $ | 156,642 | | | $ | 498,164 | |
| | | | | | | | | |
| | |
| Glossary: |
| Counterparty Abbreviations |
| BOA | | Bank of America NA |
| GSCO-OT | | Goldman Sachs Bank USA |
| HSBC | | HSBC Bank USA NA |
| JPM | | JPMorgan Chase Bank NA |
|
| Currency abbreviations indicate amounts reporting in currencies |
| EUR | | Euro |
| GBP | | British Pound Sterling |
| JPY | | Japanese Yen |
See accompanying Notes to Financial Statements.
15 OPPENHEIMER DIVIDEND OPPORTUNITY FUND
STATEMENT OF ASSETS AND LIABILITIES April 30, 2017
| | | | |
| Assets | | | | |
| Investments, at value—see accompanying statement of investments: | | | | |
| Unaffiliated companies (cost $230,818,062) | | $ | 255,687,039 | |
| Affiliated companies (cost $7,011,919) | | | 7,011,919 | |
| | | | 262,698,958 | |
| Cash | | | 75,272 | |
| Cash—foreign currencies (cost $24,867) | | | 24,802 | |
| Unrealized appreciation on forward currency exchange contracts | | | 156,642 | |
| Receivables and other assets: | | | | |
| Dividends | | | 758,480 | |
| Investments sold | | | 478,004 | |
| Shares of beneficial interest sold | | | 214,826 | |
| Other | | | 21,560 | |
| Total assets | | | 264,428,544 | |
| | | | |
| Liabilities | | | | |
| Unrealized depreciation on forward currency exchange contracts | | | 498,164 | |
| Payables and other liabilities: | | | | |
| Investments purchased | | | 718,012 | |
| Shares of beneficial interest redeemed | | | 592,282 | |
| Distribution and service plan fees | | | 51,088 | |
| Trustees’ compensation | | | 27,872 | |
| Shareholder communications | | | 7,378 | |
| Other | | | 32,385 | |
| Total liabilities | | | 1,927,181 | |
| | | | | |
| Net Assets | | $ | 262,501,363 | |
| | | | |
| | | | |
| Composition of Net Assets | | | | |
| Par value of shares of beneficial interest | | $ | 11,901 | |
| Additional paid-in capital | | | 382,025,528 | |
| Accumulated net investment loss | | | (193,297 | ) |
| Accumulated net realized loss on investments and foreign currency transactions | | | (143,874,908 | ) |
| Net unrealized appreciation on investments and translation of assets and liabilities denominated in foreign currencies | | | 24,532,139 | |
| Net Assets | | $ | 262,501,363 | |
| | | | |
16 OPPENHEIMER DIVIDEND OPPORTUNITY FUND
| | | | |
| Net Asset Value Per Share | | | | |
| Class A Shares: | | | | |
| |
| Net asset value and redemption price per share (based on net assets of $182,226,013 and 8,197,151 shares of beneficial interest outstanding) | | | $22.23 | |
| |
| Maximum offering price per share (net asset value plus sales charge of 5.75% of offering price) | | | $23.59 | |
| | | | | |
| |
| Class B Shares: | | | | |
| |
| Net asset value, redemption price (excludes applicable contingent deferred sales charge) and offering price per share (based on net assets of $1,397,519 and 64,899 shares of beneficial interest outstanding) | | | $21.53 | |
| | | | | |
| |
| Class C Shares: | | | | |
| |
| Net asset value, redemption price (excludes applicable contingent deferred sales charge) and offering price per share (based on net assets of $52,081,897 and 2,426,559 shares of beneficial interest outstanding) | | | $21.46 | |
| | | | | |
| |
| Class I Shares: | | | | |
| |
| Net asset value, redemption price and offering price per share (based on net assets of $2,572,454 and 115,803 shares of beneficial interest outstanding) | | | $22.21 | |
| | | | | |
| |
| Class R Shares: | | | | |
| |
| Net asset value, redemption price (excludes applicable contingent deferred sales charge) and offering price per share (based on net assets of $13,332,003 and 605,734 shares of beneficial interest outstanding) | | | $22.01 | |
| | | | | |
| |
| Class Y Shares: | | | | |
| |
| Net asset value, redemption price and offering price per share (based on net assets of $10,891,477 and 490,384 shares of beneficial interest outstanding) | | | $22.21 | |
See accompanying Notes to Financial Statements.
17 OPPENHEIMER DIVIDEND OPPORTUNITY FUND
STATEMENT OF OPERATIONS For the Year Ended April 30, 2017
| | | | |
| Investment Income | | | | |
| Dividends: | | | | |
| Unaffiliated companies (net of foreign withholding taxes of $271,439) | | $ | 8,358,627 | |
| Affiliated companies | | | 38,584 | |
| Interest | | | 868 | |
| Total investment income | | | 8,398,079 | |
| | | | |
| Expenses | | | | |
| Management fees | | | 1,546,298 | |
| Distribution and service plan fees: | | | | |
| Class A | | | 410,330 | |
| Class B | | | 18,546 | |
| Class C | | | 477,539 | |
| Class R | | | 57,823 | |
| Transfer and shareholder servicing agent fees: | | | | |
| Class A | | | 369,096 | |
| Class B | | | 4,086 | |
| Class C | | | 106,260 | |
| Class I | | | 162 | |
| Class R | | | 25,511 | |
| Class Y | | | 17,217 | |
| Shareholder communications: | | | | |
| Class A | | | 18,299 | |
| Class B | | | 657 | |
| Class C | | | 5,369 | |
| Class I | | | 3 | |
| Class Y | | | 572 | |
| Custodian fees and expenses | | | 5,267 | |
| Borrowing fees | | | 4,095 | |
| Trustees’ compensation | | | 3,927 | |
| Other | | | 69,782 | |
| Total expenses | | | 3,140,839 | |
| Less reduction to custodian expenses | | | (169 | ) |
| Less waivers and reimbursements of expenses | | | (21,732 | ) |
| Net expenses | | | 3,118,938 | |
| | | | |
| Net Investment Income | | | 5,279,141 | |
18 OPPENHEIMER DIVIDEND OPPORTUNITY FUND
| | | | |
| Realized and Unrealized Gain (Loss) | | | | |
| Net realized gain on: | | | | |
| Investments transactions from unaffiliated companies | | $ | 9,136,573 | |
| Foreign currency transactions | | | 999,233 | |
| Net realized gain | | | 10,135,806 | |
| Net change in unrealized appreciation/depreciation on: | | | | |
| Investment transactions | | | 14,133,456 | |
| Translation of assets and liabilities denominated in foreign currencies | | | (50,925 | ) |
| Net change in unrealized appreciation/depreciation | | | 14,082,531 | |
| | | | | |
| Net Increase in Net Assets Resulting from Operations | | $ | 29,497,478 | |
| | | | |
See accompanying Notes to Financial Statements.
19 OPPENHEIMER DIVIDEND OPPORTUNITY FUND
STATEMENTS OF CHANGES IN NET ASSETS
| | | | | | | | |
| | | Year Ended
April 30, 2017 | | | Year Ended
April 29, 20161 | |
| Operations | | | | | | | | |
| | | | | | | | |
| Net investment income | | $ | 5,279,141 | | | $ | 5,109,830 | |
| Net realized gain | | | 10,135,806 | | | | 5,816,761 | |
| Net change in unrealized appreciation/depreciation | | | 14,082,531 | | | | (12,328,775 | ) |
| Net increase (decrease) in net assets resulting from operations | | | 29,497,478 | | | | (1,402,184 | ) |
| | | | | | | | |
| | | | | | | | |
| Dividends and/or Distributions to Shareholders | | | | | | | | |
| | | | | | | | |
| Dividends from net investment income: | | | | | | | | |
| Class A | | | (4,981,576 | ) | | | (3,586,519 | ) |
| Class B | | | (42,264 | ) | | | (53,534 | ) |
| Class C | | | (1,141,144 | ) | | | (790,348 | ) |
| Class I | | | (18,436 | ) | | | (409 | ) |
| Class R | | | (319,856 | ) | | | (210,002 | ) |
| Class Y | | | (246,909 | ) | | | (206,063 | ) |
| | | (6,750,185 | ) | | | (4,846,875 | ) |
| | | | | | | | |
| | | | | | | | |
| Beneficial Interest Transactions | | | | | | | | |
| | | | | | | | |
| Net increase (decrease) in net assets resulting from beneficial interest transactions: | | | | | | | | |
| Class A | | | 15,903,114 | | | | 13,625,673 | |
| Class B | | | (1,062,778 | ) | | | (1,333,865 | ) |
| Class C | | | 4,381,702 | | | | 1,554,541 | |
| Class I | | | 2,532,383 | | | | 4,043 | |
| Class R | | | 2,377,041 | | | | 1,018,422 | |
| Class Y | | | 4,383,484 | | | | (5,734,382 | ) |
| | | 28,514,946 | | | | 9,134,432 | |
| | | | | | | | |
| Total increase | | | 51,262,239 | | | | 2,885,373 | |
| Beginning of period | | | 211,239,124 | | | | 208,353,751 | |
| End of period (including accumulated net investment income (loss) of $(193,297) and $569,299, respectively) | | $ | 262,501,363 | | | $ | 211,239,124 | |
| | | | | | | | |
1. Represents the last day of the Fund’s reporting period.
See accompanying Notes to Financial Statements.
20 OPPENHEIMER DIVIDEND OPPORTUNITY FUND
FINANCIAL HIGHLIGHTS
| | | | | | | | | | | | | | | | | | | | |
Class A | | Year Ended April 30, 2017 | | | Year Ended April 29, 20161 | | | Year Ended April 30, 2015 | | | Year Ended April 30, 2014 | | | Year Ended April 30, 2013 | |
| Per Share Operating Data | | | | | | | | | | | | | | | | | | | | |
| Net asset value, beginning of period | | | $20.19 | | | | $20.78 | | | | $19.79 | | | | $17.80 | | | | $15.60 | |
| Income (loss) from investment operations: | | | | | | | | | | | | | | | | | | | | |
| Net investment income2 | | | 0.51 | | | | 0.54 | | | | 0.53 | | | | 0.42 | | | | 0.11 | |
| Net realized and unrealized gain (loss) | | | 2.16 | | | | (0.62) | | | | 1.01 | | | | 2.00 | | | | 2.19 | |
| Total from investment operations | | | 2.67 | | | | (0.08) | | | | 1.54 | | | | 2.42 | | | | 2.30 | |
| Dividends and/or distributions to shareholders: | | | | | | | | | | | | | | | | | | | | |
| Dividends from net investment income | | | (0.63) | | | | (0.51) | | | | (0.55) | | | | (0.43) | | | | (0.10) | |
| Net asset value, end of period | | | $22.23 | | | | $20.19 | | | | $20.78 | | | | $19.79 | | | | $17.80 | |
| | | | | | | | | | | | | | | | | | | | |
| | | | | | | | | | | | | | | | | | | | |
| Total Return, at Net Asset Value3 | | | 13.40%4 | | | | (0.25)%4 | | | | 7.86% | | | | 13.71% | | | | 14.79% | |
| | | | | | | | | | | | | | | | | | | | |
| Ratios/Supplemental Data | | | | | | | | | | | | | | | | | | | | |
| Net assets, end of period (in thousands) | | | $182,226 | | | | $150,192 | | | | $140,697 | | | | $135,325 | | | | $133,099 | |
| Average net assets (in thousands) | | | $167,839 | | | | $138,687 | | | | $138,051 | | | | $130,894 | | | | $136,118 | |
| Ratios to average net assets:5 | | | | | | | | | | | | | | | | | | | | |
| Net investment income | | | 2.38% | | | | 2.72% | | | | 2.64% | | | | 2.21% | | | | 0.67% | |
| Expenses excluding specific expenses listed below | | | 1.16% | | | | 1.16% | | | | 1.15% | | | | 1.26% | | | | 1.36% | |
| Interest and fees from borrowings | | | 0.00%6 | | | | 0.00%6 | | | | 0.00% | | | | 0.00% | | | | 0.00% | |
| Total expenses7 | | | 1.16% | | | | 1.16% | | | | 1.15% | | | | 1.26% | | | | 1.36% | |
| Expenses after payments, waivers and/or reimbursements and reduction to custodian expenses | | | 1.15% | | | | 1.16%8 | | | | 1.15%8 | | | | 1.26%8 | | | | 1.35% | |
| Portfolio turnover rate | | | 64% | | | | 47% | | | | 46% | | | | 73% | | | | 140% | |
1. Represents the last business day of the Fund’s reporting period.
2. Per share amounts calculated based on the average shares outstanding during the period.
3. Assumes an initial investment on the business day before the first day of the fiscal period, with all dividends and distributions reinvested in additional shares on the reinvestment date, and redemption at the net asset value calculated on the last business day of the fiscal period. Sales charges are not reflected in the total returns. Total returns are not annualized for periods less than one full year. Returns do not reflect the deduction of taxes that a shareholder would pay on fund distributions or the redemption of fund shares.
4. The return does not include adjustments in accordance with generally accepted accounting principles required at the period end for financial reporting purposes.
5. Annualized for periods less than one full year.
6. Less than 0.005%.
7. Total expenses including indirect expenses from affiliated fund fees and expenses were as follows:
| | | | | | |
| | | | | | |
| Year Ended April 30, 2017 | | | 1.16 | % | |
| Year Ended April 29, 2016 | | | 1.16 | % | |
| Year Ended April 30, 2015 | | | 1.15 | % | |
| Year Ended April 30, 2014 | | | 1.26 | % | |
| Year Ended April 30, 2013 | | | 1.36 | % | |
8. Waiver was less than 0.005%.
See accompanying Notes to Financial Statements.
21 OPPENHEIMER DIVIDEND OPPORTUNITY FUND
FINANCIAL HIGHLIGHTS Continued
| | | | | | | | | | | | | | | | | | | | |
Class B | | Year Ended April 30, 2017 | | | Year Ended April 29, 20161 | | | Year Ended April 30, 2015 | | | Year Ended April 30, 2014 | | | Year Ended April 30, 2013 | |
| Per Share Operating Data | | | | | | | | | | | | | | | | | | | | |
| Net asset value, beginning of period | | | $19.57 | | | | $20.15 | | | | $19.19 | | | | $17.15 | | | | $15.07 | |
| Income (loss) from investment operations: | | | | | | | | | | | | | | | | | | | | |
| Net investment income (loss)2 | | | 0.34 | | | | 0.38 | | | | 0.38 | | | | 0.25 | | | | (0.03) | |
| Net realized and unrealized gain (loss) | | | 2.08 | | | | (0.61) | | | | 0.97 | | | | 1.94 | | | | 2.11 | |
| Total from investment operations | | | 2.42 | | | | (0.23) | | | | 1.35 | | | | 2.19 | | | | 2.08 | |
| Dividends and/or distributions to shareholders: | | | | | | | | | | | | | | | | | | | | |
| Dividends from net investment income | | | (0.46) | | | | (0.35) | | | | (0.39) | | | | (0.15) | | | | 0.00 | |
| Net asset value, end of period | | | $21.53 | | | | $19.57 | | | | $20.15 | | | | $19.19 | | | | $17.15 | |
| | | | | | | | | | | | | | | | | | | | |
| | | | | | | | | | | | | | | | | | | | |
| Total Return, at Net Asset Value3 | | | 12.54% | | | | (1.08)% | | | | 7.08% | | | | 12.79% | | | | 13.80% | |
| | | | | | | | | | | | | | | | | | | | |
| Ratios/Supplemental Data | | | | | | | | | | | | | | | | | | | | |
| Net assets, end of period (in thousands) | | | $1,398 | | | | $2,280 | | | | $3,755 | | | | $6,535 | | | | $10,531 | |
| Average net assets (in thousands) | | | $1,853 | | | | $2,881 | | | | $4,815 | | | | $8,271 | | | | $11,660 | |
| Ratios to average net assets:4 | | | | | | | | | | | | | | | | | | | | |
| Net investment income (loss) | | | 1.67% | | | | 1.97% | | | | 1.95% | | | | 1.36% | | | | (0.17)% | |
| Expenses excluding specific expenses listed below | | | 1.94% | | | | 1.93% | | | | 1.91% | | | | 2.20% | | | | 2.45% | |
| Interest and fees from borrowings | | | 0.00%5 | | | | 0.00%5 | | | | 0.00% | | | | 0.00% | | | | 0.00% | |
| Total expenses6 | | | 1.94% | | | | 1.93% | | | | 1.91% | | | | 2.20% | | | | 2.45% | |
| Expenses after payments, waivers and/or reimbursements and reduction to custodian expenses | | | 1.93% | | | | 1.93%7 | | | | 1.91%7 | | | | 2.08% | | | | 2.19% | |
| Portfolio turnover rate | | | 64% | | | | 47% | | | | 46% | | | | 73% | | | | 140% | |
1. Represents the last business day of the Fund’s reporting period.
2. Per share amounts calculated based on the average shares outstanding during the period.
3. Assumes an initial investment on the business day before the first day of the fiscal period, with all dividends and distributions reinvested in additional shares on the reinvestment date, and redemption at the net asset value calculated on the last business day of the fiscal period. Sales charges are not reflected in the total returns. Total returns are not annualized for periods less than one full year. Returns do not reflect the deduction of taxes that a shareholder would pay on fund distributions or the redemption of fund shares.
4. Annualized for periods less than one full year.
5. Less than 0.005%.
6. Total expenses including indirect expenses from affiliated fund fees and expenses were as follows:
| | | | | | |
| | | | | | |
| Year Ended April 30, 2017 | | | 1.94 | % | |
| Year Ended April 29, 2016 | | | 1.93 | % | |
| Year Ended April 30, 2015 | | | 1.91 | % | |
| Year Ended April 30, 2014 | | | 2.20 | % | |
| Year Ended April 30, 2013 | | | 2.45 | % | |
7. Waiver was less than 0.005%.
See accompanying Notes to Financial Statements.
22 OPPENHEIMER DIVIDEND OPPORTUNITY FUND
| | | | | | | | | | | | | | | | | | | | |
Class C | | Year Ended April 30, 2017 | | | Year Ended April 29, 20161 | | | Year Ended April 30, 2015 | | | Year Ended April 30, 2014 | | | Year Ended April 30, 2013 | |
| Per Share Operating Data | | | | | | | | | | | | | | | | | | | | |
| Net asset value, beginning of period | | | $19.52 | | | | $20.11 | | | | $19.17 | | | | $17.19 | | | | $15.10 | |
| Income (loss) from investment operations: | | | | | | | | | | | | | | | | | | | | |
| Net investment income (loss)2 | | | 0.34 | | | | 0.38 | | | | 0.37 | | | | 0.26 | | | | (0.02) | |
| Net realized and unrealized gain (loss) | | | 2.09 | | | | (0.60) | | | | 0.97 | | | | 1.94 | | | | 2.11 | |
| Total from investment operations | | | 2.43 | | | | (0.22) | | | | 1.34 | | | | 2.20 | | | | 2.09 | |
| Dividends and/or distributions to shareholders: | | | | | | | | | | | | | | | | | | | | |
| Dividends from net investment income | | | (0.49) | | | | (0.37) | | | | (0.40) | | | | (0.22) | | | | 0.00 | |
| Net asset value, end of period | | | $21.46 | | | | $19.52 | | | | $20.11 | | | | $19.17 | | | | $17.19 | |
| | | | | | | | | | | | | | | | | | | | |
| | | | | | | | | | | | | | | | | | | | |
| Total Return, at Net Asset Value3 | | | 12.59% | | | | (1.05)% | | | | 7.08% | | | | 12.84% | | | | 13.84% | |
| | | | | | | | | | | | | | | | | | | | |
| Ratios/Supplemental Data | | | | | | | | | | | | | | | | | | | | |
| Net assets, end of period (in thousands) | | | $52,082 | | | | $43,138 | | | | $42,892 | | | | $40,789 | | | | $39,347 | |
| Average net assets (in thousands) | | | $48,317 | | | | $41,327 | | | | $41,408 | | | | $39,570 | | | | $39,873 | |
| Ratios to average net assets:4 | | | | | | | | | | | | | | | | | | | | |
| Net investment income (loss) | | | 1.64% | | | | 1.99% | | | | 1.89% | | | | 1.45% | | | | (0.14)% | |
| Expenses excluding specific expenses listed below | | | 1.90% | | | | 1.90% | | | | 1.90% | | | | 2.02% | | | | 2.16% | |
| Interest and fees from borrowings | | | 0.00%5 | | | | 0.00%5 | | | | 0.00% | | | | 0.00% | | | | 0.00% | |
| Total expenses6 | | | 1.90% | | | | 1.90% | | | | 1.90% | | | | 2.02% | | | | 2.16% | |
| Expenses after payments, waivers and/or reimbursements and reduction to custodian expenses | | | 1.89% | | | | 1.90%7 | | | | 1.90%7 | | | | 2.02%7 | | | | 2.15% | |
| Portfolio turnover rate | | | 64% | | | | 47% | | | | 46% | | | | 73% | | | | 140% | |
1. Represents the last business day of the Fund’s reporting period.
2. Per share amounts calculated based on the average shares outstanding during the period.
3. Assumes an initial investment on the business day before the first day of the fiscal period, with all dividends and distributions reinvested in additional shares on the reinvestment date, and redemption at the net asset value calculated on the last business day of the fiscal period. Sales charges are not reflected in the total returns. Total returns are not annualized for periods less than one full year. Returns do not reflect the deduction of taxes that a shareholder would pay on fund distributions or the redemption of fund shares.
4. Annualized for periods less than one full year.
5. Less than 0.005%.
6. Total expenses including indirect expenses from affiliated fund fees and expenses were as follows:
| | | | | | |
| | | | | | |
| Year Ended April 30, 2017 | | | 1.90 | % | |
| Year Ended April 29, 2016 | | | 1.90 | % | |
| Year Ended April 30, 2015 | | | 1.90 | % | |
| Year Ended April 30, 2014 | | | 2.02 | % | |
| Year Ended April 30, 2013 | | | 2.16 | % | |
7. Waiver was less than 0.005%.
See accompanying Notes to Financial Statements.
23 OPPENHEIMER DIVIDEND OPPORTUNITY FUND
FINANCIAL HIGHLIGHTS Continued
| | | | | | | | | | | | |
Class I | | Year Ended April 30, 2017 | | | Year Ended April 29 20161 | | | Period Ended April 30, 20152 | |
| Per Share Operating Data | | | | | | | | | | | | |
| Net asset value, beginning of period | | | $20.18 | | | | $20.76 | | | | $20.61 | |
| Income (loss) from investment operations: | | | | | | | | | | | | |
| Net investment income3 | | | 0.66 | | | | 0.66 | | | | 0.39 | |
| Net realized and unrealized gain (loss) | | | 2.10 | | | | (0.64) | | | | 0.22 | |
| Total from investment operations | | | 2.76 | | | | 0.02 | | | | 0.61 | |
| Dividends and/or distributions to shareholders: | | | | | | | | | | | | |
| Dividends from net investment income | | | (0.73) | | | | (0.60) | | | | (0.46) | |
| Net asset value, end of period | | | $22.21 | | | | $20.18 | | | | $20.76 | |
| | | | | | | | | | | | |
| | | | | | | | | | | | |
| Total Return, at Net Asset Value4 | | | 13.91%5 | | | | 0.20%5 | | | | 3.02% | |
| | | | | | | | | | | | |
| Ratios/Supplemental Data | | | | | | | | | | | | |
| Net assets, end of period (in thousands) | | | $2,572 | | | | $15 | | | | $10 | |
| Average net assets (in thousands) | | | $548 | | | | $15 | | | | $10 | |
| Ratios to average net assets:6 | | | | | | | | | | | | |
| Net investment income | | | 3.02% | | | | 3.35% | | | | 2.86% | |
| Expenses excluding specific expenses listed below | | | 0.71% | | | | 0.70% | | | | 0.69% | |
| Interest and fees from borrowings | | | 0.00%7 | | | | 0.00%7 | | | | 0.00% | |
| Total expenses8 | | | 0.71% | | | | 0.70% | | | | 0.69% | |
| Expenses after payments, waivers and/or reimbursements and reduction to custodian expenses | | | 0.70% | | | | 0.70%9 | | | | 0.69%9 | |
| Portfolio turnover rate | | | 64% | | | | 47% | | | | 46% | |
1. Represents the last business day of the Fund’s reporting period.
2. For the period from August 28, 2014 (inception of offering) to April 30, 2015.
3. Per share amounts calculated based on the average shares outstanding during the period.
4. Assumes an initial investment on the business day before the first day of the fiscal period, with all dividends and distributions reinvested in additional shares on the reinvestment date, and redemption at the net asset value calculated on the last business day of the fiscal period. Sales charges are not reflected in the total returns. Total returns are not annualized for periods less than one full year. Returns do not reflect the deduction of taxes that a shareholder would pay on fund distributions or the redemption of fund shares.
5. The return does not include adjustments in accordance with generally accepted accounting principles required at the period end for financial reporting purposes.
6. Annualized for periods less than one full year.
7. Less than 0.005%.
8. Total expenses including indirect expenses from affiliated fund fees and expenses were as follows:
| | | | | | |
| | | | | | |
| Year Ended April 30, 2017 | | | 0.71 | % | |
| Year Ended April 29, 2016 | | | 0.70 | % | |
| Period Ended April 30, 2015 | | | 0.69 | % | |
9. Waiver was less than 0.005%.
See accompanying Notes to Financial Statements.
24 OPPENHEIMER DIVIDEND OPPORTUNITY FUND
| | | | | | | | | | | | | | | | | | | | |
Class R | | Year Ended April 30, 2017 | | | Year Ended April 29, 20161 | | | Year Ended April 30, 2015 | | | Year Ended April 30, 2014 | | | Year Ended April 30, 2013 | |
| Per Share Operating Data | | | | | | | | | | | | | | | | | | | | |
| Net asset value, beginning of period | | | $20.00 | | | | $20.59 | | | | $19.61 | | | | $17.57 | | | | $15.40 | |
| Income (loss) from investment operations: | | | | | | | | | | | | | | | | | | | | |
| Net investment income2 | | | 0.45 | | | | 0.49 | | | | 0.48 | | | | 0.36 | | | | 0.07 | |
| Net realized and unrealized gain (loss) | | | 2.14 | | | | (0.61) | | | | 1.00 | | | | 1.99 | | | | 2.15 | |
| Total from investment operations | | | 2.59 | | | | (0.12) | | | | 1.48 | | | | 2.35 | | | | 2.22 | |
| Dividends and/or distributions to shareholders: | | | | | | | | | | | | | | | | | | | | |
| Dividends from net investment income | | | (0.58) | | | | (0.47) | | | | (0.50) | | | | (0.31) | | | | (0.05) | |
| Net asset value, end of period | | | $22.01 | | | | $20.00 | | | | $20.59 | | | | $19.61 | | | | $17.57 | |
| | | | | | | | | | | | | | | | | | | | |
| | | | | | | | | | | | | | | | | | | | |
| Total Return, at Net Asset Value3 | | | 13.17% | | | | (0.55)% | | | | 7.61% | | | | 13.46% | | | | 14.48% | |
| | | | | | | | | | | | | | | | | | | | |
| Ratios/Supplemental Data | | | | | | | | | | | | | | | | | | | | |
| Net assets, end of period (in thousands) | | | $13,332 | | | | $9,837 | | | | $9,051 | | | | $10,034 | | | | $13,327 | |
| Average net assets (in thousands) | | | $11,603 | | | | $8,890 | | | | $9,492 | | | | $11,300 | | | | $14,391 | |
| Ratios to average net assets:4 | | | | | | | | | | | | | | | | | | | | |
| Net investment income | | | 2.13% | | | | 2.49% | | | | 2.41% | | | | 1.95% | | | | 0.44% | |
| Expenses excluding specific expenses listed below | | | 1.40% | | | | 1.40% | | | | 1.40% | | | | 1.48% | | | | 1.57% | |
| Interest and fees from borrowings | | | 0.00%5 | | | | 0.00%5 | | | | 0.00% | | | | 0.00% | | | | 0.00% | |
| Total expenses6 | | | 1.40% | | | | 1.40% | | | | 1.40% | | | | 1.48% | | | | 1.57% | |
| Expenses after payments, waivers and/or reimbursements and reduction to custodian expenses | | | 1.39% | | | | 1.40%7 | | | | 1.40%7 | | | | 1.48%7 | | | | 1.57%7 | |
| Portfolio turnover rate | | | 64% | | | | 47% | | | | 46% | | | | 73% | | | | 140% | |
1. Represents the last business day of the Fund’s reporting period.
2. Per share amounts calculated based on the average shares outstanding during the period.
3. Assumes an initial investment on the business day before the first day of the fiscal period, with all dividends and distributions reinvested in additional shares on the reinvestment date, and redemption at the net asset value calculated on the last business day of the fiscal period. Sales charges are not reflected in the total returns. Total returns are not annualized for periods less than one full year. Returns do not reflect the deduction of taxes that a shareholder would pay on fund distributions or the redemption of fund shares.
4. Annualized for periods less than one full year.
5. Less than 0.005%.
6. Total expenses including indirect expenses from affiliated fund fees and expenses were as follows:
| | | | | | |
| | | | | | |
| Year Ended April 30, 2017 | | | 1.40 | % | |
| Year Ended April 29, 2016 | | | 1.40 | % | |
| Year Ended April 30, 2015 | | | 1.40 | % | |
| Year Ended April 30, 2014 | | | 1.48 | % | |
| Year Ended April 30, 2013 | | | 1.57 | % | |
7. Waiver was less than 0.005%.
See accompanying Notes to Financial Statements.
25 OPPENHEIMER DIVIDEND OPPORTUNITY FUND
FINANCIAL HIGHLIGHTS Continued
| | | | | | | | | | | | | | | | | | | | |
Class Y | | Year Ended April 30, 2017 | | | Year Ended April 29, 20161 | | | Year Ended April 30, 2015 | | | Year Ended April 30, 2014 | | | Year Ended April 30, 2013 | |
| Per Share Operating Data | | | | | | | | | | | | | | | | | | | | |
| Net asset value, beginning of period | | | $20.17 | | | | $20.76 | | | | $19.77 | | | | $17.87 | | | | $15.66 | |
| Income (loss) from investment operations: | | | | | | | | | | | | | | | | | | | | |
| Net investment income2 | | | 0.55 | | | | 0.59 | | | | 0.58 | | | | 0.48 | | | | 0.18 | |
| Net realized and unrealized gain (loss) | | | 2.18 | | | | (0.62) | | | | 1.01 | | | | 2.01 | | | | 2.20 | |
| Total from investment operations | | | 2.73 | | | | (0.03) | | | | 1.59 | | | | 2.49 | | | | 2.38 | |
| Dividends and/or distributions to shareholders: | | | | | | | | | | | | | | | | | | | | |
| Dividends from net investment income | | | (0.69) | | | | (0.56) | | | | (0.60) | | | | (0.59) | | | | (0.17) | |
| Net asset value, end of period | | | $22.21 | | | | $20.17 | | | | $20.76 | | | | $19.77 | | | | $17.87 | |
| | | | | | | | | | | | | | | | | | | | |
| | | | | | | | | | | | | | | | | | | | |
| Total Return, at Net Asset Value3 | | | 13.70%4 | | | | (0.04)%4 | | | | 8.15% | | | | 14.07% | | | | 15.30% | |
| | | | | | | | | | | | | | | | | | | | |
| Ratios/Supplemental Data | | | | | | | | | | | | | | | | | | | | |
| Net assets, end of period (in thousands) | | | $10,891 | | | | $5,777 | | | | $11,949 | | | | $8,064 | | | | $7,644 | |
| Average net assets (in thousands) | | | $7,845 | | | | $7,642 | | | | $10,315 | | | | $7,693 | | | | $8,889 | |
| Ratios to average net assets:5 | | | | | | | | | | | | | | | | | | | | |
| Net investment income | | | 2.58% | | | | 2.99% | | | | 2.87% | | | | 2.53% | | | | 1.11% | |
| Expenses excluding specific expenses listed below | | | 0.91% | | | | 0.91% | | | | 0.90% | | | | 0.94% | | | | 0.90% | |
| Interest and fees from borrowings | | | 0.00%6 | | | | 0.00%6 | | | | 0.00% | | | | 0.00% | | | | 0.00% | |
| Total expenses7 | | | 0.91% | | | | 0.91% | | | | 0.90% | | | | 0.94% | | | | 0.90% | |
| Expenses after payments, waivers and/or reimbursements and reduction to custodian expenses | | | 0.90% | | | | 0.91%8 | | | | 0.90%8 | | | | 0.94%8 | | | | 0.90%8 | |
| Portfolio turnover rate | | | 64% | | | | 47% | | | | 46% | | | | 73% | | | | 140% | |
1. Represents the last business day of the Fund’s reporting period.
2. Per share amounts calculated based on the average shares outstanding during the period.
3. Assumes an initial investment on the business day before the first day of the fiscal period, with all dividends and distributions reinvested in additional shares on the reinvestment date, and redemption at the net asset value calculated on the last business day of the fiscal period. Sales charges are not reflected in the total returns. Total returns are not annualized for periods less than one full year. Returns do not reflect the deduction of taxes that a shareholder would pay on fund distributions or the redemption of fund shares.
4. The return does not include adjustments in accordance with generally accepted accounting principles required at the period end for financial reporting purposes.
5. Annualized for periods less than one full year.
6. Less than 0.005%.
7. Total expenses including indirect expenses from affiliated fund fees and expenses were as follows:
| | | | | | |
| | | | | | |
| Year Ended April 30, 2017 | | | 0.91 | % | |
| Year Ended April 29, 2016 | | | 0.91 | % | |
| Year Ended April 30, 2015 | | | 0.90 | % | |
| Year Ended April 30, 2014 | | | 0.94 | % | |
| Year Ended April 30, 2013 | | | 0.90 | % | |
8. Waiver was less than 0.005%.
See accompanying Notes to Financial Statements.
26 OPPENHEIMER DIVIDEND OPPORTUNITY FUND
NOTES TO FINANCIAL STATEMENTS April 30, 2017
1. Organization
Oppenheimer Dividend Opportunity Fund (the “Fund”) is a diversified open-end management investment company registered under the Investment Company Act of 1940 (“1940 Act”), as amended. The Fund’s investment objective is to seek total return. The Fund’s investment adviser is OFI Global Asset Management, Inc. (“OFI Global” or the “Manager”), a wholly-owned subsidiary of OppenheimerFunds, Inc. (“OFI” or the “Sub-Adviser”). The Manager has entered into a sub-advisory agreement with OFI.
The Fund offers Class A, Class C, Class I, Class R and Class Y shares, and previously offered Class B shares for new purchase through June 29, 2012. Subsequent to that date, no new purchases of Class B shares are permitted, however reinvestment of dividend and/or capital gain distributions and exchanges of Class B shares into and from other Oppenheimer funds are allowed. As of July 1, 2014, Class N shares were renamed Class R shares. Class N shares subject to a contingent deferred sales charge (“CDSC”) on July 1, 2014, continue to be subject to a CDSC after the shares were renamed. Purchases of Class R shares occurring on or after July 1, 2014, are not subject to a CDSC upon redemption. Class A shares are sold at their offering price, which is normally net asset value plus a front-end sales charge. Class C and Class R shares are sold, and Class B shares were sold, without a front-end sales charge but may be subject to a CDSC. Class R shares are sold only through retirement plans. Retirement plans that offer Class R shares may impose charges on those accounts. Class I and Class Y shares are sold to certain institutional investors or intermediaries without either a front-end sales charge or a CDSC, however, the intermediaries may impose charges on their accountholders who beneficially own Class I and Class Y shares. All classes of shares have identical rights and voting privileges with respect to the Fund in general and exclusive voting rights on matters that affect that class alone. Earnings, net assets and net asset value per share may differ due to each class having its own expenses, such as transfer and shareholder servicing agent fees and shareholder communications, directly attributable to that class. Class A, B, C and R shares have separate distribution and/or service plans under which they pay fees. Class I and Class Y shares do not pay such fees. Class B shares will automatically convert to Class A shares 72 months after the date of purchase.
The following is a summary of significant accounting policies followed in the Fund’s preparation of financial statements in accordance with accounting principles generally accepted in the United States (“U.S. GAAP”).
2. Significant Accounting Policies
Security Valuation. All investments in securities are recorded at their estimated fair value, as described in Note 3.
Foreign Currency Translation. The books and records of the Fund are maintained in U.S. dollars. Any foreign currency amounts are translated into U.S. dollars on the following basis:
(1) Value of investment securities, other assets and liabilities — at the exchange rates prevailing at Market Close as described in Note 3.
(2) Purchases and sales of investment securities, income and expenses — at the rates of
27 OPPENHEIMER DIVIDEND OPPORTUNITY FUND
NOTES TO FINANCIAL STATEMENTS Continued
2. Significant Accounting Policies (Continued)
exchange prevailing on the respective dates of such transactions.
Although the net assets and the values are presented at the foreign exchange rates at Market Close, the Fund does not isolate the portion of the results of operations resulting from changes in foreign exchange rates on investments from the fluctuations arising from changes in prices of securities held. Such fluctuations are included with the net realized and unrealized gains or losses from investments shown in the Statement of Operations.
For securities, which are subject to foreign withholding tax upon disposition, realized gains or losses on such securities are recorded net of foreign withholding tax.
Reported net realized foreign exchange gains or losses arise from sales of foreign currencies, currency gains or losses realized between the trade and settlement dates on securities transactions, the difference between the amounts of dividends, interest, and foreign withholding tax reclaims recorded on Fund’s books, and the U.S. dollar equivalent of the amounts actually received or paid. Net unrealized foreign exchange gains and losses arise from changes in the value of assets and liabilities other than investments in securities, resulting from changes in the exchange rate.
Allocation of Income, Expenses, Gains and Losses. Income, expenses (other than those attributable to a specific class), gains and losses are allocated on a daily basis to each class of shares based upon the relative proportion of net assets represented by such class. Operating expenses directly attributable to a specific class are charged against the operations of that class.
Dividends and Distributions to Shareholders. Dividends and distributions to shareholders, which are determined in accordance with income tax regulations and may differ from U.S. GAAP, are recorded on the ex-dividend date. Income distributions, if any, are declared and paid quarterly. Capital gain distributions, if any, are declared and paid annually or at other times as deemed necessary by the Manager.
Investment Income. Dividend income is recorded on the ex-dividend date or upon ex-dividend notification in the case of certain foreign dividends where the ex-dividend date may have passed. Non-cash dividends included in dividend income, if any, are recorded at the fair value of the securities received. Withholding taxes on foreign dividends, if any, and capital gains taxes on foreign investments, if any, have been provided for in accordance with the Fund’s understanding of the applicable tax rules and regulations. Interest income is recognized on an accrual basis. Discount and premium, which are included in interest income on the Statement of Operations, are amortized or accreted daily.
Return of Capital Estimates. Distributions received from the Fund’s investments in Master Limited Partnerships (MLPs) and Real Estate Investments Trusts (REITs), generally are comprised of income and return of capital. The Fund records investment income and return of capital based on estimates. Such estimates are based on historical information available from each MLP, REIT and other industry sources. These estimates may subsequently be revised
28 OPPENHEIMER DIVIDEND OPPORTUNITY FUND
2. Significant Accounting Policies (Continued)
based on information received from MLPs and REITs after their tax reporting periods are concluded.
Custodian Fees. “Custodian fees and expenses” in the Statement of Operations may include interest expense incurred by the Fund on any cash overdrafts of its custodian account during the period. Such cash overdrafts may result from the effects of failed trades in portfolio securities and from cash outflows resulting from unanticipated shareholder redemption activity. The Fund pays interest to its custodian on such cash overdrafts, to the extent they are not offset by positive cash balances maintained by the Fund, based on the negative rolling average balance at an average Federal Funds Rate plus 0.50%. The “Reduction to custodian expenses” line item, if applicable, represents earnings on cash balances maintained by the Fund during the period. Such interest expense and other custodian fees may be paid with these earnings.
Security Transactions. Security transactions are recorded on the trade date. Realized gains and losses on securities sold are determined on the basis of identified cost.
Indemnifications. The Fund’s organizational documents provide current and former Trustees and officers with a limited indemnification against liabilities arising in connection with the performance of their duties to the Fund. In the normal course of business, the Fund may also enter into contracts that provide general indemnifications. The Fund’s maximum exposure under these arrangements is unknown as this would be dependent on future claims that may be made against the Fund. The risk of material loss from such claims is considered remote.
Federal Taxes. The Fund intends to comply with provisions of the Internal Revenue Code applicable to regulated investment companies and to distribute substantially all of its investment company taxable income, including any net realized gain on investments not offset by capital loss carryforwards, if any, to shareholders. Therefore, no federal income or excise tax provision is required. The Fund files income tax returns in U.S. federal and applicable state jurisdictions. The statute of limitations on the Fund’s tax return filings generally remains open for the three preceding fiscal reporting period ends. The Fund has analyzed its tax positions for the fiscal year ended April 30, 2017, including open tax years, and does not believe there are any uncertain tax positions requiring recognition in the Fund’s financial statements.
The tax components of capital shown in the following table represent distribution requirements the Fund must satisfy under the income tax regulations, losses the Fund may be able to offset against income and gains realized in future years and unrealized appreciation or depreciation of securities and other investments for federal income tax purposes.
29 OPPENHEIMER DIVIDEND OPPORTUNITY FUND
NOTES TO FINANCIAL STATEMENTS Continued
2. Significant Accounting Policies (Continued)
| | | | | | | | | | | | |
Undistributed Net Investment Income | | Undistributed
Long-Term
Gain | | | Accumulated
Loss
Carryforward1,2,3,4,5 | | | Net Unrealized
Appreciation
Based on cost of
Securities and
Other Investments
for Federal Income
Tax Purposes | |
| |
| $— | | | $— | | | | $143,984,465 | | | | $24,539,618 | |
1. At period end, the Fund had $143,967,874 of net capital loss carryforward available to offset future realized capital gains, if any, and thereby reduce future taxable gain distributions. Details of the capital loss carryforwards are included in the table below. Capital loss carryovers with no expiration, if any, must be utilized prior to those with expiration dates.
| | | | |
| Expiring | | | |
| |
| 2018 | | $ | 143,967,874 | |
2. The Fund had $16,591 of post-October foreign currency losses which were deferred.
3. During the reporting period, the Fund utilized $8,181,491 of capital loss carryforward to offset capital gains realized in that fiscal year.
4. During the previous reporting period, the Fund utilized $6,962,889 of capital loss carryforward to offset capital gains realized in that fiscal year.
5. During the reporting period, $21,487,631 of unused capital loss carryforward expired.
Net investment income (loss) and net realized gain (loss) may differ for financial statement and tax purposes. The character of dividends and distributions made during the fiscal year from net investment income or net realized gains are determined in accordance with federal income tax requirements, which may differ from the character of net investment income or net realized gains presented in those financial statements in accordance with U.S. GAAP. Also, due to timing of dividends and distributions, the fiscal year in which amounts are distributed may differ from the fiscal year in which the income or net realized gain was recorded by the Fund.
Accordingly, the following amounts have been reclassified for the reporting period. Net assets of the Fund were unaffected by the reclassifications.
| | | | | | | | |
Reduction to Paid-in Capital | | Reduction
to Accumulated
Net Investment
Loss | | | Reduction
to Accumulated Net
Realized Loss on Investments | |
| |
| $21,648,944 | | | $708,448 | | | | $20,940,496 | |
The tax character of distributions paid during the reporting periods:
| | | | | | | | |
| | | Year Ended
April 30, 2017 | | | Year Ended
April 30, 2016 | |
| |
| Distributions paid from: | | | | | | | | |
| Ordinary income | | $ | 6,750,185 | | | $ | 4,846,875 | |
The aggregate cost of securities and other investments and the composition of unrealized appreciation and depreciation of securities and other investments for federal income tax
30 OPPENHEIMER DIVIDEND OPPORTUNITY FUND
2. Significant Accounting Policies (Continued)
purposes at period end are noted in the following table. The primary difference between book and tax appreciation or depreciation of securities and other investments, if applicable, is attributable to the tax deferral of losses or tax realization of financial statement unrealized gain or loss.
| | | | |
| Federal tax cost of securities | | $ | 237,822,502 | |
| Federal tax cost of other investments | | | 366,389 | |
| | | | |
| Total federal tax cost | | $ | 238,188,891 | |
| | | | |
| Gross unrealized appreciation | | $ | 32,465,891 | |
| Gross unrealized depreciation | | | (7,926,273) | |
| | | | |
| Net unrealized appreciation | | $ | 24,539,618 | |
| | | | |
Use of Estimates. The preparation of financial statements in conformity with U.S. GAAP requires management to make estimates and assumptions that affect the reported amounts of assets and liabilities and disclosure of contingent assets and liabilities at the date of the financial statements and the reported amounts of increases and decreases in net assets from operations during the reporting period. Actual results could differ from those estimates.
Recent Accounting Pronouncement. In October 2016, the Securities and Exchange Commission (“SEC”) adopted amendments to rules under the Investment Company Act of 1940 (“final rules”) intended to modernize the reporting and disclosure of information by registered investment companies. The final rules amend Regulation S-X and require funds to provide standardized, enhanced derivative disclosure in fund financial statements in a format designed for individual investors. The amendments to Regulation S-X also update the disclosures for other investments and investments in, and advances to affiliates and amend the rules regarding the general form and content of fund financial statements. The compliance date for the amendments to Regulation S-X is August 1, 2017. OFI Global is currently evaluating the amendments and their impact, if any, on the Fund’s financial statements.
3. Securities Valuation
The Fund calculates the net asset value of its shares as of 4:00 P.M. Eastern time, on each day the New York Stock Exchange (the “Exchange”) is open for trading, except in the case of a scheduled early closing of the Exchange, in which case the Fund will calculate net asset value of the shares as of the scheduled early closing time of the Exchange.
The Fund’s Board has adopted procedures for the valuation of the Fund’s securities and has delegated the day-to-day responsibility for valuation determinations under those procedures to the Manager. The Manager has established a Valuation Committee which is responsible for determining a fair valuation for any security for which market quotations are not readily available. The Valuation Committee’s fair valuation determinations are subject to review, approval and ratification by the Fund’s Board at its next regularly scheduled meeting covering the calendar quarter in which the fair valuation was determined.
31 OPPENHEIMER DIVIDEND OPPORTUNITY FUND
NOTES TO FINANCIAL STATEMENTS Continued
3. Securities Valuation (Continued)
Valuation Methods and Inputs
Securities are valued primarily using unadjusted quoted market prices, when available, as supplied by third party pricing services or broker-dealers.
The following methodologies are used to determine the market value or the fair value of the types of securities described below:
Equity securities traded on a securities exchange (including exchange-traded derivatives other than futures and futures options) are valued based on the official closing price on the principal exchange on which the security is traded, as identified by the Manager, prior to the time when the Fund’s assets are valued. If the official closing price is unavailable, the security is valued at the last sale price on the principal exchange on which it is traded, or if no sales occurred, the security is valued at the mean between the quoted bid and asked prices. Over-the-counter equity securities are valued at the last published sale price, or if no sales occurred, at the mean between the quoted bid and asked prices. Events occurring after the close of trading on foreign exchanges may result in adjustments to the valuation of foreign securities to more accurately reflect their fair value as of the time when the Fund’s assets are valued.
Shares of a registered investment company that are not traded on an exchange are valued at that investment company’s net asset value per share.
Corporate and government debt securities (of U.S. or foreign issuers) and municipal debt securities, short-term notes, mortgage-backed securities, collateralized mortgage obligations, and asset-backed securities are valued at the mean between the bid and asked prices utilizing evaluated prices obtained from third party pricing services or broker-dealers who may use matrix pricing methods to determine the evaluated prices. Standard inputs generally considered by third-party pricing vendors include reported trade data, broker-dealer price quotations, benchmark yields, issuer spreads on comparable securities, the credit quality, yield, maturity, as well as other appropriate factors.
Forward foreign currency exchange contracts are valued utilizing current and forward currency rates obtained from third party pricing services. When the settlement date of a contract is an interim date for which a quotation is not available, interpolated values are derived using the nearest dated forward currency rate.
Securities for which market quotations are not readily available or a significant event has occurred that would materially affect the value of the security, the security is fair valued either (i) by a standardized fair valuation methodology applicable to the security type or the significant event as previously approved by the Valuation Committee and the Fund’s Board or (ii) as determined in good faith by the Manager’s Valuation Committee. The Valuation Committee considers all relevant facts that are reasonably available, through either public information or information available to the Manager, when determining the fair value of a security. Those standardized fair valuation methodologies include, but are not limited to, valuing securities at the last sale price or initially at cost and subsequently adjusting the value based on: changes in company specific fundamentals, changes in an appropriate securities index, or changes in the value of similar securities which may be further adjusted for any discounts related to security-specific resale restrictions. When possible, such methodologies use observable market inputs such as unadjusted quoted prices of similar securities,
32 OPPENHEIMER DIVIDEND OPPORTUNITY FUND
3. Securities Valuation (Continued)
observable interest rates, currency rates and yield curves. The methodologies used for valuing securities are not necessarily an indication of the risks associated with investing in those securities nor can it be assured that the Fund can obtain the fair value assigned to a security if it were to sell the security.
Classifications
Each investment asset or liability of the Fund is assigned a level at measurement date based on the significance and source of the inputs to its valuation. Various data inputs may be used in determining the value of each of the Fund’s investments as of the reporting period end. These data inputs are categorized in the following hierarchy under applicable financial accounting standards:
1) Level 1-unadjusted quoted prices in active markets for identical assets or liabilities (including securities actively traded on a securities exchange)
2) Level 2-inputs other than unadjusted quoted prices that are observable for the asset or liability (such as unadjusted quoted prices for similar assets and market corroborated inputs such as interest rates, prepayment speeds, credit risks, etc.)
3) Level 3-significant unobservable inputs (including the Manager’s own judgments about assumptions that market participants would use in pricing the asset or liability).
The inputs used for valuing securities are not necessarily an indication of the risks associated with investing in those securities.
The Fund classifies each of its investments in investment companies which are publicly offered as Level 1. Investment companies that are not publicly offered, if any, are measured using net asset value and are classified as Level 2 in the fair value hierarchy.
The table below categorizes amounts that are included in the Fund’s Statement of Assets and Liabilities at period end based on valuation input level:
| | | | | | | | | | | | | | | | |
| | | Level 1—
Unadjusted
Quoted Prices | | | Level 2— Other Significant
Observable Inputs | | | Level 3—
Significant
Unobservable
Inputs | | | Value | |
| |
| Assets Table | | | | | | | | | | | | | | | | |
| Investments, at Value: | | | | | | | | | | | | | | | | |
| Common Stocks | | | | | | | | | | | | | | | | |
Consumer Discretionary | | $ | 13,832,469 | | | $ | 5,983,674 | | | $ | — | | | $ | 19,816,143 | |
Consumer Staples | | | 13,488,789 | | | | 4,013,057 | | | | — | | | | 17,501,846 | |
Energy | | | 27,147,413 | | | | — | | | | — | | | | 27,147,413 | |
Financials | | | 54,702,643 | | | | 8,702,396 | | | | — | | | | 63,405,039 | |
Health Care | | | 22,387,864 | | | | — | | | | — | | | | 22,387,864 | |
Industrials | | | 19,389,715 | | | | 19,578,292 | | | | — | | | | 38,968,007 | |
Information Technology | | | 25,346,071 | | | | — | | | | — | | | | 25,346,071 | |
Materials | | | 11,957,070 | | | | 1,214,820 | | | | — | | | | 13,171,890 | |
Telecommunication Services | | | 8,874,562 | | | | 4,200,359 | | | | — | | | | 13,074,921 | |
Utilities | | | 11,620,824 | | | | 1,868,441 | | | | — | | | | 13,489,265 | |
| Preferred Stock | | | 1,378,580 | | | | — | | | | — | | | | 1,378,580 | |
33 OPPENHEIMER DIVIDEND OPPORTUNITY FUND
NOTES TO FINANCIAL STATEMENTS Continued
3. Securities Valuation (Continued)
| | | | | | | | | | | | | | | | |
| | | Level 1—
Unadjusted
Quoted Prices | | | Level 2— Other Significant
Observable Inputs | | | Level 3—
Significant
Unobservable
Inputs | | | Value | |
| |
| Common Stocks (Continued) | | | | | | | | | | | | | | | | |
| Investment Company | | $ | 7,011,919 | | | $ | — | | | $ | — | | | $ | 7,011,919 | |
| | | | |
| Total Investments, at Value | | | 217,137,919 | | | | 45,561,039 | | | | — | | | | 262,698,958 | |
| Other Financial Instruments: | | | | | | | | | | | | | | | | |
| Forward currency exchange contracts | | | — | | | | 156,642 | | | | — | | | | 156,642 | |
| | | | |
| Total Assets | | $ | 217,137,919 | | | $ | 45,717,681 | | | $ | — | | | $ | 262,855,600 | |
| | | | |
| | | | |
| Liabilities Table | | | | | | | | | | | | | | | | |
| Other Financial Instruments: | | | | | | | | | | | | | | | | |
| Forward currency exchange contracts | | $ | — | | | $ | (498,164 | ) | | $ | — | | | $ | (498,164) | |
| | | | |
| Total Liabilities | | $ | — | | | $ | (498,164 | ) | | $ | — | | | $ | (498,164) | |
| | | | |
Forward currency exchange contracts and futures contracts, if any, are reported at their unrealized appreciation/depreciation at measurement date, which represents the change in the contract’s value from trade date. All additional assets and liabilities included in the above table are reported at their market value at measurement date.
4. Investments and Risks
Investments in Affiliated Funds. The Fund is permitted to invest in other mutual funds advised by the Manager (“Affiliated Funds”). Affiliated Funds are open-end management investment companies registered under the 1940 Act, as amended. The Manager is the investment adviser of, and the Sub-Adviser provides investment and related advisory services to, the Affiliated Funds. When applicable, the Fund’s investments in Affiliated Funds are included in the Statement of Investments. Shares of Affiliated Funds are valued at their net asset value per share. As a shareholder, the Fund is subject to its proportional share of the Affiliated Funds’ expenses, including their management fee. The Manager will waive fees and/ or reimburse Fund expenses in an amount equal to the indirect management fees incurred through the Fund’s investment in the Affiliated Funds.
Each of the Affiliated Funds in which the Fund invests has its own investment risks, and those risks can affect the value of the Fund’s investments and therefore the value of the Fund’s shares. To the extent that the Fund invests more of its assets in one Affiliated Fund than in another, the Fund will have greater exposure to the risks of that Affiliated Fund.
Investments in Money Market Instruments. The Fund is permitted to invest its free cash balances in money market instruments to provide liquidity or for defensive purposes. The Fund may invest in money market instruments by investing in Class E shares of Oppenheimer Institutional Government Money Market Fund (“IGMMF”), formerly known as Oppenheimer Institutional Money Market Fund, which is an Affiliated Fund. IGMMF is regulated as a money market fund under the 1940 Act, as amended. The Fund may also invest in money market instruments directly or in other affiliated or unaffiliated money market funds.
34 OPPENHEIMER DIVIDEND OPPORTUNITY FUND
4. Investments and Risks (Continued)
Master Limited Partnerships (“MLPs”). MLPs issue common units that represent an equity ownership interest in a partnership and provide limited voting rights. MLP common units are registered with the Securities and Exchange Commission (“SEC”), and are freely tradable on securities exchanges such as the NYSE and the NASDAQ Stock Market (“NASDAQ”), or in the over-the-counter (“OTC”) market. An MLP consists of one or more general partners, who conduct the business, and one or more limited partners, who contribute capital. MLP common unit holders have a limited role in the partnership’s operations and management. The Fund, as a limited partner, normally would not be liable for the debts of the MLP beyond the amounts the Fund has contributed, but would not be shielded to the same extent that a shareholder of a corporation would be. In certain circumstances creditors of an MLP would have the right to seek return of capital distributed to a limited partner. This right of an MLP’s creditors would continue after the Fund sold its investment in the MLP.
Equity Security Risk. Stocks and other equity securities fluctuate in price. The value of the Fund’s portfolio may be affected by changes in the equity markets generally. Equity markets may experience significant short-term volatility and may fall sharply at times. Different markets may behave differently from each other and U.S. equity markets may move in the opposite direction from one or more foreign stock markets. Adverse events in any part of the equity or fixed-income markets may have unexpected negative effects on other market segments.
The prices of individual equity securities generally do not all move in the same direction at the same time and a variety of factors can affect the price of a particular company’s securities. These factors may include, but are not limited to, poor earnings reports, a loss of customers, litigation against the company, general unfavorable performance of the company’s sector or industry, or changes in government regulations affecting the company or its industry.
5. Market Risk Factors
The Fund’s investments in securities and/or financial derivatives may expose the Fund to various market risk factors:
Commodity Risk. Commodity risk relates to the change in value of commodities or commodity indexes as they relate to increases or decreases in the commodities market. Commodities are physical assets that have tangible properties. Examples of these types of assets are crude oil, heating oil, metals, livestock, and agricultural products.
Credit Risk. Credit risk relates to the ability of the issuer of debt to meet interest and principal payments, or both, as they come due. In general, lower-grade, higher-yield debt securities are subject to credit risk to a greater extent than lower-yield, higher-quality securities.
Equity Risk. Equity risk relates to the change in value of equity securities as they relate to increases or decreases in the general market.
Foreign Exchange Rate Risk. Foreign exchange rate risk relates to the change in the U.S. dollar value of a security held that is denominated in a foreign currency. The U.S. dollar value of a foreign currency denominated security will decrease as the dollar appreciates
35 OPPENHEIMER DIVIDEND OPPORTUNITY FUND
NOTES TO FINANCIAL STATEMENTS Continued
5. Market Risk Factors (Continued)
against the currency, while the U.S. dollar value will increase as the dollar depreciates against the currency.
Interest Rate Risk. Interest rate risk refers to the fluctuations in value of fixed-income securities resulting from the inverse relationship between price and yield. For example, an increase in general interest rates will tend to reduce the market value of already issued fixed-income investments, and a decline in general interest rates will tend to increase their value. In addition, debt securities with longer maturities, which tend to have higher yields, are subject to potentially greater fluctuations in value from changes in interest rates than obligations with shorter maturities.
Volatility Risk. Volatility risk refers to the magnitude of the movement, but not the direction of the movement, in a financial instrument’s price over a defined time period. Large increases or decreases in a financial instrument’s price over a relative time period typically indicate greater volatility risk, while small increases or decreases in its price typically indicate lower volatility risk.
6. Use of Derivatives
The Fund’s investment objective not only permits the Fund to purchase investment securities, it also allows the Fund to enter into various types of derivatives contracts, including, but not limited to, futures contracts, forward currency exchange contracts, credit default swaps, interest rate swaps, total return swaps, variance swaps and purchased and written options. In doing so, the Fund will employ strategies in differing combinations to permit it to increase, decrease, or change the level or types of exposure to market risk factors. These instruments may allow the Fund to pursue its objectives more quickly and efficiently than if it were to make direct purchases or sales of securities capable of effecting a similar response to market factors. Such contracts may be entered into through a bilateral over-the-counter (“OTC”) transaction, or through a securities or futures exchange and cleared through a clearinghouse.
Derivatives may have little or no initial cash investment relative to their market value exposure and therefore can produce significant gains or losses in excess of their cost due to unanticipated changes in the market risk factors and the overall market. This use of embedded leverage allows the Fund to increase its market value exposure relative to its net assets and can substantially increase the volatility of the Fund’s performance. In instances where the Fund is using derivatives to decrease, or hedge, exposures to market risk factors for securities held by the Fund, there are also risks that those derivatives may not perform as expected resulting in losses for the combined or hedged positions. Some derivatives have the potential for unlimited loss, regardless of the size of the Fund’s initial investment.
Additional associated risks from investing in derivatives also exist and potentially could have significant effects on the valuation of the derivative and the Fund. Typically, the associated risks are not the risks that the Fund is attempting to increase or decrease exposure to, per its investment objectives, but are the additional risks from investing in derivatives. Examples of these associated risks are liquidity risk, which is the risk that the Fund will not be able to sell the derivative in the open market in a timely manner, and counterparty credit risk,
36 OPPENHEIMER DIVIDEND OPPORTUNITY FUND
6. Use of Derivatives (Continued)
which is the risk that the counterparty will not fulfill its obligation to the Fund.
The Fund’s actual exposures to these market risk factors and associated risks during the period are discussed in further detail, by derivative type, below.
Forward Currency Exchange Contracts
The Fund may enter into forward currency exchange contracts (“forward contracts”) for the purchase or sale of a foreign currency at a negotiated rate at a future date. Such contracts are traded in the OTC inter-bank currency dealer market.
Forward contracts are reported on a schedule following the Statement of Investments. The unrealized appreciation (depreciation) is reported in the Statement of Assets and Liabilities as a receivable (or payable) and in the Statement of Operations within the change in unrealized appreciation (depreciation). At contract close, the difference between the original cost of the contract and the value at the close date is recorded as a realized gain (loss) in the Statement of Operations.
The Fund may enter into forward foreign currency exchange contracts in order to decrease exposure to foreign exchange rate risk associated with either specific transactions or portfolio instruments or to increase exposure to foreign exchange rate risk.
During the reporting period, the Fund had daily average contract amounts on forward contracts to buy and sell of $1,312,760 and $21,750,062, respectively.
Additional associated risk to the Fund includes counterparty credit risk. Counterparty credit risk arises from the possibility that the counterparty to a forward contract will default and fail to perform its obligations to the Fund.
Counterparty Credit Risk. Derivative positions are subject to the risk that the counterparty will not fulfill its obligation to the Fund. The Fund intends to enter into derivative transactions with counterparties that the Manager believes to be creditworthy at the time of the transaction.
The Fund’s risk of loss from counterparty credit risk on OTC derivatives is generally limited to the aggregate unrealized gain netted against any collateral held by the Fund. For OTC options purchased, the Fund bears the risk of loss of the amount of the premiums paid plus the positive change in market values net of any collateral held by the Fund should the counterparty fail to perform under the contracts. Options written by the Fund do not typically give rise to counterparty credit risk, as options written generally obligate the Fund and not the counterparty to perform.
To reduce counterparty risk with respect to OTC transactions, the Fund has entered into master netting arrangements, established within the Fund’s International Swap and Derivatives Association, Inc. (“ISDA”) master agreements, which allow the Fund to make (or to have an entitlement to receive) a single net payment in the event of default (close-out netting) for outstanding payables and receivables with respect to certain OTC positions in swaps, options, swaptions, and forward currency exchange contracts for each individual counterparty. In addition, the Fund may require that certain counterparties post cash and/or securities in collateral accounts to cover their net payment obligations for those derivative contracts
37 OPPENHEIMER DIVIDEND OPPORTUNITY FUND
NOTES TO FINANCIAL STATEMENTS Continued
6. Use of Derivatives (Continued)
subject to ISDA master agreements. If the counterparty fails to perform under these contracts and agreements, the cash and/or securities will be made available to the Fund.
ISDA master agreements include credit related contingent features which allow counterparties to OTC derivatives to terminate derivative contracts prior to maturity in the event that, for example, the Fund’s net assets decline by a stated percentage or the Fund fails to meet the terms of its ISDA master agreements, which would cause the Fund to accelerate payment of any net liability owed to the counterparty.
For financial reporting purposes, the Fund does not offset derivative assets and derivative liabilities that are subject to netting arrangements in the Statement of Assets and Liabilities. Bankruptcy or insolvency laws of a particular jurisdiction may impose restrictions on or prohibitions against the right of offset in bankruptcy, insolvency or other events.
The Fund’s risk of loss from counterparty credit risk on exchange-traded derivatives cleared through a clearinghouse and for centrally cleared swaps is generally considered lower than as compared to OTC derivatives. However, counterparty credit risk exists with respect to initial and variation margin deposited/paid by the Fund that is held in futures commission merchant, broker and/or clearinghouse accounts for such exchange-traded derivatives and for centrally cleared swaps.
With respect to centrally cleared swaps, such transactions will be submitted for clearing, and if cleared, will be held in accounts at futures commission merchants or brokers that are members of clearinghouses. While brokers, futures commission merchants and clearinghouses are required to segregate customer margin from their own assets, in the event that a broker, futures commission merchant or clearinghouse becomes insolvent or goes into bankruptcy and at that time there is a shortfall in the aggregate amount of margin held by the broker, futures commission merchant or clearinghouse for all its customers, U.S. bankruptcy laws will typically allocate that shortfall on a pro-rata basis across all the broker’s, futures commission merchant’s or clearinghouse’s customers, potentially resulting in losses to the Fund.
There is the risk that a broker, futures commission merchant or clearinghouse will decline to clear a transaction on the Fund’s behalf, and the Fund may be required to pay a termination fee to the executing broker with whom the Fund initially enters into the transaction. Clearinghouses may also be permitted to terminate centrally cleared swaps at any time. The Fund is also subject to the risk that the broker or futures commission merchant will improperly use the Fund’s assets deposited/paid as initial or variation margin to satisfy payment obligations of another customer. In the event of a default by another customer of the broker or futures commission merchant, the Fund might not receive its variation margin payments from the clearinghouse, due to the manner in which variation margin payments are aggregated for all customers of the broker/futures commission merchant.
Collateral and margin requirements differ by type of derivative. Margin requirements are established by the broker, futures commission merchant or clearinghouse for exchange-traded and cleared derivatives, including centrally cleared swaps. Brokers, futures commission merchants and clearinghouses can ask for margin in excess of the regulatory minimum, or increase the margin amount, in certain circumstances.
Collateral terms are contract specific for OTC derivatives. For derivatives traded under an
38 OPPENHEIMER DIVIDEND OPPORTUNITY FUND
6. Use of Derivatives (Continued)
ISDA master agreement, the collateral requirements are typically calculated by netting the mark to market amount for each transaction under such agreement and comparing that amount to the value of any collateral currently pledged by the Fund or the counterparty.
For financial reporting purposes, cash collateral that has been pledged to cover obligations of the Fund, if any, is reported separately on the Statement of Assets and Liabilities as cash pledged as collateral. Non-cash collateral pledged by the Fund, if any, is noted in the Statement of Investments. Generally, the amount of collateral due from or to a party must exceed a minimum transfer amount threshold (e.g. $250,000) before a transfer has to be made. To the extent amounts due to the Fund from its counterparties are not fully collateralized, contractually or otherwise, the Fund bears the risk of loss from counterparty nonperformance.
The following table presents by counterparty the Fund’s OTC derivative assets net of the related collateral pledged by the Fund at period end:
| | | | | | | | | | | | | | | | | | | | |
| | | | | | Gross Amounts Not Offset in the Statement of
Assets & Liabilities | | | | |
| Counterparty | | Gross Amounts
Not Offset in the Statement of Assets &
Liabilities* | | | Financial
Instruments
Available for
Offset | | | Financial
Instruments
Collateral
Received** | | | Cash Collateral
Received** | | | Net Amount | |
| |
| Bank of America NA | | $ | 46,369 | | | $ | – | | | $ | – | | | $ | – | | | $ | 46,369 | |
| HSBC Bank USA NA | | | 67,698 | | | | (67,698) | | | | – | | | | – | | | | – | |
| JPMorgan Chase Bank NA | | | 42,575 | | | | (42,575) | | | | – | | | | – | | | | – | |
| | | | |
| | $ | 156,642 | | | $ | (110,273) | | | $ | – | | | $ | – | | | $ | 46,369 | |
| | | | |
*OTC derivatives are reported gross on the Statement of Assets and Liabilities. Exchange traded options and margin related to centrally cleared swaps and futures, if any, are excluded from these reported amounts.
**Reported collateral posted for the benefit of the Fund within this table is limited to the net outstanding amount due from an individual counterparty. The collateral posted for the benefit of the Fund may exceed these amounts.
The following table presents by counterparty the Fund’s OTC derivative liabilities net of the related collateral pledged by the Fund at period end:
| | | | | | | | | | | | | | | | | | | | |
| | | | | | Gross Amounts Not Offset in the Statement of
Assets & Liabilities | | | | |
| Counterparty | | Gross Amounts
Not Offset in
the Statement
of Assets &
Liabilities* | | | Financial
Instruments
Available for Offset | | | Financial
Instruments
Collateral
Pledged** | | | Cash Collateral
Pledged** | | | Net Amount | |
| |
| Goldman Sachs Bank USA | | $ | (236,222) | | | $ | – | | | $ | – | | | $ | – | | | $ | (236,222) | |
| HSBC Bank USA NA | | | (208,671) | | | | 67,698 | | | | – | | | | – | | | | (140,973) | |
39 OPPENHEIMER DIVIDEND OPPORTUNITY FUND
NOTES TO FINANCIAL STATEMENTS Continued
6. Use of Derivatives (Continued)
| | | | | | | | | | | | | | | | | | | | |
| | | | | | Gross Amounts Not Offset in the Statement of
Assets & Liabilities | | | | |
| Counterparty | | Gross Amounts
Not Offset in the Statement of Assets &
Liabilities* | | | Financial
Instruments
Available for
Offset | | | Financial
Instruments
Collateral
Pledged** | | | Cash Collateral
Pledged** | | | Net Amount | |
| |
| JPMorgan Chase Bank NA | | $ | (53,271) | | | $ | 42,575 | | | $ | – | | | $ | – | | | $ | (10,696) | |
| | | | |
| | $ | (498,164) | | | $ | 110,273 | | | $ | – | | | $ | – | | | $ | (387,891) | |
| | | | |
*OTC derivatives are reported gross on the Statement of Assets and Liabilities. Exchange traded options and margin related to centrally cleared swaps and futures, if any, are excluded from these reported amounts.
**Reported collateral pledged within this table is limited to the net outstanding amount due from the Fund.
The securities pledged as collateral by the Fund as reported on the Statements of Investments may exceed these amounts.
The following table presents the valuations of derivative instruments by risk exposure as reported within the Statement of Assets and Liabilities at period end:
| | | | | | | | | | | | |
| | | Asset Derivatives | | | Liability Derivatives | |
Derivatives Not Accounted for as Hedging
Instruments | | Statement of Assets and Liabilities Location | | Value | | | Statement of Assets and Liabilities Location | | Value | |
| |
| | Unrealized appreciation on | | | | | | Unrealized depreciation on | | | | |
| Forward currency | | forward currency exchange | | | | | | forward currency exchange | | | | |
| exchange contracts | | contracts | | | $ 156,642 | | | contracts | | | $ 498,164 | |
The effect of derivative instruments on the Statement of Operations is as follows:
| | |
Amount of Realized Gain or (Loss) Recognized on Derivatives |
Derivatives Not Accounted for as Hedging Instruments | | Foreign currency transactions |
|
| Forward currency | | |
| exchange contracts | | $ 1,016,870 |
| | |
Amount of Change in Unrealized Gain or (Loss) Recognized on Derivatives |
Derivatives Not Accounted for as Hedging Instruments | | Translation of assets and liabilities denominated in foreign currencies |
|
| Forward currency | | |
| exchange contracts | | $ (48,254) |
7. Shares of Beneficial Interest
The Fund has authorized an unlimited number of $0.001 par value shares of beneficial interest
40 OPPENHEIMER DIVIDEND OPPORTUNITY FUND
7. Shares of Beneficial Interest (Continued)
of each class. Transactions in shares of beneficial interest were as follows:
| | | | | | | | | | | | | | | | |
| | | Year Ended April 30, 2017 | | | Year Ended April 29, 20161 | |
| | | Shares | | | Amount | | | Shares | | | Amount | |
| |
| Class A | | | | | | | | | | | | | | | | |
| Sold | | | 2,552,318 | | | $ | 53,962,185 | | | | 2,081,810 | | | $ | 41,165,670 | |
| Dividends and/or distributions reinvested | | | 229,488 | | | | 4,830,973 | | | | 175,078 | | | | 3,477,402 | |
| Redeemed | | | (2,022,681 | ) | | | (42,890,044 | ) | | | (1,588,436 | ) | | | (31,017,399) | |
| | | | |
| Net increase | | | 759,125 | | | $ | 15,903,114 | | | | 668,452 | | | $ | 13,625,673 | |
| | | | |
|
| |
| Class B | | | | | | | | | | | | | | | | |
| Sold | | | 25,741 | | | $ | 525,337 | | | | 18,903 | | | $ | 364,702 | |
| Dividends and/or distributions reinvested | | | 2,015 | | | | 40,974 | | | | 2,687 | | | | 51,823 | |
| Redeemed | | | (79,345 | ) | | | (1,629,089 | ) | | | (91,420 | ) | | | (1,750,390) | |
| | | | |
| Net decrease | | | (51,589 | ) | | $ | (1,062,778 | ) | | | (69,830 | ) | | $ | (1,333,865) | |
| | | | |
|
| |
| Class C | | | | | | | | | | | | | | | | |
| Sold | | | 779,949 | | | $ | 15,933,890 | | | | 595,606 | | | $ | 11,404,406 | |
| Dividends and/or distributions reinvested | | | 53,121 | | | | 1,081,874 | | | | 38,711 | | | | 744,339 | |
| Redeemed | | | (616,342 | ) | | | (12,634,062 | ) | | | (557,470 | ) | | | (10,594,204) | |
| | | | |
| Net increase | | | 216,728 | | | $ | 4,381,702 | | | | 76,847 | | | $ | 1,554,541 | |
| | | | |
|
| |
| Class I | | | | | | | | | | | | | | | | |
| Sold | | | 124,698 | | | $ | 2,747,086 | | | | 2,224 | | | $ | 42,557 | |
| Dividends and/or distributions reinvested | | | 824 | | | | 18,084 | | | | 6 | | | | 116 | |
| Redeemed | | | (10,466 | ) | | | (232,787 | ) | | | (1,968 | ) | | | (38,630) | |
| | | | |
| Net increase | | | 115,056 | | | $ | 2,532,383 | | | | 262 | | | $ | 4,043 | |
| | | | |
|
| |
| Class R | | | | | | | | | | | | | | | | |
| Sold | | | 224,509 | | | $ | 4,733,138 | | | | 123,976 | | | $ | 2,431,093 | |
| Dividends and/or distributions reinvested | | | 14,318 | | | | 298,796 | | | | 9,933 | | | | 195,582 | |
| Redeemed | | | (124,922 | ) | | | (2,654,893 | ) | | | (81,629 | ) | | | (1,608,253) | |
| | | | |
| Net increase | | | 113,905 | | | $ | 2,377,041 | | | | 52,280 | | | $ | 1,018,422 | |
| | | | |
|
| |
| Class Y | | | | | | | | | | | | | | | | |
| Sold | | | 338,734 | | | $ | 7,257,016 | | | | 148,548 | | | $ | 2,946,960 | |
| Dividends and/or distributions reinvested | | | 9,171 | | | | 193,588 | | | | 9,196 | | | | 182,450 | |
| Redeemed | | | (143,872 | ) | | | (3,067,120 | ) | | | (447,002 | ) | | | (8,863,792) | |
| | | | |
| Net increase (decrease) | | | 204,033 | | | $ | 4,383,484 | | | | (289,258 | ) | | $ | (5,734,382) | |
| | | | |
1. Represents the last business day of the Fund’s reporting period.
8. Purchases and Sales of Securities
The aggregate cost of purchases and proceeds from sales of securities, other than short-term obligations and investments in IGMMF, for the reporting period were as follows:
41 OPPENHEIMER DIVIDEND OPPORTUNITY FUND
NOTES TO FINANCIAL STATEMENTS Continued
8. Purchases and Sales of Securities (Continued)
| | | | | | | | | | |
| | | Purchases | | | | | Sales | |
| |
| Investment securities | | $ | 176,328,164 | | | | | $ | 145,185,502 | |
9. Fees and Other Transactions with Affiliates
Management Fees. Under the investment advisory agreement, the Fund pays the Manager a management fee based on the daily net assets of the Fund at an annual rate as shown in the following table:
| | | | | | | | |
Fee Schedule | | | | | | |
Up to $500 million | | | 0.65 | % | | | | |
Next $500 million | | | 0.63 | | | | | |
Next $4 billion | | | 0.60 | | | | | |
Over $5 billion | | | 0.58 | | | | | |
The Fund’s effective management fee for the reporting period was 0.65% of average annual net assets before any applicable waivers.
Sub-Adviser Fees. The Manager has retained the Sub-Adviser to provide the day-to-day portfolio management of the Fund. Under the Sub-Advisory Agreement, the Manager pays the Sub-Adviser an annual fee in monthly installments, equal to a percentage of the investment management fee collected by the Manager from the Fund, which shall be calculated after any investment management fee waivers. The fee paid to the Sub-Adviser is paid by the Manager, not by the Fund.
Transfer Agent Fees. OFI Global (the “Transfer Agent”) serves as the transfer and shareholder servicing agent for the Fund. The Fund pays the Transfer Agent a fee based on annual net assets. Fees incurred and average net assets for each class with respect to these services are detailed in the Statement of Operations and Financial Highlights, respectively.
Sub-Transfer Agent Fees. The Transfer Agent has retained Shareholder Services, Inc., a wholly-owned subsidiary of OFI (the “Sub-Transfer Agent”), to provide the day-to-day transfer agent and shareholder servicing of the Fund. Under the Sub-Transfer Agency Agreement, the Transfer Agent pays the Sub-Transfer Agent an annual fee in monthly installments, equal to a percentage of the transfer agent fee collected by the Transfer Agent from the Fund, which shall be calculated after any applicable fee waivers. The fee paid to the Sub-Transfer Agent is paid by the Transfer Agent, not by the Fund.
Trustees’ Compensation. The Fund has adopted an unfunded retirement plan (the “Plan”) for the Fund’s Independent Trustees. Benefits are based on years of service and fees paid to each Trustee during their period of service. The Plan was frozen with respect to adding new participants effective December 31, 2006 (the “Freeze Date”) and existing Plan Participants as of the Freeze Date will continue to receive accrued benefits under the Plan. Active Independent Trustees as of the Freeze Date have each elected a distribution method with respect to their benefits under the Plan. During the reporting period, the Fund’s projected
42 OPPENHEIMER DIVIDEND OPPORTUNITY FUND
9. Fees and Other Transactions with Affiliates (Continued)
benefit obligations, payments to retired Trustees and accumulated liability were as follows:
| | | | |
| Projected Benefit Obligations Increased | | $ | — | |
| Payments Made to Retired Trustees | | | 1,789 | |
| Accumulated Liability as of April 30, 2017 | | | 12,928 | |
The Fund’s Board of Trustees (“Board”) has adopted a compensation deferral plan for Independent Trustees that enables Trustees to elect to defer receipt of all or a portion of the annual compensation they are entitled to receive from the Fund. For purposes of determining the amount owed to the Trustee under the plan, deferred amounts are treated as though equal dollar amounts had been invested in shares of the Fund or in other Oppenheimer funds selected by the Trustee. The Fund purchases shares of the funds selected for deferral by the Trustee in amounts equal to his or her deemed investment, resulting in a Fund asset equal to the deferred compensation liability. Such assets are included as a component of “Other” within the asset section of the Statement of Assets and Liabilities. Deferral of Trustees’ fees under the plan will not affect the net assets of the Fund and will not materially affect the Fund’s assets, liabilities or net investment income per share. Amounts will be deferred until distributed in accordance with the compensation deferral plan.
Distribution and Service Plan (12b-1) Fees. Under its General Distributor’s Agreement with the Fund, OppenheimerFunds Distributor, Inc. (the “Distributor”) acts as the Fund’s principal underwriter in the continuous public offering of the Fund’s classes of shares.
Service Plan for Class A Shares. The Fund has adopted a Service Plan (the “Plan”) for Class A shares pursuant to Rule 12b-1 under the 1940 Act. Under the Plan, the Fund reimburses the Distributor for a portion of its costs incurred for services provided to accounts that hold Class A shares. Reimbursement is made periodically at an annual rate of up to 0.25% of the daily net assets of Class A shares of the Fund. The Distributor currently uses all of those fees to pay dealers, brokers, banks and other financial institutions periodically for providing personal service and maintenance of accounts of their customers that hold Class A shares. Any unreimbursed expenses the Distributor incurs with respect to Class A shares in any fiscal year cannot be recovered in subsequent periods. Fees incurred by the Fund under the Plan are detailed in the Statement of Operations.
Distribution and Service Plans for Class B, Class C and Class R Shares. The Fund has adopted Distribution and Service Plans (the “Plans”) for Class B, Class C and Class R shares pursuant to Rule 12b-1 under the 1940 Act to compensate the Distributor for distributing those share classes, maintaining accounts and providing shareholder services. Under the Plans, the Fund pays the Distributor an annual asset-based sales charge of 0.75% on Class B and Class C shares’ daily net assets and 0.25% on Class R shares’ daily net assets. The Fund also pays a service fee under the Plans at an annual rate of 0.25% of daily net assets. The Plans continue in effect from year to year only if the Fund’s Board of Trustees votes annually to approve their continuance at an in person meeting called for that purpose. Fees incurred by
43 OPPENHEIMER DIVIDEND OPPORTUNITY FUND
NOTES TO FINANCIAL STATEMENTS Continued
9. Fees and Other Transactions with Affiliates (Continued)
the Fund under the Plans are detailed in the Statement of Operations.
Sales Charges. Front-end sales charges and CDSC do not represent expenses of the Fund. They are deducted from the proceeds of sales of Fund shares prior to investment or from redemption proceeds prior to remittance, as applicable. The sales charges retained by the Distributor from the sale of shares and the CDSC retained by the Distributor on the redemption of shares is shown in the following table for the period indicated.
| | | | | | | | | | | | | | | | | | | | |
| Year Ended | | Class A
Front-End
Sales Charges
Retained by
Distributor | | | Class A
Contingent
Deferred
Sales Charges
Retained by
Distributor | | | Class B
Contingent
Deferred
Sales Charges
Retained by
Distributor | | | Class C
Contingent
Deferred
Sales Charges
Retained by
Distributor | | | Class R
Contingent
Deferred
Sales Charges
Retained by
Distributor | |
| |
| April 30, 2017 | | | $127,944 | | | | $7,336 | | | | $2,907 | | | | $5,406 | | | | $— | |
Waivers and Reimbursements of Expenses. The Manager will waive fees and/or reimburse Fund expenses in an amount equal to the indirect management fees incurred through the Fund’s investment in IGMMF. During the reporting period, the Manager waived fees and/or reimbursed the Fund $8,977 for IGMMF management fees. This fee waiver and/or expense reimbursement may not be amended or withdrawn for one year from the date of the Fund’s prospectus, unless approved by the Board.
Effective January 1, 2017, the Transfer Agent has voluntarily agreed to waive fees and/or reimburse Fund expenses in an amount equal to 0.015% of average annual net assets for Classes A, B, C, R and Y.
During the reporting period, the Transfer Agent waived fees and/or reimbursed the Fund for transfer agent and shareholder servicing agent fees as follows:
| | | | |
| Class A | | $ | 8,980 | |
| Class B | | | 77 | |
| Class C | | | 2,557 | |
| Class R | | | 640 | |
| Class Y | | | 501 | |
This fee waiver and/or reimbursement may be terminated at any time.
10. Borrowings and Other Financing
Joint Credit Facility. A number of mutual funds managed by the Manager participate in a $1.3 billion revolving credit facility (the “Facility”) intended to provide short-term financing, if necessary, subject to certain restrictions in connection with atypical redemption activity. Expenses and fees related to the Facility are paid by the participating funds and are disclosed separately or as other expenses on the Statement of Operations. The Fund did not utilize the Facility during the reporting period.
44 OPPENHEIMER DIVIDEND OPPORTUNITY FUND
REPORT OF INDEPENDENT REGISTERED PUBLIC ACCOUNTING FIRM
The Board of Trustees and Shareholders of Oppenheimer Dividend Opportunity Fund:
We have audited the accompanying statement of assets and liabilities of Oppenheimer Dividend Opportunity Fund, including the statement of investments, as of April 30, 2017, and the related statement of operations for the year then ended, the statements of changes in net assets for each of the years in the two-year period then ended, and the financial highlights for each of the years or periods in the five-year period then ended. These financial statements and financial highlights are the responsibility of the Fund’s management. Our responsibility is to express an opinion on these financial statements and financial highlights based on our audits.
We conducted our audits in accordance with the standards of the Public Company Accounting Oversight Board (United States). Those standards require that we plan and perform the audit to obtain reasonable assurance about whether the financial statements and financial highlights are free of material misstatement. An audit includes examining, on a test basis, evidence supporting the amounts and disclosures in the financial statements. Our procedures included confirmation of securities owned as of April 30, 2017, by correspondence with the custodian, transfer agent and brokers, or by other appropriate auditing procedures where replies from brokers were not received. An audit also includes assessing the accounting principles used and significant estimates made by management, as well as evaluating the overall financial statement presentation. We believe that our audits provide a reasonable basis for our opinion.
In our opinion, the financial statements and financial highlights referred to above present fairly, in all material respects, the financial position of Oppenheimer Dividend Opportunity Fund as of April 30, 2017, the results of its operations for the year then ended, the changes in its net assets for each of the years in the two-year period then ended, and the financial highlights for each of the years or periods in the five-year period then ended, in conformity with U.S. generally accepted accounting principles.
KPMG LLP
Denver, Colorado
June 27, 2017
45 OPPENHEIMER DIVIDEND OPPORTUNITY FUND
FEDERAL INCOME TAX INFORMATION Unaudited
In early 2017, if applicable, shareholders of record received information regarding all dividends and distributions paid to them by the Fund during calendar year 2016.
Dividends, if any, paid by the Fund during the reporting period which are not designated as capital gain distributions should be multiplied by the maximum amount allowable but not less than 79.86% to arrive at the amount eligible for the corporate dividend-received deduction.
A portion, if any, of the dividends paid by the Fund during the reporting period which are not designated as capital gain distributions are eligible for lower individual income tax rates to the extent that the Fund has received qualified dividend income as stipulated by recent tax legislation. The maximum amount allowable but not less than $8,544,240 of the Fund’s fiscal year taxable income may be eligible for the lower individual income tax rates. In early 2017, shareholders of record received information regarding the percentage of distributions that are eligible for lower individual income tax rates.
Recent tax legislation allows a regulated investment company to designate distributions not designated as capital gain distributions, as either interest related dividends or short-term capital gain dividends, both of which are exempt from the U.S. withholding tax applicable to non U.S. taxpayers. For the reporting period, the maximum amount allowable but not less than $25,071 of the ordinary distributions to be paid by the Fund qualifies as an interest related dividend.
The foregoing information is presented to assist shareholders in reporting distributions received from the Fund to the Internal Revenue Service. Because of the complexity of the federal regulations which may affect your individual tax return and the many variations in state and local tax regulations, we recommend that you consult your tax advisor for specific guidance.
46 OPPENHEIMER DIVIDEND OPPORTUNITY FUND
PORTFOLIO PROXY VOTING POLICIES AND GUIDELINES;
UPDATES TO STATEMENTS OF INVESTMENTS Unaudited
The Fund has adopted Portfolio Proxy Voting Policies and Guidelines under which the Fund votes proxies relating to securities (“portfolio proxies”) held by the Fund. A description of the Fund’s Portfolio Proxy Voting Policies and Guidelines is available (i) without charge, upon request, by calling the Fund toll-free at 1.800. CALL OPP (225.5677), (ii) on the Fund’s website at www.oppenheimerfunds.com, and (iii) on the SEC’s website at www.sec.gov. In addition, the Fund is required to file Form N-PX, with its complete proxy voting record for the 12 months ended June 30th, no later than August 31st of each year. The Fund’s voting record is available (i) without charge, upon request, by calling the Fund toll-free at 1.800. CALL OPP (225.5677), and (ii) in the Form N-PX filing on the SEC’s website at www.sec.gov.
The Fund files its complete schedule of portfolio holdings with the SEC for the first quarter and the third quarter of each fiscal year on Form N-Q. The Fund’s Form N-Q filings are available on the SEC’s website at www.sec.gov. Those forms may be reviewed and copied at the SEC’s Public Reference Room in Washington, D.C. Information on the operation of the Public Reference Room may be obtained by calling 1-800-SEC-0330.
Householding—Delivery of Shareholder Documents
This is to inform you about OppenheimerFunds’ “householding” policy. If more than one member of your household maintains an account in a particular fund, OppenheimerFunds will mail only one copy of the fund’s prospectus (or, if available, the fund’s summary prospectus), annual and semiannual report and privacy policy. The consolidation of these mailings, called householding, benefits your fund through reduced mailing expense, and benefits you by reducing the volume of mail you receive from OppenheimerFunds. Householding does not affect the delivery of your account statements.
Please note that we will continue to household these mailings for as long as you remain an OppenheimerFunds shareholder, unless you request otherwise. If you prefer to receive multiple copies of these materials, please call us at 1.800. CALL-OPP (225-5677). You may also notify us in writing or via email. We will begin sending you individual copies of the prospectus (or, if available, the summary prospectus), reports and privacy policy within 30 days of receiving your request to stop householding.
47 OPPENHEIMER DIVIDEND OPPORTUNITY FUND
DISTRIBUTION SOURCES Unaudited
For any distribution that took place over the last six months of Fund’s reporting period, the table below details on a per-share basis the percentage of the Fund’s total distribution payment amount that was derived from the following sources: net income, net profit from the sale of securities, and other capital sources. Other capital sources represent a return of capital. A return of capital may occur, for example, when some or all of the money that you invested in the Fund is paid back to you. A return of capital distribution does not necessarily reflect the Fund’s investment performance and should not be confused with “yield” or “income.” You should not draw any conclusions about each Fund’s investment performance from the amounts of these distributions. This information is based upon income and capital gains using generally accepted accounting principles as of the date of each distribution. For certain securities, such as Real Estate Investment Trusts (“REITs”) and Master Limited Partnerships (“MLPs”), the percentages attributed to each category (net income, net profit from sale and other capital sources) are estimated using historical information because the character of the amounts received from the REITs and MLPs in which the fund invests is unknown until after the end of the calendar year. Because the Fund is actively managed, the relative amount of the Fund’s total distributions derived from various sources over the calendar year may change. Please note that this information should not be used for tax reporting purposes as the tax character of distributable income may differ from the amounts used for this notification. You will receive IRS tax forms in the first quarter of each calendar year detailing the actual amount of the taxable and non-taxable portion of distributions paid to you during the tax year.
For the most current information, please go to oppenheimerfunds.com. Select your Fund, then the ’Detailed’ tab; where ‘Dividends’ are shown, the Fund’s latest pay date will be followed by the sources of any distribution, updated daily.
| | | | | | | | | | | | | | | | |
Fund Name | | Pay
Date | | | Net Income | | | Net Profit
from Sale | | | Other
Capital
Sources | |
Oppenheimer Dividend Opportunity Fund | | | 12/1/16 | | | | 73.8% | | | | 18.3% | | | | 7.9% | |
Oppenheimer Dividend Opportunity Fund | | | 3/21/17 | | | | 74.5% | | �� | | 13.4% | | | | 12.1% | |
48 OPPENHEIMER DIVIDEND OPPORTUNITY FUND
TRUSTEES AND OFFICERS Unaudited
| | |
Name, Position(s) Held with the Fund, Length of Service, Year of Birth | | Principal Occupation(s) During the Past 5 Years; Other Trusteeships/ Directorships Held; Number of Portfolios in the Fund Complex Currently Overseen |
| |
| INDEPENDENT TRUSTEES | | The address of each Trustee in the chart below is 6803 S. Tucson Way, Centennial, Colorado 80112-3924. Each Trustee serves for an indefinite term, or until his or her resignation, retirement, death or removal. |
| |
Brian F. Wruble, Chairman of the Board of Trustees (since 2007) and Trustee (since 2005) Year of Birth: 1943 | | Governor of Community Foundation of the Florida Keys (non-profit) (since July 2012); Director of TCP Capital, Inc. (since November 2015); Chairman Emeritus and Trustee (since August 2011) of The Jackson Laboratory (non-profit); Member of Zurich Insurance Group’s Investment Management Advisory Council (insurance) (October 2004-February 2017); Treasurer (since 2007) and Trustee of the Institute for Advanced Study (non-profit educational institute) (since May 1992); Director of Special Value Opportunities Fund, LLC (registered investment company) (affiliate of the Sub-Adviser’s parent company) (September 2004-June 2015); General Partner of Odyssey Partners, L.P. (hedge fund) (September 1995-December 2007); Special Limited Partner of Odyssey Investment Partners, LLC (private equity investment) (January 1999-September 2004). Oversees 57 portfolios in the OppenheimerFunds complex. Mr. Wruble has served on the Boards of certain Oppenheimer funds since April 2001, during which time he has become familiar with the Fund’s (and other Oppenheimer funds’) financial, accounting, regulatory and investment matters and has contributed to the Boards’ deliberations. |
| |
Beth Ann Brown, Trustee (since 2016) Year of Birth: 1968 | | Advisor, Board of Advisors of Caron Engineering Inc. (since December 2014); Independent Consultant (since September 2012); held the following positions at Columbia Management Investment Advisers LLC: Head of Intermediary Distribution (2008-2012), Managing Director, Strategic Relations (2005-2008), Managing Director, Head of National Accounts (2004-2005); Senior Vice President, National Account Manager (2002-2004), Senior Vice President, Key Account Manager (1999-2002) and Vice President, Key Account Manager (1996-1999) of Liberty Funds Distributor, Inc.; President and Director, of Acton Shapleigh Youth Conservation Corps (non -profit) (2012-2015); and Vice President and Director of Grahamtastic Connection (non -profit) (since May 2013). Oversees 57 portfolios in the OppenheimerFunds complex. Ms. Brown has served on the Boards of certain Oppenheimer funds since January 2016, during which time she has become familiar with the Fund’s (and other Oppenheimer funds’) financial, accounting, regulatory and investment matters and has contributed to the Boards’ deliberations. |
| |
Edmund P. Giambastiani, Jr., Trustee (since 2013) Year of Birth: 1948 | | Advisory Board Member of the Maxwell School of Citizenship and Public Affairs of Syracuse University (since April 2012); Director of Mercury Defense Systems Inc. (information technology) (August 2011-February 2013); Trustee of the U.S. Naval Academy Foundation Athletic & Scholarship Program (since November 2010); Advisory Board Member of the Massachusetts Institute of Technology Lincoln Laboratory (federally-funded research development center) (since May 2010); Director of The Boeing Company (aerospace and defense) (since October 2009); Trustee of MITRE Corporation (federally-funded research development center) (since September 2008); Independent Director of QinetiQ Group Plc (defense technology and security) (February 2008-August 2011); Chairman of Monster Worldwide, Inc. (on-line career services) (March 2015-November 2016), Director of Monster Worldwide, Inc. (on-line career services) (February 2008-June 2011); Lead Director (June 2011-March 2015); Chairman of Alenia North America, Inc. (military and defense products) (January 2008-October 2009); Director of SRA International, Inc. (information technology and services) (January 2008-July 2011); President of |
49 OPPENHEIMER DIVIDEND OPPORTUNITY FUND
TRUSTEES AND OFFICERS Unaudited / Continued
| | |
| |
Edmund P. Giambastiani, Jr., (Continued) | | Giambastiani Group LLC (national security and energy consulting) (since October 2007); United States Navy, career nuclear submarine officer (June 1970-October 2007), Vice Chairman of the Joint Chiefs of Staff (2005-October 2007), Supreme Allied Commander of NATO Commander Transformation (2003-2005), Commander, U.S. Joint Forces Command (2002-2005). Since his retirement from the U.S. Navy in October 2007, Admiral Giambastiani has also served on numerous U.S. Government advisory boards, investigations and task forces for the Secretaries of Defense, State and Interior and the Central Intelligence Agency. He recently completed serving as a federal commissioner on the Military Compensation and Retirement Modernization Commission. Oversees 57 portfolios in the OppenheimerFunds complex. Admiral Giambastiani has served on the Boards of certain Oppenheimer funds since February 2013, during which time he has become familiar with the Fund’s (and other Oppenheimer funds’) financial, accounting, regulatory and investment matters and has contributed to the Boards’ deliberations. For purposes of this report, Admiral Giambastiani is identified as a Trustee. |
| |
Elizabeth Krentzman, Trustee (since 2014) Year of Birth: 1959 | | Director of Cartica Management, LLC Funds (private investment funds) (since 2017); Trustee of University of Florida Law Center Association, Inc. (since 2016); Member of University of Florida Law Advisory Board, Washington, DC Alumni Group (since 2015); Advisory Board Member of the Securities and Exchange Commission Historical Society (since 2007); held the following positions at Deloitte & Touche LLP: Principal and Chief Regulatory Advisor for Asset Management Services (2007 - 2014) and U.S. Mutual Fund Leader (2011 - 2014); General Counsel of the Investment Company Institute (trade association) (June 2004 - April 2007); held the following positions at Deloitte & Touche LLP: National Director of the Investment Management Regulatory Consulting Practice (1997 - 2004), Principal (2003 - 2004), Director (1998 - 2003) and Senior Manager (1997 - 1998); Assistant Director of the Division of Investment Management - Office of Disclosure and Investment Adviser Regulation of the U.S. Securities and Exchange Commission (1996 - 1997) and various positions with the Division of Investment Management – Office of Regulatory Policy (1991 - 1996) of the U.S. Securities and Exchange Commission; Associate at Ropes & Gray LLP (1987 – 1991). Oversees 57 portfolios in the OppenheimerFunds complex. Ms. Krentzman has served on the Boards of certain Oppenheimer funds since August 2014, during which time she has become familiar with the Fund’s (and other Oppenheimer funds’) financial, accounting, regulatory and investment matters and has contributed to the Boards’ deliberations. |
| |
Mary F. Miller, Trustee (since 2005) Year of Birth: 1942 | | Trustee of International House (not-for-profit) (since June 2007); Trustee of the American Symphony Orchestra (not-for-profit) (October 1998-November 2011); and Senior Vice President and General Auditor of American Express Company (financial services company) (July 1998-February 2003). Oversees 57 portfolios in the OppenheimerFunds complex. Ms. Miller has served on the Boards of certain Oppenheimer funds since August 2004, during which time she has become familiar with the Fund’s (and other Oppenheimer funds’) financial, accounting, regulatory and investment matters and has contributed to the Boards’ deliberations. |
50 OPPENHEIMER DIVIDEND OPPORTUNITY FUND
| | |
| |
Joel W. Motley, Trustee (since 2005) Year of Birth: 1952 | | Director of Office of Finance Federal Home Loan Bank (since September 2016); Director of Greenwall Foundation (since October 2013); Member of Board and Investment Committee of The Greenwall Foundation (since April 2013); Member of the Vestry of Trinity Wall Street (since April 2012); Director of Southern Africa Legal Services Foundation (since March 2012); Board Member of Pulitzer Center for Crisis Reporting (non-profit journalism) (since March 2011); Managing Director of Public Capital Advisors, LLC (privately-held financial advisor) (since January 2006); Managing Director of Carmona Motley, Inc. (privately-held financial advisor) (since January 2002); Director of Columbia Equity Financial Corp. (privately-held financial advisor) (2002-2007); Managing Director of Carmona Motley Hoffman Inc. (privately-held financial advisor) (January 1998-December 2001); Member of the Finance and Budget Committee of the Council on Foreign Relations, Member of the Investment Committee and Board of Human Rights Watch (since July 2000) and Member of the Investment Committee and Board of Historic Hudson Valley (since February 2010). Oversees 57 portfolios in the OppenheimerFunds complex. Mr. Motley has served on the Boards of certain Oppenheimer funds since October 2002, during which time he has become familiar with the Fund’s (and other Oppenheimer funds’) financial, accounting, regulatory and investment matters and has contributed to the Boards’ deliberations. |
| |
Joanne Pace, Trustee (since 2012) Year of Birth: 1958 | | Advisory Board Director of Massey Quick and Company, LLC (since October 2014); Board Director of Horizon Blue Cross Blue Shield of New Jersey (since November 2012); Advisory Board Director of The Alberleen Group LLC (since March, 2012); Board Member (since January 2015), Board Member of 100 Women in Hedge Funds (non-profit) (since January 2015); Advisory Council Member of Morgan Stanley Children’s Hospital (non-profit) (since May, 2012); Senior Advisor of SECOR Asset Management, LP (2010-2011); Managing Director and Chief Operating Officer of Morgan Stanley Investment Management (2006-2010); Partner and Chief Operating Officer of FrontPoint Partners, LLC (hedge fund) (2005-2006); held the following positions at Credit Suisse: Managing Director (2003-2005); Global Head of Human Resources and member of Executive Board and Operating Committee (2004-2005), Global Head of Operations and Product Control (2003- 2004); held the following positions at Morgan Stanley: Managing Director (1997- 2003), Controller and Principal Accounting Officer (1999-2003); Chief Financial Officer (temporary assignment) for the Oversight Committee, Long Term Capital Management (1998-1999). Lead Independent Director and Chair of the Audit and Nominating Committee of The Global Chartist Fund, LLC of Oppenheimer Asset Management (2011-2012); Board Director of Managed Funds Association (2008- 2010); Board Director of Morgan Stanley Foundation (2007-2010) and Investment Committee Chair (2008-2010). Oversees 57 portfolios in the OppenheimerFunds complex. Ms. Pace has served on the Boards of certain Oppenheimer funds since November 2012, including as an Advisory Board Member for certain Oppenheimer funds, during which time she has become familiar with the Fund’s (and other Oppenheimer funds’) financial, accounting, regulatory and investment matters and has contributed to the Board’s deliberations. For purposes of this report, Ms. Pace is identified as a Trustee. |
51 OPPENHEIMER DIVIDEND OPPORTUNITY FUND
TRUSTEES AND OFFICERS Unaudited / Continued
| | |
| |
Daniel Vandivort, Trustee (since 2014) Year of Birth: 1954 | | Treasurer, Chairman of the Audit and Finance Committee (since January 2016); Chairman and Lead Independent Director/Trustee (March 2010-September 2014), Chairman of the Audit Committee (March 2009-September 2014) and Director/ Trustee (December 2008-September 2014) of the Board of Directors/Trustees of Value Line Funds; Trustee, Board of Trustees of Huntington Disease Foundation of America (since January 2015 and June 2007-December 2013); Trustee, Board of Trustees, RIM Retirement Savings Plan (2005-2007); President and Chief Investment Officer, Robeco Investment Management, formerly known as Weiss Peck and Greer (January 2005-June 2007); Member, Management Committee of Robeco Investment Management (2001-2007); Chairman and Trustee of the Board of Trustees of Weiss, Peck and Greer Funds (2004-2005); Managing Director and Head of Fixed Income, Weiss, Peck and Greer (November 1994-January 2005); Managing Director and Head of Fixed Income, CS First Boston Investment Management (January 1992-November 1994); Director, Global Product Development, First Boston Asset Management (November 1989 to January 1992); Vice President, Fixed Income Sales, First Boston Corp. (May 1984-November 1989). Oversees 57 portfolios in the OppenheimerFunds complex. Mr. Vandivort has served on the Boards of certain Oppenheimer funds since 2014, during which time he has become familiar with the Fund’s (and other Oppenheimer funds’) financial, accounting, regulatory and investment matters and has contributed to the Boards’ deliberations. |
| INTERESTED TRUSTEE AND OFFICER | | Mr. Steinmetz is an “Interested Trustee” because he is affiliated with the Manager and the Sub-Adviser by virtue of his positions as Chairman of the Sub-Adviser and officer and director of the Manager. Both as a Trustee and as an officer, Mr. Steinmetz serves for an indefinite term, or until his resignation, retirement, death or removal. Mr. Steinmetz’s address is 225 Liberty Street, New York, New York 10281-1008. |
| |
Arthur P. Steinmetz, Trustee (since 2015), President and Principal Executive Officer (since 2014) Year of Birth: 1958 | | Chairman of the Sub-Adviser (since January 2015); CEO and Chairman of the Manager (since July 2014), President of the Manager (since May 2013), a Director of the Manager (since January 2013), Director of the Sub-Adviser (since July 2014), President, Management Director and CEO of Oppenheimer Acquisition Corp. (the Sub-Adviser’s parent holding company) (since July 2014), and President and Director of OFI SteelPath, Inc. (since January 2013). Chief Investment Officer of the OppenheimerFunds advisory entities from (January 2013- December 2013); Executive Vice President of the Manager (January 2013-May 2013); Chief Investment Officer of the Sub-Adviser (October 2010-December 2012); Chief Investment Officer, Fixed-Income, of the Sub-Adviser (April 2009-October 2010); Executive Vice President of the Sub-Adviser (October 2009-December 2012); Director of Fixed Income of the Sub-Adviser (January 2009-April 2009); and a Senior Vice President of the Sub-Adviser (March 1993-September 2009). An officer of 99 portfolios in the OppenheimerFunds complex. |
| OTHER OFFICERS OF THE FUND | | The addresses of the Officers in the chart below are as follows: for Mss. Lo Bessette, Foxson and Picciotto, 225 Liberty Street, New York, New York 10281-1008, for Messrs. Spahr and Petersen, 6803 S. Tucson Way, Centennial, Colorado 80112-3924. Each Officer serves for an indefinite term or until his or her resignation, retirement, death or removal. |
| |
Laton Spahr, Vice President (since 2013) Year of Birth: 1975 | | Senior Vice President of the Sub-Adviser since March 2013. Senior portfolio manager (2003-2013) and equity analyst (2001-2002) for Columbia Management Investment Advisers, LLC. A portfolio manager and an officer of other portfolios in the OppenheimerFunds complex. |
52 OPPENHEIMER DIVIDEND OPPORTUNITY FUND
| | |
| |
Cynthia Lo Bessette, Secretary and Chief Legal Officer (since 2016) Year of Birth: 1969 | | Senior Vice President and Deputy General Counsel (March 2015 to February 2016) and Executive Vice President, General Counsel and Secretary of the Manager (since February 2016); Chief Legal Officer of the Sub-Adviser and the Distributor (since February 2016); Vice President, General Counsel and Secretary of Oppenheimer Acquisition Corp. (since February 2016); General Counsel of OFI SteelPath, Inc., VTL Associates, LLC and Index Management Solutions, LLC (since February 2016); Chief Legal Officer of OFI Global Institutional, Inc., HarbourView Asset Management Corporation, OFI Global Trust Company, Oppenheimer Real Asset Management, Inc., OFI Private Investments Inc., Shareholder Services, Inc. and Trinity Investment Management Corporation (since February 2016); Vice President, Corporate Counsel (February 2012 – March 2015) and Deputy Chief Legal Officer (April 2013 – March 2015) of Jennison Associates LLC; Assistant General Counsel (April 2008 – September 2009) and Deputy General Counsel (October 2009 – February 2012) of Lord Abbett & Co. LLC. An officer of 99 portfolios in the OppenheimerFunds complex. |
| |
Jennifer Foxson, Vice President and Chief Business Officer (since 2014) Year of Birth: 1969 | | Senior Vice President of OppenheimerFunds Distributor, Inc. (since June 2014); Vice President of OppenheimerFunds Distributor, Inc. (April 2006-June 2014); Vice President of the Sub-Adviser (January 1998-March 2006); Assistant Vice President of the Sub-Adviser (October 1991-December 1998). An officer of 99 portfolios in the OppenheimerFunds complex. |
| |
Mary Ann Picciotto, Chief Compliance Officer and Chief Anti-Money Laundering Officer (since 2014) Year of Birth: 1973 | | Senior Vice President and Chief Compliance Officer of the Manager (since March 2014); Chief Compliance Officer of the Sub-Adviser, OFI SteelPath, Inc., OFI Global Trust Company, OFI Global Institutional, Inc., Oppenheimer Real Asset Management, Inc., OFI Private Investments, Inc., Harborview Asset Management Corporation, Trinity Investment Management Corporation, and Shareholder Services, Inc. (since March 2014); Managing Director of Morgan Stanley Investment Management Inc. and certain of its various affiliated entities; Chief Compliance Officer of various Morgan Stanley Funds (May 2010-January 2014); Chief Compliance Officer of Morgan Stanley Investment Management Inc. (April 2007-January 2014). An officer of 99 portfolios in the OppenheimerFunds complex. |
| |
Brian S. Petersen, Treasurer and Principal Financial & Accounting Officer (since 2016) Year of Birth: 1970 | | Senior Vice President of the Manager (since January 2017); Vice President of the Manager (January 2013-January 2017); Vice President of Sub-Adviser (February 2007-December 2012); Assistant Vice President of Sub-Adviser (August 2002- 2007). An officer of 99 portfolios in the OppenheimerFunds complex. |
The Fund’s Statement of Additional Information contains additional information about the Fund’s Trustees and Officers is available without charge upon request, by calling 1.800. CALL OPP (225.5677).
53 OPPENHEIMER DIVIDEND OPPORTUNITY FUND
OPPENHEIMER DIVIDEND OPPORTUNITY FUND
| | |
| Manager | | OFI Global Asset Management, Inc. |
| |
| Sub-Adviser | | OppenheimerFunds, Inc. |
| |
| Distributor | | OppenheimerFunds Distributor, Inc. |
| |
Transfer and Shareholder Servicing Agent | | OFI Global Asset Management, Inc. |
| |
| Sub-Transfer Agent | | Shareholder Services, Inc. DBA OppenheimerFunds Services |
| |
Independent Registered Public Accounting Firm | | KPMG LLP |
| |
| Legal Counsel | | Kramer Levin Naftalis & Frankel LLP |
© 2017 OppenheimerFunds, Inc. All rights reserved.
54 OPPENHEIMER DIVIDEND OPPORTUNITY FUND
PRIVACY POLICY NOTICE
As an Oppenheimer fund shareholder, you are entitled to know how we protect your personal information and how we limit its disclosure.
Information Sources
We obtain nonpublic personal information about our shareholders from the following sources:
● Applications or other forms
● When you create a user ID and password for online account access
● When you enroll in eDocs Direct,SM our electronic document delivery service
● Your transactions with us, our affiliates or others
● Technologies on our website, including: “cookies” and web beacons, which are used to collect data on the pages you visit and the features you use.
If you visit oppenheimerfunds.com and do not log on to the secure account information areas, we do not obtain any personal information about you. When you do log on to a secure area, we do obtain your user ID and password to identify you. We also use this information to provide you with products and services you have requested, to inform you about products and services that you may be interested in and assist you in other ways.
We do not collect personal information through our website unless you willingly provide it to us, either directly by email or in those areas of the website that request information. In order to update your personal information (including your mailing address, email address and phone number) you must first log on and visit your user profile.
If you have set your browser to warn you before accepting cookies, you will receive the warning message with each cookie. You can refuse cookies by turning them off in your browser. However, doing so may limit your access to certain sections of our website.
We use cookies to help us improve and manage our website. For example, cookies help us recognize new versus repeat visitors to the site, track the pages visited, and enable some special features on the website. This data helps us provide a better service for our website visitors.
Protection of Information
We do not disclose any non-public personal information (such as names on a customer list) about current or former customers to anyone, except as permitted by law.
Disclosure of Information
Copies of confirmations, account statements and other documents reporting activity in your fund accounts are made available to your financial advisor (as designated by you). We may also use details about you and your investments to help us, our financial service affiliates, or firms that jointly market their financial products and services with ours, to better serve your investment needs or suggest educational material that may be of interest to you. If this requires us to provide you with an opportunity to “opt in” or “opt out” of such information sharing with a firm not affiliated with us, you will receive notification on how to do so, before any such sharing takes place.
Right of Refusal
We will not disclose your personal information to unaffiliated third parties (except as permitted by law), unless we first offer you a reasonable opportunity to refuse or “opt out” of such disclosure.
55 OPPENHEIMER DIVIDEND OPPORTUNITY FUND
PRIVACY POLICY NOTICE Continued
Internet Security and Encryption
In general, the email services provided by our website are encrypted and provide a secure and private means of communication with us. To protect your own privacy, confidential and/or personal information should only be communicated via email when you are advised that you are using a secure website. As a security measure, we do not include personal or account information in non-secure emails, and we advise you not to send such information to us in non-secure emails. Instead, you may take advantage of the secure features of our website to encrypt your email correspondence. To do this, you will need to use a browser that supports Secure Sockets Layer (SSL) protocol.
| ● | All transactions, including redemptions, exchanges and purchases, are secured by SSL and 256-bit encryption. SSL is used to establish a secure connection between your PC and OppenheimerFunds’ server. It transmits information in an encrypted and scrambled format. |
| ● | Encryption is achieved through an electronic scrambling technology that uses a “key” to code and then decode the data. Encryption acts like the cable converter box you may have on your television set. It scrambles data with a secret code so that no one can make sense of it while it is being transmitted. When the data reaches its destination, the same software unscrambles the data. |
| ● | You can exit the secure area by either closing your browser, or for added security, you can use the Log Out button before you close your browser. |
Other Security Measures
We maintain physical, electronic and procedural safeguards to protect your personal account information. Our employees and agents have access to that information only so that they may offer you products or provide services, for example, when responding to your account questions.
How You Can Help
You can also do your part to keep your account information private and to prevent unauthorized transactions. If you obtain a user ID and password for your account, safeguard that information. Also, take special precautions when accessing your account on a computer used by others.
Who We Are
This joint notice describes the privacy policies of the Oppenheimer funds, OppenheimerFunds, Inc., each of its investment adviser subsidiaries, OppenheimerFunds Distributor, Inc. and OFI Global Trust Co. It applies to all Oppenheimer fund accounts you presently have, or may open in the future, using your Social Security number—whether or not you remain a shareholder of our funds. This notice was last updated November 2016. In the event it is updated or changed, we will post an updated notice on our website at oppenheimerfunds.com. If you have any questions about this privacy policy, write to us at P.O. Box 5270, Denver, CO 80217-5270, email us by clicking on the Contact Us section of our website at oppenheimerfunds.com or call us at 1.800. CALL OPP (225.5677).
56 OPPENHEIMER DIVIDEND OPPORTUNITY FUND
THIS PAGE INTENTIONALLY LEFT BLANK.
57 OPPENHEIMER DIVIDEND OPPORTUNITY FUND
THIS PAGE INTENTIONALLY LEFT BLANK.
58 OPPENHEIMER DIVIDEND OPPORTUNITY FUND
THIS PAGE INTENTIONALLY LEFT BLANK.
59 OPPENHEIMER DIVIDEND OPPORTUNITY FUND
THIS PAGE INTENTIONALLY LEFT BLANK.
60 OPPENHEIMER DIVIDEND OPPORTUNITY FUND
THIS PAGE INTENTIONALLY LEFT BLANK.
61 OPPENHEIMER DIVIDEND OPPORTUNITY FUND
THIS PAGE INTENTIONALLY LEFT BLANK.
62 OPPENHEIMER DIVIDEND OPPORTUNITY FUND
THIS PAGE INTENTIONALLY LEFT BLANK.
63 OPPENHEIMER DIVIDEND OPPORTUNITY FUND
| | | | | | |
| | 
Visit us at oppenheimerfunds.com for 24-hr access to account information and transactions or call us at 800.CALL OPP (800.225.5677) for 24-hr automated information and automated transactions. Representatives also available Mon–Fri 8am-8pm ET. | | |
| | |
Visit Us oppenheimerfunds.com Call Us 800 225 5677 | | | | |
Follow Us 
| | Oppenheimer funds are distributed by OppenheimerFunds Distributor, Inc. 225 Liberty Street, New York, NY 10281-1008 © 2017 OppenheimerFunds Distributor, Inc. All rights reserved. RA0600.001.0417 June 23, 2017 | | |
| | | |
Item 2. Code of Ethics.
The registrant has adopted a code of ethics that applies to the registrant’s principal executive officer, principal financial officer, principal accounting officer or controller or persons performing similar functions.
Item 3. Audit Committee Financial Expert.
The Board of Trustees of the registrant has determined that Joanne Pace, the Board’s Audit Committee Chairwoman, is an audit committee financial expert and that Ms. Pace is “independent” for purposes of this Item 3.
Item 4. Principal Accountant Fees and Services.
(a) Audit Fees
The principal accountant for the audit of the registrant’s annual financial statements billed $27,000 in fiscal 2017 and $23,700 in fiscal 2016.
(b) Audit-Related Fees
The principal accountant for the audit of the registrant’s annual financial statements billed $7,000 in fiscal 2017 and $254 in fiscal 2016.
The principal accountant for the audit of the registrant’s annual financial statements billed $234,635 in fiscal 2017 and $508,990 in fiscal 2016 to the registrant’s investment adviser or any entity controlling, controlled by, or under common control with the adviser that provides ongoing services to the registrant.
Such services include: Internal control reviews, GIPS attestation procedures, and additional audit services
(c) Tax Fees
The principal accountant for the audit of the registrant’s annual financial statements billed no such fees in fiscal 2017 and no such fees in fiscal 2016.
The principal accountant for the audit of the registrant’s annual financial statements billed $689,805 in fiscal 2017 and $468,498 in fiscal 2016 to the registrant’s investment adviser or any entity controlling, controlled by, or under common control with the adviser that provides ongoing services to the registrant.
Such services include: tax compliance, tax planning and tax advice. Tax compliance generally involves preparation of original and amended tax returns, claims for a refund and tax payment-planning services. Tax planning and tax advice includes assistance with tax audits and appeals, tax advice related to mergers and acquisitions and requests for rulings or technical advice from taxing authorities.
(d) All Other Fees
The principal accountant for the audit of the registrant’s annual financial statements billed no such fees in fiscal 2017 and no such fees in fiscal 2016.
The principal accountant for the audit of the registrant’s annual financial statements billed no such fees in fiscal 2017 and no such fees in fiscal 2016 to the registrant’s investment adviser or any entity controlling, controlled by, or under common control with the adviser that provides ongoing services to the registrant.
Such fees would include the cost to the principal accountant of attending audit committee meetings and consultations regarding the registrant’s retirement plan with respect to its Trustees.
| (e) | (1) During its regularly scheduled periodic meetings, the registrant’s audit committee will pre-approve all audit, audit-related, tax and other services to be provided by the principal accountants of the registrant. |
The audit committee has delegated pre-approval authority to its Chairwoman for any subsequent new engagements that arise between regularly scheduled meeting dates provided that any fees such pre-approved are presented to the audit committee at its next regularly scheduled meeting.
Under applicable laws, pre-approval of non-audit services may be waived provided that: 1) the aggregate amount of all such services provided constitutes no more than five percent of the total amount of fees paid by the registrant to its principal accountant during the fiscal year in which services are provided 2) such services were not recognized by the registrant at the time of engagement as non-audit services and 3) such services are promptly brought to the attention of the audit committee of the registrant and approved prior to the completion of the audit.
(2) 0%
| (f) | Not applicable as less than 50%. |
| (g) | The principal accountant for the audit of the registrant’s annual financial statements billed $931,440 in fiscal 2017 and $977,742 in fiscal 2016 to the registrant and the registrant’s investment adviser or any entity controlling, controlled by, or under common control with the adviser that provides ongoing services to the registrant related to non-audit fees. Those billings did not include any prohibited non-audit services as defined by the Securities Exchange Act of 1934. |
| (h) | The registrant’s audit committee of the board of Trustees has considered whether the provision of non-audit services that were rendered to the registrant’s investment adviser, and any entity controlling, controlled by, or under common control with the investment adviser that provides ongoing services to the registrant that were not pre-approved pursuant to paragraph (c)(7)(ii) of Rule 2-01 of Regulation S-X is compatible with maintaining the principal accountant’s independence. No such services were rendered. |
Item 5. Audit Committee of Listed Registrants
Not applicable.
Item 6. Schedule of Investments.
a) Not applicable. The complete schedule of investments is included in Item 1 of this Form N-CSR.
b) Not applicable.
Item 7. Disclosure of Proxy Voting Policies and Procedures for Closed-End Management Investment Companies.
Not applicable.
Item 8. Portfolio Managers of Closed-End Management Investment Companies.
Not applicable.
Item 9. Purchases of Equity Securities by Closed-End Management Investment Company and Affiliated Purchasers.
Not applicable.
Item 10. Submission of Matters to a Vote of Security Holders.
The Fund’s Governance Committee Provisions with Respect to Nominations of Directors/Trustees to the Respective Boards
None
Item 11. Controls and Procedures.
Based on their evaluation of the registrant’s disclosure controls and procedures (as defined in rule 30a-3(c) under the Investment Company Act of 1940 (17 CFR 270.30a-3(c)) as of 4/30/2017, the registrant’s principal executive officer and principal financial officer found the registrant’s disclosure controls and procedures to provide reasonable assurances that information required to be disclosed by the registrant in the reports that it files under the Securities Exchange Act of 1934 (a) is accumulated and communicated to registrant’s management, including its principal executive officer and principal financial officer, to allow timely decisions regarding required disclosure, and (b) is recorded, processed, summarized and reported, within the time periods specified in the rules and forms adopted by the U.S. Securities and Exchange Commission.
There have been no changes in the registrant’s internal controls over financial reporting that occurred during the registrant’s second fiscal quarter of the period covered by this report that
have materially affected, or are reasonably likely to materially affect, the registrant’s internal control over financial reporting.
Item 12. Exhibits.
| (a) | (1) Exhibit attached hereto. |
(2) Exhibits attached hereto.
(3) Not applicable.
| (b) | Exhibit attached hereto. |
SIGNATURES
Pursuant to the requirements of the Securities Exchange Act of 1934 and the Investment Company Act of 1940, the registrant has duly caused this report to be signed on its behalf by the undersigned, thereunto duly authorized.
Oppenheimer Dividend Opportunity Fund
| | |
| By: | | /s/ Arthur P. Steinmetz |
| | Arthur P. Steinmetz |
| | Principal Executive Officer |
| Date: | | 6/16/2017 |
Pursuant to the requirements of the Securities Exchange Act of 1934 and the Investment Company Act of 1940, this report has been signed below by the following persons on behalf of the registrant and in the capacities and on the dates indicated.
| | |
| By: | | /s/ Arthur P. Steinmetz |
| | Arthur P. Steinmetz |
| | Principal Executive Officer |
| Date: | | 6/16/2017 |
| | |
| By: | | /s/ Brian S. Petersen |
| | Brian S. Petersen |
| | Principal Financial Officer |
| Date: | | 6/16/2017 |