Free signup for more
- Track your favorite companies
- Receive email alerts for new filings
- Personalized dashboard of news and more
- Access all data and search results
Filing tables
Filing exhibits
Related financial report
GKOS similar filings
- 20 May 24 Investor Presentation May 2024
- 1 May 24 Glaukos Announces First Quarter 2024 Financial Results
- 28 Feb 24 Investor Presentation February 2024
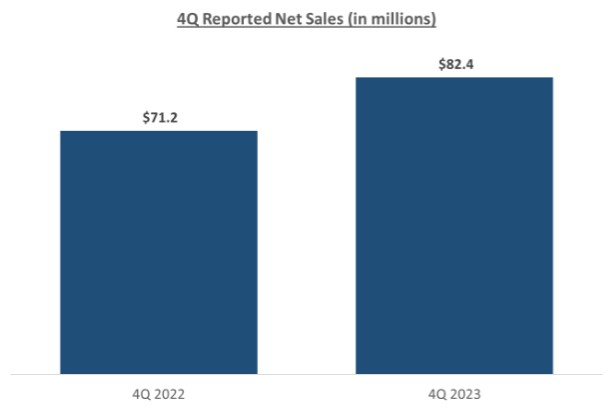
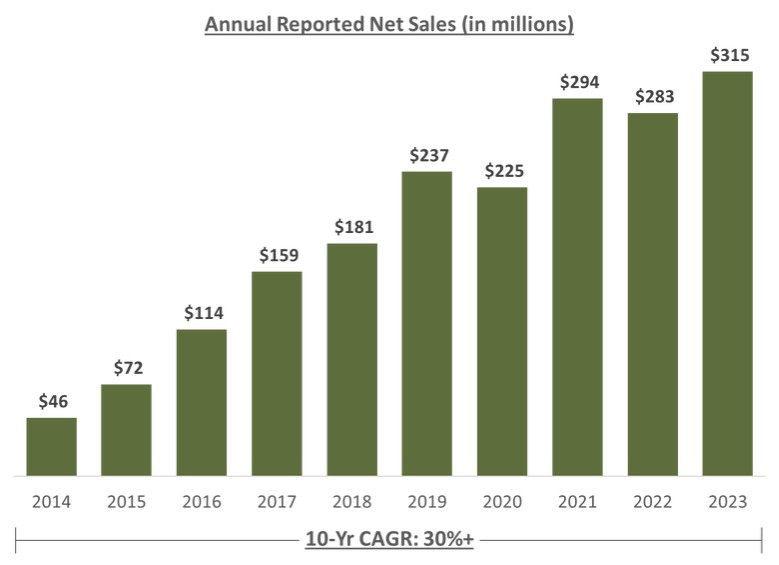
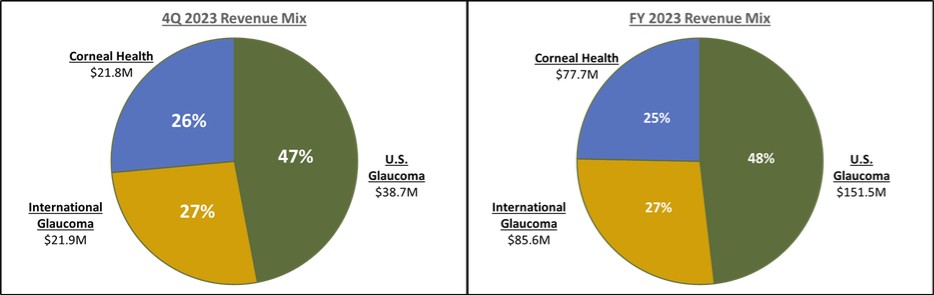
- 21 Feb 24 Glaukos Announces Fourth Quarter and Full Year 2023 Financial Results
- 9 Jan 24 Glaukos Announces Preliminary, Unaudited Fourth Quarter and Full Year 2023 Net Sales and Reaffirms 2024 Revenue Guidance
- 14 Dec 23 Revolutionary, micro-invasive, injectable treatment for the full range of glaucoma disease severity
- 1 Nov 23 Glaukos Announces Third Quarter 2023 Financial Results
Filing view
External links
 FEBRUARY 21, 2024