Exhibit 99.2

ABOUT THE COMPANY
TXU Corp., (NYSE: TXU) a Dallas-based energy company, manages a portfolio of competitive and regulated energy businesses in North America, primarily in Texas. With $9.3 billion in operating revenues in 2004, TXU ranks in the top half of the Fortune 500. TXU conducts its operations primarily through three core businesses.
TXU’s business model for competitive markets combines production, and retail and wholesale energy sales through its TXU Energy Holdings segment (TXU Energy Company LLC). The regulated electric delivery segment (TXU Electric Delivery Company), comprised of distribution and transmission assets, complements the competitive operations, delivering stable earnings and cash flow for TXU stakeholders. The electric delivery business uses its asset management skills developed over its hundred year history to provide reliable electric delivery to nearly 3 million points of delivery. It is the largest electric delivery business in the state and the sixth largest in the nation.
In its primary market of Texas, TXU’s portfolio includes over 18,300 megawatts of generation and additional contracted capacity with a fuel mix of nuclear, coal/lignite, natural gas/oil, and wind power. TXU Energy serves more than 2.4 million competitive electric customers in Texas where it is the leading energy retailer.
THIS SUMMARY
The consolidated financial data and statistics in this summary reflect the financial position and operating results of TXU through 2004.
This summary is only intended to provide limited supplemental operational and statistical information. Its contents do not constitute a complete set of financial statements prepared in accordance with generally accepted accounting principles. Accordingly, this summary is qualified in its entirety by reference to, and should be read in conjunction with, and not in lieu of, the companies’ reports, including financial statements and their accompanying notes, on file with the Securities and Exchange Commission.
Independent auditors have not audited all of the financial and operating statements. This summary has been prepared primarily for security analysts and investors in the hope that it will serve as a convenient and useful resource. The format of this summary may change in the future as we continue to try to meet the needs of our investors. The company does not undertake to update any of the information in this summary.
This summary is not intended for use in connection with any sale, offer to sell, or solicitation of any offer to buy any securities of TXU Corp. or its subsidiaries. Inquiries concerning this summary should be directed to Investor Relations:
Tim Hogan
214-812-4641
Bill Huber
214-812-2480
Steve Oakley
214-812-2220
| | |
CONTENTS | | Last Update: May 2005 |
| | |
Statements of Consolidated Income | | 2 |
Reconciliation of Operational Earnings to Reported Net Income | | 3 |
Statements of Consolidated Cash Flows | | 4 |
Consolidated Balance Sheets | | 6 |
Operating Statistics – TXU Electric Delivery | | 7 |
Operating Statistics – TXU Power | | 11 |
Operating Statistics – TXU Energy | | 19 |
ERCOT/Texas Market/Regulatory Highlights | | 25 |
Schedule of Long-Term Debt | | 30 |
Schedule of Preferred Securities | | 32 |
Common Stock Data and Credit Ratings | | 33 |
Liquidity and Capital Expenditures | | 34 |
Definitions | | 35 |
Investor Information | | 36 |
1
TXU CORP. AND SUBSIDIARIES
STATEMENTS OF CONSOLIDATED INCOME
| | | | | | | | | | | | |
| | | Year Ended December 31,
| |
| | | 2004
| | | 2003
| | | 2002
| |
| | | (millions of dollars,
except per share amounts) | |
Operating revenues | | $ | 9,308 | | | $ | 8,600 | | | $ | 8,094 | |
| | |
|
|
| |
|
|
| |
|
|
|
Costs and expenses: | | | | | | | | | | | | |
Cost of energy sold and delivery fees | | | 3,847 | | | | 3,640 | | | | 3,199 | |
Operating costs | | | 1,429 | | | | 1,389 | | | | 1,354 | |
Depreciation and amortization | | | 760 | | | | 724 | | | | 733 | |
Selling, general and administrative expenses | | | 1,091 | | | | 907 | | | | 1,046 | |
Franchise and revenue-based taxes | | | 367 | | | | 390 | | | | 428 | |
Other income | | | (148 | ) | | | (58 | ) | | | (41 | ) |
Other deductions | | | 1,172 | | | | 42 | | | | 533 | |
Interest income | | | (28 | ) | | | (36 | ) | | | (33 | ) |
Interest expense and related charges | | | 695 | | | | 784 | | | | 693 | |
| | |
|
|
| |
|
|
| |
|
|
|
Total costs and expenses | | | 9,185 | | | | 7,782 | | | | 7,912 | |
| | |
|
|
| |
|
|
| |
|
|
|
Income from continuing operations before income taxes, extraordinary gain (loss) and cumulative effect of changes in accounting principles | | | 123 | | | | 818 | | | | 182 | |
Income tax expense | | | 42 | | | | 252 | | | | 77 | |
| | |
|
|
| |
|
|
| |
|
|
|
Income from continuing operations before extraordinary gain (loss) and cumulative effect of changes in accounting principles | | | 81 | | | | 566 | | | | 105 | |
Income (loss) from discontinued operations, net of tax effect | | | 378 | | | | 74 | | | | (4,181 | ) |
Extraordinary gain (loss), net of tax effect | | | 16 | | | | — | | | | (134 | ) |
Cumulative effect of changes in accounting principles, net of tax effect | | | 10 | | | | (58 | ) | | | — | |
| | |
|
|
| |
|
|
| |
|
|
|
Net income (loss) | | | 485 | | | | 582 | | | | (4,210 | ) |
Exchangeable preferred membership interest buyback premium | | | 849 | | | | — | | | | — | |
Preference stock dividends | | | 22 | | | | 22 | | | | 22 | |
| | |
|
|
| |
|
|
| |
|
|
|
Net income (loss) available for common stock | | $ | (386 | ) | | $ | 560 | | | $ | (4,232 | ) |
| | |
|
|
| |
|
|
| |
|
|
|
Average shares of common stock outstanding (millions): | | | | | | | | | | | | |
Basic | | | 300 | | | | 322 | | | | 278 | |
Diluted | | | 300 | | | | 379 | | | | 278 | |
| | | |
Per share of common stock— Basic: | | | | | | | | | | | | |
Income from continuing operations before extraordinary gain (loss) and cumulative effect of changes in accounting principles | | $ | 0.27 | | | $ | 1.76 | | | $ | 0.37 | |
Exchangeable preferred membership interest buyback premium | | | (2.83 | ) | | | — | | | | — | |
Preference stock dividends | | | (0.07 | ) | | | (0.07 | ) | | | (0.08 | ) |
| | |
|
|
| |
|
|
| |
|
|
|
Net income (loss) from continuing operations available for common stock | | | (2.63 | ) | | | 1.69 | | | | 0.29 | |
Income (loss) from discontinued operations, net of tax effect | | | 1.26 | | | | 0.23 | | | | (15.04 | ) |
Extraordinary gain (loss), net of tax effect | | | 0.05 | | | | — | | | | (0.48 | ) |
Cumulative effect of changes in accounting principles, net of tax effect | | | 0.03 | | | | (0.18 | ) | | | — | |
| | |
|
|
| |
|
|
| |
|
|
|
Net income (loss) available for common stock | | $ | (1.29 | ) | | $ | 1.74 | | | $ | (15.23 | ) |
| | |
|
|
| |
|
|
| |
|
|
|
Per share of common stock— Diluted: | | | | | | | | | | | | |
Income from continuing operations before extraordinary gain (loss) and cumulative effect of changes in accounting principles | | $ | 0.27 | | | $ | 1.63 | | | $ | 0.37 | |
Exchangeable preferred membership interest buyback premium | | | (2.83 | ) | | | — | | | | — | |
Preference stock dividends | | | (0.07 | ) | | | (0.06 | ) | | | (0.08 | ) |
| | |
|
|
| |
|
|
| |
|
|
|
Net income (loss) from continuing operations available for common stock | | | (2.63 | ) | | | 1.57 | | | | 0.29 | |
Income (loss) from discontinued operations, net of tax effect | | | 1.26 | | | | 0.20 | | | | (15.04 | ) |
Extraordinary gain (loss), net of tax effect | | | 0.05 | | | | — | | | | (0.48 | ) |
Cumulative effect of changes in accounting principles, net of tax effect | | | 0.03 | | | | (0.15 | ) | | | — | |
| | |
|
|
| |
|
|
| |
|
|
|
Net income (loss) available for common stock | | $ | (1.29 | ) | | $ | 1.62 | | | $ | (15.23 | ) |
| | |
|
|
| |
|
|
| |
|
|
|
Dividends declared | | $ | 0.938 | | | $ | 0.50 | | | $ | 1.925 | |
2
TXU CORP. AND SUBSIDIARIES
RECONCILIATION OF OPERATIONAL EARNINGS TO REPORTED NET INCOME
Reconciliation of Operational Earnings1 to Reported Net Income
For the years ended December 31, 2003 and 2004; $ per share after tax
| | | | | | |
Factor
| | 04
| | | 03
| |
Net income (loss) to common | | (1.29 | ) | | 1.62 | |
Discontinued operations | | (1.26 | ) | | (0.20 | ) |
Extraordinary gain | | (0.05 | ) | | — | |
Cum. effect of changes in accounting principles | | (0.03 | ) | | 0.15 | |
Premium on EPMIs | | 2.83 | | | — | |
Preference stock dividends | | 0.07 | | | 0.06 | |
Income (loss) from continuing operations | | 0.27 | | | 1.63 | |
Preference stock dividends | | (0.07 | ) | | (0.06 | ) |
Effect of diluted shares calculation | | 0.04 | | | 0.01 | |
Special items | | 2.58 | | | — | |
Operational earnings | | 2.82 | | | 1.58 | |
Description of Special Items
For the year ended December 31, 2004; $millions and $ per share after tax
| | | | | | | | | | | | | | |
Special Item
| | Main Earnings
Category
| | Amount
| | | Per
Share
| | | Cash
| | | Non-Cash2
| |
Energy segment: | | | | | | | | | | | | | | |
Software projects write-off | | Other deductions | | 69 | | | 0.22 | | | — | | | 69 | |
Severance and related expenses | | Other deductions | | 72 | | | 0.22 | | | 45 | | | 27 | |
Inventory/gas plant write-downs | | Other deductions | | 55 | | | 0.17 | | | | | | 55 | |
Lease termination expense | | Other deductions | | 117 | | | 0.37 | | | 15 | | | 102 | |
Power contract settlement expense | | Other deductions | | 66 | | | 0.20 | | | 112 | | | (46 | ) |
Disposition of property | | Other income | | (50 | ) | | (0.15 | ) | | (12 | ) | | (38 | ) |
Other charges | | Other deductions | | 10 | | | 0.03 | | | 10 | | | | |
Electric Delivery segment: | | | | | | | | | | | | | | |
Rate case settlement reserve | | Other deductions | | 14 | | | 0.04 | | | — | | | 14 | |
Severance/other expenses | | Other deductions | | 19 | | | 0.06 | | | 11 | | | 8 | |
Corporate and Other: | | | | | | | | | | | | | | |
One-time compensation expense | | SG&A | | 51 | | | 0.16 | | | 51 | | | — | |
Transaction professional fees | | SG&A | | 35 | | | 0.11 | | | 35 | | | — | |
Litigation settlement expense | | Other deductions | | 56 | | | 0.17 | | | — | | | 56 | |
Liability management expense | | Other deductions
income/deductions | | 384 | | | 1.20 | | | 382 | | | 2 | |
Severance charges and other | | Other deductions | | 5 | | | 0.02 | | | 5 | | | — | |
Income tax benefit | | Income tax expense | | (75 | ) | | (0.24 | ) | | — | | | (75 | ) |
| | | | |
|
| |
|
| |
|
| |
|
|
Total | | | | 828 | | | 2.58 | | | 654 | | | 174 | |
| | | | |
|
| |
|
| |
|
| |
|
|
| 1 | Operational earnings is a non-GAAP measure that adjusts net income for special items. See Definitions for a |
detailed definition of operational earnings.
| 2 | While these items are reflected in earnings for the current period, the cash impact, if any, will be realized in future periods. These items are considered non-cash for the current period. |
3
TXU CORP. AND SUBSIDIARIES
STATEMENTS OF CONSOLIDATED CASH FLOWS
| | | | | | | | | | | | |
| | | Year Ended December 31,
| |
| | | 2004
| | | 2003
| | | 2002
| |
| | | (millions of dollars) | |
Cash flows — operating activities | | | | | | | | | | | | |
Income from continuing operations before extraordinary gain (loss) and cumulative effect of changes in accounting principles | | $ | 81 | | | $ | 566 | | | $ | 105 | |
Adjustments to reconcile income from continuing operations before extraordinary gain (loss) and cumulative effect of changes in accounting principles to cash provided by operating activities: | | | | | | | | | | | | |
Depreciation and amortization | | | 826 | | | | 791 | | | | 804 | |
Deferred income taxes and investment tax credits — net | | | (11 | ) | | | (40 | ) | | | 21 | |
Losses on early extinguishment of debt | | | 416 | | | | — | | | | 40 | |
Asset writedowns and lease-related charges | | | 376 | | | | — | | | | 237 | |
Net gain from sales of assets | | | (135 | ) | | | (45 | ) | | | (30 | ) |
Net effect of unrealized mark-to-market valuations of commodity contracts | | | 109 | | | | 100 | | | | 113 | |
Litigation settlement charge | | | 84 | | | | — | | | | — | |
Bad debt expense | | | 90 | | | | 119 | | | | 160 | |
Stock-based compensation expense | | | 56 | | | | 25 | | | | 1 | |
Net equity (income) loss from unconsolidated affiliates and joint ventures | | | (1 | ) | | | 17 | | | | 255 | |
Change in regulatory-related liabilities | | | (70 | ) | | | (144 | ) | | | 34 | |
Changes in operating assets and liabilities: | | | | | | | | | | | | |
Accounts receivable—trade | | | (246 | ) | | | 173 | | | | (632 | ) |
Impact of accounts receivable sales program | | | (73 | ) | | | 100 | | | | (15 | ) |
Inventories | | | 15 | | | | (46 | ) | | | (48 | ) |
Accounts payable—trade | | | 185 | | | | (24 | ) | | | 108 | |
Commodity contract assets and liabilities | | | (5 | ) | | | 24 | | | | (45 | ) |
Margin deposits—net | | | 34 | | | | 25 | | | | — | |
Other — net assets | | | (133 | ) | | | 290 | | | | (97 | ) |
Other — net liabilities | | | 160 | | | | 482 | | | | 41 | |
| | |
|
|
| |
|
|
| |
|
|
|
Cash provided by operating activities | | | 1,758 | | | | 2,413 | | | | 1,052 | |
| | |
|
|
| |
|
|
| |
|
|
|
Cash flows — financing activities | | | | | | | | | | | | |
Issuances of securities: | | | | | | | | | | | | |
Long-term debt | | | 5,090 | | | | 2,846 | | | | 4,446 | |
Common stock | | | 112 | | | | 23 | | | | 1,274 | |
Retirements/repurchases of securities: | | | | | | | | | | | | |
Long-term debt held by subsidiary trusts | | | (546 | ) | | | — | | | | — | |
Equity-linked debt securities | | | (1,105 | ) | | | — | | | | — | |
Other long-term debt | | | (3,088 | ) | | | (2,187 | ) | | | (3,407 | ) |
Exchangeable preferred membership interests | | | (750 | ) | | | — | | | | — | |
Preferred securities of subsidiaries | | | (75 | ) | | | (98 | ) | | | — | |
Common stock | | | (4,687 | ) | | | — | | | | — | |
Change in notes payable: | | | | | | | | | | | | |
Commercial paper | | | — | | | | — | | | | (854 | ) |
Banks | | | 210 | | | | (2,305 | ) | | | 1,490 | |
Cash dividends paid: | | | | | | | | | | | | |
Common stock | | | (150 | ) | | | (160 | ) | | | (652 | ) |
Preference stock | | | (22 | ) | | | (22 | ) | | | (22 | ) |
Premium paid for redemption of exchangeable preferred membership interests | | | (1,102 | ) | | | — | | | | — | |
Redemption deposits applied to debt retirements | | | — | | | | 210 | | | | (210 | ) |
Debt premium, discount, financing and reacquisition expenses | | | (406 | ) | | | (38 | ) | | | (283 | ) |
| | |
|
|
| |
|
|
| |
|
|
|
Cash provided by (used in) financing activities | | | (6,519 | ) | | | (1,731 | ) | | | 1,782 | |
| | |
|
|
| |
|
|
| |
|
|
|
4
TXU CORP. AND SUBSIDIARIES
STATEMENTS OF CONSOLIDATED CASH FLOWS (CONT.)
| | | | | | | | | | | | |
| | | Year Ended December 31,
| |
| | | 2004
| | | 2003
| | | 2002
| |
| | | (millions of dollars) | |
Cash flows — investing activities | | | | | | | | | | | | |
Capital expenditures | | | (912 | ) | | | (721 | ) | | | (813 | ) |
Dispositions of businesses | | | 4,814 | | | | 14 | | | | — | |
Acquisition of telecommunications partner’s interest | | | — | | | | (150 | ) | | | — | |
Proceeds from sales of assets | | | 27 | | | | 10 | | | | 447 | |
Change in collateral trust | | | 525 | | | | (525 | ) | | | — | |
Nuclear fuel | | | (87 | ) | | | (44 | ) | | | (51 | ) |
Other, including transaction costs | | | (87 | ) | | | 16 | | | | (186 | ) |
| | |
|
|
| |
|
|
| |
|
|
|
Cash provided by (used in) investing activities | | | 4,280 | | | | (1,400 | ) | | | (603 | ) |
| | |
|
|
| |
|
|
| |
|
|
|
Discontinued operations | | | | | | | | | | | | |
Cash provided by (used in) operating activities | | | (79 | ) | | | 338 | | | | 203 | |
Cash provided by (used in) financing activities | | | (10 | ) | | | 97 | | | | (966 | ) |
Cash used in investing activities | | | (153 | ) | | | (409 | ) | | | (210 | ) |
Effect of exchange rate changes | | | — | | | | 8 | | | | 60 | |
| | |
|
|
| |
|
|
| |
|
|
|
Cash provided by (used in) discontinued operations | | | (242 | ) | | | 34 | | | | (913 | ) |
| | |
|
|
| |
|
|
| |
|
|
|
Net change in cash and cash equivalents | | | (723 | ) | | | (684 | ) | | | 1,318 | |
Cash and cash equivalents — beginning balance | | | 829 | | | | 1,513 | | | | 195 | |
| | |
|
|
| |
|
|
| |
|
|
|
Cash and cash equivalents — ending balance | | $ | 106 | | | $ | 829 | | | $ | 1,513 | |
| | |
|
|
| |
|
|
| |
|
|
|
5
TXU CORP. AND SUBSIDIARIES
CONSOLIDATED BALANCE SHEETS
| | | | | | |
| | | December 31,
|
| | | 2004
| | 2003
|
| | | (millions of dollars) |
| ASSETS |
Current assets: | | | | | | |
Cash and cash equivalents | | $ | 106 | | $ | 829 |
Restricted cash | | | 49 | | | 12 |
Accounts receivable — trade | | | 1,274 | | | 1,016 |
Income taxes receivable | | | 25 | | | — |
Inventories | | | 320 | | | 419 |
Commodity contract assets | | | 546 | | | 548 |
Accumulated deferred income taxes | | | 224 | | | 94 |
Assets of telecommunications holding company | | | — | | | 110 |
Other current assets | | | 249 | | | 196 |
| | |
|
| |
|
|
Total current assets | | | 2,793 | | | 3,224 |
| | |
|
| |
|
|
Investments: | | | | | | |
Restricted cash | | | 47 | | | 582 |
Other investments | | | 664 | | | 632 |
Property, plant and equipment — net | | | 16,676 | | | 16,803 |
Goodwill | | | 542 | | | 558 |
Regulatory assets — net | | | 1,891 | | | 1,872 |
Commodity contract assets | | | 315 | | | 109 |
Cash flow hedge and other derivative assets | | | 6 | | | 88 |
Other noncurrent assets | | | 283 | | | 214 |
Assets held for sale | | | 24 | | | 7,202 |
| | |
|
| |
|
|
Total assets | | $ | 23,241 | | $ | 31,284 |
| | |
|
| |
|
|
| LIABILITIES, PREFERRED SECURITIES OF SUBSIDIARIES AND SHAREHOLDERS’ EQUITY |
Current liabilities: | | | | | | |
Notes payable - banks | | $ | 210 | | $ | — |
Long-term debt due currently | | | 229 | | | 678 |
Accounts payable — trade | | | 950 | | | 790 |
Commodity contract liabilities | | | 491 | | | 502 |
Litigation and other settlement accruals | | | 391 | | | — |
Liabilities of telecommunications holding company | | | — | | | 603 |
Other current liabilities | | | 1,445 | | | 1,322 |
| | |
|
| |
|
|
Total current liabilities | | | 3,716 | | | 3,895 |
| | |
|
| |
|
|
Accumulated deferred income taxes | | | 2,721 | | | 3,599 |
Investment tax credits | | | 405 | | | 430 |
Commodity contract liabilities | | | 347 | | | 47 |
Cash flow hedge and other derivative liabilities | | | 195 | | | 240 |
Long-term debt held by subsidiary trusts | | | — | | | 546 |
All other long-term debt, less amounts due currently | | | 12,412 | | | 10,608 |
Other noncurrent liabilities and deferred credits | | | 2,762 | | | 2,289 |
Liabilities held for sale | | | 6 | | | 2,952 |
| | |
|
| |
|
|
Total liabilities | | | 22,564 | | | 24,606 |
Preferred securities of subsidiaries | | | 38 | | | 759 |
Contingencies | | | | | | |
Shareholders’ equity | | | 639 | | | 5,919 |
| | |
|
| |
|
|
Total liabilities, preferred securities of subsidiaries and shareholders’ equity | | $ | 23,241 | | $ | 31,284 |
| | |
|
| |
|
|
6

OPERATING STATISTICS – TXU ELECTRIC DELIVERY
TXU Electric Delivery1 consists of regulated electricity transmission and distribution operations in Texas. TXU Electric Delivery provides the essential service of delivering electricity safely, reliably, and economically to approximately three million electric delivery points, or about a third of the state’s population. It is the largest electric transmission and distribution business in the state and the sixth largest in the nation.
Description of TXU Electric Delivery Business
TXU Electric Delivery owns and operates more than 100,000 miles of electric distribution lines and over 14,000 miles of electric transmission lines. The operating assets are located principally in the north-central, eastern and western parts of Texas. TXU Electric Delivery operates within the Electric Reliability Council of Texas (ERCOT) system. ERCOT is an intrastate network of investor-owned entities, cooperatives, public entities, non-utility generators and power marketers.
Electricity Distribution
TXU’s distribution business is responsible for the overall safe and efficient operation of distribution facilities, including power delivery, power quality and system reliability. The electricity distribution business owns, manages, constructs, maintains and operates the distribution system within its certificated service area. Over the past five years, the number of TXU Electric Delivery’s distribution premises served has been growing at an average rate of 2% per year. TXU’s distribution system receives electricity from the transmission system through substations and distributes electricity to end users and wholesale customers through 2,943 distribution feeders.
Distribution Facts
As of December 31, 2000 – 2004; Mixed measures
| | | | | | | | | | |
Item
| | 2004
| | 2003
| | 2002
| | 2001
| | 2000
|
Transformer Capacity (MVA) | | 49,462 | | 47,991 | | 46,722 | | 45,503 | | 43,949 |
Circuit Miles of Line | | 99,638 | | 98,286 | | 96,847 | | 95,793 | | 94,644 |
Count of Load Serving Substations | | 785 | | 780 | | 776 | | 774 | | 772 |
Distribution Feeders | | 2,943 | | 2,914 | | 2,884 | | 2,867 | | 2,831 |
Electric Delivery Owned Poles2 | | 1,898,312 | | 1,886,284 | | 1,877,954 | | 1,893,714 | | 1,885,040 |
Third Party Poles3 | | 295,468 | | 297,188 | | 296,218 | | 270,649 | | 270,620 |
Electric Transmission
TXU’s electricity transmission business is responsible for the safe and reliable operations of its transmission network and substations. These responsibilities consist of the construction and maintenance of transmission facilities and substations and the monitoring, controlling and dispatching of high-voltage electricity over TXU Electric Delivery’s transmission facilities in coordination with ERCOT. The transmission business participates with ERCOT and other member utilities to plan, design, construct, and operate new transmission lines, with regulatory approval, necessary to maintain reliability, increase bulk power transfer capability and to minimize limitations and constraints on the ERCOT transmission grid.
| 1 | TXU Electric Delivery operated under the name ‘Oncor Electric Delivery’ during 2003 and 2002. |
| 2 | Approximately 30,000 poles sold during the 2000 to 2002 timeframe. |
| 3 | Count of third party poles contacted. |
7
OPERATING STATISTICS – ELECTRIC DELIVERY
Transmission Facts
As of December 31, 2000 – 2004; Mixed measures
| | | | | | | | | | |
Item
| | 2004
| | 2003
| | 2002
| | 2001
| | 2000
|
Transformer Capacity (MVA) | | 75,533 | | 70,890 | | 68,385 | | 68,089 | | 66,893 |
Circuit Miles of Line | | 14,191 | | 14,180 | | 14,137 | | 14,010 | | 13,815 |
Count of Substations, Switching Stations and Plant Switchyards | | 950 | | 950 | | 946 | | 941 | | 935 |
Transmission Circuit Breakers | | 5,825 | | 5,749 | | 5,633 | | 5,569 | | 5,466 |
Interconnection to Generation Facilities | | 40 | | 43 | | 41 | | 38 | | 34 |
Interconnection to Other Transmission Providers | | 248 | | 241 | | 200 | | 217 | | 211 |
Key Operational Metrics
For years ended December 31, 2000 – 2004; Mixed measures
| | | | | | | | | | | | | | | |
Metric
| | 2004
| | | 2003
| | | 2002
| | | 2001
| | | 2000
| |
Non-Storm SAIDI (minutes)1 | | 75.54 | | | 74.15 | | | 90.36 | | | 81.77 | | | 87.46 | |
Non-Storm SAIFI (frequency)1 | | 1.10 | | | 1.17 | | | 1.39 | | | 1.23 | | | 1.37 | |
Non-Storm CAIDI (minutes)1 | | 68.67 | | | 63.30 | | | 64.81 | | | 66.48 | | | 63.84 | |
Meter Reading Accuracy | | 99.91 | % | | 99.89 | % | | 99.92 | % | | 99.91 | % | | 99.90 | % |
DART Incident Rate | | 1.96 | | | 1.73 | | | 1.87 | | | 2.35 | | | 2.30 | |
Regulatory Complaints2 | | 484 | | | 367 | | | 394 | | | 852 | | | 297 | |
Selected Financial Metrics
For years ended December 31, 2000 – 2004; $ millions, %
| | | | | | | | | | | | | | | |
Metric
| | 2004
| | | 2003
| | | 2002
| | | 20013
| | | 20003
| |
Total Operating Revenues | | 2,226 | | | 2,087 | | | 1,994 | | | 2,314 | | | 2,081 | |
Total Operating Expenses | | 1,697 | | | 1,565 | | | 1,517 | | | 1,820 | | | 1,597 | |
Net Income Before Extraordinary Items | | 255 | | | 258 | | | 245 | | | 228 | | | 226 | |
Property, Plant & Equipment – Net | | 6,609 | | | 6,333 | | | 6,056 | | | 5,802 | | | 5,445 | |
Capital Expenditures | | 600 | | | 543 | | | 513 | | | 635 | | | 517 | |
Capitalization Ratios | | | | | | | | | | | | | | | |
Long-term debt, less amounts due currently | | 61.0 | % | | 58.2 | % | | 60.6 | % | | 54.9 | % | | 52.1 | % |
Shareholder Equity | | 39.0 | % | | 41.8 | % | | 39.4 | % | | 45.1 | % | | 47.9 | % |
Capitalization Ratios (without transition bonds)4 | | | | | | | | | | | | | | | |
Long-term debt, less amounts due currently | | 53.2 | % | | 55.1 | % | | 60.6 | % | | 54.9 | % | | 52.1 | % |
Shareholder Equity | | 46.8 | % | | 44.9 | % | | 39.4 | % | | 45.1 | % | | 47.9 | % |
| 1 | Based on all outages greater than one minute in duration. |
| 2 | Complaints spiked in 2001 due to implementation of the pilot prior to the opening of the Texas electricity market to competition, and increased public awareness of the PUC’s involvement in regulating electric utilities. 2001 includes statistics for both TXU Electric Delivery and TXU Energy. The increase in 2004 vs 2003 is significantly due to a series of severe storms that struck North Texas during the week of June 1, 2004. Over one million customers lost power during this week and many experienced extended outages. |
| 3 | The 2000 and 2001 financial information for TXU Electric Delivery includes information derived from the historical financial statements of TXU Electric Company. Reasonable allocation methodologies were used to unbundle the financial statements of TXU Electric Company between its generation, retail and T&D operations. Allocation of revenues reflected consideration of return on invested capital, which continues to be regulated for the T&D operations. TXU Electric maintained expense accounts for each of its functional operations. Costs of O&M, plant and equipment and depreciation, as well as other assets and liabilities were specifically identified by component and function and then disaggregated. Interest and other financing costs were determined based upon debt allocated. Allocations reflected in the financial information for 2000 and 2001 did not necessarily result in amounts reported in individual line items that are comparable to actual results in 2002. Had the unbundled T&D operations of TXU US Holdings actually existed as a separate legal entity, its results of operations could have differed materially from those included in the historical financial statements of TXU Electric. |
| 4 | Excludes securitization bonds issued in years 2003 and 2004, as such bonds are serviced by transition charges and are excluded from debt in credit analyses and for regulatory rate proceedings. |
8
OPERATING STATISTICS – TXU ELECTRIC DELIVERY
Service Performance Statistics
TXU Electric Delivery finished 2004 as the best performing transmission and distribution service provider (TDSP) by performing at or above market average in 5 out of 7 key ERCOT service categories. TXU Electric Delivery had 49% of the total ERCOT market transactions.
Service Performance Statistics
For the year ended 12/31/04; %
| | | | | | |
Service Category
| | ERCOT Report Market Average
| | | TXU
| |
Scheduling of Switches | | 99.7 | % | | 99.8 | % |
Scheduling of Move-ins | | Unavailable | | | 99.97 | % |
On Schedule Completion of Switches | | 86.6 | % | | 98.3 | % |
On Schedule Completion of Move-ins | | 85.9 | % | | 91.6 | % |
Providing Historical Usage | | 98.0 | % | | 97.0 | % |
Loading of IDR Metering Data | | 99.7 | % | | 99.8 | % |
Loading of NIDR Metering Data | | 99.7 | % | | 99.6 | % |
Regulatory Environment
TXU Electric Delivery is subject to regulation by Texas authorities. TXU Electric Delivery provides delivery services to Retail Electric Providers (REPs) who sell electricity to retail customers; consequently, the electric delivery business has no commodity supply or price risk. TXU Electric Delivery believes that it operates in a favorable regulatory environment, as evidenced by a regulatory provision that allows annual updates of transmission rates to reflect changes in invested capital. This provision encourages investment in the transmission system to help ensure reliability and efficiency by allowing for timely recovery and return on new transmission investments.
General Rate Information
TXU Electric Delivery has an authorized return on equity of 11.25%. In the fourth quarter of 2004, TXU Electric Delivery recorded a $21 million ($14 million after-tax) charge for estimated settlement payments. The settlement, which was finalized February 22, 2005, is the result of a number of municipalities initiating an inquiry regarding distribution rates. The agreement avoids any immediate rate actions, but would require TXU Electric Delivery to file a rate case in 2006, based on a 2005 test year, unless the municipalities and TXU Electric Delivery mutually agree that such a filing is unnecessary. The final settlement amounts are being determined; however TXU Electric Delivery believes the total will closely approximate the amount accrued.
Transmission Cost of Service (TCOS) and Transmission Cost Recovery Factor (TCRF)
ERCOT transmission service providers (TSPs) recover their TCOS through a network transmission service rate approved by the Public Utility Commission of Texas (PUC). ERCOT TSPs bill their wholesale network transmission service charges to ERCOT distribution utilities, by applying their approved wholesale transmission rates to the distribution utilities’ average loads for the prior summer1. Distribution utilities2 are billed for wholesale transmission service by all ERCOT TSPs. Distribution utilities2 recover these transmission fees by billing the REPs a base retail transmission charge. In the Utility Cost of Service (UCOS) cases, the distribution utilities established base retail transmission charges by rate class. These rates are in addition to the base retail distribution system wires charges and other non-bypassable charges that are billed to retail electric providers.
In the latest wholesale transmission rulemaking, the PUC approved a new rule section, Distribution Service Provider TCRF. The purpose of this rule section is to allow distribution service providers to pass through wholesale transmission rate increases without the need for a distribution utility rate case. The TCRF rule allows distribution utilities to update the TCRF on March 1 and September 1 each year. The TCRF charges are billed in addition to the base retail transmission wires charges.
| 1 | The load for a distribution utility is the average demand at the time of the ERCOT peak for the months of June, July, August, and September. |
| 2 | Investor Owned Utilities (IOU’s) and other entities participating in customer choice. |
9
OPERATING STATISTICS – TXU ELECTRIC DELIVERY
Wire Rate Charges
As shown in the chart below, TXU Electric Delivery has the lowest basic wires rate in the State of Texas.
Operational Wires Rates Comparison – Residential with TCRF Factors (as of March 1, 2005)
| | | | | | | | | | | | | | | |
Charge
| | TXU
| | CenterPoint
| | AEP Central
| | AEP North
| | TNMP
|
Customer Charge | | $ | 2.74/cust/month | | $ | 2.39/cust/month | | $ | 2.58/cust/month | | $ | 4.58/cust/month | | $ | 0.33/cust/month |
Metering Charge | | $ | 2.21/cust/month | | $ | 1.91/cust/month | | $ | 2.38/cust/month | | $ | 4.78/cust/month | | $ | 3.58/cust/month |
Merger Savings/Rate Reduction Charge | | $ | 0.00/cust/month | | $ | 0.00/cust/month | | | ($0.28)/cust/month | | | ($0.48)/cust/month | | $ | 0.00/cust/month |
| | | | | |
Subtotal, Fixed Charges | | $ | 4.95/cust/month | | $ | 4.30/cust/month | | $ | 4.68/cust/month | | $ | 8.88/cust/month | | $ | 3.91/cust/month |
Distribution System Charge | | $ | 0.014070/kWh | | $ | 0.018870/kWh | | $ | 0.015628/kWh | | $ | 0.019863/kWh | | $ | 0.017291/kWh |
Transmission System Charge | | $ | 0.004493/kWh | | $ | 0.004310/kWh | | $ | 0.003712/kWh | | $ | 0.004638/kWh | | $ | 0.004150/kWh |
Transmission Cost Recovery Factor | | $ | 0.000899/kWh | | $ | 0.000752/kWh | | $ | 0.000705/kWh | | $ | 0.000972/kWh | | $ | 0.000866kWh |
Subtotal, Basic Wires Charges | | $ | 0.019462/kWh | | $ | 0.023932/kWh | | $ | 0.020045/kWh | | $ | 0.025473/kWh | | $ | 0.022307/kWh |
| | | | | |
System Benefit Fund | | $ | 0.000655/kWh | | $ | 0.000655/kWh | | $ | 0.000662/kWh | | $ | 0.000660/kWh | | $ | 0.000654/kWh |
Nuclear Decommissioning Charge | | $ | 0.000169/kWh | | | Included in base chges | | | n/a | | | n/a | | | n/a |
Transition Charge | | $ | 0.000712/kWh | | $ | 0.000939/kWh | | $ | 0.004241/kWh | | | n/a | | | n/a |
Excess Mitigation Credit | | | Expired 12/31/03 | | | ($0.004873)/kWh | | | ($0.000822)/kWh | | | n/a | | | n/a |
Merger Savings/Rate Reduction Riders | | | n/a | | | n/a | | | ($ 0.001095)/kWh | | | ($0.001248)/kWh | | | n/a |
| | | | | |
Customer Charge and Wires Charge (no non-by passable charges) for 1,000 kWh | | $ | 24.41 | | $ | 28.23 | | $ | 24.73 | | $ | 34.35 | | $ | 26.22 |
| | | | | |
Customer Charge and Wires Charge (no non-by passable charges) for 1,300 kWh | | $ | 30.25 | | $ | 35.41 | | $ | 30.74 | | $ | 41.99 | | $ | 32.91 |
| | | | | |
Total Wires Charge for 1,000 kWh | | $ | 25.95 | | $ | 24.95 | | $ | 27.71 | | $ | 33.77 | | $ | 26.87 |
| | | | | |
Total Wires Charge for 1,300 kWh | | $ | 32.25 | | $ | 31.15 | | $ | 34.62 | | $ | 41.23 | | $ | 33.76 |
TXU Electric Delivery’s average residential consumption for 2004 was approximately 1,300 kWh. |
Rate Base
For the period ending December 31, 2004, TXU Electric Delivery’s Adjusted Total Invested Capital1 is approximately $5,644,507,000, as compared to 2003 Adjusted Total Invested Capital of $5,381,055,975.
| 1 | Adjusted Total Invested Capital = Total Invested Capital – [Construction Work in Progress + Plant Held for Future Use] |
10
OPERATING STATISTICS – TXU POWER
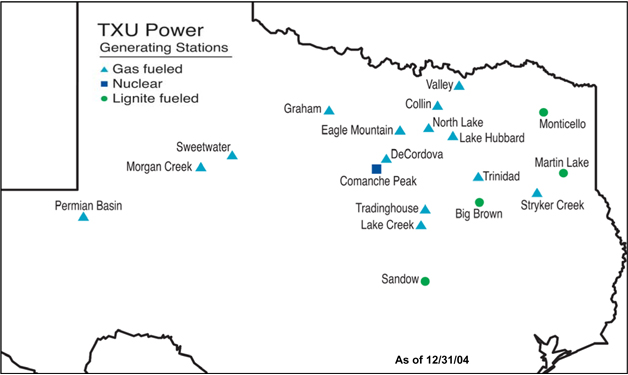
TXU Power’s generating facilities provide the capability to supply a significant portion of the wholesale electricity market demand in Texas, particularly in the North Texas market, at competitive production costs. Low cost nuclear-fueled and lignite/coal-fired (base load) generation is available to supply the electricity demands of its retail customers and other competitive retail electric providers. The generating fleet in Texas consists of 19 owned or leased plants with generating capacity fueled as follows: 2,300 MW nuclear; 5,837 MW coal/lignite; and 10,228 MW gas/oil.
Generating Plant Facts – Texas
| | | | | | | | |
Fact
| | Nuclear
| | Lignite/Coal
| | Gas/Oil
| | Total
|
Number of Generating Units | | 2 | | 9 | | 45 | | 56 |
2004 Installed Capacity (MWs) | | 2,300 | | 5,837 | | 10,228 | | 18,365 |
Annual Generation (3 year average MWhs) | | 17,793,690 | | 42,391,417 | | 12,168,793 | | 72,353,900 |
Generating Plant Locations – Texas
11
OPERATING STATISTICS – TXU POWER
Unit Statistics and Information – Texas
As of 12/31/04; MW
| | | | | | | | | | | | |
Plant
| | Unit
| | Fuel type
| | Type
| | Year in
Service1
| | County
| | Installed
Capacity
|
Comanche Peak | | 1 | | Nuclear | | Base load | | 1990 | | Somervell | | 1,150 |
Comanche Peak | | 2 | | Nuclear | | Base load | | 1993 | | Somervell | | 1,150 |
Subtotal | | | | | | | | | | | | 2,300 |
Big Brown | | 1 | | Lignite/Coal | | Base load | | 1971 | | Freestone | | 575 |
Big Brown | | 2 | | Lignite/Coal | | Base load | | 1972 | | Freestone | | 575 |
Monticello | | 1 | | Lignite/Coal | | Base load | | 1974 | | Titus | | 565 |
Monticello | | 2 | | Lignite/Coal | | Base load | | 1975 | | Titus | | 565 |
Monticello | | 3 | | Lignite/Coal | | Base load | | 1978 | | Titus | | 750 |
Martin Lake | | 1 | | Lignite/Coal | | Base load | | 1977 | | Rusk | | 750 |
Martin Lake | | 2 | | Lignite/Coal | | Base load | | 1978 | | Rusk | | 750 |
Martin Lake | | 3 | | Lignite/Coal | | Base load | | 1979 | | Rusk | | 750 |
Sandow | | 4 | | Lignite/Coal | | Base load | | 1981 | | Milam | | 557 |
| | | | | | | | | | | | |
|
Subtotal | | | | | | | | | | | | 5,837 |
| | | | | | | | | | | | |
|
Collin (M) | | 1 | | Gas/Oil | | Gas - Cycling | | 1955 | | Collin | | 153 |
DeCordova | | 1 | | Gas/Oil | | Gas - Intermediate | | 1975 | | Hood | | 818 |
DeCordova 4 CT’s2 | | | | Gas/Oil | | Gas - Peaking | | 1990 | | Hood | | 260 |
Eagle Mountain (M) | | 1 | | Gas/Oil | | Gas - Cycling | | 1954 | | Tarrant | | 115 |
Eagle Mountain (M) | | 2 | | Gas/Oil | | Gas - Cycling | | 1956 | | Tarrant | | 175 |
Eagle Mountain (RMR) | | 3 | | Gas/Oil | | Gas - Cycling | | 1971 | | Tarrant | | 375 |
Graham | | 1 | | Gas/Oil | | Gas - Cycling | | 1960 | | Young | | 240 |
Graham | | 2 | | Gas/Oil | | Gas - Intermediate | | 1969 | | Young | | 390 |
Lake Creek | | 1 | | Gas/Oil | | Gas - Cycling | | 1953 | | McLennan | | 87 |
Lake Creek | | 2 | | Gas/Oil | | Gas - Cycling | | 1959 | | McLennan | | 230 |
Lake Hubbard | | 1 | | Gas/Oil | | Gas - Cycling | | 1970 | | Dallas | | 393 |
Lake Hubbard | | 2 | | Gas/Oil | | Gas - Intermediate | | 1973 | | Dallas | | 528 |
Morgan Creek (M) | | 5 | | Gas/Oil | | Gas - Cycling | | 1959 | | Mitchell | | 175 |
Morgan Creek (M) | | 6 | | Gas/Oil | | Gas - Intermediate | | 1966 | | Mitchell | | 511 |
Morgan Creek 6 CT’s2 | | | | Gas/Oil | | Gas - Peaking | | 1988 | | Mitchell | | 390 |
North Lake (M) | | 1 | | Gas/Oil | | Gas - Cycling | | 1959 | | Dallas | | 175 |
North Lake (M) | | 2 | | Gas/Oil | | Gas - Cycling | | 1961 | | Dallas | | 175 |
North Lake (M) | | 3 | | Gas/Oil | | Gas - Cycling | | 1964 | | Dallas | | 365 |
Permian Basin | | 5 | | Gas/Oil | | Gas - Cycling | | 1959 | | Ward | | 115 |
Permian Basin | | 6 | | Gas/Oil | | Gas - Intermediate | | 1973 | | Ward | | 540 |
Permian Basin 5 CT’s2 | | | | Gas/Oil | | Gas - Peaking | | 1990 | | Ward | | 325 |
Stryker Creek | | 1 | | Gas/Oil | | Gas - Cycling | | 1958 | | Cherokee | | 175 |
Stryker Creek | | 2 | | Gas/Oil | | Gas - Intermediate | | 1965 | | Cherokee | | 500 |
Tradinghouse | | 1 | | Gas/Oil | | Gas - Intermediate | | 1970 | | McLennan | | 565 |
Tradinghouse | | 2 | | Gas/Oil | | Gas - Intermediate | | 1972 | | McLennan | | 818 |
Valley (M) | | 1 | | Gas/Oil | | Gas - Cycling | | 1962 | | Fannin | | 175 |
Valley (M) | | 2 | | Gas/Oil | | Gas - Intermediate | | 1967 | | Fannin | | 550 |
Valley (M) | | 3 | | Gas/Oil | | Gas - Cycling | | 1971 | | Fannin | | 390 |
Trinidad | | 6 | | Gas/Oil | | Gas - Cycling | | 1965 | | Henderson | | 240 |
Sweetwater | | 4 | | Gas/Oil | | Gas - Cycling | | 1989 | | Nolan | | 85 |
Sweetwater 3 CTs2 | | | | Gas/Oil | | Gas - Peaking | | 1989 | | Nolan | | 175 |
Diesels3 | | | | | | | | | | | | 20 |
| | | | | | | | | | | | |
|
Subtotal | | | | | | | | | | | | 10,228 |
| | | | | | | | | | | | |
|
Total | | | | | | | | | | | | 18,365 |
| | | | | | | | | | | | |
|
(M) – Mothballed (RMR) – Reliability Must Run for ERCOT
| 1 | Average useful lives: nuclear (60 years), lignite (50 years), gas (51 years), and gas CT’s (27 years) |
| 2 | CT - Combustion Turbine; DeCordova and Permian Basin CT capacity is under a purchase power agreement. |
| 3 | Diesels are located at Lake Creek (3), Stryker Creek (5) and Trinidad (2). |
12
OPERATING STATISTICS – TXU POWER
Nuclear Plant Statistics
| | | | |
Item
| | CPSES Unit 1
| | CPSES Unit 2
|
Commercial Operation Date | | August 1990 | | August 1993 |
License Expiration Date | | February 2030 | | February 2033 |
Architect/Engineer | | Gibbs & Hill | | Gibbs & Hill |
Reactor Manufacturer | | Westinghouse | | Westinghouse |
Reactor Type | | PWR | | PWR |
Turbine Generator Manufacturer | | Siemens | | Siemens |
Maximum Dependable Capacity (MW) | | 1,150 | | 1,150 |
Refueling Data | | | | |
Last Date | | March 27, 2004 | | March 26, 2005 |
# of Days | | 38 | | 32 |
Next Scheduled Refueling | | Fall 2005 | | Fall 2006 |
13
OPERATING STATISTICS – TXU POWER
Net Generation – Texas
For years ended December 31, 2000 – 2004; MWh
| | | | | | | | | | | | | | | |
Plant
| | Unit
| | 2004
| | | 2003
| | | 2002
| | | 2001
| | 2000
|
Comanche Peak | | 1 | | 9,013,792 | | | 9,625,953 | | | 7,785,265 | | | 8,444,318 | | 9,619,797 |
Comanche Peak | | 2 | | 10,038,851 | | | 8,123,390 | | | 8,793,819 | | | 9,877,947 | | 8,868,045 |
| | | | |
|
| |
|
| |
|
| |
| |
|
Subtotal | | | | 19,052,643 | | | 17,749,343 | | | 16,579,084 | | | 18,322,265 | | 18,487,842 |
| | | | |
|
| |
|
| |
|
| |
| |
|
Big Brown | | 1 | | 3,837,349 | | | 4,587,394 | | | 4,362,128 | | | 3,733,166 | | 4,230,742 |
Big Brown | | 2 | | 4,464,491 | | | 3,875,181 | | | 3,558,722 | | | 3,539,669 | | 4,314,241 |
Monticello | | 1 | | 4,305,393 | | | 4,134,558 | | | 3,711,998 | | | 3,646,758 | | 4,143,518 |
Monticello | | 2 | | 4,465,894 | | | 3,704,847 | | | 4,030,192 | | | 4,024,631 | | 3,478,659 |
Monticello | | 3 | | 5,277,059 | | | 5,666,922 | | | 5,385,687 | | | 4,904,882 | | 4,748,085 |
Martin Lake | | 1 | | 5,958,153 | | | 4,847,711 | | | 5,148,997 | | | 5,104,000 | | 5,596,189 |
Martin Lake | | 2 | | 5,339,493 | | | 5,781,564 | | | 5,079,555 | | | 4,812,971 | | 5,433,020 |
Martin Lake | | 3 | | 5,941,004 | | | 5,855,120 | | | 4,596,454 | | | 5,305,204 | | 5,492,880 |
Sandow | | 4 | | 4,527,603 | | | 4,787,459 | | | 3,943,323 | | | 4,434,912 | | 3,556,611 |
| | | | |
|
| |
|
| |
|
| |
| |
|
Subtotal | | | | 44,116,439 | | | 43,240,756 | | | 39,817,056 | | | 39,506,193 | | 40,993,945 |
| | | | |
|
| |
|
| |
|
| |
| |
|
Collin (M) | | 1 | | (1,217 | ) | | 98,879 | | | 74,572 | | | 191,886 | | 297,464 |
DeCordova | | 1 | | 206,385 | | | 1,414,916 | | | 2,974,511 | | | 3,338,979 | | 3,911,118 |
DeCordova CT’s | | | | 97,164 | | | 54,144 | | | 68,125 | | | 102,052 | | 181,854 |
Eagle Mountain (M) | | 1 | | 20,071 | | | 57,865 | | | 101,874 | | | 74,725 | | 148,244 |
Eagle Mountain (M) | | 2 | | 23,719 | | | 79,830 | | | 193,175 | | | 197,646 | | 256,133 |
Eagle Mountain (RMR) | | 3 | | 208,557 | | | 479,676 | | | 526,756 | | | 317,572 | | 531,411 |
Graham | | 1 | | 117,645 | | | 186,907 | | | 564,898 | | | 452,737 | | 931,078 |
Graham | | 2 | | 396,060 | | | 575,707 | | | 651,729 | | | 803,227 | | 1,362,246 |
Lake Creek | | 1 | | (2,223 | ) | | 1,858 | | | 29,460 | | | 64,960 | | 208,005 |
Lake Creek | | 2 | | 69,041 | | | 83,025 | | | 281,967 | | | 472,369 | | 691,554 |
Lake Hubbard | | 1 | | 129,333 | | | 400,926 | | | 414,224 | | | 462,944 | | 802,460 |
Lake Hubbard | | 2 | | 576,784 | | | 1,235,607 | | | 1,270,631 | | | 1,584,785 | | 1,863,522 |
Morgan Creek (R) | | 2 | | (347 | ) | | (1,561 | ) | | (1,478 | ) | | 1,492 | | 22,510 |
Morgan Creek (R) | | 3 | | (177 | ) | | (626 | ) | | (719 | ) | | 3,812 | | 16,203 |
Morgan Creek (R) | | 4 | | (418 | ) | | (1,569 | ) | | 6,343 | | | 37,413 | | 127,195 |
Morgan Creek (M) | | 5 | | 39,166 | | | 121,329 | | | 232,540 | | | 365,920 | | 568,993 |
Morgan Creek (M) | | 6 | | 42,720 | | | 629,540 | | | 842,029 | | | 1,979,522 | | 2,687,161 |
Morgan Creek CT’s | | | | 80,773 | | | 38,492 | | | 43,183 | | | 68,387 | | 174,584 |
North Lake(M) | | 1 | | 83,889 | | | 226,630 | | | 352,048 | | | 339,274 | | 337,409 |
North Lake (M) | | 2 | | 89,555 | | | 167,805 | | | 309,276 | | | 378,195 | | 461,831 |
North Lake (M) | | 3 | | 340,276 | | | 479,022 | | | 610,546 | | | 608,939 | | 1,120,695 |
North Main (R) | | 4 | | (181 | ) | | (832 | ) | | 56,863 | | | 14,775 | | 145,506 |
Parkdale (R) | | 1 | | (285 | ) | | 12,203 | | | 62,470 | | | 50,900 | | 141,342 |
Parkdale (R) | | 2 | | (169 | ) | | 21,096 | | | 99,219 | | | 81,301 | | 209,655 |
Parkdale (R) | | 3 | | (195 | ) | | 30,029 | | | 124,749 | | | 120,699 | | 263,059 |
Permian Basin | | 5 | | 17,241 | | | 40,019 | | | 95,770 | | | 221,266 | | 321,259 |
Permian Basin | | 6 | | 904,003 | | | 1,802,737 | | | 2,136,339 | | | 2,367,173 | | 2,607,556 |
Permian Basin CT’s | | | | 72,416 | | | 35,266 | | | 31,412 | | | 62,367 | | 165,561 |
River Crest (R) | | 6 | | (140 | ) | | (833 | ) | | (584 | ) | | 8,348 | | 183,042 |
Stryker Creek | | 1 | | 3,820 | | | 72,005 | | | 56,704 | | | 312,232 | | 449,959 |
Stryker Creek | | 2 | | 506,676 | | | 1,019,363 | | | 1,058,502 | | | 1,417,285 | | 1,921,490 |
Tradinghouse | | 1 | | 121,069 | | | 552,739 | | | 1,483,468 | | | 1,520,938 | | 1,806,095 |
Tradinghouse | | 2 | | 186,958 | | | 1,548,337 | | | 1,578,856 | | | 3,568,742 | | 3,595,258 |
Valley (M) | | 1 | | 5,851 | | | 141,253 | | | 192,241 | | | 327,436 | | 496,770 |
Valley (M) | | 2 | | (989 | ) | | 325,731 | | | 1,236,428 | | | 1,668,866 | | 2,086,165 |
Valley (M) | | 3 | | 823 | | | 95,422 | | | 199,461 | | | 366,490 | | 610,776 |
Trinidad | | 6 | | 45,330 | | | 144,262 | | | 218,517 | | | 415,436 | | 397,010 |
Sweetwater | | 4 | | 76,293 | | | 244,802 | | | 153,002 | | | — | | — |
Sweetwater CT | | 1 | | 44,560 | | | 65,316 | | | 85,440 | | | — | | — |
Sweetwater CT | | 2 | | 92,595 | | | 290,888 | | | 39,504 | | | — | | — |
Sweetwater CT | | 3 | | 81,478 | | | 330,777 | | | 279,435 | | | — | | — |
| | | | |
|
| |
|
| |
|
| |
| |
|
Subtotal | | | | 4,673,910 | | | 13,098,982 | | | 18,733,486 | | | 24,371,090 | | 32,102,173 |
| | | | |
|
| |
|
| |
|
| |
| |
|
Total | | | | 67,842,992 | | | 74,089,081 | | | 75,129,626 | | | 82,199,548 | | 91,583,960 |
| | | | |
|
| |
|
| |
|
| |
| |
|
| | |
Note: Excludes Handley and Mountain Creek Units sold in 2002. | | (R) Retired during 2004. |
(M) Mothballed | | (RMR) Reliability Must Run for ERCOT |
14
OPERATING STATISTICS – TXU POWER
Unit Capacity Factors – Texas
For years ended December 31, 2000 – 2004; %
| | | | | | | | | | | | |
Plant
| | Unit
| | 2004
| | 2003
| | 2002
| | 2001
| | 2000
|
Comanche Peak | | 1 | | 89.2 | | 95.6 | | 77.2 | | 83.8 | | 95.2 |
Comanche Peak | | 2 | | 99.4 | | 80.6 | | 87.2 | | 98.1 | | 87.7 |
| | | | | | |
Big Brown | | 1 | | 76.0 | | 91.1 | | 86.6 | | 74.1 | | 83.8 |
Big Brown | | 2 | | 88.4 | | 76.9 | | 70.7 | | 70.3 | | 85.4 |
Monticello | | 1 | | 86.8 | | 83.5 | | 75.0 | | 73.7 | | 83.5 |
Monticello | | 2 | | 90.0 | | 74.9 | | 81.4 | | 81.3 | | 70.1 |
Monticello | | 3 | | 80.1 | | 86.3 | | 82.0 | | 74.7 | | 72.1 |
Martin Lake | | 1 | | 90.4 | | 73.8 | | 78.4 | | 77.7 | | 84.9 |
Martin Lake | | 2 | | 81.0 | | 88.0 | | 77.3 | | 73.3 | | 82.5 |
Martin Lake | | 3 | | 90.2 | | 89.1 | | 70.0 | | 80.7 | | 83.4 |
Sandow | | 4 | | 94.6 | | 100.3 | | 82.6 | | 92.9 | | 74.3 |
| | | | | | |
Collin (M) | | 1 | | — | | 7.4 | | 5.6 | | 14.3 | | 22.1 |
DeCordova | | 1 | | 2.9 | | 19.7 | | 41.5 | | 46.6 | | 54.4 |
Decordova CT’s | | | | 3.5 | | 1.9 | | 2.4 | | 3.6 | | 6.5 |
Eagle Mountain (M) | | 1 | | 2.0 | | 5.7 | | 10.1 | | 7.4 | | 14.7 |
Eagle Mountain (M) | | 2 | | 1.5 | | 5.2 | | 12.6 | | 12.9 | | 16.7 |
Eagle Mountain (RMR) | | 3 | | 6.3 | | 14.6 | | 16.0 | | 9.7 | | 16.1 |
Graham | | 1 | | 5.6 | | 8.9 | | 26.9 | | 21.5 | | 44.2 |
Graham | | 2 | | 11.6 | | 16.9 | | 19.1 | | 23.5 | | 39.8 |
Lake Creek | | 1 | | — | | 0.2 | | 3.9 | | 8.5 | | 27.2 |
Lake Creek | | 2 | | 3.4 | | 4.1 | | 14.0 | | 23.4 | | 34.2 |
Lake Hubbard | | 1 | | 3.7 | | 11.6 | | 12.0 | | 13.4 | | 23.2 |
Lake Hubbard | | 2 | | 12.4 | | 26.7 | | 27.5 | | 34.3 | | 40.2 |
Morgan Creek (R) | | 2 | | — | | — | | — | | 0.8 | | 11.6 |
Morgan Creek (R) | | 3 | | — | | — | | — | | 1.0 | | 4.2 |
Morgan Creek (R) | | 4 | | — | | — | | 1.0 | | 6.1 | | 20.7 |
Morgan Creek (M) | | 5 | | 2.5 | | 7.9 | | 15.2 | | 23.9 | | 37.0 |
Morgan Creek (M) | | 6 | | 1.0 | | 14.1 | | 18.8 | | 44.2 | | 59.9 |
Morgan Creek CT’s | | | | 1.9 | | 0.9 | | 1.0 | | 1.6 | | 4.1 |
North Lake (M) | | 1 | | 5.5 | | 14.8 | | 23.0 | | 22.1 | | 22.0 |
North Lake (M) | | 2 | | 5.8 | | 10.9 | | 20.2 | | 24.7 | | 30.0 |
North Lake (M) | | 3 | | 10.6 | | 15.0 | | 19.1 | | 19.0 | | 35.0 |
North Main (R) | | 4 | | — | | — | | 8.1 | | 2.1 | | 20.7 |
Parkdale (R) | | 1 | | — | | 1.6 | | 8.2 | | 6.7 | | 18.5 |
Parkdale (R) | | 2 | | — | | 2.1 | | 9.8 | | 8.1 | | 20.8 |
Parkdale (R) | | 3 | | — | | 2.7 | | 11.4 | | 11.0 | | 24.0 |
Permian Basin | | 5 | | 1.7 | | 4.0 | | 9.5 | | 22.0 | | 31.8 |
Permian Basin | | 6 | | 19.1 | | 38.1 | | 45.2 | | 50.0 | | 55.0 |
Permian Basin CT’s | | | | 2.1 | | 1.0 | | 0.9 | | 1.8 | | 4.7 |
River Crest (R) | | 6 | | — | | — | | — | | 0.9 | | 18.9 |
Stryker Creek | | 1 | | 0.2 | | 4.7 | | 3.7 | | 20.4 | | 29.3 |
Stryker Creek | | 2 | | 11.5 | | 23.3 | | 24.2 | | 32.4 | | 43.8 |
Tradinghouse | | 1 | | 2.4 | | 11.2 | | 30.0 | | 30.7 | | 36.4 |
Tradinghouse | | 2 | | 2.6 | | 21.6 | | 22.0 | | 49.8 | | 50.0 |
Valley (M) | | 1 | | 0.4 | | 9.2 | | 12.5 | | 21.4 | | 32.3 |
Valley (M) | | 2 | | — | | 6.8 | | 25.7 | | 34.6 | | 43.2 |
Valley (M) | | 3 | | — | | 2.8 | | 5.8 | | 10.7 | | 17.8 |
Trinidad | | 6 | | 2.2 | | 6.9 | | 10.4 | | 19.8 | | 18.8 |
Sweetwater | | 4 | | 11.4 | | 36.8 | | 23.0 | | — | | — |
Sweetwater CT | | 1 | | 12.4 | | 18.2 | | 23.8 | | — | | — |
Sweetwater CT | | 2 | | 12.3 | | 38.6 | | 5.2 | | — | | — |
Sweetwater CT | | 3 | | 10.8 | | 43.9 | | 37.1 | | — | | — |
(R) Retired during 2004. (M) Mothballed (RMR) Reliability Must Run for ERCOT
15
OPERATING STATISTICS – TXU POWER
Net Heat Rates – Texas
Btu/kWh
| | | | | | |
Plant
| | Unit
| | Low
| | High
|
Comanche Peak | | 1 | | 10,200 | | 10,500 |
Comanche Peak | | 2 | | 9,500 | | 10,500 |
| | | |
Big Brown | | 1 | | 10,587 | | 11,517 |
Big Brown | | 2 | | 10,587 | | 11,517 |
Monticello | | 1 | | 10,587 | | 11,517 |
Monticello | | 2 | | 10,587 | | 11,517 |
Monticello | | 3 | | 10,587 | | 11,517 |
Martin Lake | | 1 | | 10,587 | | 11,517 |
Martin Lake | | 2 | | 10,587 | | 11,517 |
Martin Lake | | 3 | | 10,587 | | 11,517 |
Sandow | | 4 | | 10,587 | | 11,517 |
| | | |
Collin | | 1 | | 10,430 | | 32,426 |
DeCordova | | 1 | | 9,812 | | 13,316 |
Decordova CT’s | | | | 9,250 | | 9,800 |
Eagle Mountain | | 1 | | 10,430 | | 32,426 |
Eagle Mountain | | 2 | | 10,430 | | 32,426 |
Eagle Mountain | | 3 | | 10,430 | | 32,426 |
Graham | | 1 | | 10,430 | | 32,426 |
Graham | | 2 | | 9,812 | | 13,316 |
Lake Creek | | 1 | | 10,430 | | 32,426 |
Lake Creek | | 2 | | 10,430 | | 32,426 |
Lake Hubbard | | 1 | | 10,430 | | 32,426 |
Lake Hubbard | | 2 | | 9,812 | | 13,316 |
Morgan Creek (R) | | 2 | | 10,430 | | 32,426 |
Morgan Creek (R) | | 3 | | 10,430 | | 32,426 |
Morgan Creek (R) | | 4 | | 10,430 | | 32,426 |
Morgan Creek | | 5 | | 10,430 | | 32,426 |
Morgan Creek | | 6 | | 9,812 | | 13,316 |
Morgan Creek CT’s | | | | 9,250 | | 9,800 |
North Lake | | 1 | | 10,430 | | 32,426 |
North Lake | | 2 | | 10,430 | | 32,426 |
North Lake | | 3 | | 10,430 | | 32,426 |
North Main (R) | | 4 | | 10,430 | | 32,426 |
Parkdale (R) | | 1 | | 10,430 | | 32,426 |
Parkdale (R) | | 2 | | 10,430 | | 32,426 |
Parkdale (R) | | 3 | | 10,430 | | 32,426 |
Permian Basin | | 5 | | 10,430 | | 32,426 |
Permian Basin | | 6 | | 9,812 | | 13,316 |
Permian Basin CT’s | | | | 9,250 | | 9,800 |
River Crest (R) | | 6 | | 10,430 | | 32,426 |
Stryker Creek | | 1 | | 10,430 | | 32,426 |
Stryker Creek | | 2 | | 9,812 | | 13,316 |
Tradinghouse | | 1 | | 9,812 | | 13,316 |
Tradinghouse | | 2 | | 9,812 | | 13,316 |
Valley | | 1 | | 10,430 | | 32,426 |
Valley | | 2 | | 9,812 | | 13,316 |
Valley | | 3 | | 10,430 | | 32,426 |
Trinidad | | 6 | | 10,430 | | 32,426 |
Sweetwater | | 4 | | 11,500 | | 12,000 |
Sweetwater CT | | 1 | | 11,500 | | 12,000 |
Sweetwater CT | | 2 | | 11,500 | | 12,000 |
Sweetwater CT | | 3 | | 11,500 | | 12,000 |
(R) Retired during 2004.
16
OPERATING STATISTICS – TXU POWER
Fuel Mix and Average Cost – Texas
For the years ended December 31, 2000 – 2004; Mixed measures
| | | | | | | | | | | | | | | |
Statistic
| | 2004
| | | 2003
| | | 2002
| | | 2001
| | | 2000
| |
Generation (MWh) | | | | | | | | | | | | | | | |
Nuclear | | 19,052,643 | | | 17,749,343 | | | 16,579,084 | | | 18,322,265 | | | 18,487,842 | |
Lignite/Coal | | 44,116,439 | | | 43,240,756 | | | 39,817,056 | | | 39,506,193 | | | 40,993,945 | |
Gas/Oil | | 4,673,910 | | | 13,098,982 | | | 18,733,486 | | | 24,371,090 | | | 32,102,173 | |
Gas/Oil Divested | | — | | | — | | | 854,232 | | | 3,626,265 | | | 5,292,578 | |
| | | | | |
Total | | 67,842,992 | | | 74,089,081 | | | 75,983,858 | | | 85,825,813 | | | 96,876,538 | |
Generation Mix (%) | | | | | | | | | | | | | | | |
Nuclear | | 28 | % | | 24 | % | | 22 | % | | 21 | % | | 19 | % |
Lignite/Coal | | 65 | % | | 58 | % | | 52 | % | | 46 | % | | 42 | % |
Gas/Oil | | 7 | % | | 18 | % | | 26 | % | | 33 | % | | 39 | % |
| | | | | |
Total | | 100 | % | | 100 | % | | 100 | % | | 100 | % | | 100 | % |
Fuel Cost ($000)1 | | | | | | | | | | | | | | | |
Nuclear | | 81,748 | | | 79,503 | | | 76,365 | | | 88,796 | | | 99,151 | |
Lignite/Coal | | 548,650 | | | 517,470 | | | 482,811 | | | 543,498 | | | 464,558 | |
| | | | | |
Total Base Load | | 630,398 | | | 596,973 | | | 559,176 | | | 632,294 | | | 563,709 | |
Average Fuel Cost ($/MWh)1 | | | | | | | | | | | | | | | |
Nuclear | | 4.29 | | | 4.48 | | | 4.61 | | | 4.85 | | | 5.36 | |
Lignite/Coal | | 12.43 | | | 11.97 | | | 12.13 | | | 13.76 | | | 11.33 | |
Total Base Load | | 9.98 | | | 9.79 | | | 9.92 | | | 10.93 | | | 9.48 | |
| 1 | Based on settled volumes, which exclude company use and sales to Alcoa. Includes depreciation and amortization of lignite mining plant and equipment and related asset retirement obligations which are reported as depreciation and amortization expense but are part of overall fuel costs. |
17
OPERATING STATISTICS – TXU POWER
O&M/SG&A
For the years ended December 31, 2000 – 2004; $ thousands
| | | | | | | | | | |
Plant Type
| | 2004
| | 2003
| | 2002
| | 2001
| | 2000
|
Nuclear | | 235,786 | | 213,725 | | 236,305 | | 194,300 | | 208,571 |
Lignite/Coal | | 208,805 | | 218,272 | | 195,458 | | 163,925 | | 146,978 |
Gas/Oil | | 92,070 | | 111,283 | | 105,904 | | 120,016 | | 125,123 |
Other | | 143,049 | | 57,773 | | 98,973 | | 133,359 | | 103,223 |
Total | | 679,710 | | 601,053 | | 636,640 | | 611,600 | | 583,895 |
Depreciation Rates
For the years ended December 31, 2000 – 2004, except as noted; %
| | | | | | | | | | | | |
Plant Type
| | 2004
| | Apr-Dec 2003
| | Jan -
Mar 2003
| | 2002
| | 2001
| | 2000
|
Nuclear | | 1.70 | | 1.83 | | 2.51 | | 2.51 | | 2.51 | | 2.51 |
Lignite/Coal | | 1.98 | | 2.97 | | 2.46 | | 2.46 | | 2.46 | | 2.46 |
Gas/Oil | | 2.31 | | 2.31 | | 2.00 | | 2.00 | | 2.00 | | 2.00 |
Net Heat Rate
For the years ended December 31, 2000 – 2004; Btu/kWh
| | | | | | | | | | |
Plant Type
| | 2004
| | 2003
| | 2002
| | 2001
| | 2000
|
Nuclear | | 10,280 | | 10,399 | | 10,470 | | 9,983 | | 10,401 |
Lignite/Coal | | 11,237 | | 11,220 | | 11,192 | | 11,216 | | 11,119 |
Gas/Oil | | 12,040 | | 11,201 | | 10,998 | | 10,698 | | 10,715 |
Outage Management (Base Load)
For the years ended December 31, 2000 – 2004; TWh
| | | | | | | | | | |
Category
| | 2004
| | 2003
| | 2002
| | 2001
| | 2000
|
Total | | | | | | | | | | |
Planned | | 3.8 | | 3.3 | | 5.1 | | 3.1 | | 3.3 |
Unplanned | | 3.5 | | 5.6 | | 6.6 | | 6.8 | | 4.6 |
Total | | 7.3 | | 8.9 | | 11.7 | | 9.9 | | 7.9 |
Nuclear | | | | | | | | | | |
Planned | | 1.1 | | 0.7 | | 2.2 | | 0.8 | | 1.0 |
Unplanned | | 0.1 | | 1.1 | | 0.6 | | 0.4 | | 0.0 |
Total | | 1.2 | | 1.8 | | 2.8 | | 1.2 | | 1.0 |
Lignite/Coal | | | | | | | | | | |
Planned | | 2.7 | | 2.6 | | 2.9 | | 2.3 | | 2.3 |
Unplanned | | 3.4 | | 4.5 | | 6.0 | | 6.4 | | 4.6 |
Total | | 6.1 | | 7.1 | | 8.9 | | 8.7 | | 6.9 |
18
OPERATING STATISTICS – TXU ENERGY – WHOLESALE MARKETS
Wholesale Markets optimizes the value of the TXU Energy Holdings portfolio by balancing customer demand for energy with the supply of energy in an economically efficient and effective manner. This effort includes hedging and risk management as well as other value creation activities. Retail and wholesale demand has generally been greater than volumes that can be supplied by the base load (nuclear and lignite/coal-fired) production; however, the supply demand relationship will evolve over time as market fundamentals and the retail competitive landscape change. The wholesale markets operation acts to provide additional supply balancing through the gas/oil-fired generation assets or purchases of power. These operations manage the commodity volume and price risks inherent in TXU Energy Holdings’ generation and sales operations through supply structuring, pricing and hedging activities, including hedging both future power sales and purchases of fuel supplies for the generation plants. These operations are also responsible for the efficient dispatch of power from the generation plants.
Commodity Market Prices
For periods ended 2002 – 2004; Mixed measures
| | | | | | | | | | | | | | | | | | | | |
| | | | | | | Power Prices (MWD)1
| | Heat Rates
|
| | | | | NYMEX (GDD)2
| | 5 X 16
| | 5 X 8
| | 7 X 24
| | 5 X 16
| | 5 X 8
| | 7 X 24
|
2004 | | Q1 | | $ | 5.612 | | $ | 39.862 | | $ | 28.727 | | $ | 34.197 | | 7.115 | | 5.119 | | 6.098 |
| | | Q2 | | $ | 6.085 | | $ | 48.496 | | $ | 34.037 | | $ | 41.134 | | 7.963 | | 5.559 | | 6.760 |
| | | Q3 | | $ | 5.450 | | $ | 47.530 | | $ | 31.451 | | $ | 39.374 | | 8.714 | | 5.762 | | 7.217 |
| | | Q4 | | $ | 6.254 | | $ | 48.907 | | $ | 31.592 | | $ | 40.124 | | 7.802 | | 5.003 | | 6.382 |
| | | | |
|
| |
|
| |
|
| |
|
| |
| |
| |
|
| | | Total 2004 | | $ | 5.850 | | $ | 46.210 | | $ | 31.455 | | $ | 38.707 | | 7.901 | | 5.371 | | 6.614 |
| | | | |
|
| |
|
| |
|
| |
|
| |
| |
| |
|
2003 | | Q1 | | $ | 5.878 | | $ | 52.796 | | $ | 37.348 | | $ | 45.781 | | 8.982 | | 6.354 | | 7.789 |
| | | Q2 | | $ | 5.738 | | $ | 51.098 | | $ | 31.964 | | $ | 44.224 | | 8.905 | | 5.571 | | 7.707 |
| | | Q3 | | $ | 4.897 | | $ | 42.873 | | $ | 28.794 | | $ | 36.913 | | 8.755 | | 5.880 | | 7.538 |
| | | Q4 | | $ | 5.498 | | $ | 38.535 | | $ | 24.695 | | $ | 34.368 | | 7.009 | | 4.491 | | 6.251 |
| | | | |
|
| |
|
| |
|
| |
|
| |
| |
| |
|
| | | Total 2003 | | $ | 5.503 | | $ | 46.326 | | $ | 30.700 | | $ | 40.322 | | 8.413 | | 5.574 | | 7.321 |
| | | | |
|
| |
|
| |
|
| |
|
| |
| |
| |
|
2002 | | Q1 | | $ | 2.491 | | $ | 21.448 | | $ | 14.158 | | $ | 18.880 | | 8.611 | | 5.684 | | 7.580 |
| | | Q2 | | $ | 3.405 | | $ | 29.885 | | $ | 15.145 | | $ | 24.499 | | 8.777 | | 4.448 | | 7.195 |
| | | Q3 | | $ | 3.192 | | $ | 30.072 | | $ | 18.031 | | $ | 25.803 | | 9.422 | | 5.650 | | 8.085 |
| | | Q4 | | $ | 4.325 | | $ | 34.796 | | $ | 22.449 | | $ | 30.308 | | 8.046 | | 5.191 | | 7.008 |
| | | | |
|
| |
|
| |
|
| |
|
| |
| |
| |
|
| | | Total 2002 | | $ | 3.353 | | $ | 29.050 | | $ | 17.446 | | $ | 24.872 | | 8.714 | | 5.243 | | 7.467 |
| | | | |
|
| |
|
| |
|
| |
|
| |
| |
| |
|
| 1 | Power Prices are the Megawatt Daily non zonal ERCOT day ahead cash prices in $/MWh. |
| 2 | NYMEX gas price is the Gas Daily data for day ahead prices in the cash month in $/MMBtu. |
19
OPERATING STATISTICS – TXU ENERGY
Selected Credit Statistics for Wholesale Sales1
As of December 31, 2002 – 2004; $ millions, %
| | | | | | | | | | | | |
Statistic
| | 2004
| | | 2003
| | | 2002
| |
Gross Credit Exposure (Net of Collateral) | | $ | 600 | | | $ | 740 | | | $ | 866 | |
Investment Grade Credit Exposure (Net of Collateral) | | | | | | | | | | | | |
Less than 2 years | | $ | 317 | | | $ | 424 | | | $ | 624 | |
2 - 5 years | | | 86 | | | | 119 | | | | 22 | |
Greater than 5 years | | | 77 | | | | 119 | | | | 4 | |
| | |
|
|
| |
|
|
| |
|
|
|
Total | | $ | 480 | | | $ | 662 | | | $ | 650 | |
| | |
|
|
| |
|
|
| |
|
|
|
Non Investment Grade Credit Exposure (Net of Collateral) | | | | | | | | | | | | |
Less than 2 years | | $ | 79 | | | $ | 50 | | | $ | 195 | |
2 - 5 years | | | 22 | | | | 14 | | | | 21 | |
Greater than 5 years | | | 19 | | | | 14 | | | | 0.3 | |
| | |
|
|
| |
|
|
| |
|
|
|
Total | | $ | 120 | | | $ | 78 | | | $ | 216 | |
| | |
|
|
| |
|
|
| |
|
|
|
% Investment Grade (Net of Collateral) | | | 80 | % | | | 89 | % | | | 75 | % |
% Non Investment Grade (Net of Collateral) | | | 20 | % | | | 11 | % | | | 25 | % |
| | |
|
|
| |
|
|
| |
|
|
|
Total | | | 100 | % | | | 100 | % | | | 100 | % |
| | |
|
|
| |
|
|
| |
|
|
|
Credit Exposure Maturities (Net of Collateral) | | | | | | | | | | | | |
Less than 2 years | | | 66 | % | | | 64 | % | | | 94 | % |
2 - 5 years | | | 18 | % | | | 18 | % | | | 5 | % |
Greater than 5 years | | | 16 | % | | | 18 | % | | | 1 | % |
| | |
|
|
| |
|
|
| |
|
|
|
Total | | | 100 | % | | | 100 | % | | | 100 | % |
| | |
|
|
| |
|
|
| |
|
|
|
Selected Credit Statistics For Large Business Retail Sales1
As of December 31, 2002 – 2004; $ millions, %
| | | | | | | | | | | | |
Statistic
| | 2004
| | | 2003
| | | 2002
| |
Gross Credit Exposure (Net of Collateral) | | $ | 184 | | | $ | 226 | | | $ | 319 | |
Investment Grade Credit Exposure | | | | | | | | | | | | |
(Net of Collateral) | | | | | | | | | | | | |
Less than 2 years | | $ | 148 | | | $ | 155 | | | $ | 139 | |
2 - 5 years | | | 3 | | | | 10 | | | | 28 | |
Greater than 5 years | | | 0 | | | | 0 | | | | 0 | |
| | |
|
|
| |
|
|
| |
|
|
|
Total | | $ | 151 | | | $ | 165 | | | $ | 167 | |
| | |
|
|
| |
|
|
| |
|
|
|
Non Investment Grade Exposure (Net of Collateral) | | | | | | | | | | | | |
Less than 2 years | | $ | 33 | | | $ | 57 | | | $ | 152 | |
2 - 5 years | | | 0 | | | | 4 | | | | 0 | |
Greater than 5 years | | | 0 | | | | 0 | | | | 0 | |
| | |
|
|
| |
|
|
| |
|
|
|
Total | | $ | 33 | | | $ | 61 | | | $ | 152 | |
| | |
|
|
| |
|
|
| |
|
|
|
% Investment Grade | | | 82 | % | | | 73 | % | | | 52 | % |
% Non Investment | | | 18 | % | | | 27 | % | | | 48 | % |
| | |
|
|
| |
|
|
| |
|
|
|
Total | | | 100 | % | | | 100 | % | | | 100 | % |
| | |
|
|
| |
|
|
| |
|
|
|
Credit Exposure Maturities (Net of Collateral) | | | | | | | | | | | | |
Less than 2 years | | | 98 | % | | | 94 | % | | | 91 | % |
2 - 5 years | | | 2 | % | | | 6 | % | | | 9 | % |
Greater than 5 years | | | 0 | % | | | 0 | % | | | 0 | % |
| | |
|
|
| |
|
|
| |
|
|
|
Total | | | 100 | % | | | 100 | % | | | 100 | % |
| | |
|
|
| |
|
|
| |
|
|
|
| 1 | The tables shown above present the distribution of credit exposure for trade accounts receivable from large business customers, commodity contract assets and other derivative assets that arise primarily from hedging activities. |
20
OPERATING STATISTICS – TXU ENERGY
Financial and Operating Data
For the years ended December 31, 2002 – 2004; Mixed measures
| | | | | | | | | | | | |
Statistic
| | 2004
| | | 2003
| | | 2002
| |
Electric Operating Revenues ($ millions) | | | | | | | | | | | | |
Residential | | $ | 3,462 | | | $ | 3,311 | | | $ | 3,108 | |
Small Business | | | 1,137 | | | | 1,238 | | | | 1,330 | |
Large Business | | | 1,771 | | | | 1,935 | | | | 2,085 | |
| | |
|
|
| |
|
|
| |
|
|
|
Total | | $ | 6,370 | | | $ | 6,484 | | | $ | 6,523 | |
| | |
|
|
| |
|
|
| |
|
|
|
Electric Energy Sales (GWh) | | | | | | | | | | | | |
Residential | | | 33,986 | | | | 35,981 | | | | 37,692 | |
Small Business | | | 10,839 | | | | 12,986 | | | | 15,907 | |
Large Business | | | 25,466 | | | | 30,955 | | | | 36,982 | |
| | |
|
|
| |
|
|
| |
|
|
|
Total | | | 70,291 | | | | 79,922 | | | | 90,581 | |
| | |
|
|
| |
|
|
| |
|
|
|
Number of Electric Customers (thousands of meters) | | | | | | | | | | | | |
Native Market: | | | | | | | | | | | | |
Residential | | | 1,951 | | | | 2,059 | | | | 2,204 | |
Small Business | | | 309 | | | | 316 | | | | 328 | |
| | |
|
|
| |
|
|
| |
|
|
|
Total Native Market | | | 2,260 | | | | 2,375 | | | | 2,532 | |
| | |
|
|
| |
|
|
| |
|
|
|
Other Markets: | | | | | | | | | | | | |
Residential | | | 194 | | | | 148 | | | | 98 | |
Small Business | | | 6 | | | | 5 | | | | 5 | |
| | |
|
|
| |
|
|
| |
|
|
|
Total Other Markets | | | 200 | | | | 153 | | | | 103 | |
| | |
|
|
| |
|
|
| |
|
|
|
Large Business | | | 76 | | | | 69 | | | | 78 | |
| | |
|
|
| |
|
|
| |
|
|
|
Total Electric Customers | | | 2,536 | | | | 2,597 | | | | 2,713 | |
| | |
|
|
| |
|
|
| |
|
|
|
Net Customer Change | | | | | | | | | | | | |
Native Market | | | (4.8 | )% | | | (6.2 | )% | | | (3.5 | )% |
Other Markets | | | 30.7 | % | | | 48.5 | % | | | 1,473 | % |
| | | |
Call Center Metrics | | | | | | | | | | | | |
Answer Speed (seconds) | | | 39 | | | | 268 | | | | 93 | |
Abandoned Calls | | | 4 | % | | | 26 | % | | | 11 | % |
Credit and Collection Metrics | | | | | | | | | | | | |
| | | |
Average Receivables ($ millions) | | | | | | | | | | | | |
Less than 30 days | | | 262.4 | | | | 302.7 | | | | 341.7 | |
30-60 days | | | 37.1 | | | | 55.9 | | | | 88.3 | |
60-90 days | | | 8.8 | | | | 19.5 | | | | 55.2 | |
Greater than 90 days | | | 8.2 | | | | 24.7 | | | | 78.4 | |
| | | |
Bad Debt Expense ($ millions) | | | 94.6 | | | | 120.5 | | | | 118.4 | |
Bad Debt as % of Total Revenues | | | 1.49 | % | | | 1.84 | % | | | 1.80 | % |
21
OPERATING STATISTICS – TXU ENERGY
Price to Beat and Gas Component Information – Residential
| | | | | | | | | | | | | | | | | |
Affiliate REP
| | Docket
No.
| | | Effective
| | Gas Price As Filed
| | Gas Price Increase
| | | Months
| | Fuel Factor
| | Average Price1 (¢/kWh)
|
TXU | | 24040 | | | 01/01/2002 | | $ | 3.111 | | — | | | — | | — | | 8.26 |
| | | 25802 | | | 08/27/2002 | | $ | 3.619 | | 16.3 | % | | All | | 2.8935 | | 8.66 |
| | | 27281 | | | 03/11/2003 | | $ | 4.910 | | 35.7 | % | | All | | 3.9265 | | 9.69 |
| | | 28191 | | | 08/22/2003 | | $ | 5.362 | | 9.2 | % | | All | | 4.2877 | | 10.06 |
| | | 29516 | | | 05/20/2004 | | $ | 5.785 | | 7.9 | % | | All | | 4.6264 | | 10.39 |
| | | 29837 | | | 08/04/2004 | | $ | 6.517 | | 12.7 | % | | All | | 5.2140 | | 10.98 |
| | | 31004 | | | 05/12/2005 | | $ | 7.872 | | 20.8 | % | | All | | 6.2985 | | 12.07 |
First Choice | | 24194 | | | 01/01/2002 | | $ | 3.111 | | — | | | — | | — | | 8.66 |
| | | 25885 | | | 08/27/2002 | | $ | 3.817 | | 22.7 | % | | All | | 2.67396 | | 9.15 |
| | | 27167 | | | 02/04/2002 | | $ | 4.526 | | 18.6 | % | | All | | 3.17085 | | 9.65 |
| | | 27390 | | | 03/27/2003 | | $ | 5.166 | | 14.1 | % | | All | | 3.61921 | | 10.10 |
| | | 27511 | | | 04/22/2003 | | $ | 5.958 | | 15.3 | % | | All | | 4.17403 | | 10.65 |
| | | 29800 | | | 07/07/2004 | | $ | 6.454 | | 8.32 | % | | All | | 4.52131 | | 11.00 |
| | | 30375 | | | 12/21/2004 | | $ | 7.450 | | 15.4 | % | | All | | 5.21895 | | 11.70 |
| | | 30999 | | | 05/12/2005 | | $ | 7.845 | | 5.3 | % | | All | | 5.49555 | | 11.98 |
Mutual Energy - CPL | | 24195 | | | 01/01/2002 | | $ | 3.111 | | — | | | — | | — | | 8.88 |
| | | 25873 | | | 08/27/2002 | | $ | 3.795 | | 22.0 | % | | Mar-Jun
Jul-Oct
Nov-Feb | | 4.2908
3.9793
3.3763 | | 9.52 |
| | | 27376 | | | 03/25/2003 | | $ | 5.123 | | 35.0 | % | | Mar-Jun
Jul-Oct
Nov-Feb | | 5.7926
5.3721
4.5580 | | 10.93 |
| | | 29293 | | | 03/16/2004 | | $ | 5.586 | | 9.0 | % | | Mar-Jun
Jul-Oct
Nov-Feb | | 6.3139
5.8556
4.9682 | | 11.42 |
| | | 29845 | | | 08/10/2004 | | $ | 6.517 | | 16.7 | % | | Mar-Jun
Jul-Oct
Nov-Feb | | 7.3683
6.8335
5.7979 | | 12.41 |
| | | 30966 | | | 05/03/2005 | | $ | 7.603 | | 16.7 | % | | Mar-Jun
Jul-Oct
Nov-Feb | | 8.5988
7.9747
6.7661 | | 13.56 |
Mutual Energy - WTU | | 24335 | | | 01/01/2002 | | $ | 3.111 | | — | | | — | | — | | 8.90 |
| | | 25874 | | | 08/27/2002 | | $ | 3.795 | | 22.0 | % | | Dec-Feb
Mar-May
Jun-Aug
Sep-Nov | | 3.9894
6.0140
4.9507
3.8627 | | 9.71 |
| | | 27377 | | | 03/25/2003 | | $ | 5.123 | | 35.0 | % | | Dec-Feb
Mar-May
Jun-Aug
Sep-Nov | | 5.3857
8.1189
6.6834
5.2146 | | 11.34 |
| | | 29292 | | | 03/16/2004 | | $ | 5.586 | | 9.0 | % | | Dec-Feb
Mar-May
Jun-Aug
Sep-Nov | | 5.8704
8.8496
7.2849
5.6839 | | 11.91 |
| | | 29845 | | | 08/10/2004 | | $ | 6.517 | | 16.7 | % | | Dec-Feb
Mar-May
Jun-Aug
Sep-Nov | | 6.8508
10.3275
8.5015
6.6331 | | 13.46 |
Reliant | | 23950 | | | 01/01/2002 | | $ | 3.111 | | — | | | — | | — | | 8.62 |
| | | 25840 | | | 08/27/2002 | | $ | 3.729 | | 19.9 | % | | All | | 3.0377 | | 9.12 |
| | | 26933 | | | 12/20/2002 | | $ | 4.017 | | 7.7 | % | | All | | 3.2716 | | 9.35 |
| | | 27320 | | | 03/11/2003 | | $ | 4.956 | | 23.4 | % | | All | | 4.0372 | | 10.12 |
| | | 27956 | | | 07/26/2003 | | $ | 6.100 | | 23.1 | % | | All | | 4.9698 | | 11.05 |
| | | 30378 | | | 12/21/2004 | | $ | 7.500 | | 23.0 | % | | All | | 6.1079 | | 12.19 |
| | | 30774 | 2 | | 050/2/2005 | | $ | 7.500 | | N/A | | | All | | 6.1079 | | 12.80 |
| 1 | Average price calculated based on 1000 KWh/month. |
| 2 | Increase due to elimination of EMC credit and addition of transition charge reflected in an increased base rate. |
22
OPERATING STATISTICS – TXU ENERGY
Native Market Price Comparison1
Various dates; ¢/kWh
| | | | | | | | | | |
Retail Electric Provider
| | 06/01/05
| | 12/31/04
| | 12/31/03
| | 06/03/03
| | 12/31/02
|
TXU – PTB | | 12.07 | | 10.98 | | 10.06 | | 9.69 | | 8.66 |
Reliant | | 11.58 | | 10.21 | | 9.05 | | 8.73 | | 8.23 |
Direct Energy | | 10.10 | | 10.10 | | 9.60 | | 9.28 | | 8.48 |
First Choice (TNMP) | | 10.80 | | 10.80 | | 10.75 | | 10.75 | | 8.20 |
Entergy Solutions | | 10.80 | | 10.50 | | 8.80 | | 8.60 | | 8.15 |
Green Mountain (Pollution Free) | | 10.99 | | 10.99 | | 10.66 | | 10.30 | | 9.00 |
| 1 | Rates calculated for residential customer using 12,000 KWh/year. |
23
OPERATING STATISTICS – TXU ENERGY HOLDINGS SEGMENT
Financial and Operating Data
For the years ended December 31, 2002 – 2004; Mixed measures
| | | | | | | | | | | | |
Statistic
| | 2004
| | | 2003
| | | 20021
| |
Operating Statistics – Volumes | | | | | | | | | | | | |
| | | |
Retail Electricity (GWh) | | | | | | | | | | | | |
Residential | | | 33,986 | | | | 35,981 | | | | 37,692 | |
Small Business2 | | | 10,839 | | | | 12,986 | | | | 15,907 | |
Large Business and Other | | | 25,466 | | | | 30,955 | | | | 36,982 | |
| | |
|
|
| |
|
|
| |
|
|
|
Total Retail Electricity | | | 70,291 | | | | 79,922 | | | | 90,581 | |
| | |
|
|
| |
|
|
| |
|
|
|
Wholesale Electricity (GWh) | | | 48,309 | | | | 36,809 | | | | 29,649 | |
| | |
|
|
| |
|
|
| |
|
|
|
Production and Purchased Power (GWh) | | | | | | | | | | | | |
Nuclear and Lignite/Coal (Base Load) | | | 61,318 | | | | 59,028 | | | | 54,738 | |
Gas/Oil and Purchased Power | | | 60,733 | | | | 63,165 | | | | 70,118 | |
| | |
|
|
| |
|
|
| |
|
|
|
Total Production and Purchased Power | | | 122,051 | | | | 122,193 | | | | 124,856 | |
| | |
|
|
| |
|
|
| |
|
|
|
Customer Counts | | | | | | | | | | | | |
| | | |
Retail Electricity Customers (end of period and in thousands – based on number of meters): | | | | | | | | | | | | |
Residential | | | 2,145 | | | | 2,207 | | | | 2,302 | |
Small Business | | | 315 | | | | 321 | | | | 333 | |
Large Business and Other | | | 76 | | | | 69 | | | | 78 | |
| | |
|
|
| |
|
|
| |
|
|
|
Total Retail Electricity Customers | | | 2,536 | | | | 2,597 | | | | 2,713 | |
| | |
|
|
| |
|
|
| |
|
|
|
Operating Revenues ($ millions) | | | | | | | | | | | | |
| | | |
Retail Electricity Revenues | | | | | | | | | | | | |
Residential | | $ | 3,462 | | | $ | 3,311 | | | $ | 3,108 | |
Business and Other | | | 2,908 | | | | 3,173 | | | | 3,415 | |
| | |
|
|
| |
|
|
| |
|
|
|
Total Retail Electricity Revenues | | | 6,370 | | | | 6,484 | | | | 6,523 | |
| | |
|
|
| |
|
|
| |
|
|
|
Wholesale Electricity Revenues | | | 1,886 | | | | 1,258 | | | | 841 | |
Hedging and Risk Management Activities | | | (103 | ) | | | 30 | | | | 147 | |
Other Revenues | | | 342 | | | | 214 | | | | 167 | |
| | |
|
|
| |
|
|
| |
|
|
|
Total Operating Revenues | | $ | 8,495 | | | $ | 7,986 | | | $ | 7,678 | |
| | |
|
|
| |
|
|
| |
|
|
|
Weather (Average for Service Territory) | | | | | | | | | | | | |
Percent of Normal: | | | | | | | | | | | | |
Cooling Degree Days | | | 89.9 | % | | | 95.7 | % | | | 99.8 | % |
Heating Degree Days | | | 89.2 | % | | | 98.1 | % | | | 102.0 | % |
| 1 | Adjusted from previous report due to reclassification of discontinued operations. |
| 2 | Customers with demand of less than 1MW annually |
24
ERCOT/TEXAS MARKET/REGULATORY HIGHLIGHTS
Electric Reliability Council of Texas (ERCOT)
The Electric Reliability Council of Texas is the Independent System Operator and the regional reliability coordinator of the various electricity systems in Texas. ERCOT is one of ten regional reliability councils in North America. As one of the largest control areas in the United States, the organization serves seven million customers and oversees the operation of over 78,000 megawatts of generation and 38,000 miles of transmission lines in Texas. ERCOT serves approximately 85 percent of the state’s electric load and 75 percent of the geographic land area in Texas.
| | | |
| | | 2004
| |
Market Peak Demand – Summer (MWs) | | 58,528 | |
Total Installed Capacity (MWs) | | 75,056 | |
Interconnection Capacity (MWs) | | 856 | |
Reserve Margin | | 28 | % |
Number of Competitive Customers (millions) | | 5.13 | |
| | | | |
| | | North Texas
| | South Texas
|
Usage Per Residential Customer (kWh) | | 1,326 | | 1,402 |
ERCOT Summer 2004 Fuel Types

25
ERCOT/TEXAS MARKET/REGULATORY HIGHLIGHTS
Transmission Congestion Management in ERCOT
Transmission congestion is the additional cost associated with operating generation in a less than perfect economic manner due to the reality of a less than perfect transmission system. There are two sides to congestion costs: the cost of additional transmission versus the cost of less-than-optimal generation dispatch. The desired result is to minimize combined cost.
When the Texas competitive retail electricity market opened in 2002, the method of dealing with transmission congestion was referred to as “zonal”. ERCOT is divided into zones for transmission purposes, and currently uses “zonal” congestion management. Zonal congestion involves competitive solutions between different regions within the state. A competitive solution exists when multiple owners of generation can compete to resolve the congestion problem by making offers to increase or decrease their generation output. Costs for relieving congestion between transmission zones are charged to the companies that schedule load.
Local congestion occurs within the zones. Typically, there are not enough generation owners in the area to compete to resolve the congestion. Costs to resolve local congestion within zones are shared by all companies on a proportional basis. The congestion costs shared by all consumers within zones totaled $210 million in 2002, $409 million in 2003 and $282 million in 2004.
The challenge for ERCOT is to balance this cost against the cost of additional transmission investment to relieve this congestion. As indicated by the reduction of congestion costs from 2003 to 2004, transmission companies are actively addressing local congestion in a cost-effective manner by adding new transmission facilities in those locations identified by high local congestion costs.
The Texas market is now considering adoption of a “nodal market design” for transmission congestion management. This method differs from the zonal model primarily in the level of granularity used in dealing with generators. The nodal market makes no distinction between zonal and local congestion. As directed by the Public Utility Commission of Texas (PUC), a cost-benefit study designed to assess the potential nodal market design against the current zonal market design was filed with the PUC on December 21, 2004. The results of this study indicate that under the current assumptions regarding nodal market operation, changing to a nodal market in ERCOT should result in a net benefit of approximately $1 billion to ERCOT customers as a whole, although impacts will vary across the state. As with any estimate, its results should be considered as being within a range of possibilities, rather than the one definitive outcome. When comparing the 2003 actual operation of the zonal market to a 2003 optimal operation of the zonal market, TXU believes that as much as half of the $1 billion cost reduction indicated in the cost-benefit analysis has already been achieved by market participants through more disciplined commitment and dispatch versus from the market design change. Much of the recent mothballing of existing generating capacity has been further evidence of this. Additionally, a set of Protocols to implement this new nodal market design was filed with the PUC on March 18, 2005. It is expected that the PUC will make a decision regarding the Texas Nodal Market design by the third quarter of 2005.
ERCOT Congestion Zones

26
ERCOT/TEXAS MARKET/REGULATORY HIGHLIGHTS
Market Rules Overview
| | | | |
Rule
| | Definition
| | Impact to TXU
|
| Price to Beat | | TXU Energy may not charge rates to those customers that are different from the price to beat rates until the earlier of: (a) January 1, 2005 or (b) Until 40% of the electric power consumed by customers in those respective customer classes is supplied by competing REPs Thereafter, TXU Energy may offer rates different from the price-to-beat to customers in that class, but must also continue to make the price-to-beat rate available for residential and small business customers until January 1, 2007. | | In December 2003, TXU Energy met the 40% requirement to be allowed to offer alternatives to the price-to-beat rate for small business customers in the native market. |
| | |
| PTB Fuel Factor Adjustment | | Twice per year, affiliated REPs may request that the PUC adjust the fuel factor component of the price-to-beat rate based on changes in the market price of natural gas. Under amended rules, a request for a change in the fuel factor can be petitioned if natural gas futures move more than 5% (10% if the petition is filed after November 15 of any year) from the level used to set the existing price-to-beat fuel factor rate. | | Subsequent to PUC approval, TXU Energy has exercised its right to increase the fuel factor components of its price-to-beat rates in August 2002, March and August 2003, May and August 2004, and May 2005. |
| | |
| Unregulated Pricing on ERCOT Wholesale Power Transactions | | Power generation companies affiliated with electric delivery utilities may charge unregulated prices in connection with ERCOT wholesale power transactions. | | |
| | |
| Provider of Last Resort (POLR) | | Under the POLR framework, the POLR provides electric service only to customers who request POLR service, whose selected REP goes out of business, or who are transferred to the POLR by other REPs for reasons other than non-payment. | | TXU Energy did not bid to be the POLR, but was designated POLR through lottery for residential and small business customers in certain West Texas service areas and for small business customers in the Houston service area. TXU Energy’s obligation to serve as POLR in those areas ceased on December 31, 2004. However, the REPs selected by the Commission to assume the POLR obligation in those areas on January 1, 2005 initially objected to that selection. To ensure continuity of POLR service, TXU Energy voluntarily agreed to continue providing POLR service in those areas until March 31, 2005, at which time Energy’s POLR obligations ceased. Under the current rule, the Commission will use a competitive bid process in late 2006 to determine POLR providers for 2007 and 2008. |
27
ERCOT/TEXAS MARKET/REGULATORY HIGHLIGHTS
Summary of Settlement Plan1
| | |
Major Element
| | Description
|
| Excess Mitigation Credit | | Over the two year period ended December 21, 2003, TXU Electric Delivery implemented a stranded cost excess mitigation credit in the amount of $389 million, plus $26 million in interest, applied as a reduction to delivery rates charged to all REPs, including TXU Energy. |
| |
| Regulatory Asset Securitization | | TXU US Holdings received a financing order authorizing the issuance of securitization bonds up to $1.3 billion to recover regulatory asset stranded costs and other qualified costs. TXU Electric Delivery, through its bankruptcy remote financing subsidiary, issued an initial $500 million of securitization bonds in August 2003 and the remaining $790 million in June 2004. The principal and interest on the bonds is recoverable through a delivery fee surcharge to all REPs, including TXU Energy. |
| |
| Retail Clawback Credit | | A retail clawback credit related to residential customers was implemented in January 2004. The amount of the credit is equal to the number of residential customers retained by TXU Energy in the native market on January 1, 2004, less the number of new residential customers TXU Energy has added outside of the native market as of January 1, 2004 multiplied by $90. The estimated credit of $161 million will be applied to residential delivery rates charged by TXU Electric Delivery to all REPs, including TXU Energy over the period from 2004 through 2005. |
| |
| Stranded Costs and Fuel Cost Recovery | | TXU Energy’s stranded costs, not including regulatory assets, are fixed at zero. The Company will not seek to recover its unrecovered fuel costs which existed at December 31, 2001 nor pursue a final fuel cost reconciliation which would have covered the period from July 1998 until the beginning of competition in January 2002. |
| 1 | For detailed information related to various regulatory proceedings in which TXU is or has recently been involved, please see our Annual Reports filed with the SEC on Form 10-K or our most recent Quarterly Reports filed with the SEC on Form 10-Q. |
28
ERCOT/TEXAS MARKET/REGULATORY HIGHLIGHTS
Public Utility Commission of Texas
1701 N. Congress Avenue
P.O. Box 13326
Austin, Texas 78711-3326
(512) 936-7000
The PUC of Texas is responsible for:
| | • | | Ensuring that Texans have access to high-quality competitive alternatives for electric service |
| | • | | Providing exemplary customer service in disseminating educational information, assisting customers to resolve disputes concerning electric service and ensuring compliance with relevant law and regulations |
| | • | | Implementing the Public Utility Regulatory Act in a way that observes the letter and captures the spirit of the legislative directives |
| | • | | Resolving contested matters efficiently, emphasizing collaboration and consensus |
The Commission consists of three members appointed by the Governor and confirmed by the state senate for six-year staggered terms of office. A chairperson is designated by the Governor.
| | | | |
Commissioner
| | Term Expires
| | Background
|
| Paul Hudson (Chair) | | September 2009 | | Previously, Director of Policy for the Office of the Governor; a bachelor’s degree from University of Texas and a master’s degree from Arizona State University |
| | |
| Julie Parsley | | September 2005 | | Previously, Solicitor General of Texas in the Office of the Attorney General; a graduate of Texas A&M with law degree from Texas Tech University School of Law |
| | |
| Barry T. Smitherman | | September 2007 | | Previously, served as Harris County Assistant District Attorney; a graduate of Texas A&M with law degree from University of Texas School of Law and master’s degree from Harvard University |
29
SCHEDULE OF LONG-TERM DEBT
As of December 31, 2004; $ millions
| | | | | | | | | | | | | | | | | | | | | | | |
Issue
| | Year
Due
| | Fixed/ Floating
| | 2005
| | 2006
| | 2007
| | 2008
| | 2009 & Beyond
| | | Total
| | | Date of
Next
Redemption
| | | Next
Redemption Price
|
TXU Corp. | | | | | | | | | | | | | | | | | | | | | | | |
Senior Notes | | | | | | | | | | | | | | | | | | | | | | | |
Series C, 6.375% (a) | | 2008 | | Fixed | | | | | | | | 200 | | | | | 200 | | | 01/01/08 | | | 100.00 |
Series J, 6.375% (a) | | 2006 | | Fixed | | | | 683 | | | | | | | | | 683 | | | (b) | | | T+20 |
Series K, 4.446% | | 2006 | | Fixed | | | | 50 | | | | | | | | | 50 | | | | | | |
Series L, 5.45% (c) | | 2007 | | Fixed | | | | | | 101 | | | | | | | 101 | | | | | | |
Series M, 5.80% (c) | | 2008 | | Fixed | | | | | | | | 184 | | | | | 184 | | | | | | |
Series O, 4.80% (a) | | 2009 | | Fixed | | | | | | | | | | 1,000 | | | 1,000 | | | (b) | | | T+25 |
Series P, 5.55% | | 2014 | | Fixed | | | | | | | | | | 1,000 | | | 1,000 | | | (b) | | | T+30 |
Series Q, 6.50% (a) | | 2024 | | Fixed | | | | | | | | | | 750 | | | 750 | | | (b) | | | T+35 |
Series R, 6.55% | | 2034 | | Fixed | | | | | | | | | | 750 | | | 750 | | | (b) | | | T+35 |
Conv Senior Notes, 3.57% (e) | | 2033 | | Floating | | | | | | | | | | 25 | | | 25 | | | 07/15/08 | | | 100.00 |
Other | | | | | | | | | | | | | | | | | | | | | | | |
Building Financing, 8.820% | | 2022 | | Fixed | | 9 | | 9 | | 9 | | 9 | | 84 | | | 120 | | | | | | |
Unamortized Prem and Disc | | | | | | | | | | | | | | (11 | ) | | (11 | ) | | | | | |
| | | | | | |
| |
| |
| |
| |
|
| |
|
| | | | | |
Total TXU Corp. | | | | | | 9 | | 742 | | 110 | | 393 | | 3,598 | | | 4,852 | | | | | | |
| | | | | | |
| |
| |
| |
| |
|
| |
|
| | | | | |
TXU Energy Company LLC | | | | | | | | | | | | | | | | | | | | | | | |
Pollution Control Revenue Bonds(PCRBs) | | | | | | | | | | | | | | | | | | | | | | | |
Brazos River Authority: | | | | | | | | | | | | | | | | | | | | | | | |
3.00% Series 1994A (f) | | 2029 | | Fixed | | | | | | | | | | 39 | | | 39 | | | 05/01/05 | (g) | | 100.00 |
5.40% Series 1994B (f) | | 2029 | | Fixed | | | | | | | | | | 39 | | | 39 | | | 05/01/06 | (g) | | 100.00 |
5.40% Series 1995A (f) | | 2030 | | Fixed | | | | | | | | | | 50 | | | 50 | | | 05/01/06 | (g) | | 100.00 |
5.05% Series 1995B (f) | | 2030 | | Fixed | | | | | | | | | | 114 | | | 114 | | | 06/19/06 | (g) | | 100.00 |
7.70% Series 1999A | | 2033 | | Fixed | | | | | | | | | | 111 | | | 111 | | | 04/01/13 | | | 101.00 |
6.75% Series 1999B (f) | | 2034 | | Fixed | | | | | | | | | | 16 | | | 16 | | | 04/01/13 | (g) | | 100.00 |
7.70% Series 1999C | | 2032 | | Fixed | | | | | | | | | | 50 | | | 50 | | | 04/01/13 | | | 101.00 |
4.75% Series 2001B (f) | | 2029 | | Fixed | | | | | | | | | | 19 | | | 19 | | | 11/01/06 | (g) | | 100.00 |
5.75% Series 2001C (f) | | 2036 | | Fixed | | | | | | | | | | 217 | | | 217 | | | 11/01/11 | (g) | | 100.00 |
2.03% Series 2001D (h) | | 2033 | | Floating | | | | | | | | | | 268 | | | 268 | | | (b) | | | 100.00 |
2.45% Series 2001I (h) | | 2036 | | Floating | | | | | | | | | | 62 | | | 62 | | | (b) | | | 100.00 |
2.03% Series 2002A (h) | | 2037 | | Floating | | | | | | | | | | 45 | | | 45 | | | (b) | | | 100.00 |
6.75% Series 2003A (f) | | 2038 | | Fixed | | | | | | | | | | 44 | | | 44 | | | 04/01/13 | (g) | | 100.00 |
6.30% Series 2003B | | 2032 | | Fixed | | | | | | | | | | 39 | | | 39 | | | 07/01/13 | | | 101.00 |
6.75% Series 2003C | | 2038 | | Fixed | | | | | | | | | | 52 | | | 52 | | | 10/01/13 | | | 101.00 |
5.40% Series 2003D (f) | | 2029 | | Fixed | | | | | | | | | | 31 | | | 31 | | | 10/01/14 | (g) | | 100.00 |
Sabine River Authority: | | | | | | | | | | | | | | | | | | | | | | | |
6.45% Series 2000A | | 2021 | | Fixed | | | | | | | | | | 51 | | | 51 | | | 06/01/10 | | | 101.00 |
5.50% Series 2001A (f) | | 2022 | | Fixed | | | | | | | | | | 91 | | | 91 | | | 11/01/11 | (g) | | 100.00 |
5.75% Series 2001B (f) | | 2030 | | Fixed | | | | | | | | | | 107 | | | 107 | | | 11/01/11 | (g) | | 100.00 |
5.80% Series 2003A | | 2022 | | Fixed | | | | | | | | | | 12 | | | 12 | | | 07/01/13 | | | 101.00 |
6.15% Series 2003B | | 2022 | | Fixed | | | | | | | | | | 45 | | | 45 | | | 08/01/13 | | | 101.00 |
Trinity River Authority: | | | | | | | | | | | | | | | | | | | | | | | |
6.25% Series 2000A | | 2028 | | Fixed | | | | | | | | | | 14 | | | 14 | | | 05/01/13 | | | 101.00 |
5.00% Series 2001A (f) | | 2027 | | Fixed | | | | | | | | | | 37 | | | 37 | | | 11/01/06 | (g) | | 100.00 |
Total PCRBs | | | | | | — | | — | | — | | — | | 1,553 | | | 1,553 | | | | | | |
Senior Notes | | | | | | | | | | | | | | | | | | | | | | | |
6.875% Senior Notes – Mining | | 2005 | | Fixed | | 30 | | | | | | | | | | | 30 | | | (d) | | | |
6.125% Senior Notes (a) | | 2008 | | Fixed | | | | | | | | 250 | | | | | 250 | | | (b) | | | T+37.5 |
7.00% Senior Notes | | 2013 | | Fixed | | | | | | | | | | 1,000 | | | 1,000 | | | (b) | | | T+50 |
2.838% Senior Notes (e) | | 2006 | | Floating | | | | 400 | | | | | | | | | 400 | | | (b) | | | 100.00 |
| | | | | | | | | | |
Other | | | | | | | | | | | | | | | | | | | | | | | |
Capital Lease Obligations | | Various | | | | | | | | | | | | 9 | | | 9 | | | | | | |
Fair Value Adjustments – int. rate swaps - various | | | | | | | | | | 15 | | 15 | | | | | | | | | | | |
Unamortized Prem and Disc | | | | | | | | | | | | | | | | | | | | | | | |
| | | | | | |
| |
| |
| |
| |
|
| |
|
| | | | | |
Total TXU Energy Company LLC | | | | | | 30 | | 400 | | — | | 250 | | 2,577 | | | 3,257 | | | | | | |
| | | | | | |
| |
| |
| |
| |
|
| |
|
| | | | | |
TXU Electric Delivery | | | | | | | | | | | | | | | | | | | | | | | |
First Mortgage Bonds | | | | | | | | | | | | | | | | | | | | | | | |
6.75% due 7/01/05 | | 2005 | | Fixed | | 92 | | | | | | | | | | | 92 | | | (d) | | | 100.00 |
Senior Secured Notes | | | | | | | | | | | | | | | | | | | | | | | |
6.375% | | 2012 | | Fixed | | | | | | | | | | 700 | | | 700 | | | (b) | | | T+25 |
7.00% | | 2032 | | Fixed | | | | | | | | | | 500 | | | 500 | | | (b) | | | T+30 |
30
SCHEDULE OF LONG-TERM DEBT (CONT.)
As of December 31, 2004; $ millions
| | | | | | | | | | | | | | | | | | | | |
Issue
| | Year
Due
| | Fixed/ Floating
| | 2005
| | 2006
| | 2007
| | 2008
| | 2009 & Beyond
| | Total
| | Date of
Next
Redemption
| | Next
Redemption Price
|
TXU Electric Delivery | | | | | | | | | | | | | | | | | | | | |
6.375% (a) | | 2015 | | Fixed | | | | | | | | | | 500 | | 500 | | (b) | | T+30 |
7.25% | | 2033 | | Fixed | | | | | | | | | | 350 | | 350 | | (b) | | T+35 |
Debentures | | | | | | | | | | | | | | | | | | | | |
5.00% (a) | | 2007 | | Fixed | | | | | | 200 | | | | | | 200 | | (b) | | T+20 |
7.00% | | 2022 | | Fixed | | | | | | | | | | 800 | | 800 | | (b) | | T+30 |
Unamortized Prem and Disc | | | | | | | | | | | | | | 19 | | 19 | | | | |
| | | | | | |
| |
| |
| |
| |
| |
| | | | |
Sub-total | | | | | | 92 | | — | | 200 | | — | | 2,831 | | 3,123 | | | | |
| | | | | | |
| |
| |
| |
| |
| |
| | | | |
TXU Electric Delivery Transition Bond Company(i) | | | | | | | | | | | | | | | | | | | | |
2.26% Series 2003 | | 2007 | | Fixed | | | | | | 80 | | | | | | 80 | | (j) | | 100.00 |
4.03% Series 2003 | | 2010 | | Fixed | | | | | | | | | | 122 | | 122 | | (j) | | 100.00 |
4.95% Series 2003 | | 2013 | | Fixed | | | | | | | | | | 130 | | 130 | | (j) | | 100.00 |
5.42% Series 2003 | | 2015 | | Fixed | | | | | | | | | | 145 | | 145 | | (j) | | 100.00 |
3.52% Series 2004 | | 2009 | | Fixed | | | | | | | | | | 270 | | 270 | | (d) | | |
4.81% Series 2004 | | 2012 | | Fixed | | | | | | | | | | 221 | | 221 | | (d) | | |
5.29% Series 2004 | | 2016 | | Fixed | | | | | | | | | | 290 | | 290 | | (d) | | |
| | | | | | |
| |
| |
| |
| |
| |
| | | | |
Sub-total | | | | | | — | | — | | 80 | | — | | 1,178 | | 1,258 | | | | |
| | | | | | |
| |
| |
| |
| |
| |
| | | | |
Total TXU Electric Delivery | | | | | | 92 | | — | | 280 | | — | | 4,009 | | 4,381 | | | | |
| | | | | | |
| |
| |
| |
| |
| |
| | | | |
TXU US Holdings | | | | | | | | | | | | | | | | | | | | |
Senior Debentures | | | | | | | | | | | | | | | | | | | | |
7.17% | | 2007 | | Fixed | | | | | | 10 | | | | | | 10 | | (b) | | T+10 |
Notes | | | | | | | | | | | | | | | | | | | | |
9.58% semi-annual | | 2019 | | Fixed | | | | | | | | | | 68 | | 68 | | (d) | | |
8.254% quarterly | | 2021 | | Fixed | | | | | | | | | | 64 | | 64 | | (d) | | |
Junior Subord Debentures | | | | | | | | | | | | | | | | | | | | |
2.494%, Series D (e) | | 2037 | | Floating | | | | | | | | | | 1 | | 1 | | (b) | | 100.00 |
8.175%, Series E | | 2037 | | Fixed | | | | | | | | | | 8 | | 8 | | 02/01/07 | | 104.09 |
| | | | | | |
| |
| |
| |
| |
| |
| | | | |
Total TXU US Holdings | | | | | | — | | — | | 10 | | — | | 141 | | 151 | | | | |
| | | | | | |
| |
| |
| |
| |
| |
| | | | |
Total Long-Term Debt | | | | | | 131 | | 1,142 | | 400 | | 643 | | 10,325 | | 12,641 | | | | |
| | | | | | |
| |
| |
| |
| |
| |
| | | | |
| (a) | Interest rates swapped to floating on an aggregate $2.3 billion principal amount. |
| (b) | Redeemable with prior notice. |
| (d) | No redemption prior to maturity. |
| (e) | Interest rate in effect at 12/31/04 |
| (f) | These series are in the multiannual mode and are subject to mandatory tender prior to maturity on the mandatory remarketing date. On such date, the interest rate and interest rate period will be reset for the bonds. |
| (g) | Redemption date represents mandatory remarketing date |
| (h) | Interest rates in effect at 12/31/04. These series are in a weekly rate mode and are classified as long-term as they are supported by long-term irrevocable letters of credit. |
| (i) | Nonrecourse to TXU Electric Delivery. Due in biannual installments through due date. |
| (j) | Not redeemable unless 5% or less of initial principal balance is outstanding and only after last scheduled payment date. |
31
SCHEDULE OF PREFERRED SECURITIES
As of December 31, 2004; $ millions
| | | | | | | | |
Issue
| | Year Due
| | Fixed/ Floating
| | Total
| | Redemption Price at 12/31/04
|
TXU Corp. | | | | | | | | |
| | | | |
Preference Stock, 7.24%1 | | Perpetual | | Fixed | | 300 | | |
| | | | |
Total TXU Corp. | | | | | | 300 | | |
TXU US Holdings | | | | | | | | |
Preferred Stock | | | | | | | | |
$4.00 Series – TPL | | Perpetual | | Fixed | | 3 | | 102.00 |
$4.44 Series – TPL | | Perpetual | | Fixed | | 3 | | 102.61 |
$4.56 Series – TPL | | Perpetual | | Fixed | | 5 | | 112.00 |
$4.76 Series – TPL | | Perpetual | | Fixed | | 2 | | 102.00 |
$4.84 Series – TPL | | Perpetual | | Fixed | | 2 | | 101.79 |
$4.00 Series – TES | | Perpetual | | Fixed | | 7 | | 102.00 |
$4.56 Series – TES | | Perpetual | | Fixed | | 2 | | 112.00 |
$4.64 Series – TES | | Perpetual | | Fixed | | 3 | | 103.25 |
$5.08 Series – TES | | Perpetual | | Fixed | | 3 | | 102.00 |
$4.00 Series – DPL | | Perpetual | | Fixed | | 2 | | 103.56 |
$4.24 Series – DPL | | Perpetual | | Fixed | | 2 | | 103.50 |
$4.50 Series – DPL | | Perpetual | | Fixed | | 2 | | 110.00 |
$4.80 Series – DPL | | Perpetual | | Fixed | | 2 | | 102.79 |
Total TXU US Holdings | | | | | | 38 | | |
Total Preferred Securities | | | | | | 338 | | |
| 1 | Called for redemption effective 06/15/05. |
32
COMMON STOCK DATA1
For years ended December 31, 2000 – 2004; $ per share unless otherwise noted
| | | | | | | | | | | | | | | | | | | | |
Measure
| | 2004
| | | 2003
| | | 2002
| | | 2001
| | | 2000
| |
Earnings Per Share from continuing operations (before extraordinary items and cumulative effect of changes in accounting principles): | |
Basic | | $ | 0.27 | | | $ | 1.76 | | | $ | 0.37 | | | $ | 2.05 | | | $ | 2.12 | |
Dilutive | | $ | 0.27 | 2 | | $ | 1.63 | | | $ | 0.37 | | | $ | 2.05 | | | $ | 2.12 | |
| | | | | |
Earnings Per Share: | | | | | | | | | | | | | | | | | | | | |
Basic | | $ | (1.29 | ) | | $ | 1.74 | | | $ | (15.23 | ) | | $ | 2.52 | | | $ | 3.43 | |
Dilutive | | $ | (1.29 | ) | | $ | 1.62 | | | $ | (15.23 | ) | | $ | 2.52 | | | $ | 3.43 | |
| | | | | |
Shares Outstanding (year end - millions) | | | 240 | | | | 324 | | | | 322 | | | | 265 | | | | 258 | |
Weighted Average Shares Outstanding (millions): | | | | | | | | | | | | | | | | | | | | |
Basic | | | 300 | | | | 322 | | | | 278 | | | | 259 | | | | 264 | |
Dilutive | | | 300 | | | | 379 | | | | 278 | | | | 259 | | | | 264 | |
| | | | | |
Dividends Paid ($ millions) | | $ | 150 | | | $ | 160 | | | $ | 652 | | | $ | 621 | | | $ | 634 | |
Dividends Paid | | $ | 0.50 | | | $ | 0.50 | | | $ | 2.40 | | | $ | 2.40 | | | $ | 2.40 | |
Dividend Payout Ratio (percent) | | | — | | | | 30.9 | % | | | — | | | | 95.2 | % | | | 70.0 | % |
Book Value | | $ | 1.26 | | | $ | 17.34 | | | $ | 14.80 | | | $ | 28.88 | | | $ | 28.97 | |
| | | | | |
Historical Stock Prices | | | | | | | | | | | | | | | | | | | | |
Market Price: | | | | | | | | | | | | | | | | | | | | |
High | | $ | 67.00 | | | $ | 23.96 | | | $ | 57.05 | | | $ | 50.00 | | | $ | 45.25 | |
Low | | $ | 23.35 | | | $ | 15.00 | | | $ | 10.10 | | | $ | 34.81 | | | $ | 25.94 | |
Close | | $ | 64.56 | | | $ | 23.72 | | | $ | 18.68 | | | $ | 47.15 | | | $ | 44.31 | |
CREDIT RATINGS3
As of April 2005
| | | | | | |
Company/Bonds
| | Moody’s
| | S&P
| | Fitch
|
TXU Corp. | | | | | | |
Senior Unsecured | | Ba1 | | BBB- | | BBB- |
Preference Stock | | Ba2 | | BB+ | | BB+ |
TXU US Holdings | | | | | | |
Senior Unsecured | | Baa3 | | BBB- | | BBB- |
TXU Electric Delivery | | | | | | |
Secured | | Baa1 | | BBB | | A-/BBB+ |
Senior Unsecured | | Baa2 | | BBB- | | BBB+ |
TXU Energy Company LLC | | | | | | |
Senior Unsecured | | Baa2 | | BBB | | BBB |
| 1 | Prior year periods have been reclassified to reflect certain operations as discontinued operations. |
| 2 | Operational earnings (diluted) per share for 2004 were $2.82. Excluding special items, earnings (diluted) from continuing operations before extraordinary items, and changes in accounting principles were $2.89. For the diluted operational earnings calculation, weighted average shares were 321 million. |
| 3 | A rating reflects only the view of a rating agency, and is not a recommendation to buy, sell or hold securities. Any rating can be revised upward or downward at any time by a rating agency if such agency decides that circumstances warrant such a change. |
33
LIQUIDITY
As of April 29, 2005 and December 31, 2004; $ millions
| | | | | | | | |
Liquidity Component
| | Borrower
| | Maturity
| | 4/29/05
| | 12/31/04
|
Cash and Cash Equivalents | | | | | | 10 | | 106 |
$1.4 billion credit facility | | TXU Energy/TXU Electric Delivery Co. | | June 08 | | 966 | | 1,172 |
$1.6 billion credit facility | | TXU Energy/TXU Electric Delivery Co. | | March 10 | | 1,560 | | — |
$500 million credit facility | | TXU Energy/TXU Electric Delivery Co. | | June 10 | | 375 | | 500 |
$500 million credit facility | | TXU Energy | | December 09 | | — | | 500 |
Terminated facilities | | | | | | | | 531 |
Total Available Liquidity | | | | | | 2,911 | | 2,809 |
CAPITAL EXPENDITURES1
For the years ended December 31, 2001 – 2004; $ millions
| | | | | | | | |
Segment
| | 2004
| | 2003
| | 2002
| | 2001
|
TXU Energy Holdings | | 281 | | 163 | | 284 | | 327 |
TXU Electric Delivery | | 600 | | 543 | | 513 | | 635 |
Corporate and Other | | 31 | | 15 | | 16 | | 26 |
Total | | 912 | | 721 | | 813 | | 988 |
| 1 | Prior year periods have been reclassified to reflect certain operations as discontinued operations. |
34
DEFINITIONS
OPERATIONAL PERFORMANCE MEASURES
Base Load – Generation category including both nuclear and lignite/coal-fired generation representing the most cost efficient generation in an area that is generally economical to run at all times.
CAIDI – Customer Average Interruptible Duration Index.
DART – Days Away, Restricted Duty or Transferred. The number of lost time and restricted duty injuries, plus the number of employee transfers due to injury, per 200,000 employee hours worked.
Fuel Factor – The initial Price to Beat fuel factors, set in 2001, were based on typical integrated utility fuel filings, adjusted for the 10-day rolling average price of the NYMEX 12-month strip for the last 5 trading days prior to, and first 5 trading days after September 11, 2001. Prior to revisions in the Price to Beat rule in April 2003, increases in the fuel factors were permitted only after a 4% increase in the 10-day rolling average price of the NYMEX 12-month strip. Currently, increases must reflect at least a 5% increase in the 20-day rolling average of the NYMEX 12-month strip
Heat Rate – A measure of generating station thermal efficiency, generally expressed in Btu per new kWh. It is computed by dividing the total Btu content of fuel burned for electric generation by the resulting net kWh generation.
IDR – An IDR meter is an interval data recorder. It records a customer’s electrical demand and consumption in 15 minute intervals (or 96 times a day).
Installed Capacity – The full-load continuous rating of a generator under specified conditions as designated by the manufacturer.
Large Business – The Large Business Market is comprised of customer having aggregate demands of one megawatt or greater (annual spend generally $250K or higher), Large business customers span commercial, industrial, government, and education sectors. Large Business customers typically sign contracts with 1 to 5 year terms that are transacted through a direct sales force and channel partners.
Native Market – An Affiliated Retail Electric Provider’s (AREP) native market is the geographic boundaries of the area and associated retail customers served by the former integrated utility from which an AREP was created.
Net Customer Change – Gross customer gains due to move ins and win-back plus the gross customer losses caused by switching, move-outs and disconnects.
Net Generation – The amount of electric energy produced by the generating units in a generating station, less the kilowatt-hours consumed for that station’s use.
NIDR – A non-IDR meter is a meter that records a customer’s electrical demand and consumption over a monthly period.
SAIDI– (System Average Interruptible Duration Index) – Defined as the number of minutes the average customer is out of service in a year. Determined by summing the customer-minutes off for each interruption during a specified time period and dividing the sum by the average number of customers served during the period.
SAIFI– (System Average Interruptible Frequency Index) – Defined as the number of times in a year that the average customer experiences an interruption (non-transient) to service. Determined by dividing the total number of customers interrupted in a time period by the average number of customers served.
FINANCIAL PERFORMANCE MEASURES
Available Capacity – Amount of undrawn capacity on corporate and subsidiary short-term borrowing facilities.
Book Value Per Share – Common equity divided by end of period shares outstanding.
Liquidity – Measures how easily assets can be turned into cash to pay bills, pay dividends to shareholders, and make future investments in the growth of the business.
Preferred Securities – Sum of preference stock, exchangeable preferred membership interests, and preferred stock of subsidiaries.
Operational Earnings Per Share - (a non-GAAP measure) – Income from continuing operations, less special items and preference stock dividends. TXU believes that operational earnings is a useful measure of underlying results because of the magnitude and scope of the performance improvement program and the significant effect of the special items on reported results. TXU relies on operational earnings for evaluation of performance and believes that analysis of the business by external users is enhanced by visibility to both reported GAAP earnings and operational earnings.
Total Debt – Sum of short-term and long-term debt and capital leases on the balance sheet less non-recourse debt.
Total Liquidity – Sum of cash and available credit facility capacity.
35
INVESTOR INFORMATION
The Board of Directors meets quarterly, generally on the third Friday of February, May, August and November. The Annual Shareholders Meeting is generally held on the 3rd Friday in May of each year.
TXU’s quarterly earnings results, and other news and information of investor interest may be obtained by accessing the company’s website at www.txucorp.com.
For copies of TXU’s 10-K and 10-Q reports filed with the Securities & Exchange Commission or for other investor information, access the website at www.txucorp.com or write to:
TXU Corp.
Investor Relations
Energy Plaza
1601 Bryan Street
Dallas, Texas 75201
Securities analysts and representatives of financial institutions may contact Tim Hogan, Director of Investor Relations at 214-812-4641 or thogan@txu.com regarding TXU’s financial and operating performance.
COMMON STOCK INFORMATION
TXU Corp.’s common stock is listed on the New York, Chicago and Pacific stock exchanges under the symbol “TXU.” The TXU share price is reported daily in the financial press under “TXU” in most listings of New York Stock Exchange securities. TXU is a member of the following indices: S&P 500, S&P 500 Independent Power Producers and Electric Traders Index, Dow Jones Utilities Average, and the Philadelphia Utility Index, among others.
At year end 2004, there were 239,852,880 shares of TXU common stock outstanding. Shareholders of record totaled 58,585.
TXU COMMON STOCK PRICES
The high and low trading prices for each quarterly period in 2004 and 2003 were as follows (in dollars per share):
| | | | | | | | | | | | |
| | | 2004
| | 2003
|
Quarter
| | High
| | Low
| | High
| | Low
|
1 | | $ | 30.13 | | $ | 23.35 | | $ | 20.37 | | $ | 15.00 |
2 | | $ | 40.72 | | $ | 27.15 | | $ | 22.87 | | $ | 17.54 |
3 | | $ | 48.25 | | $ | 38.34 | | $ | 23.70 | | $ | 19.58 |
4 | | $ | 67.00 | | $ | 48.05 | | $ | 23.96 | | $ | 20.87 |
DIVIDEND PAYMENTS
Dividends paid during 2004 were taxable distributions. The Board of Directors declares dividends quarterly and sets the record and payment dates. Subject to Board discretion, those dates for 2005 are:
| | | | |
Declaration Date
| | Record Date
| | Payment Date
|
February 18, 2005 | | March 4, 2005 | | April 1, 2005 |
May 20, 2005 | | June 3, 2005 | | July 1, 2005 |
August 19, 2005 | | September 2, 2005 | | October 3, 2005 |
November 18, 2005 | | December 2, 2005 | | January 3, 2006 |
Dividend information will be updated according to the declaration schedule.
Quarterly dividend payments (in cents per share):
| | | | | | | | | | |
Quarter
| | 2004
| | 2003
| | 2002
| | 2001
| | 2000
|
1 | | 12.5 | | 12.5 | | 60.0 | | 60.0 | | 60.0 |
2 | | 12.5 | | 12.5 | | 60.0 | | 60.0 | | 60.0 |
3 | | 12.5 | | 12.5 | | 60.0 | | 60.0 | | 60.0 |
4 | | 12.5 | | 12.5 | | 60.0 | | 60.0 | | 60.0 |
SHAREHOLDERS ACCOUNT INFORMATION
Effective June 1, 2005, Wachovia Bank, N. A. Shareholder Services Group is TXU’s transfer agent, registrar, dividend disbursing agent and direct stock purchase and dividend reinvestment plan administrator. Shareholders of record with questions about their account such as lost or stolen certificates, lost or missing dividend checks or notifications of change of address should contact Wachovia’s Shareholder Services Group at 1-866-876-2166, via email at equityservices@wachovia.com, or in writing at:
Wachovia Bank, N. A.
Shareholder Services Group
1525 West W. T. Harris Blvd., 3C3
Charlotte, NC 28262-8522
DIVIDEND REINVESTMENT/STOCK PURCHASE
TXU offers an automatic Dividend Reinvestment and Stock Purchase Plan administered by Wachovia Bank, N.A. Shareholder Services Group. The plan is designed to provide TXU shareholders and other investors with a convenient and economical method to purchase shares of the company’s common stock. The plan also accommodates payments of up to $250,000 per year for the purchase of TXU common shares. Contact Wachovia Bank, N.A. Shareholder Services Group by telephone (1-866-876-2166) or visit TXU’s website (www.txucorp.com) for information and an enrollment form.
www.txucorp.com
36