Exhibit 99.1
Exhibit 99.1
2012 Fourth Quarter And Year End Investor Call
February 19, 2013
Oncor Electric Delivery
Forward Looking Statements
This presentation contains forward-looking statements, which are subject to various risks and uncertainties. Discussion of risks and uncertainties that could cause actual results to differ materially from management’s current projections, forecasts, estimates and expectations is contained in filings made by Oncor Electric Delivery Company LLC (Oncor) with the Securities and Exchange Commission (SEC). Specifically, Oncor makes reference to the section entitled “Risk Factors” in its annual and quarterly reports. In addition to the risks and uncertainties set forth in Oncor’s SEC filings, the forward-looking statements in this presentation could be affected by, among other things: prevailing governmental policies and regulatory actions; legal and administrative proceedings and settlements, including the exercise of equitable powers by courts; weather conditions and other natural phenomena; acts of sabotage, wars or terrorist or cyber security threats or activities; economic conditions, including the impact of a recessionary environment; unanticipated population growth or decline, or changes in market demand and demographic patterns; changes in business strategy, development plans or vendor relationships; unanticipated changes in interest rates or rates of inflation; unanticipated changes in operating expenses, liquidity needs and capital expenditures; inability of various counterparties to meet their financial obligations to Oncor, including failure of counterparties to perform under agreements; general industry trends; hazards customary to the industry and the possibility that Oncor may not have adequate insurance to cover losses resulting from such hazards; changes in technology used by and services offered by Oncor; significant changes in Oncor’s relationship with its employees; changes in assumptions used to estimate costs of providing employee benefits, including pension and other post-retirement employee benefits, and future funding requirements related thereto; significant changes in critical accounting policies material to Oncor; commercial bank and financial market conditions, access to capital, the cost of such capital, and the results of financing and refinancing efforts, including availability of funds in the capital markets and the potential impact of disruptions in US credit markets; circumstances which may contribute to future impairment of goodwill, intangible or other long-lived assets; financial restrictions under Oncor’s revolving credit facility and indentures governing its debt instruments; Oncor’s ability to generate sufficient cash flow to make interest payments on its debt instruments; actions by credit rating agencies; and Oncor’s ability to effectively execute its operational strategy. Any forward-looking statement speaks only as of the date on which it is made, and Oncor undertakes no obligation to update any forward-looking statement to reflect events or circumstances after the date on which it is made or to reflect the occurrence of unanticipated events.
Regulation G
This presentation includes certain non-GAAP financial measures. A reconciliation of these measures to the most directly comparable GAAP measures is included in this presentation, which is available on Oncor’s website, www.oncor.com, in the Investor section, and also filed with the SEC.
Oncor Electric Delivery
4th Quarter and Year End 2012 Investor Call Agenda
Financial Overview David Davis
Chief Financial Officer
Operational Review Bob Shapard
Chairman and CEO
Q&A
Oncor Electric Delivery
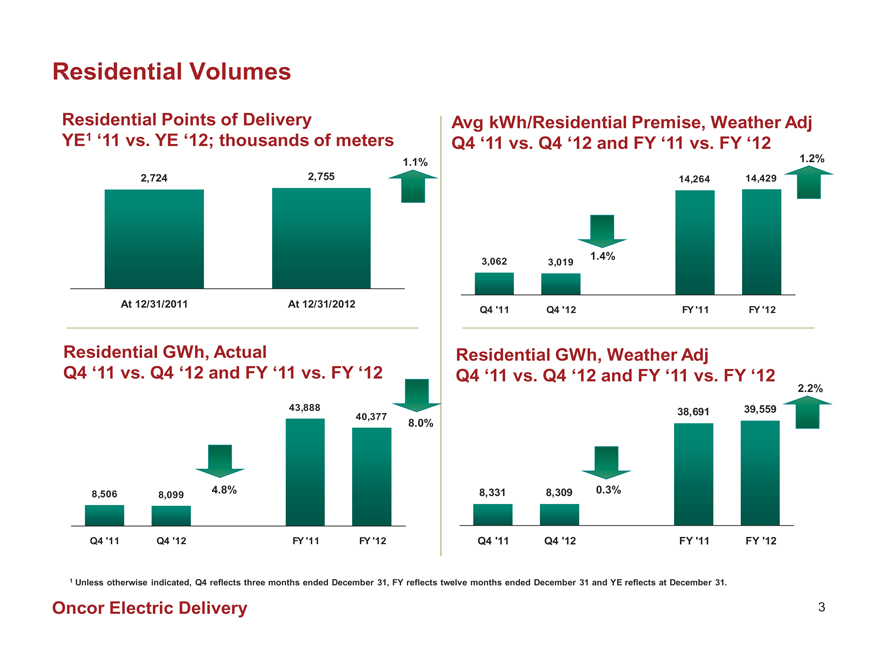
Residential Volumes
Residential Points of Delivery
YE1 ‘11 vs. YE ‘12; thousands of meters
1.1%
2,724 2,755
At 12/31/2011 At 12/31/2012
Avg kWh/Residential Premise, Weather Adj Q4 ‘11 vs. Q4 ‘12 and FY ‘11 vs. FY ‘12
1.2%
14,264 14,429
1.4%
3,062 3,019
Q4 ‘11 Q4 ‘12 FY ‘11 FY ‘12
Residential GWh, Actual
Q4 ‘11 vs. Q4 ‘12 and FY ‘11 vs. FY ‘12
43,888
40,377
8.0%
4.8%
8,506 8,099
Q4 ‘11 Q4 ‘12 FY ‘11 FY ‘12
Residential GWh, Weather Adj
Q4 ‘11 vs. Q4 ‘12 and FY ‘11 vs. FY ‘12
2.2%
38,691 39,559 8,331 8,309 0.3% Q4 ‘11 Q4 ‘12 FY ‘11 FY ‘12
1 Unless otherwise indicated, Q4 reflects three months ended December 31, FY reflects twelve months ended December 31 and YE reflects at December 31.
Oncor Electric Delivery
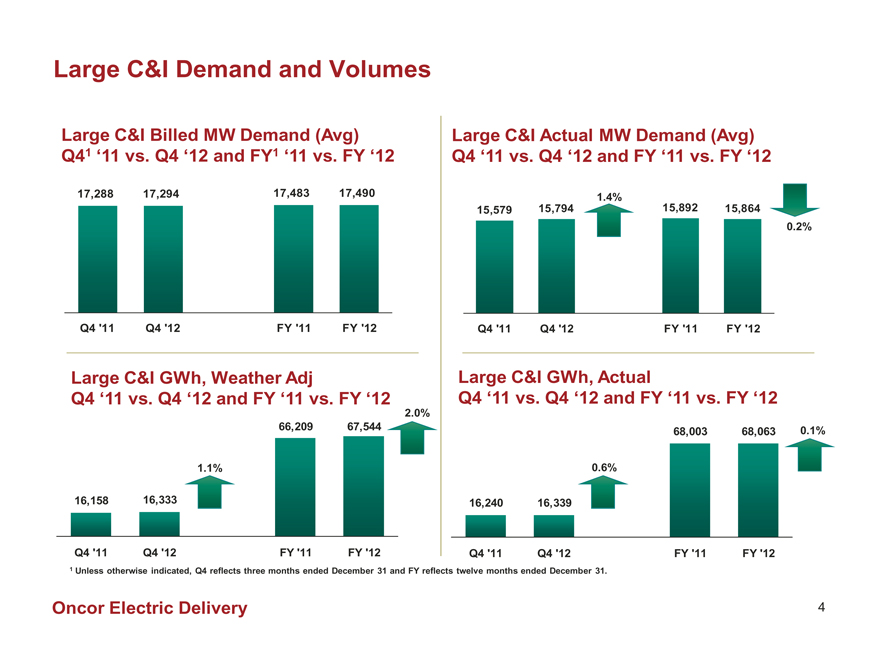
Large C&I Demand and Volumes
Large C&I Billed MW Demand (Avg) Q41 ‘11 vs. Q4 ‘12 and FY1 ‘11 vs. FY ‘12
17,288 17,294 17,483 17,490
Q4 ‘11 Q4 ‘12 FY ‘11 FY ‘12
Large C&I Actual MW Demand (Avg) Q4 ‘11 vs. Q4 ‘12 and FY ‘11 vs. FY ‘12
1.4%
15,579 15,794 15,892 15,864
0.2%
Q4 ‘11 Q4 ‘12 FY ‘11 FY ‘12
Large C&I GWh, Weather Adj
Q4 ‘11 vs. Q4 ‘12 and FY ‘11 vs. FY ‘12
2.0%
66,209 67,544
1.1%
16,158 16,333
Q4 ‘11 Q4 ‘12 FY ‘11 FY ‘12
Large C&I GWh, Actual
Q4 ‘11 vs. Q4 ‘12 and FY ‘11 vs. FY ‘12
68,003 68,063 0.1%
0.6%
16,240 16,339
Q4 ‘11 Q4 ‘12 FY ‘11 FY ‘12
1 Unless otherwise indicated, Q4 reflects three months ended December 31 and FY reflects twelve months ended December 31.
Oncor Electric Delivery
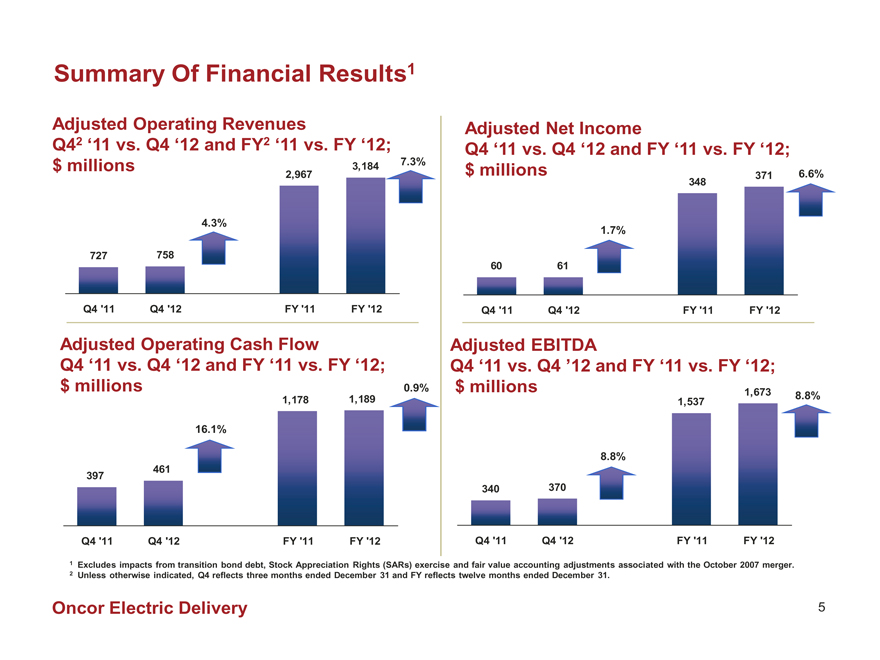
Summary Of Financial Results1
Adjusted Operating Revenues
Q42 ‘11 vs. Q4 ‘12 and FY2 ‘11 vs. FY ‘12;
7.3%
$ millions 3,184
2,967
4.3%
727 758
Q4 ‘11 Q4 ‘12 FY ‘11 FY ‘12
Adjusted Net Income
Q4 ‘11 vs. Q4 ‘12 and FY ‘11 vs. FY ‘12; $ millions 371 6.6%
348
1.7%
60 61
Q4 ‘11 Q4 ‘12 FY ‘11 FY ‘12
Adjusted Operating Cash Flow
Q4 ‘11 vs. Q4 ‘12 and FY ‘11 vs. FY ‘12; $ millions 0.9%
1,178 1,189
16.1%
461 397
Q4 ‘11 Q4 ‘12 FY ‘11 FY ‘12
Adjusted EBITDA
Q4 ‘11 vs. Q4 ’12 and FY ‘11 vs. FY ‘12; $ millions 1,673
8.8%
1,537
8.8%
340 370
Q4 ‘11 Q4 ‘12 FY ‘11 FY ‘12
1 Excludes impacts from transition bond debt, Stock Appreciation Rights (SARs) exercise and fair value accounting adjustments associated with the October 2007 merger.
2 Unless otherwise indicated, Q4 reflects three months ended December 31 and FY reflects twelve months ended December 31.
Oncor Electric Delivery
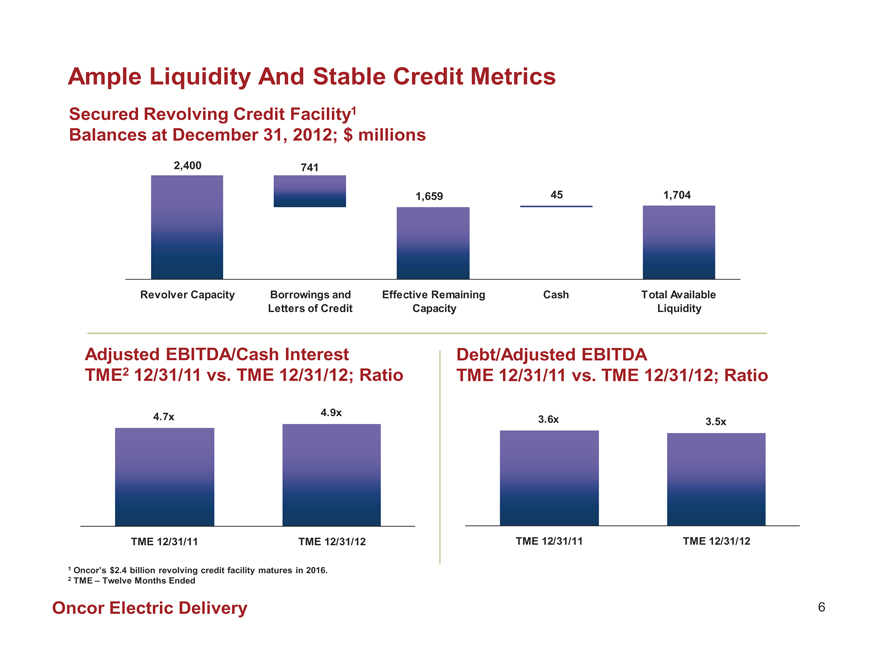
Ample Liquidity And Stable Credit Metrics
Secured Revolving Credit Facility1
Balances at December 31, 2012; $ millions
2,400 741
1,659 45 1,704
Revolver Capacity Borrowings and Effective Remaining Cash Total Available Letters of Credit Capacity Liquidity
Adjusted EBITDA/Cash Interest
TME2 12/31/11 vs. TME 12/31/12; Ratio
4.9x
4.7x
TME 12/31/11 TME 12/31/12
Debt/Adjusted EBITDA
TME 12/31/11 vs. TME 12/31/12; Ratio
3.6x 3.5x
TME 12/31/11 TME 12/31/12
1 | | Oncor’s $2.4 billion revolving credit facility matures in 2016. |
2 | | TME – Twelve Months Ended |
Oncor Electric Delivery

Historical PP&E And Projected Capital Program1
Historical Property, Plant & Equipment, Net ’08-’12; $ millions
~7.1% CAGR2 11,318 10,569
9,676 9,174 8,606
‘08 ‘09 ‘10 ‘11 ‘12
Estimated Capital Expenditures ‘13E – ‘17E; $ millions
1,050 1,045 1,000 1,005 1,010
120 350
570 595 530 435 240
225 200 210 215 225
235 245 235 225 225
13E 14E 15E 16E 17E
CREZ / Voltage Support Transmission Grid Expansion New Service IT / Maintenance / General Plant
1 | | Unless otherwise indicated, reflects twelve months ended December 31. |
2 | | Compound Annual Growth Rate |
Oncor Electric Delivery
4th Quarter and Year End 2012 Investor Call Agenda
Financial Overview David Davis
Chief Financial Officer
Operational Review Bob Shapard
Chairman and CEO
Q&A
Oncor Electric Delivery
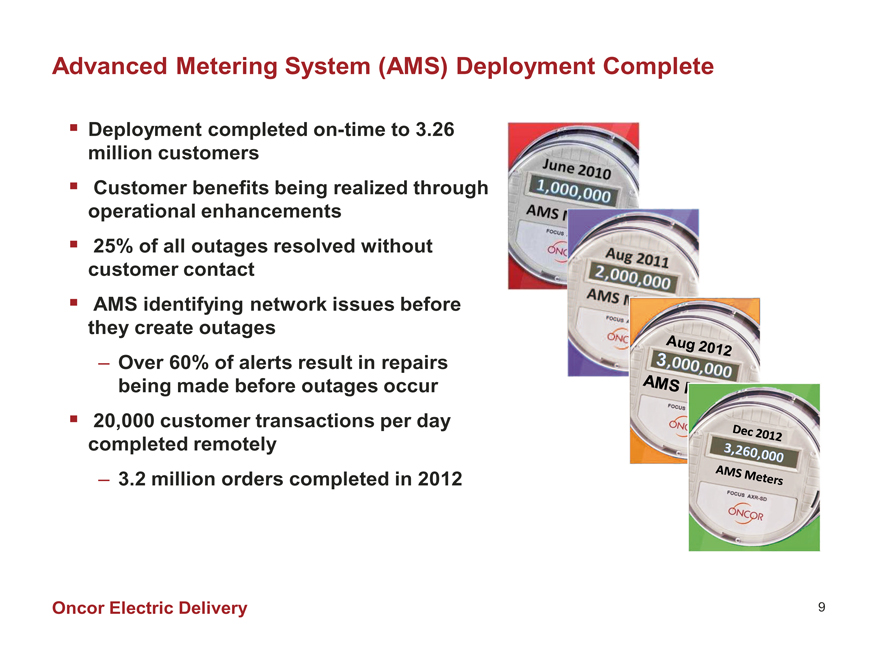
Advanced Metering System (AMS) Deployment Complete
Deployment completed on-time to 3.26 million customers
Customer benefits being realized through operational enhancements
25% of all outages resolved without customer contact
AMS identifying network issues before they create outages
– Over 60% of alerts result in repairs being made before outages occur
20,000 customer transactions per day completed remotely
– 3.2 million orders completed in 2012
Oncor Electric Delivery
9
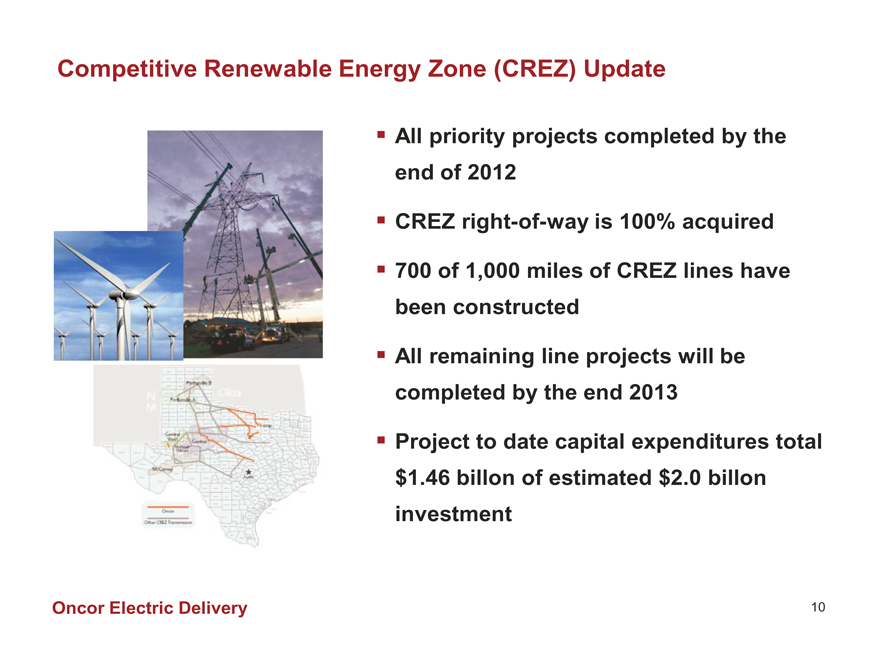
Competitive Renewable Energy Zone (CREZ) Update
All priority projects completed by the end of 2012
CREZ right-of-way is 100% acquired
700 of 1,000 miles of CREZ lines have been constructed
All remaining line projects will be completed by the end 2013
Project to date capital expenditures total $1.46 billon of estimated $2.0 billon
investment
Oncor Electric Delivery
10
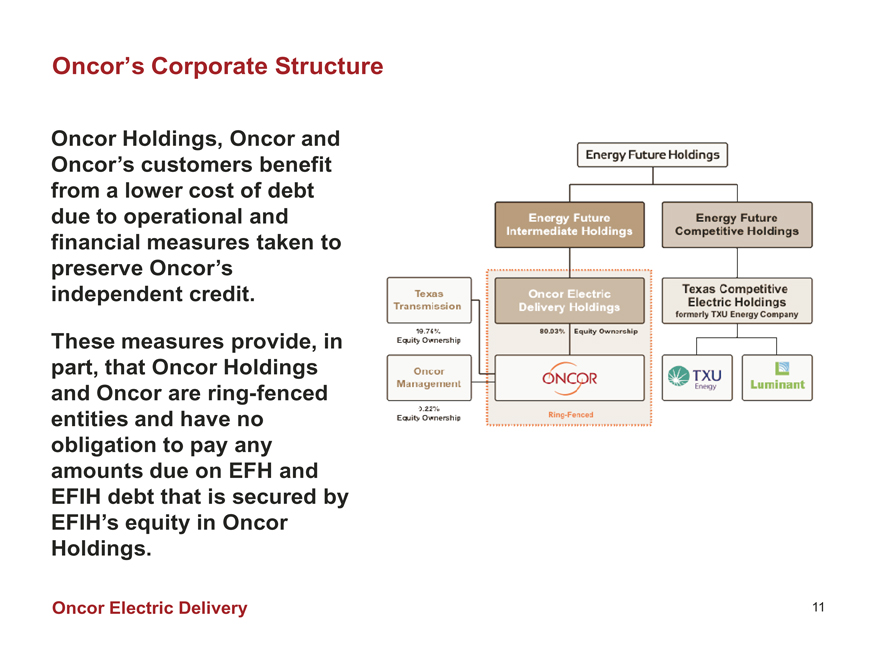
Oncor’s Corporate Structure
Oncor Holdings, Oncor and Oncor’s customers benefit from a lower cost of debt due to operational and financial measures taken to preserve Oncor’s independent credit.
These measures provide, in part, that Oncor Holdings and Oncor are ring-fenced entities and have no obligation to pay any amounts due on EFH and EFIH debt that is secured by EFIH’s equity in Oncor Holdings.
Oncor Electric Delivery 11
Appendix -
Regulation G Reconciliations and Supplemental Data
Oncor Electric Delivery 12
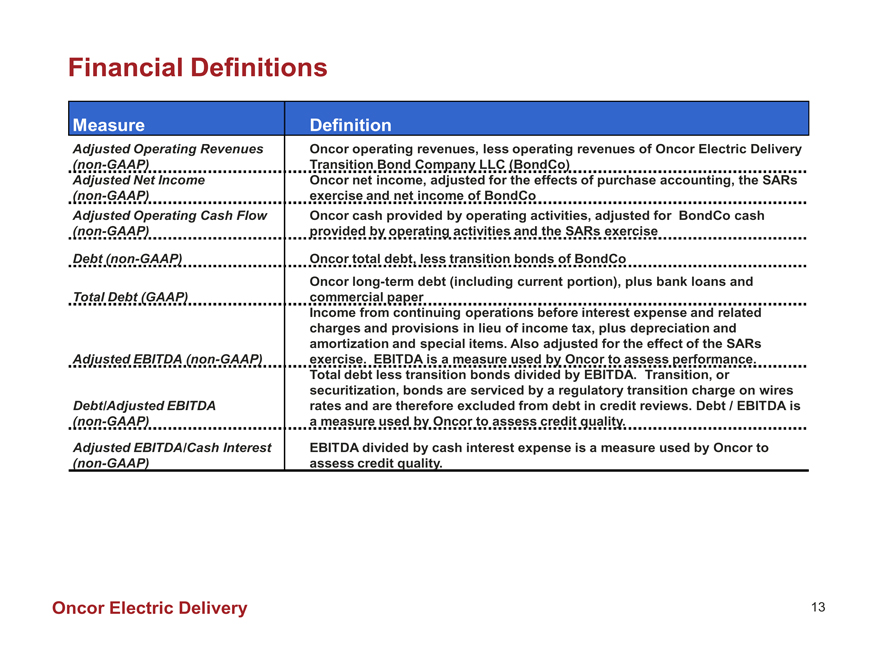
Financial Definitions
Measure Definition
Adjusted Operating Revenues Oncor operating revenues, less operating revenues of Oncor Electric Delivery
(non-GAAP) Transition Bond Company LLC (BondCo)
Adjusted Net Income Oncor net income, adjusted for the effects of purchase accounting, the SARs
(non-GAAP) exercise and net income of BondCo
Adjusted Operating Cash Flow Oncor cash provided by operating activities, adjusted for BondCo cash
(non-GAAP) provided by operating activities and the SARs exercise
Debt (non-GAAP) Oncor total debt, less transition bonds of BondCo
Oncor long-term debt (including current portion), plus bank loans and
Total Debt (GAAP) commercial paper
Income from continuing operations before interest expense and related
charges and provisions in lieu of income tax, plus depreciation and
amortization and special items. Also adjusted for the effect of the SARs
Adjusted EBITDA (non-GAAP) exercise. EBITDA is a measure used by Oncor to assess performance.
Total debt less transition bonds divided by EBITDA. Transition, or
securitization, bonds are serviced by a regulatory transition charge on wires
Debt/Adjusted EBITDA rates and are therefore excluded from debt in credit reviews. Debt / EBITDA is
(non-GAAP) a measure used by Oncor to assess credit quality.
Adjusted EBITDA/Cash Interest EBITDA divided by cash interest expense is a measure used by Oncor to
(non-GAAP) assess credit quality.
Oncor Electric Delivery 13

Table 1: Oncor Adjusted Operating Revenues Reconciliation
Three and Twelve Months Ended December 31, ‘11 and ‘12 $ millions
Q4 ‘11 Q4 ‘12 FY ‘11 FY ‘12
Operating Revenues – Oncor 759 792 3,118 3,328
Less: Operating revenues – BondCo (32)
Adjusted Operating Revenues, excluding BondCo 727 758 2,967 3,184
Oncor Electric Delivery 14
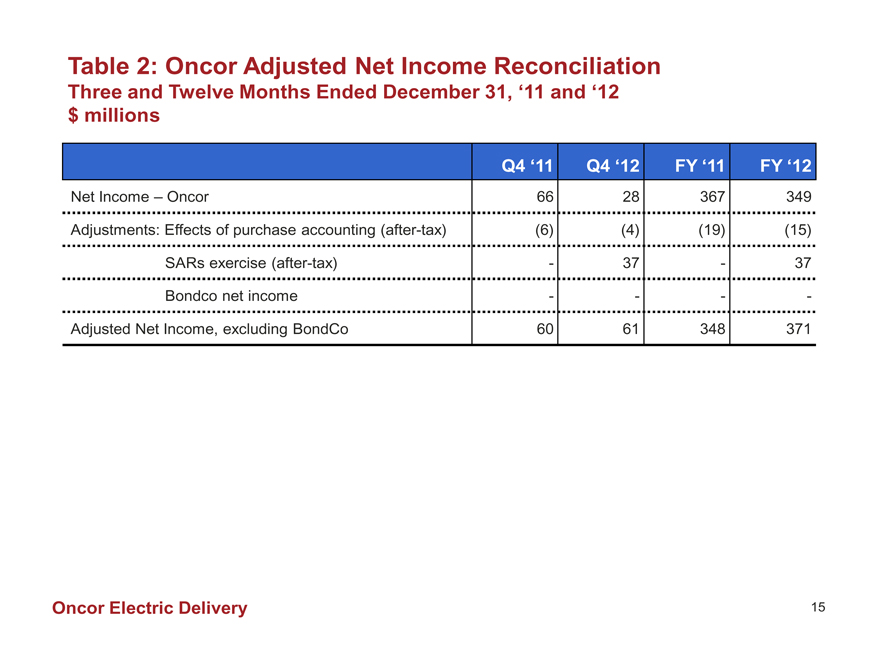
Table 2: Oncor Adjusted Net Income Reconciliation
Three and Twelve Months Ended December 31, ‘11 and ‘12 $ millions
Q4 ‘11 Q4 ‘12 FY ‘11 FY ‘12
Net Income – Oncor 66 28 367 349
Adjustments: Effects of purchase accounting (after-tax) (6) (4) (19) (15)
SARs exercise (after-tax) — 37 — 37
Bondco net income
Adjusted Net Income, excluding BondCo 60 61 348 371
Oncor Electric Delivery 15
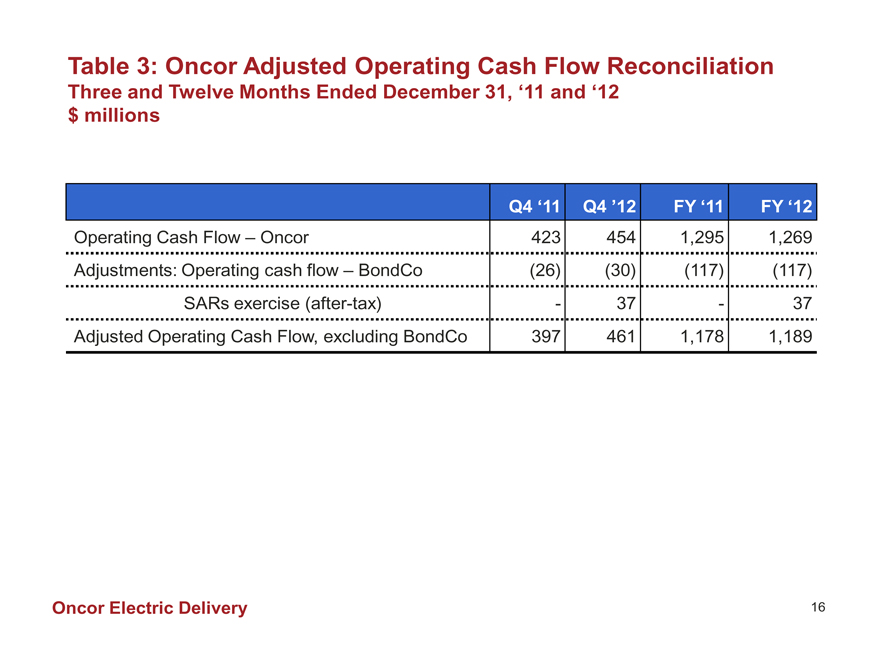
Table 3: Oncor Adjusted Operating Cash Flow Reconciliation
Three and Twelve Months Ended December 31, ‘11 and ‘12 $ millions
b Q4 ‘11 Q4 ’12 FY ‘11 FY ‘12
Operating Cash Flow – Oncor 423 454 1,295 1,269
Adjustments: Operating cash flow – BondCo (26) (30) (117) (117)
SARs exercise (after-tax) — 37 — 37
Adjusted Operating Cash Flow, excluding BondCo 397 461 1,178 1,189
Oncor Electric Delivery 16
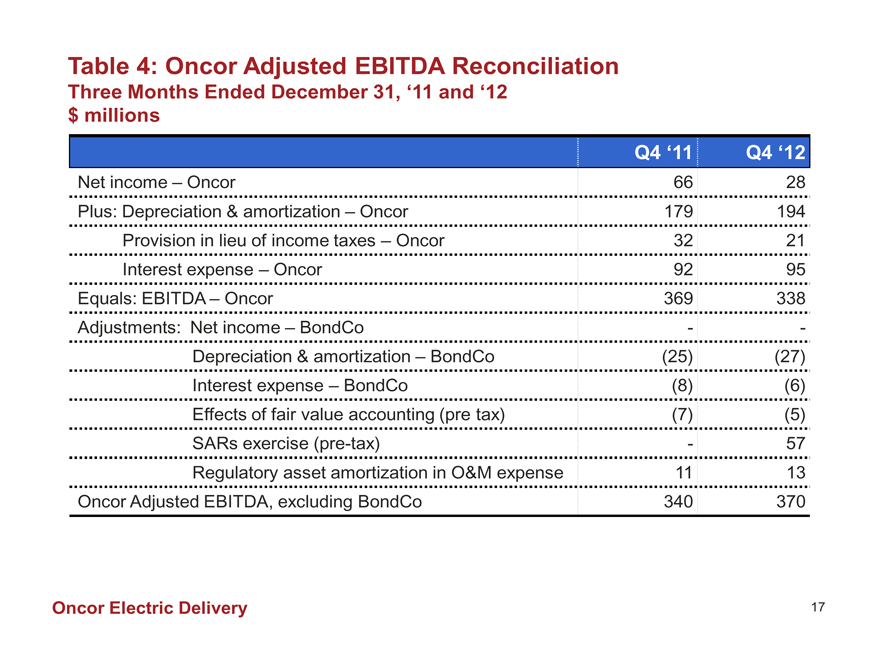
Table 4: Oncor Adjusted EBITDA Reconciliation
Three Months Ended December 31, ‘11 and ‘12 $ millions
Q4
‘11
Q4
‘12
Net income – Oncor
66
28
Plus: Depreciation & amortization – Oncor
179
194
Provision in lieu of income taxes – Oncor
32
21
Interest expense – Oncor
92
95
Equals: EBITDA – Oncor
369
338
Adjustments: Net income – BondCo
—
—
Depreciation & amortization – BondCo
(25)
(27)
Interest expense – BondCo
(8)
(6)
Effects of fair value accounting (pre tax)
(7)
(5)
SARs exercise (pre-tax)
—
57
Regulatory asset amortization in O&M expense
11
13
Oncor Adjusted EBITDA, excluding BondCo
340
370
Oncor Electric Delivery 17
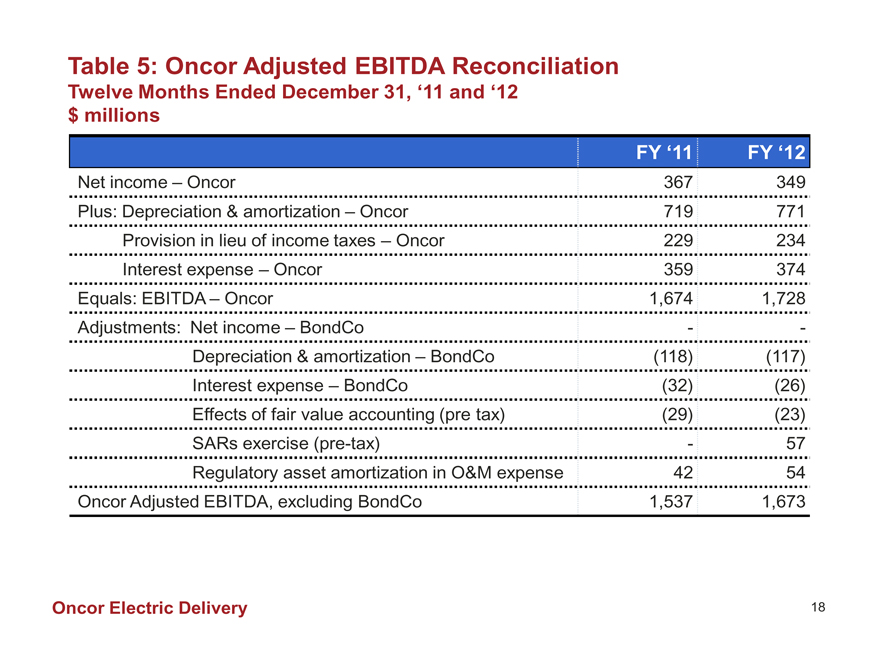
Table 5: Oncor Adjusted EBITDA Reconciliation
Twelve Months Ended December 31, ‘11 and ‘12
$ millions
FY ‘11 FY ‘12
Net income – Oncor 367 349
Plus: Depreciation & amortization – Oncor 719 771
Provision in lieu of income taxes – Oncor 229 234
Interest expense – Oncor 359 374
Equals: EBITDA – Oncor 1,674 1,728
Adjustments: Net income – BondCo
Depreciation & amortization – BondCo (118) (117)
Interest expense – BondCo (32) (26)
Effects of fair value accounting (pre tax) (29) (23)
SARs exercise (pre-tax) — 57
Regulatory asset amortization in O&M expense 42 54
Oncor Adjusted EBITDA, excluding BondCo 1,537 1,673
Oncor Electric Delivery 18
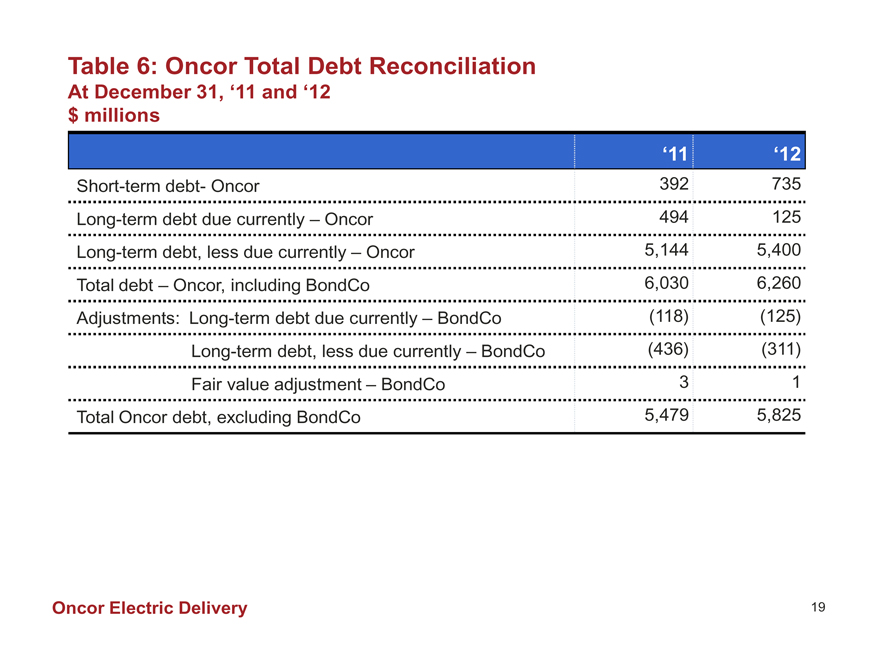
Table 6: Oncor Total Debt Reconciliation
At December 31, ‘11 and ‘12 $ millions
‘11 ‘12
Short-term debt- Oncor 392 735
Long-term debt due currently – Oncor 494 125
Long-term debt, less due currently – Oncor 5,144 5,400
Total debt – Oncor, including BondCo 6,030 6,260
Adjustments: Long-term debt due currently – BondCo (118) (125)
Long-term debt, less due currently – BondCo (436) (311)
Fair value adjustment – BondCo 3 1
Total Oncor debt, excluding BondCo 5,479 5,825
Oncor Electric Delivery 19
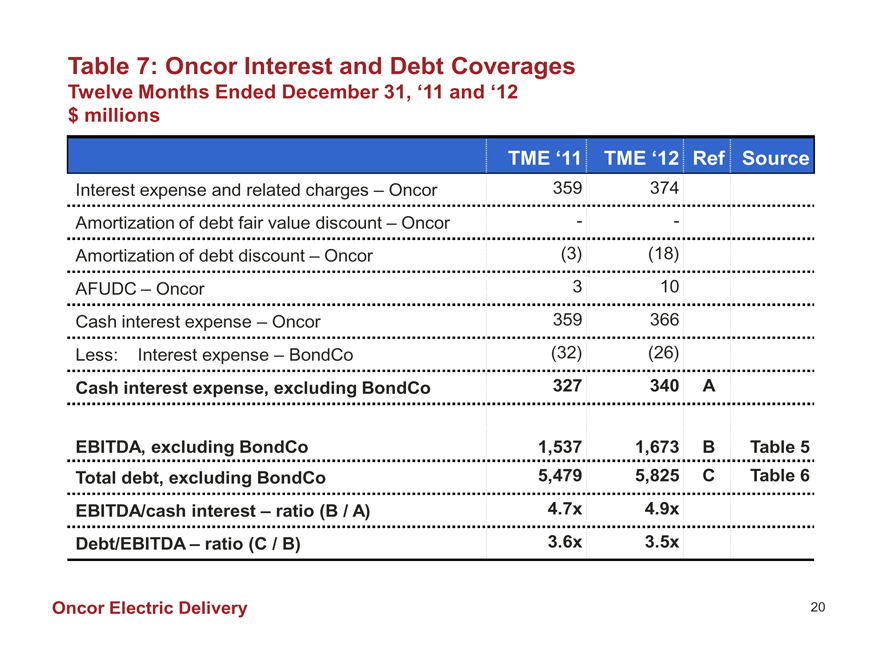
Table 7: Oncor Interest and Debt Coverages
Twelve Months Ended December 31, ‘11 and ‘12 $ millions
TME ‘11 TME ‘12 Ref Source
Interest expense and related charges – Oncor 359 374
Amortization of debt fair value discount – Oncor
Amortization of debt discount – Oncor (3) (18)
AFUDC – Oncor 3 10
Cash interest expense – Oncor 359 366
Less: Interest expense – BondCo (32) (26)
Cash interest expense, excluding BondCo 327 340 A
EBITDA, excluding BondCo 1,537 1,673 B Table 5
Total debt, excluding BondCo 5,479 5,825 C Table 6
EBITDA/cash interest – ratio (B / A) 4.7x 4.9x
Debt/EBITDA – ratio (C / B) 3.6x 3.5x
Oncor Electric Delivery 20