Exhibit 99.1

ONCOR
Fourth Quarter And Year End 2014 Investor Call
March 3, 2015
Oncor Electric Delivery
Forward Looking Statements
This presentation contains forward-looking statements, which are subject to various risks and uncertainties. Discussion of risks and uncertainties that could cause actual results to differ materially from management’s current projections, forecasts, estimates and expectations is contained in filings made by Oncor Electric Delivery Company LLC (Oncor) with the Securities and Exchange Commission (SEC). Specifically, Oncor makes reference to the section entitled “Risk Factors” in its annual and quarterly reports. In addition to the risks and uncertainties set forth in Oncor’s SEC filings, the forward-looking statements in this presentation could be affected by, among other things: prevailing governmental policies and regulatory actions; legal and administrative proceedings and settlements, including the exercise of equitable powers by courts; any impacts on us as a result of the bankruptcy proceedings involving Energy Future Holdings Corp. and certain of its subsidiaries; weather conditions and other natural phenomena; acts of sabotage, wars or terrorist or cyber security threats or activities; economic conditions, including the impact of a recessionary environment; unanticipated population growth or decline, or changes in market demand and demographic patterns; changes in business strategy, development plans or vendor relationships; unanticipated changes in interest rates or rates of inflation; unanticipated changes in operating expenses, liquidity needs and capital expenditures; inability of various counterparties to meet their financial obligations to Oncor, including failure of counterparties to perform under agreements; general industry trends; hazards customary to the industry and the possibility that Oncor may not have adequate insurance to cover losses resulting from such hazards; changes in technology used by and services offered by Oncor; significant changes in Oncor’s relationship with its employees; changes in assumptions used to estimate costs of providing employee benefits, including pension and other post-retirement employee benefits, and future funding requirements related thereto; significant changes in critical accounting policies material to Oncor; commercial bank and financial market conditions, access to capital, the cost of such capital, and the results of financing and refinancing efforts, including availability of funds in the capital markets and the potential impact of disruptions in US credit markets; circumstances which may contribute to future impairment of goodwill, intangible or other long-lived assets; financial restrictions under Oncor’s revolving credit facility and indentures governing its debt instruments; Oncor’s ability to generate sufficient cash flow to make interest payments on its debt instruments; actions by credit rating agencies; and Oncor’s ability to effectively execute its operational strategy. Any forward-looking statement speaks only as of the date on which it is made, and Oncor undertakes no obligation to update any forward-looking statement to reflect events or circumstances after the date on which it is made or to reflect the occurrence of unanticipated events.
Regulation G
This presentation includes certain non-GAAP financial measures. A reconciliation of these measures to the most directly comparable GAAP measures is included in this presentation, which is available on Oncor’s website, www.oncor.com, in the Investor section, and also filed with the SEC.
Oncor Electric Delivery 1
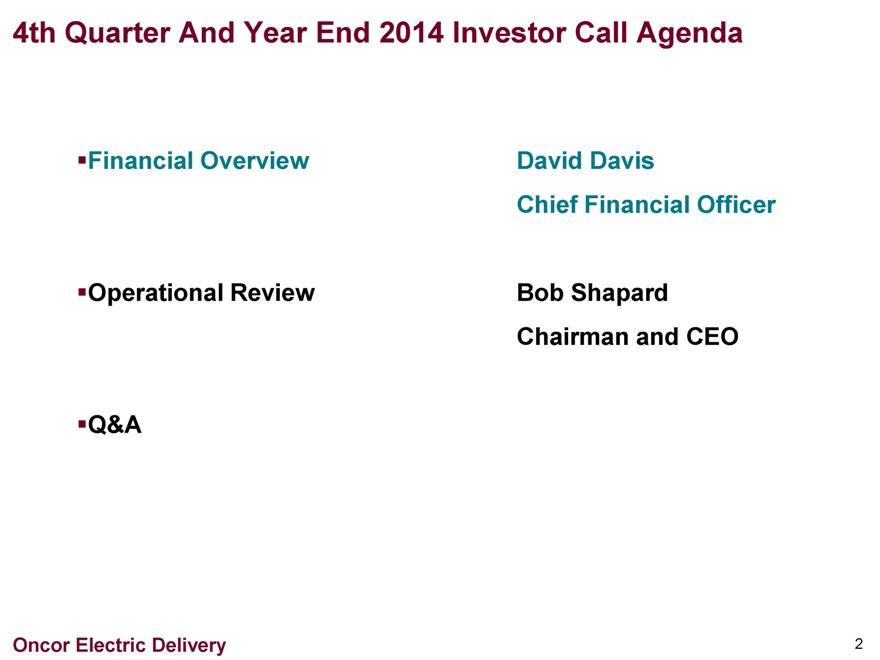
4th Quarter And Year End 2014 Investor Call Agenda
Financial Overview
David Davis
Chief Financial Officer
Operational Review
Bob Shapard
Chairman and CEO
Q&A
Oncor Electric Delivery 2
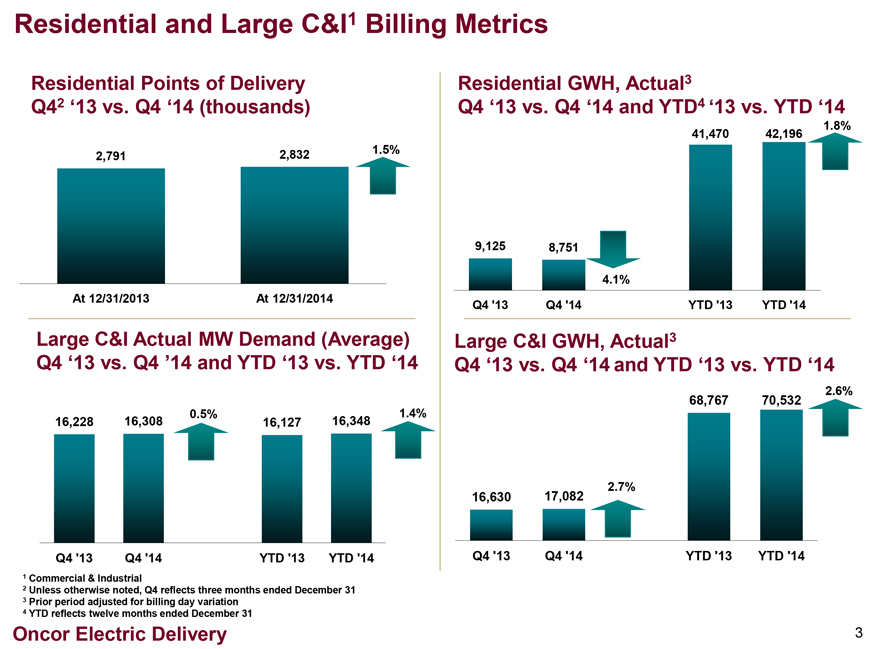
Residential and Large C&I1 Billing Metrics
Residential Points of Delivery Q42 ‘13 vs. Q4 ‘14 (thousands)
2,791 2,832 1.5%
At 12/31/2013 At 12/31/2014
Large C&I Actual MW Demand (Average) Q4 ‘13 vs. Q4 ’14 and YTD ‘13 vs. YTD ‘14
0.5% 1.4% 16,228 16,308 16,127 16,348
Q4 ‘13 Q4 ‘14 YTD ‘13 YTD ‘14
1 Commercial & Industrial
2 Unless otherwise noted, Q4 reflects three months ended December 31
3 Prior period adjusted for billing day variation
4 YTD reflects twelve months ended December 31
Residential GWH, Actual3
Q4 ‘13 vs. Q4 ‘14 and YTD4 ‘13 vs. YTD ‘14
41,470 42,196 1.8% 9,125 8,751 4.1%
Q4 ‘13 Q4 ‘14 YTD ‘13 YTD ‘14
Large C&I GWH, Actual3
Q4 ‘13 vs. Q4 ‘14 and YTD ‘13 vs. YTD ‘14
68,767 70,532 2.6% 2.7% 16,630 17,082
Q4 ‘13 Q4 ‘14 YTD ‘13 YTD ‘14
Oncor Electric Delivery
3
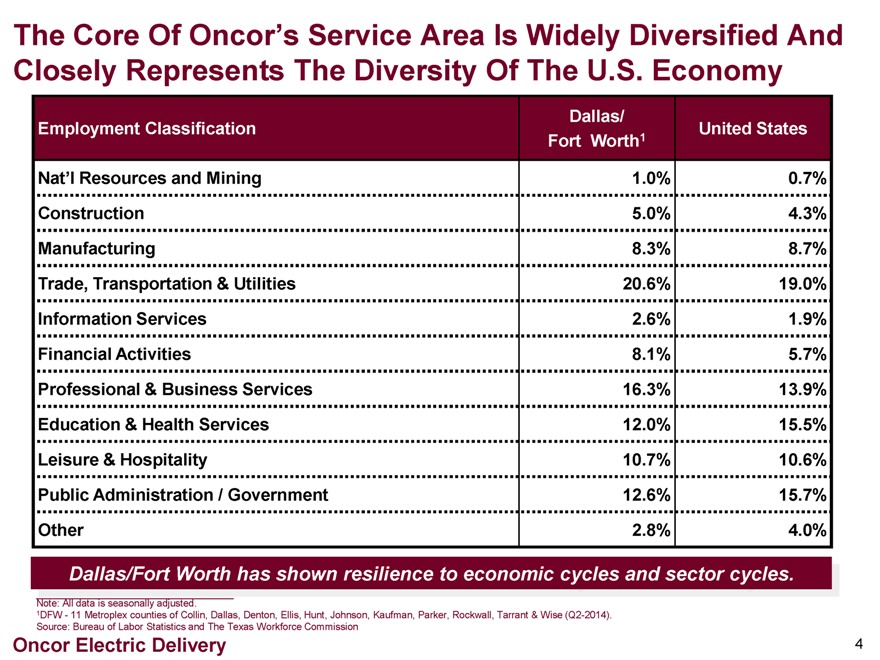
The Core Of Oncor’s Service Area Is Widely Diversified And Closely Represents The Diversity Of The U.S. Economy
Employment Classification Dallas/ Fort Worth1 United States
Nat’l Resources and Mining
1.0% 0.7%
Construction
5.0% 4.3%
Manufacturing
8.3% 8.7%
Trade, Transportation & Utilities
20.6% 19.0%
Information Services
2.6% 1.9%
Financial Activities
8.1% 5.7%
Professional & Business Services
16.3% 13.9%
Education & Health Services
12.0% 15.5%
Leisure & Hospitality
10.7% 10.6%
Public Administration / Government
12.6% 15.7%
Other 2.8% 4.0%
Dallas/Fort Worth has shown resilience to economic cycles and sector cycles.
Note: All data is seasonally adjusted.
1DFW-11 Metroplex counties of Collin, Dallas, Denton, Ellis, Hunt, Johnson, Kaufman, Parker, Rockwall, Tarrant & Wise (Q2-2014).
Source: Bureau of Labor Statistics and The Texas Workforce Commission
Oncor Electric Delivery
4
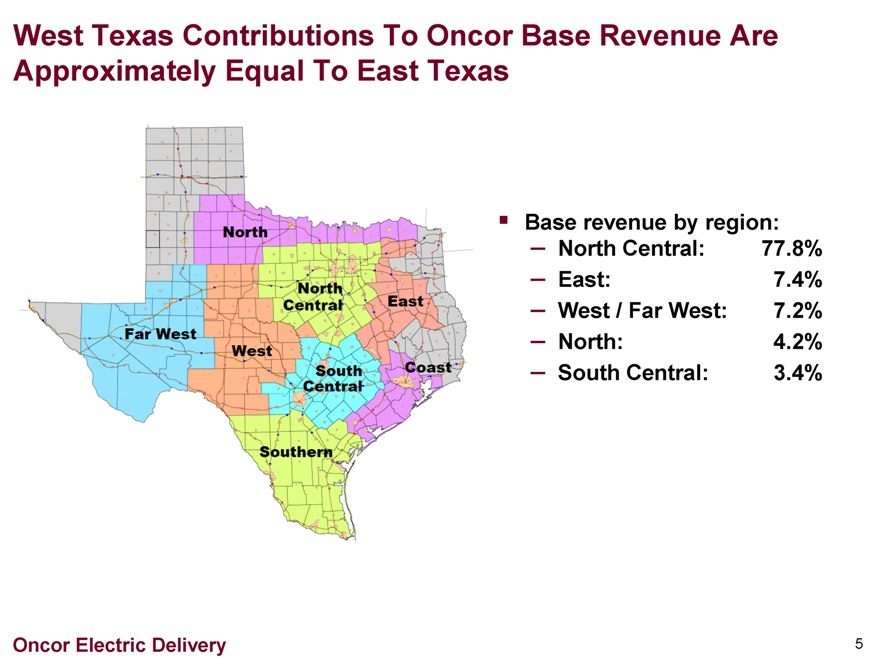
West Texas Contributions To Oncor Base Revenue Are Approximately Equal To East Texas
North
North Central
East
Far West
West South Central
Coast
Southern
Base revenue by region:
— North Central: 77.8%
— East: 7.4%
— West / Far West: 7.2%
— North: 4.2%
— South Central: 3.4%
Oncor Electric Delivery 5
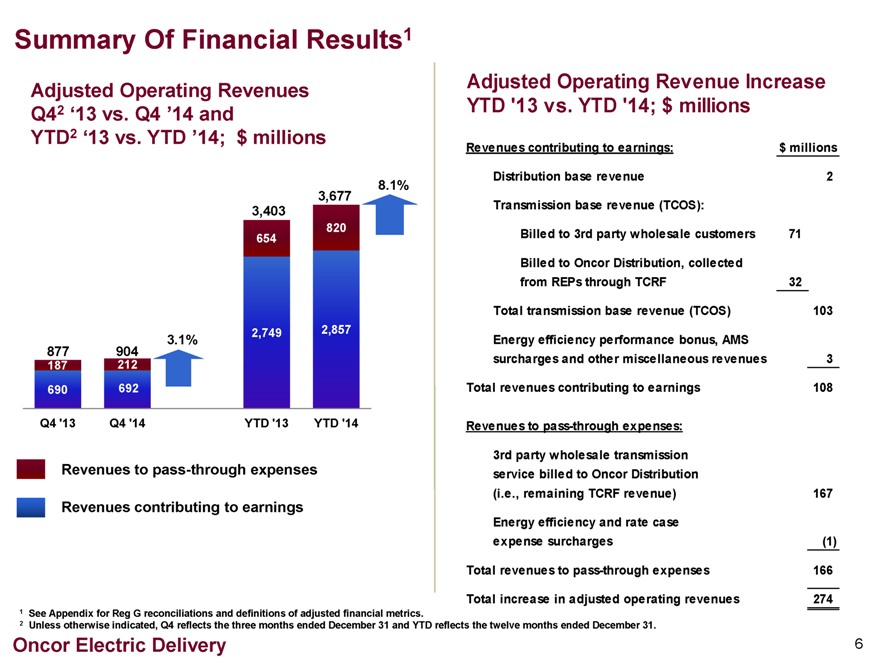
Summary Of Financial Results1
Adjusted Operating Revenues Q42 ‘13 vs. Q4 ’14 and YTD2 ‘13 vs. YTD ’14; $ millions
877 187 690 Q4 ‘13
904 212 692 Q4 ‘14
3.1%
3,403 654 2,749 YTD ‘13
3,677 820 2,857 YTD ‘14
8.1%
Revenues to pass-through expenses
Revenues contributing to earnings
Adjusted Operating Revenue Increase YTD ‘13 vs. YTD ‘14; $ millions
Revenues contributing to earnings: $ millions
Distribution base revenue 2
Transmission base revenue (TCOS):
Billed to 3rd party wholesale customers 71
Billed to Oncor Distribution, collected from REPs through TCRF 32
Total transmission base revenue (TCOS) 103
Energy efficiency performance bonus, AMS surcharges and other miscellaneous revenues 3
Total revenues contributing to earnings 108
Revenues to pass-through expenses:
3rd party wholesale transmission service billed to Oncor Distribution (i.e., remaining TCRF revenue) 167
Energy efficiency and rate case expense surcharges (1)
Total revenues to pass-through expenses 166
Total increase in adjusted operating revenues 274
1 See Appendix for Reg G reconciliations and definitions of adjusted financial metrics.
2 Unless otherwise indicated, Q4 reflects the three months ended December 31 and YTD reflects the twelve months ended December 31.
Oncor Electric Delivery
6
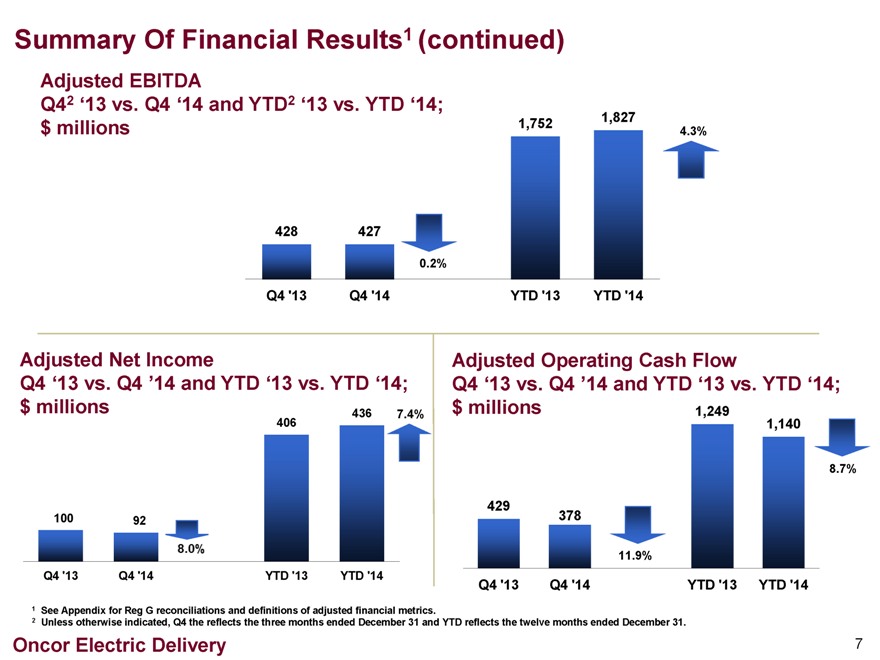
Summary Of Financial Results1 (continued)
Adjusted EBITDA
Q42 ‘13 vs. Q4 ‘14 and YTD2 ‘13 vs. YTD ‘14;
$ millions
428 Q4 ‘13
427 Q4 ‘14
0.2%
1,752 YTD ‘13
1,827 YTD ‘14
4.3%
Adjusted Net Income
Q4 ‘13 vs. Q4 ’14 and YTD ‘13 vs. YTD ‘14;
$ millions
406 436 7.4% 100 92 8.0% Q4 ‘13 Q4 ‘14 YTD ‘13 YTD ‘14
Adjusted Operating Cash Flow
Q4 ‘13 vs. Q4 ’14 and YTD ‘13 vs. YTD ‘14;
$ millions
1,249 1,140 8.7%
429 378 11.9%
Q4 ‘13 Q4 ‘14 YTD ‘13 YTD ‘14
1 See Appendix for Reg G reconciliations and definitions of adjusted financial metrics.
2 Unless otherwise indicated, Q4 the reflects the three months ended December 31 and YTD reflects the twelve months ended December 31.
Oncor Electric Delivery
7
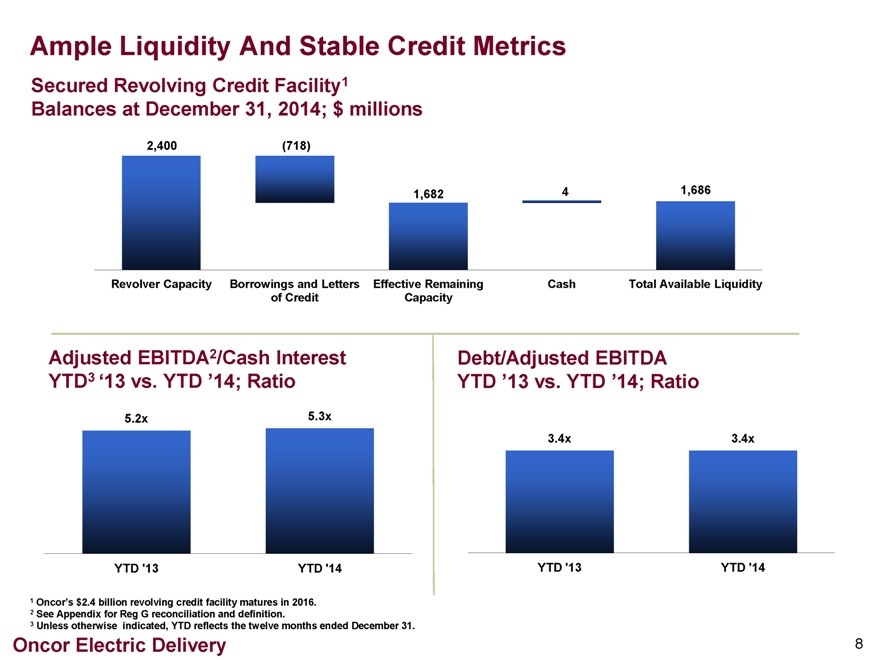
Ample Liquidity And Stable Credit Metrics
Secured Revolving Credit Facility1 Balances at December 31, 2014; $ millions
2,400 (718)
1,6824 1,686
Revolver Capacity Borrowings and Letters of Credit Effective Remaining Capacity Cash Total Available Liquidity
Adjusted EBITDA2/Cash Interest
YTD3 ‘13 vs. YTD ’14; Ratio
5.2x 5.3x
YTD ‘13 YTD ‘14
Debt/Adjusted EBITDA
YTD ’13 vs. YTD ’14; Ratio
3.4x 3.4x
YTD ‘13 YTD ‘14
1 Oncor’s $2.4 billion revolving credit facility matures in 2016.
2 See Appendix for Reg G reconciliation and definition.
3 Unless otherwise indicated, YTD reflects the twelve months ended December 31.
Oncor Electric Delivery 8
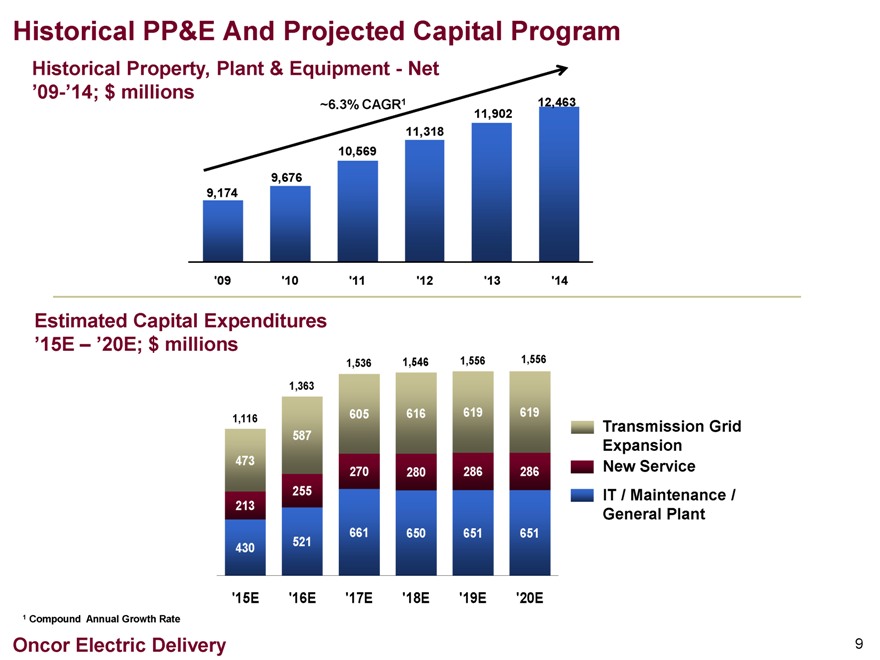
Historical PP&E And Projected Capital Program
Historical Property, Plant & Equipment - Net
’09-’14; $ millions ~6.3% CAGR1 12,463
11,902
11,318
10,569
9,676
9,174
‘09 ‘10 ‘11 ‘12 ‘13 ‘14
Estimated Capital Expenditures
’15E – ’20E; $ millions
1,536 1,546 1,556 1,556
1,363
1,116 587 605 616 619 619 Transmission Grid Expansion
473 270 280 286 286 New Service
213 255 661 650 651 651 IT / Maintenance / General Plant
430 521
‘15E ‘16E ‘17E ‘18E ‘19E ‘20E
1 Compound Annual Growth Rate
Oncor Electric Delivery
9
4th Quarter And Year End 2014 Investor Call Agenda
Financial Overview David Davis
Chief Financial Officer
Operational Review Bob Shapard
Chairman and CEO
Q&A
Oncor Electric Delivery 10
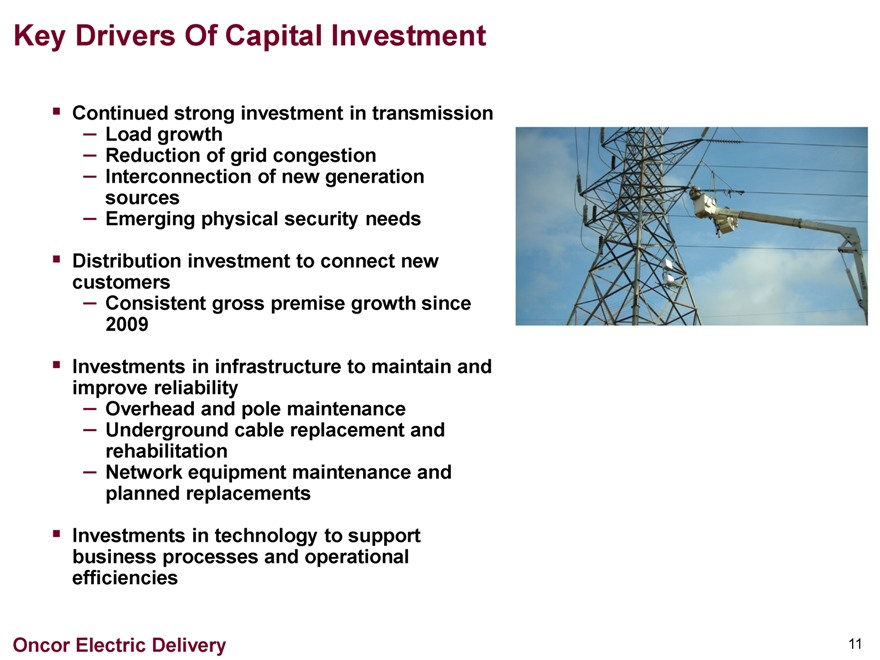
Key Drivers Of Capital Investment
Continued strong investment in transmission
Load growth
Reduction of grid congestion
Interconnection of new generation sources
Emerging physical security needs
Distribution investment to connect new customers
Consistent gross premise growth since 2009
Investments in infrastructure to maintain and improve reliability
Overhead and pole maintenance
Underground cable replacement and rehabilitation
Network equipment maintenance and planned replacements
Investments in technology to support business processes and operational efficiencies
Oncor Electric Delivery
11

Appendix -
Regulation G Reconciliations And Supplemental Data
Oncor Electric Delivery 12
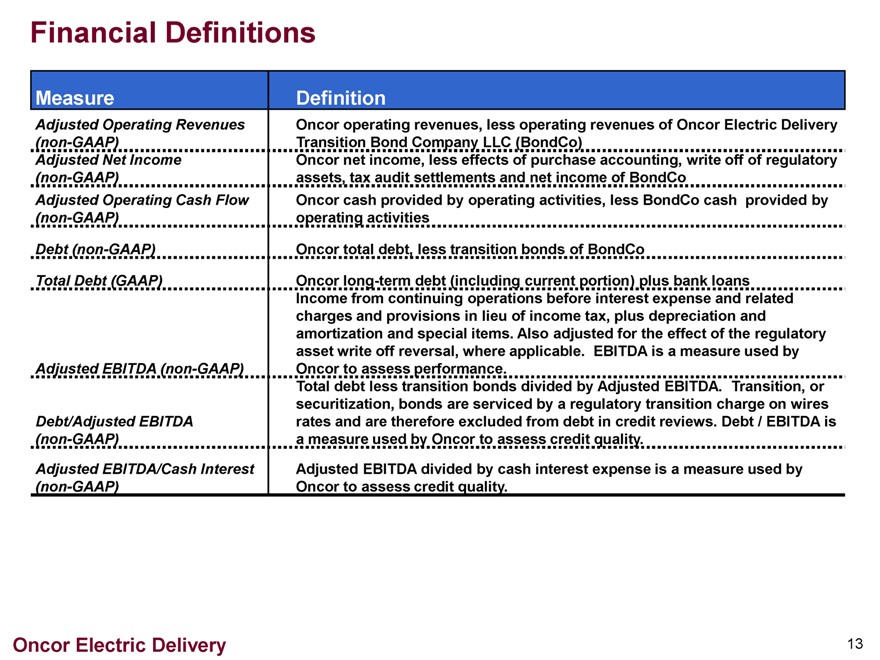
Financial Definitions
Measure Definition
Adjusted Operating Revenues Oncor operating revenues, less operating revenues of Oncor Electric Delivery
(non-GAAP) Transition Bond Company LLC (BondCo)
Adjusted Net Income Oncor net income, less effects of purchase accounting, write off of regulatory
(non-GAAP) assets, tax audit settlements and net income of BondCo
Adjusted Operating Cash Flow Oncor cash provided by operating activities, less BondCo cash provided by
(non-GAAP) operating activities
Debt (non-GAAP) Oncor total debt, less transition bonds of BondCo
Total Debt (GAAP) Oncor long-term debt (including current portion) plus bank loans
Income from continuing operations before interest expense and related
charges and provisions in lieu of income tax, plus depreciation and
amortization and special items. Also adjusted for the effect of the regulatory
asset write off reversal, where applicable. EBITDA is a measure used by
Adjusted EBITDA (non-GAAP) Oncor to assess performance.
Total debt less transition bonds divided by Adjusted EBITDA. Transition, or
securitization, bonds are serviced by a regulatory transition charge on wires
Debt/Adjusted EBITDA rates and are therefore excluded from debt in credit reviews. Debt / EBITDA is
(non-GAAP) a measure used by Oncor to assess credit quality.
Adjusted EBITDA/Cash Interest Adjusted EBITDA divided by cash interest expense is a measure used by
(non-GAAP) Oncor to assess credit quality.
Oncor Electric Delivery
13
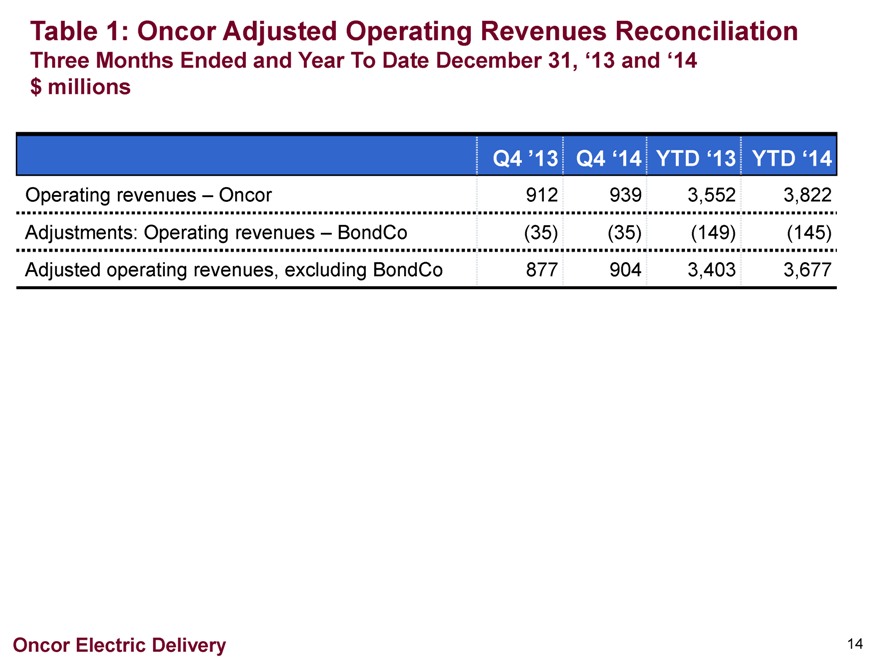
Table 1: Oncor Adjusted Operating Revenues Reconciliation
Three Months Ended and Year To Date December 31, ‘13 and ‘14 $ millions
Q4 ’13 Q4 ‘14 YTD ‘13 YTD ‘14
Operating revenues – Oncor 912 939 3,552 3,822
Adjustments: Operating revenues – BondCo (35) (35) (149) (145)
Adjusted operating revenues, excluding BondCo 877 904 3,403 3,677
Oncor Electric Delivery
14
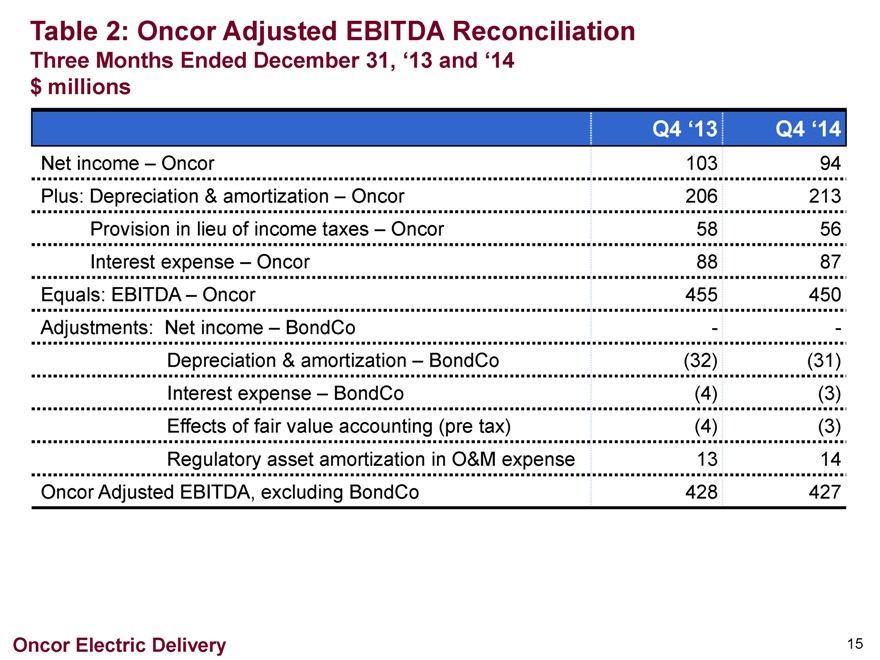
Table 2: Oncor Adjusted EBITDA Reconciliation
Three Months Ended December 31, ‘13 and ‘14 $ millions
Q4 ‘13 Q4 ‘14
Net income – Oncor 103 94
Plus: Depreciation & amortization – Oncor 206 213
Provision in lieu of income taxes – Oncor 58 56
Interest expense – Oncor 88 87
Equals: EBITDA – Oncor 455 450
Adjustments: Net income – BondCo - -
Depreciation & amortization – BondCo (32) (31)
Interest expense – BondCo (4) (3)
Effects of fair value accounting (pre tax) (4) (3)
Regulatory asset amortization in O&M expense 13 14
Oncor Adjusted EBITDA, excluding BondCo 428 427
Oncor Electric Delivery 15
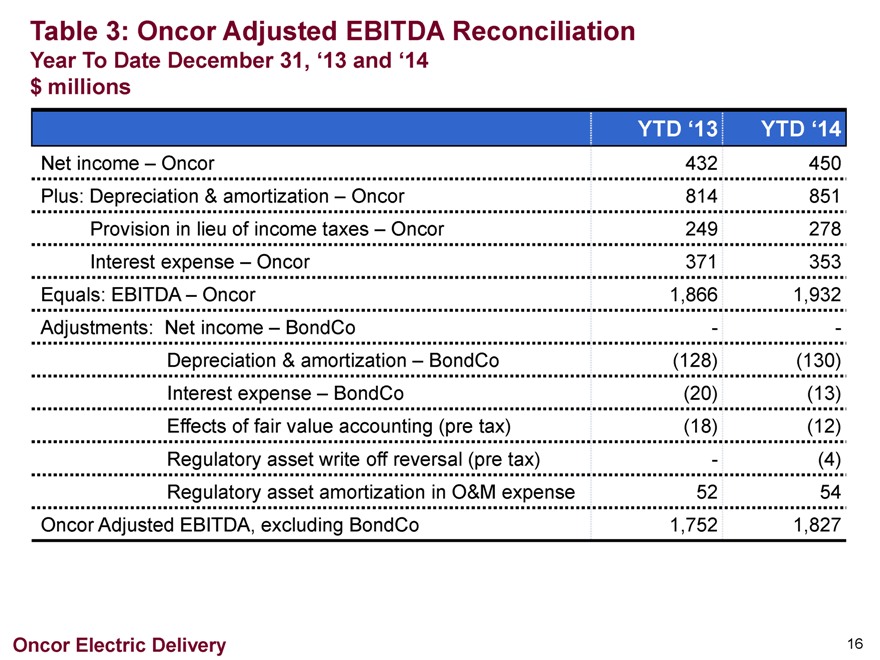
Table 3: Oncor Adjusted EBITDA Reconciliation
Year To Date December 31, ‘13 and ‘14 $ millions
YTD ‘13 YTD ‘14
Net income – Oncor 432 450
Plus: Depreciation & amortization – Oncor 814 851
Provision in lieu of income taxes – Oncor 249 278
Interest expense – Oncor 371 353
Equals: EBITDA – Oncor 1,866 1,932
Adjustments: Net income – BondCo - -
Depreciation & amortization – BondCo (128) (130)
Interest expense – BondCo (20) (13)
Effects of fair value accounting (pre tax) (18) (12)
Regulatory asset write off reversal (pre tax) - (4)
Regulatory asset amortization in O&M expense 52 54
Oncor Adjusted EBITDA, excluding BondCo 1,752 1,827
Oncor Electric Delivery
16
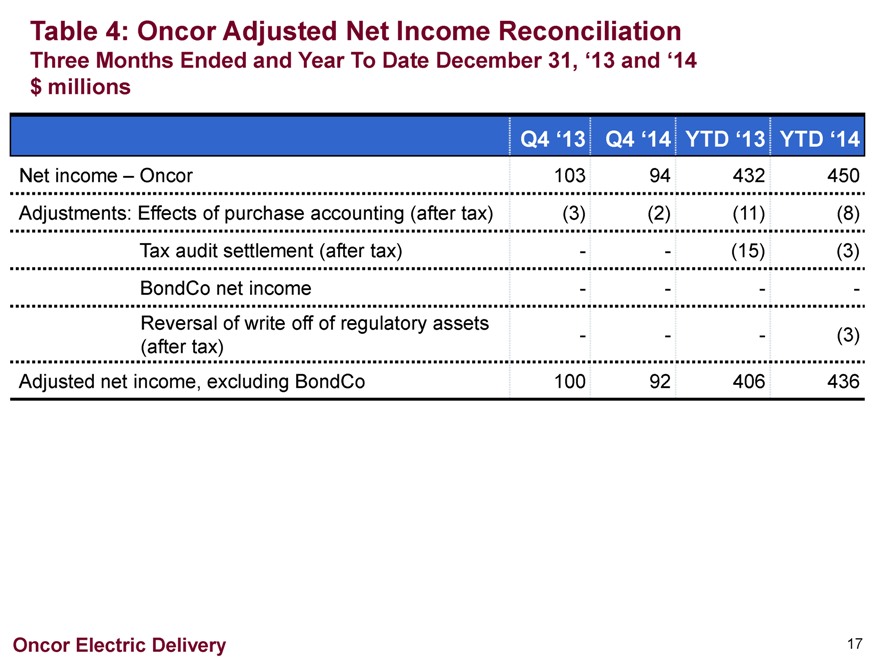
Table 4: Oncor Adjusted Net Income Reconciliation
Three Months Ended and Year To Date December 31, ‘13 and ‘14 $ millions
Q4 ‘13 Q4 ‘14 YTD ‘13 YTD ‘14
Net income – Oncor 103 94 432 450
Adjustments: Effects of purchase accounting (after tax) (3) (2) (11) (8)
Tax audit settlement (after tax) - - (15) (3)
BondCo net income - - - -
Reversal of write off of regulatory assets - - - (3)
(after tax)
Adjusted net income, excluding BondCo 100 92 406 436
Oncor Electric Delivery 17
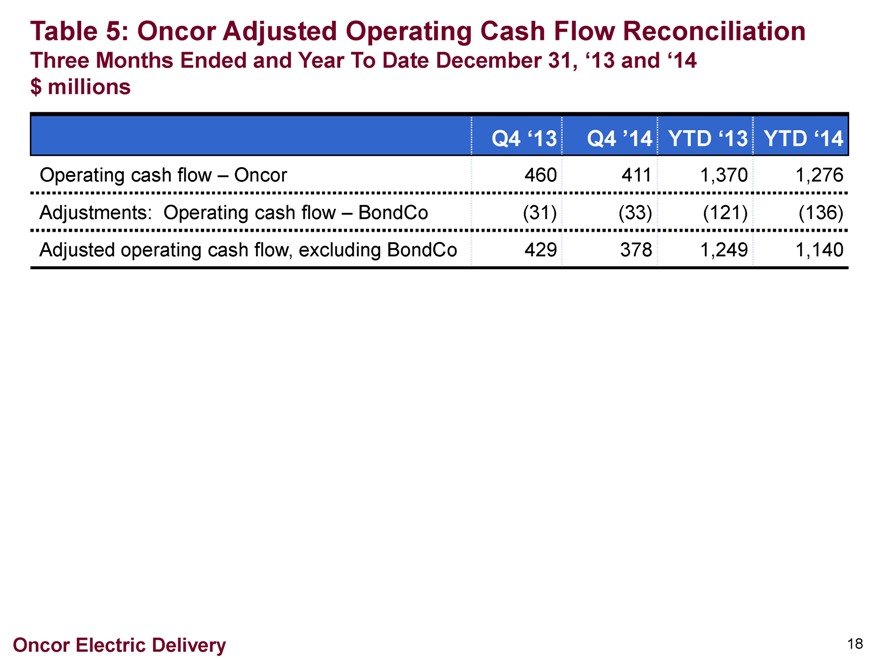
Table 5: Oncor Adjusted Operating Cash Flow Reconciliation
Three Months Ended and Year To Date December 31, ‘13 and ‘14 $ millions
Q4 ‘13 Q4 ’14 YTD ‘13 YTD ‘14
Operating cash flow – Oncor 460 411 1,370 1,276
Adjustments: Operating cash flow – BondCo (31) (33) (121) (136)
Adjusted operating cash flow, excluding BondCo 429 378 1,249 1,140
Oncor Electric Delivery
18
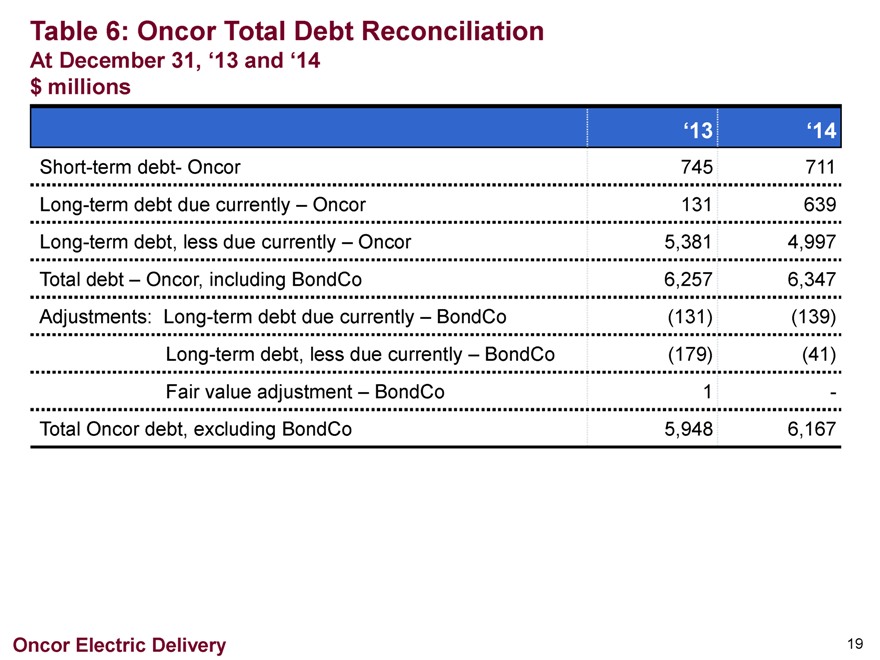
Table 6: Oncor Total Debt Reconciliation
At December 31, ‘13 and ‘14 $ millions
‘13 ‘14
Short-term debt- Oncor 745 711
Long-term debt due currently – Oncor 131 639
Long-term debt, less due currently – Oncor 5,381 4,997
Total debt – Oncor, including BondCo 6,257 6,347
Adjustments: Long-term debt due currently – BondCo (131) (139)
Long-term debt, less due currently – BondCo (179) (41)
Fair value adjustment – BondCo 1 -
Total Oncor debt, excluding BondCo 5,948 6,167
Oncor Electric Delivery
19
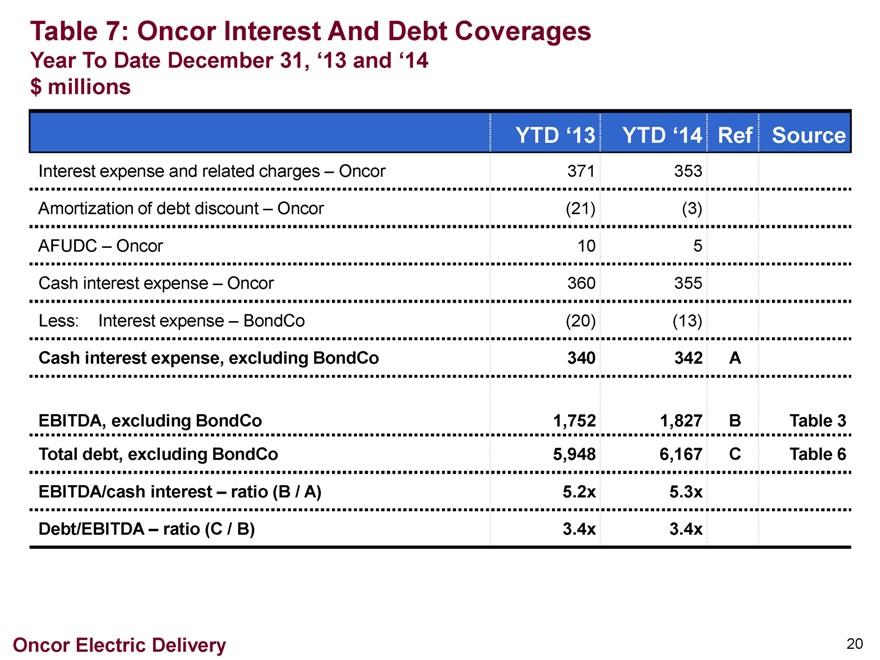
Table 7: Oncor Interest And Debt Coverages
Year To Date December 31, ‘13 and ‘14 $ millions
YTD ‘13 YTD ‘14 Ref Source
Interest expense and related charges – Oncor 371 353
Amortization of debt discount – Oncor (21) (3)
AFUDC – Oncor 10 5
Cash interest expense – Oncor 360 355
Less: Interest expense – BondCo (20) (13)
Cash interest expense, excluding BondCo 340 342 A
EBITDA, excluding BondCo 1,752 1,827 B Table 3
Total debt, excluding BondCo 5,948 6,167 C Table 6
EBITDA/cash interest – ratio (B / A) 5.2x 5.3x
Debt/EBITDA – ratio (C / B) 3.4x 3.4x
Oncor Electric Delivery
20