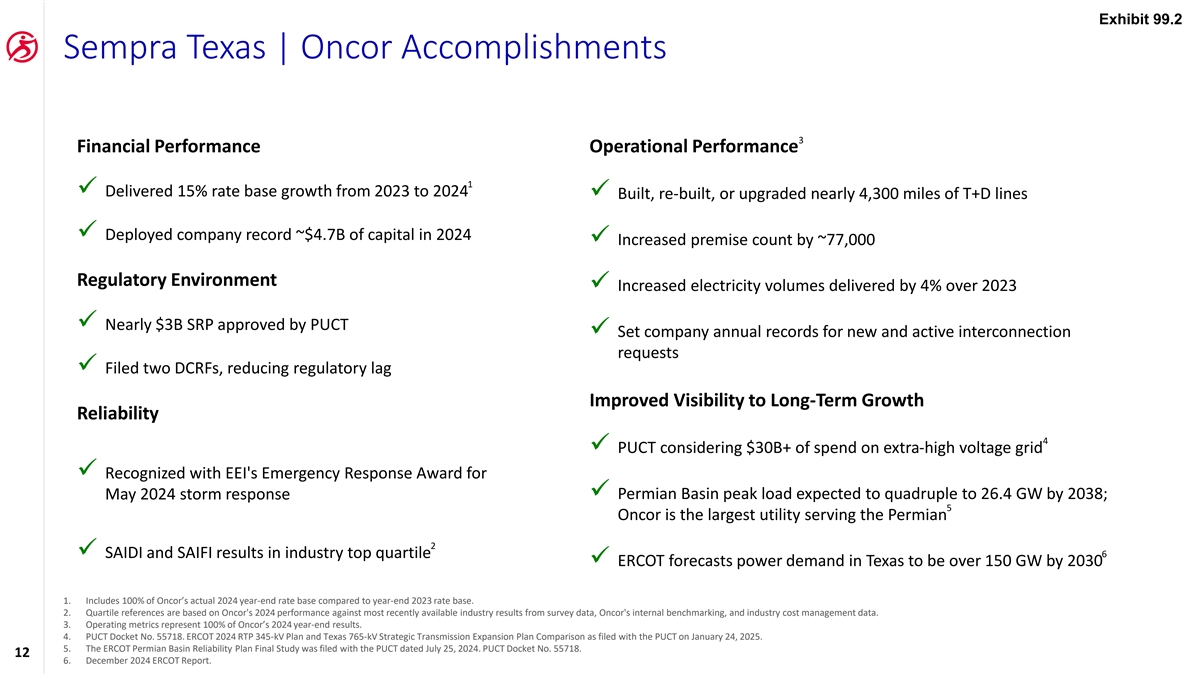
Exhibit 99.2 Sempra Texas | Oncor Accomplishments 3 Financial Performance Operational Performance 1 ✓ Delivered 15% rate base growth from 2023 to 2024 ✓ Built, re-built, or upgraded nearly 4,300 miles of T+D lines ✓ Deployed company record ~$4.7B of capital in 2024 ✓ Increased premise count by ~77,000 Regulatory Environment ✓ Increased electricity volumes delivered by 4% over 2023 ✓ Nearly $3B SRP approved by PUCT ✓ Set company annual records for new and active interconnection requests ✓ Filed two DCRFs, reducing regulatory lag Improved Visibility to Long-Term Growth Reliability 4 ✓ PUCT considering $30B+ of spend on extra-high voltage grid ✓ Recognized with EEI's Emergency Response Award for ✓ Permian Basin peak load expected to quadruple to 26.4 GW by 2038; May 2024 storm response 5 Oncor is the largest utility serving the Permian 2 6 ✓ SAIDI and SAIFI results in industry top quartile ✓ ERCOT forecasts power demand in Texas to be over 150 GW by 2030 1. Includes 100% of Oncor’s actual 2024 year-end rate base compared to year-end 2023 rate base. 2. Quartile references are based on Oncor's 2024 performance against most recently available industry results from survey data, Oncor's internal benchmarking, and industry cost management data. 3. Operating metrics represent 100% of Oncor’s 2024 year-end results. 4. PUCT Docket No. 55718. ERCOT 2024 RTP 345-kV Plan and Texas 765-kV Strategic Transmission Expansion Plan Comparison as filed with the PUCT on January 24, 2025. 5. The ERCOT Permian Basin Reliability Plan Final Study was filed with the PUCT dated July 25, 2024. PUCT Docket No. 55718. 12 6. December 2024 ERCOT Report.
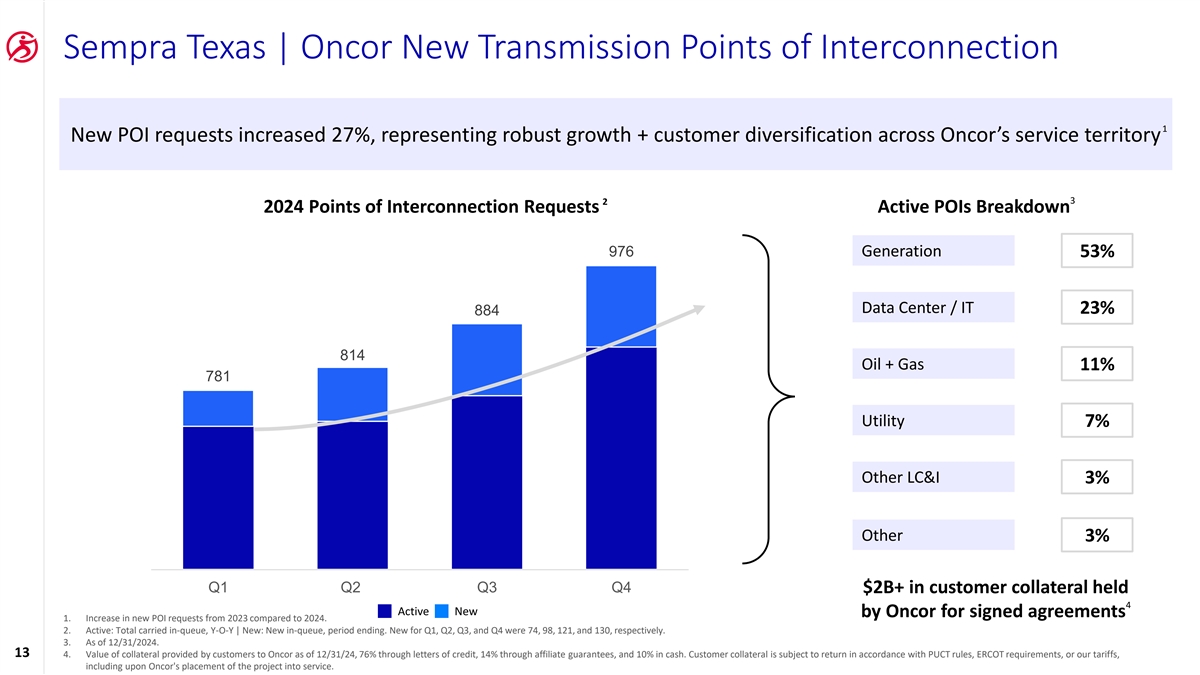
Sempra Texas | Oncor New Transmission Points of Interconnection 1 New POI requests increased 27%, representing robust growth + customer diversification across Oncor’s service territory 3 2 2024 Points of Interconnection Requests Active POIs Breakdown 1000 976 Generation 53% 950 Data Center / IT 23% 884 900 850 814 Oil + Gas 11% 781 800 750 Utility 7% 700 650 Other LC&I 3% 600 Other 3% 550 500 Q1 Q2 Q3 Q4 $2B+ in customer collateral held 4 Active New by Oncor for signed agreements 1. Increase in new POI requests from 2023 compared to 2024. 2. Active: Total carried in-queue, Y-O-Y | New: New in-queue, period ending. New for Q1, Q2, Q3, and Q4 were 74, 98, 121, and 130, respectively. 3. As of 12/31/2024. 13 4. Value of collateral provided by customers to Oncor as of 12/31/24, 76% through letters of credit, 14% through affiliate guarantees, and 10% in cash. Customer collateral is subject to return in accordance with PUCT rules, ERCOT requirements, or our tariffs, including upon Oncor's placement of the project into service.
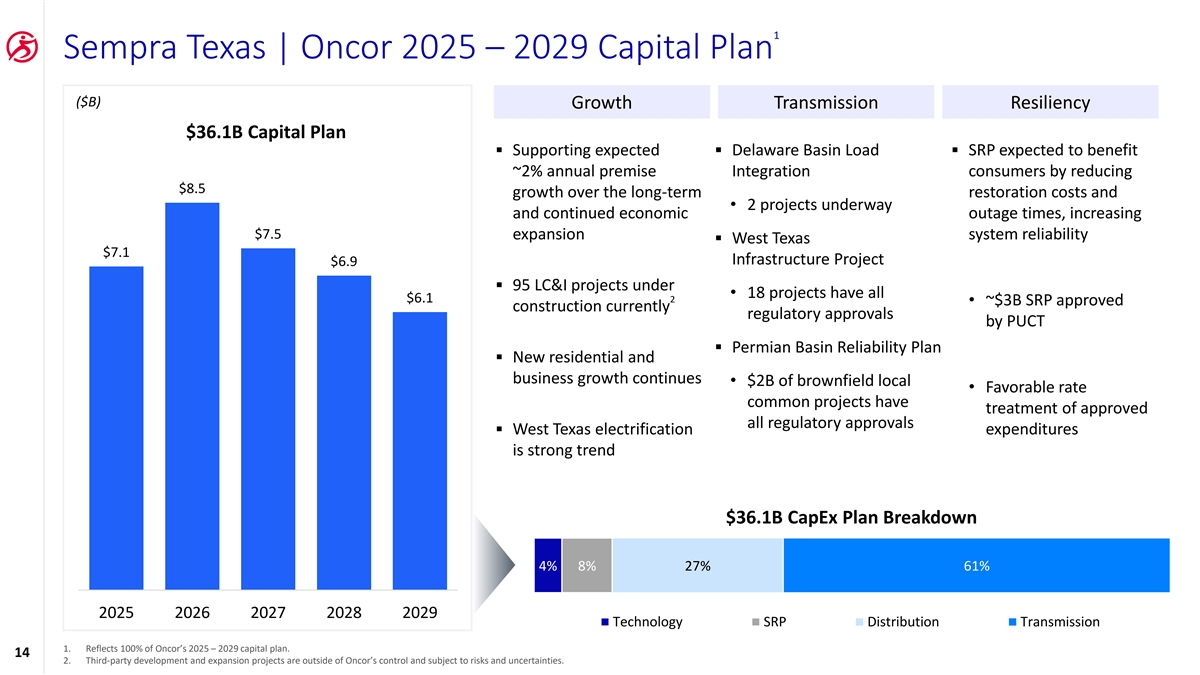
1 Sempra Texas | Oncor 2025 – 2029 Capital Plan ($B) Growth Transmission Resiliency $36.1B Capital Plan ▪ Supporting expected ▪ Delaware Basin Load ▪ SRP expected to benefit ~2% annual premise Integration consumers by reducing $8.5 growth over the long-term restoration costs and • 2 projects underway and continued economic outage times, increasing $7.5 expansion system reliability ▪ West Texas $7.1 Infrastructure Project $6.9 ▪ 95 LC&I projects under • 18 projects have all $6.1 2 • ~$3B SRP approved construction currently regulatory approvals by PUCT ▪ Permian Basin Reliability Plan ▪ New residential and business growth continues • $2B of brownfield local • Favorable rate common projects have treatment of approved all regulatory approvals ▪ West Texas electrification expenditures is strong trend $36.1B CapEx Plan Breakdown 4% 8% 27% 61% 2025 2026 2027 2028 2029 Technology SRP Distribution Transmission 1. Reflects 100% of Oncor’s 2025 – 2029 capital plan. 14 2. Third-party development and expansion projects are outside of Oncor’s control and subject to risks and uncertainties.
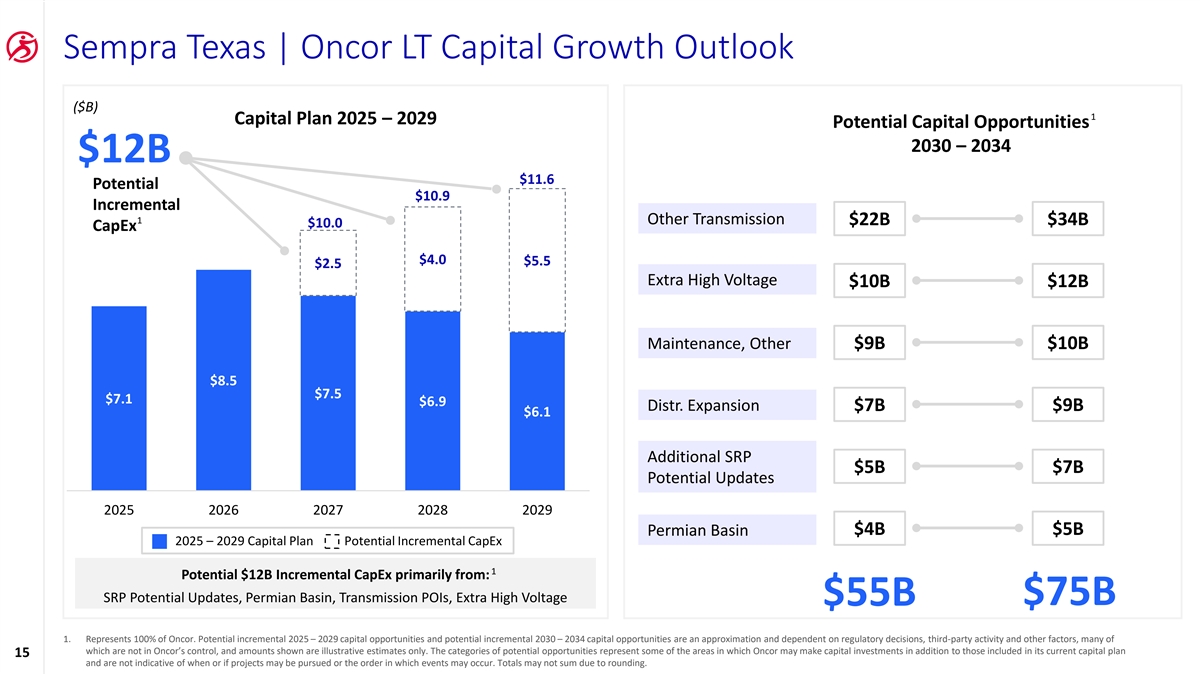
Sempra Texas | Oncor LT Capital Growth Outlook ($B) 1 Capital Plan 2025 – 2029 Potential Capital Opportunities 2030 – 2034 $12B $11.6 Potential $10.9 Incremental 1 O Oth ther er T Tr ran ansmiss smissio ion n $22B $34B $10.0 CapEx $4.0 $5.5 $2.5 Extr Extra a High High V Volt oltag age e $10B $12B Main Maint ten enan anc ce, e, O Oth ther er $9B $10B $8.5 $7.5 $7.1 $6.9 Dis Distr tr. . Expan Expansio sion n $7B $9B $6.1 Additional SRP Additional SRP Phases $5B $7B Potential Updates 2025 2026 2027 2028 2029 $4B $5B P Perm ermian ian Basin 2025 – 2029 Capital Plan Potential Incremental CapEx 1 Potential $12B Incremental CapEx primarily from: SRP Potential Updates, Permian Basin, Transmission POIs, Extra High Voltage $75B $55B 1. Represents 100% of Oncor. Potential incremental 2025 – 2029 capital opportunities and potential incremental 2030 – 2034 capital opportunities are an approximation and dependent on regulatory decisions, third-party activity and other factors, many of which are not in Oncor’s control, and amounts shown are illustrative estimates only. The categories of potential opportunities represent some of the areas in which Oncor may make capital investments in addition to those included in its current capital plan 15 and are not indicative of when or if projects may be pursued or the order in which events may occur. Totals may not sum due to rounding.
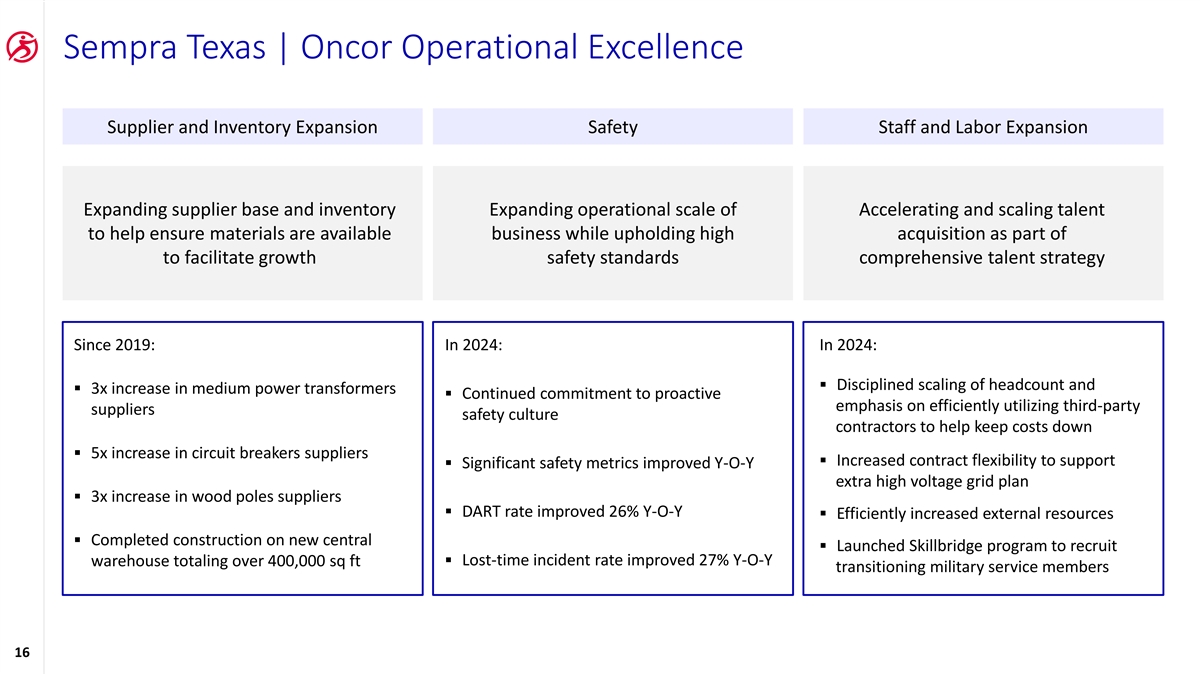
Sempra Texas | Oncor Operational Excellence Supplier and Inventory Expansion Safety Staff and Labor Expansion Expanding supplier base and inventory Expanding operational scale of Accelerating and scaling talent to help ensure materials are available business while upholding high acquisition as part of to facilitate growth safety standards comprehensive talent strategy Since 2019: In 2024: In 2024: ▪ Disciplined scaling of headcount and ▪ 3x increase in medium power transformers ▪ Continued commitment to proactive emphasis on efficiently utilizing third-party suppliers safety culture contractors to help keep costs down ▪ 5x increase in circuit breakers suppliers ▪ Increased contract flexibility to support ▪ Significant safety metrics improved Y-O-Y extra high voltage grid plan ▪ 3x increase in wood poles suppliers ▪ DART rate improved 26% Y-O-Y ▪ Efficiently increased external resources ▪ Completed construction on new central ▪ Launched Skillbridge program to recruit ▪ Lost-time incident rate improved 27% Y-O-Y warehouse totaling over 400,000 sq ft transitioning military service members 16
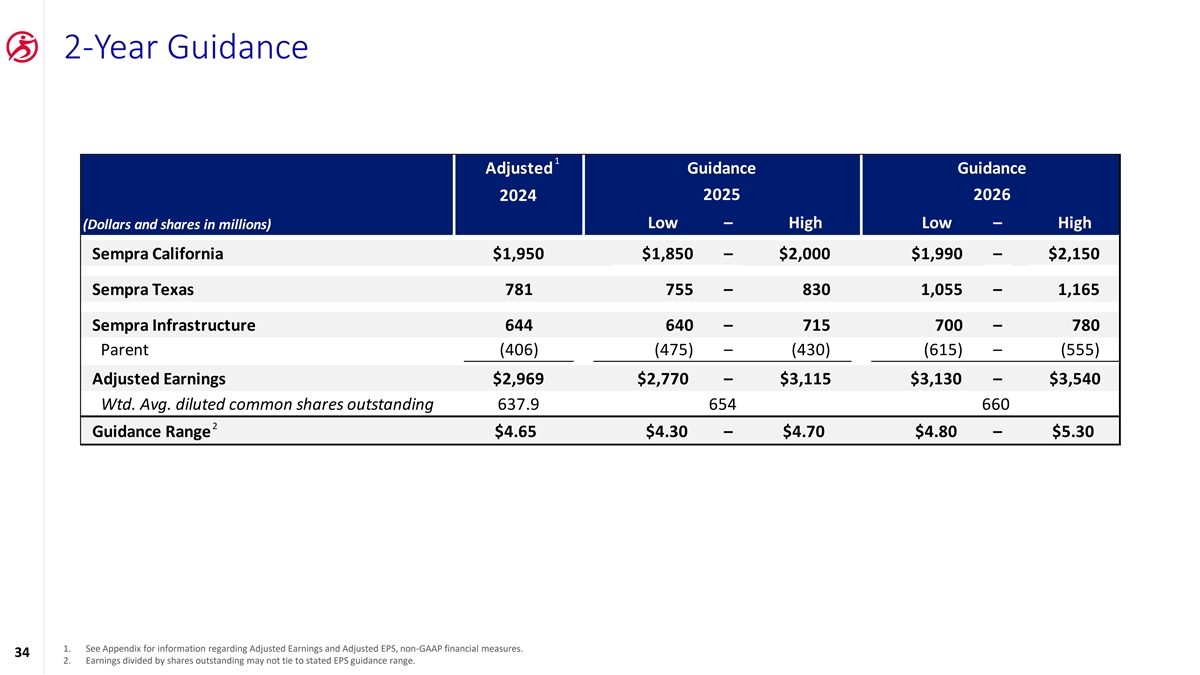
2-Year Guidance 1 Adjusted Guidance Guidance 2025 2026 2024 Low – High Low – High (Dollars and shares in millions) Sempra California $1,950 $1,850 – $2,000 $1,990 – $2,150 Sempra Texas 781 755 – 830 1,055 – 1,165 Sempra Infrastructure 644 640 – 715 700 – 780 Parent (406) (475) – (430) (615) – (555) Adjusted Earnings $2,969 $2,770 – $3,115 $3,130 – $3,540 Wtd. Avg. diluted common shares outstanding 637.9 654 660 2 Guidance Range $4.65 $4.30 – $4.70 $4.80 – $5.30 1. See Appendix for information regarding Adjusted Earnings and Adjusted EPS, non-GAAP financial measures. 34 2. Earnings divided by shares outstanding may not tie to stated EPS guidance range.
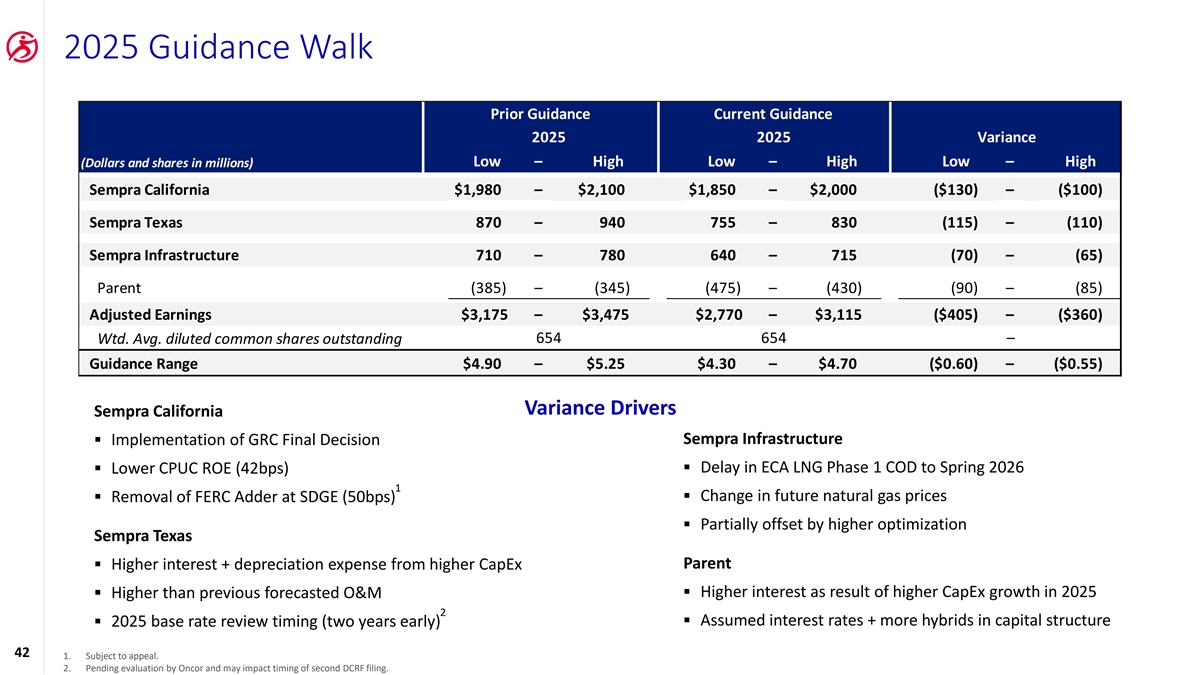
2025 Guidance Walk Prior Guidance Current Guidance 2025 2025 Variance Low – High Low – High Low – High (Dollars and shares in millions) Sempra California $1,980 – $2,100 $1,850 – $2,000 ($130) – ($100) Sempra Texas 870 – 940 755 – 830 (115) – (110) Sempra Infrastructure 710 – 780 640 – 715 (70) – (65) Parent (385) – (345) (475) – (430) (90) – (85) Adjusted Earnings $3,175 – $3,475 $2,770 – $3,115 ($405) – ($360) Wtd. Avg. diluted common shares outstanding 654 654 – Guidance Range $4.90 – $5.25 $4.30 – $4.70 ($0.60) – ($0.55) Variance Drivers Sempra California Sempra Infrastructure ▪ Implementation of GRC Final Decision ▪ Delay in ECA LNG Phase 1 COD to Spring 2026 ▪ Lower CPUC ROE (42bps) 1 ▪ Change in future natural gas prices ▪ Removal of FERC Adder at SDGE (50bps) ▪ Partially offset by higher optimization Sempra Texas Parent ▪ Higher interest + depreciation expense from higher CapEx ▪ Higher interest as result of higher CapEx growth in 2025 ▪ Higher than previous forecasted O&M 2 ▪ 2025 base rate review timing (two years early)▪ Assumed interest rates + more hybrids in capital structure 42 1. Subject to appeal. 2. Pending evaluation by Oncor and may impact timing of second DCRF filing.
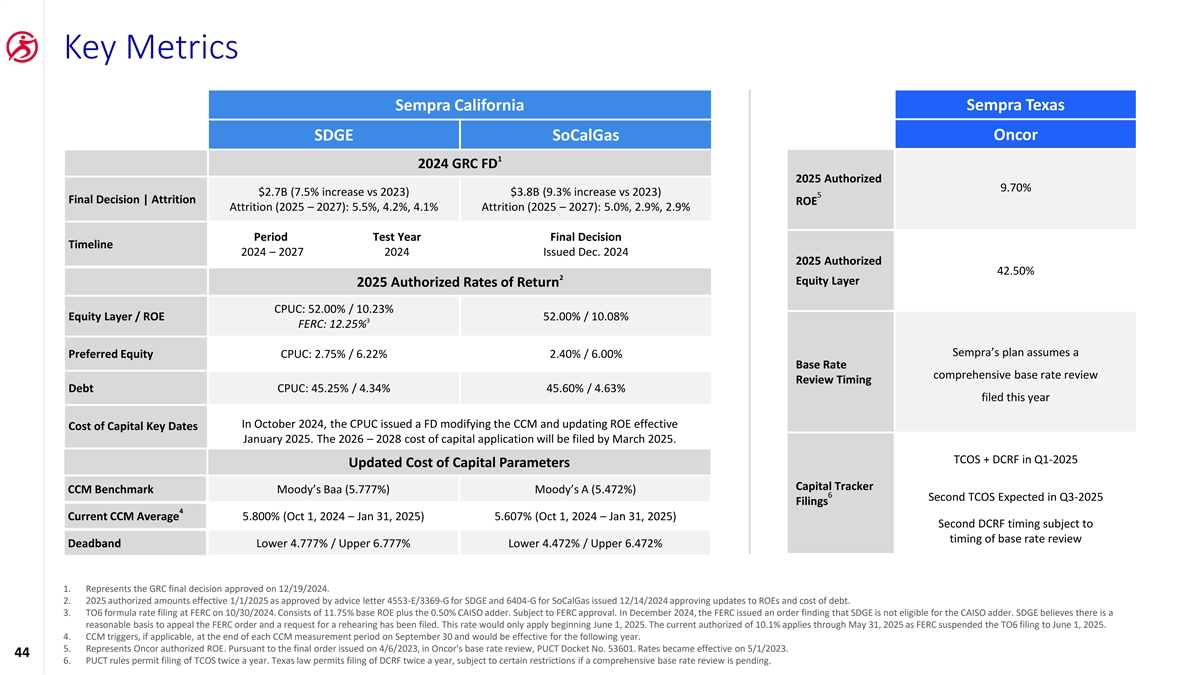
Key Metrics Sempra Texas Sempra California Oncor SDGE SoCalGas 1 2024 GRC FD 2025 Authorized 9.70% $2.7B (7.5% increase vs 2023) $3.8B (9.3% increase vs 2023) 5 Final Decision | Attrition ROE Attrition (2025 – 2027): 5.5%, 4.2%, 4.1% Attrition (2025 – 2027): 5.0%, 2.9%, 2.9% Period Test Year Final Decision Timeline 2024 – 2027 2024 Issued Dec. 2024 2025 Authorized 42.50% 2 Equity Layer 2025 Authorized Rates of Return CPUC: 52.00% / 10.23% Equity Layer / ROE 52.00% / 10.08% 3 FERC: 12.25% Sempra’s plan assumes a Preferred Equity CPUC: 2.75% / 6.22% 2.40% / 6.00% Base Rate comprehensive base rate review Review Timing Debt CPUC: 45.25% / 4.34% 45.60% / 4.63% filed this year In October 2024, the CPUC issued a FD modifying the CCM and updating ROE effective Cost of Capital Key Dates January 2025. The 2026 – 2028 cost of capital application will be filed by March 2025. TCOS + DCRF in Q1-2025 Updated Cost of Capital Parameters Capital Tracker CCM Benchmark Moody’s Baa (5.777%) Moody’s A (5.472%) 6 Second TCOS Expected in Q3-2025 Filings 4 Current CCM Average 5.800% (Oct 1, 2024 – Jan 31, 2025) 5.607% (Oct 1, 2024 – Jan 31, 2025) Second DCRF timing subject to timing of base rate review Deadband Lower 4.777% / Upper 6.777% Lower 4.472% / Upper 6.472% 1. Represents the GRC final decision approved on 12/19/2024. 2. 2025 authorized amounts effective 1/1/2025 as approved by advice letter 4553-E/3369-G for SDGE and 6404-G for SoCalGas issued 12/14/2024 approving updates to ROEs and cost of debt. 3. TO6 formula rate filing at FERC on 10/30/2024. Consists of 11.75% base ROE plus the 0.50% CAISO adder. Subject to FERC approval. In December 2024, the FERC issued an order finding that SDGE is not eligible for the CAISO adder. SDGE believes there is a reasonable basis to appeal the FERC order and a request for a rehearing has been filed. This rate would only apply beginning June 1, 2025. The current authorized of 10.1% applies through May 31, 2025 as FERC suspended the TO6 filing to June 1, 2025. 4. CCM triggers, if applicable, at the end of each CCM measurement period on September 30 and would be effective for the following year. 5. Represents Oncor authorized ROE. Pursuant to the final order issued on 4/6/2023, in Oncor's base rate review, PUCT Docket No. 53601. Rates became effective on 5/1/2023. 44 6. PUCT rules permit filing of TCOS twice a year. Texas law permits filing of DCRF twice a year, subject to certain restrictions if a comprehensive base rate review is pending.
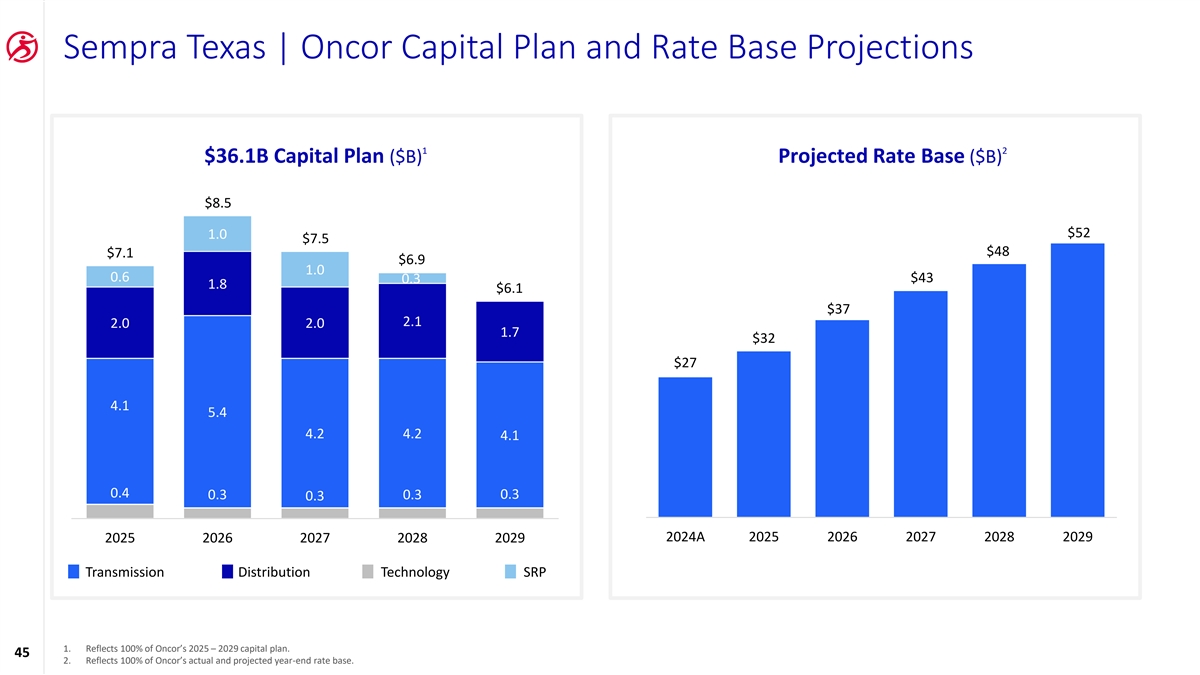
Sempra Texas | Oncor Capital Plan and Rate Base Projections 1 2 $36.1B Capital Plan ($B) Projected Rate Base ($B) $8.5 $52 1.0 $7.5 $48 $7.1 $6.9 1.0 0.6 $43 0.3 1.8 $6.1 $37 2.1 2.0 2.0 1.7 $32 $27 4.1 5.4 4.2 4.2 4.1 0.4 0.3 0.3 0.3 0.3 2024A 2025 2026 2027 2028 2029 2025 2026 2027 2028 2029 Transmission Distribution Technology SRP 1. Reflects 100% of Oncor’s 2025 – 2029 capital plan. 45 2. Reflects 100% of Oncor’s actual and projected year-end rate base.