UNITED STATES
SECURITIES AND EXCHANGE COMMISSION
Washington, D.C. 20549
FORM N-CSR
CERTIFIED SHAREHOLDER REPORT OF REGISTERED
MANAGEMENT INVESTMENT COMPANIES
Investment Company Act file number: 811-21210
Alpine Income Trust
(Exact name of registrant as specified in charter)
2500 Westchester Avenue, Suite 215
Purchase, New York 10577
(Address of principal executive offices)(Zip code)
(Name and Address of Agent for Service) | Copy to: |
Samuel A. Lieber Alpine Woods Capital Investors, LLC 2500 Westchester Avenue, Suite 215 Purchase, New York 10577 | Rose DiMartino Attorney at Law Willkie Farr & Gallagher 787 7th Avenue, 40th Floor New York, New York 10019 |
Registrant’s telephone number, including area code: (914) 251-0880
Date of fiscal year end: October 31
Date of reporting period: November 1, 2014 - October 31, 2015
Item 1: Shareholder Report

Equity & Income Funds
Alpine Dynamic Dividend Fund
Institutional Class (ADVDX)
Class A (ADAVX) | | Alpine Small Cap Fund
Institutional Class (ADINX)
Class A (ADIAX) |
Alpine Rising Dividend Fund
Institutional Class (AADDX)
Class A (AAADX) | | Alpine Ultra Short Municipal Income Fund
Institutional Class (ATOIX)
Class A (ATOAX) |
Alpine Financial Services Fund
Institutional Class (ADFSX)
Class A (ADAFX) | | Alpine High Yield Managed Duration
Municipal Fund
Institutional Class (AHYMX)
Class A (AAHMX) |
October 31,
2015
Annual Report
Table of Contents
Additional Alpine Funds are offered in the Alpine Equity Trust. These Funds include:
| Alpine International Real Estate Equity Fund | Alpine Emerging Markets Real Estate Fund |
| | |
| Alpine Realty Income & Growth Fund | Alpine Global Infrastructure Fund |
Alpine’s Real Estate Funds’ investment objectives, risks, charges and expenses must be considered carefully before investing in funds of the Alpine Equity Trust. The statutory and summary prospectuses contain this and other important information about the investment company, and it may be obtained by calling 1-888-785-5578, or visiting www.alpinefunds.com. Read it carefully before investing.
Mutual fund investing involves risk. Principal loss is possible.
Alpine’s Investment Outlook

Dear Shareholders:
A few of the watchwords for financial markets over the past year included excess liquidity, unicorn valuations, risk-on/risk-off, deflation, income inequality and, unfortunately, terrorism. Perhaps there is another way to describe the overarching themes driving the markets as we enter the eighth year of recovery since the Great Financial Recession. The markets are still captive to the complexity and contradiction of fundamental data. Alpine believes that this condition stems from the unfocused, weak economic expansion. Atypically, the markets are dependent not upon the leadership of governments or industry but from central banks. Historically, economic leadership has not been the role of central banks. However, corporate spending has been limited and government stimulus has been constrained by either ideology (austerity) or weak tax revenues. This has placed an unusual burden on central banks, worldwide, which are designed and staffed to balance or neutralize unfavorable economic forces. Perhaps that is why both consumer and business confidence has been weak during this cycle as central banks have, by default, become the primary source of both economic stimulus and direction during the past six years, yet by their nature, they can only provide monetary leadership.
As we look back on fiscal year 2015, and prepare for 2016, the slow recovery of both global economies and evolving capital markets is very clear. Nonetheless, this has been an eventful year filled with notable shifts and even dramatic reversals leading to periods of increased volatility. The dominant factors have been the anticipated emergence of divergent interest rate trends between cyclically advancing countries and those which lag behind. At the start of 2015, it was clear to the markets that the Federal Reserve was done with quantitative easing (QE), — after first signaling this intention back in May 2013 — to the point where the Fed was about to raise interest rates. Also, at the beginning of the year it was clear that the European Central Bank (ECB) was about to embark upon a program of quantitative easing trailing the Fed’s lead by over five years.
As we embark upon 2016, the Fed seems likely to finally raise interest rates, if only by a quarter percent, while the ECB has announced an extension of QE into 2017. Long-term trends remain in place, so we believe that this divergence between slowly strengthening economies and still weak, lagging countries, may continue for another two to three years, taking us into 2018. It is conceivable that even more time will be required before another global
super cycle of demand exceeding supply emerges. At minimum, any major global upswing of demand for goods and services may take three to five years to emerge. This suggests that inflation may not become a significant threat for such a period of time. The upshot is that we may see U.S. interest rates gradually increase over several years by 100 to 250 basis points towards normalized historical levels. We believe the ECB is at least three years behind the Fed. This also suggests that we may be experiencing an historically extended period of economic growth without recession that could last into the next decade.
Members of our Investment team, with respect to their areas of expertise, have made the following observations covering both the past year and the new year. Bruce Ebnother, a member of our real estate investment team noted that “Unlike typical recovery cycles... only a moderate amount of new supply has come online.” Mark Austin, who covers global housing stocks, commented that “wages (in the U.S.) have grown faster over the past year than at any other point during this recovery since 2008 and unemployment has dropped to its lowest level since then. Despite this, industry fundamentals continue to point to merely another year of slow but steady growth”. He is, however, more optimistic because in 2018 “40 million millennials will turn 25, an age when historically increased numbers begin looking for new homes. Already, we are experiencing a pick-up in household formation.” So, it appears that both commercial and residential real estate in the U.S., among other countries, is undersupplied from a cyclical perspective and demand is underpinned by solid fundamentals.
In contrast, the energy and mining sectors have only recently experienced a significant downdraft in demand at a time where productive capacity hit a new peak. Thus, over the past year, we have only begun to see a modest reduction of output despite a significant collapse in prices due to the excesses of the commodity sector. Sarah Hunt, who follows industrial companies and the oil sector, in particular, as part of our commodities team, observed that the old oil industry adage that “low prices cure low prices” (where supplies typically reduce production in the face of falling prices only when the cost of extraction is higher than the sales price) did not hold true as “large fiscal inventories... and current future strip pricing is not predicting a quick fix for low oil prices”. Thus, we believe consumers and certain industries should continue to benefit from the lowest oil prices since 2004, roughly 60% below peak levels. This could last well into 2016, before gradually moving higher.
1
Supply-side issues have generally not been such a factor in the healthcare sector as demand growth continues. Jonathan Gelb, who follows the healthcare sector for us, notes that “companies that produce clinically different drugs that create cost savings will remain insulated from pricing pressure, however, companies whose models depend on aggressive pricing actions without significant innovation are likely to see growth impacted as soon as 2016.” No doubt his comments apply to both Turing Pharmaceutical and Valent Pharmaceuticals, which relied upon repackaging acquired medication at higher prices for a captive marketplace. With limited innovation, he believes that consolidation “is a theme that will likely continue into 2016, since nearly $265 billion worth of mergers or acquisitions (M&As) were announced during 2015.
Another area where acquisitions have been on the rise, creating revenue and hopefully, earnings growth, has been the financial sector. Peter Kovalski, who follows regional banks and financial services for us, noted that M&A activity in the U.S. for 2015 to date has totaled 243 announced deals. What’s notable is that this volume is only slightly behind last year’s level of 284 deals, the most since 2006 when 299 transactions took place. The difference is one of scale as the aggregate deal value in 2006 was $109 billion compared to only $19 billion in 2014. Thus, the typical transaction was less than a fifth of the size of previous transactions in 2006, suggesting that “the main driver behind these small bank deals is the rising cost of regulatory compliance ... a burden which is not going away.” The implication of this trend is that small local banks may not be as competitive in their local markets as larger, regional players. This may accelerate the underlying consolidation trend in which the number of banks in the U.S. has fallen from 14,907 in 1984 to 5,410 in 2015.
In a world where the pie is only growing slowly or for just a few, where their industry or market share is shrinking due to regulations, technological change or better-capitalized competition, the best business alternative may be a merger or acquisition. Indeed, Brian Hennessey, who follows commodity-related businesses in the mining and industrial materials companies for us, described 2015 as “the year of the mega mergers.” He expects this to continue in 2016 as “many forces driving consolidation across the developed world with low interest rates and high uncertainty with respect to the regulatory and macro-economic backdrop.” Naturally such consolidation can create opportunities for both astute and opportunistic acquirers as well as for companies whose shares have been undervalued by the market place. The broad economic implications of strategic or complementary consolidation is that it encourages buyers to shut the least effective operators or least efficient producers, which curtails excess production, permitting supply and demand to find equilibrium levels faster than they might otherwise. Companies structured merely to grow through acquisitions, however, may lose their luster if they cannot innovate or continue to find M&A opportunities for expansion. Such risks have driven the market to place of particularly high earnings multiples on technological leaders including Facebook, Amazon, Netflix
and Google (now known as Alphabet), among others which are expanding geographically, across platforms and market segments, while both making acquisitions and pushing innovation in ways that portend an extended period of revenue expansion.
As we look forward to 2016 and beyond, we should note that a key fundamental driver of growth is in fact demographic. That is, continual global population growth and the trending evolution of agrarian populations moving to urban industrial lifestyles, transitioning from subsistence to higher levels of productivity. This ongoing shift has not only been true of emerging countries but even here at home where many recent college graduates have chosen to live in urban settings, leading to a rebirth of a number of downtowns throughout the U.S. This has put extra demands upon infrastructure while creating new nodes for consumer activity, which, of course, has led to rising real estate values in many places. The rapidly expanding capacity to make the world our “oyster,” no longer depending upon local merchants or service providers to enhance our lifestyle, may prove to be an affirmation of our technological prowess even though there might be a range of social consequences. That said, the increased access to information, as well as goods and services, is opening up new avenues for creativity on both personal and societal levels. Those companies that can benefit from these different trends—old and new, small and large-should be able to generate attractive growth. As the global economy gradually returns to normalized levels of expansion, we would anticipate that the period of corporate consolidation through M&A will evolve towards a new period of capital investment and innovation. Even though this recent period of economic recovery has been quite extended, we are optimistic that the longer-term dynamic for continued expansion will become more apparent in the months and quarters ahead of us.
Thank you for your interest and support.
Sincerely,

Samuel A. Lieber
President
Past performance is not a guarantee of future results. The specific market, sector or investment conditions that contribute to a Fund’s performance may not be replicated in future periods.
Mutual fund investing involves risk. Principal loss is possible. Please refer to individual letters for risks specific to that fund.
This letter and the letters that follow represent the opinions of the Funds’ management and are subject to change, are not guaranteed and should not be considered recommendations to buy or sell any security. The information provided is not intended to be, and is not, a forecast of future events, a guarantee of results, or investment advice.
2
| Disclosures and Definitions |  |
Please refer to the Schedule of Portfolio Investments for each Fund’s holding information. Fund holdings and sector allocations are subject to change and should not be considered a recommendation to buy or sell any security.
Favorable tax treatment of Fund distributions may be adversely affected, changed or repealed by future changes in tax laws. Alpine may not be able to anticipate the level of dividends that companies will pay in any given timeframe.
The Funds’ monthly distributions may consist of net investment income, net realized capital gains and/or a return of capital. If a distribution includes anything other than net investment income, the Funds will provide a notice of the best estimate of its distribution sources when distributed, which will be posted on the Funds’ website: www.alpinefunds.com, or can be obtained by calling 1-800-617-7616. We estimate that the Alpine Series and Income Trusts did not pay any distributions during the fiscal annual period ending October 31, 2015 through a return of capital. A return of capital distribution does not necessarily reflect the Funds’ performance and should not be confused with “yield” or “income.” Final determination of the Federal income tax characteristics of distributions paid during the calendar year will be provided on U.S. Form 1099-DIV, which will be mailed to shareholders. Please consult your tax advisor for further information.
All investments involve risk. Principal loss is possible. A small portion of the S&P 500 yield may include return of capital; the 10-year Treasury yield does not include return of capital; Corporate bonds and High Yield Bonds generally do not have return of capital; a portion of the dividend paid by REITs and REIT preferred stock may be deemed a return of capital for tax purposes in the event the company pays a dividend greater than its taxable income. A stock may trade with more or less liquidity than a bond depending on the number of shares and bonds outstanding, the size of the company, and the demand for the securities. The REIT and REIT preferred stock market are smaller than the broader equity and bond markets and often trade with less liquidity than these markets depending upon the size of the individual issue and the demand of the securities. Treasury notes are guaranteed by the U.S. Government and thus they are considered to be safer than other asset classes. Tax features of a Treasury Note, Corporate bond, Stock, High Yield bond, REITs and REIT preferred stock may vary based on an individual circumstances. Consult a tax professional for additional information. Neither the Fund nor any of its representatives may give tax advice. Investors should consult their tax advisor for information concerning their particular situation.
Standard & Poor’s Financial Services LLC (S&P) is a financial services company, a division of McGraw Hill Financial that publishes financial research and analysis on stocks and bonds. S&P is considered one of the Big Three credit-rating agencies, which also include Moody’s Investor Service and Fitch Ratings.
S&P assigns rating on a scale of ‘D’ to ‘AAA’, with ‘D’ the lowest/weakest rating, indicating a default, and ‘AAA’ the highest/strongest rating, indicating the strongest credit quality in S&P’s spectrum of credit ratings.
S&P incorporates a broad number of credit areas of each entity/municipality when assigning a bond rating to an entity’s debt instrument, including: (a) financial position, which encompasses liquidity metrics, cash reserves, non-liquid assets, liabilities, and other financial metrics; (b) debt position, which includes long and short-term bonded debt and other privately-placed notes/bonds, leases and other off-balance sheet liabilities; (c) pension and Other Post-Employment Benefits (OPEB); (d) socio-economic indices; (e) the aptitude and sophistication of management.
Earnings Growth and EPS Growth are not measures of the Funds’ future performance.
Diversification does not assure a profit or protect against loss in a declining market.
Must be preceded or accompanied by a prospectus.
Quasar Distributors, LLC, distributor.
Equity Income Funds – Definitions
Barclays Municipal Bond High Yield (non-Investment Grade) Index is the Muni High Yield component of the Barclays Municipal Bond Index. The Barclays Municipal Bond Index is a rules-based, market-value-weighted index engineered for the long-term tax-exempt bond market.
Barclays Municipal Bond: 1 Year (1-2) Index is a total return benchmark of BAA3 ratings or better designed to measure returns for tax exempt assets.
Basis Point is a value equaling one one-hundredth of a percent (1/100 of 1%).
Beta measures the sensitivity of the investment to the movements of its benchmark. A beta higher than 1.0 indicates the investment has been more volatile than the benchmark and a beta of less than 1.0 indicates that the investment has been less volatile than the benchmark.
Bloomberg Fair Value 10-Year U.S. General Obligation AAA Index is populated with U.S. municipal general obligations (G.O.) with an average rating of AAA from Moody’s and S&P, with an average maturity of ten years. The option-free yield curve is built using option-adjusted spread (OAS) model. Furthermore, the index is derived
3
| Disclosures and Definitions (Continued) | |
from contributed pricing from the Municipal Securities Rulemaking Board (MSRB), new issues calendars and other proprietary contributed prices.
Cash flow measures the cash generating capability of a company by adding non-cash charges (e.g. depreciation) and interest expense to pretax income.
The Chicago Board Options Exchange Volatility Index (VIX) reflects a market estimate of future volatility, based on the weighted average of the implied volatilities for a wide range of strikes.
Dividend Yield: The yield a company pays out to its shareholders in the form of dividends. It is calculated by taking the amount of dividends paid per share over a specific period of time and dividing by the stock’s price.
Dow Jones Industrial Average is a price-weighted average of 30 blue-chip stocks that are generally the leaders in their industry.
Duration is a commonly used measure of the potential volatility of the price of a debt securities, prior to maturity. Securities with a longer duration generally have more volatile prices than securities of comparable quality with a shorter duration
Effective Duration is a duration calculation for bonds with embedded options. Effective duration takes into account that expected cash flows will fluctuate as interest rates change. Please note, duration measures the sensitivity of price (the value of principal) of a fixed-income investment to a change in interest rates.
Free cash flow is a measure of financial performance calculated as operating cash flow minus capital expenditures. Free cash flow (FCF) represents the cash that a company is able to generate after laying out the money required to maintain or expand its asset base. Free cash flow is important because it allows a company to pursue opportunities that enhance shareholder value.
KBW Nasdaq Bank Index is designed to track the performance of the leading banks and thrifts that are publicly-traded in the U.S. The Index includes 24 banking stocks representing the large U.S. national money centers, regional banks and thrift institutions.
Markit Index of Manufacturing measures the performance of the manufacturing sector and is derived from a survey of 600 industrial companies.
MSCI All Country World Index is a total return, free-float adjusted market capitalization weighted index that captures large and mid-cap representation across 24 Developed and 21 Emerging Markets countries. With 2,483 constituents, the index covers approximately 85% of the
global investable equity opportunity set. Net total return indices reinvest dividends after the deduction of withholding taxes, using (for international indices) a tax rate applicable to non-resident institutional investors who do not benefit from double taxation treaties. Source: MSCI. MSCI data may not be reproduced or used for any other purpose. MSCI provides no warranties, has not prepared or approved this report, and has no liability hereunder.
MSCI Emerging Markets Index is a total return, free-float adjusted market capitalization weighted index that is designed to measure the equity market performance in the global emerging markets. Source: MSCI. MSCI data may not be reproduced or used for any other purpose. MSCI provides no warranties, has not prepared or approved this report, and has no liability hereunder.
MSCI Europe Index is a free float-adjusted market capitalization weighted index that is designed to measure the equity market performance of the developed markets in Europe. Source: MSCI. MSCI makes no express or implied warranties or representations and shall have no liability whatsoever with respect to any MSCI data contained herein. The MSCI data may not be further redistributed or used as a basis for other indices or any securities or financial products. This report is not approved, reviewed or produced by MSCI.
NASDAQ Financial 100 Total Return Index is a total return index that includes 100 of the largest domestic and international financial securities listed on The NASDAQ Stock Market based on market capitalization. They include companies classified according to the Industry Classification Benchmark as Financials, which are included within the NASDAQ Bank, NASDAQ Insurance, and NASDAQ Other Finance Indexes.
Operating ratio is a company’s operating expenses as a percentage of revenue. This financial ratio is most commonly used for industries which require a large percentage of revenues to maintain operations.
Risk on/Risk off refers to changes in investment activity in response to global economic patterns. When risk is perceived as low, investors tend to engage in higher-risk investments. When risk is perceive as high, investors tend to engage in lower-risk investments.
Russell 2000® Index measures the performance of the small-cap segment of the U.S. equity universe and includes approximately 2000 of the smallest securities based on a combination of their market cap and current index membership. Source: FTSE Russell Indexes. “FTSE®”, “Russell®”, “MTS®”, “FTSE TMX®” and “FTSE Russell” and other service marks and trademarks related to the FTSE or
4
| | |
Russell indexes are trademarks of the London Stock Exchange Group companies and are used by FTSE, MTS, FTSE TMX and Russell under license.
Russell 3000® Index measures the performance of the largest 3000 U.S. companies representing approximately 98% of the investable U.S. equity market. Source: FTSE Russell Indexes. “FTSE®”, “Russell®”, “MTS®”, “FTSE TMX®” and “FTSE Russell” and other service marks and trademarks related to the FTSE or Russell indexes are trademarks of the London Stock Exchange Group companies and are used by FTSE, MTS, FTSE TMX and Russell under license.
S&P 500® Index is a total return, float-adjusted market capitalization-weighted index of 500 common stocks chosen for market size, liquidity, and industry group representation to represent U.S. equity performance. Total return indexes include reinvestments of all dividends
S&P Municipal Bond Short Intermediate Index consists of bonds in the S&P Municipal Bond Index with a minimum maturity of 1 year and a max of 8 years.
Unicorn valuations is a term which denotes a start-up company whose valuation has exceeded $1 billion.
US trade-weighted dollar index, also known as the broad index, is a measure of the value of the United States dollar relative to other world currencies.
Weighted Average Maturity is the average time it takes for securities in a portfolio to mature, weighted in proportion to the dollar amount that is invested in the portfolio. Weighted average maturity (WAM) measures the sensitivity of fixed-income portfolios to interest rate changes. Portfolios with longer WAMs are more sensitive to changes in interest rates because the longer a bond is held, the greater the opportunity for interest rates to move up or down and affect the performance of the bonds in the portfolio.
The S&P 500® Index, and the S&P Municipal Bond Short Intermediate Index (the “Indices”) are products of S&P Dow Jones Indices LLC and have been licensed for use by Alpine Woods Capital Investors, LLC. Copyright © 2015 by S&P Dow Jones Indices LLC. All rights reserved. Redistribution or reproduction in whole or in part are prohibited without written the permission of S&P Dow Jones Indices LLC. S&P Dow Jones Indices LLC, its affiliates, and third party licensors make no representation or warranty, express or implied, with respect to the Index and none of such parties shall have any liability for any errors, omissions, or interruptions in the Index or the data included therein.
An investor cannot invest directly in an index.
5
Equity Manager Reports

| | Alpine Dynamic Dividend Fund |
| | |
| | Alpine Rising Dividend Fund |
| | |
| | Alpine Financial Services Fund |
| | |
| | Alpine Small Cap Fund |
6
| Alpine Dynamic Dividend Fund |  |
| Comparative Annualized Returns as of 10/31/15 (Unaudited) | | | |
| | | 1 Year | | 3 Years | | 5 Years | | 10 Years | | Since Inception(1) | |
| Alpine Dynamic Dividend Fund — Institutional Class | | 3.59 | % | | 9.43 | % | | 5.73 | % | | 1.57 | % | | 4.70 | % | | |
| Alpine Dynamic Dividend Fund — Class A (Without Load) | | | 3.34 | % | | | 9.16 | % | | | N/A | | | N/A | | | 9.35 | % | | |
| Alpine Dynamic Dividend Fund — Class A (With Load) | | | -2.28 | % | | | 7.15 | % | | | N/A | | | N/A | | | 7.75 | % | | |
| MSCI All Country World Index | | | -0.03 | % | | | 9.92 | % | | | 7.68 | % | | | 5.67 | % | | | 7.15 | % | | |
| Lipper Global Equity Income Funds Average(2) | | | -1.95 | % | | | 7.71 | % | | | 6.80 | % | | | 3.68 | % | | | 5.82 | % | | |
| Lipper Global Equity Income Funds Ranking(2) | | | 16/146 | | | 36/117 | | | 57/70 | | | 21/21 | | | 15/15 | | |
| Gross Expense Ratio (Institutional Class): 1.44%(3) | | | | | | | | | | | | | | | | | | | | | | |
| Net Expense Ratio (Institutional Class): 1.38%(3) | | | | | | | | | | | | | | | | | | | | | | |
| Gross Expense Ratio (Class A): 1.69%(3) | | | | | | | | | | | | | | | | | | | | | | |
| Net Expense Ratio (Class A): 1.63%(3) | | | | | | | | | | | | | | | | | | | | | | |
| | (1) | Institutional Class shares commenced on September 22, 2003 and Class A shares commenced on December 30, 2011. Returns for indices are since September 22, 2003. |
| | (2) | The since inception return represents the period beginning September 25, 2003 (Institutional Class only). |
| | (3) | As disclosed in the prospectus dated February 27, 2015. |
Performance data quoted represents past performance and is not predictive of future results. Investment return and principal value of the Fund fluctuate, so that the shares, when redeemed, may be worth more or less than their original cost. Performance current to the most recent month end may be lower or higher than performance quoted and may be obtained by calling 1-888-785-5578. Performance data shown does not reflect the 1.00% redemption fee imposed on shares held for fewer than 60 days. If it did, total returns would be reduced. Returns for the Class A shares with sales charge reflect a maximum sales charge of 5.50%. Performance for the Class A shares without sales charges does not reflect this load.
MSCI All Country World Index is a total return, free-float adjusted market capitalization weighted index that captures large and mid-cap representation across 24 Developed and 21 Emerging Markets countries. With 2,483 constituents, the index covers approximately 85% of the global investable equity opportunity set. Net total return indices reinvest dividends after the deduction of withholding taxes, using (for international indices) a tax rate applicable to non-resident institutional investors who do not benefit from double taxation treaties. Source: MSCI. MSCI data may not be reproduced or used for any other purpose. MSCI provides no warranties, has not prepared or approved this report, and has no liability hereunder. The Lipper Global Equity Income Funds Average is an average of funds that by prospectus language and portfolio practice seek relatively high current income and growth of income by investing at least 65% of their portfolio in dividend-paying securities of domestic and foreign companies. Lipper rankings for the periods shown are based on fund total returns with dividends and distributions reinvested and do not reflect sales charges. The Lipper Global Equity Income Funds Average are unmanaged and do not reflect the deduction of direct fees associated with a mutual fund, such as investment adviser fees; however, the Lipper Global Equity Income Funds Average reflects fees charged by the underlying funds. The performance for the Alpine Dynamic Dividend Fund reflects the deduction of fees for these value-added services. Investors cannot directly invest in an index.
Expense Ratios reflect the ratios reported in the Fund’s most recent prospectus. The Alpine Dynamic Dividend Fund has a contractual expense waiver that continues through March 1, 2016. Where a Fund’s gross and net expense ratios are the same for the period reported, the contractual expense reimbursement level was not reached as of the end of that period. To the extent the Fund’s expenses were reduced by waivers, the Fund’s total returns were increased. In these cases, in the absence of the expense waivers, the Fund’s total returns would have been lower.
To the extent that the Fund’s historical performance resulted from gains derived from participation in Initial Public Offerings (“IPOs”) and/or Secondary Offerings, there is no guarantee that these results can be replicated in future periods or that the Fund will be able to participate to the same degree in IPO/Secondary Offerings in the future.
7
| Alpine Dynamic Dividend Fund (Continued) | |
Portfolio Distributions* (Unaudited)

| Top 10 Holdings* (Unaudited) |
| 1. | | Apple, Inc. | | | 1.77 | % |
| 2. | | Snap-on, Inc. | | | 1.60 | % |
| 3. | | EMC Corp. | | | 1.42 | % |
| 4. | | CVS Health Corp. | | | 1.35 | % |
| 5. | | Anheuser-Busch InBev NV-SP ADR | | | 1.28 | % |
| 6. | | Dollar General Corp. | | | 1.26 | % |
| 7. | | Medtronic PLC | | | 1.22 | % |
| 8. | | BT Group PLC-SP ADR | | | 1.21 | % |
| 9. | | Accenture PLC-Class A | | | 1.21 | % |
| 10. | | Vodafone Group PLC-SP ADR | | | 1.21 | % |
| * | Portfolio Distributions percentages are based on total net investments. Top 10 Holdings do not include short-term investments and percentages are based on total net assets. Portfolio holdings sector distributions are as of 10/31/15 and are subject to change. Portfolio holdings are not recommendations to buy or sell any securities. |
Value of a $10,000 Investment (Unaudited)

This chart represents a comparison of a hypothetical $10,000 investment in the Fund versus a similar investment in the Fund’s benchmarks. The graph and the table do not reflect the deduction of taxes that a shareholder would pay on Fund distributions or the redemption of Fund shares. Investment performance reflects the waiver and recovery of certain fees, if applicable. Without the waiver and recovery of fees, the Fund’s total return would have differed.
Performance data quoted represents past performance and is not predictive of future results. Investment return and principal value of the Fund fluctuate, so that shares, when redeemed, may be worth more or less than their original cost.
8
| Alpine Dynamic Dividend Fund (Continued) | |
Commentary
Dear Shareholders:
For the fiscal year ended October 31, 2015, the Alpine Dynamic Dividend Fund generated a total return of 3.59% versus our benchmark, the MSCI All Country World Index, which had a total return of -0.03%. All returns include reinvestment of all distributions. The Fund distributed $0.24 per share during the fiscal year. All references in this letter to the Fund’s performance relate to the Fund’s Institutional Class.
PERFORMANCE DRIVERS
Despite a bout of turbulence, global equities managed to eke out a modest gain during the 12 month period ended October 31, 2015. During the month of August 2015, the Chicago Board Options Exchange Volatility Index (VIX) spiked by over 200% from its trough to its peak, in a vivid reminder of the heightened volatility witnessed in 2011. There were a number of factors that increased investor unease, including the devaluation of the Chinese Renminbi, general weakness in emerging market economies, the uncertainty of when the Federal Reserve Bank would begin increasing interest rates, commodity weakness, and concerns over the potential for new drug price regulations in the United States. While the volatility did subside as autumn wore on, the dispersion in the performance of stocks worldwide remained stark. The total return of the S&P 500® Index, at 5.20% contrasted sharply with that of the MSCI Europe Index (up 0.17% in U.S. Dollar terms) and the MSCI Emerging Market Index (down 14.53%). With economic prospects in the US remaining relatively sanguine as compared to most other countries, particularly in Europe, the US trade-weighted Dollar Index rose by about 13% during the period, driven largely by the 12% depreciation in the Euro.
On a sector basis, consumer discretionary, consumer staples and information technology had the greatest positive effect on the absolute total return of the Fund. The financials, energy and telecommunication services sectors had the greatest negative effect on the absolute performance of the Fund. On a relative basis, the materials sector generated the largest outperformance versus the MSCI All Country World Index, followed by energy and utilities. The financials, health care and information technology sectors were the worst relative performers during the period.
PORTFOLIO ANALYSIS
The top five contributors to the Fund’s performance for the fiscal year ended October 31, 2015 based on contribution to total return were China CNR Corp, Avago Technologies, China Railway Construction Corp (CRCC Corp), DS Smith and Pets At Home Group.
| | • | China CNR (now known as CRRC Corp.) is China’s only railway equipment manufacturer. At the end of 2014, the Chinese government merged China CNR and China CSR to form CRRC, which has a monopoly on domestic railway equipment manufacturing in China. We expect CRRC to continue to benefit from favorable government policy supporting domestic railway fixed asset investment and promoting the overseas export of China’s railway expertise via its “One Belt, One Road” program. |
| | | |
| | • | Semiconductor manufacturer Avago Technologies received a boost from the announcement of its strategic and accretive acquisition of Emulex, completed in May 2015. From a fundamental standpoint, Avago continued to benefit from the roll out of next generation (4G LTE) wireless networks, which is stimulating demand for the company’s radio frequency (RF) filtering products. The company also benefited from the recent merger of two if its competitors: TriQuint and RF Micro Devices, a long term positive for the industry. |
| | | |
| | • | China Railway Construction Corp (CRCC) is a diversified engineering and construction company in China. The stock’s outperformance was driven by China’s ‘One Belt, One Road’ program, which promotes overseas railway and road construction by Chinese companies. In 2015, CRCC was involved in project awards in Nigeria, Saudi Arabia, Dhaka and Indonesia, with potential future awards in Thailand, Poland, India, Latin America and the United States. A potential merger with China Railway Group, similar to China CNR and China CSR, could be an additional catalyst. |
| | | |
| | • | European packaging company DS Smith announced an accretive acquisition of recycled corrugated packaging company Duropack, which will extend and bolster the company’s transformation from a UK centric business to a fully pan-European packaging solutions provider. DS Smith also delivered strong core operating performance with market share gains, operating margin improvement and accelerating return on capital employed. |
| | | |
| | • | UK pet care retailer Pets At Home Group continued a string of stellar results post IPO, growing sales, stores, vet and grooming services ahead of UK pet market growth, expanding margins, increasing its dividend and deleveraging its balance sheet. The company continued to draw investors to its long term growth story, driven by expansion into a number of attractive niches supported by competitive advantages and structural growth trends, in particular the “humanization of pets”. |
9
| Alpine Dynamic Dividend Fund (Continued) | |
The bottom five contributors to the Fund’s performance for the fiscal year ended October 31, 2015 based on contribution to total return were Abengoa S.A., Rumo Logistica Operadora Multimodal S.A., Canadian Pacific Railway, NorthStar Realty Finance Corp and The Williams Companies.
| | • | Abengoa S.A. is a global engineering and construction company based in Spain. The company underperformed as a result of liquidity concerns that surfaced in November 2014 but became more apparent in the summer of 2015. We have fully divested our position in the stock. |
| | | |
| | • | Rumo Logistica Operadora Multimodal is a railway concession operator in Brazil, formed through the merger of America Latina Logistica and Rumo Logistica Operadora Multimodal. Stock performance suffered as financial results continued to deteriorate, partly as a result of the slowdown in the Brazilian economy. New management has laid out short- and long-term plans to reduce costs and deploy new capital. |
| | | |
| | • | Canadian Pacific Railway (CP) is a Class 1 transcontinental railway company serving Canada and the United States. CP’s stock declined as rail volumes decreased; specifically coal and energy related carloads were weak. An additional headwind was the strong U.S. dollar. Despite these issues, the company has continued to improve operations, as evidenced by the record operating ratio it reported in the third quarter of 2015. |
| | | |
| | • | NorthStar Realty is a real estate investment trust (REIT) that originates, acquires and manages portfolios of commercial real estate properties as well as related securities. The stock came under pressure in part because investors soured on the broader REIT industry ahead of an expected Fed rate hike. In addition, some investors may have been caught off guard by the company’s shift to an externally managed structure along with capital management actions tied to recent acquisitions. Finally, the spinoff of its European assets into NorthStar Europe brought with it some uncertainty as there are few U.S. listed stocks holding European real estate assets. |
| | | |
| | • | The Williams Companies is a midstream company with an extensive network of natural gas and natural gas liquids infrastructure. The company’s underlying fundamentals deteriorated due to declining natural gas liquids margins, and a key customer, Chesapeake Energy, endured financial distress as natural gas prices declined. Investors also soured on the merger between Energy Transfer Equity and Williams, implying that the low price paid for Williams suggested a bearish statement regarding midstream valuations. |
We have hedged a portion of our currency exposures to the Euro, the Swiss Franc, the Japanese Yen and the British Pound. The currency hedging mitigated the overall negative impact of currency in the portfolio. We have also used leverage at times both in the execution of the strategy of the Fund and to help manage net outflows during the fiscal year. Additionally, the Fund participated in Initial Public Offerings (IPOs) which contributed to the Fund’s total return. We cannot predict how long, if at all, these opportunities will continue to exist, but to the extent we consider IPOs to be attractively priced and available, the Fund may continue to participate in them.
SUMMARY & OUTLOOK
As we look towards 2016, we see a market environment that remains fairly uncertain. While the U.S. economy appears to be in a sustained growth trajectory, it is challenged by a partisan environment in Washington D.C. and numerous external headwinds including soft export markets and geopolitical uncertainties relating to key trading partners. It is entirely plausible that the U.S. stock market will be stuck in a holding pattern, supported on the one hand by a benign macro environment and solid corporate earnings growth, but at the same time wrestling with the prospect of the first Federal Funds rate hike in many years.
The setting in Europe appears a bit more favorable. Europe is benefiting from multiple tailwinds: growth is picking up, as evidenced by the persistent strength of the Markit Index of Manufacturing in the Eurozone, the exchange rate has remained far lower than in 2014, and corporate profits are improving. And in contrast to the Fed’s pulling back of the monetary punch bowl, the party is just getting started in Europe, with its own version of quantitative easing now under way.
The Asia-Pacific region is mixed, but there are some bright spots. Prime Minister Shinzo Abe’s ‘Abenomics’ appears to be gaining traction in Japan, with the labor market strengthening and corporate earnings growth amongst the most buoyant in the world. And while China’s transition to a consumer-led economy has been a bumpy ride, policy-makers are taking full advantage of their formidable array of tools, including monetary, fiscal and exchange-rate policy, and we are beginning to see some green shoots.
Beyond the macroeconomic environment, the Fund continues to emphasize its focus on high quality companies with strong balance sheets and a willingness to reward shareholders with dividends.
Sincerely,
Brian Hennessey
Joshua E. Duitz
Portfolio Managers
10
| Alpine Dynamic Dividend Fund (Continued) | |
This letter represents the opinions of the Fund’s management and is subject to change, is not guaranteed and should not be considered a recommendation to buy or sell any security. The information provided is not intended to be, and is not, a forecast of future events, a guarantee of future results, or investment advice. Views expressed may vary from those of the firm as a whole.
Past performance is no guarantee of future results.
Mutual fund investing involves risk. Principal loss is possible. The fund is subject to risks, including the following:
Credit Risk – Credit risk refers to the possibility that the issuer of a security will not be able to make payments of interest and principal when due. Changes in an issuer’s credit rating or the market’s perception of an issuer’s creditworthiness may also affect the value of the Fund’s investment in that issuer. The degree of credit risk depends on both the financial condition of the issuer and the terms of the obligation.
Currency Risk – The value of investments in securities denominated in foreign currencies increases or decreases as the rates of exchange between those currencies and the U.S. dollar change. Currency conversion costs and currency fluctuations could erase investment gains or add to investment losses. Currency exchange rates can be volatile, and are affected by factors such as general economic conditions, the actions of the U.S. and foreign governments or central banks, the imposition of currency controls and speculation.
Dividend Strategy Risk – The Fund’s strategy of investing in dividend-paying stocks involves the risk that such stocks may fall out of favor with investors and underperform the market. Companies that issue dividend paying-stocks are not required to continue to pay dividends on such stocks. Therefore, there is the possibility that such companies could reduce or eliminate the payment of dividends in the future. The Fund may hold securities for short periods of time related to the dividend payment periods and may experience loss during these periods.
Emerging Market Securities Risk – The risks of foreign investments are heightened when investing in issuers in emerging market countries. Emerging market countries tend to have economic, political and legal systems that are less fully developed and are less stable than those of more developed countries. They are often particularly sensitive to market movements because their market prices tend to reflect speculative expectations. Low trading volumes may result in a lack of liquidity and in extreme price volatility.
Equity Securities Risk – The stock or other security of a company may not perform as well as expected, and may decrease in value, because of factors related to the company (such as poorer than expected earnings or certain management decisions) or to the industry in which the company is engaged (such as a reduction in the demand for products or services in a particular industry).
Foreign Currency Transactions Risk – Foreign securities are often denominated in foreign currencies. As a result, the value of the Fund’s shares is affected by changes in exchange rates. The Fund may enter into foreign currency transactions to try to manage this risk. The Fund’s ability to use foreign currency transactions successfully depends on a number of factors, including the foreign currency transactions being available at prices that are not too costly, the availability of liquid markets and the ability of the Adviser to accurately predict the direction of changes in currency exchange rates. The Fund may enter into forward foreign currency exchange contracts in order to protect against possible losses on foreign investments resulting from adverse changes in the relationship between the U.S. dollar and foreign currencies. Although this method attempts to protect the value of the Fund’s portfolio securities against a decline in the value of a currency, it does not eliminate fluctuations in the underlying prices of the securities and while such contracts tend to minimize the risk of loss due to a decline in the value of the hedged currency, they tend to limit any potential gain which might result should the value of such currency increase.
Foreign Securities Risk – The Fund’s investments in securities of foreign issuers or issuers with significant exposure to foreign markets involve additional risk. Foreign countries in which the Fund may invest may have markets that are less liquid, less regulated and more volatile than U.S. markets. The value of the Fund’s investments may decline because of factors affecting the particular issuer as well as foreign markets and issuers generally, such as unfavorable government actions, and political or financial instability. Lack of information may also affect the value of these securities. The risks of foreign investment are heightened when investing in issuers of emerging market countries.
Growth Stock Risk – Growth stocks are stocks of companies believed to have above-average potential for growth in revenue and earnings. Growth stocks typically are very sensitive to market movements because their market prices tend to reflect future expectations. When it appears those expectations will not be met, the prices of growth stocks typically fall. Growth stocks as a group may be out of favor and underperform the overall equity market while the market concentrates on undervalued stocks.
11
| Alpine Dynamic Dividend Fund (Continued) | |
Initial Public Offerings and Secondary Offerings Risk – The Fund may invest a portion of its assets in shares of IPOs or secondary offerings of an issuer. IPOs and secondary offerings may have a magnified impact on the performance of a Fund with a small asset base. The impact of IPOs and secondary offerings on a Fund’s performance likely will decrease as the Fund’s asset size increases, which could reduce a Fund’s returns. IPOs and secondary offerings may not be consistently available to the Fund for investing. IPO and secondary offering shares frequently are volatile in price due to the absence of a prior public market, the small number of shares available for trading and limited information about the issuer. Therefore, the Fund may hold IPO and secondary offering shares for a very short period of time. This may increase the turnover of the Fund and may lead to increased expenses for the Fund, such as commissions and transaction costs. In addition, IPO and secondary offering shares can experience an immediate drop in value if the demand for the securities does not continue to support the offering price.
Leverage Risk – The Fund may use leverage to purchase securities. Increases and decreases in the value of the Fund’s portfolio will be magnified when the Fund uses leverage.
Management Risk – The Adviser’s judgment about the quality, relative yield or value of, or market trends affecting, a particular security or sector, or about interest rates generally, may be incorrect. The Adviser’s security selections and other investment decisions might produce losses or cause the Fund to underperform when compared to other funds with similar investment objectives and strategies.
Market Risk – The price of a security held by the Fund may fall due to changing market, economic or political conditions.
Portfolio Turnover Risk – High portfolio turnover necessarily results in greater transaction costs which may reduce Fund performance.
Qualified Dividend Tax Risk – Favorable U.S. federal tax treatment of Fund distributions may be adversely affected, changed or repealed by future changes in tax laws.
Small and Medium Capitalization Company Risk – Securities of small or medium capitalization companies are more likely to experience sharper swings in market values, less liquid markets, in which it may be more difficult for the Adviser to sell at times and at prices that the Adviser believes appropriate and generally are more volatile than those of larger companies.
Swaps Risk – Swap agreements are derivative instruments that can be individually negotiated and structured to address exposure to a variety of different types of investments or market factors. Depending on their structure, swap agreements may increase or decrease the Fund’s exposure to long- or short-term interest rates, foreign currency values, mortgage securities, corporate borrowing rates, or other factors such as security prices or inflation rates. The Fund also may enter into swaptions, which are options to enter into a swap agreement. Since these transactions generally do not involve the delivery of securities or other underlying assets or principal, the risk of loss with respect to swap agreements and swaptions generally is limited to the net amount of payments that the Fund is contractually obligated to make. There is also a risk of a default by the other party to a swap agreement or swaption, in which case the Fund may not receive the net amount of payments that the Fund contractually is entitled to receive.
Undervalued Stock Risk – The Fund may pursue strategies that may include investing in securities, which, in the opinion of the Adviser, are undervalued. The identification of investment opportunities in undervalued securities is a difficult task and there is no assurance that such opportunities will be successfully recognized or acquired. While investments in undervalued securities offer opportunities for above-average capital appreciation, these investments involve a high degree of financial risk and can result in substantial losses.
Please refer to pages 3-5 for other important disclosures and definitions.
12
| Alpine Rising Dividend Fund(1) | |
| Comparative Annualized Returns as of 10/31/15 (Unaudited) | | | |
| | | 1 Year | | 3 Years | | 5 Years | | Since Inception(2) |
| Alpine Rising Dividend Fund —- Institutional Class | | | 2.16 | % | | | 13.03 | % | | | 11.33 | % | | | 12.51 | % | |
| Alpine Rising Dividend Fund — Class A (Without Load) | | | 1.93 | % | | | 12.76 | % | | | N/A | | | 12.67 | % | |
| Alpine Rising Dividend Fund — Class A (With Load) | | | -3.65 | % | | | 10.66 | % | | | N/A | | | 11.03 | % | |
| S&P 500® Index | | | 5.20 | % | | | 16.20 | % | | | 14.33 | % | | | 13.39 | % | |
| Dow Jones Industrial Average | | | 4.08 | % | | | 13.22 | % | | | 12.52 | % | | | 12.04 | % | |
| Lipper Equity Income Funds Average(3) | | | 0.08 | % | | | 11.64 | % | | | 10.95 | % | | | 12.53 | % | |
| Lipper Equity Income Funds Ranking(3) | | | 139/497 | | | 92/384 | | | 130/296 | | | 140/268 | |
| Gross Expense Ratio (Institutional Class): 2.25%(4) | | | | | | | | | | | | | | | | | |
| Net Expense Ratio (Institutional Class): 1.35%(4) | | | | | | | | | | | | | | | | | |
| Gross Expense Ratio (Class A): 2.50%(4) | | | | | | | | | | | | | | | | | |
| Net Expense Ratio (Class A): 1.60%(4) | | | | | | | | | | | | | | | | | |
| | (1) | Effective September 9, 2015 the Fund’s name was changed from Alpine Accelerating Dividend Fund to Alpine Rising Dividend Fund. |
| | (2) | Institutional Class shares commenced on November 5, 2008 and Class A shares commenced on December 30, 2011. Returns for indices are since November 5, 2008. |
| | (3) | The since inception data represents the period beginning November 6, 2008 (Institutional Class only). |
| | (4) | As disclosed in the prospectus dated February 27, 2015. |
Performance data quoted represents past performance and is not predictive of future results. Investment return and principal value of the Fund fluctuate, so that the shares, when redeemed, may be worth more or less than their original cost. Performance current to the most recent month end may be lower or higher than performance quoted and may be obtained by calling 1-888-785-5578. Performance data shown does not reflect the 1.00% redemption fee imposed on shares held for fewer than 60 days. If it did, total returns would be reduced. Returns for the Class A shares with sales charge reflect a maximum sales charge of 5.50%. Performance for the Class A shares without sales charges does not reflect this load.
S&P 500® Index is a total return, float-adjusted market capitalization-weighted index of 500 common stocks chosen for market size, liquidity, and industry group representation to represent U.S. equity performance. Total return indexes include reinvestments of all dividends. The Dow Jones Industrial Average is a price-weighted average of 30 blue chip stocks that are generally the leaders in their industry. The Lipper Equity Income Funds Average is an average of funds that seek relatively high current income and income growth through investing 60% or more of their respective portfolios in equities. Lipper rankings for the periods shown are based on fund total returns with dividends and distributions reinvested and do not reflect sales charges. The S&P 500® Index, the Dow Jones Industrial Average, and the Lipper Equity Income Funds Average are unmanaged and do not reflect direct fees associated with a mutual fund, such as investment adviser fees; however, the Lipper Equity Income Funds Average reflects fees charged by the underlying funds. The performance for the Alpine Rising Dividend Fund reflects the deduction of fees for these value-added services. Investors cannot directly invest in an index.
Expense Ratios reflect the ratios reported in the Fund’s most recent prospectus. The Alpine Rising Dividend Fund has a contractual expense waiver that continues through March 1, 2016. Where a Fund’s gross and net expense ratios are the same for the period reported, the contractual expense reimbursement level was not reached as of the end of that period. To the extent the Fund’s expenses were reduced by waivers, the Fund’s total returns were increased. In these cases, in the absence of the expense waivers, the Fund’s total returns would have been lower.
To the extent that the Fund’s historical performance resulted from gains derived from participation in Initial Public Offerings (“IPOs”) and/or Secondary Offerings, there is no guarantee that these results can be replicated in future periods or that the Fund will be able to participate to the same degree in IPO/Secondary Offerings in the future.
13
| Alpine Rising Dividend Fund (Continued) | |
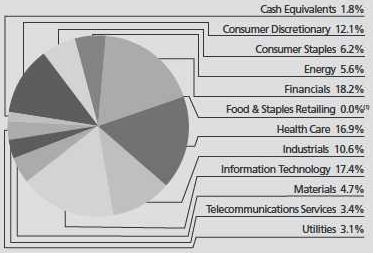
Portfolio Distributions* (Unaudited)
| Top 10 Holdings* (Unaudited) |
| 1. | | Apple, Inc. | | | 3.81 | % |
| 2. | | Johnson & Johnson | | | 3.03 | % |
| 3. | | JPMorgan Chase & Co. | | | 2.33 | % |
| 4. | | Raytheon Co. | | | 2.28 | % |
| 5. | | Pfizer, Inc. | | | 2.11 | % |
| 6. | | Prudential Financial, Inc. | | | 1.90 | % |
| 7. | | Zimmer Biomet Holdings, Inc. | | | 1.81 | % |
| 8. | | CVS Health Corp. | | | 1.78 | % |
| 9. | | CBS Corp.-Class B | | | 1.77 | % |
| 10. | | Verizon Communications, Inc. | | | 1.73 | % |
| * | Portfolio Distributions percentages are based on total net investments. Top 10 Holdings do not include short-term investments and percentages are based on total net assets. Portfolio holdings sector distributions are as of 10/31/15 and are subject to change. Portfolio holdings are not recommendations to buy or sell any securities. |
| | |
| (1) | Amount is less than 0.05% |
Value of a $10,000 Investment (Unaudited)
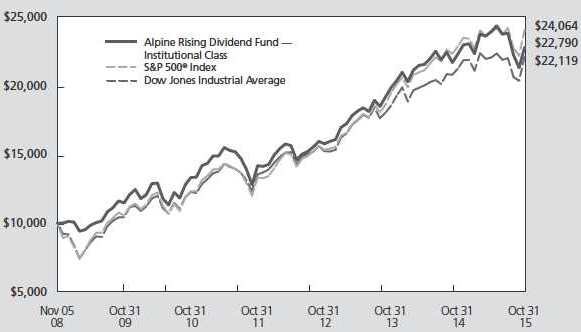
This chart represents a comparison of a hypothetical $10,000 investment in the Fund versus a similar investment in the Fund’s benchmark. The graph and the table do not reflect the deduction of taxes that a shareholder would pay on Fund distributions or the redemption of Fund shares. Investment performance reflects the waiver and recovery of certain fees, if applicable. Without the waiver and recovery of fees, the Fund’s total return would have differed.
Performance data quoted represents past performance and is not predictive of future results. Investment return and principal value of the Fund fluctuate, so that shares, when redeemed, may be worth more or less than their original cost.
14
| Alpine Rising Dividend Fund (Continued) | |
Commentary
Dear Shareholders:
For the twelve months ended October 31, 2015, the Alpine Rising Dividend Fund generated a total return of 2.16%. This compares with a total return of 5.20% for the S&P 500® Index for the same period. The Fund distributed $0.47 per share during the fiscal year. All references in this letter to the Fund’s performance relate to the performance of the Fund’s Institutional Class.
PERFORMANCE DRIVERS
The Fund generally prefers to take a conservative investment stance with regard to portfolio construction and security selection during times of economic and geopolitical uncertainty. We believe the twelve months ended October 31, 2015 was such a time. For this reason, the Fund had an average cash holding of 2.5% during the twelve month period and a portfolio beta less than 1.0 during the same span.
On a sector basis, information technology, consumer staples, and health care had the largest positive impact on the absolute performance of the Fund. The energy, industrials, and telecommunication services sectors had the largest negative impact. On a relative basis, the materials sector generated the largest outperformance versus the S&P 500®, followed by consumer staples, and health care. Consumer discretionary, industrials, and information technology were the worst relative performers.
PORTFOLIO ANALYSIS
The top five contributors to the Fund’s performance during the twelve months ended October 31, 2015, based on contribution to total return were Avago Technologies, Activision Blizzard, Walgreens Boots Alliance, Aetna, and Pinnacle Foods.
| | • | Despite a slowdown in the smartphone market, we believe Avago continued to execute extremely well. Its core radio frequency filter business continued to grow quickly due to its expanding penetration in several high end smartphones and the company is ramping up capacity even further to satisfy expected demand from Chinese original equipment manufacturing (OEMs) in the next several years. In addition, Avago is poised to complete its acquisition of Broadcom in the next few months and we think the merger will produce meaningful financial and strategic benefits. |
| | | |
| | • | Activision Blizzard shares rose strongly in the fiscal year despite modest earnings growth as investors |
| | | rewarded the stock with a higher valuation multiple. This is due to the solid performance of its key gaming franchises as well as investor excitement about the pipeline of games the company is poised to release, including the revival of the Guitar Hero franchise. Additionally, the growing contribution of digital revenues is likely to have a positive impact on margins and free cash flow. |
| | | |
| | • | Shares of Walgreens Boots Alliance enjoyed a strong performance in the fiscal year ended October 31, 2015 as investors cheered the management team which transitioned from a CEO/CFO combination that came from Walgreens to a team from Alliance Boots, led by CEO Stefano Pessina, upon completion of the merger between the companies in December 2014. Mr. Pessina is a well-respected operator, increasing investor confidence in the cost reduction plan and Walgreens place in any future industry consolidation. |
| | | |
| | • | Along with its peers in the managed care industry, Aetna stock enjoyed strong multiple expansion during the first two-thirds of the fiscal year as earnings estimates headed higher given still benign medical cost trends and speculation about industry consolidation. The stocks have come under pressure since peaking towards the end of June as risk around regulatory approval of the announced mergers took center stage and political rhetoric from Hillary Clinton against industry consolidation took investors by surprise. |
| | | |
| | • | Pinnacle Foods shares have risen during the fiscal year as investors rewarded its business model of acquiring underperforming brands and revitalizing them. The merger of Kraft and Heinz, and activist pressure on ConAgra, have created speculation that those companies would divest some brands with Pinnacle a likely acquirer. Given a solid track record of executing on prior acquisitions, the market has begun to price in earnings accretion from future deals. |
| | | |
| Bristow Group, NorthStar Realty Finance, Western Digital, Union Pacific, and Applied Materials had the largest adverse impact on the performance of the Fund over the fiscal year. |
| | | |
| | • | The sharp sell-off in crude oil that began near the end of September 2014 along with the consistent strengthening of the US dollar against nearly all major currencies proved a challenging combination for Bristow Group, one of the largest providers of |
15
| Alpine Rising Dividend Fund (Continued) | |
| | | helicopter services to the oil and gas industry. Lower crude oil prices, if sustained, could lessen future demand for Bristow’s transportation services to offshore oil rigs, while the stronger dollar has directly impacted revenues and earnings for the company. |
| | | |
| | • | Shares of NorthStar Realty Finance came under considerable pressure from June 2015 through the end of the fiscal year as investors began to anticipate the Federal Reserve would begin to raise interest rates later in the calendar year or early 2016. The prospect of higher rates caused investors to demand higher dividend yields from commercial mortgage REITs like NorthStar. |
| | | |
| | • | Western Digital, one of the largest manufacturers of hard-disk drives saw its shares decline in the second half of the fiscal year as a sharp slowdown in the personal computer (PC) and laptop market caught the market by surprise. Stronger sales of enterprise class hard disk drives and its nascent solid state flash business couldn’t offset the decline in the PC business, resulting in an earnings decline for the company. |
| | | |
| | • | Union Pacific has suffered from a slowdown in carload volumes in 2015, mainly due to a steep reduction in demand for coal from the utility customers, but also from a reduction in crude by rail due to the rapid decline in crude oil prices. The magnitude of the carload declines caused Union Pacific to experience operational inefficiencies that pressured its operating rate and led to lower than expected earnings. |
| | | |
| | • | Shares of Applied Materials (AMAT) had a significant one-day sell-off near the end of April 2015 in the wake of the surprising news that it was abandoning its planned merger with Tokyo Electron. The announcement caught investors off-guard as many had assumed the merger was nearing the finish line and that AMAT was poised to realize significant synergies from the deal. Subsequently, several semiconductor industry participants slashed their anticipated capital expenditure outlooks for the equipment that Applied Material manufactures, sending the shares lower. |
SUMMARY & OUTLOOK
As we look toward 2016, we see a market environment that remains fairly uncertain. While the Federal Reserve hopes to begin raising interest rates as soon as December, the global macro environment continues to present mixed signals that make the eventual timing and pace of such rate hikes uncertain. We think the path ahead could be a bit choppy with spurts of volatility likely to keep equity markets in the US and abroad from rallying strongly. What’s more, valuations appear rich to us, leaving the market susceptible to a pullback should earnings growth or the economic data prove disappointing.
As it relates to the Fund, we recently completed a three-way merger and name change. Despite these actions, the core strategy of focusing on quality companies with strong balance sheets that are raising and/or accelerating dividends remains the same. We will emphasize stocks with a longer and consistent track record of dividend increases, as we believe these companies have the potential to outperform through the cycle. We aim to invest in stocks with multiple years of continuous dividend increases and make these stocks the foundation of the Fund. On top of this foundation, we will continue to invest in stocks with shorter, but still meaningful track records of dividend increases. In conclusion, similar to the stocks in which we seek to invest, the Fund aims to provide a steadily rising distribution to its investors.
Sincerely,
Andrew Kohl
Mark Spellman
Portfolio Managers
16
| Alpine Rising Dividend Fund (Continued) | |
This letter represents the opinions of the Fund’s management and is subject to change, is not guaranteed and should not be considered a recommendation to buy or sell any security. The information provided is not intended to be, and is not, a forecast of future events, a guarantee of future results, or investment advice. Views expressed may vary from those of the firm as a whole.
Past performance is no guarantee of future results.
Mutual fund investing involves risk. Principal loss is possible. The Fund is subject to risks, including the following:
Currency Risk – The value of investments in securities denominated in foreign currencies increases or decreases as the rates of exchange between those currencies and the U.S. dollar change. Currency conversion costs and currency fluctuations could erase investment gains or add to investment losses. Currency exchange rates can be volatile, and are affected by factors such as general economic conditions, the actions of the U.S. and foreign governments or central banks, the imposition of currency controls and speculation.
Dividend Strategy Risk – The Fund’s strategy of investing in dividend-paying stocks involves the risk that such stocks may fall out of favor with investors and underperform the market. Companies that issue dividend paying-stocks are not required to continue to pay dividends on such stocks. Therefore, there is the possibility that such companies could reduce or eliminate the payment of dividends in the future or the anticipated acceleration of dividends could not occur.
Equity Securities Risk – The stock or other security of a company may not perform as well as expected, and may decrease in value, because of factors related to the company (such as poorer than expected earnings or certain management decisions) or to the industry in which the company is engaged (such as a reduction in the demand for products or services in a particular industry).
Foreign Currency Transactions Risk – Foreign securities are often denominated in foreign currencies. As a result, the value of the Fund’s shares is affected by changes in exchange rates. The Fund may enter into foreign currency transactions to try to manage this risk. The Fund’s ability to use foreign currency transactions successfully depends on a number of factors, including the foreign currency transactions being available at prices that are not too costly, the availability of liquid markets and the ability of the Adviser to accurately predict the direction of changes in currency exchange rates.
Foreign Securities Risk – The Fund’s investments in securities of foreign issuers or issuers with significant exposure to foreign markets involve additional risk. Foreign countries in which the Fund may invest may have markets that are less liquid, less regulated and more volatile than U.S. markets. The value of the Fund’s investments may decline because of factors affecting the particular issuer as well as foreign markets and issuers generally, such as unfavorable government actions, and political or financial instability. Lack of information may also affect the value of these securities. The risks of foreign investments are heightened when investing in issuers in emerging market countries.
Growth Stock Risk – Growth stocks typically are very sensitive to market movements because their market prices tend to reflect future expectations. When it appears those expectations will not be met, the prices of growth stocks typically fall. Growth stocks as a group may be out of favor and underperform the overall equity market while the market concentrates on undervalued stocks. Although the Fund will not concentrate its investments in any one industry or industry group, it may, like many growth funds, weight its investments toward certain industries, thus increasing its exposure to factors adversely affecting issuers within those industries.
Initial Public Offerings and Secondary Offerings Risk – The Fund may invest a portion of its assets in shares of IPOs or secondary offerings of an issuer. IPOs and secondary offerings may have a magnified impact on the performance of a Fund with a small asset base. The impact of IPOs and secondary offerings on a Fund’s performance likely will decrease as the Fund’s asset size increases, which could reduce a Fund’s returns. IPOs and secondary offerings may not be consistently available to the Fund for investing. IPO and secondary offering shares frequently are volatile in price due to the absence of a prior public market, the small number of shares available for trading and limited information about the issuer. Therefore, the Fund may hold IPO and secondary offering shares for a very short period of time. This may increase the turnover of the Fund and may lead to increased expenses for the Fund, such as commissions and transaction costs. In addition, IPO and secondary offering shares can experience an immediate drop in value if the demand for the securities does not continue to support the offering price.
17
| Alpine Rising Dividend Fund (Continued) | |
Management Risk – The Adviser’s judgment about the quality, relative yield or value of, or market trends affecting, a particular security or sector, or about interest rates generally, may be incorrect. The Adviser’s security selections and other investment decisions might produce losses or cause the Fund to underperform when compared to other funds with similar investment objectives and strategies.
Market Risk – The price of a security held by the Fund may fall due to changing market, economic or political conditions.
Micro Capitalization Company Risk – Stock prices of micro capitalization companies are significantly more volatile, and more vulnerable to adverse business and economic developments than those of larger companies. Micro capitalization companies often have narrower markets for their goods and/or services and more limited managerial and financial resources than larger, more established companies, including small or medium capitalization companies.
Portfolio Turnover Risk – High portfolio turnover necessarily results in greater transaction costs which may reduce Fund performance.
Small and Medium Capitalization Company Risk – Securities of small or medium capitalization companies are more likely to experience sharper swings in market values, less liquid markets, in which it may be more difficult for the Adviser to sell at times and at prices that the Adviser believes appropriate and generally are more volatile than those of larger companies.
Undervalued Stock Risk – The Fund may pursue strategies that may include investing in securities, which, in the opinion of the Adviser, are undervalued. The identification of investment opportunities in undervalued securities is a difficult task and there is no assurance that such opportunities will be successfully recognized or acquired. While investments in undervalued securities offer opportunities for above-average capital appreciation, these investments involve a high degree of financial risk and can result in substantial losses.
Please refer to pages 3-5 for other important disclosures and definitions.
18
| Alpine Financial Services Fund | |
| Comparative Annualized Returns as of 10/31/15 (Unaudited) | | | | |
| | | 1 Year | | 3 Years | | 5 Years | | 10 Years | | Since Inception(1) | |
| Alpine Financial Services Fund — Institutional Class | | | -2.51 | % | | | 14.44 | % | | | 11.43 | % | | | 7.41 | % | | | 7.41 | % | | |
| Alpine Financial Services Fund — Class A (Without Load) | | | -2.68 | % | | | 14.17 | % | | | N/A | | | N/A | | | 17.98 | % | | |
| Alpine Financial Services Fund — Class A (With Load) | | | -8.04 | % | | | 12.03 | % | | | N/A | | | N/A | | | 16.26 | % | | |
| KBW Nasdaq Bank Index | | | 2.70 | % | | | 15.84 | % | | | 11.95 | % | | | -0.68 | % | | | -0.68 | % | | |
| NASDAQ Financial 100 Total Return Index | | | 9.93 | % | | | 16.99 | % | | | 13.46 | % | | | 3.91 | % | | | 3.91 | % | | |
| S&P 500® Index | | | 5.20 | % | | | 16.20 | % | | | 14.33 | % | | | 7.85 | % | | | 7.85 | % | | |
| Lipper Financial Services Funds Average(2) | | | 3.23 | % | | | 15.18 | % | | | 11.63 | % | | | 1.67 | % | | | 1.67 | % | | |
| Lipper Financial Services Funds Ranking(2) | | | 69/83 | | | 44/77 | | | 34/68 | | | 2/50 | | | 2/50 | | |
| Gross Expense Ratio (Institutional Class): 1.49%(3) | | | | | | | | | | | | | | | | | | | | | | |
| Net Expense Ratio (Institutional Class): 1.49%(3) | | | | | | | | | | | | | | | | | | | | | | |
| Gross Expense Ratio (Class A): 1.74%(3) | | | | | | | | | | | | | | | | | | | | | | |
| Net Expense Ratio (Class A): 1.74%(3) | | | | | | | | | | | | | | | | | | | | | | |
| | (1) | Institutional Class shares commenced on November 1, 2005 and Class A shares commenced on December 30, 2011. Returns for indices are since November 1, 2005. |
| | (2) | The since inception data represents the period beginning November 1, 2005 (Institutional Class only). |
| | (3) | As disclosed in the prospectus dated February 27, 2015. |
Performance data quoted represents past performance and is not predictive of future results. Investment return and principal value of the Fund fluctuate, so that the shares, when redeemed, may be worth more or less than their original cost. Performance current to the most recent month end may be lower or higher than performance quoted and may be obtained by calling 1-888-785-5578. Performance data shown does not reflect the 1.00% redemption fee imposed on shares held for fewer than 60 days. If it did, total returns would be reduced. Returns for the Class A shares with sales charge reflect a maximum sales charge of 5.50%. Performance for the Class A shares without sales charges does not reflect this load.
KBW Nasdaq Bank Index is designed to track the performance of the leading banks and thrifts that are publicly-traded in the U.S. The Index includes 24 banking stocks representing the large U.S. national money centers, regional banks and thrift institutions. NASDAQ Financial 100 Total Return Index is a total return index that includes 100 of the largest domestic and international financial securities listed on The NASDAQ Stock Market based on market capitalization. They include companies classified according to the Industry Classification Benchmark as Financials, which are included within the NASDAQ Bank, NASDAQ Insurance, and NASDAQ Other Finance Indexes. S&P 500® Index is a total return, float-adjusted market capitalization-weighted index of 500 common stocks chosen for market size, liquidity, and industry group representation to represent U.S. equity performance. Total return indexes include reinvestments of all dividends. The Lipper Financial Services Funds Average is an average of funds whose primary objective is to invest primarily in equity securities of companies engaged in providing financial services. Lipper rankings for the periods shown are based on fund total returns with dividends and distributions reinvested and do not reflect sales charges. The KBW Nasdaq Bank Index, the NASDAQ Financial 100 Total Return Index, the S&P 500® Index and the Lipper Financial Services Funds Average are unmanaged and do not reflect the deduction of direct fees associated with a mutual fund, such as investment adviser fees; however, the Lipper Financial Services Fund Average reflects fees charged by the underlying funds. The performance for the Alpine Financial Services Fund reflects the deduction of fees for these value-added services. Investors cannot directly invest in an index.
Expense Ratios reflect the ratios reported in the Fund’s most recent prospectus. The Alpine Financial Services Fund has a contractual expense waiver that continues through March 1, 2016. Where a Fund’s gross and net expense ratios are the same for the period reported, the contractual expense reimbursement level was not reached as of the end of that period. To the extent the Fund’s expenses were reduced by waivers, the Fund’s total returns were increased. In these cases, in the absence of the expense waivers, the Fund’s total returns would have been lower.
The Fund’s past performance benefitted significantly from Initial Public Offerings (“IPOs”) and Secondary Offerings of certain issuers, and there is no assurance that the Fund can replicate this performance in the future or that the Fund will be able to participate to the same degree in IPO/Secondary Offerings in the future.
19
| Alpine Financial Services Fund (Continued) | |
Portfolio Distributions* (Unaudited)

| Top 10 Holdings* (Unaudited) |
| 1. | | Investar Holding Corp. | | | 2.29 | % |
| 2. | | Carolina Trust Bank | | | 2.10 | % |
| 3. | | Valley National Bancorp | | | 1.92 | % |
| 4. | | Ares Management LP | | | 1.84 | % |
| 5. | | Bankwell Financial Group, Inc. | | | 1.67 | % |
| 6. | | Mitsubishi UFJ Financial Group, Inc. | | | 1.55 | % |
| 7. | | Pacific Premier Bancorp, Inc. | | | 1.54 | % |
| 8. | | The Blackstone Group LP | | | 1.44 | % |
| 9. | | JPMorgan Chase & Co. | | | 1.40 | % |
| 10. | | Citigroup, Inc. | | | 1.37 | % |
| * | Portfolio Distributions percentages are based on total net investments. Top 10 Holdings do not include short-term investments and percentages are based on total net assets. Portfolio holdings sector distributions are as of 10/31/15 and are subject to change. Portfolio holdings are not recommendations to buy or sell any securities. |
Value of a $10,000 Investment (Unaudited)
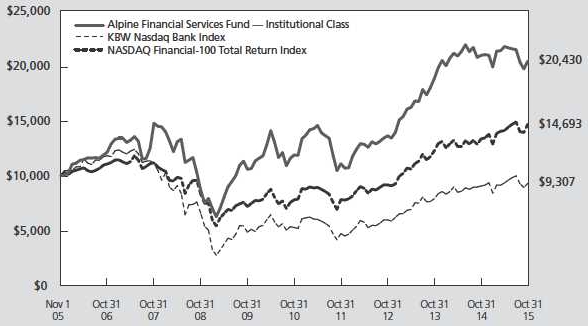
This chart represents a comparison of a hypothetical $10,000 investment in the Fund versus a similar investment in the Fund’s benchmarks. The graph and the table do not reflect the deduction of taxes that a shareholder would pay on Fund distributions or the redemption of Fund shares. Investment performance reflects the waiver and recovery of certain fees, if applicable. Without the waiver and recovery of fees, the Fund’s total return would have differed.
Performance data quoted represents past performance and is not predictive of future results. Investment return and principal value of the Fund fluctuate, so that shares, when redeemed, may be worth more or less than their original cost.
20
| Alpine Financial Services Fund (Continued) | |
Commentary
Dear Shareholders:
The Alpine Financial Services Fund generated a -2.51% total return for the twelve months ended October 31, 2015. This compares to the Fund’s benchmarks that showed total returns of 9.93% for the NASDAQ Financial 100 Total Return Index and 2.70% for the KBW Nasdaq Bank index during the same period. All references in this letter to the Fund’s performance relate to the performance for the Fund’s Institutional Class.
YEAR IN REVIEW
Investors spent much of the past fiscal year trying to predict the timing of the Federal Reserve’s initial interest rate increase. But the crosscurrents underlining a weak economy caused the Fed to take a cautious stance, thus postponing any rate increase. Bank stocks and bond yields fluctuated during the year as investors continually changed their assessment of economic conditions. In anticipation of Fed rate action, the US dollar appreciated, especially against the currencies of emerging markets. This prompted China to devalue their currency which contributed to a spike in market volatility during the latter part of the year. Assurances from global central bankers and leaders that they will do what is necessary to help support the global economy restored investor confidence at period end.
CONTRIBUTING STOCKS
The top five stocks contributing to the Fund’s absolute performance during the twelve months ended October 31, 2015 were FCB Financial Holdings, Inc., Pacific Premier Bancorp, Inc., First Internet Bancorp, Investar Holding Corp, and Atlantic Coast Financial Corporation.
| | • | FCB Financial Holdings, Inc. is a commercial bank headquartered in Weston, Florida. The Company produced strong organic loan growth while building out their franchise, and also announced two stock buyback programs during the past year. |
| | | |
| | • | Pacific Premier Bancorp, Inc. is a commercial bank headquartered in Irvine, California. The Company continued to improve their profitability and franchise value through a combination of organic growth and strategic acquisitions. |
| | | |
| | • | First Internet Bancorp is a commercial bank headquartered in Indianapolis, Indiana. The Company achieved record earnings this year, beating analysts’ estimates aided by loan growth. |
| | | |
| | • | Investar Holdings Corporation is a community bank headquartered in Baton Rouge, LA. Solid loan growth and improved profitability contributed to the stock’s outperformance this period. |
| | • | Atlantic Coast Financial Corporation is a savings bank headquartered in Jacksonville, Florida. Improved financial results contributed to a termination of a regulatory supervisory agreement and the recognition of their deferred tax asset. |
| | | |
| The five largest detractors from the Fund’s performance during the twelve months ended October 31, 2015 were Fifth Street Asset Management, Inc., National Bank of Greece S.A., Health Insurance Innovations, Inc, TBC Bank J.S.C, and Phoenix Companies, Inc. |
| | |
| | • | Fifth Street Asset Management, Inc. is an alternative asset manager which focuses on credit related investments. A challenging environment for fundraising and capital deployment has hindered the stock performance this period. |
| | | |
| | • | National Bank of Greece S.A. is one of the major banks in Greece. Concerns over a potential default on Greek bonds and the Country’s exit from the euro weighed on the stock. For these reasons the position was sold. |
| | | |
| | • | Health Insurance Innovations, Inc. is a web-based health insurance broker. Weak revenue growth which led to reduced earnings estimates hindered the stock performance this period. |
| | | |
| | • | TBC Bank J.S.C. is a bank headquartered in the country of Georgia. Although the fundamentals of the Bank remain good, the stock price was negatively affected by the weakness in the local currency relative to the US dollar. The country’s trade related exposure to Russia has caused economists to lower their growth estimates for Georgia. This may create some headwinds for TBC Bank this upcoming year. |
| | | |
| | • | Phoenix Companies, Inc. is a life insurance company. The Company reported worse than expected results for the quarter ended March 2015. As a result, we sold our position. |
A portion of the Fund’s holdings were held outside the US and denominated in foreign currencies. As a result of the strengthening dollar, these currencies had a negative impact on the Fund’s performance. In an attempt to mitigate currency fluctuation, the Fund hedged a portion of its currency exposures to the Euro. We have also used leverage at times, both in the execution of the strategy of the Fund and to help manage net outflows during the annual period.
The Fund also participated on a number of Initial Public Offerings (IPO), both inside and outside of the financial sector that have contributed to the Fund’s total return. We cannot predict how long, if at all, these opportunities will continue to exist, but to the extent we consider them to be attractively priced and available, the Fund may continue to participate in them.
21
| Alpine Financial Services Fund (Continued) | |
SUMMARY & OUTLOOK
The Federal Reserve appears to be on the cusp of initiating a rate hiking cycle for the first time in more than a decade. The liftoff from zero interest rates is bound to have large and likely unpredictable consequences on financial stocks both here in the United States and abroad. For example, banks and other financial services companies that benefit from higher rates are likely to see their earnings rise as rates head higher. We have positioned the Fund to take advantage of this outcome by buying the shares of several banks and diversified financials that we believe have above average sensitivity to higher short rates. Also, given the possibility of a stronger dollar, we have reduced our international exposure both in developed and emerging markets, although we continue to be on the lookout for interesting ideas outside of the United States.
In recent months, bank mergers and acquisitions (M&A) have begun to heat up with activity not only among small cap banks, but now among mid and large cap banks as well. For example, New York Community Bancorp agreed
to acquire Astoria Financial Corporation for 25x earnings and KeyCorp announced the acquisition of First Niagara Financial Group for 19x earnings. We believe that bank M&A may continue despite the possibility of higher interest rates as the continued burden of higher regulatory compliance and the newfound willingness amongst buyers to pay rich multiples set the stage for additional deal-making. As part of the Fund’s strategy, we continue to seek out bank stocks that may be participants in M&A and are pleased to report that during the twelve month period, the Fund owned six companies that signed merger agreements. These include Alliance Bancorp, Community Southern Holdings, County Commerce Bank, Manhattan Bancorp, Metro Bancorp and Square 1 Financial Inc.
We would like to take this opportunity to thank you for your ongoing support.
Sincerely,
Peter Kovalski
Andrew Kohl
Portfolio Managers
This letter represents the opinions of the Fund’s management and is subject to change, is not guaranteed and should not be considered a recommendation to buy or sell any security. The information provided is not intended to be, and is not, a forecast of future events, a guarantee of future results, or investment advice. Views expressed may vary from those of the firm as a whole.
Past performance is no guarantee of future results.
Mutual fund investing involves risk. Principal loss is possible. The Fund is subject to risks, including the following:
Concentration Risk – The Fund’s strategy of concentrating in companies in a specific industry means that its performance will be closely tied to the performance of a particular market segment. The Fund’s concentration in these companies may present more risks than if it were broadly diversified over numerous industries and sectors of the economy. A downturn in these companies would have a larger impact on the Fund than on a mutual fund that does not concentrate in such companies. At times, the performance of these companies will lag the performance of other industries or the broader market as a whole.
Currency Risk – The value of investments in securities denominated in foreign currencies increases or decreases as the rates of exchange between those currencies and the U.S. dollar change. Currency conversion costs and currency fluctuations could erase investment gains or add to investment losses. Currency exchange rates can be volatile, and are affected by factors such as general economic conditions, the actions of the U.S. and foreign governments or central banks, the imposition of currency controls and speculation.
Equity Securities Risk – The stock or other security of a company may not perform as well as expected, and may decrease in value, because of factors related to the company (such as poorer than expected earnings or certain management decisions) or to the industry in which the company is engaged (such as a reduction in the demand for products or services in a particular industry).
Financial Services Industry Concentration Risk – The Fund is subject to the risk of concentrating investments in financial services companies, which makes it more susceptible to factors adversely affecting issuers within that industry than would a fund investing in a more diversified portfolio of securities. Economic downturns, credit losses and severe price competition can negatively affect this industry. The profitability of financial services companies is dependent on the availability and cost of capital and can fluctuate significantly when interest rates change. Financial services companies are also subject to extensive government regulation. The impact of recent legislation on any individual company or on the industry as a whole cannot be predicted.
22
| Alpine Financial Services Fund (Continued) | |
Foreign Currency Transactions Risk – Foreign securities are often denominated in foreign currencies. As a result, the value of the Fund’s shares is affected by changes in exchange rates. The Fund may enter into foreign currency transactions to try to manage this risk. The Fund’s ability to use foreign currency transactions successfully depends on a number of factors, including the foreign currency transactions being available at prices that are not too costly, the availability of liquid markets and the ability of the Adviser to accurately predict the direction of changes in currency exchange rates.
Foreign Securities Risk – The Fund’s investments in securities of foreign issuers or issuers with significant exposure to foreign markets involve additional risk. Foreign countries in which the Fund may invest may have markets that are less liquid, less regulated and more volatile than U.S. markets. The value of the Fund’s investments may decline because of factors affecting the particular issuer as well as foreign markets and issuers generally, such as unfavorable government actions, and political or financial instability. Lack of information may also affect the value of these securities. The risks of foreign investments are heightened when investing in issuers in emerging market countries.
Growth Stock Risk – Growth stocks are stocks of companies believed to have above-average potential for growth in revenue and earnings. Growth stocks typically are very sensitive to market movements because their market prices tend to reflect future expectations. When it appears those expectations will not be met, the prices of growth stocks typically fall. Growth stocks as a group may be out of favor and underperform the overall equity market while the market concentrates on undervalued stocks.
Initial Public Offerings and Secondary Offerings Risk – The Fund may invest a portion of its assets in shares of IPOs or secondary offerings of an issuer. IPOs and secondary offerings may have a magnified impact on the performance of a Fund with a small asset base. The impact of IPOs and secondary offerings on a Fund’s performance likely will decrease as the Fund’s asset size increases, which could reduce a Fund’s returns. IPOs and secondary offerings may not be consistently available to the Fund for investing. IPO and secondary offering shares frequently are volatile in price due to the absence of a prior public market, the small number of shares available for trading and limited information about the issuer. Therefore, the Fund may hold IPO and secondary offering shares for a very short period of time. This may increase the turnover of the Fund and may lead to increased expenses for the Fund, such as commissions and transaction costs. In addition, IPO and secondary offering shares can experience an immediate drop in value if the demand for the securities does not continue to support the offering price.
Leverage Risk – The Fund may use leverage to purchase securities. Increases and decreases in the value of the Fund’s portfolio will be magnified when the Fund uses leverage.
Liquidity Risk – Some securities held by the Fund may be difficult to sell, or illiquid, particularly during times of market turmoil. Illiquid securities may also be difficult to value. If the Fund is forced to sell an illiquid asset to meet redemption requests or other cash needs, the Fund may be forced to sell at a loss.
Management Risk – The Adviser’s judgment about the quality, relative yield or value of, or market trends affecting, a particular security or sector, or about interest rates generally, may be incorrect. The Adviser’s security selections and other investment decisions might produce losses or cause the Fund to underperform when compared to other funds with similar investment objectives and strategies.
Market Risk – The price of a security held by the Fund may fall due to changing market, economic or political conditions.
Micro Capitalization Company Risk – Stock prices of micro capitalization companies are significantly more volatile, and more vulnerable to adverse business and economic developments than those of larger companies. Micro capitalization companies often have narrower markets for their goods and/or services and more limited managerial and financial resources than larger, more established companies, including small or medium capitalization companies.
Portfolio Turnover Risk – High portfolio turnover necessarily results in greater transaction costs which may reduce Fund performance.
Small and Medium Capitalization Company Risk – Securities of small or medium capitalization companies are more likely to experience sharper swings in market values, less liquid markets, in which it may be more difficult for the Adviser to sell at times and at prices that the Adviser believes appropriate and generally are more volatile than those of larger companies.
Undervalued Stock Risk – The Fund may pursue strategies that may include investing in securities, which, in the opinion of the Adviser, are undervalued. The identification of investment opportunities in undervalued securities is a difficult task and there is no assurance that such opportunities will be successfully recognized or acquired. While investments in undervalued securities offer opportunities for above-average capital appreciation, these investments involve a high degree of financial risk and can result in substantial losses.
Please refer to pages 3-5 for other important disclosures and definitions.
23
| Alpine Small Cap Fund(1) | |
| Comparative Annualized Returns as of 10/31/15 (Unaudited) |
| | | 1 Year | | 3 Years | | 5 Years | | Since Inception(2) |
| Alpine Small Cap Fund — Institutional Class | | | 4.76 | % | | | 9.19 | % | | | 7.78 | % | | | 4.85 | % | |
| Alpine Small Cap Fund — Class A (Without Load) | | | 4.43 | % | | | 8.92 | % | | | N/A | | | 9.87 | % | |
| Alpine Small Cap Fund — Class A (With Load) | | | -1.28 | % | | | 6.87 | % | | | N/A | | | 8.27 | % | |
| Russell 2000® Index | | | 0.34 | % | | | 13.90 | % | | | 12.06 | % | | | 6.89 | % | |
| Russell 3000® Index | | | 4.49 | % | | | 16.09 | % | | | 14.14 | % | | | 7.78 | % | |
| Russell 2000® Growth Index | | | 3.52 | % | | | 16.16 | % | | | 13.56 | % | | | 8.40 | % | |
| S&P 500® Index | | | 5.20 | % | | | 16.20 | % | | | 14.33 | % | | | 7.73 | % | |
| Lipper Small-Cap Growth Funds Average(3) | | | 1.83 | % | | | 13.97 | % | | | 12.30 | % | | | 7.89 | % | |
| Lipper Small-Cap Growth Funds Ranking(3) | | | 141/551 | | | 464/484 | | | 412/427 | | | 310/322 | |
| Gross Expense Ratio (Institutional Class): 1.62%(4) | | | | | | | | | | | | | | | | | |
| Net Expense Ratio (Institutional Class): 1.35%(4) | | | | | | | | | | | | | | | | | |
| Gross Expense Ratio (Class A): 1.87%(4) | | | | | | | | | | | | | | | | | |
| Net Expense Ratio (Class A): 1.60%(4) | | | | | | | | | | | | | | | | | |
| | (1) | Effective March 31, 2014 the Fund’s name, strategy and portfolio managers were changed. The investment objective remains the same. The Fund was formerly known as Alpine Innovators Fund. |
| | (2) | Institutional Class shares commenced on July 11, 2006 and Class A shares commenced on December 30, 2011. Returns for indices are since July 11, 2006. |
| | (3) | The since inception data represents the period beginning July 13, 2006 (Institutional Class only). |
| | (4) | As disclosed in the prospectus dated February 27, 2015. |
Performance data quoted represents past performance and is not predictive of future results. Investment return and principal value of the Fund fluctuate, so that the shares, when redeemed, may be worth more or less than their original cost. Performance current to the most recent month end may be lower or higher than performance quoted and may be obtained by calling 1-888-785-5578. Performance data shown does not reflect the 1.00% redemption fee imposed on shares held for fewer than 60 days. If it did, total returns would be reduced. Returns for the Class A shares with sales charge reflect a maximum sales charge of 5.50%. Performance for the Class A shares without sales charges does not reflect this load.
Russell 2000® Index measures the performance of the small-cap segment of the U.S. equity universe and includes approximately 2000 of the smallest securities based on a combination of their market cap and current index membership. Source: FTSE Russell Indexes. “FTSE®”, “Russell®”, “MTS®”, “FTSE TMX®” and “FTSE Russell” and other service marks and trademarks related to the FTSE or Russell indexes are trademarks of the London Stock Exchange Group companies and are used by FTSE, MTS, FTSE TMX and Russell under license. Russell 3000® Index measures the performance of the largest 3000 U.S. companies representing approximately 98% of the investable U.S. equity market. Source: FTSE Russell Indexes. “FTSE®”, “Russell®”, “MTS®”, “FTSE TMX®” and “FTSE Russell” and other service marks and trademarks related to the FTSE or Russell indexes are trademarks of the London Stock Exchange Group companies and are used by FTSE, MTS, FTSE TMX and Russell under license. Russell 2000® Growth Index measures the performance of the small-cap growth segment of the U.S. equity universe. It includes those Russell 2000 Index companies with higher price-to-value ratios and higher forecasted growth values. Source: FTSE Russell Indexes. “FTSE®”, “Russell®”, “MTS®”, “FTSE TMX®” and “FTSE Russell” and other service marks and trademarks related to the FTSE or Russell indexes are trademarks of the London Stock Exchange Group companies and are used by FTSE, MTS, FTSE TMX and Russell under license. S&P 500® Index is a total return, float-adjusted market capitalization-weighted index of 500 common stocks chosen for market size, liquidity, and industry group representation to represent U.S. equity performance. Total return indexes include reinvestments of all dividends.
Expense Ratios reflect the ratios reported in the Fund’s most recent prospectus. The Alpine Small Cap Fund has a contractual expense waiver that continues through March 1, 2016. Where a Fund’s gross and net expense ratios are the same for the period, the contractual expense reimbursement level was not reached as of the end of that period. To the extent the Fund’s expenses were reduced by waivers, the Fund’s total returns were increased. In these cases, in the absence of the expense waivers, the Fund’s total returns would have been lower.
The Fund’s past performance benefitted significantly from Initial Public Offerings (“IPOs”) of certain issuers, and there is no assurance that the Fund can replicate this performance in the future. To the extent that the Fund’s historical performance resulted from gains derived from participation in Secondary Offerings, there is no guarantee that these results can be replicated or that the Fund will be able to participate to the same degree in IPO/Secondary Offerings in the future.
24
| Alpine Small Cap Fund (Continued) | |
Portfolio Distributions* (Unaudited)
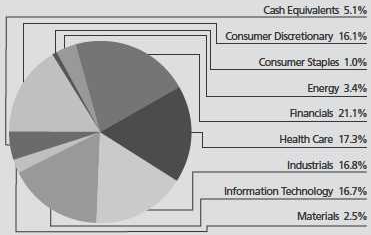
| Top 10 Holdings* (Unaudited) | | | |
| 1. | | Dycom Industries, Inc. | | | 4.69 | % |
| 2. | | Kennedy-Wilson Holdings, Inc. | | | 3.98 | % |
| 3. | | Nexstar Broadcasting Group, Inc.-Class A | | | 3.93 | % |
| 4. | | Fair Isaac Corp. | | | 3.52 | % |
| 5. | | Liberty Tax, Inc. | | | 3.36 | % |
| 6. | | Cardtronics, Inc. | | | 3.30 | % |
| 7. | | ExamWorks Group, Inc. | | | 3.27 | % |
| 8. | | Patrick Industries, Inc. | | | 3.26 | % |
| 9. | | PRA Group, Inc. | | | 3.22 | % |
| 10. | | The Providence Service Corp. | | | 3.20 | % |
| * | Portfolio Distributions percentages are based on total net investments. Top 10 Holdings do not include short-term investments and percentages are based on total net assets. Portfolio holdings sector distributions are as of 10/31/15 and are subject to change. Portfolio holdings are not recommendations to buy or sell any securities. |
Value of a $10,000 Investment (Unaudited)
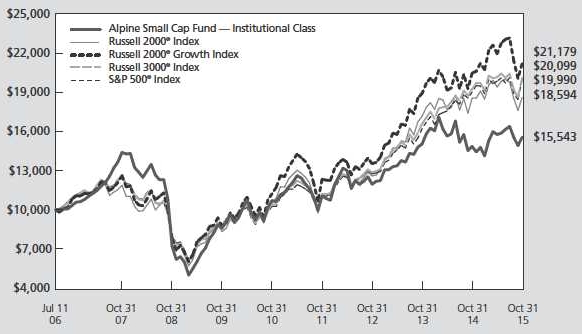
This chart represents a comparison of a hypothetical $10,000 investment in the Fund versus a similar investment in the Fund’s benchmarks. The graph and the table do not reflect the deduction of taxes that a shareholder would pay on Fund distributions or the redemption of Fund shares. Investment performance reflects the waiver and recovery of certain fees, if applicable. Without the waiver and recovery of fees, the Fund’s total return would have differed.
Performance data quoted represents past performance and is not predictive of future results. Investment return and principal value of the Fund fluctuate, so that shares, when redeemed, may be worth more or less than their original cost.
25
| Alpine Small Cap Fund (Continued) | |
Commentary
Dear Shareholders:
The small cap strategy calls for 80% of the Fund’s net assets to be invested in the equity securities of small capitalization companies. The Russell 2000® Index is the primary benchmark for the Fund.
The Fund finds and invests in small cap companies with sustainable competitive business models and managements that focus on creating shareholder value and who are strong capital allocators. Further, we continue to purchase companies with secular growth drivers that we believe will allow them to grow faster than the gross domestic product (GDP). We also look to purchase companies with strong free cash flow yields. We believe this strategy will allow for strong relative performance versus the Russell 2000® over a market cycle. All references to the Fund’s performance relate to the performance of the Fund’s Institutional Class.
The portfolio return for the Fund for the fiscal year ended October 31, 2015 was 4.76% compared with the Russell 2000® Index which was up 0.34%.
The top five stocks contributing to the Fund’s total return during the fiscal year ended October 31, 2015 were Dycom Industries, Patrick Industries, U.S. Concrete, Ligand Pharmaceuticals, and Fleetmatics Group.
| | • | Dycom Industries is an engineering and construction firm that has benefitted from increased customer buildout of fiber networks. |
| | | |
| | • | Patrick Industries is a manufacturer of recreational vehicle components. Customer demand has been strong this year. |
| | | |
| | • | U.S. Concrete supplies concrete to select urban markets and has benefitted from good non-residential construction trends. |
| | | |
| | • | Ligand Pharmaceuticals develops drugs used in a variety of growing pharmaceutical applications. |
| | | |
| | • | Fleetmatics Group provides fleet management solutions to increase customer productivity. |
| | | |
| Liberty Tax, Applied Optoelectronics, Healthways, Altisource Residential, and ExamWorks had the largest adverse impact on the performance of the Fund over the fiscal year. |
| | | |
| | • | Liberty Tax, a large paid tax preparer, encountered limited new office growth which negatively impacted the business. |
| | • | Applied Optoelectronics, a manufacturer of advanced optical semiconductor devices, was down over concern about the poor execution of a new product rollout. |
| | | |
| | • | Healthways is a health care provider of specialized services that was hurt by negative enrollment trends. |
| | | |
| | • | Altisource Residential is transitioning to an operator of single family residential homes. The market has been concerned about the strength of the business model. |
| | | |
| | • | ExamWorks is a provider of independent medical exams. Foreign currency translations and international weakness have hurt the stock in the last year. |
The Russell 2000® had a good start to the fiscal year steadily increasing into the June quarter. Concerns about the general economy and Fed actions have driven a pullback in the Russell 2000® into the end of the fiscal year, ending up slightly for the full fiscal year.
The volatility was fueled by concerns about the Federal Reserve’s anticipated increase in the Fed Funds rate. Further, even with unprecedented easy money policies by central banks around the world, economic growth remains slow or slowing in most of the world’s developed economies. We expect the interest rate environment to remain benign. This backdrop, in combination with the modest economic growth we are experiencing, should be a positive environment for small cap stocks going forward. We continue to find what we believe are attractive businesses at attractive valuations relative to their growth or free cash flow yield.
The Fund’s small cap strategy has been considerably more volatile because it invests in far fewer stocks than the 2000 in the Index. We strongly believe that this strategy should allow us to outperform the market over a full cycle. It will also cause increased volatility over shorter periods of time. We continue to find securities for the Fund that we feel are attractive businesses with attractive valuations. Small cap stocks also tend to have less investment coverage, which creates additional inefficiencies. We believe that our performance versus the Russell 2000® will be rewarded by identifying and purchasing these stocks for the portfolio over a longer period.
Sincerely,
Michael T. Smith
Portfolio Manager
26
| Alpine Small Cap Fund (Continued) | |
This letter represents the opinions of the Fund’s management and is subject to change, is not guaranteed and should not be considered a recommendation to buy or sell any security. The information provided is not intended to be, and is not, a forecast of future events, a guarantee of future results, or investment advice. Views expressed may vary from those of the firm as a whole.
Past performance is no guarantee of future results.
Mutual fund investing involves risk. Principal loss is possible. The Fund is subject to risks, including the following:
Currency Risk – The value of investments in securities denominated in foreign currencies increases or decreases as the rates of exchange between those currencies and the U.S. dollar change. Currency conversion costs and currency fluctuations could erase investment gains or add to investment losses. Currency exchange rates can be volatile, and are affected by factors such as general economic conditions, the actions of the U.S. and foreign governments or central banks, the imposition of currency controls and speculation.
Equity Securities Risk – The stock or other security of a company may not perform as well as expected, and may decrease in value, because of factors related to the company (such as poorer than expected earnings or certain management decisions) or to the industry in which the company is engaged (such as a reduction in the demand for products or services in a particular industry).
Foreign Currency Transactions Risk – Foreign securities are often denominated in foreign currencies. As a result, the value of the Fund’s shares is affected by changes in exchange rates. The Fund may enter into foreign currency transactions to try to manage this risk. The Fund’s ability to use foreign currency transactions successfully depends on a number of factors, including the foreign currency transactions being available at prices that are not too costly, the availability of liquid markets and the ability of the Adviser to accurately predict the direction of changes in currency exchange rates.
Foreign Securities Risk – The Fund’s investments in securities of foreign issuers or issuers with significant exposure to foreign markets involve additional risk. Foreign countries in which the Fund may invest may have markets that are less liquid, less regulated and more volatile than U.S. markets. The value of the Fund’s investments may decline because of factors affecting the particular issuer as well as foreign markets and issuers generally, such as unfavorable government actions, and political or financial instability. Lack of information may also affect the value of these securities. The risks of foreign investments are heightened when investing in issuers in emerging market countries.
Growth Stock Risk – Growth stocks are stocks of companies believed to have above-average potential for growth in revenue and earnings. Growth stocks typically are very sensitive to market movements because their market prices tend to reflect future expectations. When it appears those expectations will not be met, the prices of growth stocks typically fall. Growth stocks as a group may be out of favor and underperform the overall equity market while the market concentrates on undervalued stocks.
Initial Public Offerings and Secondary Offerings Risk – The Fund may invest a portion of its assets in shares of IPOs or secondary offerings of an issuer. IPOs and secondary offerings may have a magnified impact on the performance of a Fund with a small asset base. The impact of IPOs and secondary offerings on a Fund’s performance likely will decrease as the Fund’s asset size increases, which could reduce a Fund’s returns. IPOs and secondary offerings may not be consistently available to the Fund for investing. IPO and secondary offering shares frequently are volatile in price due to the absence of a prior public market, the small number of shares available for trading and limited information about the issuer. Therefore, the Fund may hold IPO and secondary offering shares for a very short period of time. This may increase the turnover of the Fund and may lead to increased expenses for the Fund, such as commissions and transaction costs. In addition, IPO and secondary offering shares can experience an immediate drop in value if the demand for the securities does not continue to support the offering price.
Leverage Risk – The Fund may use leverage to purchase securities. Increases and decreases in the value of the Fund’s portfolio will be magnified when the Fund uses leverage.
Liquidity Risk – Some securities held by the Fund may be difficult to sell, or illiquid, particularly during times of market turmoil. Illiquid securities may also be difficult to value. If the Fund is forced to sell an illiquid asset to meet redemption requests or other cash needs, the Fund may be forced to sell at a loss.
27
| Alpine Small Cap Fund (Continued) | |
Management Risk – The Adviser’s judgment about the quality, relative yield or value of, or market trends affecting, a particular security or sector, or about interest rates generally, may be incorrect. The Adviser’s security selections and other investment decisions might produce losses or cause the Fund to underperform when compared to other funds with similar investment objectives and strategies.
Market Risk – The price of a security held by the Fund may fall due to changing market, economic or political conditions.
Real Estate Investment Trusts (“REITs”) Risk – REITs’ share prices may decline because of adverse developments affecting the real estate industry including changes in interest rates. The returns from REITs may trail returns from the overall market. Additionally, there is always a risk that a given REIT will fail to qualify for favorable tax treatment.
Small Capitalization Company Risk – Securities of small capitalization companies are more likely to experience sharper swings in market values, less liquid markets, in which it may be more difficult for the Adviser to sell at times and at prices that the Adviser believes appropriate and generally are more volatile than those of larger companies.
Undervalued Stock Risk – The Fund may pursue strategies that may include investing in securities, which, in the opinion of the Adviser, are undervalued. The identification of investment opportunities in undervalued securities is a difficult task and there is no assurance that such opportunities will be successfully recognized or acquired. While investments in undervalued securities offer opportunities for above-average capital appreciation, these investments involve a high degree of financial risk and can result in substantial losses. By combining both growth and value styles, the Adviser seeks to diversify these risks and lower the volatility, but there is no assurance that this strategy will achieve that result.
Please refer to pages 3-5 for other important disclosures and definitions.
28
Fixed Income Manager Reports

| | Alpine Ultra Short Municipal Income Fund |
| | |
| | Alpine High Yield Managed Duration Municipal Fund |
29
| Alpine Ultra Short Municipal Income Fund | |
| Comparative Annualized Returns as of 10/31/15 (Unaudited) | |
| | | 1 Year | | 3 Years | | 5 Years | | 10 Years | | Since Inception(1) | |
| Alpine Ultra Short Municipal Income Fund — Institutional Class | | | 0.52 | % | | | 0.50 | % | | | 0.86 | % | | | 2.08 | % | | | 2.26 | % | | |
| Alpine Ultra Short Municipal Income Fund — Class A | | | 0.26 | % | | | 0.12 | % | | | 0.53 | % | | | 1.82 | % | | | 1.76 | % | | |
| Barclays Municipal Bond: 1 Year (1-2) Index | | | 0.76 | % | | | 0.74 | % | | | 0.88 | % | | | 2.16 | % | | | 2.02 | % | | |
| Lipper Short Municipal Debt Funds Average(2) | | | 0.39 | % | | | 0.53 | % | | | 1.00 | % | | | 1.93 | % | | | 1.79 | % | | |
| Lipper Short Municipal Debt Funds Ranking — Institutional Class(2) | | | 35/99 | | | 50/82 | | | 44/77 | | | 21/48 | | | 10/36 | | |
| Gross Expense Ratio (Institutional Class): 0.90%(3) | | | | | | | | | | | | | | | | | | | | | | |
| Net Expense Ratio (Institutional Class): 0.70%(3) | | | | | | | | | | | | | | | | | | | | | | |
| Gross Expense Ratio (Class A): 1.15%(3) | | | | | | | | | | | | | | | | | | | | | | |
| Net Expense Ratio (Class A): 0.95%(3) | | | | | | | | | | | | | | | | | | | | | | |
| | (1) | Institutional Class shares commenced on December 5, 2002 and Class A shares commenced on March 30, 2004. Returns for indices are since December 5, 2002. |
| | (2) | The since inception data represents the period beginning December 31, 2002. |
| | (3) | As disclosed in the prospectus dated February 27, 2015. |
Performance data quoted represents past performance and is not predictive of future results. Investment return and principal value of the Fund fluctuate, so that the shares, when redeemed, may be worth more or less than their original cost. Performance current to the most recent month end may be lower or higher than performance quoted and may be obtained by calling 1-888-785-5578. Performance data shown does not reflect the 0.25% redemption fee imposed on shares held for fewer than 30 days. If it did, total returns would be reduced. Effective 10/12/07, Alpine Ultra Short Municipal Income Fund — Class A began imposing a maximum sales charge of 0.50% on purchases. Performance data shown for time period beginning with dates after October 12, 2007 reflect the sales charge.
Barclays Municipal Bond: 1 Year (1-2) Index is a total return benchmark of BAA3 ratings or better designed to measure returns for tax exempt assets. The Lipper Short Municipal Debt Funds Average is an unmanaged index that tracks funds that invest in municipal debt issues with dollar-weighted average maturities of less than three years. Lipper rankings for the periods shown are based on fund total returns with dividends and distributions reinvested and do not reflect sales charges. The Barclays Municipal Bond: 1 Year (1-2) Index and the Lipper Short Municipal Debt Funds Average are unmanaged and do not reflect the deduction of direct fees associated with a mutual fund, such as investment adviser fees; however, the Lipper Short Municipal Debt Funds Average reflects fees charged by the underlying funds. The performance for the Alpine Ultra Short Municipal Income Fund reflects the deduction of fees for these value-added services. Investors cannot directly invest in an index.
Expense Ratios reflect the ratios reported in the Fund’s most recent prospectus. The Alpine Ultra Short Municipal Income Fund has a contractual expense waiver that continues through March 1, 2016. Where a Fund’s gross and net expense ratios are the same for the period reported, the contractual expense reimbursement level was not reached as of the end of that period. To the extent the Fund’s expenses were reduced by waivers, the Fund’s total returns were increased. In these cases, in the absence of the expense waivers, the Fund’s total returns would have been lower. The Adviser has also voluntarily waived a portion of the expenses for the Alpine Ultra Short Municipal Income Fund. To the extent the Fund’s expenses were reduced by waivers, the Fund’s total returns were increased. In these cases, in the absence of the expense waivers, the Fund’s total returns would have been lower.
30
| Alpine Ultra Short Municipal Income Fund (Continued) | |
Portfolio Distributions* (Unaudited)

| Top 10 Holdings* (Unaudited) |
| 1. | | Mississippi Business Finance Corp. Revenue, PSL-North America LLC Project, 2.55%, 11/01/2032 (Putable on 11/05/2015) | | | 6.97 | % |
| 2. | | Phoenix Industrial Development Authority, Solid Waste Revenue, Republic Services, Inc. Project, 0.60%, 12/01/2035 (Putable on 11/02/2015) | | | 6.35 | % |
| 3. | | Indiana Finance Authority, Multifamily HSG Revenue, 1.00%, 10/26/2017 (Putable on 11/05/2015) | | | 6.07 | % |
| 4. | | Government Development Bank for Puerto Rico Revenue, 4.75%, 12/01/2015 | | | 4.25 | % |
| 5. | | New Jersey Economic Development Authority, Port Newark Container Terminal LLC Project, 0.55%, 07/01/2030 (Putable on 11/04/2015) | | | 3.72 | % |
| 6. | | Town of Oyster Bay, Bond Anticipation Notes, 2.00%, 07/08/2016 | | | 3.61 | % |
| 7. | | Chicago Board of Education, 0.65%, 12/01/2034 (Putable on 11/05/2015) | | | 3.43 | % |
| 8. | | Florida Development Finance Corp., Healthcare Facilities Revenue, UF Health-Jacksonville Project, 0.95%, 02/01/2029 (Putable on 11/05/2015) | | | 2.93 | % |
| 9. | | Lewisburg Industrial Development Board Solid Waste Disposal Revenue, Waste Management, Inc. of Tennessee Project, 0.55%, 07/02/2035 (Putable on 11/02/2015) | | | 2.25 | % |
| 10. | | New York Environmental Facilities Corp. Solid Waste Disposal Revenue, Waste Management, Inc. Project, 0.55%, 05/01/2030 (Putable on 11/02/2015) | | | 2.25 | % |
| * | Portfolio holdings and sector distributions are as of 10/31/15 and are subject to change. Portfolio holdings are not recommendations to buy or sell any securities. Portfolio Distributions percentages are based on total investments and Top 10 Holdings percentages are based on total net assets. |
| | |
| (1) | Amount is less than 0.05%. |
31
| Alpine Ultra Short Municipal Income Fund (Continued) | |
Value of a $10,000 Investment (Unaudited)
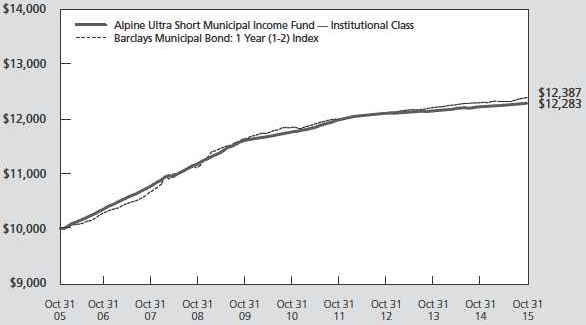
This chart represents a comparison of a hypothetical $10,000 investment in the Fund versus a similar investment in the Fund’s benchmark. The graph and the table do not reflect the deduction of taxes that a shareholder would pay on Fund distributions or the redemption of Fund shares. Investment performance reflects the waiver and recovery of certain fees, if applicable. Without the waiver and recovery of fees, the Fund’s total return would have differed.
Performance data quoted represents past performance and is not predictive of future results. Investment return and principal value of the Fund fluctuate, so that shares, when redeemed, may be worth more or less than their original cost.
Credit Quality Allocation (As of 10/31/2015)
| AAA | | | 1.60 | % |
| AA | | | 16.1 | % |
| A | | | 34.9 | % |
| BBB | | | 25.6 | % |
| B | | | 0.10 | % |
| Not Rated | | | 21.7 | % |
Bond Credit Quality-Reflects the higher of the ratings of Standards & Poor’s Corporation; Moody’s Investors Service, Inc. or Fitch, Inc. Ratings are relative, subjective and not absolute standards of quality, represent the opinions of the independent Nationally Recognized Statistical Rating Organizations (NRSRO), and are adjusted to the Standards and Poors scale shown. Ratings are measured using a scale that typically ranges from AAA (highest) to D (lowest). The security’s credit rating does not eliminate risk. The table excludes equity securities, cash and cash equivalents. For more information about securities ratings, please see the Fund’s Statement of Additional Information. Additional information on ratings methodologies are available by visiting the NRSRO websites; www.standardandpoors.com, www.moodys.com, and www.fitchratings.com.
32
| Alpine High Yield Managed Duration Municipal Fund | |
| Comparative Annualized Returns as of 10/31/15 (Unaudited) |
| | | | | | Since Inception |
| | | | 1 Year | | (5/31/2013) |
| Alpine High Yield Managed Duration Municipal Fund — Institutional Class | | | 3.65 | % | | | 4.54 | % | |
| Alpine High Yield Managed Duration Municipal Fund — Class A (Without Load) | | | 3.42 | % | | | 4.30 | % | |
| Alpine High Yield Managed Duration Municipal Fund — Class A (With Load) | | | 0.87 | % | | | 3.20 | % | |
| S&P Municipal Bond Short Intermediate Index | | | 1.81 | % | | | 2.06 | % | |
| Barclays Municipal Bond: High Yield (non-Investment Grade) Index | | | 2.79 | % | | | 2.29 | % | |
| Lipper High Yield Municipal Debt Funds Average(1) | | | 4.09 | % | | | 3.55 | % | |
| Lipper High Yield Municipal Debt Funds Ranking(1) | | | 96/145 | | | 23/127 | |
| Gross Expense Ratio (Institutional Class): 1.30%(2) | | | | | | | | | |
| Net Expense Ratio (Institutional Class): 0.81%(2) | | | | | | | | | |
| Gross Expense Ratio (Class A): 1.55%(2) | | | | | | | | | |
| Net Expense Ratio (Class A): 1.06%(2) | | | | | | | �� | | |
| | (1) | The since inception data represents the period beginning 5/31/2013. |
| | (2) | As disclosed in the prospectus dated February 27, 2015. |
Performance data quoted represents past performance and is not predictive of future results. Investment return and principal value of the Fund fluctuate, so that shares, when redeemed, may be worth more or less than their original cost. Performance current to the most recent month end may be lower or higher than the performance quoted and may be obtained by calling 1-888-785-5578. Performance data shown does not reflect the 0.75% redemption fee imposed on shares held for fewer than 60 days. If it did, total returns would be reduced. Returns for the Class A shares with sales charge reflect a maximum sales charge of 2.50%. Performance for the Class A shares without sales charges does not reflect this load.
The S&P Municipal Bond Short Intermediate Index consists of bonds in the S&P Municipal Bond Index with a minimum maturity of one year and a maximum maturity of up to, but not including, eight years as measured from the Rebalancing Date. The Barclays Municipal Bond: High Yield (non-Investment Grade) Index is the Muni High Yield component of the Barclays Municipal Bond Index. The Barclays Municipal Bond Index is a rules-based, market-value-weighted index engineered for the long-term tax-exempt bond market. The Lipper High Yield Municipal Debt Funds Average is an unmanaged index that tracks funds that invest in funds that typically invest 50% or more of their assets in municipal debt issues rated BBB or less. Lipper rankings for the period shown are based on fund total returns with dividends and distributions reinvested and do not reflect sales charges.
Expense ratios reflect the ratios reported in the Fund’s most recent prospectus. The Alpine High Yield Managed Duration Municipal Fund has a contractual expense waiver that continues through March 1, 2016. Where a Fund’s gross and net expense ratios are the same for the period reported, the contractual expense reimbursement level was not reached as of the end of that period. To the extent the Fund’s expenses were reduced by waivers, the Fund’s total returns were increased. In these cases, in the absence of the expense waivers, the Fund’s total returns would have been lower. The Adviser has also voluntarily waived a portion of the expenses for the Alpine High Yield Managed Duration Municipal Fund. To the extent the Fund’s expenses were reduced by waivers, the Fund’s total returns were increased. In these cases, in the absence of the expense waivers, the Fund’s total returns would have been lower.
33
| Alpine High Yield Managed Duration Municipal Fund (Continued) | |
Portfolio Distributions* (Unaudited)
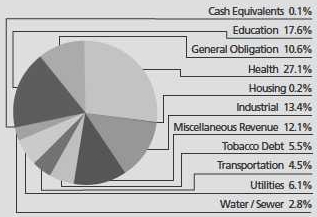
| Top 10 Holdings* (unaudited) |
| 1. | | Jefferson County Ltd. Obligation School Warrants, 4.75%, 01/01/2025 | | | 4.91 | % |
| 2. | | Sevier County Public Building Authority, Local Government Public Improvement, 2.70%, 06/01/2026 (Putable on 11/05/2015) | | | 2.45 | % |
| 3. | | Allegheny County Industrial Development Authority, Environmental Improvement Revenue, United States Steel Corp., 5.50%, 11/01/2016 | | | 2.20 | % |
| 4. | | Maryland Economic Development Corp., CNX Marine Terminal, Inc., 5.75%, 09/01/2025 | | | 1.80 | % |
| 5. | | Palomar Pomerado Health Care, 1.75%, 11/01/2036 (Putable on 11/03/2015) | | | 1.80 | % |
| 6. | | Dallas-Fort Worth International Airport Facilities Improvement Corp., Learjet, Inc., 6.15%, 01/01/2016 | | | 1.79 | % |
| 7. | | Kansas Independent College Finance Authority, Revenue Anticipation Notes, Ottawa University, 4.85%, 05/01/2016 | | | 1.72 | % |
| 8. | | Hammond Local Public Improvement Bond Bank, 3.25%, 05/01/2016 | | | 1.71 | % |
| 9. | | Palomar Pomerado Health Care, 1.39%, 11/01/2036 (Putable on 11/05/2015) | | | 1.54 | % |
| 10. | | Selma Industrial Development Board Revenue, Zilkha Biomass Selma LLC Project, 7.50%, 05/01/2025 | | | 1.52 | % |
| * | Portfolio Distributions percentages are based on total net investments. Top 10 Holdings do not include short-term investments and percentages are based on total net assets. Portfolio holdings sector distributions are as of 10/31/15 and are subject to change. Portfolio holdings are not recommendations to buy or sell any securities. |
Value of a $10,000 Investment (Unaudited)
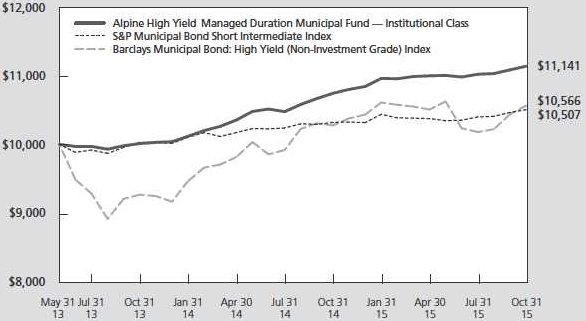
This chart represents a comparison of a hypothetical $10,000 investment in the Fund versus a similar investment in the Fund’s benchmark. The graph and the table do not reflect the deduction of taxes that a shareholder would pay on Fund distributions or the redemption of Fund shares. Investment performance reflects the waiver and recovery of certain fees, if applicable. Without the waiver and recovery of fees, the Fund’s total return would have differed.
Performance data quoted represents past performance and is not predictive of future results. Investment return and principal value of the Fund fluctuate, so that shares, when redeemed, may be worth more or less than their original cost.
34
| Alpine High Yield Managed Duration Municipal Fund (Continued) | |
Credit Quality Allocation (As of 10/31/2015)
| | | | | |
| AAA | | | 1.1 | % |
| AA | | | 13.1 | % |
| A | | | 15.2 | % |
| BBB | | | 9.7 | % |
| BB | | | 19.8 | % |
| B | | | 8.9 | % |
| CCC | | | 0.5 | % |
| Not Rated | | | 31.7 | % |
Bond Credit Quality-Reflects the higher of the ratings of Standards & Poor’s Corporation; Moody’s Investors Service, Inc. or Fitch, Inc. Ratings are relative, subjective and not absolute standards of quality, represent the opinions of the independent Nationally Recognized Statistical Rating Organizations (NRSRO), and are adjusted to the Standards and Poors scale shown. Ratings are measured using a scale that typically ranges from AAA (highest) to D (lowest). The security’s credit rating does not eliminate risk. The table excludes equity securities, cash and cash equivalents. For more information about securities ratings, please see the Fund’s Statement of Additional Information. Additional information on ratings methodologies are available by visiting the NRSRO websites; www.standardandpoors.com, www.moodys.com, and www.fitchratings.com.
35
Alpine Ultra Short Municipal Income Fund /
Alpine High Yield Managed Duration Municipal Fund | |
Commentary
Dear Shareholders:
During the last year, economic growth in the United States has continued to be unstable and relatively weak as measured by gross domestic product (GDP). Fourth-quarter (Q4) 2014 GDP growth was an adequate 2.2%, just short of market expectations, but less than half the rate of economic growth compared to the prior two quarters. In Q1 2015, GDP surprised the market by contracting 0.2%. The poor economic performance primarily reflected a growing U.S. trade deficit, deceleration of personal consumption and a West Coast port labor slowdown. In Q2 2015, the U.S. economy surged to 3.9% driven primarily by increased consumer spending, resolution of the West Coast port slowdown and strength in the finance and transportation industries. Economic growth continued in Q3 2014 with a tepid 2.1% GDP increase, according to the second estimate released by the Bureau of Economic Analysis. Up from an initial estimate of 1.5%, revisions to Q3 GDP were concentrated mainly in increased inventory stockpiles.
During the 12-month period ended October 31, 2015, fixed income markets experienced notable interest rate volatility and surprised market participants with a significant rally in the Treasury and Municipal markets during January 2015. At November 3, 2014, the 10-year Treasury bond yield stood at 2.34% with moderate to significant volatility during fiscal 2015 ending the period down 20 basis points to 2.14% at October 31, 2015. During the fiscal year, 10-year Treasury bond yields fell to a low of 1.64% on January 30, 2015 after a strong month-long Treasury bond rally forced yields down 53 basis points. The temporary yield decline was primarily driven by investor fears of slowing global economic growth and its potential negative impact on the U.S. economy. Additionally, investors renewed expectations that the Fed was not going to raise short-term rates for a considerable period of time. The 10-year Treasury bond yield peaked at 2.48% on June 10, 2015, driven in part by stiff increases in German 10-year bund yields followed by U.S. Treasury yield increases that began in April. Investor concerns of increased inflation in both, the U.S. and Europe as well as potential action by the Fed also contributed to the Treasury market backing off.
The Municipal market experienced similar yield patterns during the last fiscal year with slightly less volatility. On November 3, 2014, the Bloomberg Fair Value U.S. General Obligation AAA 10-Year Index (the “Muni Index”) stood at 2.12% and peaked at a ceiling of 2.39% five times between June 11 and July 15, 2015. The Muni Index yield hit a low during the fiscal year of 1.77% on February 2, 2015. In the preceding month, demand was strong, outstripping a still growing Muni issuance. Municipal
bond fund flows were also strong in January, contributing to the bond rally as did comments by the Fed indicating it would prolong a move to increase short-term interest rates. On October 31, 2015, the Muni Index ended the fiscal year at 2.07%, only 5 basis points below where it started the fiscal year.
Long-term municipal bond issuance during the first ten months of Calendar year 2015 increased by a significant 29.8% to $349.2 billion, compared with volume of $269.0 billion during the same period during 2014. Most of the increase was due to refunding activity versus new money issuance with refunding activity increasing 48.2% during this period compared to new capital increasing only 6.8%.
The growth in refunding activity occurred as a result of a favorable interest rate environment which made refinancing a municipal entity’s higher coupon debt economical. New capital issuance has been muted in recent years as state and local municipalities continued to rein in avoidable capital expenditures in order to replenish reserves which were significantly reduced during the Great Recession.
ALPINE ULTRA SHORT MUNICIPAL INCOME FUND
The Alpine Ultra Short Income Municipal Fund’s total return was 0.52% versus the Barclays One-Year Municipal Bond Index return of 0.76% for the one-year period ending October 31, 2015. The Fund ended the reporting period with a weighted average maturity of 67 days and a duration of 0.167 years both of which are much shorter than the benchmark which had a weighted average maturity of 1.49 years and a modified duration of 1.40 years. The Adviser continued to support the Fund by voluntarily waiving a portion of the Fund’s management fee, beyond what is required under our contractual expense limitation agreement, to provide what we believe is a competitive yield to our shareholders. Absent these waivers, the yield of the Fund would have been significantly lower.
We gradually lowered our average maturity and duration over the course of the year as we were conscious of the fundamentals of the market and in anticipation of what the Fed was going to do. Based on our current evaluation of the market, we do not anticipate extending the average maturity much further than where it currently is.
During the past year, despite the long end of the market selling off for most of the year, the short end of the market held relatively firm as demand continued to easily absorb the available supply. While we did see periods where the short end of the market backed off over all, rates did not change that much over the course of the year for securities
36
Alpine Ultra Short Municipal Income Fund /
Alpine High Yield Managed Duration Municipal Fund | |
inside of two years. Furthermore, several large issuers, namely, the State of California and the State of Texas didn’t need to sell their yearly cash flow notes and as a result demand for short-term securities increased dramatically over the summer as investors needed to find an alternative for their maturing bonds. This is just one example of why we continue to believe the market is being driven more by technical factors rather than economic or fundamental factors. Keeping this in mind, plus the fact that we believed the Fed was going to come off the sidelines in 2015, prompted us to keep our weighted average maturity and duration short and caused the Fund’s overall total return to lag its benchmark slightly.
We continued to hold our largest segment of the portfolio in Variable Rate Demand Notes (VRDNs) as they provided the Fund with price stability and liquidity. While we did see the usual increase in yields during tax time this was short-lived and rates dropped in June as supply became scarce and demand increased. We believe that these securities play an important role in meeting our investment objectives and yields could increase if the Fed raises rates this year.
We also invested in three to twelve month put bonds and this was one segment where we were able to capture a little more yield as the year progressed. Our focus concentrated more on the three-month segment as we believed yields were heading higher. We wanted our bonds maturing sooner in order to capture the higher yield. The largest holdings in these types of securities are from issuers Waste Management and Republic Services. We are encouraged that yields have finally started to increase for this segment of the market and will continue to keep it as a core holding moving forward especially as these two issuers are very active in the short-term market.
The other longer maturing bond purchases included General Market Notes. We believe these 12-month and shorter securities are a great addition for the Fund as they allow us to potentially capture a higher yield without dramatically increasing the maturity of the Fund. Some of the larger issuers purchased included Long Beach, NY, Newark, NJ, East Providence, RI and Utica, NY.
At the end of our reporting period, our holdings in Puerto Rico were slightly over 5% of the Fund. Importantly, all of these holdings are insured by Assured Guaranty or Nat Re and most mature this December. While we added to our insured positions in late spring as attractive opportunities presented themselves, we were cautious to focus on insured bonds that mature in December of this year.
Conclusion
We approached 2015 cautiously as we knew that technical factors were driving the market and there was a lot of chatter about the Fed raising rates. An increase in
supply has eased some of the burden of low yields past one-year but we won’t see any dramatic change until the Fed comes off the sidelines. We believe that with the economy on much firmer ground, the likelihood of that happening in December is high. We feel that the Fund is well positioned to take advantage of changes in the marketplace whether its economic or fundamental.
ALPINE HIGH YIELD MANAGED DURATION MUNICIPAL FUND
The Alpine High Yield Managed Duration Municipal Fund’s total return was 3.65% versus the S&P Municipal Bond Short Intermediate Index (“S&P Index”) return of 1.81% and the Barclays Municipal High Yield (Non-Investment Grade) Index (“Barclays Index”) return of 2.79% for the one-year period ended October 31, 2015. The Fund ended the reporting period with an average weighted maturity of 4.65 years and an effective duration of 2.27 years. The Barclays Index had a much longer average weighted maturity and duration while the S&P Index had a slightly shorter maturity but longer duration.
Through the last two months of 2014 and into the first four months of 2015, the market remained relatively stable as demand remained robust and the supply was easily absorbed. Despite an increase in supply this year, rates did not start to increase until the talk of a Fed rate hike got louder and demand tapered off. This is when the technical factors shifted from the markets being driven higher by a supply and demand imbalance to a selloff for the same reason. It wasn’t a surprise to see issuance increase this year as we expected issuers to come to the market before the Fed started their tightening program. This change in dynamic was a welcome change for us and we remained cautious as to how we positioned the portfolio. We were also mindful of what important role liquidity plays in the high yield space especially after it has been on such a run for the last year. For that reason, we continued to barbell the portfolio with most of our holdings in one to two years and seven to ten years. By taking this approach, we were able to capture higher yields from our longer term securities while attempting to provide some level of NAV stability with our shorter maturing securities. We expect to continue this strategy going into the 2016 as we anticipate potentially more volatility moving forward.
Our largest sectors continue to be from issuers in healthcare/continuing care facilities (CCRCs). We continued to focus primarily on structures from CCRCs that issued bonds with certain call features that pay back their principal prior to maturity as the facilities reach certain occupancy levels. While we are mindful that we will most likely have to reinvest the called principal earlier than anticipated, we believe this is mitigated by the fact that we should receive our principal before the facility is fully occupied.
37
Alpine Ultra Short Municipal Income Fund /
Alpine High Yield Managed Duration Municipal Fund | |
Another area that has caught our attention over the past year has been corporate backed municipal bonds. These securities carry the same tax exempt qualities as state and local backed bonds but are guaranteed by the corporation issuing the bonds. This is a unique segment of the market as the securities tend to trade off the fundamentals of both municipal market and the corporate bond market. Specific corporate issuers we have purchased over the last year include U.S. Steel and Consol Energy. We were attracted to these two issuers because of their individual characteristics and maturities. Our U.S. Steel positions are barbelled with the majority coming due in 2016 while our Consol Energy position is out 10 years.
An area that had cheapened up significantly was Illinois General Obligations (GO’s) and issuers in Chicago, including the city itself. While both the state and the city have been under a lot of financial stress due to their large unfunded pension programs, it wasn’t until 2015 that the market and rating agencies really started to take notice and react accordingly. As a result, the ratings on the state, the city and city entities were lowered and their yields shot up. We added to our positions in all three categories with some of our purchases being insured as they also traded off in tandem with the uninsured debt.
We also concentrated our efforts on purchasing callable bonds with very short, continuous call features. As our objective is to maximize our yield while softening volatility, investing in these types of securities gives us the potential to do both, provided the bond doesn’t get called on the nearest call date. Furthermore, with an ongoing call provision attached to the bond, we believe the price should stay relatively stable under normal circumstances.
We significantly pared down our holdings in Puerto Rico towards the end of our reporting period and our position
currently stands at 4.59% of the portfolio. Importantly, 97% of our bonds from Puerto Rico are insured by Assured Guaranty and Nat Re and our uninsured portion which is guaranteed by the Commonwealth amounts to 0.15% of the overall portfolio. While we continue to look for buying opportunities in short insured paper, we have been cautious about not increasing our exposure until we have a better understanding of how the next few months will unfold.
Conclusion
The high yield market has been far more volatile this past year than in the past few years. We saw the markets perform very well from the end of 2014 and into the first few months of 2015, only to turn in the spring as the supply/demand imbalance reversed itself and liquidity was challenged. This equation has recently changed course again as money has flowed back into the sector and yields have started to drop again on most securities. This volatility should continue until the markets are reassured as to when the Fed is going to come off the sidelines and can assess what their intentions are going forward. We are also mindful of the recent widening of spreads between high yield corporate munis and other comparably rated municipal securities. As we approach 2016, we will continue to evaluate all the variables that have been the drivers and detractors in the market over the last year and position the portfolio accordingly. We believe that the Fed will start their tightening program in December and gradually continue it throughout 2016. As always, we will continue to monitor the market for buying opportunities and credit changes and adjust the portfolio accordingly.
Sincerely,
Steven C. Shachat
Portfolio Manager
This letter represents the opinions of the Funds’ management and is subject to change, is not guaranteed and should not be considered a recommendation to buy or sell any security. The information provided is not intended to be, and is not, a forecast of future events, a guarantee of future results, or investment advice. Views expressed may vary from those of the firm as a whole.
Past performance is no guarantee of future results.
Diversification does not assure a profit nor protect against loss in a declining market.
Mutual fund investing involves risk. Principal loss is possible.
The Alpine Ultra Short Municipal Income Fund is subject to risks, including the following:
Credit Risk – The credit quality and liquidity of the Fund’s investments in municipal obligations and other debt securities may be dependent in part on the credit quality of third parties, such as banks and other financial institutions, which provide credit and liquidity enhancements to the Fund’s investments. Adverse changes in the credit quality of these third parties could cause losses to the Fund and affect its share price. A change in the credit rating of a municipal bond insurer that insures securities in the Fund’s portfolio may affect the value of the securities it insures, the Fund’s share price and Fund performance. The Fund might also be adversely impacted by the inability of an insurer to meet its insurance obligations.
38
Alpine Ultra Short Municipal Income Fund /
Alpine High Yield Managed Duration Municipal Fund | |
Fixed Income Securities Risk – Fixed income securities are subject to issuer risk, interest rate risk and market risk.
Interest Rate Risk – Interest rates may rise resulting in a decrease in the value of the securities held by the Fund, or may fall resulting in an increase in the value of such securities. Securities having longer maturities generally involve a greater risk of fluctuations in the value resulting from changes in interest rates. Securities having shorter maturities generally involve less risk of fluctuation in value resulting from changes in interest rates, but generally have yields lower than securities having longer maturities. Securities having shorter maturities are also subject to reinvestment risk, which is the risk that if interest rates fall the Fund may need to invest the proceeds of redeemed securities in securities with lower interest rates.
Issuer Risk – Changes in the financial condition of the issuer of an obligation, changes in general economic conditions, or changes in economic conditions that affect the issuer may impact its actual or perceived willingness or ability to make timely payments of interest or principal.
Liquidity Risk – Some securities held by the Fund may be difficult to sell, or illiquid, particularly during times of market turmoil. Illiquid securities may also be difficult to value. Markets may become illiquid when, for instance, there are few, if any, interested buyers or sellers or when dealers are unwilling or unable to make a market for certain securities. If the Fund is forced to sell an illiquid asset to meet redemption requests or other cash needs, it may be forced to sell at a loss.
Management Risk – The Adviser’s judgment about the quality, relative yield or value of, or market trends affecting, a particular security or sector, or about interest rates generally, may be incorrect. The Adviser’s security selections and other investment decisions might produce losses or cause the Fund to underperform when compared to other funds with similar investment objectives and strategies.
Market Risk – General market conditions, such as real or perceived adverse economic or political conditions, inflation, changes in interest rates, lack of liquidity in the bond markets or adverse investor sentiment could cause the value of your investment in the fund, or its yield, to decline.
Municipal Securities Concentration Risk – From time to time the Fund may invest a substantial amount of its assets in municipal securities whose interest is paid solely from revenues of similar projects. If the Fund concentrates its investments in this manner, it assumes the economic risks relating to such projects and this may have a significant impact on the Fund’s investment performance.
Municipal Securities Risk – Municipal securities risks include the ability of the issuer to repay the obligation, the relative lack of information about certain issuers of municipal securities, and the possibility of future legislative changes which could affect the market for and value of municipal securities. Certain municipal securities, including private activity bonds, are not backed by the full faith, credit and taxing power of the issuer. Additionally, if events occur after the security is acquired that impact the security’s tax-exempt status, the Fund and its shareholders could be subject to substantial tax liabilities.
Portfolio Turnover Risk – High portfolio turnover necessarily results in greater transaction costs which may reduce Fund performance.
Puerto Rico and U.S. Territories Risk – Because the Fund invests in the municipal securities of U.S. territories, and currently invests in Puerto Rican municipal securities, events in Puerto Rico are likely to affect the Fund’s investments and its performance. These events may include economic or political policy changes, tax base erosion, territory constitutional limits on tax increases, budget deficits and other financial difficulties, and changes in the credit ratings assigned to Puerto Rico’s municipal issuers. As with Puerto Rican municipal securities, events in any of the other territories where the Fund is invested may affect the Fund’s investments and its performance.
Tax Risk – Changes in tax laws or adverse determinations by the Internal Revenue Service may make the income from some municipal obligations taxable. Additionally, maximizing after-tax income may require trade-offs that reduce pre-tax income. The Fund’s tax-efficient strategies may reduce the taxable income of the Fund’s shareholders, but will not eliminate it. There can be no assurance that taxable distributions can always be avoided or that the Fund will achieve its investment objective.
Variable Rate Demand Obligations Risk – Variable rate demand obligations are floating rate securities that combine an interest in a long term municipal bond with a right to demand payment before maturity from a bank or other financial institution. If the bank or financial institution is unable to pay, the Fund may lose money.
39
Alpine Ultra Short Municipal Income Fund /
Alpine High Yield Managed Duration Municipal Fund | |
Yield Risk – The amount of income received by the Fund will go up or down depending on day-to-day variations in short-term interest rates, and when interest rates are very low the Fund’s expenses could absorb all or a significant portion of the fund’s income. If interest rates increase, the Fund’s yield may not increase proportionately. For example, the Adviser may discontinue any temporary voluntary fee limitation or recoup amounts previously waived and/or reimbursed.
The Alpine High Yield Managed Duration Municipal Fund is subject to risks, including the following:
Borrowing and Leverage Risk – When the Fund borrows for leverage, changes in the value of the Fund’s investments will have a larger effect on its share price than if it did not borrow. Borrowing results in interest payments to the lenders and related expenses. The costs of borrowing for investment purposes might reduce the Fund’s return if the yield on the securities purchased is less than the borrowing costs.
Credit Risk – The credit quality and liquidity of the Fund’s investments in municipal obligations and other debt securities may be dependent in part on the credit quality of third parties, such as banks and other financial institutions, which provide credit and liquidity enhancements to the Fund’s investments. Adverse changes in the credit quality of these third parties could cause losses to the Fund and affect its share price. A change in the credit rating of a municipal bond insurer that insures securities in the Fund’s portfolio may affect the value of the securities it insures, the Fund’s share price and Fund performance. The Fund might also be adversely impacted by the inability of an insurer to meet its insurance obligations.
Debt Securities Risk – Debt securities, such as bonds, involve credit risk and interest rate risk. In general, the market price of debt securities with longer maturities will go up or down more in response to changes in interest rates than the market price of shorter term securities.
Fixed Income Securities Risk – Fixed income securities are subject to issuer risk, interest rate risk and market risk.
Interest Rate Risk – Interest rates may rise resulting in a decrease in the value of the securities held by the Fund, or may fall resulting in an increase in the value of such securities. Securities having longer maturities generally involve a greater risk of fluctuations in the value resulting from changes in interest rates. Securities having shorter maturities generally involve less risk of fluctuations in the value resulting from changes in interest rates, but generally have lower yields than securities having longer maturities. Securities having shorter maturities are also subject to reinvestment risk, which is the risk that if interest rates fall the Fund may need to invest the proceeds of redeemed securities in securities with lower interest rates.
Issuer Risk – Changes in the financial condition of the issuer of an obligation, changes in general economic conditions, or changes in economic conditions that affect the issuer may impact its actual or perceived willingness or ability to make timely payments of interest or principal.
Junk Bond Risk – Junk bonds involve a greater risk of default or price changes due to changes in the credit quality of the issuer. The values of junk bonds fluctuate more than those of high-quality bonds in response to company, political, regulatory or economic developments. Values of junk bonds can decline significantly over short periods of time.
Land-Secured or “Dirt” Bonds Risk – These special assessment or special tax bonds are issued to promote residential, commercial or industrial growth and redevelopment. They are exposed to real estate development-related risks. The bonds could default if the developments failed to progress as anticipated or if taxpayers failed to pay the assessments, fees and taxes specified in the financing plans for a project.
Liquidity Risk – Some securities held by the Fund may be difficult to sell, or illiquid, particularly during times of market turmoil. Illiquid securities may also be difficult to value. Markets may become illiquid when, for instance, there are few, if any, interested buyers or sellers or when dealers are unwilling or unable to make a market for certain securities. If the Fund is forced to sell an illiquid asset to meet redemption requests or other cash needs, the Fund may be forced to sell at a loss.
Management Risk – The Adviser’s judgment about the quality, relative yield or value of, or market trends affecting, a particular security or sector, or about interest rates generally, may be incorrect. The Adviser’s security selections and other investment decisions might produce losses or cause the Fund to underperform when compared to other funds with similar investment goals.
Market Risk – General market conditions, such as real or perceived adverse economic or political conditions, inflation, changes in interest rates, lack of liquidity in the bond markets or adverse investor sentiment could cause the value of your investment in the fund, or its yield, to decline.
40
Alpine Ultra Short Municipal Income Fund /
Alpine High Yield Managed Duration Municipal Fund | |
Medium- and Lower-Grade Municipal Securities Risk – Securities which are in the medium- and lower-grade categories generally offer higher yields than are offered by higher-grade securities of similar maturity, but they also generally involve more volatility and greater risks, such as greater credit risk, market risk, liquidity risk, management risk, and regulatory risk. Furthermore, many medium- and lower-grade securities are not listed for trading on any national securities exchange and many issuers of medium- and lower-grade securities choose not to have a rating assigned to their obligations by any nationally recognized statistical rating organization.
Municipal Market Volatility and Illiquidity Risk – The municipal bond market can be susceptible to unusual volatility, particularly for lower-rated and unrated securities. Liquidity can be reduced unpredictably in response to overall economic conditions or credit tightening. During times of reduced market liquidity, the Fund may not be able to readily sell bonds at the prices at which they are carried on the Fund’s books. If the Fund needed to sell large blocks of bonds to meet shareholder redemption requests or to raise cash, those sales could further reduce the bonds’ prices.
Municipal Sector Concentration Risk – From time to time the Fund may invest a substantial amount of its assets in municipal securities whose interest is paid solely from revenues of similar projects. If the Fund concentrates its investments in this manner, it assumes the economic risks relating to such projects and this may have a significant impact on the Fund’s investment performance.
Municipal Securities Risk – Municipal securities risks include the ability of the issuer to repay the obligation, the relative lack of information about certain issuers of municipal securities, and the possibility of future legislative changes which could affect the market for and value of municipal securities. Certain municipal securities, including private activity bonds, are not backed by the full faith, credit and taxing power of the issuer. Additionally, if events occur after the security is acquired that impact the security’s tax-exempt status, the Fund and its shareholders could be subject to substantial tax liabilities.
Puerto Rico and U.S. Territories Risk – Because the Fund invests in the municipal securities of U.S. territories, and currently invests in Puerto Rican municipal securities, events in Puerto Rico are likely to affect the Fund’s investments and its performance. These events may include economic or political policy changes, tax base erosion, territory constitutional limits on tax increases, budget deficits and other financial difficulties, and changes in the credit ratings assigned to Puerto Rico’s municipal issuers. As with Puerto Rican municipal securities, events in any of the other territories where the Fund is invested may affect the Fund’s investments and its performance.
Tax Risk – To be tax-exempt, municipal obligations generally must meet certain regulatory requirements. If any such municipal obligation fails to meet these regulatory requirements, the interest received by the Fund from its investment in such obligations and distributed to Fund shareholders will be taxable. There is no guarantee that all of the Fund’s income will remain exempt from federal or state income taxes. Income from municipal bonds held by a Fund could be declared taxable because of unfavorable changes in tax laws, adverse interpretations by the Internal Revenue Service or state tax authorities, or noncompliant conduct of a bond issuer.
Tender Option Bonds Risk – Tender option bonds are synthetic floating-rate or variable-rate securities issued when long-term bonds are purchased in the primary or secondary market and then deposited into a trust. Tender option bonds may be considered derivatives, and may expose the Fund to the same risks as investments in derivatives, as well as risks associated with leverage, especially the risk of increased volatility.
Tobacco Related Bonds Risk – In 1998, the largest U.S. tobacco manufacturers reached an out of court agreement, known as the Master Settlement Agreement (the “MSA”), to settle claims against them by 46 states and six other U.S. jurisdictions. The tobacco manufacturers agreed to make annual payments to the government entities in exchange for the release of all litigation claims. A number of the states have sold bonds that are backed by those future payments. The Fund may invest in two types of those bonds: (i) bonds that make payments only from a state’s interest in the MSA and (ii) bonds that make payments from both the MSA revenue and from an “appropriation pledge” by the state. An “appropriation pledge” requires the state to pass a specific periodic appropriation to make the payments and is generally not an unconditional guarantee of payment by a state. The settlement payments are based on factors, including, but not limited to, annual domestic cigarette shipments, cigarette consumption, inflation and the financial capability of participating tobacco companies. Payments could be reduced if consumption decreases, if market share is lost to non-MSA manufacturers, or if there is a negative outcome in litigation regarding the MSA.
Please refer to pages 3-5 for other important disclosures and definitions.
41
Alpine Dynamic Dividend Fund
Schedule of Portfolio Investments
October 31, 2015
| Shares | | | Security
Description | | Value | |
| | | | | | | |
| Common Stocks—95.3% | | | |
| Aerospace & Defense—0.7% | | | |
| | 10,900 | | | Raytheon Co. | | $ | 1,279,660 | |
| Air Freight & Logistics—1.7% | | | | |
| | 9,000 | | | FedEx Corp. | | | 1,404,450 | |
| | 259,105 | | | Royal Mail PLC | | | 1,778,689 | |
| | | | | | | | 3,183,139 | |
| Airlines—0.7% | | | | |
| | 36,000 | | | Japan Airlines Co., Ltd. | | | 1,366,371 | |
| Auto Components—2.0% | | | | |
| | 11,500 | | | Delphi Automotive PLC | | | 956,685 | |
| | 347,000 | | | GKN PLC | | | 1,536,333 | |
| | 25,000 | | | Magna International, Inc. | | | 1,318,250 | |
| | | | | | | | 3,811,268 | |
| Automobiles—1.0% | | | | |
| | 123,500 | | | Ford Motor Co. | | | 1,829,035 | |
| Banks —4.4% | | | | |
| | 99,065 | | | Banco Bilbao Vizcaya Argentaria SA | | | 854,067 | |
| | 86,000 | | | Bangkok Bank PCL—NVDR | | | 405,005 | |
| | 58,500 | | | Citizens Financial Group, Inc. | | | 1,421,550 | |
| | 35,000 | | | Hana Financial Group, Inc. | | | 853,471 | |
| | 86,000 | | | Mitsubishi UFJ Financial Group, Inc. | | | 563,451 | |
| | 146,000 | | | Regions Financial Corp. | | | 1,365,100 | |
| | 62,000 | | | Standard Chartered PLC | | | 689,508 | |
| | 10,000 | | | Sumitomo Mitsui Financial Group, Inc. | | | 402,751 | |
| | 28,800 | | | Wells Fargo & Co. | | | 1,559,232 | |
| | | | | | | | 8,114,135 | |
| Beverages—1.3% | | | | |
| | 20,000 | | | Anheuser-Busch InBev NV-SP ADR | | | 2,386,600 | |
| Biotechnology—0.3% | | | | |
| | 6,000 | | | Gilead Sciences, Inc. | | | 648,780 | |
| Capital Markets—3.3% | | | | |
| | 55,000 | | | Daiwa Securities Group, Inc. | | | 379,262 | |
| | 157,000 | | | Fortress Investment Group LLC— Class A | | | 880,770 | |
| | 21,000 | | | Lazard, Ltd.—Class A | | | 972,720 | |
| | 81,853 | | | Mediobanca SpA | | | 823,588 | |
| | 91,756 | | | Och-Ziff Capital Management Group LLC—Class A | | | 642,292 | |
| | 85,000 | | | OM Asset Management PLC | | | 1,290,300 | |
| | 25,000 | | | Schroders PLC | | | 1,149,648 | |
| | | | | | | | 6,138,580 | |
| Chemicals—1.8% | | | | |
| | 117,000 | | | Clariant AG (a) | | | 2,154,282 | |
| | 19,000 | | | Symrise AG | | | 1,251,512 | |
| | | | | | | | 3,405,794 | |
| Commercial Services & Supplies—1.8% | | | | |
| | 27,200 | | | ISS A/S | | | 957,285 | |
| | 25,000 | | | KAR Auction Services, Inc. | | | 960,000 | |
| | 83,000 | | | RR Donnelley & Sons Co. | | | 1,400,210 | |
| | | | | | | | 3,317,495 | |
| Communications Equipment—2.2% | | | | |
| | 53,000 | | | Cisco Systems, Inc. | | | 1,529,050 | |
| | 12,500 | | | Harris Corp. | | | 989,125 | |
| | 204,000 | | | Nokia OYJ | | | 1,518,705 | |
| | | | | | | | 4,036,880 | |
| Shares | | | Security
Description | | Value | |
| | | | | | | |
| Common Stocks—continued | | | |
| Construction & Engineering—1.7% | | | | |
| | 789,000 | | | China Railway Construction Corp., Ltd.—Class H | | $ | 1,186,971 | |
| | 29,000 | | | Vinci SA | | | 1,957,400 | |
| | | | | | | | 3,144,371 | |
| Consumer Finance—1.1% | | | | |
| | 35,500 | | | Discover Financial Services | | | 1,995,810 | |
| Containers & Packaging—0.8% | | | | |
| | 76,000 | | | DS Smith PLC | | | 453,415 | |
| | 14,000 | | | Packaging Corp. of America | | | 958,300 | |
| | | | | | | | 1,411,715 | |
| Diversified Financial Services—1.7% | | | | |
| | 58,000 | | | Bank of America Corp. | | | 973,240 | |
| | 98,280 | | | Cerved Information Solutions SpA | | | 745,708 | |
| | 27,000 | | | Citigroup, Inc. | | | 1,435,590 | |
| | | | | | | | 3,154,538 | |
| Diversified Telecommunication Services—1.2% | | | | |
| | 31,500 | | | BT Group PLC—SP ADR | | | 2,257,605 | |
| Electric Utilities—1.0% | | | | |
| | 37,000 | | | Eversource Energy | | | 1,884,780 | |
| Electronic Equipment, Instruments & Components—1.0% | | | | |
| | 29,000 | | | TE Connectivity, Ltd. | | | 1,868,760 | |
| Food & Staples Retailing—1.4% | | | | |
| | 25,500 | | | CVS Health Corp. | | | 2,518,890 | |
| Food Products—3.8% | | | | |
| | 46,000 | | | Mondelez International, Inc.— Class A | | | 2,123,360 | |
| | 23,500 | | | Nestle SA | | | 1,797,359 | |
| | 47,500 | | | Nomad Foods, Ltd. (a) | | | 693,500 | |
| | 36,300 | | | Pinnacle Foods, Inc. | | | 1,600,104 | |
| | 12,000 | | | The Kraft Heinz Co. | | | 935,640 | |
| | | | | | | | 7,149,963 | |
| Health Care Equipment & Supplies—1.8% | | | | |
| | 30,700 | | | Medtronic PLC | | | 2,269,344 | |
| | 9,500 | | | Zimmer Biomet Holdings, Inc. | | | 993,415 | |
| | | | | | | | 3,262,759 | |
| Health Care Providers & Services—3.5% | | | | |
| | 6,500 | | | Anthem, Inc. | | | 904,475 | |
| | 6,000 | | | HCA Holdings, Inc. (a) | | | 412,740 | |
| | 7,100 | | | Humana, Inc. | | | 1,268,273 | |
| | 11,400 | | | McKesson Corp. | | | 2,038,320 | |
| | 8,700 | | | UnitedHealth Group, Inc. | | | 1,024,686 | |
| | 7,800 | | | Universal Health Services, Inc.—Class B | | | 952,302 | |
| | | | | | | | 6,600,796 | |
| Hotels, Restaurants & Leisure—2.0% | | | | |
| | 21,500 | | | Carnival Corp. | | | 1,162,720 | |
| | 11,500 | | | McDonald’s Corp. | | | 1,290,875 | |
| | 12,500 | | | Royal Caribbean Cruises, Ltd. | | | 1,229,375 | |
| | | | | | | | 3,682,970 | |
| Household Durables—1.3% | | | | |
| | 22,420 | | | CalAtlantic Group, Inc. (a) | | | 853,978 | |
| | 31,000 | | | Lennar Corp.—Class A | | | 1,552,170 | |
| | | | | | | | 2,406,148 | |
The accompanying notes are an integral part of these financial statements.
42
Alpine Dynamic Dividend Fund
Schedule of Portfolio Investments—Continued
October 31, 2015
| Shares | | | Security
Description | | Value | |
| | | | | | | |
| Common Stocks—continued | | | |
| Household Products—1.8% | | | | |
| | 15,500 | | | Colgate-Palmolive Co. | | $ | 1,028,425 | |
| | 21,500 | | | Energizer Holdings, Inc. | | | 920,845 | |
| | 50,500 | | | Svenska Cellulosa AB SCA—B Shares | | | 1,489,545 | |
| | | | | | | | 3,438,815 | |
| Independent Power and Renewables—1.6% | | | | |
| | 45,619 | | | Abengoa Yield PLC | | | 845,320 | |
| | 75,500 | | | NRG Yield, Inc.-Class A | | | 1,036,615 | |
| | 50,711 | | | Pattern Energy Group, Inc. | | | 1,186,130 | |
| | | | | | | | 3,068,065 | |
| Industrial Conglomerates—0.4% | | | | |
| | 58,000 | | | CK Hutchison Holdings, Ltd. | | | 799,964 | |
| Insurance—2.5% | | | | |
| | 8,700 | | | Allianz SE | | | 1,524,495 | |
| | 27,612 | | | Endurance Specialty Holdings, Ltd. | | | 1,743,145 | |
| | 18,462 | | | Japan Post Holdings Co., Ltd. (a) | | | 214,194 | |
| | 3,795 | | | Japan Post Insurance Co., Ltd. (a) | | | 69,189 | |
| | 20,000 | | | WR Berkley Corp. | | | 1,116,600 | |
| | | | | | | | 4,667,623 | |
| IT Services—2.3% | | | | |
| | 21,000 | | | Accenture PLC—Class A | | | 2,251,200 | |
| | 29,500 | | | Computer Sciences Corp. | | | 1,964,405 | |
| | | | | | | | 4,215,605 | |
| Life Sciences Tools & Services—1.1% | | | | |
| | 16,000 | | | Thermo Fisher Scientific, Inc. | | | 2,092,480 | |
| Machinery—2.2% | | | | |
| | 791,450 | | | CRRC Corp., Ltd.—Class H | | | 1,015,020 | |
| | 18,000 | | | Snap-on, Inc. | | | 2,986,020 | |
| | | | | | | | 4,001,040 | |
| Media —3.5% | | | | |
| | 26,500 | | | CBS Corp.—Class B | | | 1,232,780 | |
| | 19,500 | | | Comcast Corp.—Class A | | | 1,221,090 | |
| | 300,000 | | | ITV PLC | | | 1,167,299 | |
| | 9,300 | | | The Walt Disney Co. | | | 1,057,782 | |
| | 12,000 | | | Time Warner, Inc. | | | 904,080 | |
| | 45,500 | | | WPP PLC | | | 1,022,682 | |
| | | | | | | | 6,605,713 | |
| Multi-Utilities—1.1% | | | | |
| | 54,500 | | | CMS Energy Corp. | | | 1,965,815 | |
| Multiline Retail—2.1% | | | | |
| | 34,500 | | | Dollar General Corp. | | | 2,338,065 | |
| | 189,500 | | | Marks & Spencer Group PLC | | | 1,498,643 | |
| | | | | | | | 3,836,708 | |
| Oil, Gas & Consumable Fuels—6.7% | | | | |
| | 47,500 | | | BP PLC-SP ADR | | | 1,695,750 | |
| | 11,000 | | | Chevron Corp. | | | 999,680 | |
| | 51,500 | | | Enbridge, Inc. | | | 2,198,535 | |
| | 11,300 | | | EOG Resources, Inc. | | | 970,105 | |
| | 11,500 | | | Exxon Mobil Corp. | | | 951,510 | |
| | 24,000 | | | Marathon Petroleum Corp. | | | 1,243,200 | |
| | 12,500 | | | Occidental Petroleum Corp. | | | 931,750 | |
| | 21,000 | | | Phillips 66 | | | 1,870,050 | |
| | 41,643 | | | The Williams Cos., Inc. | | | 1,642,400 | |
| | | | | | | | 12,502,980 | |
| Shares | | | Security
Description | | Value | |
| | | | | | | |
| Common Stocks—continued | | | |
| Pharmaceuticals—4.8% | | | | |
| | 28,500 | | | AstraZeneca PLC-SP ADR | | $ | 908,865 | |
| | 8,000 | | | Bayer AG | | | 1,067,540 | |
| | 8,500 | | | Merck & Co., Inc. | | | 464,610 | |
| | 21,500 | | | Mylan NV (a) | | | 947,935 | |
| | 23,800 | | | Novartis AG-SP ADR | | | 2,152,234 | |
| | 13,500 | | | Pfizer, Inc. | | | 456,570 | |
| | 3,500 | | | Roche Holding AG | | | 950,023 | |
| | 32,300 | | | Teva Pharmaceutical Industries, Ltd.—SP ADR | | | 1,911,837 | |
| | | | | | | | 8,859,614 | |
| Real Estate Investment Trusts—4.8% | | |
| | 21,794 | | | American Tower Corp. | | | 2,228,000 | |
| | 140 | | | Nippon Building Fund, Inc. | | | 667,109 | |
| | 155,000 | | | NorthStar Realty Finance Corp. | | | 1,861,550 | |
| | 646,000 | | | Prologis Property Mexico SA de CV | | | 1,074,724 | |
| | 141,000 | | | Scentre Group | | | 416,265 | |
| | 55,500 | | | The Geo Group, Inc. | | | 1,790,985 | |
| | 113,000 | | | Westfield Corp. | | | 825,948 | |
| | | | | | | | 8,864,581 | |
| Real Estate Management & Development—1.0% | | | | |
| | 65,000 | | | Mitsui Fudosan Co., Ltd. | | | 1,782,962 | |
| Road & Rail—2.6% | | | | |
| | 13,500 | | | Canadian Pacific Railway, Ltd. | | | 1,896,750 | |
| | 20,000 | | | Kansas City Southern | | | 1,655,200 | |
| | 159,225 | | | Rumo Logistica Operadora Multimodal SA (a) | | | 303,046 | |
| | 12,500 | | | Ryder System, Inc. | | | 897,250 | |
| | | | | | | | 4,752,246 | |
| Semiconductors & Semiconductor Equipment—2.8% | | | | |
| | 71,000 | | | Applied Materials, Inc. | | | 1,190,670 | |
| | 18,000 | | | Avago Technologies, Ltd. | | | 2,216,340 | |
| | 32,500 | | | Intel Corp. | | | 1,100,450 | |
| | 27,000 | | | SK Hynix, Inc. | | | 727,073 | |
| | | | | | | | 5,234,533 | |
| Specialty Retail—1.6% | | | | |
| | 210,000 | | | Pets at Home Group PLC | | | 933,978 | |
| | 69,426 | | | Stein Mart, Inc. | | | 615,114 | |
| | 20,500 | | | TJX Cos., Inc. | | | 1,500,395 | |
| | | | | | | | 3,049,487 | |
| Technology, Hardware, Storage & Peripherals—4.5% | | | | |
| | 27,500 | | | Apple, Inc. | | | 3,286,250 | |
| | 100,500 | | | EMC Corp. | | | 2,635,110 | |
| | 1,400 | | | Samsung Electronics Co., Ltd. | | | 1,684,838 | |
| | 12,000 | | | Western Digital Corp. | | | 801,840 | |
| | | | | | | | 8,408,038 | |
| Textiles, Apparel & Luxury Goods—1.3% | | | | |
| | 10,300 | | | Carter’s, Inc. | | | 936,064 | |
| | 22,000 | | | VF Corp. | | | 1,485,440 | |
| | | | | | | | 2,421,504 | |
| Trading Companies & Distributors—0.5% | | | | |
| | 61,500 | | | Ashtead Group PLC | | | 948,084 | |
| Transportation Infrastructure—0.8% | | | | |
| | 345,300 | | | Adani Ports & Special Economic Zone, Ltd. | | | 1,561,499 | |
| Water Utilities—0.6% | | | | |
| | 19,400 | | | American Water Works Co., Inc. | | | 1,112,784 | |
The accompanying notes are an integral part of these financial statements.
43
Alpine Dynamic Dividend Fund
Schedule of Portfolio Investments—Continued
October 31, 2015
| Shares | | | Security
Description | | Value | |
| | | | | | | |
| Common Stocks—continued | | | |
| Wireless Telecommunication Services—1.2% | | | |
| | 68,000 | | | Vodafone Group PLC—SP ADR | | $ | 2,241,960 | |
| | | | | Total Common Stocks
(Cost $166,029,419) | | | 177,288,942 | |
| Equity-Linked Structured Notes—1.1% | | | | |
| Multi-Utilities—1.1% | | | | |
| | 91,000 | | | Veolia Environnement SA—Morgan Stanley BV | | | 2,118,944 | |
| | | | | Total Equity-Linked Structured Notes
(Cost $1,934,687) | | | 2,118,944 | |
Principal
Amount | | | Security
Description | | Value | |
| | | | | | | |
| Convertible Bonds—0.0% (b) | | | |
| Household Durables—0.0% (b) | | | |
| $ | 791,393 | | | PDG Realty SA Empreendimentos e Participacoes—Series 8, 0.000%, 9/19/16 (Brazilian Real) (c)(d) | | $ | 2,052 | |
| | | | | Total Convertible Bonds
(Cost $283,909) | | | 2,052 | |
| Short -Term Investments—3.4% | | | | |
| | 6,323,000 | | | State Street Eurodollar Time Deposit, 0.01% | | | 6,323,000 | |
| | | | | Total Short-Term Investments
(Cost $6,323,000) | | | 6,323,000 | |
Total Investments
(Cost $174,571,015) (e)—99.8% | | | 185,732,938 | |
| Other Assets in Excess of Liabilities—0.2% | | | 316,203 | |
| TOTAL NET ASSETS 100.0% | | $ | 186,049,141 | |
Percentages are stated as a percent of net assets.
| (a) | Non-income producing security. |
| (b) | Amount is less than 0.05%. |
| (c) | Represents a zero-coupon bond. |
| (d) | Security fair valued in accordance with procedures approved by the Board of Trustees. These securities comprised 0.0% of the Fund’s net assets. |
| (e) | See Note 7 for the cost of investments for federal tax purposes. |
AG—Aktiengesellschaft is a German term that refers to a corporation that is limited by shares, i.e., owned by shareholders.
A/S—Aktieselskab is the Danish term for a stock-based corporation.
BV—Besloten Vennootschap is the Dutch equivalent of a private limited liability company.
NV—Naamloze Vennootschap is the Dutch term for a public limited liability corporation.
NVDR—Non-Voting Depositary Receipts
PCL—Public Company Limited
PLC—Public Limited Company
SA—Generally designates corporations in various countries, mostly those employing the civil law.
SA de CV—Sociedad Anonima de Capital Variable is the Spanish equivalent to Variable Capital Company.
SE—SE Regulation. A European Company which can operate on a Europe-wide basis and be governed by Community law directly applicable in all Member States.
SP ADR—Sponsored American Depositary Receipt
SpA—Societa’ Per Azioni is an Italian shared company.
The accompanying notes are an integral part of these financial statements.
44
Alpine Rising Dividend Fund
Schedule of Portfolio Investments
October 31, 2015
| Shares | | | Security
Description | | Value | |
| | | | | | | |
| Common Stocks—96.5% | | | | |
| Aerospace & Defense—3.8% | | | | |
| | 3,000 | | | Precision Castparts Corp. | | $ | 692,430 | |
| | 18,000 | | | Raytheon Co. | | | 2,113,200 | |
| | 7,000 | | | United Technologies Corp. | | | 688,870 | |
| | | | | | | | 3,494,500 | |
| Air Freight & Logistics—1.0% | | | | |
| | 6,000 | | | FedEx Corp. | | | 936,300 | |
| Auto Components—0.5% | | | | |
| | 9,000 | | | Magna International, Inc. | | | 474,570 | |
| Automobiles—1.5% | | | | |
| | 95,000 | | | Ford Motor Co. | | | 1,406,950 | |
| Banks —2.8% | | | | |
| | 30,000 | | | Citizens Financial Group, Inc. | | | 729,000 | |
| | 25,000 | | | Regions Financial Corp. | | | 233,750 | |
| | 5,000 | | | Signature Bank (a) | | | 744,600 | |
| | 6,500 | | | The PNC Financial Services Group, Inc. | | | 586,690 | |
| | 8,000 | | | Washington Trust Bancorp, Inc. | | | 310,400 | |
| | | | | | | | 2,604,440 | |
| Beverages—0.6% | | | | |
| | 5,000 | | | PepsiCo, Inc. | | | 510,950 | |
| Biotechnology—2.6% | | | | |
| | 7,200 | | | Amgen, Inc. | | | 1,138,896 | |
| | 11,500 | | | Gilead Sciences, Inc. | | | 1,243,495 | |
| | | | | | | | 2,382,391 | |
| Capital Markets—2.0% | | | | |
| | 6,000 | | | Ameriprise Financial, Inc. | | | 692,160 | |
| | 1,700 | | | Lazard, Ltd.—Class A | | | 78,744 | |
| | 18,000 | | | Oaktree Capital Group LLC | | | 897,480 | |
| | 7,000 | | | Och-Ziff Capital Management Group LLC—Class A | | | 49,000 | |
| | 6,500 | | | OM Asset Management PLC | | | 98,670 | |
| | | | | | | | 1,816,054 | |
| Chemicals—4.6% | | | | |
| | 2,000 | | | Air Products & Chemicals, Inc. | | | 277,960 | |
| | 18,000 | | | E.I. du Pont de Nemours & Co. | | | 1,141,200 | |
| | 16,000 | | | Eastman Chemical Co. | | | 1,154,720 | |
| | 5,000 | | | International Flavors & Fragrances, Inc. | | | 580,300 | |
| | 10,700 | | | PPG Industries, Inc. | | | 1,115,582 | |
| | | | | | | | 4,269,762 | |
| Commercial Services & Supplies—1.5% | | | | |
| | 23,500 | | | Deluxe Corp. | | | 1,399,425 | |
| Communications Equipment—1.1% | | | | |
| | 3,400 | | | Cisco Systems, Inc. | | | 98,090 | |
| | 25,500 | | | Juniper Networks, Inc. | | | 800,445 | |
| | 14,000 | | | Nokia OYJ-SP ADR | | | 103,880 | |
| | | | | | | | 1,002,415 | |
| Consumer Finance—1.6% | | | | |
| | 27,000 | | | Discover Financial Services | | | 1,517,940 | |
| Diversified Financial Services—4.5% | | | | |
| | 22,500 | | | Citigroup, Inc. | | | 1,196,325 | |
| | 8,500 | | | CME Group, Inc. | | | 802,995 | |
| | 33,500 | | | JPMorgan Chase & Co. | | | 2,152,375 | |
| | | | | | | | 4,151,695 | |
| Diversified Telecommunication Services—3.4% | | | | |
| | 45,000 | | | AT&T, Inc. | | | 1,507,950 | |
| | 34,200 | | | Verizon Communications, Inc. | | | 1,603,296 | |
| | | | | | | | 3,111,246 | |
| Shares | | | Security
Description | | Value | |
| | | | | | | |
| Common Stocks—continued | | | | |
| Electric Utilities—1.0% | | | | |
| | 11,000 | | | American Electric Power Co., Inc. | | $ | 623,150 | |
| | 4,000 | | | Pinnacle West Capital Corp. | | | 254,040 | |
| | | | | | | | 877,190 | |
| Electronic Equipment, Instruments & Components—0.9% | | | | |
| | 13,600 | | | TE Connectivity, Ltd. | | | 876,384 | |
| Energy Equipment & Services—1.6% | | | | |
| | 19,000 | | | Bristow Group, Inc. | | | 659,870 | |
| | 10,000 | | | Schlumberger, Ltd. | | | 781,600 | |
| | | | | | | | 1,441,470 | |
| Food & Staples Retailing—3.2% | | | | |
| | 16,700 | | | CVS Health Corp. | | | 1,649,626 | |
| | 50,000 | | | Safeway, Inc. (a)(b)(c) | | | 23,933 | |
| | 15,700 | | | Walgreens Boots Alliance, Inc. | | | 1,329,476 | |
| | | | | | | | 3,003,035 | |
| Food Products—1.0% | | | | |
| | 21,000 | | | Pinnacle Foods, Inc. | | | 925,680 | |
| Gas Utilities—0.0% (d) | | | | |
| | 600 | | | Atmos Energy Corp. | | | 37,800 | |
| Health Care Equipment & Supplies—4.3% | | | | |
| | 21,000 | | | Abbott Laboratories | | | 940,800 | |
| | 9,600 | | | Becton, Dickinson & Co. | | | 1,368,192 | |
| | 16,000 | | | Zimmer Biomet Holdings, Inc. | | | 1,673,120 | |
| | | | | | | | 3,982,112 | |
| Health Care Providers & Services—3.2% | | | | |
| | 9,900 | | | Aetna, Inc. | | | 1,136,322 | |
| | 900 | | | AmerisourceBergen Corp. | | | 86,859 | |
| | 9,000 | | | Cardinal Health, Inc. | | | 739,800 | |
| | 5,600 | | | McKesson Corp. | | | 1,001,280 | |
| | | | | | | | 2,964,261 | |
| Hotels, Restaurants & Leisure—0.9% | | | | |
| | 7,000 | | | McDonald’s Corp. | | | 785,750 | |
| Household Products—1.3% | | | | |
| | 15,700 | | | The Procter & Gamble Co. | | | 1,199,166 | |
| Industrial Conglomerates—0.8% | | | | |
| | 24,000 | | | General Electric Co. | | | 694,080 | |
| Insurance—4.9% | | | | |
| | 23,000 | | | MetLife, Inc. | | | 1,158,740 | |
| | 21,300 | | | Prudential Financial, Inc. | | | 1,757,250 | |
| | 34,000 | | | The Hartford Financial Services Group, Inc. | | | 1,572,840 | |
| | | | | | | | 4,488,830 | |
| Internet & Catalog Retail—0.9% | | | | |
| | 14,100 | | | HSN, Inc. | | | 872,085 | |
| Internet Software & Services—0.9% | | | | |
| | 600 | | | Alphabet, Inc.—Class A (a) | | | 442,434 | |
| | 600 | | | Alphabet, Inc.—Class C (a) | | | 426,486 | |
| | | | | | | | 868,920 | |
| IT Services—3.1% | | | | |
| | 9,100 | | | Accenture PLC—Class A | | | 975,520 | |
| | 14,000 | | | Computer Sciences Corp. | | | 932,260 | |
| | 6,600 | | | International Business Machines Corp. | | | 924,528 | |
| | | | | | | | 2,832,308 | |
| Life Sciences Tools & Services—0.1% | | | | |
| | 2,600 | | | Agilent Technologies, Inc. | | | 98,176 | |
The accompanying notes are an integral part of these financial statements.
45
Alpine Rising Dividend Fund
Schedule of Portfolio Investments—Continued
October 31, 2015
| | | | Security | | | |
| Shares | | | Description | | Value | |
| | | | | | | | |
| Common Stocks—continued | | | | |
| Machinery—1.1% | | | | |
| | 12,000 | | | Ingersoll-Rand PLC | | $ | 711,120 | |
| | 2,000 | | | Snap-on, Inc. | | | 331,780 | |
| | | | | | | | 1,042,900 | |
| Media —5.0% | | | | |
| | 35,100 | | | CBS Corp.—Class B | | | 1,632,852 | |
| | 34,000 | | | Cinemark Holdings, Inc. | | | 1,204,960 | |
| | 22,300 | | | Comcast Corp.—Class A | | | 1,396,426 | |
| | 5,000 | | | Time Warner, Inc. | | | 376,700 | |
| | | | | | | | 4,610,938 | |
| Multi-Utilities—2.0% | | | | |
| | 6,500 | | | CMS Energy Corp. | | | 234,455 | |
| | 16,000 | | | WEC Energy Group, Inc. | | | 824,960 | |
| | 23,200 | | | Xcel Energy, Inc. | | | 826,616 | |
| | | | | | | | 1,886,031 | |
| Oil, Gas & Consumable Fuels—4.0% | | | | |
| | 14,100 | | | Enbridge, Inc. | | | 601,929 | |
| | 18,000 | | | Exxon Mobil Corp. | | | 1,489,320 | |
| | 28,000 | | | Kinder Morgan, Inc. | | | 765,800 | |
| | 10,900 | | | Occidental Petroleum Corp. | | | 812,486 | |
| | | | | | | | 3,669,535 | |
| Pharmaceuticals—6.4% | | | | |
| | 27,700 | | | Johnson & Johnson | | | 2,798,531 | |
| | 57,700 | | | Pfizer, Inc. | | | 1,951,414 | |
| | 20,100 | | | Teva Pharmaceutical Industries, Ltd.—SP ADR | | | 1,189,719 | |
| | | | | | | | 5,939,664 | |
| Real Estate Investment Trusts—2.1% | | | | |
| | 3,000 | | | Boston Properties, Inc. | | | 377,550 | |
| | 50,000 | | | NorthStar Realty Finance Corp. | | | 600,500 | |
| | 4,500 | | | Simon Property Group, Inc. | | | 906,570 | |
| | 4,000 | | | Starwood Waypoint Residential Trust | | | 98,400 | |
| | | | | | | | 1,983,020 | |
| Road & Rail—2.2% | | | | |
| | 2,700 | | | AMERCO | | | 1,097,037 | |
| | 34,000 | | | CSX Corp. | | | 917,660 | |
| | | | | | | | 2,014,697 | |
| Semiconductors & Semiconductor Equipment—3.3% | | | | |
| | 58,500 | | | Applied Materials, Inc. | | | 981,045 | |
| | 6,000 | | | Avago Technologies, Ltd. | | | 738,780 | |
| | 39,000 | | | Intel Corp. | | | 1,320,540 | |
| | | | | | | | 3,040,365 | |
| | | | Security | | | |
| Shares | | | Description | | Value | |
| | | | | | | | |
| Common Stocks—continued | | | | |
| Software—1.4% | | | | |
| | 13,000 | | | Oracle Corp. | | $ | 504,920 | |
| | 36,500 | | | Symantec Corp. | | | 751,900 | |
| | | | | | | | 1,256,820 | |
| Specialty Retail—1.7% | | | | |
| | 6,000 | | | Lowe’s Cos., Inc. | | | 442,980 | |
| | 16,000 | | | TJX Cos., Inc. | | | 1,171,040 | |
| | | | | | | | 1,614,020 | |
| Technology, Hardware, Storage & Peripherals—6.4% | | | | |
| | 29,500 | | | Apple, Inc. | | | 3,525,250 | |
| | 57,000 | | | EMC Corp. | | | 1,494,540 | |
| | 14,000 | | | Western Digital Corp. | | | 935,480 | |
| | | | | | | | 5,955,270 | |
| Textiles, Apparel & Luxury Goods—1.3% | | | | |
| | 17,900 | | | VF Corp. | | | 1,208,608 | |
| | | | | Total Common Stocks
(Cost $76,112,618) | | | 89,247,753 | |
| | | | | | | | | |
| Contract | | | | | | | |
| Amount | | | | | | | |
| Put Options Purchased—0.0% (d) | | | | |
| Pharmaceuticals—0.0% (d) | | | | |
| | 24,000 | | | Johnson & Johnson, Expiration Date 12/18/2015, Strike Price $90.00 | | | 5,160 | |
| | | | | Total Put Options Purchased
(Cost $53,561) | | | 5,160 | |
| | | | | | | | | |
| Principal | | | | | | | |
| Amount | | | | | | | |
| Short -Term Investments—1.8% | | | | |
| $ | 1,668,000 | | | State Street Eurodollar Time Deposit, 0.01% | | | 1,668,000 | |
| | | | | Total Short-Term Investments
(Cost $1,668,000) | | | 1,668,000 | |
Total Investments
(Cost $77,834,179) (e)—98.3% | | | 90,920,913 | |
| Other Assets in Excess of Liabilities—1.7% | | | 1,562,804 | |
| TOTAL NET ASSETS 100.0% | | $ | 92,483,717 | |
Percentages are stated as a percent of net assets.
| (a) | Non-income producing security. |
| (b) | Illiquid security. |
| (c) | Security fair valued in accordance with procedures approved by the Board of Trustees. These securities comprised 0.0% of the Fund’s net assets. |
| (d) | Amount is less than 0.05%. |
| (e) | See Note 7 for the cost of investments for federal tax purposes. |
ADR—American Depositary Receipt
OYJ—Osakeyhtio is the Finnish equivalent of a limited company.
PLC—Public Limited Company
SP ADR—Sponsored American Depositary Receipt
The accompanying notes are an integral part of these financial statements.
46
Alpine Financial Services Fund
Schedule of Portfolio Investments
October 31, 2015
| | | | Security | | | |
| Shares | | | Description | | Value | |
| | | | | | | | |
| Common Stocks—94.0% | | | | |
| Banks —42.4% | | | | |
| | 4,357 | | | 1st Constitution Bancorp (a) | | $ | 52,676 | |
| | 50,000 | | | Akbank TAS | | | 128,456 | |
| | 15,895 | | | Banc of California, Inc. | | | 207,271 | |
| | 2,472 | | | Banco ABC Brasil SA (a) | | | 5,304 | |
| | 451 | | | Banco Bilbao Vizcaya Argentaria SA | | | 3,887 | |
| | 42,381 | | | Bank of Commerce Holdings | | | 264,457 | |
| | 5,000 | | | Bank of Georgia Holdings PLC | | | 154,160 | |
| | 21,900 | | | Bankwell Financial Group, Inc. (a) | | | 423,546 | |
| | 7,244 | | | BNC Bancorp | | | 162,628 | |
| | 6,500 | | | Bryn Mawr Bank Corp. | | | 189,345 | |
| | 92,273 | | | Carolina Trust Bank (a) | | | 530,570 | |
| | 12,493 | | | CenterState Banks, Inc. | | | 182,148 | |
| | 6,000 | | | CIT Group, Inc. | | | 258,000 | |
| | 13,000 | | | Citizens Financial Group, Inc. | | | 315,900 | |
| | 16,434 | | | Citizens First Corp. | | | 230,076 | |
| | 6,095 | | | Comerica, Inc. | | | 264,523 | |
| | 8,333 | | | County Commerce Bank (a) | | | 136,119 | |
| | 13,000 | | | CU Bancorp (a) | | | 313,560 | |
| | 9,619 | | | FCB Financial Holdings, Inc.—Class A (a) | | | 342,052 | |
| | 40,000 | | | First BanCorp (a) | | | 151,600 | |
| | 9,898 | | | First Business Financial Services, Inc. | | | 243,986 | |
| | 11,000 | | | First Internet Bancorp | | | 338,030 | |
| | 5,000 | | | Great Western Bancorp, Inc. | | | 141,300 | |
| | 10,000 | | | Green Bancorp, Inc. (a) | | | 122,500 | |
| | 25,000 | | | Grupo Aval Acciones y Valores SA—ADR | | | 200,250 | |
| | 36,718 | | | Investar Holding Corp. | | | 579,777 | |
| | 5,500 | | | JPMorgan Chase & Co. | | | 353,375 | |
| | 5,000 | | | Metro Bancorp, Inc. | | | 154,900 | |
| | 60,000 | | | Mitsubishi UFJ Financial Group, Inc. | | | 393,105 | |
| | 150,000 | | | Mizuho Financial Group, Inc. | | | 311,138 | |
| | 10,000 | | | OFG Bancorp | | | 92,100 | |
| | 12,602 | | | Pacific Mercantile Bancorp (a) | | | 85,442 | |
| | 18,276 | | | Pacific Premier Bancorp, Inc. (a) | | | 390,193 | |
| | 779 | | | PacWest Bancorp | | | 35,086 | |
| | 2,900 | | | People’s Utah Bancorp | | | 47,734 | |
| | 3,388 | | | Plaza Bancorp (a) | | | 13,044 | |
| | 7,000 | | | Popular, Inc. | | | 206,990 | |
| | 1,500 | | | Prosperity Bancshares, Inc. | | | 77,070 | |
| | 33,000 | | | Regions Financial Corp. | | | 308,550 | |
| | 73,000 | | | Republic First Bancorp, Inc. (a) | | | 283,970 | |
| | 5,000 | | | SB Financial Group, Inc. | | | 52,850 | |
| | 28,000 | | | Shore Bancshares, Inc. | | | 277,480 | |
| | 1,543 | | | Southeastern Bank Financial Corp. | | | 50,842 | |
| | 25,000 | | | Southern National Bancorp of Virginia, Inc. | | | 285,000 | |
| | 3,745 | | | Southside Bancshares, Inc. | | | 100,740 | |
| | 5,000 | | | Sterling Bancorp | | | 76,950 | |
| | 2,000 | | | Stonegate Bank | | | 62,420 | |
| | 8,000 | | | Sumitomo Mitsui Financial Group, Inc. | | | 322,201 | |
| | 8,000 | | | Summit State Bank | | | 109,840 | |
| | 4,335 | | | Synovus Financial Corp. | | | 137,116 | |
| | 8,370 | | | TBC Bank JSC—GDR (b) | | | 69,220 | |
| | 46,248 | | | Valley National Bancorp | | | 485,604 | |
| | | | | | | | 10,725,081 | |
| | | | Security | | | |
| Shares | | | Description | | Value | |
| | | | | | | | |
| Common Stocks—continued | | | | |
| Capital Markets—20.7% | | | | |
| | 20,000 | | | American Capital, Ltd. (a) | | $ | 255,800 | |
| | 2,000 | | | Ameriprise Financial, Inc. | | | 230,720 | |
| | 12,500 | | | Apollo Global Management LLC—Class A | | | 228,375 | |
| | 28,799 | | | Ares Management LP | | | 466,256 | |
| | 25,000 | | | BGC Partners, Inc.—Class A | | | 216,250 | |
| | 23,823 | | | Cowen Group, Inc.—Class A (a) | | | 100,295 | |
| | 26,937 | | | Fifth Street Asset Management, Inc. | | | 157,851 | |
| | 2,000 | | | Hennessy Advisors, Inc. | | | 55,800 | |
| | 14,000 | | | Intertrust NV (a)(b) | | | 276,650 | |
| | 7,500 | | | Invesco, Ltd. | | | 248,775 | |
| | 17,900 | | | KKR & Co. LP | | | 306,985 | |
| | 5,500 | | | Lazard, Ltd.—Class A | | | 254,760 | |
| | 4,869 | | | LPL Financial Holdings, Inc. | | | 207,419 | |
| | 8,654 | | | Moelis & Co.—Class A | | | 255,120 | |
| | 8,000 | | | Morgan Stanley | | | 263,760 | |
| | 8,200 | | | Och-Ziff Capital Management Group LLC—Class A | | | 57,400 | |
| | 16,500 | | | OM Asset Management PLC | | | 250,470 | |
| | 5,000 | | | Piper Jaffray Cos. (a) | | | 177,850 | |
| | 275 | | | PJT Partners, Inc.—Class A (a) | | | 5,912 | |
| | 4,700 | | | Raymond James Financial, Inc. | | | 259,017 | |
| | 8,000 | | | Solar Capital, Ltd. | | | 138,480 | |
| | 4,000 | | | State Street Corp. | | | 276,000 | |
| | 11,000 | | | The Blackstone Group LP | | | 363,660 | |
| | 10,040 | | | WisdomTree Investments, Inc. | | | 193,069 | |
| | | | | | | | 5,246,674 | |
| Computers & Peripherals—0.6% | | | | |
| | 5,500 | | | NCR Corp. (a) | | | 146,300 | |
| Consumer Finance—3.4% | | | | |
| | 12,500 | | | Ally Financial, Inc. (a) | | | 249,000 | |
| | 5,500 | | | Discover Financial Services | | | 309,210 | |
| | 62,337 | | | Emergent Capital, Inc. (a) | | | 309,192 | |
| | | | | | | | 867,402 | |
| Diversified Financial Services—2.2% | | | | |
| | 6,500 | | | Citigroup, Inc. | | | 345,605 | |
| | 7,000 | | | Marlin Business Services Corp. | | | 123,620 | |
| | 1,500 | | | Nasdaq, Inc. | | | 86,835 | |
| | | | | | | | 556,060 | |
| Insurance—8.0% | | | | |
| | 1,200 | | | ACE, Ltd. | | | 136,248 | |
| | 11,000 | | | Atlas Financial Holdings, Inc. (a) | | | 209,220 | |
| | 5,000 | | | CNA Financial Corp. | | | 182,800 | |
| | 20,000 | | | Conifer Holdings, Inc. (a) | | | 191,200 | |
| | 7,000 | | | FNF Group | | | 246,960 | |
| | 58,945 | | | Health Insurance Innovations, Inc.—Class A (a) | | | 252,874 | |
| | 2,884 | | | Japan Post Holdings Co., Ltd. (a) | | | 33,460 | |
| | 542 | | | Japan Post Insurance Co., Ltd. (a) | | | 9,881 | |
| | 3,000 | | | Prudential Financial, Inc. | | | 247,500 | |
| | 14,000 | | | The Dai-ichi Life Insurance Co., Ltd. | | | 245,380 | |
| | 7,500 | | | Unum Group | | | 259,875 | |
| | | | | | | | 2,015,398 | |
| Internet Software & Services—0.5% | | | | |
| | 3,660 | | | Zillow Group, Inc.—Class A (a) | | | 112,765 | |
The accompanying notes are an integral part of these financial statements.
47
Alpine Financial Services Fund
Schedule of Portfolio Investments—Continued
October 31, 2015
| | | | Security | | | |
| Shares | | | Description | | Value | |
| | | | | | | | |
| Common Stocks—continued | | | | |
| IT Services—0.5% | | | | |
| | 4,000 | | | Cardtronics, Inc. (a) | | $ | 138,000 | |
| Professional Services—0.5% | | | | |
| | 1,000 | | | Towers Watson & Co.—Class A | | | 123,560 | |
| Real Estate Investment Trusts—5.8% | | | | |
| | 8,000 | | | Blackstone Mortgage Trust, Inc.—Class A | | | 220,160 | |
| | 12,500 | | | Colony Capital, Inc.—Class A | | | 254,250 | |
| | 12,600 | | | Five Oaks Investment Corp. | | | 83,916 | |
| | 17,000 | | | New Residential Investment Corp. | | | 206,210 | |
| | 22,000 | | | NorthStar Realty Finance Corp. | | | 264,220 | |
| | 14,000 | | | Owens Realty Mortgage, Inc. | | | 196,420 | |
| | 10,000 | | | Starwood Waypoint Residential Trust | | | 246,000 | |
| | | | | | | | 1,471,176 | |
| Real Estate Management & Development—0.8% | | | | |
| | 8,000 | | | Kennedy-Wilson Holdings, Inc. | | | 196,160 | |
| | | | Security | | | |
| Shares | | | Description | | Value | |
| | | | | | | | |
| Common Stocks—continued | | | | |
| Thrifts & Mortgage Finance—8.6% | | | | |
| | 10,105 | | | Alliance Bancorp, Inc. of Pennsylvania | | $ | 261,901 | |
| | 49,536 | | | Atlantic Coast Financial Corp. (a) | | | 303,160 | |
| | 85,940 | | | Central Federal Corp. (a) | | | 117,738 | |
| | 11,000 | | | Dime Community Bancshares, Inc. | | | 190,850 | |
| | 8,823 | | | HopFed Bancorp, Inc. | | | 104,023 | |
| | 4,466 | | | Meta Financial Group, Inc. | | | 192,395 | |
| | 10,000 | | | Nationstar Mortgage Holdings, Inc. (a) | | | 132,700 | |
| | 33,000 | | | NMI Holdings, Inc.—Class A (a) | | | 248,160 | |
| | 14,448 | | | PennyMac Financial Services, Inc.—Class A (a) | | | 238,970 | |
| | 19,651 | | | Provident Financial Holdings, Inc. | | | 336,818 | |
| | 11,000 | | | Riverview Bancorp, Inc. | | | 51,920 | |
| | | | | | | | 2,178,635 | |
| | | | | Total Common Stocks
(Cost $20,615,741) | | | 23,777,211 | |
Total Investments
(Cost $20,615,741) (c)—94.0% | | | 23,777,211 | |
| Other Assets in Excess of Liabilities—6.0% | | | 1,517,945 | |
| TOTAL NET ASSETS 100.0% | | $ | 25,295,156 | |
Percentages are stated as a percent of net assets.
| (a) | Non-income producing security. |
| (b) | Restricted under Rule 144A of the Securities Act of 1933. These securities may be resold in transactions exempt from registration, normally to qualified institutional buyers. These securities have been determined to be liquid under guidelines established by the Board of Trustees. Liquid securities restricted under Rule 144A comprised 1.4% of the Fund’s net assets. |
| (c) | See Note 7 for the cost of investments for federal tax purposes. |
ADR—American Depositary Receipt
GDR—Global Depositary Receipt
JSC—Joint Stock Company
PLC—Public Limited Company
SA—Generally designates corporations in various countries, mostly those employing the civil law.
The accompanying notes are an integral part of these financial statements.
48
Alpine Small Cap Fund
Schedule of Portfolio Investments
October 31, 2015
| | | | Security | | | |
| Shares | | | Description | | Value | |
| | | | | | | | |
| Common Stocks—96.0% | | | | |
| Banks —2.9% | | | | |
| | 17,828 | | | C1 Financial, Inc. (a) | | $ | 368,861 | |
| | 1,022 | | | Enterprise Financial Services Corp. | | | 28,984 | |
| | | | | | | | 397,845 | |
| Biotechnology—2.0% | | | | |
| | 3,025 | | | Ligand Pharmaceuticals, Inc. (a) | | | 273,309 | |
| Building Products—3.3% | | | | |
| | 11,109 | | | Patrick Industries, Inc. (a) | | | 450,803 | |
| Capital Markets—2.1% | | | | |
| | 15,080 | | | WisdomTree Investments, Inc. | | | 289,988 | |
| Construction & Engineering—4.7% | | | | |
| | 8,523 | | | Dycom Industries, Inc. (a) | | | 648,515 | |
| Construction Materials—2.5% | | | | |
| | 6,170 | | | U.S. Concrete, Inc. (a) | | | 342,188 | |
| Consumer Finance—3.2% | | | | |
| | 8,115 | | | PRA Group, Inc. (a) | | | 444,702 | |
| Diversified Consumer Services—3.4% | | | | |
| | 20,119 | | | Liberty Tax, Inc. | | | 464,548 | |
| Electronic Equipment, Instruments & Components—2.3% | | | | |
| | 6,864 | | | Rogers Corp. (a) | | | 319,313 | |
| Food Products—1.0% | | | | |
| | 1,161 | | | J&J Snack Foods Corp. | | | 142,559 | |
| Health Care Equipment & Supplies—2.5% | | | | |
| | 7,516 | | | Natus Medical, Inc. (a) | | | 342,204 | |
| Health Care Providers & Services—11.0% | | | | |
| | 16,037 | | | ExamWorks Group, Inc. (a) | | | 452,885 | |
| | 23,910 | | | Healthways, Inc. (a) | | | 281,421 | |
| | 10,595 | | | National Research Corp.—Class B | | | 341,477 | |
| | 8,577 | | | The Providence Service Corp. (a) | | | 443,002 | |
| | | | | | | | 1,518,785 | |
| Hotels, Restaurants & Leisure—2.9% | | | | |
| | 7,122 | | | Popeyes Louisiana Kitchen, Inc. (a) | | | 401,966 | |
| Insurance—2.7% | | | | |
| | 17,025 | | | Greenlight Capital Re, Ltd.— Class A (a) | | | 373,869 | |
| Internet Software & Services—4.7% | | | | |
| | 15,615 | | | GrubHub, Inc. (a) | | | 374,448 | |
| | 14,617 | | | NIC, Inc. | | | 277,284 | |
| | | | | | | | 651,732 | |
| IT Services—3.3% | | | | |
| | 13,218 | | | Cardtronics, Inc. (a) | | | 456,021 | |
| Life Sciences Tools & Services—2.0% | | | | |
| | 6,705 | | | INC Research Holdings, Inc.— Class A (a) | | | 279,666 | |
| Machinery—2.0% | | | | |
| | 19,745 | | | NN, Inc. | | | 272,481 | |
| | | | Security | | | |
| Shares | | | Description | | Value | |
| | | | | |
| Common Stocks—continued | | | | |
| Media —7.0% | | | | |
| | 15,410 | | | Live Nation Entertainment, Inc. (a) | | $ | 420,385 | |
| | 10,222 | | | Nexstar Broadcasting Group, Inc.— Class A | | | 544,117 | |
| | | | | | | | 964,502 | |
| Oil, Gas & Consumable Fuels—3.4% | | | | |
| | 41,758 | | | Aegean Marine Petroleum Network, Inc. | | | 325,713 | |
| | 16,601 | | | Scorpio Tankers, Inc. | | | 151,401 | |
| | | | | | | | 477,114 | |
| Professional Services—2.6% | | | | |
| | 8,382 | | | The Advisory Board Co. (a) | | | 367,383 | |
| Real Estate Investment Trusts—2.7% | | | | |
| | 25,897 | | | Altisource Residential Corp. | | | 372,658 | |
| Real Estate Management & Development—4.0% | | | | |
| | 22,460 | | | Kennedy-Wilson Holdings, Inc. | | | 550,719 | |
| Road & Rail—2.9% | | | | |
| | 15,869 | | | Knight Transportation, Inc. | | | 403,390 | |
| Software—6.6% | | | | |
| | 5,270 | | | Fair Isaac Corp. | | | 486,790 | |
| | 2,529 | | | Fleetmatics Group PLC (a) | | | 140,764 | |
| | 16,296 | | | The Descartes Systems Group, Inc. (a) | | | 285,017 | |
| | | | | | | | 912,571 | |
| Specialty Retail—3.0% | | | | |
| | 19,792 | | | Select Comfort Corp. (a) | | | 419,590 | |
| Thrifts & Mortgage Finance—3.8% | | | | |
| | 13,086 | | | Essent Group, Ltd. (a) | | | 315,373 | |
| | 4,816 | | | Meta Financial Group, Inc. | | | 207,473 | |
| | | | | | | | 522,846 | |
| Trading Companies & Distributors—1.5% | | | | |
| | 8,522 | | | Rush Enterprises, Inc.— Class A (a) | | | 207,766 | |
| | | | | Total Common Stocks
(Cost $13,313,630) | | | 13,269,033 | |
| | | | | | | | | |
| Principal | | | | | | | |
| Amount | | | | | | | |
| Short -Term Investments—5.1% | | | | |
| $ | 707,000 | | | State Street Eurodollar Time Deposit, 0.01% | | | 707,000 | |
| | | | | Total Short-Term Investments
(Cost $707,000) | | | 707,000 | |
Total Investments
(Cost $14,020,630) (b)—101.1% | | | 13,976,033 | |
| Liabilities in Excess of Other Assets—(1.1)% | | | (147,351 | ) |
| TOTAL NET ASSETS 100.0% | | $ | 13,828,682 | |
Percentages are stated as a percent of net assets.
| (a) | Non-income producing security. |
| (b) | See Note 7 for the cost of investments for federal tax purposes. |
PLC—Public Limited Company
The accompanying notes are an integral part of these financial statements.
49
Alpine Ultra Short Municipal Income Fund
Schedule of Portfolio Investments
October 31, 2015
| Principal | | | Security | | | |
| Amount | | | Description | | Value | |
| | | | | | | |
| Municipal Bonds—105.3% | | | | |
| Alabama—4.1% | | | | |
| $ | 3,838,000 | | | Alabama Housing Finance Authority, Multi-Family Housing, Phoenix Apartments Project—Series A (LOC: Regions Bank)
0.390%, 01/01/2036 (Putable on 11/05/2015) (a) | | $ | 3,838,000 | |
| | 5,000,000 | | | Birmingham-Baptist Medical Centers Special Care Facilities Financing Authority Bonds,— Series A
5.000%, 11/15/2015 | | | 5,007,400 | |
| | 7,215,000 | | | Chatom Industrial Development Board Gulf Opportunity Zone Revenue, National Rural Utilities Finance—Series A
0.500%, 11/15/2038 (Putable on 11/15/2015) (a) | | | 7,215,361 | |
| | 2,000,000 | | | Chatom Industrial Development Board Pollution Control Revenue, National Rural Utilities Finance—Series C
0.500%, 12/01/2024 (Putable on 12/01/2015) (a) | | | 2,000,200 | |
| | 1,450,000 | | | Chatom Industrial Development Board Revenue, National Rural Utilities Finance—Series A
0.600%, 08/01/2037 (Putable on 02/01/2016) (a) | | | 1,450,174 | |
| | 6,550,000 | | | Eutaw Industrial Development Board, Mission Power Co. Greene County Project
0.250%, 12/01/2020 (Putable on 11/02/2015) (a) | | | 6,550,000 | |
| | 1,850,000 | | | Health Care Authority for Baptist Health Revenue—Series B (CS: Assured Guaranty Municipal)
0.450%, 11/15/2037 (Putable on 11/06/2015) (a) | | | 1,850,000 | |
| | 12,000,000 | | | Health Care Authority for Baptist Health Revenue—Series B (CS: Assured Guaranty Municipal)
0.500%, 11/01/2042 (Putable on 11/05/2015) (a) | | | 12,000,000 | |
| | | | | | | | 39,911,135 | |
| Arizona—8.1% | | | | |
| | 15,400,000 | | | Cochise County Pollution Control Corp. Revenue, Arizona Electric Power Cooperative, Inc. Project
0.650%, 09/01/2024 (Putable on 03/01/2016) (a) | | | 15,400,924 | |
| | 62,000,000 | | | Phoenix Industrial Development Authority, Solid Waste Revenue, Republic Services, Inc. Project
0.600%, 12/01/2035 (Putable on 11/02/2015) (a) | | | 62,000,000 | |
| | 2,050,000 | | | Scottsdale Industrial Development Authority, Hospital Revenue Bonds, Scottsdale Healthcare—Series F (CS: Assured Guaranty Municipal)
0.800%, 09/01/2045 (Putable on 11/03/2015) (a) | | | 2,050,000 | |
| | | | | | | | 79,450,924 | |
| Principal | | | Security | | | |
| Amount | | | Description | | Value | |
| | | | | | | | | |
| Municipal Bonds—continued | | | | |
| California—6.6% | | | | |
| $ | 370,000 | | | California Health Facilities Financing Authority, Children’s Hospital of Los Angeles—Series A
5.000%, 11/15/2015 | | $ | 370,407 | |
| | 7,000,000 | | | California Pollution Control Financing Authority, Solid Waste Disposal Revenue, Republic Services, Inc. Project—Series A
0.600%, 08/01/2023 (Putable on 11/02/2015) (a)(b) | | | 7,000,000 | |
| | 3,500,000 | | | California Pollution Control Financing Authority, Solid Waste Disposal Revenue, Waste Management Inc. Project—Series A
1.650%, 07/01/2031 (Putable on 05/01/2017) (a) | | | 3,514,035 | |
| | 5,000,000 | | | California Pollution Control Financing Authority, Solid Waste Disposal Revenue, Waste Management, Inc. Project—Series A
0.750%, 11/01/2038 (Putable on 05/02/2016) (a) | | | 5,001,950 | |
| | 750,000 | | | California State Public Works Board Lease Revenue, Department of Corrections—Series A
5.250%, 09/01/2016 | | | 752,812 | |
| | 655,000 | | | California Statewide Communities Development Authority Industrial Development Revenue— Spratling—Cranor Properties LLC—Series A (LOC: City National Bank)
1.650%, 06/01/2020 (Putable on 11/04/2015) (a) | | | 655,000 | |
| | 1,300,000 | | | California Statewide Communities Development Authority, Dignity Health Obligation Group—Series E (CS: Assured Guaranty Municipal)
0.440%, 07/01/2040 (Putable on 11/06/2015) (a) | | | 1,300,000 | |
| | 7,350,000 | | | California Statewide Communities Development Authority, Dignity Health Obligation Group—Series F (CS: Assured Guaranty Municipal)
0.440%, 07/01/2040 (Putable on 11/06/2015) (a) | | | 7,350,000 | |
| | 560,000 | | | City of La Verne, Brethren Hillcrest Homes
3.000%, 05/15/2016 | | | 564,542 | |
| | 350,000 | | | Los Angeles Regional Airports Improvement Corp. Lease Revenue, Los Angeles International Airport (LOC: Societe Generale)
0.350%, 12/01/2015 (Putable on 11/05/2015) (a) | | | 350,000 | |
| | 14,475,000 | | | Palomar Pomerado Health Care— Series A, ARN (CS: Assured Guaranty Municipal)
1.750%, 11/01/2036 (Putable on 11/03/2015) (a) | | | 14,475,000 | |
The accompanying notes are an integral part of these financial statements.
50
Alpine Ultra Short Municipal Income Fund
Schedule of Portfolio Investments—Continued
October 31, 2015
| Principal | | | Security | | | |
| Amount | | | Description | | Value | |
| | | | | | | |
| Municipal Bonds—continued | | | | |
| California—(continued) | | | | |
| $ | 9,050,000 | | | Palomar Pomerado Health Care— Series B, ARN (CS: Assured Guaranty Municipal)
1.740%, 11/01/2036 (Putable on 11/04/2015) (a) | | $ | 9,050,000 | |
| | 14,200,000 | | | Palomar Pomerado Health Care— Series C, ARN (CS: Assured Guaranty Municipal)
1.390%, 11/01/2036 (Putable on 11/05/2015) (a) | | | 14,200,000 | |
| | | | | | | | 64,583,746 | |
| Colorado—0.1% | | | | |
| | 320,000 | | | Colorado Health Facilities Authority, Covenant Retire Community Obligation
1.000%, 12/01/2015 | | | 320,064 | |
| | 550,000 | | | Colorado Health Facilities Authority, Covenant Retire Community Obligation
2.000%, 12/01/2016 | | | 554,978 | |
| | 235,000 | | | E-470 Public Highway Authority— Series D1 (CS: NATL-RE)
5.250%, 09/01/2016 | | | 243,500 | |
| | | | | | | | 1,118,542 | |
| Florida—4.3% | | | | |
| | 28,600,000 | | | Florida Development Finance Corp., Healthcare Facilities Revenue, UF Health-Jacksonville Project—Series B
0.950%, 02/01/2029 (Putable on 11/05/2015) (a) | | | 28,600,000 | |
| | 11,355,000 | | | Miami-Dade County Expressway Authority Toll System Revenue—Series DCL-2012-005 (CS: AMBAC; LOC: Dexia Credit Local)
0.540%, 05/20/2029 (Putable on 11/02/2015) (a)(b) | | | 11,355,000 | |
| | 200,000 | | | Mid-Bay Bridge Authority—Series C
5.000%, 10/01/2016 | | | 206,824 | |
| | 1,315,000 | | | Southeast Overtown Park West Community Redevelopment Agency—Series A-2
4.000%, 03/01/2016 (b) | | | 1,328,794 | |
| | | | | | | | 41,490,618 | |
| Georgia—1.7% | | | | |
| | 15,500,000 | | | Burke County Development Authority, Georgia Power Company Plant Vogtle Project
0.270%, 11/01/2052 (Putable on 11/02/2015) (a) | | | 15,500,000 | |
| | 900,000 | | | Douglas County Development Authority, Electrical Fiber Systems Project (LOC: Regions Bank)
0.480%, 12/01/2021 (Putable on 11/05/2015) (a) | | | 900,000 | |
| | | | | | | | 16,400,000 | |
| Principal | | | Security | | | |
| Amount | | | Description | | Value | |
| | | | | | | | | |
| Municipal Bonds—continued | | | |
| Illinois—5.9% | | | | |
| $ | 33,470,000 | | | Chicago Board of Education—Series—DCL-2012-001 (LOC: Dexia Credit Local)
0.650%, 12/01/2034 (Putable on 11/05/2015) (a)(b) | | $ | 33,470,000 | |
| | 1,425,000 | | | Chicago Board of Education—Series A (CS: AMBAC)
5.250%, 12/01/2015 | | | 1,428,377 | |
| | 2,285,000 | | | Chicago Board of Education, General Obligation—Series B (CS: Assured Guaranty Municipal)
5.000%, 12/01/2016 | | | 2,358,006 | |
| | 1,250,000 | | | City of Chicago IL Wastewater Transmission Revenue, Second Lien—Series C
4.000%, 01/01/2017 | | | 1,288,800 | |
| | 5,000,000 | | | City of Chicago, General Obligation—Series A (LOC: Bank of New York Mellon)
0.600%, 01/01/2019 (Putable on 11/04/2015) (a) | | | 5,000,000 | |
| | 80,000 | | | Elk Grove Village Industrial Development Revenue, Rainbow Fish House, Inc. Project (LOC: JPMorgan Chase Bank N.A.)
0.460%, 05/01/2016 (Putable on 11/05/2015) (a) | | | 80,000 | |
| | 535,000 | | | Illinois Finance Authority Educational Revenue, Noble Network of Charter Schools
2.000%, 09/01/2016 | | | 537,488 | |
| | 230,000 | | | Illinois Finance Authority Industrial Development Revenue, Church Road Partnership (LOC: JPMorgan Chase Bank)
0.460%, 10/01/2017 (Putable on 11/05/2015) (a) | | | 230,000 | |
| | 500,000 | | | Illinois Finance Authority, Lifespace Communities—Series A
2.000%, 05/15/2016 | | | 503,305 | |
| | 250,000 | | | Illinois Finance Authority, Silver Cross Hospital & Medical
5.000%, 08/15/2016 | | | 257,532 | |
| | 150,000 | | | Plano Special Service Areas No 1 & 2, Special Tax Refunding (CS: Assured Guaranty Municipal)
2.000%, 03/01/2016 | | | 150,863 | |
| | 4,400,000 | | | Springfield Airport Authority, Allied-Signal, Inc. Project
5.000%, 09/01/2018 (Putable on 11/04/2015) (a) | | | 4,400,000 | |
| | 4,065,000 | | | State of Illinois, General Obligation
5.000%, 03/01/2016 | | | 4,120,406 | |
| | 2,550,000 | | | State of Illinois, General Obligation
5.000%, 01/01/2018 | | | 2,561,934 | |
| | 300,000 | | | Village of Broadview—Series A
3.000%, 12/01/2015 | | | 300,564 | |
The accompanying notes are an integral part of these financial statements.
51
Alpine Ultra Short Municipal Income Fund
Schedule of Portfolio Investments—Continued
October 31, 2015
| Principal | | | Security | | | |
| Amount | | | Description | | Value | |
| | | | | | | |
| Municipal Bonds—continued | | | | |
| Illinois—(continued) | | | | |
| $ | 500,000 | | | Village of Gilberts, Special Service Area (CS: Build America Mutual)
1.000%, 03/01/2016 | | $ | 500,210 | |
| | 155,000 | | | Village of Hanover Park Industrial Development Revenue, Spectra-Tech, Inc. Project (LOC: BMO Harris Bank N.A.)
0.500%, 08/01/2017 (Putable on 11/05/2015) (a) | | | 155,000 | |
| | | | | | | | 57,342,485 | |
| Indiana—9.4% | | | | |
| | 420,000 | | | City of South Bend Economic Development Revenue, Dynamic R.E.H.C., Inc. Project (LOC: KeyBank N.A.)
0.700%, 09/01/2020 (Putable on 11/04/2015) (a) | | | 420,000 | |
| | 500,000 | | | County of Knox Economic Development Revenue
3.000%, 04/01/2016 | | | 503,140 | |
| | 7,046,000 | | | Elkhart County Revenue (CS: Pedcor Invts-2000-xli LP)
0.380%, 01/01/2035 (Putable on 11/05/2015) (a) | | | 7,046,000 | |
| | 350,000 | | | Gary Chicago International Airport Authority
5.000%, 02/01/2016 | | | 352,951 | |
| | 400,000 | | | Gary Chicago International Airport Authority
5.000%, 02/01/2017 | | | 415,484 | |
| | 7,000,000 | | | Indiana Finance Authority Economic Development, Republic Services, Inc. Project—Series A
0.600%, 05/01/2034 (Putable on 12/01/2015) (a) | | | 7,000,070 | |
| | 6,435,000 | | | Indiana Finance Authority, Environmental Improvement Revenue, Mittal Steel U.S.A., Inc. Project (LOC: Banco Bilbao Vizcaya Argentaria)
0.530%, 08/01/2030 (Putable on 11/04/2015) (a) | | | 6,435,000 | |
| | 150,000 | | | Indiana Finance Authority, Marquette Retirement Living, Inc. Project
2.000%, 03/01/2016 | | | 150,426 | |
| | 59,255,000 | | | Indiana Finance Authority, Multifamily HSG Revenue (LIQ FAC: CitiGroup)
1.000%, 10/26/2017 (Putable on 11/05/2015) (a) | | | 59,255,000 | |
| | 10,600,000 | | | State Development Finance Authority, Environmental Revenue, PSI Energy, Inc. Projects—Series A
0.300%, 12/01/2038 (Putable on 11/04/2015) (a) | | | 10,600,000 | |
| | | | | | | | 92,178,071 | |
| Principal | | | Security | | | |
| Amount | | | Description | | Value | |
| | | | | | | |
| Municipal Bonds—continued | | | | |
| Iowa—0.1% | | | | |
| $ | 1,090,000 | | | Iowa Finance Authority, Pella Regional Health Center Project
5.000%, 12/01/2017 | | $ | 1,139,257 | |
| Kansas—0.2% | | | | |
| | 1,000,000 | | | City of Dodge City Industrial Development Revenue, Farmland National Beef Packing Co., L.P. Project (LOC: Rabobank Int.)
1.150%, 03/01/2027 (Putable on 11/05/2015) (a) | | | 1,000,000 | |
| | 1,000,000 | | | City of Liberal KS Industrial Development Revenue, Farmland National Beef Packing Co., L.P. Project (LOC: Rabobank Int.)
1.150%, 02/01/2029 (Putable on 11/05/2015) (a) | | | 1,000,000 | |
| | | | | | | | 2,000,000 | |
| Kentucky—0.8% | | | | |
| | 3,000,000 | | | City of Somerset, General Obligation Note
1.250%, 10/01/2016 | | | 3,000,180 | |
| | 5,000,000 | | | Pulaski County Solid Waste Disposal Revenue, National Rural Utilities-East Kentucky Power—Series B
0.650%, 08/15/2023 (Putable on 02/15/2016) (a) | | | 5,000,400 | |
| | | | | | | | 8,000,580 | |
| Louisiana—3.0% | | | | |
| | 4,600,000 | | | Jefferson Parish Industrial Development Board, Sara Lee Corp. Project
0.400%, 06/01/2024 (Putable on 11/02/2015) (a) | | | 4,600,000 | |
| | 1,835,000 | | | Louisiana Housing Finance Agency Revenue, Multifamily Housing Restoration—Series A (LOC: Regions Bank)
0.410%, 12/01/2032 (Putable on 11/05/2015) | | | 1,835,000 | |
| | 480,000 | | | Louisiana Public Facilities Authority, Equipment & Capital Facilities Pooled—Series B (LOC: Capital One Bank NA)
0.620%, 07/01/2033 (Putable on 11/05/2015) (a) | | | 480,000 | |
| | 1,290,000 | | | North Webster Parish Industrial Development Revenue, CSP Project (LOC: Regions Bank)
2.000%, 09/01/2021 (Putable on 11/05/2015) (a) | | | 1,290,000 | |
| | 680,000 | | | Ouachita Parish Industrial Development Board, Garrett Manufacturing LLC (LOC: Regions Bank)
0.480%, 12/01/2016 (Putable on 11/05/2015) (a) | | | 680,000 | |
The accompanying notes are an integral part of these financial statements.
52
Alpine Ultra Short Municipal Income Fund
Schedule of Portfolio Investments—Continued
October 31, 2015
| Principal | | | Security | | | |
| Amount | | | Description | | Value | |
| | | | | | | |
| Municipal Bonds—continued | | | | |
| Louisiana—(continued) | | |
| $ | 20,000,000 | | | Plaquemines Port Harbor & Terminal District Revenue, International Marine Terminal Project—Series A (LOC: Wells Fargo Bank N.A.)
0.470%, 03/15/2025 (Putable on 03/15/2016) (a) | | $ | 20,000,000 | |
| | | | | | | | 28,885,000 | |
| Maryland—0.0% (c) | | |
| | 300,000 | | | Maryland State Health & Educational Facilities Authority, Meritus Medical Center
5.000%, 07/01/2016 | | | 308,274 | |
| Massachusetts—0.2% | | |
| | 1,165,000 | | | Massachusetts Development Finance Agency, Seven Hills Obligated Group
3.000%, 09/01/2016 | | | 1,178,782 | |
| | 1,000,000 | | | Massachusetts Development Finance Agency, Waste Management, Inc.—Series B
2.125%, 12/01/2029 (Putable on 12/01/2015) (a) | | | 1,001,310 | |
| | | | | | | | 2,180,092 | |
| Michigan—2.1% | | |
| | 7,900,000 | | | City of Detroit Sewage Disposal System Revenue, Senior Lien—Series 1182 (CS: Assured Guaranty Municipal; LOC: Rabobank, Int)
0.910%, 07/01/2029 (Putable on 11/05/2015) (a)(b) | | | 7,900,000 | |
| | 1,500,000 | | | Michigan Finance Authority— Series 25-A
5.000%, 11/01/2015 | | | 1,500,000 | |
| | 3,000,000 | | | Michigan Finance Authority, Detroit School District
4.750%, 06/01/2016 (b) | | | 3,026,940 | |
| | 1,600,000 | | | Michigan Finance Authority, Detroit School District
5.000%, 06/01/2016 | | | 1,632,848 | |
| | 6,605,000 | | | Michigan Finance Authority, Detroit School District—Series A
3.000%, 05/01/2016 | | | 6,678,117 | |
| | | | | | | | 20,737,905 | |
| Minnesota—0.1% | | |
| | 1,020,000 | | | Saint Paul Housing & Redevelopment Authority, Healtheast Care Systems Project
2.000%, 11/15/2015 | | | 1,020,408 | |
| Mississippi—9.1% | | |
| | 68,000,000 | | | Mississippi Business Finance Corp. Revenue, PSL—North America LLC Project—Series A (LOC: ICICI Bank)
2.550%, 11/01/2032 (Putable on 11/05/2015) (a) | | | 68,000,000 | |
| | 6,495,000 | | | Mississippi Business Finance Corp., Hattiesburg Clinic Professional Association Project (LOC: Regions Bank)
0.340%, 11/01/2026 (Putable on 11/05/2015) (a) | | | 6,495,000 | |
| Principal | | | Security | | | |
| Amount | | | Description | | Value | |
| | | | | | | |
| Municipal Bonds—continued | | | | |
| Mississippi—(continued) |
| $ | 4,200,000 | | | Mississippi Business Finance Corp., Tri-State Truck Center, Inc. Project (LOC: Regions Bank)
0.350%, 03/01/2033 (Putable on 11/05/2015) (a) | | $ | 4,200,000 | |
| | 10,000,000 | | | Mississippi Hospital Equipment & Facilities Authority, Baptist Member Health—Series B2
0.750%, 09/01/2022 (Putable on 01/07/2016) (a) | | | 10,002,200 | |
| | | | | | | | 88,697,200 | |
| Missouri—0.0% (c) | | | |
| | 405,000 | | | Joplin Industrial Development Authority, Freeman Health System
2.000%, 02/15/2016 | | | 406,389 | |
| Montana—0.8% | | | |
| | 8,000,000 | | | City of Livingston, Revenue Anticipation Notes, Livingston Healthcare Project—Series 2013
2.000%, 12/01/2015 | | | 8,001,440 | |
| Nevada—0.4% | | | |
| | 4,400,000 | | | Las Vegas Valley Water District, Water Improvement—Series B (SPA: Dexia Credit Local)
0.250%, 06/01/2036 (Putable on 11/02/2015) (a) | | | 4,400,000 | |
| New Hampshire—0.6% | | | |
| | 955,000 | | | New Hampshire Business Finance Authority, Pennichuck Water Works, Inc. Project—Series A
3.000%, 01/01/2016 | | | 958,476 | |
| | 995,000 | | | New Hampshire Business Finance Authority, Pennichuck Water Works, Inc. Project—Series A
4.000%, 01/01/2017 | | | 1,028,810 | |
| | 3,700,000 | | | New Hampshire State Business Finance Authority Poll Control Revenue
0.450%, 11/09/2015 (Putable on 11/09/2015) | | | 3,700,037 | |
| | | | | | | | 5,687,323 | |
| New Jersey—9.2% | | | |
| | 3,830,000 | | | Casino Reinvestment Development Authority—Series A (CS: NATL-RE)
5.000%, 06/01/2016 | | | 3,841,452 | |
| | 500,000 | | | Casino Reinvestment Development Authority—Series D
4.000%, 11/01/2016 | | | 507,495 | |
| | 2,765,000 | | | City of Newark, General Obligation Notes
1.750%, 12/08/2015 | | | 2,766,687 | |
| | 14,834,000 | | | City of Newark, Tax Anticipation Notes—Series A
1.750%, 02/19/2016 | | | 14,854,026 | |
| | 36,300,000 | | | New Jersey Economic Development Authority, Port Newark Container Terminal LLC Project—Series B (LOC: Sovereign Bank N.A.)
0.550%, 07/01/2030 (Putable on 11/04/2015) (a) | | | 36,300,000 | |
The accompanying notes are an integral part of these financial statements.
53
Alpine Ultra Short Municipal Income Fund
Schedule of Portfolio Investments—Continued
October 31, 2015
| Principal | | | Security | | | |
| Amount | | | Description | | Value | |
| | | | |
| Municipal Bonds—continued | | | |
| New Jersey—(continued) | | | |
| $ | 835,000 | | | South Jersey Port Corp., Marine Terminal Revenue—Series P-2
4.000%, 01/01/2016 | | $ | 839,200 | |
| | 625,000 | | | South Jersey Port Corp., Marine Terminal Revenue—Series Q
3.000%, 01/01/2016 | | | 627,150 | |
| | 5,000,000 | | | Town of Kearny, Tax Anticipation Notes
2.000%, 04/29/2016 | | | 5,027,250 | |
| | 17,650,905 | | | Township of Berkeley, Bond Anticipation Notes
1.500%, 05/25/2016 | | | 17,706,152 | |
| | 7,400,000 | | | Township of Irvington, Bond Anticipation Notes
3.250%, 06/17/2016 | | | 7,427,232 | |
| | | | | | | | 89,896,644 | |
| New York—14.8% | | | |
| | 1,656,000 | | | City of Glen Cove, Bond Anticipation Notes—Series D
1.500%, 04/08/2016 | | | 1,658,467 | |
| | 410,000 | | | City of Long Beach—Series A
2.000%, 11/15/2015 | | | 410,201 | |
| | 10,879,000 | | | City of Long Beach, Bond Anticipation Notes—Series B
1.500%, 02/17/2016 | | | 10,898,473 | |
| | 14,570,000 | | | City of Long Beach, Revenue Anticipation Notes—Series A
1.500%, 06/30/2016 | | | 14,621,578 | |
| | 10,400,000 | | | City of New York General Obligation—Series A (CS: Assured Guaranty Municipal; SPA: Dexia Credit Local)
0.300%, 11/01/2026 (Putable on 11/02/2015) (a) | | | 10,400,000 | |
| | 5,000,000 | | | Nassau Health Care Corp., Revenue Anticipation Notes
2.250%, 01/15/2016 | | | 5,011,150 | |
| | 295,000 | | | New York City Industrial Development Agency, Allway Tools, Inc. (LOC: Citibank N.A.)
0.710%, 08/01/2017 (Putable on 11/05/2015) (a) | | | 295,000 | |
| | 810,000 | | | New York City Industrial Development Agency, Allway Tools, Inc. (LOC: Citibank N.A.)
0.710%, 08/01/2020 (Putable on 11/05/2015) (a) | | | 810,000 | |
| | 16,000,000 | | | New York City Transitional Finance Authority, Future Tax Secured Revenue—Series 2A
0.300%, 11/01/2022 (Putable on 11/02/2015) (a) | | | 16,000,000 | |
| | 22,000,000 | | | New York Environmental Facilities Corp. Solid Waste Disposal Revenue, Waste Management, Inc. Project—Series 2012
0.550%, 05/01/2030 (Putable on 11/02/2015) (a) | | | 22,000,000 | |
| Principal | | | Security | | | |
| Amount | | | Description | | Value | |
| | | | | | | | | |
| Municipal Bonds—continued | | | |
| New York—(continued) | | | |
| $ | 3,475,000 | | | Niagara Falls City School District
2.000%, 06/15/2016 | | $ | 3,497,900 | |
| | 300,000 | | | Otsego County Capital Resource Corp.
3.000%, 10/01/2016 | | | 304,779 | |
| | 500,000 | | | Rockland County, General Obligation Bond
5.000%, 03/01/2016 | | | 507,425 | |
| | 15,000,000 | | | Rockland County, Tax Anticipation Notes
2.000%, 03/16/2016 | | | 15,078,150 | |
| | 35,000,000 | | | Town of Oyster Bay, Bond Anticipation Notes—Series B
2.000%, 07/08/2016 | | | 35,272,300 | |
| | 560,000 | | | Town of Ramapo, General Obligation
2.000%, 05/01/2016 | | | 563,069 | |
| | 370,000 | | | Town of Ramapo, General Obligation—Series B
3.000%, 05/01/2016 | | | 373,841 | |
| | 900,000 | | | Town of Ramapo, Public Improvement—Series A
4.000%, 05/15/2016 | | | 914,832 | |
| | 5,000,000 | | | Utica School District, Bond Anticipation Notes
2.000%, 07/22/2016 | | | 5,026,950 | |
| | 500,000 | | | Westchester Tobacco Asset Securitization Corp.
5.000%, 06/01/2026 | | | 500,510 | |
| | | | | | | | 144,144,625 | |
| North Carolina—4.3% | | | |
| | 18,900,000 | | | Hertford County Industrial Facilities & Pollution Control Financing Authority, Nucor Corp. Project—Series A
0.320%, 11/01/2033 (Putable on 11/04/2015) (a) | | | 18,900,000 | |
| | 13,100,000 | | | Hertford County Industrial Facilities & Pollution Control Financing Authority, Nucor Corp. Project—Series B
0.300%, 11/01/2033 (Putable on 11/04/2015) (a) | | | 13,100,000 | |
| | 9,500,000 | | | North Carolina Capital Facilities Finance Agency, Solid Waste Disposal Revenue, Republic Services, Inc. Project—Series B
0.600%, 12/01/2020 (Putable on 12/01/2015) (a) | | | 9,500,095 | |
| | | | | | | | 41,500,095 | |
| North Dakota—0.1% | | | |
| | 1,375,000 | | | Ward County Healthcare Revenue, Trinity Obligated Group
5.250%, 07/01/2016 | | | 1,407,986 | |
| Ohio—2.1% | | | |
| | 2,400,000 | | | Ohio Water Development Authority, FirstEnergy Generation Project—Series A
2.250%, 08/01/2029 (Putable on 09/15/2016) (a) | | | 2,407,560 | |
The accompanying notes are an integral part of these financial statements.
54
Alpine Ultra Short Municipal Income Fund
Schedule of Portfolio Investments—Continued
October 31, 2015
| Principal | | | Security | | | |
| Amount | | | Description | | Value | |
| | | | | | | | | |
| Municipal Bonds—continued | | | |
| Ohio—(continued) | | | |
| $ | 9,000,000 | | | Ohio Water Development Authority, Solid Waste Revenue, Waste Management Project
2.250%, 11/01/2022 (Putable on 11/02/2015) (a) | | $ | 9,000,000 | |
| | 9,000,000 | | | State of Ohio, University Hospital Health
0.350%, 01/15/2045 (Putable on 11/02/2015) (a) | | | 9,000,000 | |
| | | | | | | | 20,407,560 | |
| Oklahoma—0.2% | | | | |
| | 710,000 | | | Comanche County Hospital Authority
5.000%, 07/01/2016 | | | 727,154 | |
| | 500,000 | | | Tulsa Airports Improvement Trust Revenue—Series A
3.000%, 06/01/2016 | | | 506,095 | |
| | 300,000 | | | Tulsa Airports Improvement Trust Revenue—Series B
3.000%, 06/01/2016 | | | 303,657 | |
| | | | | | | | 1,536,906 | |
| Oregon—0.5% | | | |
| | 460,000 | | | City of Forest Grove, Pacific University
3.000%, 05/01/2016 | | | 465,046 | |
| | 250,000 | | | City of Forest Grove, Pacific University
3.000%, 05/01/2017 | | | 257,045 | |
| | 4,325,000 | | | Gilliam County, Solid Waste Disposal Revenue, Waste Management, Inc. Project—Series A
0.800%, 08/01/2025 (Putable on 05/02/2016) (a)(b) | | | 4,326,687 | |
| | | | | | | | 5,048,778 | |
| Pennsylvania—1.2% | | | |
| | 3,000,000 | | | Beaver County Industrial Development Authority, FirstEnergy Generation Project—Series A
2.200%, 01/01/2035 (Putable on 07/01/2016) (a) | | | 3,013,470 | |
| | 5,000,000 | | | Beaver County Industrial Development Authority, FirstEnergy Generation Project—Series B
2.500%, 12/01/2041 (Putable on 06/01/2017) (a) | | | 5,003,800 | |
| | 435,000 | | | Clarion County Industrial Development Authority, Clarion University Foundation, Inc. Housing Project—Series D
3.000%, 07/01/2016 | | | 440,290 | |
| | 600,000 | | | Cumberland County Municipal Authority, Diakon Lutheran Ministries
3.000%, 01/01/2016 | | | 601,908 | |
| | 200,000 | | | Dallas Area Municipal Authority, Misericordia University Project—Series 2014
4.000%, 05/01/2016 | | | 202,302 | |
| Principal | | | Security | | | |
| Amount | | | Description | | Value | |
| | | | | | | | | |
| Municipal Bonds—continued | | | |
| Pennsylvania—(continued) | | | |
| $ | 2,000,000 | | | Pennsylvania Economic Development Financing Authority, Solid Waste Disposal Revenue, Waste Management, Inc.
1.750%, 12/01/2033 (Putable on 12/01/2015) (a) | | $ | 2,001,400 | |
| | 195,000 | | | West Shore Area Authority, Messiah Village Project—Series A
2.000%, 07/01/2016 | | | 195,838 | |
| | | | | | | | 11,459,008 | |
| Puerto Rico—5.1% | | | |
| | 120,000 | | | Commonwealth of Puerto Rico—Series A (CS: Assured Guaranty Municipal)
4.000%, 07/01/2016 | | | 121,638 | |
| | 500,000 | | | Commonwealth of Puerto Rico, Public Improvement—Series A (CS: Assured Guaranty Municipal)
5.000%, 07/01/2017 | | | 513,585 | |
| | 820,000 | | | Commonwealth of Puerto Rico, Public Improvement—Series A (CS: NATL-RE)
5.500%, 07/01/2016 | | | 835,933 | |
| | 2,590,000 | | | Commonwealth of Puerto Rico, Public Improvement Bonds (CS: Assured Guaranty Municipal)
5.500%, 07/01/2017 | | | 2,681,090 | |
| | 670,000 | | | Commonwealth of Puerto Rico, Public Improvement Bonds—Series A (CS: NATL-RE)
5.500%, 07/01/2017 | | | 693,597 | |
| | 41,450,000 | | | Government Development Bank for Puerto Rico Revenue (CS: NATL-RE)
4.750%, 12/01/2015 | | | 41,512,175 | |
| | 1,725,000 | | | Puerto Rico Commonwealth Aqueduct & Sewer Authority, Senior Lien—Series A (CS: Assured Guaranty Municipal)
5.000%, 07/01/2016 | | | 1,759,897 | |
| | 140,000 | | | Puerto Rico Electric Power Authority—Series LL (CS: NATL-RE)
5.500%, 07/01/2017 | | | 144,931 | |
| | 250,000 | | | Puerto Rico Electric Power Authority—Series SS (CS: NATL-RE)
5.000%, 07/01/2017 | | | 250,385 | |
| | 1,100,000 | | | Puerto Rico Highways & Transportation Authority—Series E (CS: Assured Guaranty Municipal)
5.500%, 07/01/2017 | | | 1,126,158 | |
| | 550,000 | | | Puerto Rico Municipal Finance Agency—Series A (CS: Assured Guaranty Municipal)
5.000%, 08/01/2016 | | | 550,907 | |
| | | | | | | | 50,190,296 | |
The accompanying notes are an integral part of these financial statements.
55
Alpine Ultra Short Municipal Income Fund
Schedule of Portfolio Investments—Continued
October 31, 2015
| Principal | | | Security | | | |
| Amount | | | Description | | Value | |
| | | | | | | | | |
| Municipal Bonds—continued | | | |
| Rhode Island—0.1% | | | |
| $ | 500,000 | | | Providence Redevelopment Agency Revenue—Series A
3.000%, 04/01/2017 | | $ | 512,385 | |
| Tennessee—2.3% | | | |
| | 22,000,000 | | | Lewisburg Industrial Development Board Solid Waste Disposal Revenue, Waste Management, Inc. of Tennessee Project
0.550%, 07/02/2035 (Putable on 11/02/2015) (a) | | | 22,000,000 | |
| Texas—4.4% | | | |
| | 3,000,000 | | | Central Texas Regional Mobility Authority—Series B
3.000%, 01/01/2045 (Putable on 01/04/2016) (a) | | | 3,004,770 | |
| | 570,000 | | | Hidalgo County Health Services Corp., Hospital Revenue, Mission Hospital, Inc.—Series 2008
5.000%, 08/15/2016 | | | 584,421 | |
| | 21,700,000 | | | Port of Port Arthur Navigation District Revenue, Motiva Enterprises LLC—Series B
0.210%, 04/01/2040 (Putable on 11/02/2015) (a) | | | 21,700,000 | |
| | 2,000,000 | | | Texas Municipal Gas Acquisition & Supply Corp. III Gas Supply Revenue—Series 2012 (CS: Macquarie Group Ltd)
5.000%, 12/15/2015 | | | 2,009,880 | |
| | 12,055,000 | | | Weslaco Health Facilities Development Corp., Knapp Medical Center—Series A (LOC: Compass Bank)
0.250%, 06/01/2038 (Putable on 11/05/2015) (a) | | | 12,055,000 | |
| | 3,820,000 | | | Weslaco Health Facilities Development Corp., Knapp Medical Center—Series B (LOC: Compass Bank)
0.250%, 06/01/2031 (Putable on 11/05/2015) (a) | | | 3,820,000 | |
| | | | | | | | 43,174,071 | |
| Utah—0.0% (c) | | | |
| | 220,000 | | | Salt County Lake Revenue, Westminster College
2.000%, 10/01/2016 | | | 222,024 | |
| Virginia—2.0% | | | |
| | 19,500,000 | | | Campbell County Industrial Development Authority, Solid Waste Disposal Facility Revenue, Georgia Pacific Corp. Project
0.220%, 12/01/2019 (Putable on 11/04/2015) (a)(b) | | | 19,500,000 | |
| Washington—0.3% | | | |
| | 1,400,000 | | | Washington Economic Development Finance Authority, Belina Interiors, Inc.—Series E (LOC: KeyBank N.A.)
0.510%, 08/01/2033 (Putable on 11/05/2015) (a) | | | 1,400,000 | |
| Principal | | | Security | | | |
| Amount | | | Description | | Value | |
| | | | | | | | | |
| Municipal Bonds—continued | | | |
| Washington—continued | | | |
| $ | 1,110,000 | | | Washington Economic Development Finance Authority, Belina Interiors, Inc.—Series F (LOC: KeyBank N.A.)
0.510%, 11/01/2023 (Putable on 11/05/2015) (a) | | $ | 1,110,000 | |
| | | | | | | | 2,510,000 | |
| Wisconsin—0.8% | | | |
| | 2,305,000 | | | City of Baraboo, Industrial Development Revenue, Series 2007, Teel Plastics, Inc. Project (LOC: BMO Harris Bank N.A.)
0.400%, 11/01/2042 (Putable on 11/05/2015) (a) | | | 2,305,000 | |
| | 1,785,000 | | | Mequon Industrial Development Revenue, SPI Lighting (LOC: BMO Harris Bank N.A.)
0.400%, 12/01/2023 (Putable on 11/05/2015) (a) | | | 1,785,000 | |
| | 500,000 | | | Milwaukee Redevelopment Authority, Kubin Nicholson Corp. Project—Series A (LOC: BMO Harris Bank N.A.)
0.400%, 08/01/2020 (Putable on 11/05/2015) (a) | | | 500,000 | |
| | 2,720,000 | | | Village of Menomonee Falls Industrial Development Revenue, AJ Die-Namics Project (LOC: BMO Harris Bank N.A.)
0.400%, 11/01/2036 (Putable on 11/05/2015) (a) | | | 2,720,000 | |
| | 245,000 | | | Wisconsin Health & Educational Facilities Authority, Fort Healthcare, Inc. Obligation
4.000%, 05/01/2016 | | | 248,790 | |
| | | | | | | | 7,558,790 | |
| Wyoming—0.3% | | | |
| | 2,855,000 | | | Gillette Environmental Improvement Revenue, Black Hills Power and Light Co.—Series A
0.750%, 06/01/2024 (Putable on 11/04/2015) (a) | | | 2,855,000 | |
| | | | | Total Municipal Bonds
(Cost $1,027,765,705) | | | 1,027,863,557 | |
| | | | | | | | | |
| Shares | | | | | | | |
| Money Market Funds—0.0% (c) | | | |
| | 44,767 | | | BlackRock Liquidity Funds: MuniCash Portfolio, 0.02% | | | 44,767 | |
| | | | | Total Money Market Funds
(Cost $44,767) | | | 44,767 | |
Total Investments
(Cost $1,027,810,472) (d)—105.3% | | 1,027,908,324 | |
| Liabilities in Excess of Other Assets—(5.3)% | | (52,128,123 | ) |
| TOTAL NET ASSETS 100.0% | $ | 975,780,201 | |
The accompanying notes are an integral part of these financial statements.
56
Alpine Ultra Short Municipal Income Fund
Schedule of Portfolio Investments—Continued
October 31, 2015
Percentages are stated as a percent of net assets.
| (a) | Variable Rate Security—The rate reported is the rate in effect as of October 31, 2015. |
| | |
| (b) | Restricted under Rule 144A of the Securities Act of 1933. These securities may be resold in transactions exempt from registration, normally to qualified institutional buyers. These securities have been determined to be liquid under guidelines established by the Board of Trustees. Liquid securities restricted under Rule 144A comprised 9.0% of the Fund’s net assets. |
| | |
| (c) | Amount is less than 0.05%. |
| | |
| (d) | See Note 7 for the cost of investments for federal tax purposes. |
AMBAC—American Municipal Bond Assurance Corp.
ARN—Auction Rate Note
CS—Credit Support
CSP—Continental Structural Plastics
LIQ FAC—Liquidity Facility
NATL-RE—Reinsurance provided by National Public Finance Guarantee Corp.
SPA—Standby Purchase Agreement
The accompanying notes are an integral part of these financial statements.
57
Alpine High Yield Managed Duration Municipal Fund
Schedule of Portfolio Investments
October 31, 2015
Principal
Amount | | Security
Description | | | Value | |
| | | | | | | | | |
| Municipal Bonds—97.8% | | | | |
| Alabama—9.9% | | | | |
| $ | 750,000 | | Alabama Industrial Development Solid Waste Disposal Revenue (CS: OfficeMax, Inc.)
6.450%, 12/01/2023 | | | $ | 752,115 | |
| | 850,000 | | Health Care Authority for Baptist Health Revenue—Series D
5.000%, 11/15/2021 | | | | 852,729 | |
| | 2,855,000 | | Jefferson County Ltd. Obligation School Warrants—Series A
4.750%, 01/01/2025 | | | | 2,870,902 | |
| | 250,000 | | Jefferson County Ltd. Obligation School Warrants—Series A
5.250%, 01/01/2017 | | | | 251,625 | |
| | 160,000 | | Jefferson County, Capital Improvement Warrants— Series A (CS: NATL-RE)
5.000%, 04/01/2023 | | | | 160,312 | |
| | 900,000 | | Selma Industrial Development Board Revenue, Zilkha Biomass Selma LLC Project
7.500%, 05/01/2025 (a) | | | | 890,397 | |
| | | | | | | | 5,778,080 | |
| Arizona—1.0% | | | | |
| | 200,000 | | Phoenix Industrial Development Authority, AZ GFF Tiyan LLC (Guam annual appropriation)
5.000%, 02/01/2018 | | | | 209,332 | |
| | 200,000 | | Phoenix Industrial Development Authority, Basis School, Inc.
3.000%, 07/01/2020 (a) | | | | 199,048 | |
| | 180,000 | | Phoenix Industrial Development Authority, Legacy Traditional Schools Project—Series A
4.750%, 07/01/2019 (a) | | | | 182,887 | |
| | | | | | | | 591,267 | |
| California—5.8% | | | | |
| | 250,000 | | California Municipal Finance Authority, Julian Charter School Project—Series A
5.000%, 03/01/2025 (a) | | | | 250,908 | |
| | 135,000 | | California School Finance Authority, School Facility Revenue, Alta Public Schools Project—Series A
3.400%, 11/01/2015 (a) | | | | 135,000 | |
| | 190,000 | | Inland Empire Tobacco Securitization Authority, Tobacco Settlement—Series A
4.625%, 06/01/2021 | | | | 187,927 | |
| | 145,000 | | Inland Empire Tobacco Securitization Authority, Tobacco Settlement—Series A
5.000%, 06/01/2021 | | | | 144,994 | |
| | 1,050,000 | | Palomar Pomerado Health Care— Series A, ARN (CS: Assured Guaranty Municipal)
1.750%, 11/01/2036 (Putable on 11/03/2015) (b) | | | | 1,050,000 | |
Principal
Amount | | | Security
Description | | Value | |
| | | | | | | | | |
| Municipal Bonds—continued | | | | |
| California—continued | | | | |
| $ | 700,000 | | | Palomar Pomerado Health Care— Series B, ARN (CS: Assured Guaranty Municipal)
1.740%, 11/01/2036 (Putable on 11/04/2015) (b) | | $ | 700,000 | |
| | 900,000 | | | Palomar Pomerado Health Care— Series C, ARN (CS: Assured Guaranty Municipal)
1.390%, 11/01/2036 (Putable on 11/05/2015) (b) | | | 900,000 | |
| | | | | | | | 3,368,829 | |
| Colorado—0.4% | | | | |
| | 250,000 | | | Colorado Health Facilities Authority, Covenant Retirement Communities, Inc.—Series B
3.150%, 12/01/2018 | | | 250,295 | |
| District of Columbia—0.9% | | | | |
| | 275,000 | | | District of Columbia, Howard University—Series A
5.250%, 10/01/2022 | | | 297,811 | |
| | 250,000 | | | District of Columbia, Methodist Home
4.500%, 01/01/2025 | | | 248,873 | |
| | | | | | | | 546,684 | |
| Florida—3.8% | | | | |
| | 250,000 | | | Capital Trust Agency, Inc. Revenue, First Mortgage Revenue—Silver Creek St. Augustine Project— Series A
6.500%, 01/01/2024 | | | 240,800 | |
| | 170,000 | | | Capital Trust Agency, Inc. Revenue, River City Education Services, Inc. Project—Series A
4.625%, 02/01/2025 | | | 167,290 | |
| | 100,000 | | | Celebration Pointe Community Development District No.1, Special Assessment Revenue
4.750%, 05/01/2024 | | | 101,819 | |
| | 200,000 | | | City of Atlantic Beach, Health Care Facilities Revenue Naval CCRC— Series A
5.000%, 11/15/2021 | | | 221,566 | |
| | 200,000 | | | City Of Tampa, Solid Waste System Revenue (CS: Assured Guaranty Municipal)
5.000%, 10/01/2020 | | | 229,124 | |
| | 300,000 | | | Collier County Industrial Development Authority CCRC, Arlington of Naples Project— Series B-1
6.875%, 05/15/2021 (a) | | | 300,252 | |
| | 100,000 | | | Florida Development Finance Corp., Educational Facilities Revenue Bonds, Miami Arts Charter School Project—Series A
5.000%, 06/15/2024 (a) | | | 99,167 | |
| | 400,000 | | | Palm Beach County Health Facilities Authority, Sinai Residences Boca Raton Project— Series C
6.000%, 06/01/2021 | | | 442,132 | |
The accompanying notes are an integral part of these financial statements.
58
Alpine High Yield Managed Duration Municipal Fund
Schedule of Portfolio Investments—Continued
October 31, 2015
Principal
Amount | | | Security
Description | | Value | |
| | | | | | | | | |
| Municipal Bonds—continued | | | | |
| Florida—continued | | | | |
| $ | 290,000 | | | State Development Finance Corp. Revenue, Tuscan Isle Obligated Group—Series A
6.500%, 06/01/2025 (a) | | $ | 295,327 | |
| | 100,000 | | | Village Community Development District #11, Special Assessment Revenue
3.250%, 05/01/2019 | | | 100,019 | |
| | | | | | | | 2,197,496 | |
| Guam —0.5% | | | | |
| | 250,000 | | | Guam International Airport Authority—Series C
5.000%, 10/01/2021 | | | 283,275 | |
| Idaho —0.6% | | | | |
| | 360,000 | | | Idaho Health Facilities Authority, The Terraces Boise Project—Series B-2
6.000%, 10/01/2021 | | | 360,130 | |
| Illinois—8.1% | | | | |
| | 155,000 | | | Chicago Board of Education, Dedicated Revenues (CS: Assured Guaranty Municipal)
5.000%, 12/01/2022 | | | 158,207 | |
| | 100,000 | | | Chicago Board of Education, General Obligation—Series A (CS: NATL-RE)
5.000%, 12/01/2021 | | | 100,318 | |
| | 75,000 | | | Chicago Board of Education, General Obligation—Series A (CS: NATL-RE)
5.250%, 12/01/2018 | | | 79,376 | |
| | 725,000 | | | Chicago Board of Education, General Obligation—Series A (CS: NATL-RE)
5.250%, 12/01/2019 | | | 727,429 | |
| | 500,000 | | | Chicago Board of Education, General Obligation—Series B (CS: Assured Guaranty Municipal)
5.000%, 12/01/2016 | | | 515,975 | |
| | 200,000 | | | Chicago Board of Education, Refunding—Series G
4.010%, 03/01/2032 (Putable on 11/05/2015) (b) | | | 197,914 | |
| | 150,000 | | | City of Chicago—Series A
4.000%, 01/01/2019 | | | 149,905 | |
| | 210,000 | | | City of Chicago—Series A
4.000%, 01/01/2020 | | | 207,064 | |
| | 100,000 | | | City of Chicago, General Obligation (CS: AMBAC) 5.000%, 12/01/2024 | | | 101,018 | |
| | 25,000 | | | City of Chicago, General Obligation—Series A (CS: Assured Guaranty Municipal)
5.000%, 01/01/2022 | | | 25,082 | |
| | 100,000 | | | City of Chicago, General Obligation—Series A (CS: Assured Guaranty Municipal)
5.000%, 01/01/2023 | | | 100,421 | |
Principal
Amount | | | Security
Description | | Value | |
| | | | | | | | | |
| Municipal Bonds—continued | | | | |
| Illinois—continued | | | | |
| $ | 95,000 | | | City of Chicago, General Obligation—Series B (CS: AMBAC)
5.000%, 12/01/2015 | | $ | 95,227 | |
| | 70,000 | | | City of Chicago, General Obligation—Series B (CS: Assured Guaranty Municipal)
5.000%, 01/01/2018 | | | 70,228 | |
| | 125,000 | | | City of Chicago, General Obligation—Series B (CS: Assured Guaranty Municipal)
5.000%, 01/01/2026 | | | 125,070 | |
| | 125,000 | | | City of Chicago, General Obligation—Series D (CS: AMBAC)
5.000%, 12/01/2015 | | | 125,299 | |
| | 200,000 | | | Illinois Finance Authority Educational Facility Revenue, Senior Rogers Park Montessori School Project
5.000%, 02/01/2024 | | | 201,142 | |
| | 150,000 | | | Southwestern Development Authority, Memorial Group, Inc.
5.750%, 11/01/2019 | | | 164,311 | |
| | 700,000 | | | State of Illinois, General Obligation (CS: Assured Guaranty Municipal)
5.000%, 04/01/2021 | | | 701,050 | |
| | 100,000 | | | State of Illinois, General Obligation (CS: AMBAC)
5.000%, 11/01/2024 | | | 100,145 | |
| | 380,000 | | | State of Illinois, General Obligation—Series A
5.000%, 03/01/2017 | | | 381,292 | |
| | 50,000 | | | State of Illinois, General Obligation Refunding Bond
5.000%, 08/01/2021 | | | 54,849 | |
| | 180,000 | | | Stephenson County Revenue (CS: AMBAC)
4.500%, 12/01/2020 | | | 182,702 | |
| | 160,000 | | | Village of Maywood
3.000%, 01/01/2016 | | | 160,198 | |
| | | | | | | | 4,724,222 | |
| Indiana—3.8% | | | | |
| | 100,000 | | | City of Anderson, Economic Development Revenue, Anderson University Project
5.000%, 10/01/2024 | | | 100,589 | |
| | 250,000 | | | City of Valparaiso Exempt Facilities Revenue, Pratt Paper LLC Project
5.875%, 01/01/2024 | | | 288,547 | |
| | 1,000,000 | | | Hammond Local Public Improvement Bond Bank—Series B
3.250%, 05/01/2016 | | | 1,000,030 | |
| | 225,000 | | | Indiana Finance Authority, King’s Daughters Hospital & Health Services
5.000%, 08/15/2020 | | | 252,137 | |
| | 50,000 | | | Indiana Finance Authority, United States Steel Corp.
6.000%, 12/01/2019 | | | 51,321 | |
The accompanying notes are an integral part of these financial statements.
59
Alpine High Yield Managed Duration Municipal Fund
Schedule of Portfolio Investments—Continued
October 31, 2015
Principal
Amount | | | Security
Description | | Value | |
| | | | | | | |
| Municipal Bonds—continued | | | | |
| Indiana—continued | | | | |
| $ | 545,000 | | | Indiana Finance Authority, United States Steel Corp.
6.000%, 12/01/2026 | | $ | 540,193 | |
| | | | | | | | 2,232,817 | |
| Iowa —1.7% | | | | |
| | 100,000 | | | City of Coralville, Certificate of Participation—Series D
5.250%, 06/01/2022 | | | 100,355 | |
| | 350,000 | | | Iowa Finance Authority, Midwestern Disaster Area Revenue, Iowa Fert. Co.
5.000%, 12/01/2019 | | | 369,905 | |
| | 520,000 | | | Iowa Higher Education Loan Authority, Wartburg College Project
2.500%, 10/01/2020 | | | 512,179 | |
| | | | | | | | 982,439 | |
| Kansas—3.9% | | | | |
| | 800,000 | | | Kansas Independent College Finance Authority, Revenue Anticipation Notes, Bethany College—Series A
5.250%, 05/01/2016 | | | 803,904 | |
| | 1,000,000 | | | Kansas Independent College Finance Authority, Revenue Anticipation Notes, Ottawa University—Series C
4.850%, 05/01/2016 | | | 1,004,700 | |
| | 260,000 | | | Overland Park Development Corp. Revenue, Second Tier Convention Center Hotel—Series B (CS: AMBAC)
5.125%, 01/01/2022 | | | 267,223 | |
| | 200,000 | | | Wichita Health Care Facilities Revenue, Temps-80-Presbyterian Manors—Series IV-B-1
4.250%, 11/15/2021 | | | 200,014 | |
| | | | | | | | 2,275,841 | |
| Louisiana—0.9% | | | | |
| | 250,000 | | | Louisiana Local Government Environmental Facilities & Community Development Authority, St James Place of Baton Rouge—Series A
5.500%, 11/15/2025 | | | 253,403 | |
| | 250,000 | | | Parish of St. Charles, Gulf Opportunity Zone Revenue, Valero Energy Corp.
4.000%, 12/01/2040 (Putable on 06/01/2022) (b) | | | 266,195 | |
| | | | | | | | 519,598 | |
| Maryland—3.7% | | | | |
| | 110,000 | | | Anne Arundel County, Consolidated Special Taxing District Bonds, Villages at Two Rivers Project
4.200%, 07/01/2024 | | | 111,710 | |
Principal
Amount | | | Security
Description | | Value | |
| | | | | | | |
| Municipal Bonds—continued | | | | |
| Maryland—continued | | | | |
| $ | 500,000 | | | City of Westminster, Lutheran Village at Miller’s Grant, Inc.—Series C
4.375%, 07/01/2021 | | $ | 519,140 | |
| | 500,000 | | | City of Westminster, Lutheran Village at Miller’s Grant, Inc.—Series D
3.875%, 07/01/2019 | | | 509,470 | |
| | 1,060,000 | | | Maryland Economic Development Corp., CNX Marine Terminal, Inc.
5.750%, 09/01/2025 | | | 1,051,287 | |
| | | | | | | | 2,191,607 | |
| Massachusetts—0.9% | | | | |
| | 450,000 | | | Massachusetts Port Authority Facilities Revenue, Delta Air Lines, Inc. Project—Series A (CS: AMBAC)
5.000%, 01/01/2021 | | | 451,521 | |
| | 30,000 | | | Massachusetts Port Authority Facilities Revenue, Delta Air Lines, Inc. Project—Series A (CS: AMBAC)
5.500%, 01/01/2017 | | | 30,114 | |
| | 50,000 | | | Massachusetts Port Authority Facilities Revenue, Delta Air Lines, Inc. Project—Series A (CS: AMBAC)
5.500%, 01/01/2022 | | | 50,186 | |
| | | | | | | | 531,821 | |
| Michigan—4.9% | | | | |
| | 125,000 | | | Charyl Stockwell Academy Revenue
4.875%, 10/01/2023 | | | 122,944 | |
| | 385,000 | | | Jackson College Dormitories, College Housing Revenue
5.000%, 05/01/2021 | | | 379,556 | |
| | 700,000 | | | Michigan Finance Authority, Detroit School District
4.750%, 06/01/2016 (a) | | | 706,286 | |
| | 895,000 | | | Michigan Strategic Fund Revenue, Genesee Power Station Project
7.500%, 01/01/2021 | | | 880,295 | |
| | 200,000 | | | Michigan Strategic Fund Revenue, United Methodist Retirement Communities, Inc. Project
5.125%, 11/15/2025 | | | 206,706 | |
| | 625,000 | | | Michigan Tobacco Settlement Finance Authority—Series A
5.125%, 06/01/2022 | | | 569,581 | |
| | | | | | | | 2,865,368 | |
| Minnesota—2.6% | | | | |
| | 540,000 | | | City of Blaine Revenue, Crest View Senior Community Project— Series A
5.125%, 07/01/2025 | | | 554,245 | |
| | 145,000 | | | City of Hugo, Charter School Lease Revenue, Noble Academy Project—Series A
4.000%, 07/01/2020 | | | 149,852 | |
The accompanying notes are an integral part of these financial statements.
60
Alpine High Yield Managed Duration Municipal Fund
Schedule of Portfolio Investments—Continued
October 31, 2015
Principal
Amount | | | Security
Description | | Value | |
| | | | | | | |
| Municipal Bonds—continued | | | | |
| Minnesota—continued | | | | |
| $ | 300,000 | | | City of Oak Park Heights, Nursing Home Revenue, Boutwells Landing Care Center Project
4.000%, 02/01/2020 | | $ | 310,764 | |
| | 500,000 | | | Rice County Revenue, St. Mary’s School—Series A
5.000%, 08/01/2022 (a) | | | 513,735 | |
| | | | | | | | 1,528,596 | |
| Nevada—0.4% | | | | |
| | 250,000 | | | City of North Las Vegas, Refunding Bonds, Water and Sewer System—Series B (CS: AMBAC)
4.000%, 08/01/2017 | | | 249,993 | |
| New Hampshire—0.4% | | | | |
| | 250,000 | | | New Hampshire Business Finance Authority, Casella Waste Systems, Inc. Project
4.000%, 04/01/2029 (Putable on 10/01/2019) (a)(b) | | | 251,703 | |
| New Jersey—4.6% | | | | |
| | 415,000 | | | Atlantic City Municipal Utilities Authority, Refunding Water System—Series 2007 (CS: AMBAC)
4.000%, 06/01/2018 | | | 415,116 | |
| | 400,000 | | | City of Paterson, Bond Anticipation Notes
5.000%, 12/15/2015 | | | 400,488 | |
| | 100,000 | | | New Jersey Economic Development Authority, Charter School Revenue, Greater Brunswick Charter School Project—Series A
4.750%, 08/01/2024 (a) | | | 100,920 | |
| | 500,000 | | | New Jersey Economic Development Authority, Lions Gate Project— Series 2014
4.375%, 01/01/2024 | | | 509,150 | |
| | 125,000 | | | New Jersey Economic Development Authority, Private Activity— The Goethals Bridge Replacement Project
5.250%, 01/01/2025 | | | 142,496 | |
| | 55,000 | | | New Jersey Economic Development Authority, United Airlines, Inc. Project
5.500%, 04/01/2028 | | | 55,168 | |
| | 450,000 | | | New Jersey Tobacco Settlement Financing Corp. Revenue— Series A
4.500%, 06/01/2023 | | | 453,047 | |
| | 5,000 | | | Tobacco Settlement Financing Corp. Revenue—Series 1-A
4.625%, 06/01/2026 | | | 4,887 | |
| | 586,167 | | | Township of Irvington, Bond Anticipation Notes
3.250%, 06/17/2016 | | | 588,324 | |
| | | | | | | | 2,669,596 | |
Principal
Amount | | | Security
Description | | Value | |
| | | | | | | |
| Municipal Bonds—continued | | | | |
| New York—5.5% | | | | |
| $ | 600,000 | | | Nassau County Tobacco Settlement Corp. Revenue, Asset Brookfield—Series A-2
5.250%, 06/01/2026 (Putable on 06/01/2026) | | $ | 602,142 | |
| | 100,000 | | | New York City Industrial Development Agency Revenue, American Airlines, Inc.
7.500%, 08/01/2016 | | | 104,459 | |
| | 500,000 | | | New York City Industrial Development Agency Revenue, American Airlines, Inc.—Series B
2.000%, 08/01/2028 (Putable on 08/01/2016) (b) | | | 500,985 | |
| | 600,000 | | | New York City Transitional Finance Authority, Future Tax Secured Revenue—Second—SubSeries A-3 (SPA: Dexia Credit Local)
0.300%, 08/01/2023 (Putable on 11/02/2015) (b) | | | 600,000 | |
| | 300,000 | | | New York State Dormitory Authority, Orange Regional Medical Center
6.000%, 12/01/2016 | | | 314,736 | |
| | 100,000 | | | New York State Dormitory Authority, Pace University— Series A
4.000%, 05/01/2016 | | | 101,141 | |
| | 440,000 | | | New York State Dormitory Authority, Yeshiva University— Series A
5.000%, 11/01/2018 | | | 477,219 | |
| | 100,000 | | | Onondaga Civic Development Corp., St Joseph’s Hospital Health Center Project—Series A
4.625%, 07/01/2022 | | | 105,338 | |
| | 100,000 | | | Onondaga Civic Development Corp., St Joseph’s Hospital Health Center Project—Series A
5.000%, 07/01/2019 | | | 108,142 | |
| | 300,000 | | | TSASC, Inc.—Series 1
5.000%, 06/01/2026 | | | 303,903 | |
| | | | | | | | 3,218,065 | |
| North Carolina—0.9% | | | | |
| | 500,000 | | | North Carolina Capital Facilities Finance Agency, Solid Waste Disposal Revenue, Republic Services, Inc. Project—Series B
0.600%, 12/01/2020 (Putable on 12/01/2015) (b) | | | 500,005 | |
| North Dakota—0.5% | | | | |
| | 300,000 | | | City of Bowman, Southwest Healthcare Services Project, Revenue Anticipation Notes— Series A
2.500%, 02/15/2017 | | | 300,063 | |
The accompanying notes are an integral part of these financial statements.
61
Alpine High Yield Managed Duration Municipal Fund
Schedule of Portfolio Investments—Continued
October 31, 2015
Principal
Amount | | | Security
Description | | Value | |
| | | | | | | | | |
| Municipal Bonds—continued | | | | |
| Ohio—5.2% | | | | |
| $ | 910,000 | | | Buckeye Tobacco Settlement Financing Authority—Series A
5.125%, 06/01/2024 | | $ | 812,839 | |
| | 100,000 | | | Buckeye Tobacco Settlement Financing Authority—Series A-2
5.375%, 06/01/2024 | | | 91,067 | |
| | 400,000 | | | City of Cleveland, Airport Special Revenue, United Airlines, Inc.
5.375%, 09/15/2027 | | | 401,732 | |
| | 195,000 | | | City of Cleveland, Airport Special Revenue, United Airlines, Inc.
5.700%, 12/01/2019 | | | 196,976 | |
| | 300,000 | | | Licking County Revenue, Kendal Granville Obligation Group— Series B
3.750%, 07/01/2020 | | | 300,207 | |
| | 200,000 | | | Ohio Air Quality Development Authority, AK Steel Corp. Project
6.750%, 06/01/2024 | | | 178,972 | |
| | 200,000 | | | Ohio Air Quality Development Authority, FirstEnergy Nuclear Generation Project—Series C
3.950%, 11/01/2032 (Putable on 05/01/2020) (b) | | | 206,568 | |
| | 300,000 | | | Ohio State Water Development Authority—Series B
4.000%, 01/01/2034 (Putable on 07/01/2021) (b) | | | 306,546 | |
| | 265,000 | | | Southeastern Ohio Port Authority, Memorial Health System
5.000%, 12/01/2016 | | | 272,807 | |
| | 250,000 | | | State Air Quality Development Authority, United States Steel Corp. Project
5.375%, 11/01/2015 | | | 250,000 | |
| | | | | | | | 3,017,714 | |
| Oklahoma—0.1% | | | | |
| | 50,000 | | | Tulsa Industrial Authority—Series A (CS: NATL-RE)
6.000%, 10/01/2016 | | | 52,484 | |
| Oregon—0.3% | | | | |
| | 80,000 | | | Hospital Facilities Authority of Multnomah County Oregon, Mirabella At South Waterfront Project—Series A
5.000%, 10/01/2019 | | | 84,983 | |
| | 100,000 | | | Hospital Facilities Authority of Multnomah County Oregon, Mirabella At South Waterfront Project—Series A
5.000%, 10/01/2024 | | | 110,505 | |
| | | | | | | | 195,488 | |
| Pennsylvania—6.6% | | | | |
| | 1,275,000 | | | Allegheny County Industrial Development Authority, Environmental Improvement Revenue, United States Steel Corp.
5.500%, 11/01/2016 | | | 1,285,136 | |
Principal
Amount | | | Security
Description | | Value | |
| | | | | | | | | |
| Municipal Bonds—continued | | | | |
| Pennsylvania—continued | | | | |
| $ | 50,000 | | | Allegheny County Industrial Development Authority, Environmental Improvement Revenue, United States Steel Corp.
6.500%, 05/01/2017 | | $ | 51,202 | |
| | 100,000 | | | Indiana County Hospital Authority, Regional Medical Center— Series A
5.000%, 06/01/2023 | | | 109,624 | |
| | 400,000 | | | Moon Industrial Development Authority, Baptist Homes Society Obligation
5.000%, 07/01/2020 | | | 413,220 | |
| | 400,000 | | | Pennsylvania Economic Development Financing Authority, Colver Project
5.000%, 12/01/2037 (Putable on 09/01/2020) (b) | | | 403,552 | |
| | 200,000 | | | Pennsylvania Economic Development Financing Authority, Colver Project—Series F (CS: AMBAC)
5.000%, 12/01/2015 | | | 200,608 | |
| | 420,000 | | | Pennsylvania Economic Development Financing Authority, Colver Project— Series G
5.125%, 12/01/2015 | | | 421,377 | |
| | 140,000 | | | Philadelphia Authority for Industrial Development, Discovery Charter School Project
4.000%, 04/01/2017 | | | 139,730 | |
| | 380,000 | | | Philadelphia Hospitals & Higher Education Facilities Authority, Refunding—Temple University Health System—Series B
5.500%, 07/01/2026 | | | 393,365 | |
| | 200,000 | | | Pottsville Hospital Facilities Authority, Schuylkill Health System Project
5.750%, 07/01/2022 | | | 207,282 | |
| | 240,000 | | | York, PA City School District— Series A (CS: XLCA)
4.500%, 06/01/2016 | | | 240,211 | |
| | | | | | | | 3,865,307 | |
| Puerto Rico—4.5% | | | | |
| | 210,000 | | | Commonwealth of Puerto Rico (CS: Assured Guaranty Municipal)
5.500%, 07/01/2018 | | | 218,658 | |
| | 500,000 | | | Commonwealth of Puerto Rico— Series A (CS: NATL-RE)
5.500%, 07/01/2020 | | | 511,075 | |
| | 15,000 | | | Commonwealth of Puerto Rico, General Obligation Bonds (CS: Assured Guaranty Municipal)
5.250%, 07/01/2016 | | | 15,327 | |
The accompanying notes are an integral part of these financial statements.
62
Alpine High Yield Managed Duration Municipal Fund
Schedule of Portfolio Investments—Continued
October 31, 2015
Principal
Amount | | | Security
Description | | Value | |
| | | | | | | | | |
| Municipal Bonds—continued | | | | |
| Puerto Rico—continued | | | | |
| $ | 150,000 | | | Commonwealth of Puerto Rico, General Obligation Bonds (CS: NATL-RE)
6.000%, 07/01/2016 | | $ | 153,401 | |
| | 115,000 | | | Commonwealth of Puerto Rico, Public Improvement (CS: Assured Guaranty Municipal)
5.500%, 07/01/2019 | | | 119,615 | |
| | 300,000 | | | Commonwealth of Puerto Rico, Public Improvement—Series A (CS: Assured Guaranty Municipal)
5.000%, 07/01/2017 | | | 308,151 | |
| | 425,000 | | | Commonwealth of Puerto Rico, Public Improvement—Series A (CS: NATL-RE)
5.500%, 07/01/2016 | | | 433,258 | |
| | 150,000 | | | Commonwealth of Puerto Rico, Public Improvement—Series A (CS: NATL-RE)
5.500%, 07/01/2018 | | | 155,497 | |
| | 245,000 | | | Government Development Bank for Puerto Rico Revenue (CS: NATL-RE)
4.750%, 12/01/2015 | | | 245,367 | |
| | 200,000 | | | Puerto Rico Electric Power Authority—Series LL (CS: NATL-RE)
5.500%, 07/01/2017 | | | 207,044 | |
| | 160,000 | | | Puerto Rico Industrial Development Company Revenue—Series B (CS: NATL-RE)
5.375%, 07/01/2016 | | | 160,384 | |
| | 120,000 | | | Puerto Rico Public Buildings Authority, Government Facilities—Series C
5.750%, 07/01/2018 | | | 82,055 | |
| | | | | | | | 2,609,832 | |
| Rhode Island—0.2% | | | | |
| | 100,000 | | | Rhode Island Health & Educational Building Corp. Revenue, Hospital Financing—Care New England— Series A
5.000%, 09/01/2021 | | | 107,838 | |
| South Carolina—0.6% | | | | |
| | 85,000 | | | Clarendon Hospital District, General Obligation
4.250%, 04/01/2017 | | | 85,054 | |
| | 85,000 | | | Clarendon Hospital District, General Obligation
4.500%, 04/01/2018 | | | 85,479 | |
| | 90,000 | | | Clarendon Hospital District, General Obligation
5.000%, 04/01/2016 | | | 90,301 | |
| | 65,000 | | | South Carolina Jobs—Economic Development Authority, Palmetto Health
5.000%, 08/01/2019 | | | 72,392 | |
| | | | | | | | 333,226 | |
Principal
Amount | | | Security
Description | | Value | |
| | | | | | | | | |
| Municipal Bonds—continued | | | | |
| Tennessee—3.1% | | | | |
| $ | 1,430,000 | | | Sevier County Public Building Authority, Local Government Public Improvement (CS: AMBAC, LOC: KBC Bank NV)
2.700%, 06/01/2026 (Putable on 11/05/2015) (b) | | $ | 1,430,000 | |
| | 345,000 | | | Tennessee Energy Acquisition Corp. Revenue—Series A (CS: Goldman Sachs & Co.)
5.250%, 09/01/2018 | | | 381,963 | |
| | | | | | | | 1,811,963 | |
| Texas —5.4% | | | | |
| | 150,000 | | | City of Houston Airport System, United Airlines, Inc.—Series C
5.000%, 07/15/2020 | | | 159,327 | |
| | 200,000 | | | City of Houston Airport System, United Airlines, Inc. Terminal E Project
4.500%, 07/01/2020 | | | 209,308 | |
| | 1,045,000 | | | Dallas-Fort Worth International Airport Facilities Improvement Corp., Learjet, Inc.—Series A-1
6.150%, 01/01/2016 | | | 1,047,738 | |
| | 75,000 | | | Decatur Hospital Authority, Wise Regional Health System.— Series A
5.000%, 09/01/2023 | | | 82,369 | |
| | 170,000 | | | Harris County Cultural Education Facilities Finance Corp. Revenue, Willow Winds Project—Series A
5.000%, 10/01/2023 | | | 182,328 | |
| | 210,000 | | | Orchard Higher Education Finance Corp. Revenue, Nyos Charter School, Inc.—Series A
4.875%, 02/15/2023 | | | 210,069 | |
| | 150,000 | | | Red River Health Facilities Development Corp. Revenue, TEMPS-MRC Crossings Project— Series B-1
6.125%, 11/15/2020 | | | 150,156 | |
| | 100,000 | | | Red River Health Facilities Development Corp. Revenue, TEMPS-MSC Crossings Project— Series B-2
5.000%, 11/15/2019 | | | 100,151 | |
| | 80,000 | | | SA Energy Acquisition Public Facility Corp. Revenue, Gas Supply Revenue (CS: Goldman Sachs & Co.)
5.500%, 08/01/2022 | | | 94,802 | |
| | 50,000 | | | SA Energy Acquisition Public Facility Corp. Revenue, Gas Supply Revenue (CS: Goldman Sachs & Co.)
5.500%, 08/01/2023 | | | 59,797 | |
| | 500,000 | | | Tarrant County Cultural Education Facilities Finance Corp. Revenue, Buckingham Senior Living Project
3.875%, 11/15/2020 | | | 504,105 | |
The accompanying notes are an integral part of these financial statements.
63
Alpine High Yield Managed Duration Municipal Fund
Schedule of Portfolio Investments—Continued
October 31, 2015
Principal
Amount | | | Security
Description | | Value | |
| | | | | | | | | |
| Municipal Bonds—continued | | | | |
| Texas—continued | | | | |
| $ | 200,000 | | | Texas Municipal Gas Acquisition & Supply Corp. I Revenue, Sr. Lien—Series D (CS: Merrill Lynch)
6.250%, 12/15/2026 | | $ | 242,252 | |
| | 100,000 | | | Texas Public Finance Authority, Refunding, Southern University Financing System
5.000%, 11/01/2021 | | | 112,586 | |
| | | | | | | | 3,154,988 | |
| Utah—1.1% | | | | |
| | 160,000 | | | Utah Charter School Finance, George Washington Academy— Series A
6.375%, 07/15/2018 | | | 169,981 | |
| | 470,000 | | | Utah County Environmental Improvement Revenue, US Corp. Project
5.375%, 11/01/2015 | | | 470,000 | |
| | | | | | | | 639,981 | |
| Vermont—0.7% | | | | |
| | 400,000 | | | Vermont Student Assistance Corp. Education Loan Revenue— Series A
3.000%, 06/15/2019 | | | 415,648 | |
| Washington—3.2% | | | | |
| | 425,000 | | | Chelan County Development Corp., Pollution Control Alcoa Project
5.850%, 12/01/2031 | | | 425,004 | |
| | 205,000 | | | Washington Housing Finance Commission Revenue, Presbyterian Retirement Communities Northwest Project
5.000%, 01/01/2023 | | | 214,775 | |
| | 400,000 | | | Washington Housing Finance Commission, Rockwood Retirement Communities Project—Series B-1
5.875%, 01/01/2021 (a) | | | 400,560 | |
| | 800,000 | | | Washington Housing Finance Commission, TEMPS 65— Heron’s Key Senior Living
4.875%, 01/01/2022 (a) | | | 811,600 | |
| | | | | | | | 1,851,939 | |
Principal
Amount | | | Security
Description | | Value | |
| | | | | | | | | |
| Municipal Bonds—continued | | | | |
| Wisconsin—1.1% | | | | |
| $ | 200,000 | | | Public Finance Authority, Church Home Of Hartford
5.000%, 09/01/2025 (a) | | $ | 209,802 | |
| | 215,000 | | | Public Finance Authority, Senior Living Rose Villa Project— Series B
4.500%, 11/15/2020 | | | 215,352 | |
| | 205,000 | | | Wisconsin Public Finance Authority, Roseman University of Health Sciences Project
5.000%, 04/01/2022 | | | 213,559 | |
| | | | | | | | 638,713 | |
| | | | | Total Municipal Bonds
(Cost $56,538,787) | | | 57,112,911 | |
| | | | | | | | | |
| Shares | | | | | | | |
| Money Market Funds—0.1% | | | | |
| | 81,092 | | | Federated Municipal Obligation Fund, 0.01% | | | 81,092 | |
| | | | | Total Money Market Funds
(Cost $81,092) | | | 81,092 | |
Total Investments
(Cost $56,619,879) (c)—97.9% | | | 57,194,003 | |
| Other Assets in Excess of Liabilities—2.1% | | | 1,236,429 | |
| TOTAL NET ASSETS 100.0% | | $ | 58,430,432 | |
Percentages are stated as a percent of net assets.
| (a) | Restricted under Rule 144A of the Securities Act of 1933. These securities may be resold in transactions exempt from registration, normally to qualified institutional buyers. These securities have been determined to be liquid under guidelines established by the Board of Trustees. Liquid securities restricted under Rule 144A comprised 9.2% of the Fund’s net assets. |
| (b) | Variable Rate Security—The rate reported is the rate in effect as of October 31, 2015. |
| (c) | See Note 7 for the cost of investments for federal tax purposes. |
AMBAC—American Municipal Bond Assurance Corp.
ARN—Auction Rate Note
CS—Credit Support
NATL-RE—Reinsurance provided by National Public Finance Guarantee Corp.
SPA—Standby Purchase Agreement
XLCA—XL Capital Assurance, Inc.
The accompanying notes are an integral part of these financial statements.
64
Alpine Mutual Funds
Statements of Assets and Liabilities
October 31, 2015
| | | Dynamic
Dividend
Fund | | Rising
Dividend
Fund | | Financial
Services
Fund |
| ASSETS: | | | | | | | | | | | | | | | | | | |
| Investments, at value(1) | | | $ | 185,732,938 | | | | | $ | 90,920,913 | | | | | $ | 23,777,211 | | |
| Foreign currencies, at value(2) | | | | 401,933 | | | | | | — | | | | | | 534 | | |
| Cash | | | | 420 | | | | | | 136 | | | | | | 72,252 | | |
| Receivable from investment securities sold | | | | 2,849,896 | | | | | | 5,744,128 | | | | | | 4,214,661 | | |
| Dividends and interest receivable | | | | 679,625 | | | | | | 130,893 | | | | | | 22,737 | | |
| Receivable from capital shares issued | | | | 53,017 | | | | | | 414 | | | | | | 32,038 | | |
| Unrealized appreciation on forward currency contracts | | | | 635,394 | | | | | | — | | | | | | 27,942 | | |
| Due from Adviser | | | | — | | | | | | 3,736 | | | | | | 59,222 | | |
| Prepaid expenses and other assets | | | | 23,144 | | | | | | 21,761 | | | | | | 2,493 | | |
| Total assets | | | | 190,376,367 | | | | | | 96,821,981 | | | | | | 28,209,090 | | |
| | | | | | | | | | | | | | | | | | | |
| LIABILITIES: | | | | | | | | | | | | | | | | | | |
| Payable for investment securities purchased | | | | 3,255,413 | | | | | | 4,161,788 | | | | | | 2,760,904 | | |
| Payable for distributions to shareholders | | | | 307,332 | | | | | | — | | | | | | — | | |
| Unrealized depreciation on forward currency contracts | | | | 62,591 | | | | | | — | | | | | | 25,522 | | |
| Payable for capital shares redeemed | | | | 231,840 | | | | | | 45 | | | | | | 22,251 | | |
| Written options contracts, at value(3) | | | | — | | | | | | 1,200 | | | | | | — | | |
| Accrued expenses and other liabilities: | | | | | | | | | | | | | | | | | | |
| Investment advisory fees | | | | 155,815 | | | | | | 76,777 | | | | | | 21,392 | | |
| Distribution fees | | | | 6,673 | | | | | | 15,755 | | | | | | 3,464 | | |
| Trustee fees | | | | 6,947 | | | | | | 3,317 | | | | | | 971 | | |
| Other | | | | 300,615 | | | | | | 79,382 | | | | | | 79,430 | | |
| Total liabilities | | | | 4,327,226 | | | | | | 4,338,264 | | | | | | 2,913,934 | | |
| Net Assets | | | $ | 186,049,141 | | | | | $ | 92,483,717 | | | | | $ | 25,295,156 | | |
| | | | | | | | | | | | | | | | | | | |
| NET ASSETS REPRESENTED BY: | | | | | | | | | | | | | | | | | | |
| Paid-in-capital | | | $ | 1,265,223,718 | | | | | $ | 78,873,899 | | | | | $ | 22,409,331 | | |
| Undistributed (accumulated) net investment income (loss) | | | | (353,948 | ) | | | | | 10,950 | | | | | | 225,763 | | |
| Accumulated net realized gain (loss) from investments and foreign currency transactions | | | | (1,090,502,519 | ) | | | | | 499,103 | | | | | | (501,214 | ) | |
| Net unrealized appreciation/(depreciation) on: | | | | | | | | | | | | | | | | | | |
| Investments | | | | 11,161,923 | | | | | | 13,086,734 | | | | | | 3,161,470 | | |
| Foreign currency translations | | | | 519,967 | | | | | | 5 | | | | | | (194 | ) | |
| Written options contracts | | | | — | | | | | | 13,026 | | | | | | — | | |
| Net Assets | | | $ | 186,049,141 | | | | | $ | 92,483,717 | | | | | $ | 25,295,156 | | |
| Net asset value | | | | | | | | | | | | | | | | | | |
| Institutional Class | | | | | | | | | | | | | | | | | | |
| Net assets | | | $ | 182,038,889 | | | | | $ | 90,125,611 | | | | | $ | 19,451,554 | | |
| Shares outstanding | | | | 48,865,772 | | | | | | 5,986,979 | | | | | | 1,497,675 | | |
| Net asset value, offering price and redemption price per share* | | | $ | 3.73 | | | | | $ | 15.05 | | | | | $ | 12.99 | | |
| Class A | | | | | | | | | | | | | | | | | | |
| Net assets | | | $ | 4,010,252 | | | | | $ | 2,358,106 | | | | | $ | 5,843,602 | | |
| Shares outstanding | | | | 1,075,414 | | | | | | 156,693 | | | | | | 453,380 | | |
| Net asset value per share | | | $ | 3.73 | | | | | $ | 15.05 | | | | | $ | 12.89 | | |
| Maximum offering price per share (net asset value plus sales charge of 5.50% of offering price) | | | $ | 3.95 | | | | | $ | 15.93 | | | | | $ | 13.64 | | |
| * If applicable, redemption price per share may be reduced by a redemption fee | | | | | | | | | | | | | | | | | | |
| (1) Total cost of investments | | | $ | 174,571,015 | | | | | $ | 77,834,179 | | | | | $ | 20,615,741 | | |
| (2) Total cost of foreign currencies | | | $ | 401,202 | | | | | $ | — | | | | | $ | 943 | | |
| (3) Premiums received for written options contracts | | | $ | — | | | | | $ | 14,226 | | | | | $ | — | | |
The accompanying notes are an integral part of these financial statements.
Alpine Mutual Funds
Statements of Assets and Liabilities—Continued
October 31, 2015
| | | Small Cap
Fund | | Ultra Short
Municipal
Income
Fund | | High Yield
Managed Duration
Municipal Fund |
| ASSETS: | | | | | | | | | | | | | | | | | | |
| Investments, at value(1) | | | $ | 13,976,033 | | | | | $ | 1,027,908,324 | | | | | $ | 57,194,003 | | |
| Cash | | | | 147 | | | | | | — | | | | | | — | | |
| Receivable from investment securities sold | | | | 509,719 | | | | | | — | | | | | | — | | |
| Dividends and interest receivable | | | | — | | | | | | 3,798,337 | | | | | | 884,787 | | |
| Receivable from capital shares issued | | | | 1,534 | | | | | | 1,938,414 | | | | | | 690,981 | | |
| Due from Adviser | | | | 13,044 | | | | | | 402,426 | | | | | | 20,908 | | |
| Prepaid expenses and other assets | | | | 1,202 | | | | | | 58,290 | | | | | | 2,414 | | |
| Total assets | | | | 14,501,679 | | | | | | 1,034,105,791 | | | | | | 58,793,093 | | |
| | | | | | | | | | | | | | | | | | | |
| LIABILITIES: | | | | | | | | | | | | | | | | | | |
| Payable for investment securities purchased | | | | 622,682 | | | | | | 55,000,000 | | | | | | 195,276 | | |
| Payable for distributions to shareholders | | | | — | | | | | | — | | | | | | 45,373 | | |
| Payable for capital shares redeemed | | | | 14 | | | | | | 1,665,946 | | | | | | 6,741 | | |
| Accrued expenses and other liabilities: | | | | | | | | | | | | | | | | | | |
| Investment advisory fees | | | | 11,752 | | | | | | 630,524 | | | | | | 35,536 | | |
| Distribution fees | | | | 1,525 | | | | | | 99,140 | | | | | | 7,336 | | |
| Trustee fees | | | | 502 | | | | | | 33,635 | | | | | | 1,597 | | |
| Other | | | | 36,522 | | | | | | 896,345 | | | | | | 70,802 | | |
| Total liabilities | | | | 672,997 | | | | | | 58,325,590 | | | | | | 362,661 | | |
| Net Assets | | | $ | 13,828,682 | | | | | $ | 975,780,201 | | | | | $ | 58,430,432 | | |
| | | | | | | | | | | | | | | | | | | |
| NET ASSETS REPRESENTED BY: | | | | | | | | | | | | | | | | | | |
| Paid-in-capital | | | $ | 21,986,653 | | | | | $ | 975,956,769 | | | | | $ | 57,859,367 | | |
| Undistributed (accumulated) net investment income (loss) | | | | (62,343 | ) | | | | | (21 | ) | | | | | 252 | | |
| Accumulated net realized loss from investments and foreign currency transactions | | | | (8,051,031 | ) | | | | | (274,399 | ) | | | | | (3,311 | ) | |
| Net unrealized appreciation/(depreciation) on: | | | | | | | | | | | | | | | | | | |
| Investments | | | | (44,597 | ) | | | | | 97,852 | | | | | | 574,124 | | |
| Net Assets | | | $ | 13,828,682 | | | | | $ | 975,780,201 | | | | | $ | 58,430,432 | | |
| Net asset value | | | | | | | | | | | | | | | | | | |
| Institutional Class | | | | | | | | | | | | | | | | | | |
| Net assets | | | $ | 12,673,307 | | | | | $ | 772,307,944 | | | | | $ | 48,260,748 | | |
| Shares outstanding | | | | 858,989 | | | | | | 76,923,458 | | | | | | 4,689,380 | | |
| Net asset value, offering price and redemption price per share* | | | $ | 14.75 | | | | | $ | 10.04 | | | | | $ | 10.29 | | |
| Class A | | | | | | | | | | | | | | | | | | |
| Net assets | | | $ | 1,155,375 | | | | | $ | 203,472,257 | | | | | $ | 10,169,684 | | |
| Shares outstanding | | | | 79,116 | | | | | | 20,152,417 | | | | | | 988,191 | | |
| Net asset value per share | | | $ | 14.60 | | | | | $ | 10.10 | | | | | $ | 10.29 | | |
| Maximum offering price per share (net asset value plus sales charge of 5.50%, 0.50% and 2.50%, respectively, of offering price) | | | $ | 15.45 | | | | | $ | 10.15 | | | | | $ | 10.55 | | |
| * If applicable, redemption price per share may be reduced by a redemption fee | | | | | | | | | | | | | | | | | | |
| (1) Total cost of investments | | | $ | 14,020,630 | | | | | $ | 1,027,810,472 | | | | | $ | 56,619,879 | | |
The accompanying notes are an integral part of these financial statements.
Alpine Mutual Funds
Statements of Operations For the year ended
October 31, 2015
| | | Dynamic
Dividend
Fund | | Rising
Dividend
Fund | | Financial
Services
Fund |
| INVESTMENT INCOME: | | | | | | | | | | | | | | | | | | |
| Dividend income | | | $ | 15,423,503 | | | | | $ | 336,010 | | | | | $ | 603,668 | | |
| Less: Foreign taxes withheld | | | | (177,351 | ) | | | | | (2,032 | ) | | | | | (19,075 | ) | |
| Interest income | | | | — | | | | | | 34 | | | | | | 10 | | |
| Total investment income | | | | 15,246,152 | | | | | | 334,012 | | | | | | 584,603 | | |
| | | | | | | | | | | | | | | | | | | |
| EXPENSES: | | | | | | | | | | | | | | | | | | |
| Investment advisory fee (Note 6) | | | | 2,021,082 | | | | | | 90,987 | | | | | | 290,642 | | |
| Transfer agent fees | | | | 216,445 | | | | | | 9,351 | | | | | | 97,630 | | |
| Distribution fees - Class A (Note 5) | | | | 10,429 | | | | | | 4,918 | | | | | | 16,759 | | |
| Administration fee (Note 6) | | | | 50,565 | | | | | | 2,151 | | | | | | 7,343 | | |
| Registration and filing fees | | | | 33,967 | | | | | | 34,848 | | | | | | 37,477 | | |
| Accounting and custody fees | | | | 93,980 | | | | | | 3,847 | | | | | | 23,408 | | |
| Audit and tax fees | | | | 28,894 | | | | | | 31,366 | | | | | | 33,979 | | |
| Legal fees | | | | — | | | | | | 2,221 | | | | | | 14,116 | | |
| Printing and mailing fees | | | | 29,212 | | | | | | 3,095 | | | | | | 19,266 | | |
| Trustee fees | | | | 8,486 | | | | | | 646 | | | | | | 3,247 | | |
| Interest (Note 2) | | | | 57,034 | | | | | | 98 | | | | | | 9,536 | | |
| Other fees | | | | 19,991 | | | | | | 276 | | | | | | 2,327 | | |
| Total expenses | | | | 2,570,085 | | | | | | 183,804 | | | | | | 555,730 | | |
| Less: Fee waivers and/or expense reimbursements (Note 6) | | | | — | | | | | | (55,991 | ) | | | | | (137,078 | ) | |
| Net expenses | | | | 2,570,085 | | | | | | 127,813 | | | | | | 418,652 | | |
| Net investment income | | | | 12,676,067 | | | | | | 206,199 | | | | | | 165,951 | | |
| | | | | | | | | | | | | | | | | | | |
| NET REALIZED AND UNREALIZED GAIN/(LOSS) ON INVESTMENTS AND FOREIGN CURRENCY: | | | | | | | | | | | | | | | | | | |
| Net realized gain/(loss) from: | | | | | | | | | | | | | | | | | | |
| Investments | | | | 2,094,877 | | | | | | 506,148 | | | | | | (16,039 | ) | |
| Foreign currency transactions | | | | 5,177,818 | | | | | | 882 | | | | | | (41,924 | ) | |
| Net realized gain/(loss) from investments and foreign currency | | | | 7,272,695 | | | | | | 507,030 | | | | | | (57,963 | ) | |
| Change in net unrealized appreciation/(depreciation) on: | | | | | | | | | | | | | | | | | | |
| Investments | | | | (9,954,704 | ) | | | | | (657,874 | ) | | | | | (896,534 | ) | |
| Foreign currency translations | | | | (2,274,026 | ) | | | | | 75 | | | | | | 187 | | |
| Written options contracts | | | | — | | | | | | 13,026 | | | | | | — | | |
| Change in net unrealized depreciation on investments and foreign currency | | | | (12,228,730 | ) | | | | | (644,773 | ) | | | | | (896,347 | ) | |
| Net loss on investments and foreign currency | | | | (4,956,035 | ) | | | | | (137,743 | ) | | | | | (954,310 | ) | |
| Increase (decrease) in net assets from operations | | | $ | 7,720,032 | | | | | $ | 68,456 | | | | | $ | (788,359 | ) | |
The accompanying notes are an integral part of these financial statements.
Alpine Mutual Funds
Statements of Operations—Continued
For the year ended October 31, 2015
| | | Small Cap
Fund | | Ultra Short
Municipal
Income
Fund | | High Yield
Managed Duration
Municipal Fund |
| INVESTMENT INCOME: | | | | | | | | | | | | | | | | | | |
| Dividend income | | | $ | 143,310 | | | | | $ | — | | | | | $ | — | | |
| Less: Foreign taxes withheld | | | | (223 | ) | | | | | — | | | | | | — | | |
| Interest income | | | | 57 | | | | | | 10,204,385 | | | | | | 1,699,886 | | |
| Total investment income | | | | 143,144 | | | | | | 10,204,385 | | | | | | 1,699,886 | | |
| | | | | | | | | | | | | | | | | | | |
| EXPENSES: | | | | | | | | | | | | | | | | | | |
| Investment advisory fee (Note 6) | | | | 142,472 | | | | | | 7,564,188 | | | | | | 296,375 | | |
| Transfer agent fees | | | | 17,740 | | | | | | 524,652 | | | | | | 7,982 | | |
| Distribution fees - Class A (Note 5) | | | | 2,868 | | | | | | 532,322 | | | | | | 9,916 | | |
| Administration fee (Note 6) | | | | 3,491 | | | | | | 248,849 | | | | | | 9,876 | | |
| Registration and filing fees | | | | 35,948 | | | | | | 92,117 | | | | | | 52,657 | | |
| Accounting and custody fees | | | | 4,891 | | | | | | 120,218 | | | | | | 3,581 | | |
| Audit and tax fees | | | | 31,282 | | | | | | 75,146 | | | | | | 31,745 | | |
| Legal fees | | | | 29,529 | | | | | | 179,131 | | | | | | — | | |
| Printing and mailing fees | | | | 3,253 | | | | | | 165,597 | | | | | | — | | |
| Trustee fees | | | | 1,035 | | | | | | 194,540 | | | | | | 6,282 | | |
| Interest (Note 2) | | | | 4 | | | | | | — | | | | | | 9,205 | | |
| Compliance fees | | | | — | | | | | | 73,842 | | | | | | 2,288 | | |
| Insurance fees | | | | 438 | | | | | | 64,290 | | | | | | 728 | | |
| Other fees | | | | — | | | | | | 40,477 | | | | | | 20,162 | | |
| Total expenses | | | | 272,951 | | | | | | 9,875,369 | | | | | | 450,797 | | |
| Less: Fee waivers and/or expense reimbursements (Note 6) | | | | (77,751 | ) | | | | | (4,300,255 | ) | | | | | (115,542 | ) | |
| Net expenses | | | | 195,200 | | | | | | 5,575,114 | | | | | | 335,255 | | |
| Net investment income (loss) | | | | (52,056 | ) | | | | | 4,629,271 | | | | | | 1,364,631 | | |
| | | | | | | | | | | | | | | | | | | |
| NET REALIZED AND UNREALIZED GAIN/(LOSS) ON INVESTMENTS AND FOREIGN CURRENCY: | | | | | | | | | | | | | | | | | | |
| Net realized gain/(loss) from: | | | | | | | | | | | | | | | | | | |
| Investments | | | | (227,094 | ) | | | | | 149,302 | | | | | | (3,311 | ) | |
| Foreign currency transactions | | | | 77 | | | | | | — | | | | | | — | | |
| Net realized gain/(loss) from investments and foreign currency | | | | (227,017 | ) | | | | | 149,302 | | | | | | (3,311 | ) | |
| Change in net unrealized appreciation/(depreciation) on: | | | | | | | | | | | | | | | | | | |
| Investments | | | | 926,881 | | | | | | (14,807 | ) | | | | | (47,109 | ) | |
| Foreign currency translations | | | | 9 | | | | | | — | | | | | | — | | |
| Change in net unrealized appreciation/(depreciation) on investments and foreign currency | | | | 926,890 | | | | | | (14,807 | ) | | | | | (47,109 | ) | |
| Net gain/(loss) on investments and foreign currency | | | | 699,873 | | | | | | 134,495 | | | | | | (50,420 | ) | |
| Increase in net assets from operations | | | $ | 647,817 | | | | | $ | 4,763,766 | | | | | $ | 1,314,211 | | |
The accompanying notes are an integral part of these financial statements.
Alpine Mutual Funds
Statements of Changes in Net Assets
| | | Dynamic Dividend Fund |
| | | Year Ended
October 31, 2015 | | Year Ended
October 31, 2014† |
| OPERATIONS: | | | | | | | | | | | | |
| Net investment income | | | $ | 12,676,067 | | | | | $ | 12,293,652 | | |
| Net realized gain (loss) from: | | | | | | | | | | | | |
| Investments | | | | 2,094,877 | | | | | | 14,026,882 | | |
| Foreign currency transactions | | | | 5,177,818 | | | | | | (511,719 | ) | |
| Change in net unrealized appreciation/(depreciation) on: | | | | | | | | | | | | |
| Investments | | | | (9,954,704 | ) | | | | | (10,709,233 | ) | |
| Foreign currency translations | | | | (2,274,026 | ) | | | | | 2,986,063 | | |
| Increase in net assets from operations | | | | 7,720,032 | | | | | | 18,085,645 | | |
| | | | | | | | | | | | | |
| DISTRIBUTIONS TO SHAREHOLDERS: | | | | | | | | | | | | |
| Distributions to Institutional Class Shareholders: | | | | | | | | | | | | |
| From net investment income | | | | (12,083,554 | ) | | | | | (14,153,741 | ) | |
| Distributions to Class A Shareholders: | | | | | | | | | | | | |
| From net investment income | | | | (244,816 | ) | | | | | (216,650 | ) | |
| Decrease in net assets from distributions to shareholders | | | | (12,328,370 | ) | | | | | (14,370,391 | ) | |
| | | | | | | | | | | | | |
| CAPITAL SHARE TRANSACTIONS (NOTE 3): | | | | | | | | | | | | |
| Net proceeds from shares sold | | | | 14,993,760 | | | | | | 12,437,976 | | |
| Dividends reinvested | | | | 8,502,088 | | | | | | 9,778,810 | | |
| Redemption fees (Note 2) | | | | 2,198 | | | | | | 2,349 | | |
| Cost of shares redeemed | | | | (47,494,989 | ) | | | | | (61,035,034 | ) | |
| Decrease in net assets from capital share transactions | | | | (23,996,943 | ) | | | | | (38,815,899 | ) | |
| Net decrease in net assets | | | | (28,605,281 | ) | | | | | (35,100,645 | ) | |
| | | | | | | | | | | | | |
| NET ASSETS: | | | | | | | | | | | | |
| Beginning of year | | | | 214,654,422 | | | | | | 249,755,067 | | |
| End of year* | | | $ | 186,049,141 | | | | | $ | 214,654,422 | | |
| * Including accumulated net investment loss of: | | | $ | (353,948 | ) | | | | $ | (806,054 | ) | |
| † | Beginning with the year ended October 31, 2015, the Fund was audited by Ernst & Young LLP. The previous year was audited by another independent registered public accounting firm. |
The accompanying notes are an integral part of these financial statements.
Alpine Mutual Funds
Statements of Changes in Net Assets—Continued
| | | Rising Dividend Fund |
| | | Year Ended
October 31, 2015 | | Year Ended
October 31, 2014† |
| OPERATIONS: | | | | | | | | | | | | |
| Net investment income | | | $ | 206,199 | | | | | $ | 156,665 | | |
| Net realized gain (loss) from: | | | | | | | | | | | | |
| Investments | | | | 506,148 | | | | | | 304,552 | | |
| Foreign currency transactions | | | | 882 | | | | | | (320 | ) | |
| Change in net unrealized appreciation/(depreciation) on: | | | | | | | | | | | | |
| Investments | | | | (657,874 | ) | | | | | 96,713 | | |
| Foreign currency translations | | | | 75 | | | | | | (85 | ) | |
| Written options contracts | | | | 13,026 | | | | | | — | | |
| Increase in net assets from operations | | | | 68,456 | | | | | | 557,525 | | |
| | | | | | | | | | | | | |
| DISTRIBUTIONS TO SHAREHOLDERS: | | | | | | | | | | | | |
| Distributions to Institutional Class Shareholders: | | | | | | | | | | | | |
| From net investment income | | | | (170,683 | ) | | | | | (137,419 | ) | |
| From net realized gain on investments | | | | (199,861 | ) | | | | | (130,272 | ) | |
| Distributions to Class A Shareholders: | | | | | | | | | | | | |
| From net investment income | | | | (59,375 | ) | | | | | (24,801 | ) | |
| From net realized gain on investments | | | | (84,793 | ) | | | | | (36,437 | ) | |
| Decrease in net assets from distributions to shareholders | | | | (514,712 | ) | | | | | (328,929 | ) | |
| | | | | | | | | | | | | |
| CAPITAL SHARE TRANSACTIONS (NOTE 3): | | | | | | | | | | | | |
| Net proceeds from shares sold | | | | 3,356,210 | | | | | | 2,365,706 | | |
| Proceeds from shares issued in connection with the tax-free transfer of assets from Alpine Transformations Fund (Note 8) | | | | 7,799,629 | | | | | | — | | |
| Proceeds from shares issued in connection with the tax-free transfer of assets from Alpine Equity Income Fund (Note 8) | | | | 77,440,536 | | | | | | — | | |
| Dividends reinvested | | | | 468,937 | | | | | | 280,216 | | |
| Redemption fees (Note 2) | | | | — | | | | | | 3,169 | | |
| Cost of shares redeemed | | | | (1,485,856 | ) | | | | | (1,861,266 | ) | |
| Increase in net assets from capital share transactions | | | | 87,579,456 | | | | | | 787,825 | | |
| Net increase in net assets | | | | 87,133,200 | | | | | | 1,016,421 | | |
| | | | | | | | | | | | | |
| NET ASSETS: | | | | | | | | | | | | |
| Beginning of year | | | | 5,350,517 | | | | | | 4,334,096 | | |
| End of year* | | | $ | 92,483,717 | | | | | $ | 5,350,517 | | |
| * Including undistributed net investment income of: | | | $ | 10,950 | | | | | $ | 37,167 | | |
| † | Beginning with the year ended October 31, 2015, the Fund was audited by Ernst & Young LLP. The previous year was audited by another independent registered public accounting firm. |
The accompanying notes are an integral part of these financial statements.
Alpine Mutual Funds
Statements of Changes in Net Assets—Continued
| | | Financial Services Fund |
| | | Year Ended
October 31, 2015 | | Year Ended
October 31, 2014† |
| OPERATIONS: | | | | | | | | | | | | |
| Net investment income (loss) | | | $ | 165,951 | | | | | $ | (64,516 | ) | |
| Net realized gain (loss) from: | | | | | | | | | | | | |
| Investments | | | | (16,039 | ) | | | | | 471,953 | | |
| Foreign currency transactions | | | | (41,924 | ) | | | | | (16,673 | ) | |
| Change in net unrealized appreciation/(depreciation) on: | | | | | | | | | | | | |
| Investments | | | | (896,534 | ) | | | | | 2,521,766 | | |
| Foreign currency translations | | | | 187 | | | | | | (399 | ) | |
| Increase (decrease) in net assets from operations | | | | (788,359 | ) | | | | | 2,912,131 | | |
| | | | | | | | | | | | | |
| DISTRIBUTIONS TO SHAREHOLDERS: | | | | | | | | | | | | |
| Distributions to Institutional Class Shareholders: | | | | | | | | | | | | |
| From net investment income | | | | (15,838 | ) | | | | | (7,300 | ) | |
| From net realized gain on investments | | | | (291,458 | ) | | | | | — | | |
| Distributions to Class A Shareholders: | | | | | | | | | | | | |
| From net investment income | | | | (4,306 | ) | | | | | — | | |
| From net realized gain on investments | | | | (79,233 | ) | | | | | — | | |
| Decrease in net assets from distributions to shareholders | | | | (390,835 | ) | | | | | (7,300 | ) | |
| | | | | | | | | | | | | |
| CAPITAL SHARE TRANSACTIONS (NOTE 3): | | | | | | | | | | | | |
| Net proceeds from shares sold | | | | 5,873,328 | | | | | | 57,960,341 | | |
| Dividends reinvested | | | | 218,645 | | | | | | 6,073 | | |
| Redemption fees (Note 2) | | | | 2,385 | | | | | | 7,986 | | |
| Cost of shares redeemed | | | | (15,882,712 | ) | | | | | (45,495,693 | ) | |
| Increase (decrease) in net assets from capital share transactions | | | | (9,788,354 | ) | | | | | 12,478,707 | | |
| Net increase (decrease) in net assets | | | | (10,967,548 | ) | | | | | 15,383,538 | | |
| | | | | | | | | | | | | |
| NET ASSETS: | | | | | | | | | | | | |
| Beginning of year | | | | 36,262,704 | | | | | | 20,879,166 | | |
| End of year* | | | $ | 25,295,156 | | | | | $ | 36,262,704 | | |
| * Including undistributed net investment income of: | | | $ | 225,763 | | | | | $ | 13,349 | | |
| † | Beginning with the year ended October 31, 2015, the Fund was audited by Ernst & Young LLP. The previous year was audited by another independent registered public accounting firm. |
The accompanying notes are an integral part of these financial statements.
Alpine Mutual Funds
Statements of Changes in Net Assets—Continued
| | | Small Cap Fund |
| | | Year Ended
October 31, 2015 | | Year Ended
October 31, 2014† |
| OPERATIONS: | | | | | | | | | | | | |
| Net investment loss | | | $ | (52,056 | ) | | | | $ | (102,990 | ) | |
| Net realized gain (loss) from: | | | | | | | | | | | | |
| Investments | | | | (227,094 | ) | | | | | 4,761,998 | | |
| Foreign currency transactions | | | | 77 | | | | | | (965 | ) | |
| Change in net unrealized appreciation/(depreciation) on: | | | | | | | | | | | | |
| Investments | | | | 926,881 | | | | | | (4,965,266 | ) | |
| Foreign currency translations | | | | 9 | | | | | | (9 | ) | |
| Increase (decrease) in net assets from operations | | | | 647,817 | | | | | | (307,232 | ) | |
| | | | | | | | | | | | | |
| CAPITAL SHARE TRANSACTIONS (NOTE 3): | | | | | | | | | | | | |
| Net proceeds from shares sold | | | | 913,271 | | | | | | 5,361,545 | | |
| Redemption fees (Note 2) | | | | 892 | | | | | | 642 | | |
| Cost of shares redeemed | | | | (2,544,087 | ) | | | | | (2,646,234 | ) | |
| Increase (decrease) in net assets from capital share transactions | | | | (1,629,924 | ) | | | | | 2,715,953 | | |
| Net increase (decrease) in net assets | | | | (982,107 | ) | | | | | 2,408,721 | | |
| | | | | | | | | | | | | |
| NET ASSETS: | | | | | | | | | | | | |
| Beginning of year | | | | 14,810,789 | | | | | | 12,402,068 | | |
| End of year* | | | $ | 13,828,682 | | | | | $ | 14,810,789 | | |
| * Including accumulated net investment loss of: | | | $ | (62,343 | ) | | | | $ | (96,032 | ) | |
| † | Beginning with the year ended October 31, 2015, the Fund was audited by Ernst & Young LLP. The previous year was audited by another independent registered public accounting firm. |
The accompanying notes are an integral part of these financial statements.
Alpine Mutual Funds
Statements of Changes in Net Assets—Continued
| | | Ultra Short Municipal Income Fund |
| | | Year Ended
October 31, 2015 | | Year Ended
October 31, 2014† |
| OPERATIONS: | | | | | | | | | | | | |
| Net investment income | | | $ | 4,629,271 | | | | | $ | 5,360,727 | | |
| Net realized gain from investments | | | | 149,302 | | | | | | 64,603 | | |
| Change in unrealized appreciation (depreciation) on investments | | | | (14,807 | ) | | | | | 1,068,561 | | |
| Increase in net assets from operations | | | | 4,763,766 | | | | | | 6,493,891 | | |
| | | | | | | | | | | | | |
| DISTRIBUTIONS TO SHAREHOLDERS: | | | | | | | | | | | | |
| Distributions to Institutional Class Shareholders: | | | | | | | | | | | | |
| From net investment income | | | | (4,076,167 | ) | | | | | (4,631,945 | ) | |
| Distributions to Class A Shareholders: | | | | | | | | | | | | |
| From net investment income | | | | (553,131 | ) | | | | | (728,776 | ) | |
| Decrease in net assets from distributions to shareholders | | | | (4,629,298 | ) | | | | | (5,360,721 | ) | |
| | | | | | | | | | | | | |
| CAPITAL SHARE TRANSACTIONS (NOTE 3): | | | | | | | | | | | | |
| Net proceeds from shares sold | | | | 366,438,670 | | | | | | 513,952,342 | | |
| Dividends reinvested | | | | 3,637,200 | | | | | | 4,202,899 | | |
| Redemption fees (Note 2) | | | | 16,215 | | | | | | 17,923 | | |
| Cost of shares redeemed | | | | (473,550,338 | ) | | | | | (678,688,579 | ) | |
| Decrease in net assets from capital share transactions | | | | (103,458,253 | ) | | | | | (160,515,415 | ) | |
| Net decrease in net assets | | | | (103,323,785 | ) | | | | | (159,382,245 | ) | |
| | | | | | | | | | | | | |
| NET ASSETS: | | | | | | | | | | | | |
| Beginning of year | | | | 1,079,103,986 | | | | | | 1,238,486,231 | | |
| End of year* | | | $ | 975,780,201 | | | | | $ | 1,079,103,986 | | |
| * Including undistributed (accumulated) net investment income (loss) of: | | | $ | (21 | ) | | | | $ | 6 | | |
| † | Beginning with the year ended October 31, 2015, the Fund was audited by Ernst & Young LLP. The previous year was audited by another independent registered public accounting firm. |
The accompanying notes are an integral part of these financial statements.
Alpine Mutual Funds
Statements of Changes in Net Assets—Continued
| | | High Yield Managed
Duration Municipal Fund |
| | | Year Ended
October 31, 2015 | | Year Ended
October 31, 2014† |
| OPERATIONS: | | | | | | | | | | | | |
| Net investment income | | | $ | 1,364,631 | | | | | $ | 820,544 | | |
| Net realized gain (loss) from investments | | | | (3,311 | ) | | | | | 21,557 | | |
| Change in unrealized appreciation (depreciation) on investments | | | | (47,109 | ) | | | | | 722,871 | | |
| Increase in net assets from operations | | | | 1,314,211 | | | | | | 1,564,972 | | |
| | | | | | | | | | | | | |
| DISTRIBUTIONS TO SHAREHOLDERS: | | | | | | | | | | | | |
| Distributions to Institutional Class Shareholders: | | | | | | | | | | | | |
| From net investment income | | | | (1,240,090 | ) | | | | | (816,850 | ) | |
| From net realized gain on investments | | | | (14,739 | ) | | | | | — | | |
| Distributions to Class A Shareholders: | | | | | | | | | | | | |
| From net investment income | | | | (124,386 | ) | | | | | (3,597 | ) | |
| From net realized gain on investments | | | | (1,479 | ) | | | | | — | | |
| Decrease in net assets from distributions to shareholders | | | | (1,380,694 | ) | | | | | (820,447 | ) | |
| | | | | | | | | | | | | |
| CAPITAL SHARE TRANSACTIONS (NOTE 3): | | | | | | | | | | | | |
| Net proceeds from shares sold | | | | 35,898,673 | | | | | | 4,106,000 | | |
| Dividends reinvested | | | | 1,136,399 | | | | | | 809,176 | | |
| Redemption fees (Note 2) | | | | 4,830 | | | | | | — | | |
| Cost of shares redeemed | | | | (4,216,056 | ) | | | | | (2,015 | ) | |
| Increase in net assets from capital share transactions | | | | 32,823,846 | | | | | | 4,913,161 | | |
| Net increase in net assets | | | | 32,757,363 | | | | | | 5,657,686 | | |
| |
| NET ASSETS: | | | | | | | | | | | | |
| Beginning of year | | | | 25,673,069 | | | | | | 20,015,383 | | |
| End of year* | | | $ | 58,430,432 | | | | | $ | 25,673,069 | | |
| * Including undistributed net investment income of: | | | $ | 252 | | | | | $ | 97 | | |
| † | Beginning with the year ended October 31, 2015, the Fund was audited by Ernst & Young LLP. The previous year was audited by another independent registered public accounting firm. |
The accompanying notes are an integral part of these financial statements.
Alpine Mutual Funds
Financial Highlights
(For a share outstanding throughout each year)
| | | Dynamic Dividend Fund |
| | | Years Ended October 31, |
| | | 2015 | | 2014† | | 2013† | | 2012† | | 2011† | |
| Institutional Class: | | | | | | | | | | | | | | | | | | | | | | | | | | | | | | |
| Net asset value per share, beginning of year | | | $ | 3.83 | | | | | $ | 3.77 | | | | | $ | 3.49 | | | | | $ | 3.84 | | | | | $ | 4.48 | | |
| Income from investment operations: | | | | | | | | | | | | | | | | | | | | | | | | | | | | | | |
| Net investment income | | | | 0.25 | | | | | | 0.21 | | | | | | 0.22 | | | | | | 0.50 | | | | | | 0.49 | | |
| Net realized and unrealized gain (loss) | | | | (0.11 | ) | | | | | 0.09 | | | | | | 0.34 | | | | | | (0.35 | ) | | | | | (0.59 | ) | |
| Total from investment operations | | | | 0.14 | | | | | | 0.30 | | | | | | 0.56 | | | | | | 0.15 | | | | | | (0.10 | ) | |
| Redemption fees | | | | 0.00 | (a) | | | | | 0.00 | (a) | | | | | 0.00 | (a) | | | | | 0.00 | (a) | | | | | 0.00 | (a) | |
| Less distributions: | | | | | | | | | | | | | | | | | | | | | | | | | | | | | | |
| From net investment income | | | | (0.24 | ) | | | | | (0.24 | ) | | | | | (0.28 | ) | | | | | (0.50 | ) | | | | | (0.54 | ) | |
| From net realized gains | | | | (0.00 | )(a) | | | | | — | | | | | | — | | | | | | — | | | | | | — | | |
| Total distributions | | | | (0.24 | ) | | | | | (0.24 | ) | | | | | (0.28 | ) | | | | | (0.50 | ) | | | | | (0.54 | ) | |
| Net asset value per share, end of year | | | $ | 3.73 | | | | | $ | 3.83 | | | | | $ | 3.77 | | | | | $ | 3.49 | | | | | $ | 3.84 | | |
| Total return | | | | 3.59 | % | | | | | 8.09 | % | | | | | 17.02 | % | | | | | 4.46 | % | | | | | (3.48 | )% | |
| Ratios/Supplemental Data: | | | | | | | | | | | | | | | | | | | | | | | | | | | | | | |
| Net Assets at end of year (000) | | | $ | 182,039 | | | | | $ | 210,436 | | | | | $ | 247,276 | | | | | $ | 353,501 | | | | | $ | 460,466 | | |
| Ratio of total expenses to average net assets: | | | | | | | | | | | | | | | | | | | | | | | | | | | | | | |
| Before waivers and/or expense reimbursements (b) | | | | 1.27 | % | | | | | 1.44 | % | | | | | 1.43 | % | | | | | 1.28 | % | | | | | 1.21 | % | |
| After waivers and/or expense reimbursements (c) | | | | 1.27 | % | | | | | 1.38 | % | | | | | 1.38 | % | | | | | — | % | | | | | — | % | |
| Ratio of net investment income to average net assets | | | | 6.28 | % | | | | | 5.30 | % | | | | | 5.78 | % | | | | | 13.17 | % | | | | | 10.39 | % | |
| Portfolio turnover (d) | | | | 111 | % | | | | | 81 | % | | | | | 197 | % | | | | | 258 | % | | | | | 358 | % | |
| † | Beginning with the year ended October 31, 2015, the Fund was audited by Ernst & Young LLP. The previous years were audited by another independent registered public accounting firm. |
| (a) | The amount is less than $0.005 per share. |
| (b) | Ratio of total expenses to average net assets excluding interest expense before waivers and/or expense reimbursements was 1.24%, 1.41%, 1.40%, 1.27% and 1.18% for the years ended October 31, 2015, 2014, 2013, 2012 and 2011, respectively. |
| (c) | Ratio of total expenses to average net assets excluding interest expense after waivers and/or expense reimbursements was 1.24%, 1.35% and 1.35% for the years ended October 31, 2015, 2014 and 2013, respectively. |
| (d) | Portfolio turnover is calculated on the basis of the Fund as a whole, without distinguishing between classes of shares issued. |
The accompanying notes are an integral part of these financial statements.
Alpine Mutual Funds
Financial Highlights—Continued
(For a share outstanding throughout each period)
| | | Dynamic Dividend Fund |
| | | | | | | | | | | | | | | | | | Period | |
| | | | | | | | | | | | | | | | | | Ended | |
| | | Years Ended October 31, | | | October 31, | |
| | | 2015 | | 2014† | | 2013† | | 2012 †(a) | |
| Class A: | | | | | | | | | | | | | | | | | | | | | | | | |
| Net asset value per share, beginning of period | | | $ | 3.83 | | | | | $ | 3.77 | | | | | $ | 3.49 | | | | | $ | 3.61 | | |
| Income from investment operations: | | | | | | | | | | | | | | | | | | | | | | | | |
| Net investment income | | | | 0.24 | | | | | | 0.17 | | | | | | 0.23 | | | | | | 0.35 | | |
| Net realized and unrealized gain (loss) | | | | (0.11 | ) | | | | | 0.12 | | | | | | 0.33 | | | | | | (0.06 | ) | |
| Total from investment operations | | | | 0.13 | | | | | | 0.29 | | | | | | 0.56 | | | | | | 0.29 | | |
| Redemption fees | | | | 0.00 | (b) | | | | | 0.00 | (b) | | | | | 0.00 | (b) | | | | | 0.00 | (b) | |
| Less distributions: | | | | | | | | | | | | | | | | | | | | | | | | |
| From net investment income | | | | (0.23 | ) | | | | | (0.23 | ) | | | | | (0.28 | ) | | | | | (0.41 | ) | |
| From net realized gains | | | | (0.00 | )(b) | | | | | — | | | | | | — | | | | | | — | | |
| Total distributions | | | | (0.23 | ) | | | | | (0.23 | ) | | | | | (0.28 | ) | | | | | (0.41 | ) | |
| Net asset value per share, end of period | | | $ | 3.73 | | | | | $ | 3.83 | | | | | $ | 3.77 | | | | | $ | 3.49 | | |
| Total return | | | | 3.34 | % | | | | | 7.83 | % | | | | | 16.73 | % | | | | | 8.36 | %(c) | |
| Ratios/Supplemental Data | | | | | | | | | | | | | | | | | | | | | | | | |
| Net Assets at end of period (000) | | | $ | 4,010 | | | | | $ | 4,219 | | | | | $ | 2,479 | | | | | $ | 1,612 | | |
| Ratio of total expenses to average net assets: | | | | | | | | | | | | | | | | | | | | | | | | |
| Before waivers and/or expense reimbursements (d) | | | | 1.52 | % | | | | | 1.69 | % | | | | | 1.68 | % | | | | | 1.56 | %(e) | |
| After waivers and/or expense reimbursements (f) | | | | 1.52 | % | | | | | 1.63 | % | | | | | 1.63 | % | | | | | — | % | |
| Ratio of net investment income to average net assets | | | | 5.95 | % | | | | | 4.51 | % | | | | | 5.38 | % | | | | | 8.02 | %(e) | |
| Portfolio turnover (g) | | | | 111 | % | | | | | 81 | % | | | | | 197 | % | | | | | 258 | % | |
| † | Beginning with the year ended October 31, 2015, the Fund was audited by Ernst & Young LLP. The previous years were audited by another independent registered public accounting firm. |
| (a) | Class A commenced operations on December 30, 2011. |
| (b) | The amount is less than $0.005 per share. |
| (c) | Not annualized. |
| (d) | Ratio of total expenses to average net assets excluding interest expense before waivers and/or expense reimbursements was 1.49%, 1.66% and 1.65% for the years ended October 31, 2015, 2014 and 2013, respectively, and 1.55% for the period ended October 31, 2012. |
| (e) | Annualized. |
| (f) | Ratio of total expenses to average net assets excluding interest expense after waivers and/or expense reimbursements was 1.49%, 1.60% and 1.60% for the years ended October 31, 2015, 2014 and 2013, respectively. |
| (g) | Portfolio turnover is calculated on the basis of the Fund as a whole, without distinguishing between classes of shares issued. |
The accompanying notes are an integral part of these financial statements.
Alpine Mutual Funds
Financial Highlights—Continued
(For a share outstanding throughout each year)
| | | Rising Dividend Fund |
| | | Years Ended October 31, |
| | | 2015 | | 2014† | | 2013† | | 2012† | | 2011† | |
| Institutional Class: | | | | | | | | | | | | | | | | | | | | | | | | | | | | | | |
| Net asset value per share, beginning of year | | | $ | 15.88 | | | | | $ | 15.19 | | | | | $ | 12.88 | | | | | $ | 12.83 | | | | | $ | 12.80 | | |
| Income from investment operations: | | | | | | | | | | | | | | | | | | | | | | | | | | | | | | |
| Net investment income | | | | 0.38 | | | | | | 0.49 | | | | | | 0.51 | | | | | | 0.62 | | | | | | 0.51 | | |
| Net realized and unrealized gain (loss) | | | | (0.02 | ) | | | | | 1.29 | | | | | | 2.65 | | | | | | 0.73 | | | | | | 0.32 | | |
| Total from investment operations | | | | 0.36 | | | | | | 1.78 | | | | | | 3.16 | | | | | | 1.35 | | | | | | 0.83 | | |
| Redemption fees | | | | — | | | | | | 0.01 | | | | | | 0.03 | | | | | | — | | | | | | 0.00 | (a) | |
| Less distributions: | | | | | | | | | | | | | | | | | | | | | | | | | | | | | | |
| From net investment income | | | | (0.50 | ) | | | | | (0.51 | ) | | | | | (0.64 | ) | | | | | (0.50 | ) | | | | | (0.58 | ) | |
| From net realized gains | | | | (0.69 | ) | | | | | (0.59 | ) | | | | | (0.24 | ) | | | | | (0.80 | ) | | | | | (0.22 | ) | |
| Total distributions | | | | (1.19 | ) | | | | | (1.10 | ) | | | | | (0.88 | ) | | | | | (1.30 | ) | | | | | (0.80 | ) | |
| Net asset value per share, end of year | | | $ | 15.05 | | | | | $ | 15.88 | | | | | $ | 15.19 | | | | | $ | 12.88 | | | | | $ | 12.83 | | |
| Total return | | | | 2.16 | % | | | | | 12.25 | % | | | | | 25.94 | % | | | | | 11.28 | % | | | | | 6.43 | % | |
| Ratios/Supplemental Data: | | | | | | | | | | | | | | | | �� | | | | | | | | | | | | | | |
| Net Assets at end of year (000) | | | $ | 90,126 | | | | | $ | 4,486 | | | | | $ | 3,418 | | | | | $ | 2,155 | | | | | $ | 3,218 | | |
| Ratio of total expenses to average net assets: | | | | | | | | | | | | | | | | | | | | | | | | | | | | | | |
| Before waivers and/or expense reimbursements (b) | | | | 1.93 | % | | | | | 2.25 | % | | | | | 3.43 | % | | | | | 3.26 | % | | | | | 2.64 | % | |
| After waivers and/or expense reimbursements (c) | | | | 1.35 | % | | | | | 1.35 | % | | | | | 1.35 | % | | | | | 1.35 | % | | | | | 1.35 | % | |
| Ratio of net investment income to average net assets | | | | 2.14 | % | | | | | 3.33 | % | | | | | 3.94 | % | | | | | 4.52 | % | | | | | 4.09 | % | |
| Portfolio turnover (d) | | | | 97 | % | | | | | 78 | % | | | | | 86 | % | | | | | 73 | % | | | | | 137 | % | |
| † | Beginning with the year ended October 31, 2015, the Fund was audited by Ernst & Young LLP. The previous years were audited by another independent registered public accounting firm. |
| (a) | The amount is less than $0.005 per share. |
| (b) | Ratio of total expenses to average net assets excluding interest expense before waivers and/or expense reimbursements was 1.93%, 2.25%, 3.43%, 3.26% and 2.64% for the years ended October 31, 2015, 2014, 2013, 2012 and 2011, respectively. |
| (c) | Ratio of total expenses to average net assets excluding interest expense after waivers and/or expense reimbursements was 1.35%, 1.35%, 1.35%, 1.35% and 1.35% for the years ended October 31, 2015, 2014, 2013, 2012 and 2011, respectively. |
| (d) | Portfolio turnover is calculated on the basis of the Fund as a whole, without distinguishing between classes of shares issued. |
The accompanying notes are an integral part of these financial statements.
Alpine Mutual Funds
Financial Highlights—Continued
(For a share outstanding throughout each period)
| | | Rising Dividend Fund |
| | | | | | | | | | | | | | | | | | Period | |
| | | | | | | | | | | | | | | | | | Ended | |
| | | Years Ended October 31, | | | October 31, | |
| | | 2015 | | | 2014† | | | 2013† | | | 2012 †(a) | |
| Class A: | | | | | | | | | | | | | | | | | | | | | | | | |
| Net asset value per share, beginning of period | | | $ | 15.88 | | | | | $ | 15.18 | | | | | $ | 12.88 | | | | | $ | 12.02 | | |
| Income from investment operations: | | | | | | | | | | | | | | | | | | | | | | | | |
| Net investment income | | | | 0.43 | | | | | | 0.38 | | | | | | 0.63 | | | | | | 0.31 | | |
| Net realized and unrealized gain (loss) | | | | (0.10 | ) | | | | | 1.37 | | | | | | 2.48 | | | | | | 0.92 | | |
| Total from investment operations | | | | 0.33 | | | | | | 1.75 | | | | | | 3.11 | | | | | | 1.23 | | |
| Redemption fees | | | | — | | | | | | 0.01 | | | | | | 0.04 | | | | | | — | | |
| Less distributions: | | | | | | | | | | | | | | | | | | | | | | | | |
| From net investment income | | | | (0.47 | ) | | | | | (0.47 | ) | | | | | (0.61 | ) | | | | | (0.37 | ) | |
| From net realized gains | | | | (0.69 | ) | | | | | (0.59 | ) | | | | | (0.24 | ) | | | | | — | | |
| Total distributions | | | | (1.16 | ) | | | | | (1.06 | ) | | | | | (0.85 | ) | | | | | (0.37 | ) | |
| Net asset value per share, end of period | | | $ | 15.05 | | | | | $ | 15.88 | | | | | $ | 15.18 | | | | | $ | 12.88 | | |
| Total return | | | | 1.93 | % | | | | | 12.04 | % | | | | | 25.55 | % | | | | | 10.29 | %(b) | |
| Ratios/Supplemental Data | | | | | | | | | | | | | | | | | | | | | | | | |
| Net Assets at end of period (000) | | | $ | 2,358 | | | | | $ | 865 | | | | | $ | 917 | | | | | $ | 257 | | |
| Ratio of total expenses to average net assets: | | | | | | | | | | | | | | | | | | | | | | | | |
| Before waivers and/or expense reimbursements (c) | | | | 2.18 | % | | | | | 2.50 | % | | | | | 3.68 | % | | | | | 3.83 | %(d) | |
| After waivers and/or expense reimbursements (e) | | | | 1.60 | % | | | | | 1.60 | % | | | | | 1.60 | % | | | | | 1.60 | %(d) | |
| Ratio of net investment income to average net assets | | | | 2.65 | % | | | | | 2.41 | % | | | | | 3.72 | % | | | | | 2.71 | %(d) | |
| Portfolio turnover (f) | | | | 97 | % | | | | | 78 | % | | | | | 86 | % | | | | | 73 | % | |
| † | Beginning with the year ended October 31, 2015, the Fund was audited by Ernst & Young LLP. The previous years were audited by another independent registered public accounting firm. |
| (a) | Class A commenced operations on December 30, 2011. |
| (b) | Not annualized. |
| (c) | Ratio of total expenses to average net assets excluding interest expense before waivers and/or expense reimbursements was 2.18%, 2.50% and 3.68% for the years ended October 31, 2015, 2014 and 2013, respectively, and 3.83% for the period ended October 31, 2012. |
| (d) | Annualized. |
| (e) | Ratio of total expenses to average net assets excluding interest expense after waivers and/or expense reimbursements was 1.60%, 1.60% and 1.60% for the years ended October 31, 2015, 2014 and 2013, respectively, and 1.60% for the period ended October 31, 2012. |
| (f) | Portfolio turnover is calculated on the basis of the Fund as a whole, without distinguishing between classes of shares issued. |
The accompanying notes are an integral part of these financial statements.
Alpine Mutual Funds
Financial Highlights—Continued
(For a share outstanding throughout each year)
| | | Financial Services Fund |
| | | Years Ended October 31, |
| | | 2015 | | 2014† | | 2013† | | 2012† | | 2011† | |
| Institutional Class: | | | | | | | | | | | | | | | | | | | | | | | | | | | | | | |
| Net asset value per share, beginning of year | | | $ | 13.48 | | | | | $ | 12.13 | | | | | $ | 8.77 | | | | | $ | 7.15 | | | | | $ | 7.69 | | |
| Income from investment operations: | | | | | | | | | | | | | | | | | | | | | | | | | | | | | | |
| Net investment income (loss) | | | | 0.10 | | | | | | (0.01 | ) | | | | | (0.02 | ) | | | | | (0.00 | )(a) | | | | | 0.02 | | |
| Net realized and unrealized gain (loss) | | | | (0.43 | ) | | | | | 1.36 | | | | | | 3.36 | | | | | | 1.64 | | | | | | (0.54 | ) | |
| Total from investment operations | | | | (0.33 | ) | | | | | 1.35 | | | | | | 3.34 | | | | | | 1.64 | | | | | | (0.52 | ) | |
| Redemption fees | | | | 0.00 | (a) | | | | | 0.00 | (a) | | | | | 0.02 | | | | | | 0.00 | (a) | | | | | 0.00 | (a) | |
| Less distributions: | | | | | | | | | | | | | | | | | | | | | | | | | | | | | | |
| From net investment income | | | | (0.16 | ) | | | | | (0.00 | )(a) | | | | | — | | | | | | — | | | | | | (0.01 | ) | |
| From net realized gains | | | | (0.00 | )(a) | | | | | — | | | | | | — | | | | | | — | | | | | | — | | |
| Tax return of capital | | | | — | | | | | | — | | | | | | — | | | | | | (0.02 | ) | | | | | (0.01 | ) | |
| Total distributions | | | | (0.16 | ) | | | | | — | | | | | | — | | | | | | (0.02 | ) | | | | | (0.02 | ) | |
| Net asset value per share, end of year | | | $ | 12.99 | | | | | $ | 13.48 | | | | | $ | 12.13 | | | | | $ | 8.77 | | | | | $ | 7.15 | | |
| Total return | | | | (2.51 | )% | | | | | 11.16 | % | | | | | 38.31 | % | | | | | 22.95 | % | | | | | (6.77 | )% | |
| Ratios/Supplemental Data: | | | | | | | | | | | | | | | | | | | | | | | | | | | | | | |
| Net Assets at end of year (000) | | | $ | 19,452 | | | | | $ | 27,995 | | | | | $ | 13,561 | | | | | $ | 8,874 | | | | | $ | 6,251 | | |
| Ratio of total expenses to average net assets: | | | | | | | | | | | | | | | | | | | | | | | | | | | | | | |
| Before waivers and/or expense reimbursements (b) | | | | 1.86 | % | | | | | 1.36 | % | | | | | 1.72 | % | | | | | 1.94 | % | | | | | 1.85 | % | |
| After waivers and/or expense reimbursements (c) | | | | 1.38 | % | | | | | 1.36 | % | | | | | 1.36 | % | | | | | 1.38 | % | | | | | 1.44 | % | |
| Ratio of net investment income (loss) to average net assets | | | | 0.63 | % | | | | | (0.08 | )% | | | | | (0.20 | )% | | | | | (0.16 | )% | | | | | 0.30 | % | |
| Portfolio turnover (d) | | | | 80 | % | | | | | 131 | % | | | | | 108 | % | | | | | 120 | % | | | | | 73 | % | |
| † | Beginning with the year ended October 31, 2015, the Fund was audited by Ernst & Young LLP. The previous years were audited by another independent registered public accounting firm. |
| (a) | The amount is less than $0.005 per share. |
| (b) | Ratio of total expenses to average net assets excluding interest expense before waivers and/or expense reimbursements was 1.82%, 1.33%, 1.71%, 1.91% and 1.75% for the years ended October 31, 2015, 2014, 2013, 2012 and 2011, respectively. |
| (c) | Ratio of total expenses to average net assets excluding interest expense after waivers and/or expense reimbursements was 1.35%, 1.33%, 1.35%, 1.35% and 1.35% for the years ended October 31, 2015, 2014, 2013, 2012 and 2011, respectively. |
| (d) | Portfolio turnover is calculated on the basis of the Fund as a whole, without distinguishing between classes of shares issued. |
The accompanying notes are an integral part of these financial statements.
Alpine Mutual Funds
Financial Highlights—Continued
(For a share outstanding throughout each period)
| | | Financial Services Fund |
| | | | | | | | | | | | | | | | | | Period | |
| | | | | | | | | | | | | | | | | | Ended | |
| | | Years Ended October 31, | | October 31, | |
| | | 2015 | | 2014† | | 2013† | | 2012†(a) | |
| Class A: | | | | | | | | | | | | | | | | | | | | | | | | |
| Net asset value per share, beginning of period | | | $ | 13.39 | | | | | $ | 12.08 | | | | | $ | 8.75 | | | | | $ | 6.90 | | |
| Income from investment operations: | | | | | | | | | | | | | | | | | | | | | | | | |
| Net investment income (loss) | | | | 0.04 | | | | | | (0.06 | ) | | | | | (0.04 | ) | | | | | (0.01 | ) | |
| Net realized and unrealized gain (loss) | | | | (0.40 | ) | | | | | 1.37 | | | | | | 3.35 | | | | | | 1.86 | | |
| Total from investment operations | | | | (0.36 | ) | | | | | 1.31 | | | | | | 3.31 | | | | | | 1.85 | | |
| Redemption fees | | | | 0.00 | (b) | | | | | 0.00 | (b) | | | | | 0.02 | | | | | | 0.00 | (b) | |
| Less distributions: | | | | | | | | | | | | | | | | | | | | | | | | |
| From net investment income | | | | (0.14 | ) | | | | | — | | | | | | — | | | | | | — | | |
| From net realized gains | | | | (0.00 | )(b) | | | | | — | | | | | | — | | | | | | — | | |
| Total distributions | | | | (0.14 | ) | | | | | — | | | | | | — | | | | | | — | | |
| Net asset value per share, end of period | | | $ | 12.89 | | | | | $ | 13.39 | | | | | $ | 12.08 | | | | | $ | 8.75 | | |
| Total return | | | | (2.75 | )% | | | | | 10.84 | % | | | | | 38.06 | % | | | | | 26.81 | %(c) | |
| Ratios/Supplemental Data | | | | | | | | | | | | | | | | | | | | | | | | |
| Net Assets at end of period (000) | | | $ | 5,844 | | | | | $ | 8,268 | | | | | $ | 7,318 | | | | | $ | 1,375 | | |
| Ratio of total expenses to average net assets: | | | | | | | | | | | | | | | | | | | | | | | | |
| Before waivers and/or expense reimbursements (e) | | | | 2.10 | % | | | | | 1.61 | % | | | | | 1.97 | % | | | | | 2.05 | %(d) | |
| After waivers and/or expense reimbursements (f) | | | | 1.63 | % | | | | | 1.61 | % | | | | | 1.61 | % | | | | | 1.53 | %(d) | |
| Ratio of net investment income (loss) to average net assets | | | | 0.36 | % | | | | | (0.36 | )% | | | | | (0.44 | )% | | | | | (0.50 | )%(d) | |
| Portfolio turnover (g) | | | | 80 | % | | | | | 131 | % | | | | | 108 | % | | | | | 120 | % | |
| † | Beginning with the year ended October 31, 2015, the Fund was audited by Ernst & Young LLP. The previous years were audited by another independent registered public accounting firm. |
| (a) | Class A commenced operations on December 30, 2011. |
| (b) | The amount is less than $0.005 per share. |
| (c) | Not annualized. |
| (d) | Annualized. |
| (e) | Ratio of total expenses to average net assets excluding interest expense before waivers and/or expense reimbursements was 2.07%, 1.61% and 1.96% for the years ended October 31, 2015, 2014 and 2013, respectively, and 2.05% for the period ended October 31, 2012. |
| (f) | Ratio of total expenses to average net assets excluding interest expense after waivers and/or expense reimbursements was 1.60%, 1.61% and 1.60% for the years ended October 31, 2015, 2014 and 2013, respectively, and 1.53% for the period ended October 31, 2012. |
| (g) | Portfolio turnover is calculated on the basis of the Fund as a whole, without distinguishing between classes of shares issued. |
The accompanying notes are an integral part of these financial statements.
Alpine Mutual Funds
Financial Highlights—Continued
(For a share outstanding throughout each year)
| | | Small Cap Fund |
| | | Years Ended October 31, |
| | | 2015 | | 2014† | | 2013† | | 2012† | | 2011† | |
| Institutional Class: | | | | | | | | | | | | | | | | | | | | | | | | | | | | | | |
| Net asset value per share, beginning of year | | | $ | 14.08 | | | | | $ | 14.25 | | | | | $ | 11.33 | | | | | $ | 10.48 | | | | | $ | 10.14 | | |
| Income from investment operations: | | | | | | | | | | | | | | | | | | | | | | | | | | | | | | |
| Net investment loss | | | | (0.06 | ) | | | | | (0.09 | ) | | | | | (0.14 | ) | | | | | (0.13 | ) | | | | | (0.11 | ) | |
| Net realized and unrealized gain (loss) | | | | 0.73 | | | | | | (0.08 | ) | | | | | 3.06 | | | | | | 0.98 | | | | | | 0.45 | | |
| Total from investment operations | | | | 0.67 | | | | | | (0.17 | ) | | | | | 2.92 | | | | | | 0.85 | | | | | | 0.34 | | |
| Redemption fees | | | | 0.00 | (a) | | | | | 0.00 | (a) | | | | | 0.00 | (a) | | | | | 0.00 | (a) | | | | | 0.00 | (a) | |
| Net asset value per share, end of year | | | $ | 14.75 | | | | | $ | 14.08 | | | | | $ | 14.25 | | | | | $ | 11.33 | | | | | $ | 10.48 | | |
| Total return | | | | 4.76 | % | | | | | (1.19 | )% | | | | | 25.77 | % | | | | | 8.11 | % | | | | | 3.35 | % | |
| Ratios/Supplemental Data: | | | | | | | | | | | | | | | | | | | | | | | | | | | | | | |
| Net Assets at end of year (000) | | | $ | 12,673 | | | | | $ | 13,589 | | | | | $ | 12,263 | | | | | $ | 10,877 | | | | | $ | 10,383 | | |
| Ratio of total expenses to average net assets: | | | | | | | | | | | | | | | | | | | | | | | | | | | | | | |
| Before waivers and/or expense reimbursements (b) | | | | 1.90 | % | | | | | 1.62 | % | | | | | 1.80 | % | | | | | 1.67 | % | | | | | 1.59 | % | |
| After waivers and/or expense reimbursements (c) | | | | 1.35 | % | | | | | 1.35 | % | | | | | 1.35 | % | | | | | 1.36 | % | | | | | 1.41 | % | |
| Ratio of net investment loss to average net assets | | | | (0.35 | )% | | | | | (0.73 | )% | | | | | (0.97 | )% | | | | | (1.07 | )% | | | | | (0.97 | )% | |
| Portfolio turnover (d) | | | | 96 | % | | | | | 171 | % | | | | | 39 | % | | | | | 29 | % | | | | | 18 | % | |
| † | Beginning with the year ended October 31, 2015, the Fund was audited by Ernst & Young LLP. The previous years were audited by another independent registered public accounting firm. |
| (a) | The amount is less than $0.005 per share. |
| (b) | Ratio of total expenses to average net assets excluding interest expense before waivers and/or expense reimbursements was 1.90%, 1.62%, 1.80%, 1.66% and 1.53% for the years ended October 31, 2015, 2014, 2013, 2012 and 2011, respectively. |
| (c) | Ratio of total expenses to average net assets excluding interest expense after waivers and/or expense reimbursements was 1.35%, 1.35%, 1.35%, 1.35% and 1.35% for the years ended October 31, 2015, 2014, 2013, 2012 and 2011, respectively. |
| (d) | Portfolio turnover is calculated on the basis of the Fund as a whole, without distinguishing between classes of shares issued. |
The accompanying notes are an integral part of these financial statements.
Alpine Mutual Funds
Financial Highlights—Continued
(For a share outstanding throughout each period)
| | | Small Cap Fund |
| | | | | | | | | | | | | | | | | | Period | |
| | | | | | | | | | | | | | | | | | Ended | |
| | | Years Ended October 31, | | | October 31, | |
| | | 2015 | | 2014† | | 2013† | | 2012†(a) | |
| Class A: | | | | | | | | | | | | | | | | | | | | | | | | |
| Net asset value per share, beginning of period | | | $ | 13.98 | | | | | $ | 14.18 | | | | | $ | 11.30 | | | | | $ | 10.17 | | |
| Income from investment operations: | | | | | | | | | | | | | | | | | | | | | | | | |
| Net investment income (loss) | | | | (0.09 | ) | | | | | 0.07 | | | | | | (0.16 | ) | | | | | (0.14 | ) | |
| Net realized and unrealized gain (loss) | | | | 0.71 | | | | | | (0.27 | ) | | | | | 3.04 | | | | | | 1.27 | | |
| Total from investment operations | | | | 0.62 | | | | | | (0.20 | ) | | | | | 2.88 | | | | | | 1.13 | | |
| Redemption fees | | | | 0.00 | (b) | | | | | 0.00 | (b) | | | | | 0.00 | (b) | | | | | — | | |
| Net asset value per share, end of period | | | $ | 14.60 | | | | | $ | 13.98 | | | | | $ | 14.18 | | | | | $ | 11.30 | | |
| Total return | | | | 4.43 | % | | | | | (1.41 | )% | | | | | 25.49 | % | | | | | 11.11 | %(c) | |
| Ratios/Supplemental Data | | | | | | | | | | | | | | | | | | | | | | | | |
| Net Assets at end of period (000) | | | $ | 1,155 | | | | | $ | 1,221 | | | | | $ | 139 | | | | | $ | 111 | | |
| Ratio of total expenses to average net assets: | | | | | | | | | | | | | | | | | | | | | | | | |
| Before waivers and/or expense reimbursements (d) | | | | 2.15 | % | | | | | 1.87 | % | | | | | 2.05 | % | | | | | 1.92 | %(e) | |
| After waivers and/or expense reimbursements (f) | | | | 1.60 | % | | | | | 1.60 | % | | | | | 1.60 | % | | | | | 1.60 | %(e) | |
| Ratio of net investment loss to average net assets | | | | (0.59 | )% | | | | | (0.92 | )% | | | | | (1.22 | )% | | | | | (1.34 | )%(e) | |
| Portfolio turnover (g) | | | | 96 | % | | | | | 171 | % | | | | | 39 | % | | | | | 29 | % | |
| † | Beginning with the year ended October 31, 2015, the Fund was audited by Ernst & Young LLP. The previous years were audited by another independent registered public accounting firm. |
| (a) | Class A commenced operations on December 30, 2011. |
| (b) | The amount is less than $0.005 per share. |
| (c) | Not annualized. |
| (d) | Ratio of total expenses to average net assets excluding interest expense before waivers and/or expense reimbursements was 2.15%, 1.87% and 2.05% for the years ended October 31, 2015, 2014 and 2013, respectively, and 1.92% for the period ended October 31, 2012. |
| (e) | Annualized. |
| (f) | Ratio of total expenses to average net assets excluding interest expense after waivers and/or expense reimbursements was 1.60%, 1.60% and 1.60% for the years ended October 31, 2015, 2014 and 2013, respectively, and 1.60% for the period ended October 31, 2012. |
| (g) | Portfolio turnover is calculated on the basis of the Fund as a whole, without distinguishing between classes of shares issued. |
The accompanying notes are an integral part of these financial statements.
Alpine Mutual Funds
Financial Highlights—Continued
(For a share outstanding throughout each year)
| | | Ultra Short Municipal Income Fund |
| | | Years Ended October 31, |
| | | 2015 | | 2014† | | 2013† | | 2012† | | 2011† | |
| Institutional Class: (a) | | | | | | | | | | | | | | | | | | | | | | | | | | | | | | |
| Net asset value per share, beginning of year | | | $ | 10.04 | | | | | $ | 10.03 | | | | | $ | 10.05 | | | | | $ | 10.05 | | | | | $ | 10.05 | | |
| Income from investment operations: | | | | | | | | | | | | | | | | | | | | | | | | | | | | | | |
| Net investment income | | | | 0.05 | | | | | | 0.05 | | | | | | 0.06 | | | | | | 0.10 | | | | | | 0.19 | | |
| Net realized and unrealized gain (loss) | | | | 0.00 | (b) | | | | | 0.01 | | | | | | (0.02 | ) | | | | | 0.00 | (b) | | | | | 0.00 | (b) | |
| Total from investment operations | | | | 0.05 | | | | | | 0.06 | | | | | | 0.04 | | | | | | 0.10 | | | | | | 0.19 | | |
| Redemption fees | | | | 0.00 | (b) | | | | | 0.00 | (b) | | | | | 0.00 | (b) | | | | | 0.00 | (b) | | | | | 0.00 | (b) | |
| Less distributions: | | | | | | | | | | | | | | | | | | | | | | | | | | | | | | |
| From net investment income | | | | (0.05 | ) | | | | | (0.05 | ) | | | | | (0.06 | ) | | | | | (0.10 | ) | | | | | (0.19 | ) | |
| From net realized gains | | | | (0.00 | )(b) | | | | | — | | | | | | — | | | | | | — | | | | | | — | | |
| Total distributions | | | | (0.05 | ) | | | | | (0.05 | ) | | | | | (0.06 | ) | | | | | (0.10 | ) | | | | | (0.19 | ) | |
| Net asset value per share, end of year | | | $ | 10.04 | | | | | $ | 10.04 | | | | | $ | 10.03 | | | | | $ | 10.05 | | | | | $ | 10.05 | | |
| Total return | | | | 0.52 | % | | | | | 0.63 | % | | | | | 0.36 | % | | | | | 0.95 | % | | | | | 1.87 | % | |
| Ratios/Supplemental Data: | | | | | | | | | | | | | | | | | | | | | | | | | | | | | | |
| Net Assets at end of year (000) | | | $ | 772,308 | | | | | $ | 831,505 | | | | | $ | 933,294 | | | | | $ | 1,375,490 | | | | | $ | 1,265,829 | | |
| Ratio of total expenses to average net assets: | | | | | | | | | | | | | | | | | | | | | | | | | | | | | | |
| Before waivers and/or expense reimbursements | | | | 0.93 | % | | | | | 0.90 | % | | | | | 0.89 | % | | | | | 0.84 | % | | | | | 0.82 | % | |
| After waivers and/or expense reimbursements | | | | 0.50 | % | | | | | 0.53 | % | | | | | 0.61 | % | | | | | 0.65 | % | | | | | 0.63 | % | |
| Ratio of net investment income to average net assets | | | | 0.51 | % | | | | | 0.53 | % | | | | | 0.55 | % | | | | | 0.95 | % | | | | | 1.86 | % | |
| Portfolio turnover (c) | | | | 155 | % | | | | | 168 | % | | | | | 185 | % | | | | | 192 | % | | | | | 174 | % | |
| † | Beginning with the year ended October 31, 2015, the Fund was audited by Ernst & Young LLP. The previous years were audited by another independent registered public accounting firm. |
| (a) | Effective January 3, 2012, the share class was renamed Institutional Class. |
| (b) | The amount is less than $0.005 per share. |
| (c) | Portfolio turnover is calculated on the basis of the Fund as a whole, without distinguishing between classes of shares issued. |
The accompanying notes are an integral part of these financial statements.
Alpine Mutual Funds
Financial Highlights—Continued
(For a share outstanding throughout each year)
| | | Ultra Short Municipal Income Fund |
| | | Years Ended October 31, |
| | | 2015 | | 2014† | | 2013† | | 2012† | | 2011† | |
| Class A: (a) | | | | | | | | | | | | | | | | | | | | | | | | | | | | | | |
| Net asset value per share, beginning of year | | | $ | 10.10 | | | | | $ | 10.09 | | | | | $ | 10.10 | | | | | $ | 10.10 | | | | | $ | 10.10 | | |
| Income from investment operations: | | | | | | | | | | | | | | | | | | | | | | | | | | | | | | |
| Net investment income | | | | 0.03 | | | | | | 0.03 | | | | | | 0.03 | | | | | | 0.07 | | | | | | 0.16 | | |
| Net realized and unrealized gain (loss) | | | | 0.00 | (b) | | | | | 0.01 | | | | | | (0.01 | ) | | | | | 0.00 | (b) | | | | | 0.00 | (b) | |
| Total from investment operations | | | | 0.03 | | | | | | 0.04 | | | | | | 0.02 | | | | | | 0.07 | | | | | | 0.16 | | |
| Redemption fees | | | | 0.00 | (b) | | | | | 0.00 | (b) | | | | | 0.00 | (b) | | | | | 0.00 | (b) | | | | | 0.00 | (b) | |
| Less distributions: | | | | | | | | | | | | | | | | | | | | | | | | | | | | | | |
| From net investment income | | | | (0.03 | ) | | | | | (0.03 | ) | | | | | (0.03 | ) | | | | | (0.07 | ) | | | | | (0.16 | ) | |
| From net realized gains | | | | (0.00 | )(b) | | | | | — | | | | | | — | | | | | | — | | | | | | — | | |
| Total distributions | | | | (0.03 | ) | | | | | (0.03 | ) | | | | | (0.03 | ) | | | | | (0.07 | ) | | | | | (0.16 | ) | |
| Net asset value per share, end of year | | | $ | 10.10 | | | | | $ | 10.10 | | | | | $ | 10.09 | | | | | $ | 10.10 | | | | | $ | 10.10 | | |
| Total return | | | | 0.26 | % | | | | | 0.38 | % | | | | | 0.21 | % | | | | | 0.70 | % | | | | | 1.61 | % | |
| Ratios/Supplemental Data | | | | | | | | | | | | | | | | | | | | | | | | | | | | | | |
| Net Assets at end of year (000) | | | $ | 203,472 | | | | | $ | 247,599 | | | | | $ | 305,193 | | | | | $ | 443,598 | | | | | $ | 358,284 | | |
| Ratio of total expenses to average net assets: | | | | | | | | | | | | | | | | | | | | | | | | | | | | | | |
| Before waivers and/or expense reimbursements | | | | 1.18 | % | | | | | 1.15 | % | | | | | 1.14 | % | | | | | 1.09 | % | | | | | 1.07 | % | |
| After waivers and/or expense reimbursements | | | | 0.75 | % | | | | | 0.78 | % | | | | | 0.86 | % | | | | | 0.90 | % | | | | | 0.88 | % | |
| Ratio of net investment income to average net assets | | | | 0.26 | % | | | | | 0.28 | % | | | | | 0.30 | % | | | | | 0.67 | % | | | | | 1.61 | % | |
| Portfolio turnover (c) | | | | 155 | % | | | | | 168 | % | | | | | 185 | % | | | | | 192 | % | | | | | 174 | % | |
| † | Beginning with the year ended October 31, 2015, the Fund was audited by Ernst & Young LLP. The previous years were audited by another independent registered public accounting firm. |
| (a) | Effective January 3, 2012, the share class was renamed Class A. |
| (b) | The amount is less than $0.005 per share. |
| (c) | Portfolio turnover is calculated on the basis of the Fund as a whole, without distinguishing between classes of shares issued. |
The accompanying notes are an integral part of these financial statements.
Alpine Mutual Funds
Financial Highlights—Continued
(For a share outstanding throughout each period)
| | | High Yield Managed Duration Municipal Fund |
| | | | | | | | | | | | | Period | |
| | | | | | | | | | | | | Ended | |
| | | Years Ended October 31, | | October 31, | |
| | | 2015 | | 2014† | | 2013†(a) | |
| Institutional Class: | | | | | | | | | | | | | | | | | | |
| Net asset value per share, beginning of period | | | $ | 10.29 | | | | | $ | 9.95 | | | | | $ | 10.00 | | |
| Income from investment operations: | | | | | | | | | | | | | | | | | | |
| Net investment income | | | | 0.36 | | | | | | 0.37 | | | | | | 0.06 | | |
| Net realized and unrealized gain (loss) | | | | (0.00 | )(b) | | | | | 0.34 | | | | | | (0.05 | ) | |
| Total from investment operations | | | | 0.36 | | | | | | 0.71 | | | | | | 0.01 | | |
| Less distributions: | | | | | | | | | | | | | | | | | | |
| From net investment income | | | | (0.36 | ) | | | | | (0.37 | ) | | | | | (0.06 | ) | |
| From net realized gains | | | | (0.00 | )(b) | | | | | — | | | | | | — | | |
| Total distributions | | | | (0.36 | ) | | | | | (0.37 | ) | | | | | (0.06 | ) | |
| Net asset value per share, end of period | | | $ | 10.29 | | | | | $ | 10.29 | | | | | $ | 9.95 | | |
| Total return | | | | 3.65 | % | | | | | 7.32 | % | | | | | 0.11 | %(c) | |
| Ratios/Supplemental Data: | | | | | | | | | | | | | | | | | | |
| Net Assets at end of period (000) | | | $ | 48,261 | | | | | $ | 25,566 | | | | | $ | 19,915 | | |
| Ratio of total expenses to average net assets: | | | | | | | | | | | | | | | | | | |
| Before waivers and/or expense reimbursements (d) | | | | 1.12 | % | | | | | 1.30 | % | | | | | 1.66 | %(e) | |
| After waivers and/or expense reimbursements (f) | | | | 0.82 | % | | | | | 0.81 | % | | | | | 0.74 | %(e) | |
| Ratio of net investment income to average net assets | | | | 3.49 | % | | | | | 3.75 | % | | | | | 1.47 | %(e) | |
| Portfolio turnover (g) | | | | 58 | % | | | | | 62 | % | | | | | 117 | % | |
| † | Beginning with the year ended October 31, 2015, the Fund was audited by Ernst & Young LLP. The previous years were audited by another independent registered public accounting firm. |
| (a) | Institutional Class commenced operations on June 3, 2013. |
| (b) | The amount is less than $0.005 per share. |
| (c) | Not annualized. |
| (d) | Ratio of total expenses to average net assets excluding interest expense before waivers and/or expense reimbursements was 1.12% and 1.30% for the years ended October 31, 2015 and 2014 , respectively, and 1.66% for the period ended October 31, 2013. |
| (e) | Annualized. |
| (f) | Ratio of total expenses to average net assets excluding interest expense after waivers and/or expense reimbursements was 0.80% and 0.80% for the years ended October 31, 2015 and 2014 , respectively, and 0.74% for the period ended October 31, 2013. |
| (g) | Portfolio turnover is calculated on the basis of the Fund as a whole, without distinguishing between classes of shares issued. |
The accompanying notes are an integral part of these financial statements.
Alpine Mutual Funds
Financial Highlights—Continued
(For a share outstanding throughout each period)
| | | High Yield Managed Duration Municipal Fund |
| | | Years Ended October 31, | | Period
Ended
October 31, | |
| | | 2015 | | 2014† | | 2013†(a) | |
| Class A: | | | | | | | | | | | | | | | | | | |
| Net asset value per share, beginning of period | | | $ | 10.29 | | | | | $ | 9.95 | | | | | $ | 10.00 | | |
| Income from investment operations: | | | | | | | | | | | | | | | | | | |
| Net investment income | | | | 0.34 | | | | | | 0.35 | | | | | | 0.05 | | |
| Net realized and unrealized gain (loss) | | | | (0.00 | )(b) | | | | | 0.34 | | | | | | (0.05 | ) | |
| Total from investment operations | | | | 0.34 | | | | | | 0.69 | | | | | | 0.00 | | |
| Less distributions: | | | | | | | | | | | | | | | | | | |
| From net investment income | | | | (0.34 | ) | | | | | (0.35 | ) | | | | | (0.05 | ) | |
| From net realized gains | | | | (0.00 | )(b) | | | | | — | | | | | | — | | |
| Total distributions | | | | (0.34 | ) | | | | | (0.35 | ) | | | | | (0.05 | ) | |
| Net asset value per share, end of period | | | $ | 10.29 | | | | | $ | 10.29 | | | | | $ | 9.95 | | |
| Total return | | | | 3.42 | % | | | | | 7.08 | % | | | | | 0.01 | %(c) | |
| Ratios/Supplemental Data | | | | | | | | | | | | | | | | | | |
| Net Assets at end of period (000) | | | $ | 10,170 | | | | | $ | 107 | | | | | $ | 100 | | |
| Ratio of total expenses to average net assets: | | | | | | | | | | | | | | | | | | |
| Before waivers and/or expense reimbursements (d) | | | | 1.37 | % | | | | | 1.55 | % | | | | | 1.91 | %(e) | |
| After waivers and/or expense reimbursements (f) | | | | 1.07 | % | | | | | 1.06 | % | | | | | 0.99 | %(e) | |
| Ratio of net investment income to average net assets | | | | 3.16 | % | | | | | 3.49 | % | | | | | 1.21 | %(e) | |
| Portfolio turnover (g) | | | | 58 | % | | | | | 62 | % | | | | | 117 | % | |
| † | Beginning with the year ended October 31, 2015, the Fund was audited by Ernst & Young LLP. The previous years were audited by another independent registered public accounting firm. |
| (a) | Class A commenced operations on December 30, 2011. |
| (b) | The amount is less than $0.005 per share. |
| (c) | Not annualized. |
| (d) | Ratio of total expenses to average net assets excluding interest expense before waivers and/or expense reimbursements was 1.37% and 1.55% for the years ended October 31, 2015 and 2014, respectively, and 1.91% for the period ended October 31, 2013. |
| (e) | Annualized. |
| (f) | Ratio of total expenses to average net assets excluding interest expense after waivers and/or expense reimbursements was 1.05% and 1.05% for the years ended October 31, 2015 and 2014, respectively, and 0.99% for the period ended October 31, 2013. |
| (g) | Portfolio turnover is calculated on the basis of the Fund as a whole, without distinguishing between classes of shares issued. |
The accompanying notes are an integral part of these financial statements.
Alpine Mutual Funds
Notes to Financial Statements
October 31, 2015
Alpine Series Trust (the “Series Trust”) was organized in 2001 as a Delaware Statutory Trust, and is registered under the Investment Company Act of 1940, as amended (the “1940 Act”), as an open-end management investment company. Alpine Income Trust (the “Income Trust”) was organized in 2002 as a Delaware Statutory Trust and is registered under the 1940 Act, as an open-end management investment company. The Alpine Dynamic Dividend Fund, Alpine Rising Dividend Fund, Alpine Financial Services Fund and Alpine Small Cap Fund are four separate series of the Series Trust. The Alpine Ultra Short Municipal Income Fund and Alpine High Yield Managed Duration Municipal Fund are two separate series of the Income Trust. The Alpine Dynamic Dividend Fund, Alpine Rising Dividend Fund, Alpine Financial Services Fund, Alpine Small Cap Fund, Alpine Ultra Short Municipal Income Fund and Alpine High Yield Managed Duration Municipal Fund (individually referred to as a “Fund” and collectively, “the Funds”) are diversified funds. Alpine Dynamic Dividend Fund seeks high current dividend income that qualifies for the reduced U.S. federal income tax rates created by the “Jobs and Growth Tax Relief Reconciliation Act of 2003,” while also focusing on total return for long-term growth of capital. Alpine Rising Dividend Fund seeks income. Long-term growth of capital is a secondary objective. Alpine Financial Services Fund seeks long-term growth of capital and consistent above average total returns as compared to those typical of investments made in public equities. Alpine Small Cap Fund seeks capital appreciation. Alpine Ultra Short Municipal Income Fund seeks high after-tax current income consistent with preservation of capital. Alpine High Yield Managed Duration Municipal Fund seeks a high level of current income exempt from federal income tax.
Alpine Woods Capital Investors, LLC (the “Adviser”) is a Delaware limited liability company and serves as the investment manager to the Funds. The Funds offer Institutional Class and Class A shares. Institutional Class shares are sold without a sales charge. Class A shares have an initial sales charge which may be waived under certain conditions as described in the Funds’ prospectus. Class A shares may be subject to Contingent Deferred Sales Charges (“CDSC”) for certain redemptions where no initial sales charge was paid at the time of purchase. All shares of the Funds have equal rights and privileges. Each share of a Fund is entitled to one vote on all matters as to which shares are entitled to vote, to participate equally with other shares in dividends and distributions declared by the Funds and on liquidation to their proportionate share of the assets remaining after satisfaction of outstanding liabilities, except that Class A shares bear certain expenses related to the distribution fee of such shares. Each class has exclusive voting rights with respect to the distribution fee of such class. Each class has exclusive voting rights with respect to matters relating to its shareholders servicing and distribution expenditures.
The Funds are each an investment company and accordingly follow the investment company accounting and reporting guidance of the Financial Accounting Standards Board (“FASB”) Accounting Standards Codification Topic (“ASC”) 946 Financial Services - Investment Companies.
| 2. | Significant Accounting Policies: |
The following is a summary of significant accounting policies consistently followed by the Funds in the preparation of their financial statements. The policies are in conformity with accounting principles generally accepted in the United States of America (“GAAP”), which require management to make estimates and assumptions that affect amounts reported herein. Actual results could differ from those estimates. Changes in the economic environment, financial markets and any other parameters used in determining these estimates could cause actual results to differ.
A. Valuation of Securities:
The net asset value (“NAV”) of shares of the Funds are calculated by dividing the value of the Funds’ net assets by the number of outstanding shares. NAV is determined each day the New York Stock Exchange (“NYSE”) is open as of the close of regular trading (normally, 4:00 p.m., Eastern Time). In computing NAV, portfolio securities of the Funds are valued at their current fair values determined on the basis of market quotations or if market quotations are not readily available or determined to be unreliable, through procedures and/or guidelines established by the Board. In computing the Funds’ NAV, equity securities that are traded on a securities exchange in the United States, except for those listed on NASDAQ Global Market, NASDAQ Global Select Market and NASDAQ Capital Market exchanges (collectively, “NASDAQ”) and option securities are valued at the last reported sale price as of the time of valuation. Securities traded on NASDAQ will be valued at the NASDAQ Official Closing Prices (“NOCP”). If, on a particular day, an exchange traded or NASDAQ security does not trade, then the mean between the most recent quoted bid and asked prices will be used. For equity investments traded on more than one exchange, the last reported sale price on
87
Alpine Mutual Funds
Notes to Financial Statements—Continued
October 31, 2015
the exchange where the stock is primarily traded is used. Equity-linked structured notes are valued by referencing the last reported sale or settlement price of the underlying security on the day of valuation. Foreign exchange adjustments are applied to the last reported price to convert the underlying security’s trading currency to the equity-linked structured note’s settlement currency. Each option security traded on a securities exchange in the United States is valued at the last current reported sales price as of the time of valuation if the last current reported sales price falls within the consolidated bid/ask quote. If the last current reported sale price does not fall within the consolidated bid/ask quote, the security is valued at the mid-point of the consolidated bid/ask quote for the option security. Forward currency contracts are valued based on third-party vendor quotations. Each security traded in the over-the-counter market and quoted on the NASDAQ National Market System is valued at the NOCP, as determined by NASDAQ, or lacking an NOCP, the last current reported sale price as of the time of valuation by NASDAQ, or lacking any current reported sale on NASDAQ at the time of valuation, at the mean between the most recent bid and asked quotations. Each over-the-counter option that is not traded through the Options Clearing Corporation is valued by the counterparty of the option, or if the counterparty’s price is not readily available, then by using the Black-Scholes method. Debt and short-term securities are valued based on an evaluated bid price as furnished by pricing services approved by the Board, which may be based on market transactions for comparable securities and various relationships between securities that are generally recognized by institutional traders, a computerized matrix system, or appraisals derived from information concerning the securities or similar securities received from recognized dealers in those securities. Each other security traded over-the-counter is valued at the mean between the most recent bid and asked quotations.
Securities that are principally traded in a foreign market are valued at the last current sale price at the time of valuation or lacking any current or reported sale, at the time of valuation, at the mean between the most recent bid and asked quotations as of the close of the appropriate exchange or other designated time. Trading in securities on European and Far Eastern securities exchanges and over-the-counter markets is normally completed at various times before the close of business on each day on which the NYSE is open. Trading of these securities may not take place on every NYSE business day. In addition, trading may take place in various foreign markets on Saturdays or on other days when the NYSE is not open and on which the Funds’ NAVs are not calculated.
When market quotations are not readily available or when the valuation methods mentioned above are not reflective of a fair value of the security, the security is valued at fair value following procedures and/or guidelines approved by the Board. The Funds may also use fair value pricing, if the value of a security it holds is, pursuant to the Board guidelines, materially affected by events occurring before the Funds’ NAVs are calculated but after the close of the primary market or market transactions for comparable securities and various relationships between securities that are generally recognized by institutional traders, a computerized matrix system, or appraisals derived from information concerning the securities or similar securities received from recognized dealers in those securities. The Board has approved the use of a third-party pricing vendor’s proprietary fair value pricing model to assist in determining current valuation for foreign equities and OTC derivatives traded in markets that close prior to the NYSE. When fair value pricing is employed, the value of the portfolio security used to calculate the Funds’ NAVs may differ from quoted or official closing prices. The Fund may also fair value a security if the Fund or Adviser believes that the market price is stale. Other types of securities that the Funds may hold for which fair value pricing might be required include illiquid securities including restricted securities and private placements for which there is no public market.
For securities valued by the Funds, valuation techniques are used to measure fair value that are consistent with the market approach and/or income approach, depending on the type of security and the particular circumstance. The market approach uses prices and other relevant information generated by market transactions involving identical or comparable securities. The income approach uses valuation techniques to discount estimated future cash flows to present value.
The Board of Trustees adopted procedures which utilize fair value procedures when any assets for which reliable market quotations are not readily available or for which the Funds’ pricing service does not provide a valuation or provides a valuation that in the judgment of the Adviser does not represent fair value. The Board of Trustees has established a Valuation Committee which is responsible for (1) monitoring the valuation of Fund securities and other investments; and (2) as required, when the Board of Trustees is not in session, reviewing and approving the fair value of illiquid and other holdings after consideration of all relevant factors, which determinations are reported to the Board of Trustees.
88
Alpine Mutual Funds
Notes to Financial Statements—Continued
October 31, 2015
Fair Value Measurement:
In accordance with FASB ASC, “Fair Value Measurement” (“ASC 820”), defines fair value as the value that the Funds would receive to sell an investment or pay to transfer a liability in a timely transaction with an independent buyer in the principal market, or in the absence of a principal market the most advantageous market for the investment or liability. ASC 820 uses a three-tier hierarchy to establish classification of fair value measurements for disclosure purposes. Inputs refer broadly to the assumptions that market participants would use in pricing the asset or liability, including assumptions about risk. Inputs may be observable or unobservable. Observable inputs are inputs that reflect the assumptions market participants would use in pricing the asset or liability that are developed based on market data obtained from sources independent of the reporting entity. Unobservable inputs are inputs that reflect the reporting entities’ own assumptions about the assumptions market participants would use in pricing the asset or liability that are developed based on the best information available.
| | • Level 1 — | Unadjusted quoted prices in active markets for identical investments. |
| | | |
| | • Level 2 — | Other significant observable inputs (including quoted prices for similar instruments, interest rates, prepayment speeds, credit risk, yield curves, default rates, etc.). |
| | | |
| | • Level 3 — | Significant unobservable inputs (including the Funds’ own assumptions in determining the fair value of investments). |
The availability of observable inputs can vary from security to security and is affected by a wide variety of factors, including, for example, the type of security, whether the security is new and not yet established in the marketplace, the liquidity of markets, and other characteristics particular to the security. To the extent that valuation is based on models or inputs that are less observable or unobservable in the market, the determination of fair value requires more judgment. Accordingly, the degree of judgment exercised in determining fair value is greatest for instruments categorized in Level 3.
The inputs used to measure fair value may fall into different levels of the fair value hierarchy. In such cases, for disclosure purposes, the level in the fair value hierarchy within which the fair value measurement falls, is determined based on the lowest level input that is significant to the fair value measurement in its entirety.
Various inputs are used in determining the value of the Funds’ investments as of the reporting year end. The designated input levels are not necessarily an indication of the risk or liquidity associated with these investments. These inputs are categorized in the following hierarchy under ASC 820.
89
Alpine Mutual Funds
Notes to Financial Statements—Continued
October 31, 2015
The following is a summary of the inputs used to value the Funds’ assets and liabilities carried at fair value as of October 31, 2015:
| | | Valuation Inputs | | | | |
| Dynamic Dividend Fund* | | Level 1 | | | Level 2 | | | Level 3 | | | Total Value | |
| Common Stocks | | | | | | | | | | | | | | | | |
| Consumer Discretionary | | $ | 27,642,833 | | | $ | — | | | $ | — | | | $ | 27,642,833 | |
| Consumer Staples | | | 15,494,268 | | | | — | | | | — | | | | 15,494,268 | |
| Energy | | | 12,502,980 | | | | — | | | | — | | | | 12,502,980 | |
| Financials | | | 34,029,841 | | | | 688,388 | | | | — | | | | 34,718,229 | |
| Health Care | | | 21,464,429 | | | | — | | | | — | | | | 21,464,429 | |
| Industrials | | | 24,353,869 | | | | — | | | | — | | | | 24,353,869 | |
| Information Technology | | | 23,763,816 | | | | — | | | | — | | | | 23,763,816 | |
| Materials | | | 4,817,509 | | | | — | | | | — | | | | 4,817,509 | |
| Telecommunication Services | | | 4,499,565 | | | | — | | | | — | | | | 4,499,565 | |
| Utilities | | | 8,031,444 | | | | — | | | | — | | | | 8,031,444 | |
| Equity-Linked Structured Notes | | | — | | | | 2,118,944 | | | | — | | | | 2,118,944 | |
| Convertible Bonds | | | — | | | | 2,052 | | | | — | | | | 2,052 | |
| Short-Term Investments | | | — | | | | 6,323,000 | | | | — | | | | 6,323,000 | |
| Total | | $ | 176,600,554 | | | $ | 9,132,384 | | | $ | — | | | $ | 185,732,938 | |
| | | | | | | | |
| | | Valuation Inputs | | | | | |
| Other Financial Instruments | | Level 1 | | | Level 2 | | | Level 3 | | | Total Value | |
| Assets | | | | | | | | | | | | | | | | |
| Forward Currency Contracts | | $ | — | | | $ | 635,394 | | | $ | — | | | $ | 635,394 | |
| Liabilities | | | | | | | | | | | | | | | | |
| Forward Currency Contracts | | | — | | | | (62,591 | ) | | | — | | | | (62,591 | ) |
| Total | | $ | — | | | $ | 572,803 | | | $ | — | | | $ | 572,803 | |
90
Alpine Mutual Funds
Notes to Financial Statements—Continued
October 31, 2015
| | | Valuation Inputs | | | | |
| Rising Dividend Fund* | | Level 1 | | | Level 2 | | | Level 3 | | | Total Value | |
| Common Stocks | | | | | | | | | | | | | | | | |
| Aerospace & Defense | | $ | 3,494,500 | | | $ | — | | | $ | — | | | $ | 3,494,500 | |
| Air Freight & Logistics | | | 936,300 | | | | — | | | | — | | | | 936,300 | |
| Auto Components | | | 474,570 | | | | — | | | | — | | | | 474,570 | |
| Automobiles | | | 1,406,950 | | | | — | | | | — | | | | 1,406,950 | |
| Banks | | | 2,604,440 | | | | — | | | | — | | | | 2,604,440 | |
| Beverages | | | 510,950 | | | | — | | | | — | | | | 510,950 | |
| Biotechnology | | | 2,382,391 | | | | — | | | | — | | | | 2,382,391 | |
| Capital Markets | | | 1,816,054 | | | | — | | | | — | | | | 1,816,054 | |
| Chemicals | | | 4,269,762 | | | | — | | | | — | | | | 4,269,762 | |
| Commercial Services & Supplies | | | 1,399,425 | | | | — | | | | — | | | | 1,399,425 | |
| Communications Equipment | | | 1,002,415 | | | | — | | | | — | | | | 1,002,415 | |
| Consumer Finance | | | 1,517,940 | | | | — | | | | — | | | | 1,517,940 | |
| Diversified Financial Services | | | 4,151,695 | | | | — | | | | — | | | | 4,151,695 | |
| Diversified Telecommunication Services | | | 3,111,246 | | | | — | | | | — | | | | 3,111,246 | |
| Electric Utilities | | | 877,190 | | | | — | | | | — | | | | 877,190 | |
| Electronic Equipment, Instruments & Components | | | 876,384 | | | | — | | | | — | | | | 876,384 | |
| Energy Equipment & Services | | | 1,441,470 | | | | — | | | | — | | | | 1,441,470 | |
| Food & Staples Retailing | | | 2,979,102 | | | | — | | | | 23,933 | | | | 3,003,035 | |
| Food Products | | | 925,680 | | | | — | | | | — | | | | 925,680 | |
| Gas Utilities | | | 37,800 | | | | — | | | | — | | | | 37,800 | |
| Health Care Equipment & Supplies | | | 3,982,112 | | | | — | | | | — | | | | 3,982,112 | |
| Health Care Providers & Services | | | 2,964,261 | | | | — | | | | — | | | | 2,964,261 | |
| Hotels, Restaurants & Leisure | | | 785,750 | | | | — | | | | — | | | | 785,750 | |
| Household Products | | | 1,199,166 | | | | — | | | | — | | | | 1,199,166 | |
| Industrial Conglomerates | | | 694,080 | | | | — | | | | — | | | | 694,080 | |
| Insurance | | | 4,488,830 | | | | — | | | | — | | | | 4,488,830 | |
| Internet & Catalog Retail | | | 872,085 | | | | — | | | | — | | | | 872,085 | |
| Internet Software & Services | | | 868,920 | | | | — | | | | — | | | | 868,920 | |
| IT Services | | | 2,832,308 | | | | — | | | | — | | | | 2,832,308 | |
| Life Sciences Tools & Services | | | 98,176 | | | | — | | | | — | | | | 98,176 | |
| Machinery | | | 1,042,900 | | | | — | | | | — | | | | 1,042,900 | |
| Media | | | 4,610,938 | | | | — | | | | — | | | | 4,610,938 | |
| Multi-Utilities | | | 1,886,031 | | | | — | | | | — | | | | 1,886,031 | |
| Oil, Gas & Consumable Fuels | | | 3,669,535 | | | | — | | | | — | | | | 3,669,535 | |
| Pharmaceuticals | | | 5,939,664 | | | | — | | | | — | | | | 5,939,664 | |
| Real Estate Investment Trusts | | | 1,983,020 | | | | — | | | | — | | | | 1,983,020 | |
| Road & Rail | | | 2,014,697 | | | | — | | | | — | | | | 2,014,697 | |
| Semiconductors & Semiconductor Equipment | | | 3,040,365 | | | | — | | | | — | | | | 3,040,365 | |
| Software | | | 1,256,820 | | | | — | | | | — | | | | 1,256,820 | |
| Specialty Retail | | | 1,614,020 | | | | — | | | | — | | | | 1,614,020 | |
| Technology, Hardware, Storage & Peripherals | | | 5,955,270 | | | | — | | | | — | | | | 5,955,270 | |
| Textiles, Apparel & Luxury Goods | | | 1,208,608 | | | | — | | | | — | | | | 1,208,608 | |
| Put Options Purchased | | | 5,160 | | | | — | | | | — | | | | 5,160 | |
| Short-Term Investments | | | — | | | | 1,668,000 | | | | — | | | | 1,668,000 | |
| Total | | $ | 89,228,980 | | | $ | 1,668,000 | | | $ | 23,933 | | | $ | 90,920,913 | |
91
Alpine Mutual Funds
Notes to Financial Statements—Continued
October 31, 2015
| | | Valuation Inputs | | | | |
| Other Financial Instruments | | Level 1 | | | Level 2 | | | Level 3 | | | Total Value | |
| Liabilities | | | | | | | | | | | | | | | | |
| Written Options Contracts | | $ | (1,200 | ) | | $ | — | | | $ | — | | | $ | (1,200 | ) |
| Total | | $ | (1,200 | ) | | $ | — | | | $ | — | | | $ | (1,200 | ) |
| | | | | | | | |
| | | Valuation Inputs | | | | | |
| Financial Services Fund* | | Level 1 | | | Level 2 | | | Level 3 | | | Total Value | |
| Common Stocks | | | | | | | | | | | | | | | | |
| Banks | | $ | 10,655,861 | | | $ | 69,220 | | | $ | — | | | $ | 10,725,081 | |
| Capital Markets | | | 5,246,674 | | | | — | | | | — | | | | 5,246,674 | |
| Computers & Peripherals | | | 146,300 | | | | — | | | | — | | | | 146,300 | |
| Consumer Finance | | | 867,402 | | | | — | | | | — | | | | 867,402 | |
| Diversified Financial Services | | | 556,060 | | | | — | | | | — | | | | 556,060 | |
| Insurance | | | 1,972,057 | | | | 43,341 | | | | — | | | | 2,015,398 | |
| Internet Software & Services | | | 112,765 | | | | — | | | | — | | | | 112,765 | |
| IT Services | | | 138,000 | | | | — | | | | — | | | | 138,000 | |
| Professional Services | | | 123,560 | | | | — | | | | — | | | | 123,560 | |
| Real Estate Investment Trusts | | | 1,471,176 | | | | — | | | | — | | | | 1,471,176 | |
| Real Estate Management & Development | | | 196,160 | | | | — | | | | — | | | | 196,160 | |
| Thrifts & Mortgage Finance | | | 1,916,734 | | | | 261,901 | | | | — | | | | 2,178,635 | |
| Total | | $ | 23,402,749 | | | $ | 374,462 | | | $ | — | | | $ | 23,777,211 | |
| | | | | | | | |
| | | Valuation Inputs | | | | | |
| Other Financial Instruments | | Level 1 | | | Level 2 | | | Level 3 | | | Total Value | |
| Assets | | | | | | | | | | | | | | | | |
| Forward Currency Contracts | | $ | — | | | $ | 27,942 | | | $ | — | | | $ | 27,942 | |
| Liabilities | | | | | | | | | | | | | | | | |
| Forward Currency Contracts | | | — | | | | (25,522 | ) | | | — | | | | (25,522 | ) |
| Total | | $ | — | | | $ | 2,420 | | | $ | — | | | $ | 2,420 | |
| | | | | | | | |
| | | Valuation Inputs | | | | | |
| Small Cap Fund* | | Level 1 | | | Level 2 | | | Level 3 | | | Total Value | |
| Common Stocks | | $ | 13,269,033 | | | $ | — | | | $ | — | | | $ | 13,269,033 | |
| Short-Term Investment | | | — | | | | 707,000 | | | | — | | | | 707,000 | |
| Total | | $ | 13,269,033 | | | $ | 707,000 | | | $ | — | | | $ | 13,976,033 | |
| | | | | | | | |
| | | Valuation Inputs | | | | | |
| Ultra Short Municipal Income Fund* | | Level 1 | | | Level 2 | | | Level 3 | | | Total Value | |
| Municipal Bonds | | $ | — | | | $ | 1,027,863,557 | | | $ | — | | | $ | 1,027,863,557 | |
| Money Market Fund | | | — | | | | 44,767 | | | | — | | | | 44,767 | |
| Total | | $ | — | | | $ | 1,027,908,324 | | | $ | — | | | $ | 1,027,908,324 | |
| | | | | | | | |
| | | Valuation Inputs | | | | | |
| High Yield Managed Duration Municipal Fund* | | Level 1 | | | Level 2 | | | Level 3 | | | Total Value | |
| Municipal Bonds | | $ | — | | | $ | 57,112,911 | | | $ | — | | | $ | 57,112,911 | |
| Money Market Fund | | | — | | | | 81,092 | | | | — | | | | 81,092 | |
| Total | | $ | — | | | $ | 57,194,003 | | | $ | — | | | $ | 57,194,003 | |
* For detailed sector, country and state descriptions, see accompanying Schedule of Portfolio Investments.
For the year ended October 31, 2015, there were no transfers between Level 1, Level 2 and Level 3.
92
Alpine Mutual Funds
Notes to Financial Statements—Continued
October 31, 2015
The following is a reconciliation of Level 3 assets for which significant unobservable inputs were used to determine fair value:
| | | Rising | |
| | | Dividend | |
| | | Fund | |
| Balance as of October 31, 2014 | | $ | — | |
| Realized gain (loss) | | | — | |
| Change in unrealized depreciation* | | | (2,567 | ) |
| Purchases | | | 26,500 | |
| Sales | | | — | |
| Transfers in to Level 3** | | | — | |
| Transfers out of Level 3** | | | — | |
| Balance as of October 31, 2015 | | $ | 23,933 | |
| Change in net unrealized appreciation/(depreciation) on Level 3 assets held at year end | | $ | (2,567 | ) |
| * | | Statements of Operations Location: Change in net unrealized depreciation on investments and foreign currency. |
| ** | | The Funds recognize transfers as of the beginning of the year. |
B. Security Transactions and Investment Income:
Security transactions are accounted for on a trade date basis. Realized gains and losses are computed on the identified cost basis. Dividend income is recorded on the ex-dividend date or in the case of some foreign securities, on the date thereafter when the Funds are made aware of the dividend. Upon notification from issuers, some of the dividend income received from a real estate investment trust may be redesignated as a reduction of cost of the related investment and/or realized gain. Interest income is recorded on the accrual basis and includes accretion of discounts and amortization of premiums, where applicable. To the extent any issuer defaults or a credit event occurs that impacts the issuer, the Funds may halt any additional interest income accruals and consider the realizability of interest accrued up to the date of default or credit event.
C. Line of Credit and Custody Overdrafts:
On December 1, 2010, each of the Series Trust and Income Trust entered into a lending agreement with BNP Paribas through its New York branch (“BNPP NY”) on behalf of each of the Funds. Loans in aggregate, whether to cover overdrafts or for investment purposes, may not exceed the maximum amount that is permitted under the 1940 Act. The terms of the lending agreement indicate the rate to be the Federal Funds rate plus 0.95% per annum on amounts borrowed. The BNPP NY facility provides secured, uncommitted lines of credit for the Funds where selected Funds’ assets are pledged against advances made to the respective Fund. Each Fund has granted a security interest in all pledged assets used as collateral to the BNPP NY facility. Each Fund is permitted to borrow up to 33.33% of its total assets for extraordinary or emergency purposes. Additionally, each of the following Funds is permitted to borrow up to 10% of its total assets for investment purposes but in no case shall any Fund’s total outstanding borrowings exceed 33.33% of their respective total assets. Either BNPP NY or the Funds may terminate this agreement upon delivery of written notice. For the year ended October 31, 2015, the average interest rate paid on outstanding borrowings under the line of credit was 1.08%, 1.09%, 1.07%, 1.06% and 0.97% for the Dynamic Dividend Fund, Rising Dividend Fund, Financial Services Fund, Small Cap Fund and High Yield Managed Duration Municipal Fund, respectively. The Funds may also incur interest expense on custody overdraft charges.
93
Alpine Mutual Funds
Notes to Financial Statements—Continued
October 31, 2015
| | | | Dynamic | | | | Rising | | | | Financial | | | | |
| | | | Dividend | | | | Dividend | | | | Services | | | | Small Cap | |
| | | | Fund | | | | Fund | | | | Fund | | | | Fund | |
| Total line of credit amount available for investment purposes at October 31, 2015 | | | $19,037,685 | | | | $9,682,198 | | | | $2,820,917 | | | | $1,450,168 | |
| Line of credit outstanding at October 31, 2015 | | | — | | | | — | | | | — | | | | — | |
| Line of credit amount unused at October 31, 2015 | | | 19,037,685 | | | | 9,682,198 | | | | 2,820,917 | | | | 1,450,168 | |
| Average balance outstanding during the period | | | 5,219,291 | | | | 8,845 | | | | 876,154 | | | | 373 | |
| Maximum balance outstanding during the period | | | 19,939,781 | | | | 782,366 | | | | 3,975,885 | | | | 76,309 | |
| Interest expense incurred on line of credit during the period | | | 57,034 | | | | 98 | | | | 9,536 | | | | 4 | |
| Interest expense incurred on custody overdrafts during the period | | | 860 | | | | 2 | | | | 6 | | | | — | |
| | | | | | High Yield | | |
| | | Ultra Short | | | Managed | | |
| | | Municipal | | | Duration | | |
| | | Income Fund | | | Municipal Fund | | |
| Total line of credit amount available for investment purposes at October 31, 2015 | | $ | — | | | $ | 5,879,309 | | |
| Line of credit outstanding at October 31, 2015 | | | — | | | | — | | |
| Line of credit amount unused at October 31, 2015 | | | — | | | | 5,879,309 | | |
| Average balance outstanding during the period | | | — | | | | 970,974 | | |
| Maximum balance outstanding during the period | | | — | | | | 3,234,394 | | |
| Interest expense incurred on line of credit during the period | | | — | | | | 9,205 | | |
| Interest expense incurred on custody overdrafts during the period | | | 507 | | | | 281 | | |
D. Federal and Other Income Taxes:
It is each Fund’s policy to comply with the Federal income and excise tax requirements of the Internal Revenue Code of 1986 (the “Code”), as amended, applicable to regulated investment companies and to timely distribute all of its investment company taxable income and net realized capital gains to shareholders in accordance with the timing requirements imposed by the Code. Therefore, no Federal income tax provision is required. Capital gains realized on some foreign securities are subject to foreign taxes. Dividends and interest from non-U.S. sources received by the Funds are generally subject to non-U.S. withholding taxes at rates ranging up to 30%. Such capital gains and withholding taxes, which are accrued as applicable, may be reduced or eliminated under the terms of applicable U.S. income tax treaties, and the Funds intend to undertake procedural steps to claim the benefits of such treaties. Where available, the Funds will file refund claims for foreign taxes withheld.
FASB ASC 740-10 Income Taxes — Overall sets forth a minimum threshold for financial statement recognition of the benefit of a tax position taken or expected to be taken in a tax return. Management has analyzed the Funds’ tax positions taken on income tax returns for all open tax years and has concluded that as of October 31, 2015, no provision for income tax is required in the Funds’ financial statements. The Funds’ Federal and state income and Federal excise tax returns for tax years for which the applicable statutes of limitations have not expired are subject to examination by the Internal Revenue Service and state departments of revenue. As of October 31, 2015, open Federal and New York tax years include the tax years ended October 31, 2012 through 2015. Also, the Funds have recognized no interest and penalties related to uncertain tax benefits. The Funds are also not aware of any tax positions for which it is reasonably possible that the total amounts of unrecognized tax benefits will significantly change in the next twelve months.
94
Alpine Mutual Funds
Notes to Financial Statements—Continued
October 31, 2015
E. Distributions to Shareholders:
Each Fund intends to distribute all of its net investment income and net realized capital gains, if any, throughout the year to its shareholders in the form of dividends. Distributions to shareholders are recorded at the close of business on the ex-dividend date. All dividends are automatically reinvested in full and fractional shares of the respective Funds at net asset value per share, unless otherwise requested.
The amounts of dividends from net investment income and of distributions from net realized gains are determined in accordance with Federal income tax regulations, which may differ from GAAP. These differences are either considered temporary or permanent in nature. To the extent these differences are permanent in nature, such amounts are reclassified within the composition of net assets based on their Federal tax-basis treatment; temporary differences do not require reclassification. In the event dividends and distributions to shareholders exceed net investment income and net realized gains for tax purposes, they are reported as returns of capital.
F. Class Allocations:
Income, expenses (other than class specific expenses) and realized and unrealized gains and losses are allocated among the classes of the Funds based on the relative net assets of each class. Class specific expenses are allocated to the class to which they relate. Currently, class specific distribution expenses are limited to those incurred under the Distribution Plan for Class A shares (See Note 5).
G. Foreign Currency Translation Transactions:
Each of the Dynamic Dividend, Rising Dividend and Financial Services may invest without limitation in foreign securities. The Small Cap Fund may invest up to 30% of the value of its net assets in foreign securities. The books and records of each Fund are maintained in U.S. dollars. Non-U.S. dollar-denominated amounts are translated into U.S. dollars as follows, with the resultant translations gains and losses recorded in the Statements of Operations.
| | i) | fair value of investment securities and other assets and liabilities at the exchange rate on the valuation date. |
| | | |
| | ii) | purchases and sales of investment securities, income and expenses at the exchange rate prevailing on the respective date of such transactions. |
H. Risks Associated with Foreign Securities and Currencies:
Investments in securities of foreign issuers carry certain risks not ordinarily associated with investments in securities of domestic issuers. Such risks include future political and economic developments and the possible imposition of exchange controls or other foreign governmental laws and restrictions. In addition, with respect to certain countries, there is a possibility of expropriation of assets, confiscatory taxation, political or social instability or diplomatic developments, which could adversely affect investments in those countries. Generally, when the U.S. dollar rises in value against a foreign currency, the Funds’ investments denominated in that currency will lose value because that currency is worth fewer U.S. dollars; the opposite effect occurs if the U.S. dollar falls in relative value.
Certain countries may also impose substantial restrictions on investments in their capital markets by foreign entities, including restrictions on investments in issuers or industries deemed sensitive to relevant national interests. These factors may limit the investment opportunities available to the Funds or result in a lack of liquidity and high price volatility with respect to securities of issuers from developing countries.
I. Equity-Linked Structured Notes:
The Funds may invest in equity-linked structured notes. Equity-linked structured notes are securities which are specially designed to combine the characteristics of one or more underlying securities and their equity derivatives in a single note form. The return and/or yield or income component may be based on the performance of the underlying equity securities, and equity index, and/or option positions. Equity-linked structured notes are typically offered in limited transactions by financial institutions in either registered or non-registered form. An investment in equity-linked structured notes creates exposure to the credit risk of the issuing financial institution, as well as to the market risk of the underlying securities. There is no guaranteed return of principal with these securities and the appreciation potential of these securities may be limited by a maximum payment or call right. In certain cases, equity-linked structured notes may be more volatile and less liquid than complex securities or other types of fixed-income securities. Such securities may exhibit price behavior that does not correlate with other fixed-income securities. The Dynamic Dividend Fund held one equity-linked structured note as of October 31, 2015.
95
Alpine Mutual Funds
Notes to Financial Statements—Continued
October 31, 2015
J. Options:
The Funds may engage in option transactions and in doing so achieve similar objectives to what they would achieve through the sale or purchase of individual securities. A call option, upon payment of a premium, gives the purchaser of the option the right to buy, and the seller of the option the obligation to sell, the underlying security, index or other instrument at the exercise price. A put option gives the purchaser of the option, upon payment of a premium, the right to sell, and the seller the obligation to buy, the underlying security, index, or other instrument at the exercise price.
To seek to offset some of the risk of a potential decline in value of certain long positions, the Funds may also purchase put options on individual securities. The Funds may also seek to generate income from option premiums by writing (selling) options on a portion of the equity securities in the Funds’ portfolio.
When a Fund purchases an option, it pays a premium and an amount equal to that premium is recorded as an asset. When a Fund writes an option, it receives a premium and an amount equal to that premium is recorded as a liability. The asset or liability is adjusted daily to reflect the current market value of the option. If an option expires unexercised, the Fund realizes a gain or loss to the extent of the premium received or paid. If an option is exercised, the premium received or paid is recorded as an adjustment to the proceeds from the sale or the cost basis of the purchase. The difference between the premium and the amount received or paid on a closing purchase or sale transaction is also treated as a realized gain or loss. The cost of securities acquired through the exercise of call options is increased by premiums paid. The proceeds from securities sold through the exercise of put options are decreased by the premiums paid. Gain or loss on written options and purchased options is presented separately as net realized gain or loss on written options and net realized gain or loss on purchased options, respectively.
The following written options contracts were held as of October 31, 2015 in the Rising Dividend Fund:
| | | Number | | Exercise | | Expiration | | Premium | | Current | | Unrealized |
| Call Options | | of Contracts | | Price | | Date | | Received | | Value | | Appreciation |
| | | | | | | | | | | | | |
| Johnson & Johnson | | 240 | | $80.00 | | 12/18/2015 | | $14,226 | | $(1,200) | | $13,026 |
| | | | | | | | | | | | | | | | | | | | | |
Written options transactions for the year ended October 31, 2015 were as follows in the Rising Dividend Fund:
| | | Number of | | Premiums |
| | | Contracts | | Received |
| Written Options, outstanding as of October 31, 2014 | | | — | | | $ | — | |
| Options written | | | 240 | | | | 14,226 | |
| Written Options, outstanding as of October 31, 2015 | | | 240 | | | $ | 14,226 | |
K. Forward Currency Contracts:
The Funds are subject to foreign currency exchange rate risk in the normal course of pursuing their investment objectives. The Funds may use forward currency contracts to gain exposure to or economically hedge against changes in the value of foreign currencies. A forward currency contract (“forward”) is an agreement between two parties to buy and sell a currency at a set price on a future date. The market value of the forward contract fluctuates with changes in forward currency exchange rates. The forward contract is marked-to-market daily and the change in market value is recorded by each Fund as unrealized appreciation or depreciation. When the forward contract is closed, a Fund records a realized gain or loss equal to the fluctuation in value during the period the forward contract was open. A Fund could be exposed to risk if a counterparty is unable to meet the terms of a forward or if the value of the currency changes unfavorably. The Funds’ forward contracts are not subject to an enforceable master netting agreement or similar agreement. During the year ended October 31, 2015, the Dynamic Dividend Fund and Financial Services Fund entered into seventeen forward contracts, respectively. The average monthly principal amount for forward contracts held by the Dynamic Dividend Fund and Financial Services Fund throughout the period was $28,583,260 and $1,289,887, respectively. This is based on amounts held as of each month-end throughout the fiscal year.
96
Alpine Mutual Funds
Notes to Financial Statements—Continued
October 31, 2015
The following forward currency contracts were held as of October 31, 2015:
Dynamic Dividend Fund
| Description | | Counterparty | | Settlement
Date | | Currency | | Settlement
Value | | | | Current
Value | | | Unrealized
Appreciation/
(Depreciation) |
| Contracts Sold: | | | | | | | | | | | | | | | | |
| Swiss Franc | | State Street Bank
And Trust Company | | 12/09/15 | | 5,400,000 | CHF | | $ | 5,817,398 | | | $ | 5,469,483 | | | $ | 347,915 | |
| Euro | | State Street Bank
And Trust Company | | 12/09/15 | | 6,800,000 | EUR | | | 7,635,483 | | | | 7,481,481 | | | | 154,002 | |
| British Pound | | State Street Bank
And Trust Company | | 12/09/15 | | 5,100,000 | GBP | | | 7,994,148 | | | | 7,860,671 | | | | 133,477 | |
| Japanese Yen | | State Street Bank
And Trust Company | | 12/09/15 | | 320,000,000 | JPY | | | 2,590,401 | | | | 2,652,992 | | | | (62,591 | ) |
| | | | | | | | | | | | | | $ | 23,464,627 | | | $ | 572,803 | |
Financial Services Fund
| Description | | Counterparty | | Settlement
Date | | Currency | | Settlement
Value | | | | Current
Value | | | Unrealized
Appreciation/
(Depreciation) |
| Contracts Purchased: | | | | | | | | | | | | | | | | |
| Euro | | State Street Bank
And Trust Company | | 12/16/15 | | 300,000 | EUR | | $ | 336,715 | | | $ | 330,120 | | | $ | (6,595 | ) |
| Euro | | State Street Bank
And Trust Company | | 12/16/15 | | 125,000 | EUR | | | 144,830 | | | | 137,550 | | | | (7,280 | ) |
| Euro | | State Street Bank
And Trust Company | | 12/16/15 | | 75,000 | EUR | | | 81,757 | | | | 82,530 | | | | 773 | |
| | | | | | | | | | | | | | $ | 593,542 | | | $ | (13,102 | ) |
| | | | | | | | | | | | | | | | | | | | |
| Contracts Sold: | | | | | | | | | | | | | | | | | | | |
| Euro | | State Street Bank
and Trust Company | | 12/16/15 | | 900,000 | EUR | | $ | 1,015,560 | | | $ | 990,361 | | | $ | 25,199 | |
| British Pound | | State Street Bank
and Trust Company | | 12/16/15 | | 50,000 | GBP | | | 79,035 | | | | 77,065 | | | | 1,970 | |
| Japanese Yen | | State Street Bank
and Trust Company | | 12/16/15 | | 70,000,000 | JPY | | | 568,828 | | | | 580,475 | | | | (11,647 | ) |
| | | | | | | | | | | | | | $ | 1,647,901 | | | $ | 15,522 | |
L. Derivative Instruments:
The following tables provide information about the effect of derivatives on the Funds’ Statements of Assets and Liabilities and Statements of Operations as of and for the year ended October 31, 2015. The first table provides additional detail about the amounts and sources of unrealized appreciation/(depreciation) on derivatives at the end of the period. The second table provides additional information about the amounts and sources of net realized gain/(loss) and the change in net unrealized appreciation/(depreciation) resulting from the Funds’ derivatives during the year.
97
Alpine Mutual Funds
Notes to Financial Statements—Continued
October 31, 2015
The effect of derivative instruments in the Statements of Assets and Liabilities as of October 31, 2015:
Dynamic Dividend Fund
| Derivatives | | Statements of Assets
and Liabilities Location | | Unrealized
Appreciation/(Depreciation) |
| Foreign exchange risk | | Unrealized appreciation on forward currency contracts | | | $ | 635,394 | |
| Foreign exchange risk | | Unrealized depreciation on forward currency contracts | | | | (62,591 | ) |
| | | | | | $ | 572,803 | |
Rising Dividend Fund
| Derivatives | | Statements of Assets
and Liabilities Location | | Unrealized
Appreciation/(Depreciation) |
| Equity risk | | Investments, at value (includes purchased options) | | | $ | (48,401 | ) |
| Equity risk | | Written options contracts, at value | | | | 13,026 | |
| | | | | | $ | 35,375 | |
Financial Services Fund
| Derivatives | | Statements of Assets
and Liabilities Location | | Unrealized
Appreciation/(Depreciation) |
| Foreign exchange risk | | Unrealized appreciation on forward currency contracts | | | $ | 27,942 | |
| Foreign exchange risk | | Unrealized depreciation on forward currency contracts | | | | (25,522 | ) |
| | | | | | $ | 2,420 | |
The effect of derivative instruments in the Statements of Operations for the year ended October 31, 2015:
Dynamic Dividend Fund
| Derivatives | | Statements of
Operations Location | | Net Realized
Gain/(Loss) | | Changes in Net
Unrealized Depreciation |
| Equity risk | | Net realized gain/(loss) from investments | | | $ | (132,155 | ) | | | | | |
| | | Change in net unrealized appreciation/(depreciation) on investments | | | | | | | | $ | — | |
| Foreign exchange risk | | Net realized gain/(loss) from foreign currency transactions | | | $ | 5,189,869 | | | | | | |
| | | Change in net unrealized appreciation/(depreciation) on foreign currency translations | | | | | | | | $ | (2,257,012 | ) |
98
Alpine Mutual Funds
Notes to Financial Statements—Continued
October 31, 2015
Rising Dividend Fund
| Derivatives | | Statements of
Operations Location | | Net Realized
Loss | | Change in Net Unrealized
Appreciation/(Depreciation) |
| Equity risk | | Net realized gain/(loss) from investments | | | $ | — | | | | | | |
| | | Change in net unrealized appreciation/(depreciation) on investments | | | | | | | | $ | (48,401 | ) |
| Equity risk | | Net realized gain/(loss) from Written options contracts | | | $ | — | | | | | | |
| | | Change in net unrealized appreciation/(depreciation) on written options contracts | | | | | | | | $ | 13,026 | |
| Foreign exchange risk | | Net realized gain/(loss) from foreign currency transactions | | | $ | (209 | ) | | | | | |
| | | Change in net unrealized appreciation/(depreciation) on foreign currency translations | | | | | | | | $ | — | |
Financial Services Fund
| Derivatives | | Statements of
Operations Location | | Net Realized
Loss | | Change in Net
Unrealized Appreciation |
| Foreign exchange risk | | Net realized gain/(loss) from foreign currency transactions | | | $ | (40,835 | ) | | | | | |
| | | Change in net unrealized appreciation/(depreciation) on foreign currency translations | | | | | | | | $ | 2,420 | |
M. Redemption Fees:
The Funds of the Alpine Series Trust impose a redemption fee of 1% of the total redemption amount on all Fund shares redeemed or exchanged within 60 days of buying them, either by purchase or exchange. This fee is assessed and retained by the Funds for the benefit of the remaining shareholders. The redemption fee is accounted for as an increase to paid-in-capital. The Funds of the Alpine Income Trust, impose a 0.25% redemption fee for shares redeemed or exchanged within 30 days of buying them and 0.75% redemption fee for shares redeemed or exchanged within 60 days of buying them, respectively, of the total redemption amount on all Fund shares redeemed or exchanged. This fee is assessed and retained by the Funds for the benefit of the remaining shareholders. The redemption fee is accounted for as an increase to paid-in-capital.
99
Alpine Mutual Funds
Notes to Financial Statements—Continued
October 31, 2015
| 3. | Capital Share Transactions: |
The Funds have an unlimited number of shares of beneficial interest, with $0.001 par value, authorized. Transactions in shares and dollars of the Funds were as follows:
Dynamic Dividend Fund
| | | Year Ended
October 31, 2015 | | | Year Ended
October 31, 2014 | |
| | | Shares | | | Amount | | | Shares | | | Amount | |
| Institutional Class | | | | | | | | | | | | | | | | |
| Shares sold | | | 3,466,999 | | | $ | 13,621,647 | | | | 2,695,521 | | | $ | 10,364,444 | |
| Shares issued in reinvestment of dividends | | | 2,162,374 | | | | 8,384,107 | | | | 2,510,738 | | | | 9,683,398 | |
| Redemption fees | | | — | | | | 2,152 | | | | — | | | | 2,316 | |
| Shares redeemed | | | (11,756,955 | ) | | | (45,912,677 | ) | | | (15,803,293 | ) | | | (60,579,434 | ) |
| Total net change | | | (6,127,582 | ) | | $ | (23,904,771 | ) | | | (10,597,034 | ) | | $ | (40,529,276 | ) |
| | | | | | | | | | | | | | | | | |
| Class A | | | | | | | | | | | | | | | | |
| Shares sold | | | 347,585 | | | $ | 1,372,113 | | | | 536,790 | | | $ | 2,073,532 | |
| Shares issued in reinvestment of dividends | | | 30,404 | | | | 117,981 | | | | 24,672 | | | | 95,412 | |
| Redemption fees | | | — | | | | 46 | | | | — | | | | 33 | |
| Shares redeemed | | | (404,030 | ) | | | (1,582,312 | ) | | | (117,052 | ) | | | (455,600 | ) |
| Total net change | | | (26,041 | ) | | $ | (92,172 | ) | | | 444,410 | | | $ | 1,713,377 | |
Rising Dividend Fund
| | | Year Ended
October 31, 2015 | | | Year Ended
October 31, 2014 | |
| | | Shares | | | Amount | | | Shares | | | Amount | |
| Institutional Class | | | | | | | | | | | | | | | | |
| Shares sold | | | 118,489 | | | $ | 1,905,372 | | | | 141,954 | | | $ | 2,176,399 | |
| Proceeds from shares issued in connection with the tax-free transfer of assets from Alpine Transformations Fund (Note 8) | | | 507,899 | | | | 7,643,926 | | | | — | | | | — | |
| Proceeds from shares issued in connection with the tax-free transfer of assets from Alpine Equity Income Fund (Note 8) | | | 5,123,760 | | | | 77,113,107 | | | | — | | | | — | |
| Shares issued in reinvestment of dividends | | | 22,856 | | | | 357,891 | | | | 16,285 | | | | 248,587 | |
| Redemption fees | | | — | | | | — | | | | — | | | | 2,469 | |
| Shares redeemed | | | (68,404 | ) | | | (1,092,652 | ) | | | (100,837 | ) | | | (1,550,294 | ) |
| Total net change | | | 5,704,600 | | | $ | 85,927,644 | | | | 57,402 | | | $ | 877,161 | |
| | | | | | | | | | | | | | | | | |
| Class A | | | | | | | | | | | | | | | | |
| Shares sold | | | 89,014 | | | $ | 1,450,838 | | | | 12,237 | | | $ | 189,307 | |
| Proceeds from shares issued in connection with the tax-free transfer of assets from Alpine Transformations Fund (Note 8) | | | 10,346 | | | | 155,703 | | | | — | | | | — | |
| Proceeds from shares issued in connection with the tax-free transfer of assets from Alpine Equity Income Fund (Note 8) | | | 21,756 | | | | 327,429 | | | | — | | | | — | |
| Shares issued in reinvestment of dividends | | | 7,101 | | | | 111,046 | | | | 2,081 | | | | 31,629 | |
| Redemption fees | | | — | | | | — | | | | — | | | | 700 | |
| Shares redeemed | | | (25,995 | ) | | | (393,204 | ) | | | (20,208 | ) | | | (310,972 | ) |
| Total net change | | | 102,222 | | | $ | 1,651,812 | | | | (5,890 | ) | | $ | (89,336 | ) |
100
Alpine Mutual Funds
Notes to Financial Statements—Continued
October 31, 2015
Financial Services Fund
| | | Year Ended
October 31, 2015 | | | Year Ended
October 31, 2014 | |
| | | Shares | | | Amount | | | Shares | | | Amount | |
| Institutional Class | | | | | | | | | | | | | | | | |
| Shares sold | | | 369,389 | | | $ | 4,998,497 | | | | 3,891,425 | | | $ | 52,223,228 | |
| Shares issued in reinvestment of dividends | | | 12,761 | | | | 171,655 | | | | 461 | | | | 6,073 | |
| Redemption fees | | | — | | | | 1,836 | | | | — | | | | 6,007 | |
| Shares redeemed | | | (962,004 | ) | | | (12,790,683 | ) | | | (2,932,309 | ) | | | (40,017,894 | ) |
| Total net change | | | (579,854 | ) | | $ | (7,618,695 | ) | | | 959,577 | | | $ | 12,217,414 | |
| | | | | | | | | | | | | | | | | |
| Class A | | | | | | | | | | | | | | | | |
| Shares sold | | | 66,509 | | | $ | 874,831 | | | | 428,074 | | | $ | 5,737,113 | |
| Shares issued in reinvestment of dividends | | | 3,511 | | | | 46,990 | | | | — | | | | — | |
| Redemption fees | | | — | | | | 549 | | | | — | | | | 1,979 | |
| Shares redeemed | | | (234,275 | ) | | | (3,092,029 | ) | | | (416,369 | ) | | | (5,477,799 | ) |
| Total net change | | | (164,255 | ) | | $ | (2,169,659 | ) | | | 11,705 | | | $ | 261,293 | |
Small Cap Fund
| | | Year Ended
October 31, 2015 | | | Year Ended
October 31, 2014 | |
| | | Shares | | | Amount | | | Shares | | | Amount | |
| Institutional Class | | | | | | | | | | | | | | | | |
| Shares sold | | | 33,543 | | | $ | 472,343 | | | | 242,533 | | | $ | 3,574,521 | |
| Shares issued in reinvestment of dividends | | | — | | | | — | | | | — | | | | — | |
| Redemption fees | | | — | | | | 822 | | | | — | | | | 586 | |
| Shares redeemed | | | (139,381 | ) | | | (1,991,521 | ) | | | (137,994 | ) | | | (2,030,695 | ) |
| Total net change | | | (105,838 | ) | | $ | (1,518,356 | ) | | | 104,539 | | | $ | 1,544,412 | |
| | | | | | | | | | | | | | | | | |
| Class A | | | | | | | | | | | | | | | | |
| Shares sold | | | 30,976 | | | $ | 440,928 | | | | 120,756 | | | $ | 1,787,024 | |
| Shares issued in reinvestment of dividends | | | — | | | | — | | | | — | | | | — | |
| Redemption fees | | | — | | | | 70 | | | | — | | | | 56 | |
| Shares redeemed | | | (39,243 | ) | | | (552,566 | ) | | | (43,206 | ) | | | (615,539 | ) |
| Total net change | | | (8,267 | ) | | $ | (111,568 | ) | | | 77,550 | | | $ | 1,171,541 | |
101
Alpine Mutual Funds
Notes to Financial Statements—Continued
October 31, 2015
Ultra Short Municipal Income Fund
| | | Year Ended | | | Year Ended | |
| | | October 31, 2015 | | | October 31, 2014 | |
| | | Shares | | | Amount | | | Shares | | | Amount | |
| Institutional Class | | | | | | | | | | | | | | | | |
| Shares sold | | | 27,287,282 | | | $ | 273,964,312 | | | | 41,635,652 | | | $ | 417,829,233 | |
| Shares issued in reinvestment of dividends | | | 315,186 | | | | 3,164,465 | | | | 356,964 | | | | 3,581,682 | |
| Redemption fees | | | — | | | | 12,623 | | | | — | | | | 13,825 | |
| Shares redeemed | | | (33,510,389 | ) | | | (336,444,301 | ) | | | (52,223,017 | ) | | | (524,077,213 | ) |
| Total net change | | | (5,907,921 | ) | | $ | (59,302,901 | ) | | | (10,230,401 | ) | | $ | (102,652,473 | ) |
| | | | | | | | | | | | | | | | | |
| Class A | | | | | | | | | | | | | | | | |
| Shares sold | | | 9,158,022 | | | $ | 92,474,358 | | | | 9,525,204 | | | $ | 96,123,109 | |
| Shares issued in reinvestment of dividends | | | 46,820 | | | | 472,735 | | | | 61,561 | | | | 621,217 | |
| Redemption fees | | | — | | | | 3,592 | | | | — | | | | 4,098 | |
| Shares redeemed | | | (13,577,730 | ) | | | (137,106,037 | ) | | | (15,321,364 | ) | | | (154,611,366 | ) |
| Total net change | | | (4,372,888 | ) | | $ | (44,155,352 | ) | | | (5,734,599 | ) | | $ | (57,862,942 | ) |
High Yield Managed Duration Municipal Fund
| | | Year Ended | | | Year Ended | |
| | | October 31, 2015 | | | October 31, 2014 | |
| | | Shares | | | Amount | | | Shares | | | Amount | |
| Institutional Class | | | | | | | | | | | | | | | | |
| Shares sold | | | 2,437,080 | | | $ | 25,137,443 | | | | 402,910 | | | $ | 4,106,000 | |
| Shares issued in reinvestment of dividends | | | 103,944 | | | | 1,071,225 | | | | 79,614 | | | | 805,579 | |
| Redemption fees | | | — | | | | 4,190 | | | | — | | | | — | |
| Shares redeemed | | | (336,237 | ) | | | (3,457,415 | ) | | | (197 | ) | | | (2,015 | ) |
| Total net change | | | 2,204,787 | | | $ | 22,755,443 | | | | 482,327 | | | $ | 4,909,564 | |
| | | | | | | | | | | | | | | | | |
| Class A | | | | | | | | | | | | | | | | |
| Shares sold | | | 1,045,193 | | | $ | 10,761,230 | | | | — | | | $ | — | |
| Shares issued in reinvestment of dividends | | | 6,339 | | | | 65,174 | | | | 356 | | | | 3,597 | |
| Redemption fees | | | — | | | | 640 | | | | — | | | | — | |
| Shares redeemed | | | (73,749 | ) | | | (758,641 | ) | | | — | | | | — | |
| Total net change | | | 977,783 | | | $ | 10,068,403 | | | | 356 | | | $ | 3,597 | |
| 4. | Purchases and Sales of Securities: |
Purchases and sales of securities (excluding short-term securities) for the year ended October 31, 2015 are as follows:
| | | Purchases | | | Sales | |
| Dynamic Dividend Fund | | $ | 223,476,127 | | | $ | 246,458,170 | |
| Rising Dividend Fund | | | 20,338,103 | | | | 12,926,685 | |
| Financial Services Fund | | | 23,650,825 | | | | 31,510,727 | |
| Small Cap Fund | | | 13,126,212 | | | | 15,300,169 | |
| Ultra Short Municipal Income Fund | | | 1,376,202,511 | | | | 1,445,541,159 | |
| High Yield Managed Duration Municipal Fund | | | 46,584,866 | | | | 21,428,684 | |
The Funds did not have purchases and sales of U.S. Government Obligations during the year ended October 31, 2015.
102
Alpine Mutual Funds
Notes to Financial Statements—Continued
October 31, 2015
Quasar Distributors, LLC (“Quasar”) serves as each Fund’s distributor. Each of the Funds have adopted a distribution and servicing plan (the “Plan”) for their Class A shares as allowed by Rule 12b-1 under the 1940 Act. The Plan authorizes payments by the Funds in connection with the distribution and servicing of their Class A shares at an annual rate, as determined from time to time by the Board, of up to 0.25% of the average daily net assets of the Class A shares of the Funds. Amounts paid under the Plan by the Funds may be spent by the Funds on any activities or expenses primarily intended to result in the sale of Class A shares of the Funds, including but not limited to advertising, compensation for sales and marketing activities of financial institutions and others such as dealers and distributors, shareholder account servicing, the printing and mailing of prospectuses to other than current shareholders and the printing and mailing of sales literature. Dynamic Dividend Fund, Rising Dividend Fund, Financial Services Fund, Small Cap Fund, Ultra Short Municipal Income Fund and High Yield Managed Duration Municipal Fund incurred $10,429, $4,918, $16,759, $2,868, $532,322 and $9,916, respectively, pursuant to the Plan for the year ended October 31, 2015.
The Plan for the Funds may be terminated at any time by a majority vote of the Trustees of the Trusts who are not “interested persons,” as defined by the 1940 Act, or by vote of a majority of the outstanding voting shares of the respective Fund.
| 6. | Investment Advisory Agreement and Other Affiliated Transactions: |
The Adviser provides investment advisory services to each of the Funds. Pursuant to the advisory agreements with the Funds, the Adviser is entitled to an annual fee based on 1.00% of each Fund’s average daily net assets for the Dynamic Dividend Fund, Rising Dividend Fund, Financial Services Fund and Small Cap Fund. The Adviser is entitled to an annual fee based on 0.75% of each of the Fund’s average daily net assets for the Ultra Short Municipal Income Fund and High Yield Managed Duration Municipal Fund.
The Adviser agreed to reimburse the Dynamic Dividend Fund, Rising Dividend Fund, Financial Services Fund and Small Cap Fund to the extent necessary to ensure that ordinary operating expenses (including 12b-1 fees, but excluding interest, brokerage commissions, acquired fund fees and extraordinary expenses) do not exceed annually 1.60% of each Fund’s Class A shares average daily net assets, and 1.35% of each Fund’s Institutional Class shares average daily net assets. The contractual expense cap for the Ultra Short Municipal Income Fund Class A shares and Institutional Class shares is 0.95% and 0.70%, respectively, as of October 31, 2015. The Adviser may recover expenses paid in excess of the cap on expenses for the three previous years, as long as the recovery does not cause the Fund to exceed such cap on expenses. The contractual expense cap for High Yield Managed Duration Municipal Fund Class A shares and Institutional Class shares is 1.05% and 0.80%, respectively. For the year ended October 31, 2015, the Adviser waived investment advisory fees and other expenses totaling $55,991, $137,078, $77,751, $4,300,255 and $115,542 for the Rising Dividend Fund, Financial Services Fund, Small Cap Fund, Ultra Short Municipal Income Fund and High Yield Managed Duration Municipal Fund, respectively. The expense limitations will remain in effect for each Fund through March 1, 2016 unless and until the Board of the Series and Income Trusts approve its modification or termination with respect to each Fund. Waived expenses subject to potential recovery by year of expiration are as follows:
| Years of Expiration | | Dynamic
Dividend
Fund | | Rising
Dividend
Fund | | Financial
Services
Fund | | Small Cap
Fund | | Ultra Short
Municipal
Income
Fund | | High Yield
Managed
Duration
Municipal Fund |
| 10/31/2016 | | $ | 144,069 | | | $ | 67,570 | | | $ | 58,369 | | | $ | 52,638 | | | $ | 4,236,779 | | | $ | 76,676 | |
| 10/31/2017 | | | 146,717 | | | | 44,557 | | | | — | | | | 37,668 | | | | 4,223,255 | | | | 106,330 | |
| 10/31/2018 | | | — | | | | 55,991 | | | | 137,078 | | | | 77,751 | | | | 4,300,255 | | | | 115,542 | |
For the year ended October 31, 2015, the Adviser voluntarily agreed to reimburse the Ultra Short Municipal Income Fund to the extent necessary to ensure that the Fund’s total operating expenses (including 12b-1 fees, where applicable, but excluding interest, brokerage commissions and extraordinary expenses) did not exceed 0.75% and 0.50% of the average daily net assets of the Class A shares and Institutional Class shares, respectively, during the year ended October 31, 2015.
The Adviser makes payments to intermediaries that provide omnibus account services, sub-accounting services and/or networking services with respect to the Funds. On February 2, 2012, the Board approved, subject to certain
103
Alpine Mutual Funds
Notes to Financial Statements—Continued
October 31, 2015
limitations, the reimbursement to the Adviser by the appropriate Fund, of up to a certain percentage of such fees paid by the Adviser to intermediaries that provide omnibus account services, sub-accounting services, and/or networking services. Reimbursement of these fees are subject to review by the Board and are included in the transfer agent fees in the Statements of Operations. The Dynamic Dividend Fund, Rising Dividend Fund, Financial Services Fund, Small Cap Fund and Ultra Short Municipal Income Fund and High Yield Managed Duration Municipal Fund incurred $150,815, $1,299, $32,935, $5,794, $489,620 and $253, respectively, in reimbursements to the Adviser.
State Street Bank and Trust Company (“SSBT”) serves as the fund accounting agent and custodian. The custodian is responsible for the safekeeping of the assets of the Funds and the fund accounting agent is responsible for calculating the Funds’ NAVs. SSBT, as the Funds’ custodian and fund accounting agent, is paid on the basis of net assets and transaction costs of the Funds. SSBT also serves as the administrator for the Series Trust and Income Trust. SSBT, as the Funds’ administrator, is paid on the basis of net assets of the Funds which are allocated among the series of the Series Trust and Income Trust, on the basis of relative net assets.
Boston Financial Data Services, Inc. (“BFDS”) serves as the transfer agent to the Equity Trust. BFDS is paid on the basis of net assets, per account fees and certain transaction costs.
During the year ended October 31, 2015, the Funds engaged in purchase and sale transactions with funds that have a common investment adviser (or affiliated investment advisers), common Directors/Trustees and/or common Officers. These purchase and sale transactions complied with Rule 17a-7 under the 1940 Act and were as follows:
| | | Purchases | | | Sales | |
| Ultra Short Municipal Income Fund | | $ | 11,755,000 | | | | $— | |
| 7. | Federal Income Tax Information: |
GAAP requires that certain components of net assets be reclassified to reflect permanent differences between financial and tax reporting. These reclassifications have no effect on net assets or net asset values per share of the Funds.
As of October 31, 2015, the components of distributable earnings on a tax basis were as follows:
| | | Dynamic
Dividend Fund | | | Rising Dividend
Fund | | | Financial
Services Fund | |
| Undistributed ordinary income | | $ | 475,543 | | | $ | 12,799 | | | $ | 247,738 | |
| Undistributed long-term capital gain | | | — | | | | 588,858 | | | | — | |
| Accumulated capital loss | | | (1,086,574,414 | ) | | | — | | | | (208,443 | ) |
| Unrealized appreciation/(depreciation) | | | 7,231,621 | | | | 13,008,162 | | | | 2,846,530 | |
| Total | | $ | (1,078,867,250 | ) | | $ | 13,609,819 | | | $ | 2,885,825 | |
| | | Small Cap Fund | | | Ultra Short
Municipal
Income Fund | | | High Yield
Managed
Duration
Municipal Fund | |
| Undistributed tax exempt income | | $ | — | | | $ | 90,395 | | | $ | 45,625 | |
| Late year ordinary loss deferral | | | (62,343 | ) | | | — | | | | — | |
| Accumulated capital loss | | | (8,038,502 | ) | | | (274,399 | ) | | | (3,311 | ) |
| Unrealized appreciation/(depreciation) | | | (57,125 | ) | | | 97,852 | | | | 574,124 | |
| Total | | $ | (8,157,970 | ) | | $ | (86,152 | ) | | $ | 616,438 | |
104
Alpine Mutual Funds
Notes to Financial Statements—Continued
October 31, 2015
Tax components of distributable earnings are determined in accordance with income tax regulations which may differ from the composition of net assets reported under GAAP. These permanent differences are primarily due to the differing treatment of gains (losses) related to foreign currency transactions, basis adjustments on certain equity securities designated as passive foreign investment companies, distribution redesignations, and net operating losses. Accordingly, for the year ended October 31, 2015, the effects of certain differences were reclassified as follows:
| Fund | | Capital stock | | Accumulated
net investment income (loss) | | Accumulated
net realized
gains (losses) |
| Dynamic Dividend Fund | | | $ | (25,935,315 | ) | | | | $ | 104,409 | | | | | $ | 25,830,906 | | |
| Rising Dividend Fund | | | | 11 | | | | | | (2,358 | ) | | | | | 2,347 | | |
| Financial Services Fund | | | | 17 | | | | | | 66,607 | | | | | | (66,624 | ) | |
| Small Cap Fund | | | | (96,234 | ) | | | | | 85,745 | | | | | | 10,489 | | |
As of October 31, 2015, net unrealized appreciation/(depreciation) of investments, excluding foreign currency, based on Federal tax costs was as follows:
| Fund | | Cost of
investments | | Gross
unrealized
appreciation | | Gross
unrealized
depreciation | | Net unrealized
appreciation/
(depreciation) |
| Dynamic Dividend Fund | | | $ | 178,448,739 | | | | | $ | 20,742,339 | | | | | $ | (13,458,138 | ) | | | | $ | 7,284,201 | | |
| Rising Dividend Fund | | | | 77,925,782 | | | | | | 14,170,227 | | | | | | (1,175,096 | ) | | | | | 12,995,131 | | |
| Financial Services Fund | | | | 20,927,690 | | | | | | 4,526,096 | | | | | | (1,676,575 | ) | | | | | 2,849,521 | | |
| Small Cap Fund | | | | 14,033,158 | | | | | | 1,407,734 | | | | | | (1,464,859 | ) | | | | | (57,125 | ) | |
| Ultra Short Municipal Income Fund | | | | 1,027,810,472 | | | | | | 171,436 | | | | | | (73,584 | ) | | | | | 97,852 | | |
| High Yield Managed Duration Municipal Fund | | | | 56,619,879 | | | | | | 723,815 | | | | | | (149,691 | ) | | | | | 574,124 | | |
The tax basis of investments for tax and financial reporting purposes differs principally due to the deferral of losses on wash sales, partnership tax adjustments, and mark-to-market cost basis adjustments for investments in passive foreign investment companies (PFICs) for tax purposes.
The tax character of distributions paid during the years ended October 31, 2015 and 2014 were as follows:
| | | 2015 | | 2014 |
| Dynamic Dividend Fund | | | | | | | | | | |
| Ordinary income | | | $ | 12,328,370 | | | | $ | 14,370,391 | |
| Total | | | $ | 12,328,370 | | | | $ | 14,370,391 | |
| Rising Dividend Fund | | | | | | | | | | |
| Ordinary income | | | $ | 230,058 | | | | $ | 172,291 | |
| Long-term capital gain | | | | 284,654 | | | | | 156,638 | |
| Total | | | $ | 514,712 | | | | $ | 328,929 | |
| Financial Services Fund | | | | | | | | | | |
| Ordinary income | | | $ | 390,835 | | | | $ | 7,300 | |
| Total | | | $ | 390,835 | | | | $ | 7,300 | |
| Small Cap Fund | | | | | | | | | | |
| Long-term capital gain | | | $ | — | | | | $ | — | |
| Total | | | $ | — | | | | $ | — | |
105
Alpine Mutual Funds
Notes to Financial Statements—Continued
October 31, 2015
| | | 2015 | | 2014 |
| Ultra Short Municipal Income Fund | | | | | | | | | | |
| Ordinary income | | | $ | 4,685 | | | | $ | 10,638 | |
| Exempt interest dividends | | | | 4,624,613 | | | | | 5,350,083 | |
| Total | | | $ | 4,629,298 | | | | $ | 5,360,721 | |
| High Yield Managed Duration Municipal Fund | | | | | | | | | | |
| Ordinary income | | | $ | 34,949 | | | | $ | 9,971 | |
| Exempt interest dividends | | | | 1,345,745 | | | | | 810,476 | |
| Total | | | $ | 1,380,694 | | | | $ | 820,447 | |
During the year ended October 31, 2015, the Ultra Short Municipal Income Fund utilized $149,302 of capital loss carryovers. Capital loss carryovers as of October 31, 2015 are as follows:
| Expiration Date | | Dynamic
Dividend Fund | | Rising
Dividend Fund | | Financial
Services Fund |
| 10/31/2016 | | $ | 536,971,822 | | | $ | — | | | $ | — | |
| 10/31/2017 | | $ | 388,131,987 | | | $ | — | | | $ | — | |
| 10/31/2018 | | $ | 154,525,095 | | | $ | — | | | $ | — | |
| 10/31/2019 | | $ | — | | | $ | — | | | $ | — | |
| Expiration Date | | Small Cap
Fund | | Ultra Short
Municipal
Income Fund | | High Yield
Managed
Duration
Municipal Fund |
| 10/31/2016 | | $ | 113,385 | | | $ | — | | | $ | — | |
| 10/31/2017 | | $ | 5,637,266 | | | $ | — | | | $ | — | |
| 10/31/2018 | | $ | 1,581,056 | | | $ | — | | | $ | — | |
| 10/31/2019 | | $ | 342,429 | | | $ | 67,228 | | | $ | — | |
During the year ended October 31, 2015, the Dynamic Dividend Fund expired $25,935,421 of capital loss carryovers.
Under the Regulated Investment Company (“RIC”) Modernization Act of 2010 (“the Modernization Act”), post-enactment capital losses that are carried forward will retain their character as either short-term or long-term capital losses rather than being considered all short-term as under previous law. However, any losses incurred during those future taxable years will be required to be utilized prior to the losses incurred in pre-enactment taxable years, which carry an expiration date. As a result of this ordering rule, pre-enactment capital loss carryovers may be more likely to expire unused. Capital loss carryover as of October 31, 2015 with no expiration are as follows:
| Fund | | Short-Term | | Long-Term |
| Dynamic Dividend Fund | | $ | 6,945,510 | | | $ | — | |
| Financial Services Fund | | $ | — | | | $ | 208,443 | |
| Small Cap Fund | | $ | 364,366 | | | $ | — | |
| Ultra Short Municipal Income Fund | | $ | 207,171 | | | $ | — | |
| High Yield Managed Duration Municipal Fund | | $ | 1,864 | | | $ | 1,447 | |
Certain ordinary losses incurred after December 31 and within the taxable year are deemed to arise on the first day of the Funds’ next taxable year, if the Funds so elect. For the year ended October 31, 2015, the following Funds elected to defer late-year ordinary losses:
| Fund | | Late Year
Ordinary Losses |
| Small Cap Fund | | | $(62,343) | |
106
Alpine Mutual Funds
Notes to Financial Statements—Continued
October 31, 2015
At a meeting held on July 31, 2015, the Board, unanimously approved the tax free reorganization of the Alpine Transformations Fund and the Alpine Equity Income Fund (the “Target Funds”) into the Alpine Accelerating Dividend Fund (the “Acquiring Fund”), a separate series of the Trust. On September 9, 2015, the Acquiring Fund was renamed Alpine Rising Dividend Fund and on October 23, 2015, acquired all of the net assets of the Target Funds in a tax-free exchange of shares pursuant to an Agreement and Plan of Reorganization approved by the Target Funds shareholders. The purpose of the transaction was to combine two portfolios with comparable investment objectives and strategies.
Alpine
Transformations
Fund | | Shares Prior to
Reorganization | | Shares Issued by
the Acquiring
Fund | | Net Assets Prior
to Reorganization |
| Institutional Class | | | 664,477 | | | | 507,899 | | | $ | 7,643,926 | |
| Class A | | | 13,727 | | | | 10,346 | | | $ | 155,703 | |
Alpine
Equity Income
Fund | | Shares Prior to
Reorganization | | Shares Issued by
the Acquiring
Fund | | Net Assets Prior
to Reorganization |
| Institutional Class | | | 6,042,454 | | | | 5,123,760 | | | $ | 77,113,107 | |
| Class A | | | 25,724 | | | | 21,756 | | | $ | 327,429 | |
The appreciation of the Transformations Fund and Equity Income Fund were $779,528 and $12,159,650, respectively, as of the date of the reorganization. The combined net assets of the Acquiring Fund immediately after the reorganization were $92,462,283.
Assuming the acquisition had been completed on November 1, 2014, the beginning of the reporting period of the Acquiring Fund, the Acquiring Fund’s pro forma results of operations for the period ended October 31, 2015, were as follows:
| Net Investment Income (Loss) | | $ | 1,329,773 | |
| Net Realized and Unrealized Gains/Losses on Investments and Foreign Currency Transactions | | $ | (603,933 | ) |
| Net Increase/Decrease in Net Assets resulting from Operations | | $ | 725,840 | |
Because the combined investment portfolios have been managed as a single integrated portfolio since the reorganization was completed, it is not practicable to separate the amounts of revenue and earnings of the Target Funds that have been included in the Acquiring Fund’s Statement of Operations as of October 31, 2015.
Distributions: The Dynamic Dividend Fund — Institutional Class and Class A Shares paid a distribution from net investment income of $968,837 and $20,881 or $0.02 and $0.0193 per share, respectively, on November 30, 2015 to shareholders of record on November 27, 2015.
107
Alpine Mutual Funds
Report of Independent Registered Public Accounting Firm
To the Shareholders and Board of Trustees of
Alpine Series Trust and Alpine Income Trust:
We have audited the accompanying statements of assets and liabilities, including the schedule of portfolio investments, of Alpine Series Trust (comprising, respectively, Alpine Dynamic Dividend Fund, Alpine Rising Dividend Fund (formerly Alpine Accelerating Dividend Fund), Alpine Financial Services Fund and Alpine Small Cap Fund); and Alpine Income Trust (comprising, respectively, Alpine High Yield Managed Duration Municipal Fund and Alpine Ultra Short Municipal Income Fund) (collectively the “Funds”) as of October 31, 2015, and the related statements of operations, changes in net assets and the financial highlights for the year then ended. These financial statements and financial highlights are the responsibility of the Funds’ management. Our responsibility is to express an opinion on these financial statements and financial highlights based on our audits. The statement of changes in net assets for the year ended October 31, 2014 and the financial highlights for the periods ended prior to November 1, 2014 were audited by another independent registered public accounting firm whose report, dated December 29, 2014, expressed an unqualified opinion on those financial statements and financial highlights.
We conducted our audits in accordance with the standards of the Public Company Accounting Oversight Board (United States). Those standards require that we plan and perform the audit to obtain reasonable assurance about whether the financial statements and financial highlights are free of material misstatement. We were not engaged to perform an audit of the Funds’ internal control over financial reporting. Our audits included consideration of internal control over financial reporting as a basis for designing audit procedures that are appropriate in the circumstances, but not for the purpose of expressing an opinion on the effectiveness of the Funds’ internal control over financial reporting. Accordingly, we express no such opinion. An audit also includes examining, on a test basis, evidence supporting the amounts and disclosures in the financial statements and financial highlights, assessing the accounting principles used and significant estimates made by management, and evaluating the overall financial statement presentation. Our procedures included confirmation of securities owned as of October 31, 2015, by correspondence with the custodian and others or by other appropriate auditing procedures where replies from others were not received. We believe that our audits provide a reasonable basis for our opinion.
In our opinion, the financial statements and financial highlights referred to above present fairly, in all material respects, the financial position of each of the respective portfolios constituting Alpine Series Trust and Alpine Income Trust at October 31, 2015, the results of their operations, changes in their net assets and the financial highlights for the year then ended in conformity with U.S. generally accepted accounting principles.

New York, NY
December 24, 2015
108
Alpine Mutual Funds
Information about your Funds Expenses
October 31, 2015
Fund expenses (Unaudited)
Example
As a shareholder of the Fund, you may incur two types of costs: (1) transaction costs, including front-end on purchase payments; and (2) ongoing costs, including management fees; service and/or distribution (12b-1) fees; and other Fund expenses. This example is intended to help you understand your ongoing costs (in dollars) of investing in the Fund and to compare these costs with the ongoing costs of investing in other mutual funds. This example is based on an investment of $1,000 invested on May 1, 2015 and held for the six months ended October 31, 2015.
Actual Expenses
The table below titled “Based on Actual Total Return” provides information about actual account values and actual expenses. You may use the information provided in this table, together with the amount you invested, to estimate the expenses that you paid over the period. To estimate the expenses you paid on your account, divide your ending account value by $1,000 (for example, an $8,600 ending account value divided by $1,000 = 8.6), then multiply the result by the number under the heading entitled “Expenses Paid During the Period”.
Hypothetical Example for Comparison Purposes
The table below titled “Based on Hypothetical Total Return” provides information about hypothetical account values and hypothetical expenses based on the actual expense ratio and an assumed rate of return of 5.00% per year before expenses, which is not the Fund’s actual return. The hypothetical account values and expenses may not be used to estimate the actual ending account balance or expenses you paid for the period. You may use the information provided in this table to compare the ongoing costs of investing in the Fund and other funds. To do so, compare the 5.00% hypothetical example relating to the Fund with the 5.00% hypothetical examples that appear in the shareholder reports of the other funds.
Please note that the expenses shown in the table below are meant to highlight your ongoing costs only and do not reflect any transactional costs, such as front-end or back-end sales charges (loads). Therefore, the table is useful in comparing ongoing costs only, and will not help you determine the relative total costs of owning different funds. In addition, if these transaction costs were included, your costs would have been higher.
Dynamic Dividend Fund
Based on actual total return(1)
| Class | | Actual Total
Return Without
Sales Charges (2) | | Beginning
Account Value | | Ending
Account Value | | Annualized
Expense
Ratio | | Expenses
Paid During
the Period (3) |
| Institutional | | | (4.73 | )% | | $ | 1,000.00 | | | | $952.70 | | | | 1.14 | % | | | $5.61 | |
| Class A | | | (4.86 | )% | | $ | 1,000.00 | | | | $951.40 | | | | 1.39 | % | | | $6.84 | |
Based on hypothetical total return(1)
| Class | | Hypothetical
Annualized
Total Return | | Beginning
Account Value | | Ending
Account Value | | Annualized
Expense
Ratio | | Expenses
Paid During
the Period (4) |
| Institutional | | | 5.00 | % | | $ | 1,000.00 | | | | $1,019.46 | | | | 1.14 | % | | | $5.80 | |
| Class A | | | 5.00 | % | | $ | 1,000.00 | | | | $1,018.20 | | | | 1.39 | % | | | $7.07 | |
109
Alpine Mutual Funds
Information about your Funds Expenses—Continued
October 31, 2015
Rising Dividend Fund
Based on actual total return(1)
| Class | | Actual Total
Return Without
Sales Charges (2) | | Beginning
Account Value | | Ending
Account Value | | Annualized
Expense
Ratio | | Expenses
Paid During
the Period (3) |
| Institutional | | | (4.85 | )% | | $ | 1,000.00 | | | $ | 951.50 | | | | 1.35 | % | | | $6.64 | |
| Class A | | | (4.95 | )% | | $ | 1,000.00 | | | $ | 950.50 | | | | 1.60 | % | | | $7.87 | |
Based on hypothetical total return(1)
| Class | | Hypothetical
Annualized
Total Return | | Beginning
Account Value | | Ending
Account Value | | Annualized
Expense
Ratio | | Expenses
Paid During
the Period (4) |
| Institutional | | | 5.00 | % | | $ | 1,000.00 | | | $ | 1,018.40 | | | | 1.35 | % | | | $6.87 | |
| Class A | | | 5.00 | % | | $ | 1,000.00 | | | $ | 1,017.14 | | | | 1.60 | % | | | $8.13 | |
Financial Services Fund
Based on actual total return(1)
| Class | | Actual Total
Return Without
Sales Charges (2) | | Beginning
Account Value | | Ending
Account Value | | Annualized
Expense
Ratio | | Expenses
Paid During
the Period (3) |
| Institutional | | | (6.07 | )% | | $ | 1,000.00 | | | $ | 939.30 | | | | 1.36 | % | | | $6.65 | |
| Class A | | | (6.19 | )% | | $ | 1,000.00 | | | $ | 938.10 | | | | 1.60 | % | | | $7.82 | |
Based on hypothetical total return(1)
| Class | | Hypothetical
Annualized
Total Return | | Beginning
Account Value | | Ending
Account Value | | Annualized
Expense
Ratio | | Expenses
Paid During
the Period (4) |
| Institutional | | | 5.00 | % | | $ | 1,000.00 | | | $ | 1,018.35 | | | | 1.36 | % | | | $6.92 | |
| Class A | | | 5.00 | % | | $ | 1,000.00 | | | $ | 1,017.14 | | | | 1.60 | % | | | $8.13 | |
Small Cap Fund
Based on actual total return(1)
| Class | | Actual Total
Return Without
Sales Charges (2) | | Beginning
Account Value | | Ending
Account Value | | Annualized
Expense
Ratio | | Expenses
Paid During
the Period (3) |
| Institutional | | | (1.34 | )% | | $ | 1,000.00 | | | $ | 986.60 | | | | 1.35 | % | | | $6.76 | |
| Class A | | | (1.48 | )% | | $ | 1,000.00 | | | $ | 985.20 | | | | 1.60 | % | | | $8.01 | |
| Based on hypothetical total return(1) | | | | | | | | | | |
| Class | | Hypothetical
Annualized
Total Return | | Beginning
Account Value | | Ending
Account Value | | Annualized
Expense
Ratio | | Expenses
Paid During
the Period (4) |
| Institutional | | | 5.00 | % | | $ | 1,000.00 | | | $ | 1,018.40 | | | | 1.35 | % | | | $6.87 | |
| Class A | | | 5.00 | % | | $ | 1,000.00 | | | $ | 1,017.14 | | | | 1.60 | % | | | $8.13 | |
110
Alpine Mutual Funds
Information about your Funds Expenses—Continued
October 31, 2015
Ultra Short Municipal Income Fund
Based on actual total return(1)
| Class | | Actual Total
Return Without
Sales Charges (2) | | Beginning
Account Value | | Ending
Account Value | | Annualized Expense
Ratio | | Expenses
Paid During
the Period (3) |
| Institutional | | | 0.29 | % | | $ | 1,000.00 | | | $ | 1,002.90 | | | | 0.50 | % | | | $2.52 | |
| Class A | | | 0.17 | % | | $ | 1,000.00 | | | $ | 1,001.70 | | | | 0.75 | % | | | $3.78 | |
Based on hypothetical total return(1)
| Class | | Hypothetical
Annualized
Total Return | | Beginning
Account Value | | Ending
Account Value | | Annualized
Expense
Ratio | | Expenses
Paid During
the Period (4) |
| Institutional | | | 5.00 | % | | $ | 1,000.00 | | | $ | 1,022.69 | | | | 0.50 | % | | | $2.55 | |
| Class A | | | 5.00 | % | | $ | 1,000.00 | | | $ | 1,021.43 | | | | 0.75 | % | | | $3.82 | |
High Yield Managed Duration Municipal Fund
Based on actual total return(1)
| Class | | Actual Total
Return Without
Sales Charges (2) | | Beginning
Account Value | | Ending
Account Value | | Annualized
Expense
Ratio | | Expenses
Paid During
the Period (3) |
| Institutional | | | 1.27 | % | | $ | 1,000.00 | | | $ | 1,012.70 | | | | 0.80 | % | | | $4.06 | |
| Class A | | | 1.16 | % | | $ | 1,000.00 | | | $ | 1,011.60 | | | | 1.07 | % | | | $5.43 | |
| Based on hypothetical total return(1) | | | | | | | | | | |
| Class | | Hypothetical
Annualized
Total Return | | Beginning
Account Value | | Ending
Account Value | | Annualized
Expense
Ratio | | Expenses
Paid During
the Period (4) |
| Institutional | | | 5.00 | % | | $ | 1,000.00 | | | $ | 1,021.17 | | | | 0.80 | % | | | $4.08 | |
| Class A | | | 5.00 | % | | $ | 1,000.00 | | | $ | 1,019.81 | | | | 1.07 | % | | | $5.45 | |
| (1) | For the six months ended October 31, 2015. |
| (2) | Assumes the reinvestment of all distributions, including returns of capital, if any, at net asset value and does not reflect the deduction of the applicable sales charge. Total return is not annualized, as it may not be representative of the total return for the year. Performance figures may reflect fee waivers and/or expense reimbursements. In the absence of fee waivers and/or expense reimbursements, the total return would have been lower. Past performance is no guarantee of future results. |
| (3) | Expenses (net of fee waivers and/or expense reimbursements) are equal to each class’ respective annualized expense ratio multiplied by the average account value over the period, multiplied by the number of days in the most recent fiscal half-year then divided by 365. |
| (4) | Hypothetical expense examples assume a 5% return over a hypothetical 184 day period. |
111
Alpine Mutual Funds
Additional Information (Unaudited)
October 31, 2015
The Fund’s Statement of Additional Information includes additional information about Trust Trustees and is available, without charge and upon request, by visiting www.alpinefunds.com.
Independent Trustees
Name, Address
and Year of Birth | | Position(s)
Held with
the Trusts | | Term of Office
and Length of
Time Served | | Principal Occupation During
Past Five Years | | Number of
Portfolios in
Fund
Complex
Overseen by
Trustee* | | Other Directorships
Held by Trustee |
| H. Guy Leibler (1954) | | Independent Trustee | | Indefinite, since the Trust’s inception | | President, Simone Healthcare development (since 2013); Private investor (since 2007). | | 13 | | Chairman Emeritus, White Plains Hospital Center (1988 to Present); Trustee of each of the Alpine Trusts (1996 to Present).** |
| Jeffrey E. Wacksman (1960) | | Independent Trustee | | Indefinite, since 2004 | | Partner, Loeb, Block & Partners LLP, (law firm) (since 1994). | | 13 | | Director, International Succession Planning Association; Director, Bondi Icebergs Inc. (women’s sportswear); Director, MH Properties, Inc. (a real estate holding company); Trustee of each of the Alpine Trusts.** |
| James A. Jacobson (1945) | | Independent Trustee | | Indefinite, since 2009 | | Retired, (since 2008); Vice Chairman and Managing Director, Spear Leeds & Kellogg Specialists, LLC (sales and trading firm) (2003 to 2008). | | 13 | | Trustee of Allianz Global Investors Multi-Funds (2009 to Present); Trustee of PIMCO Closed-End Funds (since 2014); Trustee of PIMCO Managed Accounts Trust (since 2014); Trustee of each of the Alpine Trusts.** |
| Eleanor T.M. Hoagland (1951) | | Independent Trustee | | Indefinite, since October 2012 | | Principal, VCS Advisory, LLC (since 2011); Chief Compliance Officer and Senior Managing Director of Magni Asset Management LLC (since 2011) and Park Fifth Capital Management LLC (2011-2013); Vice President (2008 to 2010) and CCO (2009 to 2010), Ameriprise Financial Inc. | | 13 | | Trustee of each of the Alpine Trusts.** |
| * | The term “Fund Complex” refers to the Funds in the Alpine Equity Trust, Alpine Series Trust, Alpine Income Trust, Alpine Global Dynamic Dividend Fund, Alpine Total Dynamic Dividend Fund and Alpine Global Premier Properties Fund (the “Alpine Trusts”). |
112
Alpine Mutual Funds
Additional Information (Unaudited)—Continued
October 31, 2015
Interested Trustees & Officers
Name, Address
and Year of Birth | | Position(s)
Held with
the Trusts | | Term of Office
and Length of
Time Served | | Principal Occupation During
Past Five Years | | # of
Portfolios in
Fund Complex
Overseen
by Trustee* | | Other Directorships
Held by Trustee |
| Samuel A. Lieber*** (1956) | | Interested Trustee and President | | Indefinite, since the Trust’s inception | | Chief Executive Officer, Alpine Woods Capital Investors, LLC (since 1997); President of Alpine Trusts (since 1998). | | 13 | | Trustee of each of the Alpine Trusts.** |
| Stephen A. Lieber**** (1925) | | Vice President | | Indefinite, since the Trust’s inception | | Chairman and Senior Portfolio Manager, Saxon Woods Advisors, LLC (since 1999). | | 13 | | N/A |
| Kenneth Corrado (1964) | | Chief Compliance Officer | | Indefinite, since July 2013 | | Chief Compliance Officer, Alpine Woods Capital Investors, LLC (since July 2013); Independent Compliance Consultant (2012 to 2013); Vice President and Deputy Chief Compliance Officer, Artio Global Management, LLC (2007 to 2012). | | 13 | | N/A |
| Ronald G. Palmer, Jr. (1968) | | Chief Financial Officer | | Indefinite, since 2010 | | Chief Financial Officer, Alpine Woods Capital Investors, LLC (since January 2010). | | 13 | | N/A |
| Joe C. Caruso (1971) | | Treasurer | | Indefinite, since July 2013 | | Fund Accountant, Alpine Woods Capital Investors, LLC since 2011; Independent Tax Consultant (2010 to 2011); Assistant Vice President Global Fund Services, Deutsche Bank AG (2009 to 2010). | | 13 | | N/A |
| Andrew Pappert (1980) | | Secretary | | Indefinite, since 2009 | | Director of Fund Operations, Alpine Woods Capital Investors, LLC (since September 2008). | | 13 | | N/A |
| * | As of October 31, 2015, Alpine Woods Capital Investors, LLC manages thirteen portfolios within the six investment companies that comprise the Alpine Trusts. The Alpine Equity Trust, Alpine Series Trust and Alpine Income Trust are each registered as an open-end management investment company. The Alpine Global Dynamic Dividend Fund, Alpine Total Dynamic Dividend Fund and Alpine Global Premier Properties Fund are each registered as a closed-end management investment company. As of October 31, 2015, the Trustees oversee thirteen portfolios within the six Alpine Trusts. |
| ** | The Trustees are members of the Board of Trustees for each of the Alpine Equity Trust, Alpine Income Trust, Alpine Series Trust, Alpine Global Dynamic Dividend Fund, Alpine Total Dynamic Dividend Fund and Alpine Global Premier Properties Fund (the “Alpine Trusts”). Shareholders may contact the Trustee at c/o Alpine Woods Capital Investors, LLC, 2500 Westchester Ave., Suite 215, Purchase NY, 10577. Each Trust’s Statement of Additional Information (“SAI”) includes additional information about the Trustees and is available, without charge, by calling 1-888-785-5578. |
| *** | Denotes Trustees who are “interested persons” of the Trust or Fund under the 1940 Act. |
| **** | Stephen A. Lieber is the father of Samuel A. Lieber. |
113
Alpine Mutual Funds
Additional Information (Unaudited)—Continued
October 31, 2015
Tax Information
The Funds designated the following percentages of dividends declared from net investment income for the fiscal year ended October 31, 2015 as qualified dividend income under the Jobs & Growth Tax Relief Reconciliation Act of 2003.
| Dynamic Dividend Fund | | | 65 | % |
| Rising Dividend Fund | | | 98 | % |
| Financial Services Fund | | | 100 | % |
| Small Cap Fund | | | 0 | % |
| Ultra Short Municipal Income Fund | | | 0 | % |
| High Yield Managed Duration Municipal Fund | | | 0 | % |
The Funds designated the following percentages of dividends declared during the fiscal year ended October 31, 2015 as dividends qualifying for the dividends received deduction available to corporate shareholders.
| Dynamic Dividend Fund | | | 28 | % |
| Rising Dividend Fund | | | 82 | % |
| Financial Services Fund | | | 67 | % |
| Small Cap Fund | | | 0 | % |
| Ultra Short Municipal Income Fund | | | 0 | % |
| High Yield Managed Duration Municipal Fund | | | 0 | % |
The Funds designated the following percentages of taxable ordinary income distributions as short-term capital gain distributions under Internal Revenue Section 871(k)(2)(C).
| Dynamic Dividend Fund | | | 0 | % |
| Rising Dividend Fund | | | 0 | % |
| Financial Services Fund | | | 0 | % |
| Small Cap Fund | | | 0 | % |
| Ultra Short Municipal Income Fund | | | 0 | % |
| High Yield Managed Duration Municipal Fund | | | 46 | % |
The Fund designated as long-term capital gain dividend, pursuant to Internal Revenue Code Section 852(b)(3), the amount necessary to reduce the earnings and profits of the Fund related to net capital gain to zero for the tax year ended October 31, 2015.
Change in Independent Registered Public Accounting Firm
Effective June 25, 2015, Deloitte & Touche LLP (“D&T”) was replaced as the independent registered public accounting firm to each series (the “Funds”) of the following trusts: Alpine Series Trust (on behalf of its series, Alpine Dynamic Dividend Fund, Alpine Rising Dividend Fund, Alpine Financial Services Fund and Alpine Small Cap Fund); Alpine Equity Trust (on behalf of its series, Alpine International Real Estate Equity Fund, Alpine Realty Income & Growth Fund, Alpine Emerging Markets Real Estate Fund and Alpine Global Infrastructure Fund); and Alpine Income Trust (on behalf of its series, Alpine Ultra Short Municipal Income Fund, and Alpine High Yield Managed Duration Municipal Fund) (the “Trusts”). The Board of Trustees of each Trust approved the dismissal upon recommendation by the Audit Committee of each Board.
D&T’s reports on the Funds’ financial statements for the fiscal years ended October 31, 2014 and October 31, 2013 contained no adverse opinion or disclaimer of opinion nor were they qualified or modified as to uncertainty, audit scope or accounting principles.
During the Funds’ fiscal years ended October 31, 2014 and October 31, 2013 and during the period from November 1, 2014 through the date of this semi-annual report, (i) there were no disagreements with D&T on any matter of accounting principles or practices, financial statement disclosure or auditing scope or procedure, which disagreements, if not resolved to the satisfaction of D&T, would have caused them to make reference to the subject matter of the disagreements in connection with their reports on the Funds’ financial statements for such periods, and (ii) there were no “reportable events” of the kind described in Item 304(a)(1)(v) of Regulation S-K under the Securities Exchange Act of 1934, as amended.
On June 25, 2015, upon recommendation of the Audit Committee of each Trust’s Board of Trustees, each Trust’s Board of Trustees approved the engagement of Ernst & Young LLP (“E&Y”) as each Fund’s independent registered public
114
Alpine Mutual Funds
Additional Information (Unaudited)—Continued
October 31, 2015
accounting firm for the fiscal year ended October 31, 2015. The selection of E&Y does not reflect any disagreements with or dissatisfaction by the Trusts or the Boards of Trustees with the performance of the Funds’ prior independent registered public accounting firm, D&T.
During the Funds’ fiscal years ended October 31, 2014 and October 31, 2013, and during the period from November 1, 2014 through the date of this semi-annual report neither the Funds, nor anyone on their behalf, consulted with E&Y on items which: (i) concerned the application of accounting principles to a specified transaction, either completed or proposed, or the type of audit opinion that might be rendered on the Funds’ financial statements; or (ii) concerned the subject of a “disagreement” (as defined in paragraph (a)(1)(iv) of Item 304 of Regulation S-K) or a “reportable event” (as described in paragraph (a)(1)(v) of said Item 304).
Availability of Proxy Voting Information
The policies and procedures used in determining how to vote proxies relating to portfolio securities are available without a charge, upon request, by contacting the Funds at 1(800) 617.7616 and on the SEC’s web site at http://www.sec.gov.
Information regarding how the Funds voted proxies relating to portfolio securities during the most recent twelve-month period ended June 30 is available without charge, upon request, by contacting the Fund at 1(800) 617.7616 and on the SEC’s web site at http://www.sec.gov.
Availability of Quarterly Portfolio Schedule
Beginning with each Fund’s fiscal quarter ended July 31, 2004, each Fund filed its complete schedule of portfolio holdings on Form N-Q with the SEC. Going forward, each Fund will file Form N-Q for the first and third quarters of each fiscal year on Form N-Q. Each Fund’s Form N-Q is available on the SEC’s website at www.sec.gov and may be reviewed and copied at the SEC’s Public Reference Room in Washington, DC. Information on the operation of the Public Reference Room may be obtained by calling 1-202-551-8090.
115
Alpine Mutual Funds
Additional Information (Unaudited)—Continued
October 31, 2015
Privacy Policy
The Funds collect non-public information about you from the following sources:
| | • | information we receive about you on applications or other forms; |
| | • | information you give us orally; and |
| | • | information about your transactions with others or us. |
The Funds do not disclose any non-public personal information about our customers or former customers without the customer’s authorization, except as required by law or in response to inquiries from governmental authorities. The Funds restrict access to your personal and account information to those employees who need to know that information to provide products and services to you. The Funds also may disclose that information to unaffiliated third parties (such as to brokers or custodians) only as permitted by law and only as needed for us to provided agreed services to you. The Funds maintain physical, electronic and procedural safeguards to guard your non-public personal information.
In the event that you hold shares of the Funds through a financial intermediary, including, but not limited to a broker dealer, bank or trust company, the privacy policy of your financial intermediary would govern how your non-public personal information would be shared with unaffiliated third parties.
Shareholder Meeting
On October 16, 2015, a Special Meeting of Shareholders of the Alpine Equity Income Fund and the Alpine Transformations Fund (each a “Fund”), each a series of Alpine Series Trust (the “Trust”), met to vote to approve an Agreement and Plan of Reorganization, providing for: (i) the acquisition of all of the assets of the Alpine Equity Income Fund and Alpine Transformations Fund by the Alpine Rising Dividend Fund (the “Acquiring Fund”), in exchange for the assumption of all of the liabilities of the Alpine Equity Income Fund and Alpine Transformations Fund for shares of the Acquiring Fund to be distributed to the shareholders of the Alpine Equity Income Fund and Alpine Transformations Fund; and (ii) the subsequent termination of the Alpine Equity Income Fund and Alpine Transformations Fund as a series of the Trust:
Proposal 1: to approve an Agreement and Plan of Reorganization for the Alpine Equity Income Fund.
| | For | 99.96% |
| | Against | 0.04% |
| | Abstain | 0.00% |
Proposal 2: to approve an Agreement and Plan of Reorganization for the Alpine Transformations Fund.
| | For | 99.76% |
| | Against | 0.24% |
| | Abstain | 0.00% |
116
TRUSTEES
Samuel A. Lieber
Eleanor T.M. Hoagland
James A. Jacobson
H. Guy Leibler
Jeffrey E.Wacksman
CUSTODIAN &
ADMINISTRATOR
State Street Bank & Trust Company
One Lincoln Street
Boston, MA 02111
INDEPENDENT REGISTERED
PUBLIC ACCOUNTING FIRM
Ernst & Young
5 Times Square
New York, NY 10019
FUND COUNSEL
Willkie Farr & Gallagher LLP
787 7th Avenue
New York, NY 10019
DISTRIBUTOR
Quasar Distributors, LLC
615 East Michigan Street
Milwaukee,WI 53202
INVESTMENT ADVISER
Alpine Woods Capital Investors, LLC
2500 Westchester Ave., Suite 215
Purchase, NY 10577
TRANSFER AGENT
Boston Financial Data Services
2000 Crown Colony Drive
Quincy, MA 02169

SHAREHOLDER | INVESTOR INFORMATION
1(888)785.5578
www.alpinefunds.com
This material must be preceded or accompanied by a current prospectus.
Item 2. Code of Ethics
| (a) | The Registrant, as of the end of the period covered by the report, has adopted a code of ethics that applies to the Registrant’s principal executive officer, principal financial officer, principal accounting officer or controller or persons performing similar functions. |
| (c) | There have been no amendments, during the period covered by this report, to a provision of the code of ethics that applies to the Registrant’s principal executive officer, principal financial officer, principal accounting officer or controller, or persons performing similar functions and that relates to any element of the code of ethics described in Item 2(b) of Form N-CSR. |
| (d) | The Registrant has not granted any waivers, including an implicit waiver, from a provision of the code of ethics that applies to the Registrant’s principal executive officer, principal financial officer, principal accounting officer or controller, or persons performing similar functions that relates to any element of the code of ethics described in Item 2(b) of Form N-CSR. |
| (f) | The Registrant’s Code of Ethics is attached as EX-99.CODE ETH hereto. |
Item 3. Audit Committee Financial Expert
| (a)(1) | The Board of Trustees of the Registrant has determined that the Registrant has at least one audit committee financial expert serving on its audit committee. |
| (a)(2) | The Board of Trustees has determined that James A. Jacobson and H. Guy Leibler are audit committee financial experts. Messrs. Jacobson and Leibler are “independent” as defined in paragraph (a)(2) of Item 3 to Form N-CSR. It has been determined that Mr. Jacobson qualifies as an audit committee financial expert based on his extensive experience in the financial services industry, including serving for more than 15 years as a senior executive at a New York Stock Exchange (“NYSE”) specialist firm and as a member of the NYSE Board of Directors (including terms as Vice Chair), his other board service, as well as his educational background. It has been determined that Mr. Leibler qualifies as an audit committee financial expert based on his substantial experience as a senior executive of an operating company actively supervising principal financial officers in the preparation of financial statements, other board service, as well as his educational background. |
Item 4. Principal Accountant Fees and Services
| (a) | Audit Fees: The aggregate fees billed for each of the last two fiscal years for professional services rendered by the principal accountant for the audit of the Registrant’s annual financial statements or services that are normally provided by the accountant in connection with statutory and regulatory filings or engagements for fiscal year 2014 was $115,587 and fiscal year 2015 was $105,931. |
| (b) | Audit-Related Fees: The aggregate fees billed in each of the last two fiscal years for assurance and related services by the principal accountant that are reasonably related to the performance of the audit of the Registrant’s financial statements and are not reported under paragraph (a) of this Item was $0 in fiscal year 2014 and $292 in fiscal year 2015. The fees in fiscal year 2015 were for professional services for auditor transition. |
| (c) | Tax Fees: The aggregate fees billed in each of the last two fiscal years for professional services rendered by the principal accountant for tax compliance, tax advice, and tax planning was $18,768 in fiscal year 2014 and $9,660 in fiscal year 2015. |
| (d) | All Other Fees: The aggregate fees billed in each of the last two fiscal years for products and services provided by the principal accountant, other than the services reported in paragraphs (a) through (c) of this Item was $6,725 in fiscal year 2014 and $0 in fiscal year 2015. The fees in fiscal year 2014 were for consulting and advisory services regarding enterprise risk management. |
| (e)(1) | Audit Committee Pre-Approval Policies and Procedures: All services to be performed by the Registrant’s principal auditors must be pre-approved by the Registrant’s audit committee, which may include the approval of certain services up to an amount determined by the audit committee. Any services that would exceed that amount would require additional approval of the audit committee. |
| (e)(2) | No services described in paragraphs (b) through (d) were approved pursuant to paragraph (c)(7)(i)(C) of Rule 2-01 of Regulation S-X. |
| (g) | The aggregate non-audit fees billed by the Registrant’s accountant for services rendered to the Registrant, and the Registrant’s investment adviser, and any entity controlling, controlled by, or under common control with the adviser that provides ongoing services to the Registrant was $67,250 in fiscal year 2014 and $0 in fiscal year 2015. The fees in fiscal year 2014 were for consulting and advisory services regarding enterprise risk management. |
Item 5. Audit Committee of Listed Registrants
Not applicable to registrants who are not listed issuers (as defined in Rule 10A-3 under the Securities Exchange Act of 1934).
Item 6. Schedule of Investments
| (a) | Schedule of Investments is included as part of Item 1 of the Form N-CSR. |
Item 7. Disclosure of Proxy Voting Policies and Procedures for Closed-End Management Investment Companies.
Not applicable to open-end investment management companies.
Item 8. Portfolio Managers of Closed-End Management Investment Companies.
Not applicable to open-end investment management companies.
Item 9. Purchases of Equity Securities by Closed-End Management Investment Company and Affiliated Purchasers.
Not applicable to open-end investment management companies.
Item 10. Submission of Matters to a Vote of Security Holders.
There were no material changes to the procedures by which shareholders may recommend nominees to the Registrant’s Board of Trustees.
Item 11. Controls and Procedures.
| (a) | The Registrant’s principal executive officer and principal financial officer have evaluated the registrant’s disclosure controls and procedures (as defined in Rule 30a-3(c) under the Investment Company Act of 1940, as amended) within 90 days of this filing and have concluded that the Registrant’s disclosure controls and procedures were effective, as of that date. |
| (b) | There was no change in the Registrant’s internal control over financial reporting (as defined in Rule 30a-3(d) under the Investment Company Act of 1940, as amended) during the second fiscal quarter of the period covered by this report that has materially affected, or is reasonably likely to materially affect, the Registrant’s internal control over financial reporting. |
Item 12. Exhibits
| (a)(1) | The Code of Ethics that applies to the Registrant’s principal executive officer and principal financial officer is attached hereto as Exhibit EX-99.CODE ETH12.A.1. |
| (a)(2) | The certifications required by Rule 30a-2(a) of the Investment Company Act of 1940, as amended, and Section 302 of the Sarbanes-Oxley Act of 2002 are attached hereto as Ex-99.Cert. |
| (b) | The certifications by the Registrant’s Principal Executive Officer and Principal Financial Officer, as required by Rule 30a-2(b) of the Investment Company Act of 1940, as amended, and Section 906 of the Sarbanes-Oxley Act of 2002 are attached hereto as Ex-99.906Cert. |
SIGNATURES
Pursuant to the requirements of the Securities Exchange Act of 1934 and the Investment Company Act of 1940, the registrant has duly caused this report to be signed on its behalf by the undersigned, thereunto duly authorized.
Alpine Income Trust
| By: | /s/ Samuel A. Lieber | |
| | Samuel A. Lieber |
| | Chief Executive Officer (Principal Executive Officer) |
| | |
| Date: | December 31, 2015 |
Pursuant to the requirements of the Securities Exchange Act of 1934 and the Investment Company Act of 1940, this report has been signed below by the following persons on behalf of the registrant and in the capacities and on the dates indicated.
| By: | /s/ Samuel A. Lieber | |
| | Samuel A. Lieber |
| | Chief Executive Officer (Principal Executive Officer) |
| By: | /s/ Ronald G. Palmer, Jr. | |
| | Ronald G. Palmer, Jr. |
| | Chief Financial Officer (Principal Financial Officer) |
| | |
| Date: | December 31, 2015 |