| Investment Company Act file number | 811-21213 |
| Registrant’s telephone number, including area code: | (312) 917-7700 |
| Date of fiscal year end: | October 31 |
| Date of reporting period: | October 31, 2023 |
| ITEM 1. | REPORTS TO STOCKHOLDERS. |
 | Closed-End Funds | October 31, 2023 |
| Nuveen Quality Municipal Income Fund | NAD | |||
Nuveen AMT-Free Quality Municipal Income Fund | NEA | |||
| 3 | ||||
| 4 | ||||
| 5 | ||||
| 7 | ||||
| 8 | ||||
| 10 | ||||
| 14 | ||||
| 17 | ||||
| 18 | ||||
| 19 | ||||
| 125 | ||||
| 126 | ||||
| 127 | ||||
| 128 | ||||
| 130 | ||||
| 133 | ||||
| 146 | ||||
| 167 | ||||
| 168 | ||||
| 169 | ||||
| 171 | ||||
| 178 | ||||
 | Dear Shareholders, Financial markets spent the past year focused on the direction of inflation and whether policy makers would be able to deliver a soft landing in their economies. After more than a year and a half of interest rate increases by the U.S. Federal Reserve (Fed) and other central banks, financial conditions have tightened and inflation rates have cooled considerably. The Fed increased the target fed funds rate from near zero in March 2022 to a range of 5.25% to 5.50% as of November 2023, with pauses in June 2023, September 2023 and November 2023. But current inflation rates remain above central banks’ targets, and the trajectory from here is difficult to predict given that monetary policy acts on the economy with long and variable lags. Surprisingly, economies were relatively resilient for much of 2023. By year-end, the “most predicted recession” had yet to materialize in the U.S., while U.K. and European economic growth was just beginning to show signs of stagnation or decline. U.S. gross domestic product rose 5.2% in the third quarter of 2023, 2.1% in the second quarter of 2023 and 2.0% in the first quarter of 2023, after growing 2.1% in 2022 overall compared to 2021. Much of the growth was driven by a relatively strong jobs market, which kept consumer sentiment and spending elevated despite long-term interest rates nearing multi-year highs, a series of U.S. regional bank failures and shocks from flaring geopolitical tensions.While central banks are likely nearing the end of this interest rate hiking cycle, there are still upside risks to inflation and downside risks to the economy. Some labor market and consumer indicators are softening. Government funding and deficits remain a concern, especially as the U.S. election year gets underway. The markets will continue to try to anticipate monetary policy shifts as the Fed evaluates incoming data and adjusts its rate setting activity on a meeting-by-meeting On behalf of the other members of the Nuveen Fund Board, we look forward to continuing to earn your trust in the months and years ahead.  Terence J. Toth Chair of the Board December 22, 2023 |
NAD | NEA | |||||||
Effective Leverage * | 42.58% | 42.58% | ||||||
Regulatory Leverage * | 41.47% | 41.52% | ||||||
| * | Effective Leverage is a Fund’s effective economic leverage, and includes both regulatory leverage and the leverage effects of certain derivative and other investments in a Fund’s portfolio that increase the Fund’s investment exposure. Currently, the leverage effects of Tender Option Bond (TOB) inverse floater holdings are included in effective leverage values, in addition to any regulatory leverage. Regulatory leverage consists of preferred shares issued or borrowings of a Fund. Both of these are part of a Fund’s capital structure. A Fund, however, may from time to time borrow on a typically transient basis in connection with its day-to-day |
Variable Rate Preferred* | Variable Rate Remarketed Preferred** | |||||||||||
Fund | Shares Issued at Liquidation Preference | Shares Issued at Liquidation Preference | Total | |||||||||
| NAD | $1,406,500,000 | $ 504,300,000 | $1,910,800,000 | |||||||||
| NEA | $ 643,000,000 | $ 1,728,300,000 | $2,371,300,000 | |||||||||
Per Common Share Amounts | ||||||||
Monthly Distributions (Ex-Dividend Date) | NAD | NEA | ||||||
| November | $0.0465 | $0.0445 | ||||||
| December | 0.0465 | 0.0445 | ||||||
| January | 0.0395 | 0.0350 | ||||||
| February | 0.0395 | 0.0350 | ||||||
| March | 0.0395 | 0.0350 | ||||||
| April | 0.0380 | 0.0350 | ||||||
| May | 0.0380 | 0.0350 | ||||||
| June | 0.0380 | 0.0350 | ||||||
| July | 0.0380 | 0.0350 | ||||||
| August | 0.0380 | 0.0350 | ||||||
| September | 0.0380 | 0.0350 | ||||||
| October | 0.0380 | 0.0350 | ||||||
Total Distributions from Net Investment Income | $0.4775 | $0.4390 | ||||||
Yields | NAD | NEA | ||||||
Market Yield 1 | 4.65 | % | 4.44% | |||||
Taxable-Equivalent Yield 1 | 7.84 | % | 7.49% | |||||
| 1 | Market Yield is based on the Fund’s current annualized monthly dividend divided by the Fund’s current market price as of the end of the reporting period. Taxable- Equivalent Yield represents the yield that must be earned on a fully taxable investment in order to equal the yield of the Fund on an after-tax basis. It is based on a federal income tax rate of 40.8%. Your actual federal income tax rate may differ from the assumed rate. The Taxable-Equivalent Yield also takes into account the percentage of the Fund’s income generated and paid by the Fund (based on payments made during the previous calendar year) that was not exempt from federal income tax. Separately, if the comparison were instead to investments that generate qualified dividend income, which is taxable at a rate lower than an individual’s ordinary graduated tax rate, the fund’s Taxable-Equivalent Yield would be lower. |
NAD | NEA | |||||||
| Common shares cumulatively repurchased and retired | 17,900 | 120,000 | ||||||
| Common shares authorized for repurchase | 23,340,000 | 29,900,000 | ||||||
NEA | ||||
| Common shares repurchased and retired | 45,000 | |||
| Weighted average price per common share repurchased and retired | $ 9.88 | |||
| Weighted average discount per common share repurchased and retired | (17.23)% | |||
NAD | NEA | |||||||
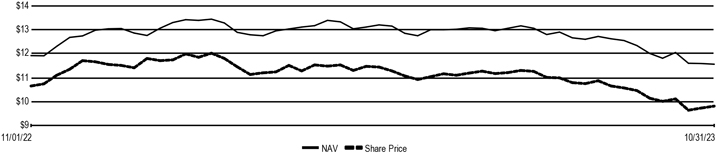
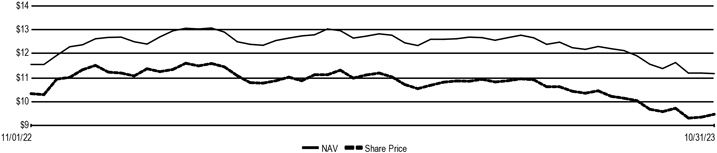
| Common share NAV | $11.56 | $11.17 | ||||||
| Common share price | $9.81 | $9.47 | ||||||
| Premium/(Discount) to NAV | (15.14)% | (15.22)% | ||||||
| Average premium/(discount) to NAV | (13.10)% | (13.31)% | ||||||
| NAD | Nuveen Quality Municipal Income Fund Performance Overview and Holding Summaries October 31, 2023 |
Total Returns as of | ||||||||||||||||
October 31, 2023 | ||||||||||||||||
Average Annual | ||||||||||||||||
Inception Date | 1-Year | 5-Year | 10-Year | |||||||||||||
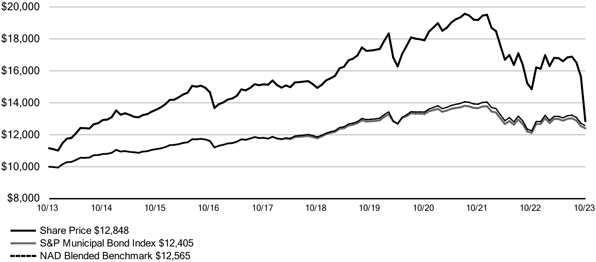
| NAD at Common Share NAV | 5/26/99 | 1.26% | (0.15)% | 2.62% | ||||||||||||
| NAD at Common Share Price | 5/26/99 | (3.68)% | (0.03)% | 2.54% | ||||||||||||
| S&P Municipal Bond Index | – | 2.36% | 1.04% | 2.18% | ||||||||||||
| NAD Blended Benchmark | – | 2.57% | 1.15% | 2.31% | ||||||||||||
Fund Allocation (% of net assets) | ||||
| Municipal Bonds | 168.8% | |||
| Investment Companies | 0.0% | |||
| Short-Term Municipal Bonds | 2.7% | |||
| Other Assets & Liabilities, Net | 2.3% | |||
| Floating Rate Obligations | (2.9)% | |||
| AMTP Shares, Net | (27.0)% | |||
| MFP Shares, Net | (25.2)% | |||
| VRDP Shares, Net | (18.7)% | |||
Net Assets | 100% | |||
Bond Credit Quality (% of total investment exposure) | ||||
| U.S. Guaranteed | 6.7% | |||
| AAA | 2.3% | |||
| AA | 27.1% | |||
| A | 37.4% | |||
| BBB | 14.9% | |||
| BB or Lower | 5.2% | |||
| N/R (not rated) | 6.4% | |||
Total | 100% | |||
Portfolio Composition | ||||
(% of total investments) | ||||
| Transportation | 27.9% | |||
| Health Care | 19.3% | |||
| Tax Obligation/Limited | 15.5% | |||
| Tax Obligation/General | 10.6% | |||
| Utilities | 9.4% | |||
| U.S. Guaranteed | 6.7% | |||
| Education and Civic Organizations | 4.2% | |||
| Other | 6.4% | |||
| Investment Companies | 0.0% | |||
Total | 100% | |||
States and Territories 1 | ||||
(% of total municipal bonds) | ||||
| Texas | 10.6% | |||
| Illinois | 9.0% | |||
| Colorado | 8.1% | |||
| California | 6.9% | |||
| New York | 6.1% | |||
| Florida | 5.7% | |||
| Maryland | 5.7% | |||
| Pennsylvania | 3.8% | |||
| Missouri | 3.4% | |||
| New Jersey | 3.1% | |||
| South Carolina | 3.0% | |||
| Ohio | 2.5% | |||
| Michigan | 2.4% | |||
| Louisiana | 2.1% | |||
| Washington | 2.0% | |||
| Minnesota | 1.9% | |||
| Wisconsin | 1.7% | |||
| Arizona | 1.7% | |||
| Utah | 1.5% | |||
| Oregon | 1.4% | |||
| Other | 17.4% | |||
Total | 100% | |||
| 1 | See the Portfolio of Investments for the remaining states comprising “Other” and not listed in the table above. |
| NEA | Nuveen AMT-Free Quality Municipal Income FundPerformance Overview and Holding Summaries October 31, 2023 |
Total Returns as of | ||||||||||||||||
October 31, 2023 | ||||||||||||||||
Average Annual | ||||||||||||||||
Inception Date | 1-Year | 5-Year | 10-Year | |||||||||||||
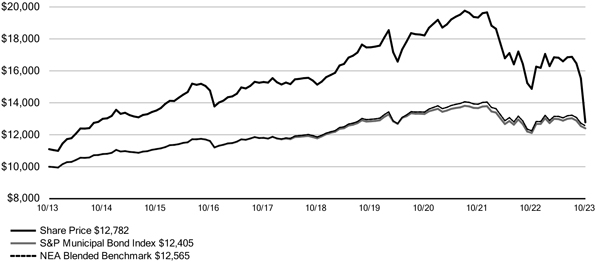
| NEA at Common Share NAV | 11/21/02 | 0.72% | (0.50)% | 2.64% | ||||||||||||
| NEA at Common Share Price | 11/21/02 | (4.42)% | (0.31)% | 2.48% | ||||||||||||
| S&P Municipal Bond Index | – | 2.36% | 1.04% | 2.18% | ||||||||||||
| NEA Blended Benchmark | – | 2.57% | 1.15% | 2.31% | ||||||||||||
Fund Allocation | ||||
(% of net assets) | ||||
| Municipal Bonds | 169.1% | |||
| Short-Term Municipal Bonds | 1.7% | |||
| Other Assets & Liabilities, Net | 2.4% | |||
| Floating Rate Obligations | (2.3)% | |||
| AMTP Shares, Net | (5.2)% | |||
| MFP Shares, Net | (31.1)% | |||
| VRDP Shares, Net | (34.6)% | |||
Net Assets | 100% | |||
Bond Credit Quality | ||||
(% of total investment exposure) | ||||
| U.S. Guaranteed | 7.6% | |||
| AAA | 2.3% | |||
| AA | 33.5% | |||
| A | 35.2% | |||
| BBB | 13.1% | |||
| BB or Lower | 3.1% | |||
| N/R (not rated) | 5.2% | |||
Total | 100% | |||
Portfolio Composition | ||||
(% of total investments) | ||||
| Health Care | 21.6% | |||
| Tax Obligation/Limited | 18.5% | |||
| Transportation | 15.0% | |||
| Tax Obligation/General | 12.6% | |||
| Utilities | 11.9% | |||
| U.S. Guaranteed | 8.0% | |||
| Education and Civic Organizations | 7.3% | |||
| Other | 5.1% | |||
Total | 100% | |||
States and Territories 1 | ||||
(% of total municipal bonds) | ||||
| Illinois | 10.8% | |||
| Colorado | 9.3% | |||
| Michigan | 7.1% | |||
| Texas | 6.7% | |||
| New York | 6.5% | |||
| Florida | 4.6% | |||
| New Jersey | 4.5% | |||
| California | 4.1% | |||
| Pennsylvania | 3.6% | |||
| Missouri | 3.5% | |||
| Minnesota | 3.1% | |||
| Ohio | 3.0% | |||
| Georgia | 2.8% | |||
| Wisconsin | 2.5% | |||
| North Carolina | 2.3% | |||
| Washington | 2.2% | |||
| South Carolina | 2.2% | |||
| District of Columbia | 2.1% | |||
| Oregon | 1.7% | |||
| Indiana | 1.6% | |||
| Other | 15.8% | |||
Total | 100% | |||
| 1 | See the Portfolio of Investments for the remaining states comprising "Other" and not listed in the table above. |
NAD | NEA | |||||||||||||||
| Common and | Common and | |||||||||||||||
| Preferred | Preferred | Preferred | Preferred | |||||||||||||
| shares voting | shares voting | shares voting | shares voting | |||||||||||||
| together | together | together | together | |||||||||||||
| as a class | as a class | as a class | as a class | |||||||||||||
Approval of the Board Members was reached as follows: | ||||||||||||||||
| Amy B.R. Lancellotta | ||||||||||||||||
| For | 174,000,515 | – | 217,189,079 | – | ||||||||||||
| Withhold | 12,322,058 | – | 26,121,923 | – | ||||||||||||
| Total | 186,322,573 | – | 243,311,002 | – | ||||||||||||
| John K. Nelson | ||||||||||||||||
| For | 172,461,624 | – | 214,668,845 | – | ||||||||||||
| Withhold | 13,860,949 | – | 28,642,157 | – | ||||||||||||
| Total | 186,322,573 | – | 243,311,002 | – | ||||||||||||
| Terence J. Toth | ||||||||||||||||
| For | 173,217,249 | – | 216,033,138 | – | ||||||||||||
| Withhold | 13,105,324 | – | 27,277,864 | – | ||||||||||||
| Total | 186,322,573 | – | 243,311,002 | – | ||||||||||||
| Robert L. Young | ||||||||||||||||
| For | 173,126,275 | – | 215,397,161 | – | ||||||||||||
| Withhold | 13,196,298 | – | 27,913,841 | – | ||||||||||||
| Total | 186,322,573 | – | 243,311,002 | – | ||||||||||||
| William C. Hunter | ||||||||||||||||
| For | – | 19,108 | – | 347,609 | ||||||||||||
| Withhold | – | – | – | – | ||||||||||||
| Total | – | 19,108 | – | 347,609 | ||||||||||||
| Albin F. Moschner | ||||||||||||||||
| For | – | 19,108 | – | 347,609 | ||||||||||||
| Withhold | – | – | – | – | ||||||||||||
| Total | – | 19,108 | – | 347,609 | ||||||||||||
| NAD | Nuveen Quality Municipal Income Fund Portfolio of Investments October 31, 2023 |
Principal Amount (000) | Description (a) | Optional Call Provisions (b) | Value | |||||||||
LONG-TERM INVESTMENTS - 168.8% (98.4% of Total Investments) | ||||||||||||
MUNICIPAL BONDS - 168.8% (98.4% of Total Investments) | ||||||||||||
Alabama - 1.4% (0.8% of Total Investments) | ||||||||||||
| $ 5,000 | Alabama Special Care Facilities Financing Authority, Revenue Bonds, Ascension Health, Series 2016C, 5.000%, 11/15/46 | 5/26 at 100.00 | $ | 4,774,506 | ||||||||
| Alabama State Port Authority, Docks Facilities Revenue Bonds, Refunding Series 2017A: | ||||||||||||
| 5,000 | 5.000%, 10/01/33 - AGM Insured, (AMT) | 10/27 at 100.00 | 5,029,825 | |||||||||
| 5,455 | 5.000%, 10/01/34 - AGM Insured, (AMT) | 10/27 at 100.00 | 5,479,379 | |||||||||
| 5,550 | 5.000%, 10/01/35 - AGM Insured, (AMT) | 10/27 at 100.00 | 5,558,363 | |||||||||
| 3,000 | Black Belt Energy Gas District, Alabama, Gas Supply Revenue Bonds, Series 2023 Sub B-2, 5.250%, 12/01/53, (Mandatory Put 12/01/30) | 9/30 at 100.32 | 3,024,306 | |||||||||
| 2,255 | Limestone County Water & Sewer Authority, Alabama, Water and Sewer Revenue Bonds, Series 2022, 5.000%, 12/01/45 | 6/32 at 100.00 | 2,260,261 | |||||||||
| 7,590 | Pike Road, Alabama, General Obligation Warrants, Series 2023, 5.000%, 3/01/52 | 3/33 at 100.00 | 7,663,133 | |||||||||
| 1,000 | Southeast Energy Authority, Alabama, Commodity Supply Revenue Bonds, Project 3, Fixed Rate Series 2022A-1, 5.500%, 1/01/53, (Mandatory Put 12/01/29) | 9/29 at 100.10 | 1,015,347 | |||||||||
| 4,165 | Tuscaloosa County Industrial Development Authority, Alabama, Gulf Opportunity Zone Bonds, Hunt Refining Project, Refunding Series 2019A, 5.250%, 5/01/44, 144A | 5/29 at 100.00 | 3,432,786 | |||||||||
| Total Alabama | 38,237,906 | |||||||||||
Alaska - 0.3% (0.2% of Total Investments) | ||||||||||||
| Alaska Industrial Development and Export Authority, Power Revenue Bonds, Snettisham Hydroelectric Project, Refunding Series 2015: | ||||||||||||
| 1,580 | 5.000%, 1/01/24, (AMT) | No Opt. Call | 1,579,816 | |||||||||
| 3,400 | 5.000%, 1/01/25, (AMT) | No Opt. Call | 3,403,519 | |||||||||
| 1,000 | 5.000%, 1/01/28, (AMT) | 7/25 at 100.00 | 999,670 | |||||||||
| 1,075 | 5.000%, 1/01/29, (AMT) | 7/25 at 100.00 | 1,074,770 | |||||||||
| 300 | 5.000%, 1/01/31, (AMT) | 7/25 at 100.00 | 298,705 | |||||||||
| Total Alaska | 7,356,480 | |||||||||||
Arizona - 2.9% (1.7% of Total Investments) | ||||||||||||
| 3,815 | Arizona Board of Regents, University of Arizona, Speed Revenue Bonds, Stimulus Plan for Economic and Educational Development, Refunding Series 2020A, 4.000%, 8/01/44 | 8/30 at 100.00 | 3,229,207 | |||||||||
| 2,500 | Arizona Health Facilities Authority, Revenue Bonds, Scottsdale Lincoln Hospitals Project, Refunding Series 2014A, 5.000%, 12/01/39 | 12/24 at 100.00 | 2,362,020 | |||||||||
| 1,000 | Arizona Industrial Development Authority Education Revenue Bonds, Academies of Math & Science Projects, Series 2023, 5.375%, 7/01/53 | 7/31 at 100.00 | 855,098 | |||||||||
| 2,000 | Arizona Industrial Development Authority, Arizona, Education Revenue Bonds, Academies of Math & Science Projects, Series 2018A, 5.000%, 7/01/48 | 1/28 at 100.00 | 1,830,468 | |||||||||
| 11,795 | Maricopa County Industrial Development Authority, Arizona, Revenue Bonds, Banner Health, Refunding Series 2016A, 4.000%, 1/01/36 | 1/27 at 100.00 | 11,045,086 | |||||||||
| 9,665 | Phoenix Civic Improvement Corporation, Arizona, Airport Revenue Bonds, Junior Lien Series 2019B, 5.000%, 7/01/49, (AMT) | 7/29 at 100.00 | 9,118,685 | |||||||||
| 15,935 | Phoenix Civic Improvement Corporation, Arizona, Airport Revenue Bonds, Senior Lien Series 2017A, 5.000%, 7/01/42, (AMT) | 7/27 at 100.00 | 15,626,095 | |||||||||
| NAD | Nuveen Quality Municipal Income Fund (continued) Portfolio of Investments October 31, 2023 |
Principal Amount (000) | Description (a) | Optional Call Provisions (b) | Value | |||||||||
Arizona | ||||||||||||
| $ 7,000 | Phoenix Civic Improvement Corporation, Arizona, Revenue Bonds, Civic Plaza Expansion Project, Series 2005B, 5.500%, 7/01/39 - FGIC Insured | No Opt. Call | $ | 7,625,668 | ||||||||
| 1,000 | Pinal County Electrical District 4, Arizona, Electric System Revenue Bonds, Refunding Series 2015, 4.000%, 12/01/38 - AGM Insured | 12/25 at 100.00 | 887,401 | |||||||||
| Salt Verde Financial Corporation, Arizona, Senior Gas Revenue Bonds, Citigroup Energy Inc Prepay Contract Obligations, Series 2007: | ||||||||||||
| 500 | 5.500%, 12/01/29 | No Opt. Call | 511,482 | |||||||||
| 24,765 | 5.000%, 12/01/37 | No Opt. Call | 24,040,252 | |||||||||
| 1,100 | Student and Academic Services LLC, Arizona, Lease Revenue Bonds, Northern Arizona University Project, Series 2014, 5.000%, 6/01/34 - BAM Insured | 6/24 at 100.00 | 1,100,834 | |||||||||
| Total Arizona | 78,232,296 | |||||||||||
Arkansas - 0.6% (0.3% of Total Investments) | ||||||||||||
| 5,020 | Arkansas Development Finance Authority, Arkansas, Environmental Improvement Revenue Bonds, United States Steel Corporation, Green Series 2022, 5.450%, 9/01/52, (AMT), 144A | 9/25 at 105.00 | 4,425,367 | |||||||||
| 6,550 | Arkansas Development Finance Authority, Arkansas, Environmental Improvement Revenue Bonds, United States Steel Corporation, Green Series 2023, 5.700%, 5/01/53, (AMT) | 5/26 at 105.00 | 5,977,485 | |||||||||
| 4,000 | Arkansas Development Finance Authority, Industrial Development Revenue Bonds, Big River Steel Project, Series 2019, 4.500%, 9/01/49, (AMT), 144A | 9/26 at 103.00 | 3,552,299 | |||||||||
| 2,055 | Arkansas State University, Student Fee Revenue Bonds, Jonesboro Campus, Series 2013, 4.875%, 12/01/43 | 12/23 at 100.00 | 1,817,459 | |||||||||
| Total Arkansas | 15,772,610 | |||||||||||
California - 11.8% (6.9% of Total Investments) | ||||||||||||
| 2,665 | Alameda Corridor Transportation Authority, California, Revenue Bonds, Refunding Second Subordinate Lien Series 2022C, 5.000%, 10/01/52 - AGM Insured | 10/32 at 100.00 | 2,665,177 | |||||||||
| Anaheim Public Financing Authority, California, Lease Revenue Bonds, Public Improvement Project, Series 1997C: | ||||||||||||
| 2,945 | 0.000%, 9/01/27 - AGM Insured | No Opt. Call | 2,496,450 | |||||||||
| 7,150 | 0.000%, 9/01/28 - AGM Insured | No Opt. Call | 5,800,011 | |||||||||
| 2,455 | 0.000%, 9/01/32 - AGM Insured | No Opt. Call | 1,642,293 | |||||||||
| 105 | (c) | 0.000%, 9/01/35 - AGM Insured, (ETM) | No Opt. Call | 63,706 | ||||||||
| 95 | 0.000%, 9/01/35 - AGM Insured | No Opt. Call | 54,268 | |||||||||
| 1,055 | Brisbane School District, San Mateo County, California, General Obligation Bonds, Election 2003 Series 2005, 0.000%, 7/01/35 - AGM Insured | No Opt. Call | 616,156 | |||||||||
| Byron Unified School District, Contra Costa County, California, General Obligation Bonds, Series 2007B: | ||||||||||||
| 1,405 | 0.000%, 8/01/32 - SYNCORA GTY Insured | No Opt. Call | 938,998 | |||||||||
| 235 | (c) | 0.000%, 8/01/32 - SYNCORA GTY Insured, (ETM) | No Opt. Call | 165,918 | ||||||||
| 60 | (c) | 0.000%, 8/01/32, (ETM) | No Opt. Call | 42,362 | ||||||||
| Calexico Unified School District, Imperial County, California, General Obligation Bonds, Election of 2004 Series 2005B: | ||||||||||||
| 3,685 | 0.000%, 8/01/31 - FGIC Insured | No Opt. Call | 2,583,794 | |||||||||
| 4,505 | 0.000%, 8/01/33 - FGIC Insured | No Opt. Call | 2,868,821 | |||||||||
| California Health Facilities Financing Authority, California, Revenue Bonds, Sutter Health, Refunding Series 2016B: | ||||||||||||
| 10,000 | 5.000%, 11/15/46 | 11/26 at 100.00 | 9,821,977 | |||||||||
| 2,855 | (c) | 5.000%, 11/15/46, (Pre-refunded 11/15/26) | 11/26 at 100.00 | 2,974,624 | ||||||||
Principal Amount (000) | Description (a) | Optional Call Provisions (b) | Value | |||||||||
California | ||||||||||||
| $ 16,665 | California Health Facilities Financing Authority, California, Revenue Bonds, Sutter Health, Refunding Series 2017A, 5.000%, 11/15/48 | 11/27 at 100.00 | $ | 16,451,740 | ||||||||
| 2,275 | California Health Facilities Financing Authority, California, Revenue Bonds, Sutter Health, Series 2018A, 4.000%, 11/15/42 | 11/27 at 100.00 | 2,014,648 | |||||||||
| 5,000 | California Municipal Finance Authority, Revenue Bonds, Linxs APM Project, Senior Lien Series 2018A, 5.000%, 12/31/43, (AMT) | 6/28 at 100.00 | 4,731,028 | |||||||||
| 3,250 | California Municipal Finance Authority, Reveue Bonds, Community Medical Centers, Series 2017A, 5.000%, 2/01/47 | 2/27 at 100.00 | 3,067,383 | |||||||||
| 815 | (c) | California State Public Works Board, Lease Revenue Bonds, Various Capital Projects, Series 2013I, 5.000%, 11/01/38, (Pre-refunded 1/02/24) | 1/24 at 100.00 | 816,716 | ||||||||
| 500 | California Statewide Communities Development Authority, California, Revenue Bonds, Loma Linda University Medical Center, Series 2014A, 5.250%, 12/01/44 | 12/24 at 100.00 | 465,044 | |||||||||
| California Statewide Communities Development Authority, California, Revenue Bonds, Loma Linda University Medical Center, Series 2016A: | ||||||||||||
| 1,000 | 5.000%, 12/01/46, 144A | 6/26 at 100.00 | 883,669 | |||||||||
| 13,820 | 5.250%, 12/01/56, 144A | 6/26 at 100.00 | 12,243,712 | |||||||||
| California Statewide Community Development Authority, Revenue Bonds, Daughters of Charity Health System, Series 2005A: | ||||||||||||
| 29 | (d),(e) | 5.750%, 7/01/30 | 1/22 at 100.00 | 29,023 | ||||||||
| 80 | (d),(e) | 5.500%, 7/01/39 | 1/22 at 100.00 | 79,485 | ||||||||
| 4,890 | Clovis Unified School District, Fresno County, California, General Obligation Bonds, Series 2006B, 0.000%, 8/01/26 - NPFG Insured | No Opt. Call | 4,366,822 | |||||||||
| 1,000 | Coachella Valley Unified School District, Riverside County, California, General Obligation Bonds, Series 2005A, 0.000%, 8/01/30 - FGIC Insured | No Opt. Call | 744,623 | |||||||||
| 4,000 | East Bay Municipal Utility District, Alameda and Contra Costa Counties, California, Water System Revenue Bonds, Series 2014C, 5.000%, 6/01/44 | 6/24 at 100.00 | 4,009,618 | |||||||||
| 3,010 | El Camino Community College District, California, General Obligation Bonds, Election of 2002 Series 2012C, 0.000%, 8/01/25 | No Opt. Call | 2,808,137 | |||||||||
| 3,500 | Foothill/Eastern Transportation Corridor Agency, California, Toll Road Revenue Bonds, Refunding Senior Lien Series 2015A, 0.000%, 1/15/34 - AGM Insured | No Opt. Call | 2,196,959 | |||||||||
| Foothill/Eastern Transportation Corridor Agency, California, Toll Road Revenue Bonds, Refunding Series 2013A: | ||||||||||||
| 1,480 | (c) | 5.750%, 1/15/46, (Pre-refunded 1/15/24) | 1/24 at 100.00 | 1,486,016 | ||||||||
| 6,480 | (c) | 6.000%, 1/15/49, (Pre-refunded 1/15/24) | 1/24 at 100.00 | 6,509,166 | ||||||||
| 9,930 | (c) | Golden State Tobacco Securitization Corporation, California, Enhanced Tobacco Settlement Asset-Backed Revenue Bonds, Refunding Series 2015A, 5.000%, 6/01/45, (Pre-refunded 6/01/25) | 6/25 at 100.00 | 10,131,753 | ||||||||
| Golden State Tobacco Securitization Corporation, California, Enhanced Tobacco Settlement Asset-Backed Revenue Bonds, Series 2005A: | ||||||||||||
| 1,455 | (c) | 0.000%, 6/01/24 - AMBAC Insured, (ETM) | No Opt. Call | 1,424,449 | ||||||||
| 3,500 | (c) | 0.000%, 6/01/26 - AGM Insured, (ETM) | No Opt. Call | 3,186,760 | ||||||||
| 59,280 | Golden State Tobacco Securitization Corporation, California, Tobacco Settlement Asset-Backed Bonds, Capital Appreciation Series 2021B-2, 0.000%, 6/01/66 | 12/31 at 27.75 | 4,862,282 | |||||||||
| 1,260 | Huntington Beach Union High School District, Orange County, California, Certificates of Participation, Capital Project, Series 2007, 0.000%, 9/01/35 - AGM Insured | No Opt. Call | 739,161 | |||||||||
| 5,240 | Huntington Beach Union High School District, Orange County, California, General Obligation Bonds, Series 2005, 0.000%, 8/01/30 - AGM Insured | No Opt. Call | 3,961,550 | |||||||||
| NAD | Nuveen Quality Municipal Income Fund (continued) Portfolio of Investments October 31, 2023 |
Principal Amount (000) | Description (a) | Optional Call Provisions (b) | Value | |||||||||
California | ||||||||||||
| $ 2,500 | Huntington Beach Union High School District, Orange County, California, General Obligation Bonds, Series 2007, 0.000%, 8/01/32 - FGIC Insured | No Opt. Call | $ | 1,718,657 | ||||||||
| 5,000 | Kern Community College District, California, General Obligation Bonds, Safety, Repair & Improvement, Election 2002 Series 2006, 0.000%, 11/01/24 - AGM Insured | No Opt. Call | 4,802,538 | |||||||||
| 1,045 | Lake Tahoe Unified School District, El Dorado County, California, General Obligation Bonds, Series 2001B, 0.000%, 8/01/31 - NPFG Insured | No Opt. Call | 745,597 | |||||||||
| 9,140 | Los Angeles Department of Airports, California, Revenue Bonds, Los Angeles International Airport, Senior Lien Series 2015D, 5.000%, 5/15/41, (AMT) | 5/25 at 100.00 | 8,954,768 | |||||||||
| Los Angeles Department of Airports, California, Revenue Bonds, Los Angeles International Airport, Subordinate Lien Series 2021D: | ||||||||||||
| 12,835 | 5.000%, 5/15/46, (AMT) | 11/31 at 100.00 | 12,411,355 | |||||||||
| 40 | (c) | 5.000%, 5/15/46, (Pre-refunded 11/15/31), (AMT) | 11/31 at 100.00 | 42,030 | ||||||||
| 2,665 | Los Angeles Department of Water and Power, California, Power System Revenue Bonds, Series 2014B, 5.000%, 7/01/43 | 1/24 at 100.00 | 2,669,853 | |||||||||
| 6,215 | (c) | Martinez Unified School District, Contra Costa County, California, General Obligation Bonds, Series 2011, 5.875%, 8/01/31, (Pre-refunded 8/01/24) | 8/24 at 100.00 | 6,316,130 | ||||||||
| 5,955 | (f) | Mount San Antonio Community College District, Los Angeles County, California, General Obligation Bonds, Election of 2008, Series 2013A, 0.000%, 8/01/43 | 8/35 at 100.00 | 5,185,728 | ||||||||
| 2,700 | M-S-R | No Opt. Call | 3,143,644 | |||||||||
| 2,200 | M-S-R | No Opt. Call | 2,477,930 | |||||||||
| 3,605 | Ontario Redevelopment Financing Authority, San Bernardino County, California, Revenue Bonds, Redevelopment Project 1, Refunding Series 1995, 7.400%, 8/01/25 - NPFG Insured | No Opt. Call | 3,694,642 | |||||||||
| 4,930 | Patterson Joint Unified School District, Stanislaus County, California, General Obligation Bonds, 2008 Election Series 2009B, 0.000%, 8/01/42 - AGM Insured | No Opt. Call | 1,834,932 | |||||||||
| 6,000 | (c) | Placentia-Yorba Linda Unified School District, Orange County, California, Certificates of Participation, Series 2006, 0.000%, 10/01/34 - FGIC Insured, (ETM) | No Opt. Call | 3,843,811 | ||||||||
| 2,000 | Poway Unified School District, San Diego County, California, General Obligation Bonds, School Facilities Improvement District 2007-1, Series 2011A, 0.000%, 8/01/41 | No Opt. Call | 811,592 | |||||||||
| 5,000 | (f) | Rialto Unified School District, San Bernardino County, California, General Obligation Bonds, 2010 Election Series 2011A, 0.000%, 8/01/41 - AGM Insured | 8/36 at 100.00 | 5,218,794 | ||||||||
| 5,000 | Riverside County Asset Leasing Corporation, California, Leasehold Revenue Bonds, Riverside County Hospital Project, Series 1997, 0.000%, 6/01/25 - NPFG Insured | No Opt. Call | 4,665,742 | |||||||||
| 4,615 | Riverside County Redevelopment Agency, California, Tax Allocation Bonds, Jurupa Valley Project Area, Series 2011B, 0.000%, 10/01/38 | No Opt. Call | 2,133,239 | |||||||||
| 10,990 | San Diego County Regional Airport Authority, California, Airport Revenue Bonds, Subordinate Series 2021B, 5.000%, 7/01/46, (AMT) | 7/31 at 100.00 | 10,444,099 | |||||||||
| 14,055 | San Francisco Airports Commission, California, Revenue Bonds, San Francisco International Airport, Refunding Second Series 2019A, 5.000%, 5/01/49, (AMT) | 5/29 at 100.00 | 13,489,084 | |||||||||
Principal Amount (000) | Description (a) | Optional Call Provisions (b) | Value | |||||||||
California | ||||||||||||
| $ 4,945 | San Francisco Airports Commission, California, Revenue Bonds, San Francisco International Airport, Second Series 2016B, 5.000%, 5/01/41, (AMT) | 5/26 at 100.00 | $ | 4,800,719 | ||||||||
| 10,000 | San Francisco Airports Commission, California, Revenue Bonds, San Francisco International Airport, Second Series 2017A, 5.000%, 5/01/42, (AMT) | 5/27 at 100.00 | 9,703,546 | |||||||||
| San Francisco Airports Commission, California, Revenue Bonds, San Francisco International Airport, Second Series 2019E: | ||||||||||||
| 11,000 | 5.000%, 5/01/45, (AMT) | 5/29 at 100.00 | 10,585,483 | |||||||||
| 8,405 | 5.000%, 5/01/50, (AMT) | 5/29 at 100.00 | 8,031,680 | |||||||||
| 2,000 | San Francisco City and County Redevelopment Agency Successor Agency, California, Special Tax Bonds, Community Facilities District 6 Mission Bay South Public Improvements, Series 2013C, 0.000%, 8/01/43 | 12/23 at 31.69 | 595,276 | |||||||||
| 2,000 | San Joaquin Hills Transportation Corridor Agency, Orange County, California, Toll Road Revenue Bonds, Refunding Junior Lien Series 2014B, 5.250%, 1/15/44 | 1/25 at 100.00 | 2,006,305 | |||||||||
| San Joaquin Hills Transportation Corridor Agency, Orange County, California, Toll Road Revenue Bonds, Refunding Senior Lien Series 2014A: | ||||||||||||
| 15,350 | (c) | 5.000%, 1/15/44, (Pre-refunded 1/15/25) | 1/25 at 100.00 | 15,596,040 | ||||||||
| 25,840 | (c) | 5.000%, 1/15/50, (Pre-refunded 1/15/25) | 1/25 at 100.00 | 26,254,182 | ||||||||
| San Jose, California, Airport Revenue Bonds, Refunding Series 2017A: | ||||||||||||
| 5,000 | 5.000%, 3/01/41, (AMT) | 3/27 at 100.00 | 4,854,617 | |||||||||
| 5,000 | 5.000%, 3/01/47, (AMT) | 3/27 at 100.00 | 4,732,111 | |||||||||
| 14,985 | San Ysidro School District, San Diego County, California, General Obligation Bonds, 1997 Election Series 2012G, 0.000%, 8/01/40 - AGM Insured | No Opt. Call | 6,294,031 | |||||||||
| 6,660 | San Ysidro School District, San Diego County, California, General Obligation Bonds, Refunding Series 2015, 0.000%, 8/01/43 | 8/25 at 38.93 | 2,335,832 | |||||||||
| 2,460 | Santee School District, San Diego County, California, General Obligation Bonds, Capital Appreciation, Election 2006, Series 2008D, 0.000%, 8/01/33 - AGC Insured | No Opt. Call | 1,611,988 | |||||||||
| 1,145 | Southern Kern Unified School District, Kern County, California, General Obligation Bonds, Series 2006C, 0.000%, 11/01/30 - AGM Insured | No Opt. Call | 848,841 | |||||||||
| 1,175 | Southern Kern Unified School District, Kern County, California, General Obligation Bonds, Series 2010B, 0.000%, 11/01/35 - AGM Insured | No Opt. Call | 678,921 | |||||||||
| 2,410 | Victor Elementary School District, San Bernardino County, California, General Obligation Bonds, Series 2002A, 0.000%, 8/01/26 - FGIC Insured | No Opt. Call | 2,141,184 | |||||||||
| 3,750 | (f) | Wiseburn School District, Los Angeles County, California, General Obligation Bonds, Series 2011B, 0.000%, 8/01/36 - AGM Insured | 8/31 at 100.00 | 3,768,299 | ||||||||
| Total California | 319,387,519 | |||||||||||
Colorado - 14.0% (8.2% of Total Investments) | ||||||||||||
| 4,350 | Aerotropolis Regional Transportation Authority, Colorado, Special Revenue Bonds, Series 2021, 4.375%, 12/01/52 | 12/26 at 103.00 | 3,140,190 | |||||||||
| 3,000 | Anthem West Metropolitan District, Colorado, General Obligation Bonds, Refunding Series 2015, 5.000%, 12/01/35 - BAM Insured | 12/25 at 100.00 | 3,035,822 | |||||||||
| 2,000 | Arvada, Colorado, Water Enterprise Revenue Bonds, Series 2022, 4.000%, 12/01/48 | 12/32 at 100.00 | 1,672,414 | |||||||||
| 4,195 | Boulder Larimer & Weld Counties School District RE-1J Saint Vrain Valley, Colorado, General Obligation Bonds, Series 2016C, 4.000%, 12/15/34 | 12/26 at 100.00 | 3,968,865 | |||||||||
| 5,500 | Brighton, Colorado, Water Activity Enterprise Revenue Bonds, Water System Project, Series 2022, 5.000%, 6/01/47 | 6/32 at 100.00 | 5,570,232 | |||||||||
| NAD | Nuveen Quality Municipal Income Fund (continued) Portfolio of Investments October 31, 2023 |
Principal Amount (000) | Description (a) | Optional Call Provisions (b) | Value | |||||||||
Colorado | ||||||||||||
| $ 1,775 | Centerra Metropolitan District 1, Loveland, Colorado, Special Revenue Bonds, Refunding & Improvement Series 2017, 5.000%, 12/01/29, 144A | 12/23 at 102.00 | $ | 1,703,018 | ||||||||
| 1,500 | Cherokee Metropolitan District, Colorado, Water and Wastewater Revenue Bonds, Series 2020, 4.000%, 8/01/50 - BAM Insured | 8/30 at 100.00 | 1,206,234 | |||||||||
| 2,945 | Colorado Educational and Cultural Facilities Authority, Charter School Revenue Bonds, Community Leadership Academy, Inc. Second Campus Project, Series 2013, 7.350%, 8/01/43 | 12/23 at 100.00 | 2,946,338 | |||||||||
| 1,715 | Colorado Educational and Cultural Facilities Authority, Charter School Revenue Bonds, Flagstaff Academy Project, Refunding Series 2016, 3.625%, 8/01/46 | 8/26 at 100.00 | 1,219,406 | |||||||||
| 500 | Colorado Educational and Cultural Facilities Authority, Charter School Revenue Bonds, Liberty Common Charter School, Series 2014A, 5.000%, 1/15/44 | 1/24 at 100.00 | 450,518 | |||||||||
| 1,000 | Colorado Educational and Cultural Facilities Authority, Charter School Revenue Bonds, Peak-to-Peak | 8/24 at 100.00 | 1,003,912 | |||||||||
| 3,915 | Colorado Educational and Cultural Facilities Authority, Charter School Revenue Bonds, Weld County School District 6 - Frontier Academy, Refunding & Improvement Series 2016, 3.250%, 6/01/46 | 6/26 at 100.00 | 2,670,206 | |||||||||
| 545 | Colorado Educational and Cultural Facilities Authority, Revenue Bonds, University Corporation for Atmospheric Research Project, Refunding Series 2017, 3.625%, 9/01/31 | 9/27 at 100.00 | 506,727 | |||||||||
| Colorado Educational and Cultural Facilities Authority, Revenue Bonds, University of Denver, Series 2017A: | ||||||||||||
| 1,200 | 4.000%, 3/01/36 | 3/27 at 100.00 | 1,086,177 | |||||||||
| 1,600 | 4.000%, 3/01/37 | 3/27 at 100.00 | 1,414,730 | |||||||||
| 5,460 | Colorado Health Facilities Authority, Colorado, Revenue Bonds, AdventHealth Obligated Group, Series 2019A, 4.000%, 11/15/43 | 11/29 at 100.00 | 4,709,550 | |||||||||
| Colorado Health Facilities Authority, Colorado, Revenue Bonds, AdventHealth Obligated Group, Series 2021A: | ||||||||||||
| 17,905 | 4.000%, 11/15/46 | 11/31 at 100.00 | 15,033,887 | |||||||||
| 11,090 | 4.000%, 11/15/50 | 11/31 at 100.00 | 9,051,547 | |||||||||
| 4,600 | Colorado Health Facilities Authority, Colorado, Revenue Bonds, Christian Living Neighborhoods Project, Refunding Series 2016, 5.000%, 1/01/37 | 1/24 at 102.00 | 4,165,559 | |||||||||
| Colorado Health Facilities Authority, Colorado, Revenue Bonds, CommonSpirit Health, Series 2019A-2: | ||||||||||||
| 4,000 | 5.000%, 8/01/44 | 8/29 at 100.00 | 3,782,079 | |||||||||
| 15,395 | 4.000%, 8/01/49 | 8/29 at 100.00 | 11,909,118 | |||||||||
| Colorado Health Facilities Authority, Colorado, Revenue Bonds, CommonSpirit Health, Series 2022A: | ||||||||||||
| 2,725 | 5.500%, 11/01/47 | 11/32 at 100.00 | 2,704,774 | |||||||||
| 2,300 | 5.250%, 11/01/52 | 11/32 at 100.00 | 2,163,485 | |||||||||
| Colorado Health Facilities Authority, Colorado, Revenue Bonds, Evangelical Lutheran Good Samaritan Society Project, Series 2013A: | ||||||||||||
| 2,670 | (c) | 5.000%, 6/01/28, (Pre-refunded 6/01/25) | 6/25 at 100.00 | 2,711,921 | ||||||||
| 6,425 | (c) | 5.000%, 6/01/40, (Pre-refunded 6/01/25) | 6/25 at 100.00 | 6,525,876 | ||||||||
| 1,390 | Colorado Health Facilities Authority, Colorado, Revenue Bonds, Frasier Meadows Project, Refunding & Improvement Series 2017A, 5.250%, 5/15/47 | 5/27 at 100.00 | 1,209,039 | |||||||||
| 5,000 | Colorado Health Facilities Authority, Colorado, Revenue Bonds, Intermountain Healthcare, Series 2022A, 5.000%, 5/15/52 | 5/32 at 100.00 | 4,885,336 | |||||||||
Principal Amount (000) | Description (a) | Optional Call Provisions (b) | Value | |||||||||
Colorado | ||||||||||||
| $ 3,785 | Colorado Health Facilities Authority, Colorado, Revenue Bonds, Parkview Medical Center, Series 2020A, 4.000%, 9/01/50 | 9/30 at 100.00 | $ | 2,853,255 | ||||||||
| 5,535 | Colorado Health Facilities Authority, Colorado, Revenue Bonds, Sanford Health, Series 2019A, 5.000%, 11/01/44 | 11/29 at 100.00 | 5,149,599 | |||||||||
| 3,300 | Colorado Health Facilities Authority, Colorado, Revenue Bonds, SCL Health System, Refunding Series 2019A, 4.000%, 1/01/37 | 1/30 at 100.00 | 3,057,902 | |||||||||
| 1,100 | Colorado High Performance Transportation Enterprise, C-470 Express Lanes Revenue Bonds, Senior Lien Series 2017, 5.000%, 12/31/56 | 12/24 at 100.00 | 990,285 | |||||||||
| Colorado State Board of Governors, Colorado State University Auxiliary Enterprise System Revenue Bonds, Refunding Series 2017C: | ||||||||||||
| 950 | (c) | 5.000%, 3/01/43, (Pre-refunded 3/01/28) - BAM Insured | 3/28 at 100.00 | 1,001,233 | ||||||||
| 710 | 5.000%, 3/01/43 - BAM Insured | 3/28 at 100.00 | 719,071 | |||||||||
| 2,360 | Colorado State Board of Governors, Colorado State University Auxiliary Enterprise System Revenue Bonds, Refunding Series 2017E, 4.000%, 3/01/43 | 3/28 at 100.00 | 2,055,813 | |||||||||
| 3,420 | Colorado State, Building Excellent Schools Today, Certificates of Participation, Series 2020R, 4.000%, 3/15/45 | 3/30 at 100.00 | 2,903,238 | |||||||||
| 4,000 | Colorado State, Building Excellent Schools Today, Certificates of Participation, Series 2021S, 4.000%, 3/15/41 | 3/31 at 100.00 | 3,530,883 | |||||||||
| 3,000 | (c) | Commerce City, Colorado, Sales and Use Tax Revenue Bonds, Series 2014, 5.000%, 8/01/44, (Pre-refunded 8/01/24) - AGM Insured | 8/24 at 100.00 | 3,020,829 | ||||||||
| 7,250 | (c) | Commerce City, Colorado, Sales and Use Tax Revenue Bonds, Series 2016, 5.000%, 8/01/46, (Pre-refunded 8/01/26) | 8/26 at 100.00 | 7,475,913 | ||||||||
| 8,250 | Denver City and County, Colorado, Airport System Revenue Bonds, Series 2022A, 5.500%, 11/15/53, (AMT) | 11/32 at 100.00 | 8,342,614 | |||||||||
| 3,400 | Denver City and County, Colorado, Airport System Revenue Bonds, Series 2022B, 5.250%, 11/15/53 | 11/32 at 100.00 | 3,485,620 | |||||||||
| Denver City and County, Colorado, Airport System Revenue Bonds, Series 2022D: | ||||||||||||
| 2,790 | 5.750%, 11/15/45, (AMT) | 11/32 at 100.00 | 2,927,001 | |||||||||
| 5,000 | 5.000%, 11/15/53, (AMT) | 11/32 at 100.00 | 4,703,261 | |||||||||
| 1,100 | Denver City and County, Colorado, Airport System Revenue Bonds, Subordinate Lien Series 2013A, 5.250%, 11/15/43, (AMT) | 12/23 at 100.00 | 1,091,616 | |||||||||
| 4,515 | Denver City and County, Colorado, Airport System Revenue Bonds, Subordinate Lien Series 2013B, 5.000%, 11/15/43 | 12/23 at 100.00 | 4,457,492 | |||||||||
| Denver City and County, Colorado, Airport System Revenue Bonds, Subordinate Lien Series 2018A: | ||||||||||||
| 17,000 | 5.000%, 12/01/43, (AMT) | 12/28 at 100.00 | 16,369,353 | |||||||||
| 13,040 | 5.000%, 12/01/48, (AMT) | 12/28 at 100.00 | 12,225,338 | |||||||||
| 9,040 | 5.250%, 12/01/48, (AMT) | 12/28 at 100.00 | 8,830,201 | |||||||||
| 4,095 | Denver City and County, Colorado, Dedicated Tax Revenue Bonds, Current Interest Series 2018A-1, 5.000%, 8/01/48 | 8/26 at 100.00 | 4,108,983 | |||||||||
| 1,820 | Denver City and County, Colorado, Dedicated Tax Revenue Bonds, Refunding & Improvement Series 2016A, 4.000%, 8/01/46 | 8/26 at 100.00 | 1,522,783 | |||||||||
| 11,000 | Denver City and County, Colorado, Dedicated Tax Revenue Bonds, Series 2021A, 4.000%, 8/01/51 | 8/31 at 100.00 | 9,006,849 | |||||||||
| 2,005 | Denver City and County, Colorado, Special Facilities Airport Revenue Bonds, United Airlines, Inc. Project, Refunding Series 2017, 5.000%, 10/01/32, (AMT) | 12/23 at 100.00 | 1,879,867 | |||||||||
| NAD | Nuveen Quality Municipal Income Fund (continued) Portfolio of Investments October 31, 2023 |
Principal Amount (000) | Description (a) | Optional Call Provisions (b) | Value | |||||||||
Colorado | ||||||||||||
| Denver Convention Center Hotel Authority, Colorado, Revenue Bonds, Convention Center Hotel, Refunding Senior Lien Series 2016: | ||||||||||||
| $ 2,955 | 5.000%, 12/01/28 | 12/26 at 100.00 | $ | 2,957,295 | ||||||||
| 2,000 | 5.000%, 12/01/29 | 12/26 at 100.00 | 1,995,181 | |||||||||
| 3,900 | 5.000%, 12/01/36 | 12/26 at 100.00 | 3,701,388 | |||||||||
E-470 Public Highway Authority, Colorado, Senior Revenue Bonds, Capital Appreciation Series 2010A: | ||||||||||||
| 385 | 0.000%, 9/01/35 | No Opt. Call | 219,188 | |||||||||
| 150 | 0.000%, 9/01/37 | No Opt. Call | 74,472 | |||||||||
| 75 | 0.000%, 9/01/38 | No Opt. Call | 34,736 | |||||||||
| 20 | 0.000%, 9/01/39 | No Opt. Call | 8,674 | |||||||||
| 110 | 0.000%, 9/01/41 | No Opt. Call | 42,338 | |||||||||
| 18,380 | E-470 Public Highway Authority, Colorado, Senior Revenue Bonds, Series 1997B, 0.000%, 9/01/25 - NPFG Insured | No Opt. Call | 16,994,284 | |||||||||
E-470 Public Highway Authority, Colorado, Senior Revenue Bonds, Series 2000B: | ||||||||||||
| 1,045 | 0.000%, 9/01/29 - NPFG Insured | No Opt. Call | 814,922 | |||||||||
| 2,175 | 0.000%, 9/01/30 - NPFG Insured | No Opt. Call | 1,618,970 | |||||||||
| 25,050 | 0.000%, 9/01/31 - NPFG Insured | No Opt. Call | 17,779,235 | |||||||||
| 23,305 | 0.000%, 9/01/32 - NPFG Insured | No Opt. Call | 15,759,895 | |||||||||
| 100 | 0.000%, 9/01/33 - NPFG Insured | No Opt. Call | 64,326 | |||||||||
| 12,500 | E-470 Public Highway Authority, Colorado, Senior Revenue Bonds, Series 2006A, 0.000%, 9/01/38 - NPFG Insured | 9/26 at 54.77 | 5,873,631 | |||||||||
E-470 Public Highway Authority, Colorado, Toll Revenue Bonds, Series 2004A: | ||||||||||||
| 385 | 0.000%, 9/01/28 - NPFG Insured | No Opt. Call | 314,156 | |||||||||
| 60,000 | 0.000%, 3/01/36 - NPFG Insured | No Opt. Call | 33,380,322 | |||||||||
| 2,200 | Eagle River Water and Sanitation District, Eagle County, Colorado, Enterprise Wastewater Revenue Bonds, Improvement Series 2020A, 4.000%, 12/01/49 - AGM Insured | 12/29 at 100.00 | 1,828,739 | |||||||||
| 8,000 | Ebert Metropolitan District, Denver Colorado, Limited Tax General Obligation Bonds, Refunding Series 2018A-1, 5.000%, 12/01/43 - BAM Insured | 12/28 at 100.00 | 8,062,282 | |||||||||
| 3,550 | Falcon Area Water and Wastewater Authority (El Paso County, Colorado), Tap Fee Revenue Bonds, Series 2022A, 6.750%, 12/01/34, 144A | 9/27 at 103.00 | 3,295,557 | |||||||||
| 2,000 | Firestone, Colorado, Water Enterprise Revenue Bones, Series 2020, 4.000%, 12/01/45 - BAM Insured | 12/30 at 100.00 | 1,640,178 | |||||||||
| 3,935 | Flying Horse Metropolitan District 2, El Paso County, Colorado, General Obligation Limited Tax Bonds, Refunding & Improvement Series 2020A, 4.000%, 12/01/50 - AGM Insured | 12/30 at 100.00 | 3,067,798 | |||||||||
| 2,545 | Future Legends Sports Park Business Improvement District, Colorado, Limited Tax General Obligation Bonds, Series 2022A and Subordinate Limited Tax General Obligation Bonds, Series 2022B, 6.000%, 12/01/52 | 9/27 at 103.00 | 2,259,036 | |||||||||
| 3,305 | Goldsmith Metropolitan District, Colorado, General Obligation Bonds, Refunding Series 2021, 4.000%, 12/01/51 - AGM Insured | 12/31 at 100.00 | 2,558,676 | |||||||||
| 1,825 | Meridian Metropolitan District, Douglas County, Colorado, General Obligation Bonds, Series 2023, 4.375%, 12/01/53 - AGM Insured | 12/33 at 100.00 | 1,608,385 | |||||||||
| 1,860 | (c) | Metropolitan State University of Denver, Colorado, Institutional Enterprise Revenue Bonds, Aerospace and Engineering Sciences Building Project, Series 2016, 4.000%, 12/01/40, (Pre-refunded 12/01/25) | 12/25 at 100.00 | 1,863,712 | ||||||||
| Northern Colorado Water Conservancy District Building Corporation, Certificates of Participation, Refunding Series 2021: | ||||||||||||
| 9,520 | 4.000%, 7/01/46 | 7/31 at 100.00 | 8,067,961 | |||||||||
Principal Amount (000) | Description (a) | Optional Call Provisions (b) | Value | |||||||||
Colorado | ||||||||||||
| $ 3,250 | 4.000%, 7/01/51 | 7/31 at 100.00 | $ | 2,653,342 | ||||||||
| Park 70 Metropolitan District, Aurora, Colorado, General Obligation Bonds, Limited Tax Refunding & Improvement Series 2016: | ||||||||||||
| 1,565 | 5.000%, 12/01/36 | 12/26 at 100.00 | 1,522,139 | |||||||||
| 2,100 | 5.000%, 12/01/46 | 12/26 at 100.00 | 1,887,310 | |||||||||
| 8,000 | Park Creek Metropolitan District, Colorado, Senior Limited Property Tax Supported Revenue Bonds, Series 2017A, 5.000%, 12/01/46 | 12/25 at 100.00 | 7,637,613 | |||||||||
| 2,235 | Park Creek Metropolitan District, Colorado, Senior Limited Property Tax Supported Revenue Bonds, Series 2019A, 4.000%, 12/01/38 - AGM Insured | 12/29 at 100.00 | 1,986,080 | |||||||||
| 3,975 | Peak Metropolitan District 1, Colorado Springs, El Paso County, Colorado, Limited Tax General Obligation Bonds, Series 2021A, 5.000%, 12/01/51, 144A | 3/26 at 103.00 | 3,128,067 | |||||||||
| 700 | Public Authority for Colorado Energy, Natural Gas Purchase Revenue Bonds, Colorado Springs Utilities, Series 2008, 6.500%, 11/15/38 | No Opt. Call | 774,152 | |||||||||
| 750 | Thompson Crossing Metropolitan District 2, Johnstown, Larimer County, Colorado, General Obligation Bonds, Limited Tax Convertible to Unlimited Tax, Series 2016B, 5.000%, 12/01/36 - AGM Insured | 12/26 at 100.00 | 764,742 | |||||||||
| Traditions Metropolitan District 2, Colorado, Limited Tax General Obligation Bonds, Refunding Series 2016: | ||||||||||||
| 1,050 | 5.000%, 12/01/32 - BAM Insured | 12/26 at 100.00 | 1,077,954 | |||||||||
| 1,000 | 4.125%, 12/01/37 - BAM Insured | 12/26 at 100.00 | 929,798 | |||||||||
| 500 | Transport Metropolitan District 3, In the City of Aurora, Adams County, Colorado, General Obligation Limited Bonds, Series 2021A-1, 5.000%, 12/01/41 | 3/26 at 103.00 | 390,604 | |||||||||
| 2,000 | Vista Ridge Metropolitan District, In the Town of Erie, Weld County, Colorado, General Obligation Refunding Bonds, Series 2016A, 4.000%, 12/01/36 - BAM Insured | 12/26 at 100.00 | 1,886,646 | |||||||||
| 6,225 | West Globeville Metropolitan District 1, Denver, Colorado, General Obligation Limited Tax Bonds, Series 2022, 6.750%, 12/01/52 | 12/29 at 103.00 | 5,382,174 | |||||||||
| Total Colorado | 378,061,917 | |||||||||||
Connecticut - 1.3% (0.7% of Total Investments) | ||||||||||||
| 2,135 | Connecticut Health and Educational Facilities Authority, Revenue Bonds, Hartford HealthCare Issue, Series 2021A, 4.000%, 7/01/51 | 7/31 at 100.00 | 1,678,970 | |||||||||
| 850 | Connecticut Health and Educational Facilities Authority, Revenue Bonds, McLean Affiliates, Series 2020A, 5.000%, 1/01/45, 144A | 1/26 at 102.00 | 674,745 | |||||||||
| Connecticut State, Special Tax Obligation Bonds, Transportation Infrastructure Purposes Series 2018A: | ||||||||||||
| 14,775 | 5.000%, 1/01/34 | 1/28 at 100.00 | 15,325,310 | |||||||||
| 6,410 | 5.000%, 1/01/37 | 1/28 at 100.00 | 6,573,132 | |||||||||
| 6,000 | 5.000%, 1/01/38 | 1/28 at 100.00 | 6,101,467 | |||||||||
| 4,000 | University of Connecticut, General Obligation Bonds, Series 2020A, 5.000%, 2/15/39 | 2/30 at 100.00 | 4,103,422 | |||||||||
| Total Connecticut | 34,457,046 | |||||||||||
Delaware - 0.3% (0.2% of Total Investments) | ||||||||||||
| 800 | Delaware Health Facilities Authroity, Revenue Bonds, Beebe Medical Center Project, Series 2018, 5.000%, 6/01/48 | 12/28 at 100.00 | 723,464 | |||||||||
| 7,255 | Delaware Transportation Authority, Revenue Bonds, US 301 Project, Series 2015, 5.000%, 6/01/55 | 6/25 at 100.00 | 7,151,050 | |||||||||
| Total Delaware | 7,874,514 | |||||||||||
| NAD | Nuveen Quality Municipal Income Fund (continued) Portfolio of Investments October 31, 2023 |
Principal Amount (000) | Description (a) | Optional Call Provisions (b) | Value | |||||||||
District of Columbia - 2.4% (1.4% of Total Investments) | ||||||||||||
| $ 450 | District of Columbia Housing Finance Agency, GNMA Collateralized Single Family Mortgage Revenue Bonds, Series 1988E-4, 6.375%, 6/01/26, (AMT) | 12/23 at 100.00 | $ | 450,703 | ||||||||
| 34,000 | District of Columbia Tobacco Settlement Corporation, Tobacco Settlement Asset-Backed Bonds, Series 2006A, 0.000%, 6/15/46 | 12/23 at 24.98 | 7,296,961 | |||||||||
| Metropolitan Washington Airports Authority, District of Columbia, Dulles Toll Road Revenue Bonds, Dulles Metrorail & Capital improvement Projects, Refunding & Subordinate Lien Series 2019B: | ||||||||||||
| 2,000 | 4.000%, 10/01/44 | 10/29 at 100.00 | 1,636,307 | |||||||||
| 5,000 | 5.000%, 10/01/47 | 10/29 at 100.00 | 4,709,757 | |||||||||
| 7,500 | 4.000%, 10/01/49 | 10/29 at 100.00 | 5,878,095 | |||||||||
| 2,000 | Metropolitan Washington Airports Authority, District of Columbia, Dulles Toll Road Revenue Bonds, Dulles Metrorail & Capital improvement Projects, Second Senior Lien Series 2009B, 0.000%, 10/01/36 - AGC Insured | No Opt. Call | 1,050,531 | |||||||||
| 5,000 | (c) | Metropolitan Washington Airports Authority, District of Columbia, Dulles Toll Road Revenue Bonds, Dulles Metrorail & Capital improvement Projects, Second Senior Lien Series 2009C, 6.500%, 10/01/41, (Pre-refunded 10/01/26) - AGC Insured | 10/26 at 100.00 | 5,366,164 | ||||||||
| 15,800 | Metropolitan Washington D.C. Airports Authority, Airport System Revenue Bonds, Refunding Series 2018A, 5.000%, 10/01/43, (AMT) | 10/28 at 100.00 | 15,311,022 | |||||||||
| 5,000 | Metropolitan Washington D.C. Airports Authority, Airport System Revenue Bonds, Refunding Series 2019A, 5.000%, 10/01/49, (AMT) | 10/29 at 100.00 | 4,756,320 | |||||||||
| 8,000 | Metropolitan Washington D.C. Airports Authority, Airport System Revenue Bonds, Refunding Series 2021A, 5.000%, 10/01/46, (AMT) | 10/31 at 100.00 | 7,671,724 | |||||||||
| 7,400 | Metropolitan Washington D.C. Airports Authority, Airport System Revenue Bonds, Refunding Series 2023A, 5.250%, 10/01/53, (AMT) | 10/32 at 100.00 | 7,331,906 | |||||||||
| 1,000 | Washington Metropolitan Area Transit Authority, District of Columbia, Gross Revenue Bonds, Refunding Crossover Series 2017A-2, 5.000%, 7/01/33 | 7/27 at 100.00 | 1,024,900 | |||||||||
| 1,000 | Washington Metropolitan Area Transit Authority, District of Columbia, Gross Revenue Bonds, Series 2018, 5.000%, 7/01/38 | 7/27 at 100.00 | 1,007,282 | |||||||||
| Total District of Columbia | 63,491,672 | |||||||||||
Florida - 9.9% (5.7% of Total Investments) | ||||||||||||
| 1,480 | Atlantic Beach, Florida, Healthcare Facilities Revenue Refunding Bonds, Fleet Landing Project, Series 2013A, 5.000%, 11/15/37 | 12/23 at 100.00 | 1,342,185 | |||||||||
| Bay County, Florida, Educational Facilities Revenue Refunding Bonds, Bay Haven Charter Academy, Inc. Project, Series 2013A: | ||||||||||||
| 450 | 5.000%, 9/01/45 | 12/23 at 100.00 | 425,084 | |||||||||
| 2,260 | 5.000%, 9/01/48 | 12/23 at 100.00 | 2,104,898 | |||||||||
| 8,280 | Broward County, Florida, Airport System Revenue Bonds, Series 2019A, 5.000%, 10/01/44, (AMT) | 10/29 at 100.00 | 7,907,455 | |||||||||
| 175 | Florida Development Finance Corporation, Educational Facilities Revenue Bonds, Renaissance Charter School, Inc. Projects, Series 2020C, 5.000%, 9/15/40, 144A | 9/27 at 100.00 | 145,035 | |||||||||
| 18,500 | Florida Development Finance Corporation, Florida, Surface Transportation Facility Revenue Bonds, Brightline Passenger Rail Project, Green Series 2019B, 7.375%, 1/01/49, (AMT), 144A | 1/24 at 107.00 | 18,037,522 | |||||||||
| Florida Development Finance Corporation, Florida, Surface Transportation Facility Revenue Bonds, Virgin Trains USA Passenger Rail Project, Series 2019A: | ||||||||||||
| 12,000 | 6.375%, 1/01/49, (AMT), (Mandatory Put 1/01/26), 144A | 12/23 at 102.00 | 11,422,895 | |||||||||
Principal Amount (000) | Description (a) | Optional Call Provisions (b) | Value | |||||||||
Florida | ||||||||||||
| $ 15,985 | 6.500%, 1/01/49, (AMT), (Mandatory Put 1/01/29), 144A | 12/23 at 102.00 | $ | 15,108,187 | ||||||||
| 5,000 | Florida Development Finance Corporation, Revenue Bonds, Brightline Florida Passenger Rail Expansion Project, Series 2023A, 7.500%, 7/01/57, (AMT), (Mandatory Put 8/15/24) | 12/23 at 103.50 | 4,916,207 | |||||||||
| 12,500 | Florida Development Finance Corporation, Revenue Bonds, Brightline Passenger Rail Expansion Project, Series 2023C, 8.000%, 7/01/57, (AMT), (Mandatory Put 4/01/24), 144A | 11/23 at 100.00 | 12,588,353 | |||||||||
| Greater Orlando Aviation Authority, Florida, Orlando Airport Facilities Revenue Bonds, Priority Subordinated Series 2017A: | ||||||||||||
| 31,985 | 5.000%, 10/01/42, (AMT) | 10/27 at 100.00 | 31,022,782 | |||||||||
| 2,665 | 5.000%, 10/01/47, (AMT) | 10/27 at 100.00 | 2,513,701 | |||||||||
| 6,020 | (c) | Hillsborough County Aviation Authority, Florida, Revenue Bonds, Tampa International Airport, Senior Lien Series 2015A, 5.000%, 10/01/44, (Pre- refunded 10/01/24), (AMT) | 10/24 at 100.00 | 6,052,856 | ||||||||
| 5,000 | Hillsborough County Aviation Authority, Florida, Revenue Bonds, Tampa International Airport, Series 2018E, 5.000%, 10/01/43, (AMT) | 10/28 at 100.00 | 4,845,260 | |||||||||
| 2,290 | (c) | Hillsborough County Aviation Authority, Florida, Revenue Bonds, Tampa International Airport, Subordinate Lien Series 2015B, 5.000%, 10/01/40, (Pre-refunded 10/01/24) | 10/24 at 100.00 | 2,312,736 | ||||||||
| 10,305 | Hillsborough County Aviation Authority, Florida, Tampa International Airport Customer Facility Charge Revenue Bonds, Series 2015A, 5.000%, 10/01/44 | 10/24 at 100.00 | 10,133,924 | |||||||||
| 10,000 | Hillsborough County Industrial Development Authority, Florida, Hospital Revenue Bonds, Florida Health Sciences Center Inc D/B/A Tampa General Hospital, Series 2020A, 4.000%, 8/01/55 | 2/31 at 100.00 | 7,587,207 | |||||||||
| 5,000 | Hillsborough County Port District, Florida, Revenue Bonds, Tampa Port Authority Project, Series 2018B, 5.000%, 6/01/46, (AMT) | 6/28 at 100.00 | 4,518,770 | |||||||||
| 5,075 | (c) | Lakeland, Florida, Hospital System Revenue Bonds, Lakeland Regional Health, Series 2015, 5.000%, 11/15/35, (Pre-refunded 11/15/24) | 11/24 at 100.00 | 5,134,947 | ||||||||
| 9,820 | Miami Beach Redevelopment Agency, Florida, Tax Increment Revenue Bonds, City Center/Historic Convention Village, Series 2015A, 5.000%, 2/01/44 - AGM Insured | 2/24 at 100.00 | 9,820,319 | |||||||||
| 2,000 | Miami Health Facilities Authority, Florida, Health Facilities Revenue Bonds, Miami Jewish Health System Inc. Project, Series 2017, 5.125%, 7/01/46 | 7/27 at 100.00 | 1,498,266 | |||||||||
| 2,930 | Miami-Dade County Educational Facilities Authority, Florida, Revenue Bonds, University of Miami, Series 2012A, 5.000%, 4/01/42 | 12/23 at 100.00 | 2,829,830 | |||||||||
| 8,070 | Miami-Dade County Educational Facilities Authority, Florida, Revenue Bonds, University of Miami, Series 2015A, 5.000%, 4/01/45 | 4/25 at 100.00 | 7,807,020 | |||||||||
| 3,000 | Miami-Dade County Educational Facilities Authority, Florida, Revenue Bonds, University of Miami, Series 2018A, 5.000%, 4/01/53 | 4/28 at 100.00 | 2,822,136 | |||||||||
| 1,500 | Miami-Dade County Health Facility Authority, Florida, Hospital Revenue Bonds, Nicklaus Children’s Hospital, Refunding Series 2017, 5.000%, 8/01/42 | 8/27 at 100.00 | 1,461,369 | |||||||||
| 5,000 | Miami-Dade County School District, Florida, General Obligation Bonds, School Series 2022A, 5.000%, 3/15/52 - BAM Insured | 3/32 at 100.00 | 5,022,696 | |||||||||
| 5,000 | Miami-Dade County, Florida, Aviation Revenue Bonds, Refunding Series 2014A, 5.000%, 10/01/35, (AMT) | 10/24 at 100.00 | 4,891,849 | |||||||||
| 3,000 | Miami-Dade County, Florida, Aviation Revenue Bonds, Refunding Series 2015A, 5.000%, 10/01/38 - BAM Insured, (AMT) | 10/25 at 100.00 | 2,944,863 | |||||||||
| 13,385 | Miami-Dade County, Florida, Aviation Revenue Bonds, Refunding Series 2017B, 5.000%, 10/01/40, (AMT) | 10/27 at 100.00 | 12,935,038 | |||||||||
| NAD | Nuveen Quality Municipal Income Fund (continued) Portfolio of Investments October 31, 2023 |
Principal Amount (000) | Description (a) | Optional Call Provisions (b) | Value | |||||||||
Florida | ||||||||||||
| $ 1,005 | (g) | Miami-Dade County, Florida, Seaport Revenue Bonds, Refunding Series 2022A, 5.250%, 10/01/52, (AMT), (UB) | 10/32 at 100.00 | $ | 967,594 | |||||||
| 5,000 | Miami-Dade County, Florida, Transit System Sales Surtax Revenue Bonds, Series 2022, 5.000%, 7/01/51 | 7/32 at 100.00 | 4,952,680 | |||||||||
| 6,035 | Miami-Dade County, Florida, Water and Sewer System Revenue Bonds, Series 2019B, 4.000%, 10/01/49 | 10/29 at 100.00 | 4,955,680 | |||||||||
| 3,500 | Miami-Dade County, Florida, Water and Sewer System Revenue Bonds, Series 2021, 4.000%, 10/01/46 | 4/31 at 100.00 | 2,942,258 | |||||||||
| 7,000 | Orange County Health Facilities Authority, Florida, Hospital Revenue Bonds, Orlando Health Obligated Group, Inc., Series 2022, 4.000%, 10/01/52 | 4/32 at 100.00 | 5,636,053 | |||||||||
| 2,360 | Osceola County, Florida, Transportation Revenue Bonds, Osceola Parkway, Refunding & Improvement Series 2019A-1, 5.000%, 10/01/49 | 10/29 at 100.00 | 2,146,470 | |||||||||
| 2,260 | Palm Beach County Health Facilities Authority, Florida, Retirement Communities Revenue Bonds, ACTS Retirement - Life Communities, Inc Obligated Group, Series 2016, 5.000%, 11/15/32 | 11/26 at 100.00 | 2,238,918 | |||||||||
| 4,635 | Port Saint Lucie, Florida, Public Service Tax Revenue Bonds, Recovery Zone Facility Bond Series 2014B, 5.000%, 9/01/43 | 9/24 at 100.00 | 4,663,753 | |||||||||
| 2,500 | Putnam County Development Authority, Florida, Pollution Control Revenue Bonds, Seminole Electric Cooperatice, Inc. Project, Refunding Series 2018A, 5.000%, 3/15/42 | 5/28 at 100.00 | 2,406,310 | |||||||||
| 10,095 | Putnam County Development Authority, Florida, Pollution Control Revenue Bonds, Seminole Electric Cooperatice, Inc. Project, Refunding Series 2018B, 5.000%, 3/15/42 | 5/28 at 100.00 | 9,716,679 | |||||||||
| South Miami Health Facilities Authority, Florida, Hospital Revenue Bonds, Baptist Health Systems of South Florida Obligated Group, Refunding Series 2017: | ||||||||||||
| 2,000 | 5.000%, 8/15/42 | 8/27 at 100.00 | 1,937,145 | |||||||||
| 9,770 | 5.000%, 8/15/47 | 8/27 at 100.00 | 9,310,673 | |||||||||
| 705 | Southeast Overtown/Park West Community Redevelopement Agency, Florida, Tax Increment Revenue Bonds, Series 2014A-1, 5.000%, 3/01/30, 144A | 3/24 at 100.00 | 705,164 | |||||||||
| 1,500 | Sumter County Industrial Development Authority, Florida, Hospital Revenue Bonds, Central Florida Health Alliance Projects, Series 2014A, 5.250%, 7/01/44 | 1/24 at 100.00 | 1,448,535 | |||||||||
| 5,545 | Tampa, Florida, Hospital Revenue Bonds, H. Lee Moffitt Cancer Center Project, Series 2020B, 5.000%, 7/01/50 | 7/30 at 100.00 | 5,226,032 | |||||||||
| 180 | (f) | Tolomato Community Development District, Florida, Special Assessment Bonds, Refunding Series 2015-2, 0.000%, 5/01/40 | 12/23 at 100.00 | 167,506 | ||||||||
| 195 | (d) | Tolomato Community Development District, Florida, Special Assessment Bonds, Refunding Series 2015-3, 6.610%, 5/01/40 | 12/23 at 100.00 | 2 | ||||||||
| 6,510 | Volusia County Educational Facilities Authority, Florida, Revenue Bonds, Stetson University Inc. Project, Series 2015, 5.000%, 6/01/45 | 6/25 at 100.00 | 6,243,501 | |||||||||
| Total Florida | 265,818,343 | |||||||||||
Georgia - 2.4% (1.4% of Total Investments) | ||||||||||||
| 1,820 | Atlanta Development Authority, Georgia, Revenue Bonds, New Downtown Atlanta Stadium Project, Senior Lien Series 2015A-1, 5.250%, 7/01/40 | 7/25 at 100.00 | 1,828,690 | |||||||||
| 10,000 | Atlanta, Georgia, Airport General Revenue Bonds, Series 2022B, 5.000%, 7/01/52, (AMT) | 7/32 at 100.00 | 9,434,122 | |||||||||
| 2,600 | Cobb County Kennestone Hospital Authority, Georgia, Revenue Anticipation Certificates, Wellstar Health System, Series 2017A, 5.000%, 4/01/47 | 4/27 at 100.00 | 2,471,929 | |||||||||
Principal Amount (000) | Description (a) | Optional Call Provisions (b) | Value | |||||||||
Georgia | ||||||||||||
| $ | 2,500 | Columbia County Hospital Authority, Georgia, Revenue Anticipation Certificates, WellStar Health System, Inc. Project, Series 2023B, 5.125%, 4/01/53, (WI/DD) | 4/33 at 100.00 | $ | 2,433,449 | |||||||
| 3,575 | Crisp County Hospital Authority, Georgia, Revenue Anticipation Certificates, Crisp County Hospital Project, Series 2021, 4.000%, 7/01/51 | 7/31 at 100.00 | 2,819,901 | |||||||||
| 635 | Dalton Development Authority, Georgia, Revenue Certificates, Hamilton Health Care System Inc., Series 1996, 5.500%, 8/15/26 - NPFG Insured | No Opt. Call | 644,870 | |||||||||
| 2,000 | Fulton County Development Authority, Georgia, Revenue Bonds, Piedmont Healthcare, Inc. Project, Series 2019A, 4.000%, 7/01/49 | 7/29 at 100.00 | 1,617,502 | |||||||||
| 3,500 | Georgia Ports Authority, Revenue Bonds, Series 2021, 4.000%, 7/01/51 | 7/31 at 100.00 | 2,923,233 | |||||||||
| Main Street Natural Gas Inc., Georgia, Gas Supply Revenue Bonds, Series 2019A: | ||||||||||||
| 1,460 | 5.000%, 5/15/43 | 5/29 at 100.00 | 1,372,879 | |||||||||
| 22,700 | 5.000%, 5/15/49 | No Opt. Call | 21,124,452 | |||||||||
| 3,265 | Metropolitan Atlanta Rapid Transit Authority, Georgia, Sales Tax Revenue Bonds, Third Indenture, Series 2015B, 5.000%, 7/01/41 | 7/26 at 100.00 | 3,284,416 | |||||||||
| 10,260 | Municipal Electric Authority of Georgia, Plant Vogtle Units 3 & 4 Project J Bonds, Series 2015A, 5.000%, 7/01/60 | 7/25 at 100.00 | 9,497,400 | |||||||||
| Paulding County Hospital Authority, Georgia, Revenue Anticipation Certificates, WellStar Health System Inc., Series 2022A: | ||||||||||||
| 3,465 | 5.000%, 4/01/42 | 4/32 at 100.00 | 3,430,107 | |||||||||
| 1,565 | 5.000%, 4/01/43 | 4/32 at 100.00 | 1,539,182 | |||||||||
| 1,000 | Rockdale County Development Authority, Georgia, Revenue Bonds, Piedmont Healthcare, Inc. Project, Series 2019A, 4.000%, 7/01/44 | 7/29 at 100.00 | 832,276 | |||||||||
| Total Georgia | 65,254,408 | |||||||||||
Guam - 0.7% (0.4% of Total Investments) | ||||||||||||
| 2,000 | Government of Guam, Business Privilege Tax Bonds, Refunding Series 2015D, 5.000%, 11/15/34 | 11/25 at 100.00 | 1,927,732 | |||||||||
| Guam Economic Development & Commerce Authority, Tobacco Settlement Asset-Backed Bonds, Series 2007A: | ||||||||||||
| 1,760 | 5.250%, 6/01/32 | 11/23 at 100.00 | 1,659,986 | |||||||||
| 2,915 | 5.625%, 6/01/47 | 11/23 at 100.00 | 2,599,765 | |||||||||
| 1,300 | Guam Government Waterworks Authority, Water and Wastewater System Revenue Bonds, Refunding Series 2014A, 5.000%, 7/01/35 | 7/24 at 100.00 | 1,291,508 | |||||||||
| Guam Government Waterworks Authority, Water and Wastewater System Revenue Bonds, Series 2016: | ||||||||||||
| 245 | 5.000%, 7/01/27 | 7/26 at 100.00 | 245,736 | |||||||||
| 1,240 | 5.000%, 1/01/46 | 7/26 at 100.00 | 1,137,075 | |||||||||
| 1,000 | Guam Government Waterworks Authority, Water and Wastewater System Revenue Bonds, Series 2020A, 5.000%, 1/01/50 | 7/30 at 100.00 | 898,543 | |||||||||
| Guam Government, Limited Obligation Section 30 Revenue Bonds, Series 2016A: | ||||||||||||
| 1,000 | 5.000%, 12/01/23 | No Opt. Call | 1,000,259 | |||||||||
| 2,000 | 5.000%, 12/01/33 | 12/26 at 100.00 | 1,997,651 | |||||||||
| 2,260 | 5.000%, 12/01/34 | 12/26 at 100.00 | 2,240,361 | |||||||||
| 1,175 | 5.000%, 12/01/46 | 12/26 at 100.00 | 1,002,907 | |||||||||
| Guam Port Authority, Port Revenue Bonds, Private Activity Series 2018B: | ||||||||||||
| 510 | 5.000%, 7/01/32, (AMT) | 7/28 at 100.00 | 516,327 | |||||||||
| 355 | 5.000%, 7/01/33, (AMT) | 7/28 at 100.00 | 359,287 | |||||||||
| NAD | Nuveen Quality Municipal Income Fund (continued) Portfolio of Investments October 31, 2023 |
Principal Amount (000) | Description (a) | Optional Call Provisions (b) | Value | |||||||||
Guam | ||||||||||||
| Guam Power Authority, Revenue Bonds, Series 2014A: | ||||||||||||
| $ | 600 | 5.000%, 10/01/39 | 10/24 at 100.00 | $ | 600,305 | |||||||
| 575 | 5.000%, 10/01/44 | 10/24 at 100.00 | 554,029 | |||||||||
| Total Guam | 18,031,471 | |||||||||||
Hawaii - 1.3% (0.8% of Total Investments) | ||||||||||||
| 6,000 | Hawaii Department of Budget and Finance, Special Purpose Revenue Bonds, Hawaiian Electric Company, Inc. and Subsidiary Projects, Refunding Series 2017B, 4.000%, 3/01/37, (AMT) | 3/27 at 100.00 | 3,885,388 | |||||||||
| 7,500 | Hawaii State, Airport System Revenue Bonds, Series 2015A, 5.000%, 7/01/45, (AMT) | 7/25 at 100.00 | 7,197,004 | |||||||||
| 10,000 | Hawaii State, Airport System Revenue Bonds, Series 2018A, 5.000%, 7/01/43, (AMT) | 7/28 at 100.00 | 9,692,496 | |||||||||
| 6,000 | Hawaii State, Airport System Revenue Bonds, Series 2022, 5.000%, 7/01/38, (AMT) | 7/32 at 100.00 | 5,951,629 | |||||||||
| 5,000 | Hawaii State, General Obligation Bonds, Series 2017FK, 4.000%, 5/01/35 | 5/27 at 100.00 | 4,811,711 | |||||||||
| 3,720 | Honolulu City and County, Hawaii, Wastewater System Revenue Bonds, First Bond Resolution, Green Senior Series 2023, 5.000%, 7/01/48 | 7/33 at 100.00 | 3,748,123 | |||||||||
| Total Hawaii | 35,286,351 | |||||||||||
Idaho - 1.0% (0.6% of Total Investments) | ||||||||||||
| 9,495 | Boise City Water Renewal System, Idaho, Revenue Bonds, Refunding Series 2022, 5.000%, 9/01/47 | 9/32 at 100.00 | 9,567,039 | |||||||||
| 11,205 | Idaho Health Facilities Authority, Hospital Revenue Bonds, CHE Trinity Helath Group, Series 2017ID, 5.000%, 12/01/46 | 6/27 at 100.00 | 10,754,814 | |||||||||
| 1,700 | Idaho Health Facilities Authority, Revenue Bonds, Madison Memorial Hospital Project, Refunding Series 2016, 5.000%, 9/01/29 | 9/26 at 100.00 | 1,648,979 | |||||||||
| 5,585 | Idaho Health Facilities Authority, Revenue Bonds, Saint Luke’s Health System Project, Series 2021A, 4.000%, 3/01/46 | 3/32 at 100.00 | 4,510,229 | |||||||||
| Idaho Water Resource Board, Water Resource Loan Program Revenue, Ground Water Rights Mitigation Series 2012A: | ||||||||||||
| 1,155 | 4.750%, 9/01/26 | 12/23 at 100.00 | 1,154,930 | |||||||||
| 310 | 5.000%, 9/01/32 | 12/23 at 100.00 | 310,037 | |||||||||
| Total Idaho | 27,946,028 | |||||||||||
Illinois - 15.6% (9.1% of Total Investments) | ||||||||||||
| 6,000 | Chicago Board of Education, Illinois, Dedicated Capital Improvement Tax Revenue Bonds, Series 2016, 6.000%, 4/01/46 | 4/27 at 100.00 | 6,036,100 | |||||||||
| 9,250 | Chicago Board of Education, Illinois, General Obligation Bonds, Dedicated Revenues, Series 2016A, 7.000%, 12/01/44 | 12/25 at 100.00 | 9,453,493 | |||||||||
| 2,400 | Chicago Board of Education, Illinois, General Obligation Bonds, Dedicated Revenues, Series 2016B, 6.500%, 12/01/46 | 12/26 at 100.00 | 2,438,044 | |||||||||
| 11,295 | Chicago Board of Education, Illinois, General Obligation Bonds, Dedicated Revenues, Series 2017A, 7.000%, 12/01/46, 144A | 12/27 at 100.00 | 11,727,671 | |||||||||
| Chicago Board of Education, Illinois, Unlimited Tax General Obligation Bonds, Dedicated Tax Revenues, Series 1998B-1: | ||||||||||||
| 10,130 | 0.000%, 12/01/24 - FGIC Insured | No Opt. Call | 9,603,284 | |||||||||
| 7,140 | 0.000%, 12/01/25 - FGIC Insured | No Opt. Call | 6,445,698 | |||||||||
| 4,325 | 0.000%, 12/01/29 - FGIC Insured | No Opt. Call | 3,192,547 | |||||||||
| 4,235 | 0.000%, 12/01/31 - FGIC Insured | No Opt. Call | 2,804,112 | |||||||||
Principal Amount (000) | Description (a) | Optional Call Provisions (b) | Value | |||||||||
Illinois | ||||||||||||
| Chicago Board of Education, Illinois, Unlimited Tax General Obligation Bonds, Dedicated Tax Revenues, Series 1999A: | ||||||||||||
| $ 10,000 | 0.000%, 12/01/23 - FGIC Insured | No Opt. Call | $ | 9,959,477 | ||||||||
| 8,845 | 5.500%, 12/01/26 - NPFG Insured | No Opt. Call | 8,910,167 | |||||||||
| 15,735 | Chicago, Illinois, General Airport Revenue Bonds, O’Hare International Airport, Refunding Senior Lien Series 2018A, 5.000%, 1/01/48 | 1/29 at 100.00 | 14,728,852 | |||||||||
| 6,745 | Chicago, Illinois, General Airport Revenue Bonds, O’Hare International Airport, Senior Lien Series 2015C, 5.000%, 1/01/46 | 1/25 at 100.00 | 6,355,563 | |||||||||
| 3,000 | Chicago, Illinois, General Airport Revenue Bonds, O’Hare International Airport, Senior Lien Series 2017D, 5.000%, 1/01/47 | 1/27 at 100.00 | 2,813,501 | |||||||||
| Chicago, Illinois, General Airport Revenue Bonds, O’Hare International Airport, Senior Lien Series 2022A: | ||||||||||||
| 5,000 | 5.500%, 1/01/53 - AGM Insured | 1/31 at 100.00 | 5,025,611 | |||||||||
| 8,010 | 5.500%, 1/01/55 | 1/32 at 100.00 | 7,995,795 | |||||||||
| Chicago, Illinois, General Obligation Bonds, City Colleges, Series 1999: | ||||||||||||
| 4,115 | 0.000%, 1/01/33 - FGIC Insured | No Opt. Call | 2,533,935 | |||||||||
| 29,600 | 0.000%, 1/01/38 - FGIC Insured | No Opt. Call | 12,940,324 | |||||||||
| 11,675 | Chicago, Illinois, General Obligation Bonds, Project & Refunding Series 2017A, 6.000%, 1/01/38 | 1/27 at 100.00 | 11,961,326 | |||||||||
| Chicago, Illinois, General Obligation Bonds, Series 2019A: | ||||||||||||
| 4,000 | 5.000%, 1/01/40 | 1/29 at 100.00 | 3,876,589 | |||||||||
| 7,445 | 5.500%, 1/01/49 | 1/29 at 100.00 | 7,275,814 | |||||||||
| 6,290 | Chicago, Illinois, Wastewater Transmission Revenue Bonds, Second Lien Series 2001A, 5.500%, 1/01/30 - NPFG Insured | No Opt. Call | 6,507,913 | |||||||||
| 1,300 | Chicago, Illinois, Water Revenue Bonds, Senior Lien Series 2001, 5.750%, 11/01/30 - AMBAC Insured | No Opt. Call | 1,355,158 | |||||||||
| 4,500 | Cook County Community College District 508, Illinois, General Obligation Bonds, Chicago City Colleges, Series 2017, 5.000%, 12/01/47 | 12/27 at 100.00 | 4,409,517 | |||||||||
| 3,000 | Cook County, Illinois, General Obligation Bonds, Refunding Series 2016A, 5.000%, 11/15/31 | 11/26 at 100.00 | 3,026,635 | |||||||||
| Cook County, Illinois, General Obligation Bonds, Refunding Series 2018: | ||||||||||||
| 500 | 5.000%, 11/15/34 | 11/26 at 100.00 | 509,822 | |||||||||
| 4,550 | 5.000%, 11/15/35 | 11/26 at 100.00 | 4,610,947 | |||||||||
| Illinois Educational Facilities Authority, Revenue Bonds, Field Museum of Natural History, Series 2002.RMKT: | ||||||||||||
| 5,000 | 4.450%, 11/01/36 | 11/25 at 102.00 | 4,841,294 | |||||||||
| 815 | 4.500%, 11/01/36 | 11/24 at 100.00 | 792,273 | |||||||||
| 2,785 | 5.500%, 11/01/36 | 12/23 at 100.00 | 2,788,581 | |||||||||
| 410 | Illinois Finance Authority, Charter School Revenue Bonds, Intrinsic Charter Schools Belmont School Project, Series 2015A, 6.000%, 12/01/45, 144A | 12/25 at 100.00 | 381,137 | |||||||||
| Illinois Finance Authority, Revenue Bonds, Advocate Health Care Network, Refunding Series 2015: | ||||||||||||
| 12,025 | (c),(g) | 5.000%, 5/01/45, (Pre-refunded 5/01/25), (UB) | 5/25 at 100.00 | 12,212,958 | ||||||||
| 1,930 | (g) | 5.000%, 5/01/45, (UB) | 5/25 at 100.00 | 1,954,558 | ||||||||
| 2,000 | Illinois Finance Authority, Revenue Bonds, Art Institute of Chicago, Series 2016, 4.000%, 3/01/38 | 3/26 at 100.00 | 1,768,906 | |||||||||
| 2,500 | Illinois Finance Authority, Revenue Bonds, Ascension Health/fkaPresence Health Network, Series 2016C, 5.000%, 2/15/33 | 2/27 at 100.00 | 2,560,715 | |||||||||
| 3,300 | Illinois Finance Authority, Revenue Bonds, Bradley University, Refunding Series 2021A, 4.000%, 8/01/46 | 8/31 at 100.00 | 2,564,542 | |||||||||
| NAD | Nuveen Quality Municipal Income Fund (continued) Portfolio of Investments October 31, 2023 |
Principal Amount (000) | Description (a) | Optional Call Provisions (b) | Value | |||||||||
Illinois | ||||||||||||
| Illinois Finance Authority, Revenue Bonds, Centegra Health System, Series 2014A: | ||||||||||||
| $ 4,750 | (c) | 5.000%, 9/01/39, (Pre-refunded 9/01/24) | 9/24 at 100.00 | $ | 4,788,784 | |||||||
| 6,000 | (c) | 5.000%, 9/01/42, (Pre-refunded 9/01/24) | 9/24 at 100.00 | 6,048,990 | ||||||||
| 10,745 | Illinois Finance Authority, Revenue Bonds, OSF Healthcare System, Series 2015A, 5.000%, 11/15/45 | 11/25 at 100.00 | 10,185,214 | |||||||||
| Illinois Finance Authority, Revenue Bonds, Silver Cross Hospital and Medical Centers, Refunding Series 2015C: | ||||||||||||
| 560 | 5.000%, 8/15/35 | 8/25 at 100.00 | 537,079 | |||||||||
| 3,745 | 5.000%, 8/15/44 | 8/25 at 100.00 | 3,522,336 | |||||||||
| 10,000 | Illinois Finance Authority, Revenue Bonds, University of Chicago Medicine, Series 2022A, 5.000%, 8/15/47 | 8/32 at 100.00 | 9,620,931 | |||||||||
| Illinois Finance Authority, Revenue Bonds, University of Chicago, Refunding Series 2015A: | ||||||||||||
| 2,670 | (c) | 5.000%, 10/01/46, (Pre-refunded 10/01/25) | 10/25 at 100.00 | 2,720,774 | ||||||||
| 330 | 5.000%, 10/01/46 | 10/25 at 100.00 | 328,234 | |||||||||
| 2,000 | Illinois Health Facilities Authority, Revenue Bonds, Midwest Care Center I Inc., Series 2001, 5.950%, 2/20/36 | 11/23 at 100.00 | 2,001,652 | |||||||||
| 1,830 | Illinois Sports Facility Authority, State Tax Supported Bonds, Refunding Series 2014, 5.250%, 6/15/32 - AGM Insured | 6/24 at 100.00 | 1,830,034 | |||||||||
| 450 | Illinois State, General Obligation Bonds, December Series 2017A, 5.000%, 12/01/39 | 12/27 at 100.00 | 427,443 | |||||||||
| Illinois State, General Obligation Bonds, February Series 2014: | ||||||||||||
| 5,705 | 5.250%, 2/01/33 | 2/24 at 100.00 | 5,631,199 | |||||||||
| 5,815 | 5.250%, 2/01/34 | 2/24 at 100.00 | 5,719,491 | |||||||||
| 2,000 | 5.000%, 2/01/39 | 2/24 at 100.00 | 1,905,359 | |||||||||
| Illinois State, General Obligation Bonds, January Series 2016: | ||||||||||||
| 3,500 | 5.000%, 1/01/29 | 1/26 at 100.00 | 3,542,554 | |||||||||
| 8,250 | 5.000%, 1/01/32 | 1/26 at 100.00 | 8,308,580 | |||||||||
| 4,200 | Illinois State, General Obligation Bonds, June Series 2016, 5.000%, 6/01/27 | 6/26 at 100.00 | 4,267,194 | |||||||||
| Illinois State, General Obligation Bonds, June Series 2022A: | ||||||||||||
| 2,000 | 5.500%, 3/01/42 | 3/32 at 100.00 | 2,034,072 | |||||||||
| 785 | 5.500%, 3/01/47 | 3/32 at 100.00 | 789,657 | |||||||||
| 16,485 | Illinois State, General Obligation Bonds, March Series 2021A, 5.000%, 3/01/46 | 3/31 at 100.00 | 15,494,143 | |||||||||
| Illinois State, General Obligation Bonds, May Series 2020: | ||||||||||||
| 1,635 | 5.500%, 5/01/30 | No Opt. Call | 1,712,160 | |||||||||
| 5,305 | 5.500%, 5/01/39 | 5/30 at 100.00 | 5,430,155 | |||||||||
| 3,000 | 5.750%, 5/01/45 | 5/30 at 100.00 | 3,061,421 | |||||||||
| Illinois State, General Obligation Bonds, May Series 2023B: | ||||||||||||
| 4,585 | 5.250%, 5/01/43 | 5/32 at 100.00 | 4,509,717 | |||||||||
| 4,525 | 5.500%, 5/01/47 | 5/32 at 100.00 | 4,551,282 | |||||||||
| 1,500 | Illinois State, General Obligation Bonds, November Series 2016, 5.000%, 11/01/37 | 11/26 at 100.00 | 1,460,178 | |||||||||
| 3,510 | Illinois State, General Obligation Bonds, October Series 2016, 5.000%, 2/01/27 | No Opt. Call | 3,582,641 | |||||||||
| 8,865 | Illinois State, General Obligation Bonds, October Series 2022C, 5.500%, 10/01/41 | 10/32 at 100.00 | 9,036,849 | |||||||||
| 1,395 | Illinois Toll Highway Authority, Toll Highway Revenue Bonds, Senior Lien Series 2013A, 5.000%, 1/01/38 | 12/23 at 100.00 | 1,394,885 | |||||||||
Principal Amount (000) | Description (a) | Optional Call Provisions (b) | Value | |||||||||
Illinois | ||||||||||||
| $ 4,685 | Illinois Toll Highway Authority, Toll Highway Revenue Bonds, Senior Lien Series 2015A, 5.000%, 1/01/40 | 7/25 at 100.00 | $ | 4,675,985 | ||||||||
| Illinois Toll Highway Authority, Toll Highway Revenue Bonds, Senior Lien Series 2021A: | ||||||||||||
| 7,770 | 4.000%, 1/01/42 | 1/32 at 100.00 | 6,783,232 | |||||||||
| 10,000 | 5.000%, 1/01/46 | 1/32 at 100.00 | 9,997,025 | |||||||||
| 5,000 | Illinois Toll Highway Authority, Toll Highway Revenue Bonds, Senior Series 2023A, 5.250%, 1/01/45 | 7/33 at 100.00 | 5,077,022 | |||||||||
| Illinois Toll Highway Authority, Toll Highway Revenue Bonds, Tender Option Bond Trust 2015-XF0052: | ||||||||||||
| 1,875 | 5.460%, 1/01/38, 144A, (IF) | 1/23 at 100.00 | 1,874,381 | |||||||||
| 1,815 | 5.791%, 1/01/38, 144A, (IF) | 1/23 at 100.00 | 1,814,401 | |||||||||
| 4,100 | Lake County School District 112 North Shore, Illinois, General Obligation Bonds, Series 2022, 4.000%, 12/01/38 | 12/31 at 100.00 | 3,765,989 | |||||||||
| Metropolitan Pier and Exposition Authority, Illinois, Dedicated Tax Revenue Bonds, McCormick Place Expansion Project, Series 2002A: | ||||||||||||
| 6,170 | 0.000%, 12/15/23 - NPFG Insured | No Opt. Call | 6,139,778 | |||||||||
| 440 | 0.000%, 12/15/23 - NPFG Insured | No Opt. Call | 437,596 | |||||||||
| 1,890 | Metropolitan Pier and Exposition Authority, Illinois, McCormick Place Expansion Project Bonds, Refunding Series 2015B, 5.000%, 6/15/52 | 12/25 at 100.00 | 1,746,924 | |||||||||
| 1,000 | Metropolitan Pier and Exposition Authority, Illinois, McCormick Place Expansion Project Bonds, Series 2015A, 5.500%, 6/15/53 | 12/25 at 100.00 | 993,938 | |||||||||
| 4,780 | Metropolitan Pier and Exposition Authority, Illinois, McCormick Place Expansion Project Bonds, Series 2017A, 5.000%, 6/15/57 | 12/27 at 100.00 | 4,373,482 | |||||||||
| Metropolitan Pier and Exposition Authority, Illinois, Revenue Bonds, McCormick Place Expansion Project, Refunding Series 1996A: | ||||||||||||
| 23,575 | 0.000%, 12/15/23 - NPFG Insured | No Opt. Call | 23,446,191 | |||||||||
| 10,775 | 0.000%, 12/15/24 - NPFG Insured | No Opt. Call | 10,236,542 | |||||||||
| Metropolitan Pier and Exposition Authority, Illinois, Revenue Bonds, McCormick Place Expansion Project, Series 2002A: | ||||||||||||
| 155 | (c) | 0.000%, 12/15/23, (ETM) | No Opt. Call | 154,222 | ||||||||
| 5,000 | 0.000%, 12/15/34 - NPFG Insured | No Opt. Call | 2,916,634 | |||||||||
| 1,100 | 0.000%, 12/15/35 - NPFG Insured | No Opt. Call | 604,472 | |||||||||
| 3,805 | 0.000%, 6/15/41 - NPFG Insured | No Opt. Call | 1,458,497 | |||||||||
| 1,210 | (c) | Metropolitan Pier and Exposition Authority, Illinois, Revenue Bonds, McCormick Place Hospitality Facility, Series 1996A, 7.000%, 7/01/26, (ETM) | No Opt. Call | 1,261,392 | ||||||||
| 1,350 | Northern Illinois University, Auxiliary Facilities System Revenue Bonds, Refunding Series 2020B, 4.000%, 4/01/41 - BAM Insured | 4/30 at 100.00 | 1,135,743 | |||||||||
| 2,495 | Sangamon County School District 186 Springfield, Illinois, General Obligation Bonds, Alternate Revenue Source Series 2023, 5.500%, 6/01/58 - AGM Insured | 6/33 at 100.00 | 2,535,473 | |||||||||
| 2,500 | Sangamon County Water Reclamation District, Illinois, General Obligation Bonds Alternate Revenue Source, Project & Refunding Series 2019A, 4.000%, 1/01/44 - BAM Insured | 1/29 at 100.00 | 2,125,972 | |||||||||
| Springfield, Illinois, Electric Revenue Bonds, Refunding Senior Lien Series 2015: | ||||||||||||
| 2,250 | 5.000%, 3/01/29 | 3/25 at 100.00 | 2,262,548 | |||||||||
| 3,505 | 5.000%, 3/01/40 - AGM Insured | 3/25 at 100.00 | 3,525,901 | |||||||||
| Total Illinois | 420,149,207 | |||||||||||
| NAD | Nuveen Quality Municipal Income Fund (continued) Portfolio of Investments October 31, 2023 |
Principal Amount (000) | Description (a) | Optional Call Provisions (b) | Value | |||||||||
Indiana - 1.1% (0.6% of Total Investments) | ||||||||||||
| $ 1,480 | Gary Local Public Improvement Bond Bank, Indiana, Economic Development Revenue Bonds, Drexel Foundation for Educational Excellence Project, Refunding Series 2020A, 5.875%, 6/01/55, 144A | 6/30 at 100.00 | $ | 1,164,962 | ||||||||
| Indiana Finance Authority, Hospital Revenue Bonds, Indiana University Health Obligation Group, Fixed Rate Series 2023A: | ||||||||||||
| 3,950 | 5.000%, 10/01/46 | No Opt. Call | 3,901,332 | |||||||||
| 10,000 | 5.000%, 10/01/53 | 10/33 at 100.00 | 9,740,045 | |||||||||
| 7,480 | Indiana Finance Authority, Hospital Revenue Bonds, Indiana Unversity Health Obligation Group, Refunding 2015A, 5.000%, 12/01/40 | 6/25 at 100.00 | 7,490,068 | |||||||||
| 4,500 | Indiana Finance Authority, Wastewater Utility Revenue Bonds, CWA Authority Project, Series 2012A, 4.000%, 10/01/42 | 12/23 at 100.00 | 3,870,602 | |||||||||
| 3,985 | Valparaiso, Indiana, Exempt Faciltiies Revenue Bonds, Pratt Paper LLC Project, Series 2013, 7.000%, 1/01/44, (AMT) | 1/24 at 100.00 | 3,992,809 | |||||||||
| Total Indiana | 30,159,818 | |||||||||||
Iowa - 0.7% (0.4% of Total Investments) | ||||||||||||
| Iowa Finance Authority Senior Living Facilities Revenue Bonds, Sunrise Retirement Community Project, Refunding Series 2021: | ||||||||||||
| 2,550 | 5.000%, 9/01/41 | 9/28 at 102.00 | 1,898,021 | |||||||||
| 2,000 | 5.000%, 9/01/51 | 9/28 at 102.00 | 1,347,306 | |||||||||
| 1,505 | Iowa Finance Authority, Iowa, Midwestern Disaster Area Revenue Bonds, Alcoa Inc. Project, Series 2012, 4.750%, 8/01/42 | 12/23 at 100.00 | 1,324,129 | |||||||||
| 9,535 | Iowa Finance Authority, Iowa, Midwestern Disaster Area Revenue Bonds, Iowa Fertilizer Company Project, Refunding Series 2022, 5.000%, 12/01/50 | 12/29 at 103.00 | 8,463,399 | |||||||||
| 6,235 | Iowa State, Hospital Revenue Bonds, University of Iowa Hospitals and Clinics, SUI Series 2022A, 4.000%, 9/01/36 | 9/32 at 100.00 | 5,744,983 | |||||||||
| 5,290 | Iowa Tobacco Settlement Authority, Tobacco Settlement Asset-Backed Bonds, Class 2 Capital Appreciation Senior Lien Series 2021B-2, 0.000%, 6/01/65 | 6/31 at 25.58 | 490,885 | |||||||||
| Total Iowa | 19,268,723 | |||||||||||
Kansas - 0.6% (0.4% of Total Investments) | ||||||||||||
| Lawrence, Kansas, Hospital Revenue Bonds, Lawrence Memorial Hospital, Series 2018A: | ||||||||||||
| 6,770 | 5.000%, 7/01/43 | 7/28 at 100.00 | 6,354,927 | |||||||||
| 7,600 | 5.000%, 7/01/48 | 7/28 at 100.00 | 6,904,380 | |||||||||
| 3,625 | Wyandotte County Unified School District 203, Piper, Kansas, General Obligation Bonds, Improvement and Refunding Series 2022A, 5.250%, 9/01/52 - AGM Insured | 9/32 at 100.00 | 3,673,941 | |||||||||
| Total Kansas | 16,933,248 | |||||||||||
Kentucky - 0.4% (0.2% of Total Investments) | ||||||||||||
| 2,730 | Kentucky Economic Development Finance Authority, Revenue Bonds, Next Generation Kentucky Information Highway Project, Senior Series 2015A, 5.000%, 1/01/45 | 7/25 at 100.00 | 2,478,459 | |||||||||
| Kentucky Public Transportation Infrastructure Authority, Toll Revenue Bonds, Downtown Crossing Project, Convertible Capital Appreciation First Tier Series 2013C: | ||||||||||||
| 4,790 | 6.750%, 7/01/43 | 7/31 at 100.00 | 5,231,280 | |||||||||
| 3,655 | 6.875%, 7/01/46 | 7/31 at 100.00 | 3,999,640 | |||||||||
| Total Kentucky | 11,709,379 | |||||||||||
Principal Amount (000) | Description (a) | Optional Call Provisions (b) | Value | |||||||||
Louisiana - 3.6% (2.1% of Total Investments) | ||||||||||||
| $ 4,055 | Ascension Parish Industrial development Board, Louisiana, Revenue Bonds, Impala Warehousing (US) LLC Project, Series 2013, 6.000%, 7/01/36 | 12/23 at 100.00 | $ | 3,908,464 | ||||||||
| 2,665 | (c) | East Baton Rouge Sewerage Commission, Louisiana, Revenue Bonds, Refunding Series 2014B, 5.000%, 2/01/39, (Pre-refunded 2/01/25) | 2/25 at 100.00 | 2,704,425 | ||||||||
| 3,130 | Jefferson Sales Tax District, Jefferson Parish, Louisiana, Special Sales Tax Revenue Bonds, Series 2017B, 5.000%, 12/01/42 - AGM Insured | 12/27 at 100.00 | 3,094,171 | |||||||||
| Lafayette Parish School Board, Louisiana, Sales Tax Revenue Bonds, Series 2018: | ||||||||||||
| 1,500 | 4.000%, 4/01/40 | 4/27 at 100.00 | 1,325,832 | |||||||||
| 4,685 | 4.000%, 4/01/43 | 4/27 at 100.00 | 4,013,631 | |||||||||
| 4,000 | Louisiana Local Government Environmental Facilities and Community Development Authority, Louisiana, Revenue Bonds, Womans Hospital Foundation Project, Refunding Series 2017A, 5.000%, 10/01/41 | 10/27 at 100.00 | 3,763,075 | |||||||||
| 5,200 | (c) | Louisiana Local Government Environmental Facilities and Community Development Authority, Revenue Bonds, East Baton Rouge Sewerage Commission Projects, Subordinate Lien Series 2014A, 5.000%, 2/01/44, (Pre-refunded 2/01/24) | 2/24 at 100.00 | 5,213,838 | ||||||||
| 7,000 | Louisiana Publc Facilities Authority, Lousiana, Revenue Bonds, Ochsner Clinic Foundation Project, Refunding Series 2017, 5.000%, 5/15/46 | 5/27 at 100.00 | 6,541,846 | |||||||||
| 10,000 | Louisiana Publc Facilities Authority, Lousiana, Revenue Bonds, Ochsner Clinic Foundation Project, Series 2020A, 4.000%, 5/15/49 | 5/30 at 100.00 | 7,965,884 | |||||||||
| 6,900 | Louisiana Public Facilities Authority, Dock and Wharf Revenue Bonds, Impala Warehousing (US) LLC Project, Series 2013, 6.500%, 7/01/36, (AMT), 144A | 12/23 at 100.00 | 6,657,317 | |||||||||
| 1,265 | (c) | Louisiana Public Facilities Authority, Hospital Revenue and Refunding Bonds, Lafayette General Medical Center Project, Series 2016A, 5.000%, 11/01/45, (Pre-refunded 11/01/25) | 11/25 at 100.00 | 1,291,371 | ||||||||
| 1,830 | Louisiana Public Facilities Authority, Revenue Bonds, Ochsner Clinic Foundation Project, Refunding Series 2016, 4.000%, 5/15/35 | 5/26 at 100.00 | 1,726,356 | |||||||||
| 10,810 | Louisiana Stadium and Exposition District, Revenue Bonds, Senior Series 2023A, 5.000%, 7/01/48 | 7/33 at 100.00 | 10,670,228 | |||||||||
| 14,000 | (c) | Louisiana State, Gasoline and Fuels Tax Revenue Bonds, Refunding Series 2015A, 4.000%, 5/01/41, (Pre-refunded 5/01/25) | 5/25 at 100.00 | 14,017,155 | ||||||||
| New Orleans Aviation Board, Louisiana, General Airport Revenue Bonds, North Terminal Project, Series 2015B: | ||||||||||||
| 6,235 | 5.000%, 1/01/40, (AMT) | 1/25 at 100.00 | 6,031,125 | |||||||||
| 6,895 | 5.000%, 1/01/45, (AMT) | 1/25 at 100.00 | 6,461,832 | |||||||||
| 5,350 | (c) | New Orleans, Louisiana, Sewerage Service Revenue Bonds, Refunding Series 2014, 5.000%, 6/01/44, (Pre-refunded 6/01/24) | 6/24 at 100.00 | 5,383,320 | ||||||||
| 1,200 | (c) | New Orleans, Louisiana, Water Revenue Bonds, Refunding Series 2014, 5.000%, 12/01/44, (Pre-refunded 12/01/24) | 12/24 at 100.00 | 1,213,503 | ||||||||
| 5,655 | Shreveport, Louisiana, Water and Sewer Revenue Bonds, Refunding Series 2015, 5.000%, 12/01/40 | 12/25 at 100.00 | 5,629,966 | |||||||||
| Total Louisiana | 97,613,339 | |||||||||||
Maine - 0.4% (0.2% of Total Investments) | ||||||||||||
| Maine Health and Higher Educational Facilities Authority Revenue Bonds, Eastern Maine Medical Center Obligated Group Issue, Series 2016A: | ||||||||||||
| 3,820 | 4.000%, 7/01/41 | 7/26 at 100.00 | 2,949,186 | |||||||||
| 2,800 | 4.000%, 7/01/46 | 7/26 at 100.00 | 2,020,475 | |||||||||
| NAD | Nuveen Quality Municipal Income Fund (continued) Portfolio of Investments October 31, 2023 |
Principal Amount (000) | Description (a) | Optional Call Provisions (b) | Value | |||||||||
Maine | ||||||||||||
| $ 2,935 | Maine Health and Higher Educational Facilities Authority Revenue Bonds, MaineHealth Issue, Series 2018A, 5.000%, 7/01/48 | 7/28 at 100.00 | $ | 2,818,732 | ||||||||
| Maine Turnpike Authority, Special Obligation Bonds, Series 2014: | ||||||||||||
| 1,290 | 5.000%, 7/01/33 | 7/24 at 100.00 | 1,297,250 | |||||||||
| 1,020 | 5.000%, 7/01/34 | 7/24 at 100.00 | 1,025,400 | |||||||||
| Total Maine | 10,111,043 | |||||||||||
Maryland - 9.8% (5.7% of Total Investments) | ||||||||||||
| 1,810 | Anne Arundel County, Maryland, FNMA Multifamily Housing Revenue Bonds, Glenview Gardens Apartments Project, Series 2009, 5.000%, 1/01/28, (Mandatory Put 1/01/27) | 12/23 at 100.00 | 1,811,232 | |||||||||
| 1,180 | Anne Arundel County, Maryland, Special Tax District Revenue Bonds, Villages of Dorchester & Farmington Village Projects, Series 2013, 5.000%, 7/01/32 | 12/23 at 100.00 | 1,180,293 | |||||||||
| Baltimore County, Maryland, Revenue Bonds, Oak Crest Village, Series 2016: | ||||||||||||
| 1,000 | 3.625%, 1/01/37 | 1/26 at 100.00 | 841,466 | |||||||||
| 2,220 | 5.000%, 1/01/37 | 1/26 at 100.00 | 2,206,316 | |||||||||
| 2,500 | Baltimore County, Maryland, Revenue Bonds, Oak Crest Village, Series 2020, 4.000%, 1/01/50 | 1/27 at 103.00 | 1,891,130 | |||||||||
| 635 | Baltimore County, Maryland, Revenue Bonds, Riderwood Village Inc Facility, Series 2020, 4.000%, 1/01/50 | 1/27 at 103.00 | 478,961 | |||||||||
| 9,215 | Baltimore, Maryland, Convention Center Hotel Revenue Bonds, Refunding Series 2017, 5.000%, 9/01/42 | 9/27 at 100.00 | 7,661,847 | |||||||||
| 2,480 | (c) | Baltimore, Maryland, Project and Revenue Refunding Bonds, Water Projects, Series 2013B, 5.000%, 7/01/38, (Pre-refunded 1/01/24) | 1/24 at 100.00 | 2,483,899 | ||||||||
| 5,000 | Baltimore, Maryland, Revenue Bonds, Wastewater Projects, Subordinate Series 2014C, 5.000%, 7/01/44 | 1/25 at 100.00 | 4,849,276 | |||||||||
| 2,000 | Baltimore, Maryland, Revenue Bonds, Wastewater Projects, Subordinate Series 2017A, 5.000%, 7/01/46 | 1/27 at 100.00 | 1,999,493 | |||||||||
| 2,000 | Baltimore, Maryland, Revenue Bonds, Wastewater Projects, Subordinate Series 2017A, 5.000%, 7/01/46, (UB) | 1/27 at 100.00 | 1,999,492 | |||||||||
| 625 | (c) | Baltimore, Maryland, Revenue Bonds, Water Projects, Refunding Series 1994A, 5.000%, 7/01/24 - FGIC Insured, (ETM) | No Opt. Call | 629,453 | ||||||||
| 1,750 | (c) | Baltimore, Maryland, Revenue Bonds, Water Projects, Refunding Series 1998A, 5.000%, 7/01/28 - FGIC Insured, (ETM) | 8/21 at 100.00 | 1,784,639 | ||||||||
| 2,500 | Baltimore, Maryland, Revenue Bonds, Water Projects, Subordinate Series 2014A, 5.000%, 7/01/44 | 1/25 at 100.00 | 2,424,638 | |||||||||
| 6,000 | Baltimore, Maryland, Revenue Bonds, Water Projects, Subordinate Series 2017A, 5.000%, 7/01/41, (UB) | 1/27 at 100.00 | 6,034,960 | |||||||||
| 1,450 | Baltimore, Maryland, Special Obligation Bonds, Center/West Development Project, Series 2017A, 5.500%, 6/01/43 | 6/26 at 100.00 | 1,388,357 | |||||||||
| Baltimore, Maryland, Special Obligation Bonds, Consolidated Tax Increment Financing, Series 2015: | ||||||||||||
| 525 | 5.000%, 6/15/30 | 6/24 at 100.00 | 526,980 | |||||||||
| 425 | 5.000%, 6/15/33 | 6/24 at 100.00 | 426,555 | |||||||||
| Baltimore, Maryland, Special Obligation Bonds, East Baltimore Research Park Project, Series 2017A: | ||||||||||||
| 1,270 | 4.500%, 9/01/33 | 9/27 at 100.00 | 1,184,080 | |||||||||
| 240 | 5.000%, 9/01/38 | 9/27 at 100.00 | 224,805 | |||||||||
Principal Amount (000) | Description (a) | Optional Call Provisions (b) | Value | |||||||||
Maryland | ||||||||||||
| Baltimore, Maryland, Special Obligation Bonds, Harbor Point Project, Refunding Series 2016: | ||||||||||||
| $ 1,895 | 5.000%, 6/01/36 | 6/26 at 100.00 | $ | 1,788,784 | ||||||||
| 250 | 5.125%, 6/01/43 | 6/26 at 100.00 | 228,360 | |||||||||
| 2,000 | Baltimore, Maryland, Special Obligation Bonds, Harbor Point Project, Refunding Series 2019A, 3.625%, 6/01/46, 144A | 6/29 at 100.00 | 1,457,600 | |||||||||
| 350 | Baltimore, Maryland, Special Obligation Bonds, Harbor Point Project, Refunding Series 2019B, 3.875%, 6/01/46, 144A | 11/23 at 100.00 | 257,556 | |||||||||
| Brunswick, Frederick County, Maryland, Special Obligation Bonds, Brunswick Crossing Special Taxing District, Refunding Series 2019: | ||||||||||||
| 450 | 4.000%, 7/01/29 | 1/29 at 100.00 | 425,676 | |||||||||
| 739 | 5.000%, 7/01/36 | 1/29 at 100.00 | 709,507 | |||||||||
| Frederick County, Maryland, Educational Facilities Revenue Bonds, Mount Saint Mary’s University Inc., Series 2017A: | ||||||||||||
| 3,000 | 5.000%, 9/01/37, 144A | 9/27 at 100.00 | 2,717,842 | |||||||||
| 1,750 | 5.000%, 9/01/45, 144A | 9/27 at 100.00 | 1,469,215 | |||||||||
| 330 | Frederick County, Maryland, Special Obligation Bonds, Lake Linganore Village Community Development Series 2001A, 5.700%, 7/01/29 - RAAI Insured | 12/23 at 100.00 | 330,372 | |||||||||
| 1,250 | Frederick County, Maryland, Special Obligation Bonds, Urbana Community Development Authority, Refunding Series 2020A, 4.000%, 7/01/35 | 7/30 at 100.00 | 1,151,598 | |||||||||
| 370 | Frederick County, Maryland, Tax Increment and Special Tax B Limited Obligation Bonds, Oakdale-Lake Linganore Project, Series 2019, 3.750%, 7/01/39 | 7/29 at 100.00 | 294,457 | |||||||||
| 115 | Frederick County, Maryland, Tax Increment and Special Tax Limited Obligation Bonds, Jefferson Technology Park Project, Refunding Series 2020B, 4.625%, 7/01/43, 144A | 7/30 at 102.00 | 100,980 | |||||||||
| Gaithersburg, Maryland, Economic Development Revenue Bonds, Asbury Methodist Obligated Group Project, Refunding Series 2018A: | ||||||||||||
| 2,000 | 5.000%, 1/01/33 | 1/24 at 104.00 | 1,923,052 | |||||||||
| 1,000 | 5.000%, 1/01/36 | 1/24 at 104.00 | 929,145 | |||||||||
| Howard County Housing Commission, Maryland, Revenue Bonds, Columbia Commons Apartments, Series 2014A: | ||||||||||||
| 1,500 | 4.000%, 6/01/34 | 6/24 at 100.00 | 1,458,670 | |||||||||
| 1,550 | 5.000%, 6/01/44 | 6/24 at 100.00 | 1,492,092 | |||||||||
| 1,860 | Howard County Housing Commission, Maryland, Revenue Bonds, Gateway Village Apartments, Series 2016, 4.000%, 6/01/46 | 6/26 at 100.00 | 1,479,859 | |||||||||
| Howard County Housing Commission, Maryland, Revenue Bonds, The Verona at Oakland Mills Project, Series 2013: | ||||||||||||
| 2,000 | 4.625%, 10/01/28 | 12/23 at 100.00 | 2,000,631 | |||||||||
| 3,000 | 5.000%, 10/01/28 | 12/23 at 100.00 | 3,001,957 | |||||||||
| 1,000 | Howard County Housing Commission, Maryland, Revenue Bonds, Woodfield Oxford Square Apartments, Series 2017, 5.000%, 12/01/42 | 12/27 at 100.00 | 972,886 | |||||||||
| 1,290 | Howard County, Maryland, Retirement Community Revenue Bonds, Vantage House, Refunding Series 2016, 5.000%, 4/01/46 | 4/27 at 100.00 | 962,677 | |||||||||
| 1,710 | Howard County, Maryland, Retirement Community Revenue Bonds, Vantage House, Refunding Series 2017, 5.000%, 4/01/36 | 4/27 at 100.00 | 1,440,612 | |||||||||
| 1,420 | Howard County, Maryland, Special Obligation Bonds, Annapolis Junction Town Center Project, Series 2014, 6.100%, 2/15/44 | 2/24 at 100.00 | 1,350,494 | |||||||||
| NAD | Nuveen Quality Municipal Income Fund (continued) Portfolio of Investments October 31, 2023 |
Principal Amount (000) | Description (a) | Optional Call Provisions (b) | Value | |||||||||
Maryland | ||||||||||||
| Howard County, Maryland, Special Obligation Bonds, Downtown Columbia Project, Series 2017A: | ||||||||||||
| $ 1,500 | 4.125%, 2/15/34, 144A | 2/26 at 100.00 | $ | 1,352,664 | ||||||||
| 1,550 | 4.375%, 2/15/39, 144A | 2/26 at 100.00 | 1,359,593 | |||||||||
| 850 | 4.500%, 2/15/47, 144A | 2/26 at 100.00 | 704,062 | |||||||||
| Hyattsville, Maryland, Special Obligation Bonds, University Town Center Project, Series 2016: | ||||||||||||
| 2,125 | 5.000%, 7/01/31 | 7/25 at 100.00 | 2,016,440 | |||||||||
| 1,640 | 5.000%, 7/01/34 | 7/25 at 100.00 | 1,503,430 | |||||||||
| 1,220 | Maryland Community Development Administration Department of Housing and Community Development, Housing Revenue Bonds, Series 2000A, 2.800%, 7/01/45 | 7/29 at 100.00 | 775,583 | |||||||||
| 1,195 | Maryland Community Development Administration Department of Housing and Community Development, Housing Revenue Bonds, Series 2014D, 3.900%, 7/01/40 | 1/24 at 100.00 | 1,039,742 | |||||||||
| 680 | Maryland Community Development Administration Department of Housing and Community Development, Housing Revenue Bonds, Series 2017C, 3.550%, 7/01/42 | 1/27 at 100.00 | 549,250 | |||||||||
| 700 | Maryland Community Development Administration Department of Housing and Community Development, Housing Revenue Bonds, Series 2020E, 2.350%, 7/01/45 | 1/30 at 100.00 | 406,324 | |||||||||
| 1,445 | Maryland Community Development Administration Department of Housing and Community Development, Residential Revenue Bonds, Series 2019C, 3.000%, 3/01/42 | 3/29 at 100.00 | 1,151,891 | |||||||||
| 2,000 | Maryland Community Development Administration Department of Housing and Community Development, Residential Revenue Bonds, Series 2020D, 2.100%, 9/01/40 | 9/29 at 100.00 | 1,260,797 | |||||||||
| 2,570 | Maryland Community Development Administration Department of Housing and Community Development, Residential Revenue Bonds, Series 2021A, 2.000%, 9/01/43 | 3/30 at 100.00 | 1,415,429 | |||||||||
| 2,000 | Maryland Community Development Administration Department of Housing and Community Development, Residential Revenue Bonds, Taxable Series 2019D, 3.350%, 7/01/49 | 7/29 at 100.00 | 1,453,345 | |||||||||
| 1,000 | Maryland Community Development Administration, Department of Housing and Community Development, Multifamily Development Revenue Bonds, Marlborough Apartments, Series 2014I, 3.450%, 12/15/31 | 12/24 at 100.00 | 936,710 | |||||||||
| 600 | Maryland Economic Development Corporation Economic Development Revenue Bonds, Terminal Project, Series 2019A, 5.000%, 6/01/49, (AMT) | 6/29 at 100.00 | 559,086 | |||||||||
| Maryland Economic Development Corporation Economic Development Revenue Bonds, Transportation Facilities Project, Refunding Series 2017A: | ||||||||||||
| 1,000 | 5.000%, 6/01/31 | 6/28 at 100.00 | 1,009,544 | |||||||||
| 1,125 | 5.000%, 6/01/32 | 6/28 at 100.00 | 1,134,616 | |||||||||
| 3,360 | 5.000%, 6/01/35 | 6/28 at 100.00 | 3,378,040 | |||||||||
| 1,600 | Maryland Economic Development Corporation, Air Cargo Obligated Group Revenue Bonds, AFCO Airport Real Estate Group, Series 2019, 4.000%, 7/01/39, (AMT) | 7/29 at 100.00 | 1,323,851 | |||||||||
| Maryland Economic Development Corporation, Parking Facilities Revenue Bonds Baltimore City Project, Subordinate Parking Facilities Revenue Bonds, Series 2018C: | ||||||||||||
| 1,250 | 4.000%, 6/01/48 | 6/28 at 100.00 | 861,955 | |||||||||
| 1,080 | 4.000%, 6/01/58 | 6/28 at 100.00 | 695,413 | |||||||||
Principal Amount (000) | Description (a) | Optional Call Provisions (b) | Value | |||||||||||
Maryland | ||||||||||||||
| $3,725 | Maryland Economic Development Corporation, Parking Facilities Revenue Bonds, Baltimore City Project, Senior Parking Facilities Revenue Bonds, Series 2018A, 5.000%, 6/01/58 | 6/28 at 100.00 | $ | 3,296,747 | ||||||||||
| 5,810 | Maryland Economic Development Corporation, Port Facilities Revenue Bonds, CNX Marine Terminals Inc. Port of Baltimore Facility, Refunding Series 2010, 5.750%, 9/01/25 | 12/23 at 100.00 | 5,861,112 | |||||||||||
| 2,000 | (d) | Maryland Economic Development Corporation, Revenue Bonds, Chesapeake Bay Hyatt Conference Center, Series 2006A, 5.000%, 12/01/31 | 12/23 at 100.00 | 1,200,000 | ||||||||||
| Maryland Economic Development Corporation, Senior Student Housing Revenue Bonds, Towson University Project, Refunding Series 2017: | ||||||||||||||
| 1,100 | 5.000%, 7/01/36 | 7/27 at 100.00 | 1,037,759 | |||||||||||
| 470 | 5.000%, 7/01/37 | 12/23 at 100.00 | 440,722 | |||||||||||
| Maryland Economic Development Corporation, Special Obligation Bonds, Metro Centre Owings Mills Project, Series 2017: | ||||||||||||||
| 585 | 4.375%, 7/01/36 | 1/27 at 100.00 | 525,495 | |||||||||||
| 355 | 4.500%, 7/01/44 | 1/27 at 100.00 | 302,101 | |||||||||||
| Maryland Economic Development Corporation, Student Housing Revenue Bonds, Salisbury University Project, Refunding Series 2013: | ||||||||||||||
| 500 | 5.000%, 6/01/27 | 12/23 at 100.00 | 496,749 | |||||||||||
| 500 | 5.000%, 6/01/34 | 12/23 at 100.00 | 470,936 | |||||||||||
| 1,510 | Maryland Economic Development Corporation, Student Housing Revenue Bonds, Sheppard Pratt University Village, Series 2012, 5.000%, 7/01/33 | 12/23 at 100.00 | 1,445,382 | |||||||||||
| 495 | Maryland Economic Development Corporation, Student Housing Revenue Bonds, University of Maryland - Baltimore Project, Refunding Senior Lien Series 2015, 5.000%, 7/01/39 | 7/25 at 100.00 | 466,718 | |||||||||||
| 1,110 | Maryland Economic Development Corporation, Student Housing Revenue Bonds, University of Maryland, Baltimore County Project, Refunding Series 2016, 3.600%, 7/01/35 - AGM Insured | 12/23 at 100.00 | 1,013,354 | |||||||||||
| Maryland Economic Development Corporation, Student Housing Revenue Bonds, University of Maryland, College Park Project, Refunding Series 2016: | ||||||||||||||
| 875 | 5.000%, 6/01/30 - AGM Insured | 6/26 at 100.00 | 888,537 | |||||||||||
| 240 | 5.000%, 6/01/31 - AGM Insured | 6/26 at 100.00 | 243,675 | |||||||||||
| 2,405 | 5.000%, 6/01/35 - AGM Insured | 6/26 at 100.00 | 2,438,181 | |||||||||||
| 780 | 5.000%, 6/01/43 - AGM Insured | 6/26 at 100.00 | 761,687 | |||||||||||
| Maryland Health and Higher Educational Facilities Authority, Maryland, Revenue Bonds, Meritus Medical Center, Series 2015: | ||||||||||||||
| 990 | 4.000%, 7/01/32 | 7/25 at 100.00 | 907,439 | |||||||||||
| 2,470 | 4.250%, 7/01/35 | 7/25 at 100.00 | 2,217,229 | |||||||||||
| 1,740 | 5.000%, 7/01/45 | 7/25 at 100.00 | 1,621,003 | |||||||||||
| Maryland Health and Higher Educational Facilities Authority, Parking Facilities Revenue Bonds, Johns Hopkins Hospital, Series 2001: | ||||||||||||||
| 1,300 | 5.000%, 7/01/27 - AMBAC Insured | 12/23 at 100.00 | 1,308,790 | |||||||||||
| 1,000 | 5.000%, 7/01/34 - AMBAC Insured | 12/23 at 100.00 | 1,006,828 | |||||||||||
| 210 | Maryland Health and Higher Educational Facilities Authority, Parking Facilities Revenue Bonds, Johns Hopkins Medical Institutions, Series 1996, 5.500%, 7/01/26 - AMBAC Insured | 12/23 at 100.00 | 211,419 | |||||||||||
| Maryland Health and Higher Educational Facilities Authority, Revenue Bonds Doctors Community Hospital, Series 2017B: | ||||||||||||||
| 250 | 5.000%, 7/01/34 | 7/27 at 100.00 | 250,060 | |||||||||||
| 4,820 | 5.000%, 7/01/38 | 7/27 at 100.00 | 4,491,787 | |||||||||||
| NAD | Nuveen Quality Municipal Income Fund (continued) Portfolio of Investments October 31, 2023 |
Principal Amount (000) | Description (a) | Optional Call Provisions (b) | Value | |||||||||||
Maryland | ||||||||||||||
| Maryland Health and Higher Educational Facilities Authority, Revenue Bonds, Mercy Medical Center, Series 2016A: | ||||||||||||||
| $ | 90 | 5.000%, 7/01/36 | 7/26 at 100.00 | $ | 89,813 | |||||||||
| 1,450 | 5.000%, 7/01/38 | 7/26 at 100.00 | 1,370,889 | |||||||||||
| 600 | 4.000%, 7/01/42 | 7/26 at 100.00 | 487,133 | |||||||||||
| Maryland Health and Higher Educational Facilities Authority, Revenue Bonds, Adventist Healthcare, Series 2016A: | ||||||||||||||
| 1,400 | 5.500%, 1/01/36 | 1/27 at 100.00 | 1,410,056 | |||||||||||
| 4,020 | 5.500%, 1/01/46 | 1/27 at 100.00 | 3,769,271 | |||||||||||
| Maryland Health and Higher Educational Facilities Authority, Revenue Bonds, Charlestown Community Issue, Series 2016A: | ||||||||||||||
| 2,125 | 5.000%, 1/01/36 | 7/26 at 100.00 | 2,137,591 | |||||||||||
| 4,090 | 5.000%, 1/01/45 | 7/26 at 100.00 | 3,896,885 | |||||||||||
| Maryland Health and HIgher Educational Facilities Authority, Revenue Bonds, Frederick Health System Issue; Series 2020: | ||||||||||||||
| 1,000 | 3.250%, 7/01/39 | 7/30 at 100.00 | 715,533 | |||||||||||
| 280 | 4.000%, 7/01/45 | 7/30 at 100.00 | 229,480 | |||||||||||
| Maryland Health and Higher Educational Facilities Authority, Revenue Bonds, Goucher College, Series 2017A: | ||||||||||||||
| 1,100 | 5.000%, 7/01/37 | 7/27 at 100.00 | 1,097,331 | |||||||||||
| 1,200 | 5.000%, 7/01/44 | 7/27 at 100.00 | 1,149,222 | |||||||||||
| Maryland Health and Higher Educational Facilities Authority, Revenue Bonds, Green Street Academy, Series 2017A: | ||||||||||||||
| 265 | 5.125%, 7/01/37, 144A | 7/27 at 100.00 | 241,716 | |||||||||||
| 500 | 5.250%, 7/01/47, 144A | 7/27 at 100.00 | 428,719 | |||||||||||
| 1,745 | (c) | Maryland Health and Higher Educational Facilities Authority, Revenue Bonds, Helix Health, Series 1997, 5.000%, 7/01/27 - AMBAC Insured, (ETM) | 8/21 at 100.00 | 1,781,846 | ||||||||||
| 2,500 | Maryland Health and Higher Educational Facilities Authority, Revenue Bonds, Johns Hopkins Health System Issue, Series 2015A, 4.000%, 5/15/40 | 5/25 at 100.00 | 2,149,926 | |||||||||||
| Maryland Health and Higher Educational Facilities Authority, Revenue Bonds, Johns Hopkins University, Series 2013B: | ||||||||||||||
| 500 | 5.000%, 7/01/38 | 11/23 at 100.00 | 500,051 | |||||||||||
| 4,375 | 4.250%, 7/01/41 | 11/23 at 100.00 | 3,884,451 | |||||||||||
| Maryland Health and Higher Educational Facilities Authority, Revenue Bonds, LifeBridge Health Issue, Series 2017: | ||||||||||||||
| 1,000 | 5.000%, 7/01/33 | 7/27 at 100.00 | 1,019,687 | |||||||||||
| 1,000 | 5.000%, 7/01/44 | 7/27 at 100.00 | 966,492 | |||||||||||
| Maryland Health and Higher Educational Facilities Authority, Revenue Bonds, LifeBridge Health System, Series 2015: | ||||||||||||||
| 1,500 | (c) | 4.000%, 7/01/35, (Pre-refunded 7/01/25) | 7/25 at 100.00 | 1,505,655 | ||||||||||
| 1,125 | (c) | 5.000%, 7/01/40, (Pre-refunded 7/01/25) | 7/25 at 100.00 | 1,147,211 | ||||||||||
| 2,975 | 4.125%, 7/01/47 | 7/25 at 100.00 | 2,436,948 | |||||||||||
| Maryland Health and Higher Educational Facilities Authority, Revenue Bonds, Loyola University Maryland, Series 2014: | ||||||||||||||
| 1,000 | 4.000%, 10/01/45 | 10/24 at 100.00 | 823,772 | |||||||||||
| 1,250 | 5.000%, 10/01/45 | 10/24 at 100.00 | 1,237,990 | |||||||||||
| Maryland Health and Higher Educational Facilities Authority, Revenue Bonds, Maryland Institute College of Art, Series 2012: | ||||||||||||||
| 1,500 | 5.000%, 6/01/34 | 11/23 at 100.00 | 1,500,140 | |||||||||||
| 3,000 | 5.000%, 6/01/47 | 11/23 at 100.00 | 2,734,296 | |||||||||||
Principal Amount (000) | Description (a) | Optional Call Provisions (b) | Value | |||||||||||
Maryland | ||||||||||||||
| Maryland Health and Higher Educational Facilities Authority, Revenue Bonds, Maryland Institute College of Art, Series 2016: | ||||||||||||||
| $ | 175 | 5.000%, 6/01/36 | 6/26 at 100.00 | $ | 174,680 | |||||||||
| 2,500 | 4.000%, 6/01/42 | 6/26 at 100.00 | 2,035,969 | |||||||||||
| Maryland Health and Higher Educational Facilities Authority, Revenue Bonds, Maryland Institute College of Art, Series 2017: | ||||||||||||||
| 525 | 5.000%, 6/01/35 | 6/26 at 100.00 | 526,403 | |||||||||||
| 1,000 | 5.000%, 6/01/42 | 6/26 at 100.00 | 939,729 | |||||||||||
| 2,500 | Maryland Health and Higher Educational Facilities Authority, Revenue Bonds, MedStar Health Issue, Series 2015, 5.000%, 8/15/38 | 2/25 at 100.00 | 2,489,516 | |||||||||||
| Maryland Health and Higher Educational Facilities Authority, Revenue Bonds, Peninsula Regional Medical Center Issue, Refunding Series 2015: | ||||||||||||||
| 2,790 | (c) | 5.000%, 7/01/39, (Pre-refunded 7/01/24) | 7/24 at 100.00 | 2,805,316 | ||||||||||
| 5,500 | (c) | 5.000%, 7/01/45, (Pre-refunded 7/01/24) | 7/24 at 100.00 | 5,530,194 | ||||||||||
| 865 | Maryland Health and Higher Educational Facilities Authority, Revenue Bonds, Stevenson University, Series 2021A, 4.000%, 6/01/41 | 6/31 at 100.00 | 734,992 | |||||||||||
| 3,260 | (g) | Maryland Health and Higher Educational Facilities Authority, Revenue Bonds, Trinity Health Credit Group, Series 2017MD, 5.000%, 12/01/46, (UB) | 6/27 at 100.00 | 3,129,022 | ||||||||||
| 1,000 | (g) | Maryland Health and Higher Educational Facilities Authority, Revenue Bonds, Trinity Health Credit Group, Series 2017MD, 5.000%, 12/01/46 | 6/27 at 100.00 | 959,823 | ||||||||||
| 1,000 | Maryland Health and Higher Educational Facilities Authority, Revenue Bonds, University of Maryland Medical System Issue, Series 2015, 5.000%, 7/01/35 | 7/25 at 100.00 | 1,009,560 | |||||||||||
| 5,500 | Maryland Health and Higher Educational Facilities Authority, Revenue Bonds, University of Maryland Medical System Issue, Series 2017B, 5.000%, 7/01/39 | 7/27 at 100.00 | 5,449,848 | |||||||||||
| 2,000 | Maryland Health and Higher Educational Facilities Authority, Revenue Bonds, University of Maryland Medical System Issue, Taxable Series 2017D, 4.000%, 7/01/48 | 1/28 at 100.00 | 1,675,273 | |||||||||||
| 12,250 | (c) | Maryland Health and Higher Educational Facilities Authority, Revenue Bonds, Western Maryland Health, Series 2014, 5.250%, 7/01/34, (Pre- refunded 7/01/24) | 7/24 at 100.00 | 12,341,073 | ||||||||||
| Maryland Stadium Authority, Revenue Bonds, Baltimore City Public Schools Construction & Revitalization Program, Series 2016: | ||||||||||||||
| 4,395 | 5.000%, 5/01/33 | 5/26 at 100.00 | 4,485,341 | |||||||||||
| 3,650 | (c) | 5.000%, 5/01/35, (Pre-refunded 5/01/26) | 5/26 at 100.00 | 3,766,296 | ||||||||||
| 5,100 | (c),(g) | 5.000%, 5/01/46, (Pre-refunded 5/01/26), (UB) | 5/26 at 100.00 | 5,262,495 | ||||||||||
| Maryland Stadium Authority, Revenue Bonds, Baltimore City Public Schools Construction & Revitalization Program, Series 2018A: | ||||||||||||||
| 2,000 | 5.000%, 5/01/35 | 5/28 at 100.00 | 2,071,618 | |||||||||||
| 2,000 | 5.000%, 5/01/36 | 5/28 at 100.00 | 2,061,888 | |||||||||||
| 6,250 | (g) | 5.000%, 5/01/42, (UB) | 5/28 at 100.00 | 6,304,425 | ||||||||||
| 7,000 | Maryland Transportation Authority, Revenue Bonds, Transportation Facilities Projects, Series 2020, 4.000%, 7/01/50 | 7/30 at 100.00 | 5,835,057 | |||||||||||
| 1,250 | Maryland Transportation Authority, Revenue Bonds, Transportation Facilities Projects, Series 2021A, 5.000%, 7/01/46 | 7/31 at 100.00 | 1,268,084 | |||||||||||
| 1,500 | Montgomery County Housing Opportunities Commission, Maryland, Multifamily Housing Development Bonds, Series 2014A, 3.875%, 7/01/39 | 7/24 at 100.00 | 1,336,552 | |||||||||||
| 6,000 | Montgomery County, Maryland, Revenue Bonds, Trinity Health Credit Group, Series 2015, 4.000%, 12/01/44 | 6/25 at 100.00 | 5,110,266 | |||||||||||
| NAD | Nuveen Quality Municipal Income Fund (continued) Portfolio of Investments October 31, 2023 |
Principal Amount (000) | Description (a) | Optional Call Provisions (b) | Value | |||||||||
Maryland | ||||||||||||
| $ | 320 | Prince George’s County Revenue Authority, Maryland, Special Obligation Bonds, Suitland-Naylor Road Project, Series 2016, 5.000%, 7/01/46, 144A | 1/26 at 100.00 | $ | 286,877 | |||||||
| 4,500 | (g) | Prince George’s County, Maryland, Certificates of Participation, University of Maryland Capital Region Medical Center, Series 2018, 5.000%, 10/01/43, (UB) | 10/28 at 100.00 | 4,521,101 | ||||||||
| 3,000 | Prince George’s County, Maryland, General Obligation Consolidated Public Improvement Bonds, Series 2014A, 4.000%, 9/01/31 | 9/24 at 100.00 | 2,976,661 | |||||||||
| 1,050 | Prince George’s County, Maryland, Revenue Bonds, Collington Episcopal Life Care Community Inc., Series 2017, 5.250%, 4/01/37 | 4/27 at 100.00 | 950,209 | |||||||||
| Prince George’s County, Maryland, Special Obligation Bonds, Westphalia Town Center Project, Series 2018: | ||||||||||||
| 1,300 | 5.125%, 7/01/39, 144A | 7/28 at 100.00 | 1,140,950 | |||||||||
| 2,200 | 5.250%, 7/01/48, 144A | 7/28 at 100.00 | 1,873,856 | |||||||||
| 1,996 | Prince George’s County, Maryland, Special Tax District Bonds, Victoria Falls Project, Series 2005, 5.250%, 7/01/35 | 12/23 at 100.00 | 1,996,637 | |||||||||
| 1,340 | Rockville Mayor and Council, Maryland, Economic Development Revenue Bonds, Ingleside King Farm Project, Refunding Series 2017, 5.000%, 11/01/35 | 11/24 at 103.00 | 1,169,246 | |||||||||
| 795 | Rockville Mayor and Council, Maryland, Economic Development Revenue Bonds, Ingleside King Farm Project, Refunding Series 2017A-2, 5.000%, 11/01/31 | 11/24 at 103.00 | 724,776 | |||||||||
| Rockville Mayor and Council, Maryland, Economic Development Revenue Bonds, Ingleside King Farm Project, Series 2017A-1: | ||||||||||||
| 1,070 | 5.000%, 11/01/28 | 11/24 at 103.00 | 1,012,026 | |||||||||
| 1,000 | 5.000%, 11/01/37 | 11/24 at 103.00 | 853,629 | |||||||||
| Rockville Mayor and Council, Maryland, Economic Development Revenue Bonds, Series 2017B: | ||||||||||||
| 500 | 5.000%, 11/01/42 | 11/24 at 103.00 | 405,260 | |||||||||
| 1,000 | 5.000%, 11/01/47 | 11/24 at 103.00 | 780,653 | |||||||||
| Washington County County Commissioners, Maryland, Revenue Bonds, Diakon Lutheran Social Ministries Project, Series 2019B: | ||||||||||||
| 1,000 | (c) | 5.000%, 1/01/29, (ETM) | No Opt. Call | 1,057,022 | ||||||||
| 500 | (c) | 5.000%, 1/01/32, (Pre-refunded 1/01/29) | 1/29 at 100.00 | 528,511 | ||||||||
| Total Maryland | 264,056,307 | |||||||||||
Massachusetts - 0.3% (0.2% of Total Investments) | ||||||||||||
| 540 | (d) | Massachusetts Development Finance Agency, Health Care Facility Revenue Bonds, Adventcare Project, Series 2007A, 6.750%, 10/15/37, 144A | 12/23 at 100.00 | 5,400 | ||||||||
| 677 | (d) | Massachusetts Development Finance Agency, Health Care Facility Revenue Bonds, Adventcare Project, Series 2010, 7.625%, 10/15/37 | 12/23 at 100.00 | 6,770 | ||||||||
| 270 | (c) | Massachusetts Development Finance Agency, Revenue Bonds, Atrius Health Issue, Series 2019A, 4.000%, 6/01/49, (Pre-refunded 6/01/29) | 6/29 at 100.00 | 274,258 | ||||||||
| 825 | Massachusetts Development Finance Agency, Revenue Bonds, Boston Medical Center Issue, Green Bonds, Series 2015D, 5.000%, 7/01/44 | 7/25 at 100.00 | 767,863 | |||||||||
| 3,200 | Massachusetts Development Finance Agency, Revenue Bonds, Emerson College, Series 2015, 4.500%, 1/01/45 | 1/25 at 100.00 | 2,701,342 | |||||||||
| 1,500 | Massachusetts Development Finance Agency, Revenue Bonds, UMass Memorial Health Care, Series 2016I, 4.000%, 7/01/41 | 7/26 at 100.00 | 1,189,553 | |||||||||
| Massachusetts Development Finance Agency, Revenue Bonds, Western New England University, Series 2015: | ||||||||||||
| 1,145 | 5.000%, 9/01/40 | 9/25 at 100.00 | 1,029,891 | |||||||||
Principal Amount (000) | Description (a) | Optional Call Provisions (b) | Value | |||||||||
Massachusetts | ||||||||||||
| $ | 1,280 | 5.000%, 9/01/45 | 9/25 at 100.00 | $ | 1,100,805 | |||||||
| 1,100 | Massachusetts Turnpike Authority, Metropolitan Highway System Revenue Bonds, Senior Series 1997A, 0.000%, 1/01/24 - NPFG Insured | No Opt. Call | 1,092,271 | |||||||||
| Total Massachusetts | 8,168,153 | |||||||||||
Michigan - 4.1% (2.4% of Total Investments) | ||||||||||||
| 625 | Bloomfield Hills Schools, Oakland County, Michigan, General Obligation Bonds, School Building & Site Series 2023, 5.000%, 5/01/48 | 5/33 at 100.00 | 628,757 | |||||||||
| 6,525 | Caledonia Community Schools, Kent, Allegan and Barry Counties, Michigan, General Obligation Bonds, School Building & Site Series 2020I, 4.000%, 5/01/50 | 5/30 at 100.00 | 5,376,725 | |||||||||
| Eastern Michigan University, General Revenue Bonds, Series 2018A: | ||||||||||||
| 960 | 4.000%, 3/01/44 - AGM Insured | 3/28 at 100.00 | 797,242 | |||||||||
| 40 | (c) | 4.000%, 3/01/44, (Pre-refunded 3/01/28) - AGM Insured | 3/28 at 100.00 | 40,488 | ||||||||
| 4,180 | Hudsonville Public Schools, Ottawa and Allegan Counties, Michigan, General Obligation Bonds, School Building & Site Refunding Series 2023, 5.000%, 5/01/53 | 5/33 at 100.00 | 4,023,246 | |||||||||
| 7,615 | Hudsonville Public Schools, Ottawa and Allegan Counties, Michigan, General Obligation Bonds, School Building & Site Series 2020-I, 4.000%, 5/01/49 | 5/30 at 100.00 | 6,269,343 | |||||||||
| 2,000 | Lansing Board of Water and Light, Michigan, Utility System Revenue Bonds, Series 2019A, 5.000%, 7/01/48 | 7/29 at 100.00 | 1,985,249 | |||||||||
| Michigan Finance Authority, Distributable State Aid Revenue Bonds, Charter County of Wayne, Second Lien Refunding Series 2020: | ||||||||||||
| 10,125 | 4.000%, 11/01/55 | 11/30 at 100.00 | 8,157,995 | |||||||||
| 10,000 | 4.000%, 11/01/55 | 11/30 at 100.00 | 7,919,337 | |||||||||
| 5,000 | Michigan Finance Authority, Hospital Revenue Bonds, McLaren Health Care, Series 2019A, 4.000%, 2/15/47 | 8/29 at 100.00 | 4,119,272 | |||||||||
| 2,690 | Michigan Finance Authority, Local Government Loan Program Revenue Bonds, Detroit Water & Sewerage Department Water Supply System Local Project, Insured Senior Lien Series 2014C-3, 5.000%, 7/01/32 - AGM Insured | 7/24 at 100.00 | 2,704,416 | |||||||||
| 405 | Michigan Finance Authority, Local Government Loan Program Revenue Bonds, Detroit Water & Sewerage Department Water Supply System Local Project, Refunding Senior Loan Series 2014D-1, 5.000%, 7/01/37 - AGM Insured | 7/24 at 100.00 | 406,037 | |||||||||
| 1,000 | Michigan Finance Authority, Local Government Loan Program Revenue Bonds, Detroit Water & Sewerage Department Water Supply System Local Project, Series 2014D-6, 5.000%, 7/01/36 - NPFG Insured | 7/24 at 100.00 | 1,001,976 | |||||||||
| 3,000 | Michigan Finance Authority, Michigan, Revenue Bonds, Trinity Health Credit Group, Fixed Rate Series 2022A-MI, 4.000%, 12/01/47 | 12/31 at 100.00 | 2,491,589 | |||||||||
| 4,500 | Michigan Finance Authority, Michigan, Revenue Bonds, Trinity Health Credit Group, Refunding Series 2019A-MI, 4.000%, 12/01/49 | 12/29 at 100.00 | 3,677,764 | |||||||||
| 4,435 | Michigan Finance Authority, Tobacco Settlement Asset- Backed Bonds, 2006 Sold Tobacco Receipts Senior Current Interest Series 2020A-2, 5.000%, 6/01/40 | 12/30 at 100.00 | 4,361,228 | |||||||||
| 5,000 | Michigan Hospital Finance Authority, Revenue Bonds, Ascension Health Senior Credit Group, Refunding & Project Series 2010F-6, 4.000%, 11/15/47 | 11/26 at 100.00 | 4,118,229 | |||||||||
| 10,000 | Michigan State Building Authority, Revenue Bonds, Facilities Program, Refunding Series 2015-I, 5.000%, 4/15/34 | 10/25 at 100.00 | 10,150,908 | |||||||||
| 1,000 | Michigan State University, General Revenue Bonds, Refunding Series 2019C, 4.000%, 2/15/44 | 8/29 at 100.00 | 846,997 | |||||||||
| NAD | Nuveen Quality Municipal Income Fund (continued) Portfolio of Investments October 31, 2023 |
Principal Amount (000) | Description (a) | Optional Call Provisions (b) | Value | |||||||||
Michigan | ||||||||||||
| $ | 8,000 | Michigan State, Trunk Line Fund Bonds, Rebuilding Michigan Program Series 2020B, 4.000%, 11/15/45 | 11/30 at 100.00 | $ | 6,918,466 | |||||||
| 6,000 | Michigan State, Trunk Line Fund Bonds, Rebuilding Michigan Program, Series 2023, 5.500%, 11/15/49 | 11/33 at 100.00 | 6,390,614 | |||||||||
| 7,500 | Monroe Public Schools, Monroe County, Michigan, General Obligation Bonds, School Building & Site Series 2020I, 5.000%, 5/01/50 | 5/30 at 100.00 | 7,384,227 | |||||||||
| 3,805 | Rockford Public Schools, Kent County, Michigan, General Obligation Bonds, School Building & Site Series 2023II, 5.000%, 5/01/46 | 5/33 at 100.00 | 3,778,890 | |||||||||
| 11,225 | Walled Lake Consolidated School District, Oakland County, Michigan, General Obligation Bonds, School Building & Site Series 2020, 5.000%, 5/01/50 | 5/30 at 100.00 | 11,282,506 | |||||||||
| 3,000 | (c) | Wayne County Airport Authority, Michigan, Revenue Bonds, Detroit Metropolitan Wayne County Airport, Series 2012A, 5.000%, 12/01/37, (Pre-refunded 12/01/23) | 12/23 at 100.00 | 3,002,426 | ||||||||
| 1,200 | Wayne County Airport Authority, Michigan, Revenue Bonds, Detroit Metropolitan Wayne County Airport, Series 2015D, 5.000%, 12/01/45 | 12/25 at 100.00 | 1,178,594 | |||||||||
| 1,120 | Wayne State University, Michigan, General Revenue Bonds, Series 2018A, 5.000%, 11/15/36 | 11/25 at 100.00 | 1,129,391 | |||||||||
| Total Michigan | 110,141,912 | |||||||||||
Minnesota - 3.2% (1.9% of Total Investments) | ||||||||||||
| 310 | Baytown Township, Minnesota Charter School Lease Revenue Bonds, Saint Croix Preparatory Academy, Refunding Series 2016A, 4.000%, 8/01/36 | 8/26 at 100.00 | 251,674 | |||||||||
| 3,000 | Brainerd Independent School District 181, Crow Wing County, Minnesota, General Obligation Bonds, School Building Series 2018A, 4.000%, 2/01/42 | 2/27 at 100.00 | 2,682,173 | |||||||||
| 750 | City of Ham Lake, Minnesota, Charter School Lease Revenue Bonds, DaVinci Academy Project, Series 2016A, 5.000%, 7/01/47 | 7/24 at 102.00 | 581,998 | |||||||||
| 500 | Deephaven, Minnesota, Charter School Lease Revenue Bonds, Eagle Ridge Academy Project, Series 2016A, 4.000%, 7/01/37 | 7/25 at 100.00 | 400,373 | |||||||||
| Duluth Economic Development Authority, Minnesota, Health Care Facilities Revenue Bonds, Essentia Health Obligated Group, Series 2018A: | ||||||||||||
| 6,905 | 5.000%, 2/15/48 | 2/28 at 100.00 | 6,287,846 | |||||||||
| 11,925 | 5.000%, 2/15/53 | 2/28 at 100.00 | 10,737,284 | |||||||||
| 1,925 | 5.250%, 2/15/53 | 2/28 at 100.00 | 1,854,395 | |||||||||
| 1,125 | GFW Independent School District No. 2365, Sibley, Renville, McLeod and Nicollet Counties, Minnesota, General Obligation School Building Bonds, Series 2023A, 4.125%, 2/01/52 | 2/31 at 100.00 | 968,881 | |||||||||
| 725 | Hawley Independent School District 150, Clay County, Minnesota, General Obligation Bonds, School Building Series 2023A, 4.000%, 2/01/43 | 2/30 at 100.00 | 634,209 | |||||||||
| 500 | Independence, Minnesota, Charter School Lease Revenue Bonds, Paladin Career & Technical High School Project, Series 2021A, 4.000%, 6/01/41 | 6/29 at 102.00 | 353,596 | |||||||||
| 2,010 | Independent School District 621, Mounds View, Minnesota, General Obligation Bonds, School Building Series 2018A, 4.000%, 2/01/42 | 2/27 at 100.00 | 1,781,394 | |||||||||
Minneapolis-St. Paul Metropolitan Airports Commission, Minnesota, Airport Revenue Bonds, Refunding Subordinate Lien Series 2019B: | ||||||||||||
| 1,000 | 5.000%, 1/01/31, (AMT) | 7/29 at 100.00 | 1,014,134 | |||||||||
| 1,300 | 5.000%, 1/01/38, (AMT) | 7/29 at 100.00 | 1,271,786 | |||||||||
| 3,420 | 5.000%, 1/01/44, (AMT) | 7/29 at 100.00 | 3,269,109 | |||||||||
| 4,000 | 5.000%, 1/01/49, (AMT) | 7/29 at 100.00 | 3,729,196 | |||||||||
Principal Amount (000) | Description (a) | Optional Call Provisions (b) | Value | |||||||||
Minnesota | ||||||||||||
| $ | 2,295 | Minneapolis-St. Paul Metropolitan Airports Commission, Minnesota, Airport Revenue Bonds, Senior Lien Series 2016C, 5.000%, 1/01/41 | 1/27 at 100.00 | $ | 2,295,039 | |||||||
Minneapolis-St. Paul Metropolitan Airports Commission, Minnesota, Airport Revenue Bonds, Subordinate Lien Series 2016D: | ||||||||||||
| 470 | 5.000%, 1/01/32, (AMT) | 1/27 at 100.00 | 471,083 | |||||||||
| 450 | 5.000%, 1/01/35, (AMT) | 1/27 at 100.00 | 446,536 | |||||||||
| 580 | 5.000%, 1/01/37, (AMT) | 1/27 at 100.00 | 568,784 | |||||||||
| 750 | 5.000%, 1/01/41, (AMT) | 1/27 at 100.00 | 728,323 | |||||||||
| 2,745 | Minneapolis-St. Paul Metropolitan Airports Commission, Minnesota, Airport Revenue Bonds, Subordinate Lien Series 2022B, 5.250%, 1/01/47, (AMT) | 1/32 at 100.00 | 2,699,175 | |||||||||
| Minnesota Higher Education Facilities Authority, Revenue Bonds, Carleton College, Refunding Series 2017: | ||||||||||||
| 1,300 | 3.750%, 3/01/38 | 3/27 at 100.00 | 1,132,681 | |||||||||
| 1,460 | 4.000%, 3/01/41 | 3/27 at 100.00 | 1,267,743 | |||||||||
| 2,150 | Minnesota Higher Education Facilities Authority, Revenue Bonds, Macalester College, Refunding Series 2017, 4.000%, 3/01/48 | 3/27 at 100.00 | 1,764,651 | |||||||||
| 270 | Minnesota Housing Finance Agency, Housing Infrastructure State Appropriation Bonds, Series 2021A, 3.000%, 8/01/36 | 8/31 at 100.00 | 213,879 | |||||||||
| 190 | Minnesota Housing Finance Agency, Housing Infrastructure State Appropriation Bonds, Series 2021B, 3.000%, 8/01/36 | 8/31 at 100.00 | 150,508 | |||||||||
| 2,910 | Minnesota Housing Finance Agency, Housing Infrastructure State Appropriation Bonds, Series 2022A, 5.000%, 8/01/41 | 8/32 at 100.00 | 2,956,940 | |||||||||
| 910 | Rochester, Minnesota, Health Care Facilities Revenue Bonds, Mayo Clinic, Series 2018A, 4.000%, 11/15/48 | 5/28 at 100.00 | 754,961 | |||||||||
| 5,000 | Rochester, Minnesota, Health Care Facilities Revenue Bonds, Mayo Clinic, Series 2022, 5.000%, 11/15/57 | 11/32 at 100.00 | 5,079,334 | |||||||||
| 2,380 | Round Lake-Brewster Independent School District 2907, Minnesota, General Obligation Bonds, School Building Series 2023A, 4.000%, 2/01/44 | 2/32 at 100.00 | 2,038,792 | |||||||||
| 2,000 | Saint Cloud, Minnesota, Health Care Revenue Bonds, CentraCare Health System, Series 2019, 5.000%, 5/01/48 | 5/29 at 100.00 | 1,944,075 | |||||||||
| 1,520 | Saint Paul Housing & Redevelopment Authority, Minnesota, Charter School Lease Revenue Bonds, Community of Peace Academy Project, Refunding Series 2015A, 5.000%, 12/01/50 | 12/24 at 100.00 | 1,252,111 | |||||||||
| Saint Paul Housing & Redevelopment Authority, Minnesota, Charter School Lease Revenue Bonds, Hmong College Prep Academy Project, Refunding Series 2020A: | ||||||||||||
| 2,625 | 5.000%, 9/01/40 | 9/30 at 100.00 | 2,293,549 | |||||||||
| 1,250 | 5.000%, 9/01/43 | 9/30 at 100.00 | 1,066,086 | |||||||||
| 780 | 5.000%, 9/01/55 | 9/30 at 100.00 | 618,419 | |||||||||
| Saint Paul Housing & Redevelopment Authority, Minnesota, Charter School Lease Revenue Bonds, Hmong College Prep Academy Project, Series 2016A: | ||||||||||||
| 2,205 | 5.500%, 9/01/36 | 9/26 at 100.00 | 2,141,639 | |||||||||
| 2,500 | 5.750%, 9/01/46 | 9/26 at 100.00 | 2,314,556 | |||||||||
| 2,500 | 6.000%, 9/01/51 | 9/26 at 100.00 | 2,345,939 | |||||||||
| 500 | Saint Paul Housing & Redevelopment Authority, Minnesota, Charter School Lease Revenue Bonds, Twin Cities German Immersion School, Series 2013A, 5.000%, 7/01/44 | 12/23 at 100.00 | 415,339 | |||||||||
| NAD | Nuveen Quality Municipal Income Fund (continued) Portfolio of Investments October 31, 2023 |
Principal Amount (000) | Description (a) | Optional Call Provisions (b) | Value | |||||||||
Minnesota | ||||||||||||
| Saint Paul Housing and Redevelopment Authority Minnesota, Senior Housing and Health Care Revenue Bonds, Episcopal Homes Project, Series 2013: | ||||||||||||
| $ | 1,855 | 5.000%, 5/01/33 | 12/23 at 100.00 | $ | 1,649,215 | |||||||
| 1,000 | 5.125%, 5/01/48 | 12/23 at 100.00 | 749,840 | |||||||||
| 2,245 | Saint Paul Housing and Redevelopment Authority, Minnesota, Health Care Revenue Bonds, Fairview Health Services, Series 2017A, 5.000%, 11/15/47 | 11/27 at 100.00 | 2,087,984 | |||||||||
| 1,000 | Saint Paul Housing and Redevelopment Authority, Minnesota, Lease Revenue Bonds, Hope Community Academy Project, Series 2015A, 5.000%, 12/01/43 | 12/24 at 100.00 | 804,357 | |||||||||
| 750 | (c) | St. Paul Housing and Redevelopment Authority, Minnesota, Hospital Revenue Bonds, HealthEast Inc., Series 2015A, 5.000%, 11/15/29, (Pre-refunded 11/15/25) | 11/25 at 100.00 | 759,318 | ||||||||
| 2,000 | Wayzata, Minnesota Senior Housing Revenue Bonds, Folkestone Senior Living Community, Refunding Series 2019, 5.000%, 8/01/54 | 8/24 at 102.00 | 1,725,603 | |||||||||
| 3,855 | West Saint Paul-Mendota Heights-Eagan Independent School District 197, Dakota County, Minnesota, General Obligation Bonds, School Buidling Series 2018A, 4.000%, 2/01/41 | 2/27 at 100.00 | 3,461,127 | |||||||||
| 2,000 | (c) | Western Minnesota Municipal Power Agency, Minnesota, Power Supply Revenue Bonds, Series 2014A, 5.000%, 1/01/46, (Pre-refunded 1/01/24) | 1/24 at 100.00 | 2,003,476 | ||||||||
| Total Minnesota | 86,019,110 | |||||||||||
Mississippi - 0.8% (0.5% of Total Investments) | ||||||||||||
| Mississippi Hospital Equipment and Facilities Authority, Revenue Bonds, Baptist Memorial Healthcare, Series 2016A: | ||||||||||||
| 1,500 | 5.000%, 9/01/36 | 9/26 at 100.00 | 1,465,731 | |||||||||
| 6,000 | 5.000%, 9/01/41 | 9/26 at 100.00 | 5,682,886 | |||||||||
| 15,500 | 5.000%, 9/01/46 | 9/26 at 100.00 | 14,010,461 | |||||||||
| Total Mississippi | 21,159,078 | |||||||||||
Missouri - 5.6% (3.3% of Total Investments) | ||||||||||||
| 1,000 | Boone County, Missouri, Hospital Revenue Bonds, Boone Hospital Center, Refunding Series 2016, 5.000%, 8/01/28 | 8/26 at 100.00 | 913,594 | |||||||||
| 2,010 | Bridgeton Industrial Development Authority, Missouri, Senior Housing Revenue Bonds, The Sarah Community Project, Refunding Series 2016, 3.625%, 5/01/30 | 5/25 at 100.00 | 1,890,979 | |||||||||
| 500 | Curators of the University of Missouri, System Facilities Revenue Bonds, Series 2014A, 4.000%, 11/01/33 | 11/24 at 100.00 | 467,389 | |||||||||
| 1,000 | Jefferson County School District R-1 Northwest, Missouri, General Obligation Bonds, Direct Deposit Program Series 2023, 4.000%, 3/01/42 | 3/31 at 100.00 | 867,155 | |||||||||
| 5,640 | Kansas City Industrial Development Authority, Missouri, Airport Special Obligation Bonds, Kansas City International Airport Terminal Modernization Project, Series 2019A, 5.000%, 3/01/44, (AMT) | 3/29 at 100.00 | 5,390,013 | |||||||||
| Kansas City Industrial Development Authority, Missouri, Airport Special Obligation Bonds, Kansas City International Airport Terminal Modernization Project, Series 2019B: | ||||||||||||
| 2,965 | 5.000%, 3/01/39, (AMT) | 3/29 at 100.00 | 2,876,008 | |||||||||
| 23,675 | 5.000%, 3/01/46, (AMT) | 3/29 at 100.00 | 22,302,736 | |||||||||
| 1,525 | 5.000%, 3/01/54, (AMT) | 3/29 at 100.00 | 1,402,184 | |||||||||
| 400 | Kansas City Industrial Development Authority, Missouri, Sales Tax Revenue Bonds, Ward Parkway Center Community Improvement District, Senior Refunding & Improvement Series 2016, 5.000%, 4/01/46, 144A | 4/26 at 100.00 | 320,863 | |||||||||
Principal Amount (000) | Description (a) | Optional Call Provisions (b) | Value | |||||||||
Missouri | ||||||||||||
| Kansas City Municipal Assistance Corporation, Missouri, Leasehold Revenue Bonds, Improvement Series 2004B-1: | ||||||||||||
| $ | 7,000 | 0.000%, 4/15/27 - AMBAC Insured | No Opt. Call | $ | 6,055,918 | |||||||
| 5,000 | 0.000%, 4/15/28 - AMBAC Insured | No Opt. Call | 4,143,048 | |||||||||
| 5,000 | 0.000%, 4/15/29 - AMBAC Insured | No Opt. Call | 3,956,131 | |||||||||
| 4,470 | Kansas City, Missouri, Sanitary Sewer System Revenue Bonds, Improvement Series 2018A, 4.000%, 1/01/42 | 1/28 at 100.00 | 3,863,265 | |||||||||
| 6,185 | Kansas City, Missouri, Sanitary Sewer System Revenue Bonds, Improvement Series 2023A, 4.000%, 1/01/48 | 1/33 at 100.00 | 5,207,437 | |||||||||
| 1,000 | Missouri Environmental Improvement and Energy Resources Authority, Revenue Bonds, Union Electric Company Project, Series 1998C, 2.750%, 9/01/33 | 6/27 at 102.00 | 787,743 | |||||||||
| 1,000 | Missouri Health and Education Facilities Authority, Health Facilities Revenue Bonds, Saint Luke’s Health System, Inc., Series 2016, 5.000%, 11/15/34 | 5/26 at 100.00 | 1,009,942 | |||||||||
| 11,010 | Missouri Health and Educational Facilities Authority, Health Facilities Revenue Bonds, BJC Health System, Series 2021A, 4.000%, 7/01/46 | 7/31 at 100.00 | 9,362,979 | |||||||||
| Missouri Health and Educational Facilities Authority, Health Facilities Revenue Bonds, CoxHealth, Series 2013A: | ||||||||||||
| 1,045 | 5.000%, 11/15/44 | 12/23 at 100.00 | 1,011,943 | |||||||||
| 11,090 | 5.000%, 11/15/48 | 12/23 at 100.00 | 10,412,376 | |||||||||
| Missouri Health and Educational Facilities Authority, Health Facilities Revenue Bonds, Mercy Health, Series 2017C: | ||||||||||||
| 3,000 | 5.000%, 11/15/42 | 11/27 at 100.00 | 2,933,568 | |||||||||
| 10,000 | 4.000%, 11/15/47 | 11/27 at 100.00 | 8,188,893 | |||||||||
| 6,265 | 5.000%, 11/15/47 | 11/27 at 100.00 | 6,045,923 | |||||||||
| 10,000 | Missouri Health and Educational Facilities Authority, Health Facilities Revenue Bonds, Mercy Health, Series 2020, 4.000%, 6/01/53 | 6/30 at 100.00 | 7,922,731 | |||||||||
| Missouri Health and Educational Facilities Authority, Health Facilities Revenue Bonds, Mosaic Health System, Series 2019A: | ||||||||||||
| 1,800 | 4.000%, 2/15/44 | 2/29 at 100.00 | 1,449,263 | |||||||||
| 7,815 | 4.000%, 2/15/49 | 2/29 at 100.00 | 6,209,419 | |||||||||
| Missouri Health and Educational Facilities Authority, Health Facilities Revenue Bonds, SSM Health Care, Series 2018A: | ||||||||||||
| 2,000 | 4.000%, 6/01/48 | 6/28 at 100.00 | 1,621,310 | |||||||||
| 3,500 | 5.000%, 6/01/48 | 6/28 at 100.00 | 3,209,889 | |||||||||
| Missouri Health and Educational Facilities Authority, Revenue Bonds, Children’s Mercy Hospital, Series 2017A: | ||||||||||||
| 1,250 | 4.000%, 5/15/42 | 5/25 at 102.00 | 1,061,224 | |||||||||
| 16,690 | 4.000%, 5/15/48 | 5/25 at 102.00 | 13,467,714 | |||||||||
| 7,925 | Missouri Health and Educational Facilities Authority, Revenue Bonds, Lutheran Senior Services Projects, Series 2016A, 5.000%, 2/01/46 | 2/26 at 100.00 | 6,861,906 | |||||||||
| 3,370 | Missouri Health and Educational Facilities Authority, Revenue Bonds, Lutheran Senior Services Projects, Series 2016B, 5.000%, 2/01/46 | 2/26 at 100.00 | 2,917,933 | |||||||||
| Missouri Health and Educational Facilities Authority, Revenue Bonds, Saint Louis University, Series 2017A: | ||||||||||||
| 725 | 4.000%, 10/01/36 | 4/27 at 100.00 | 654,552 | |||||||||
| 3,510 | 5.000%, 10/01/47 | 4/27 at 100.00 | 3,519,199 | |||||||||
| Missouri Joint Municipal Electric Utility Commission, Power Supply System Revenue Bonds, MoPEP Facilities, Series 2018: | ||||||||||||
| 1,330 | 5.000%, 12/01/37 | 6/27 at 100.00 | 1,336,918 | |||||||||
| NAD | Nuveen Quality Municipal Income Fund (continued) Portfolio of Investments October 31, 2023 |
Principal Amount (000) | Description (a) | Optional Call Provisions (b) | Value | |||||||||
Missouri | ||||||||||||
| $ | 1,140 | 5.000%, 12/01/38 | 6/27 at 100.00 | $ | 1,142,027 | |||||||
| 375 | Saint Louis County Industrial Development Authority, Missouri, Revenue Bonds, Friendship Village of Sunset Hills, Series 2013A, 5.875%, 9/01/43 | 12/23 at 100.00 | 357,058 | |||||||||
| 1,000 | Saint Louis County Industrial Development Authority, Missouri, Revenue Bonds, Friendship Village Saint Louis Obligated Group, Series 2018A, 5.125%, 9/01/48 | 9/25 at 103.00 | 806,493 | |||||||||
| Total Missouri | 151,947,723 | |||||||||||
Montana - 0.4% (0.2% of Total Investments) | ||||||||||||
| 2,090 | Montana Facility Finance Authority, Healthcare Facility Revenue Bonds, Kalispell Regional Medical Center, Series 2018B, 5.000%, 7/01/43 | 7/28 at 100.00 | 1,867,192 | |||||||||
| 3,315 | Montana Facility Finance Authority, Montana, Health Facilities Reveue Bonds, Bozeman Deaconess Health Services Obligated Group, Series 2018, 5.000%, 6/01/48 | 6/28 at 100.00 | 3,040,224 | |||||||||
| 6,830 | Montana State Board of Regents of Higher Education, General Revenue Bonds, Series 2022, 5.250%, 11/15/52 - AGM Insured | 11/32 at 100.00 | 6,947,863 | |||||||||
| Total Montana | 11,855,279 | |||||||||||
Nebraska - 0.2% (0.1% of Total Investments) | ||||||||||||
| Douglas County Hospital Authority 2, Nebraska, Health Facilities Revenue Bonds, Children’s Hospital Obligated Group, Refunding Series 2020A: | ||||||||||||
| 1,625 | 4.000%, 11/15/40 | 11/30 at 100.00 | 1,385,718 | |||||||||
| 1,000 | 4.000%, 11/15/50 | 11/30 at 100.00 | 783,693 | |||||||||
| Douglas County Hospital Authority 3, Nebraska, Health Facilities Revenue Bonds, Nebraska Methodist Health System, Refunding Series 2015: | ||||||||||||
| 1,635 | 4.125%, 11/01/36 | 11/25 at 100.00 | 1,498,322 | |||||||||
| 1,000 | 5.000%, 11/01/45 | 11/25 at 100.00 | 966,878 | |||||||||
| Total Nebraska | 4,634,611 | |||||||||||
Nevada - 1.0% (0.6% of Total Investments) | ||||||||||||
| 8,835 | Las Vegas Convention and Visitors Authority, Nevada, Convention Center Expansion Revenue Bonds, Series 2018B, 5.000%, 7/01/43 | 7/28 at 100.00 | 8,876,116 | |||||||||
| Las Vegas Valley Water District, Nevada, General Obligation Bonds, Refunding Series 2015: | ||||||||||||
| 9,000 | 5.000%, 6/01/32 | 12/24 at 100.00 | 9,095,317 | |||||||||
| 5,000 | 5.000%, 6/01/39 | 12/24 at 100.00 | 5,021,930 | |||||||||
| Nevada System of Higher Education, Community College Revenue Bonds, Series 2017: | ||||||||||||
| 2,400 | 4.000%, 7/01/41 | 7/27 at 100.00 | 2,078,698 | |||||||||
| 2,000 | 4.000%, 7/01/47 | 7/27 at 100.00 | 1,653,759 | |||||||||
| Total Nevada | 26,725,820 | |||||||||||
New Hampshire - 0.4% (0.2% of Total Investments) | ||||||||||||
| 3,500 | New Hampshire Health and Education Facilities Authority, Revenue Bonds, Catholic Medical Center, Series 2012, 4.000%, 7/01/32 | 12/23 at 100.00 | 3,169,656 | |||||||||
| 4,000 | New Hampshire Health and Education Facilities Authority, Revenue Bonds, Dartmouth-Hitchcock Obligated Group, Series 2018A, 5.000%, 8/01/35 | 2/28 at 100.00 | 4,050,584 | |||||||||
| 5,000 | New Hampshire Health and Education Facilities Authority, Revenue Bonds, Dartmouth-Hitchcock Obligated Group, Series 2020A, 5.000%, 8/01/59 - AGM Insured | No Opt. Call | 4,623,986 | |||||||||
| Total New Hampshire | 11,844,226 | |||||||||||
Principal Amount (000) | Description (a) | Optional Call Provisions (b) | Value | |||||||||
New Jersey - 5.4% (3.1% of Total Investments) | ||||||||||||
| $ 5,000 | New Jersey Economic Development Authority, New Jersey, Transit Transportation Project Revenue Bonds, Series 2020A, 5.000%, 11/01/40 | 11/29 at 100.00 | $ | 5,011,334 | ||||||||
| New Jersey Economic Development Authority, Private Activity Bonds, The Goethals Bridge Replacement Project, Series 2013: | ||||||||||||
| 1,965 | 5.000%, 1/01/31 - AGM Insured, (AMT) | 1/24 at 100.00 | 1,966,758 | |||||||||
| 1,865 | 5.125%, 1/01/39 - AGM Insured, (AMT) | 1/24 at 100.00 | 1,865,363 | |||||||||
| 1,585 | 5.125%, 7/01/42 - AGM Insured, (AMT) | 1/24 at 100.00 | 1,584,857 | |||||||||
| 6,030 | New Jersey Economic Development Authority, Revenue Bonds, New Jersey Transit Corporation Projects Sublease, Refunding Series 2017B, 5.000%, 11/01/25 | No Opt. Call | 6,137,130 | |||||||||
| 2,000 | (c) | New Jersey Economic Development Authority, School Facilities Construction Bonds, Refunding Series 2016BBB, 5.500%, 6/15/31, (Pre- refunded 12/15/26) | 12/26 at 100.00 | 2,101,069 | ||||||||
| 6,770 | New Jersey Economic Development Authority, School Facilities Construction Bonds, Series 2005N-1, 5.500%, 9/01/27 - NPFG Insured | No Opt. Call | 7,140,835 | |||||||||
| 2,825 | (c) | New Jersey Economic Development Authority, School Facilities Construction Bonds, Series 2014UU, 5.000%, 6/15/30, (Pre-refunded 6/15/24) | 6/24 at 100.00 | 2,843,733 | ||||||||
| | 2,410 | | New Jersey Economic Development Authority, School Facilities Construction Bonds, Social Series 2021QQQ, 4.000%, 6/15/50 | 12/30 at 100.00 | 1,982,571 | |||||||
| 5,275 | New Jersey Health Care Facilities Financing Authority, Revenue Bonds, RWJ Barnabas Health Obligated Group, Series 2021A, 4.000%, 7/01/51 | 7/31 at 100.00 | 4,417,054 | |||||||||
| New Jersey Transportation Trust Fund Authority, Federal Highway Reimbursement Revenue Notes, Series 2016A-1: | ||||||||||||
| 2,020 | 5.000%, 6/15/28 | 6/26 at 100.00 | 2,054,672 | |||||||||
| 3,340 | 5.000%, 6/15/29 | 6/26 at 100.00 | 3,399,018 | |||||||||
| 8,155 | New Jersey Transportation Trust Fund Authority, Transportation Program Bonds, Series 2023AA, 4.250%, 6/15/44 | 6/33 at 100.00 | 7,270,567 | |||||||||
| 1,000 | New Jersey Transportation Trust Fund Authority, Transportation System Bonds, Capital Appreciation Series 2010A, 0.000%, 12/15/26 | No Opt. Call | 875,624 | |||||||||
| New Jersey Transportation Trust Fund Authority, Transportation System Bonds, Refunding Series 2006C: | ||||||||||||
| 21,120 | 0.000%, 12/15/28 - AMBAC Insured | No Opt. Call | 16,916,746 | |||||||||
| 10,000 | 0.000%, 12/15/32 - AGM Insured | No Opt. Call | 6,645,748 | |||||||||
| 20,000 | 0.000%, 12/15/33 - AGM Insured | No Opt. Call | 12,652,540 | |||||||||
| 25,000 | 0.000%, 12/15/35 - AMBAC Insured | No Opt. Call | 13,885,008 | |||||||||
| 30,000 | 0.000%, 12/15/36 - AMBAC Insured | No Opt. Call | 15,578,190 | |||||||||
| 2,000 | New Jersey Transportation Trust Fund Authority, Transportation System Bonds, Series 2009A, 0.000%, 12/15/32 | No Opt. Call | 1,305,666 | |||||||||
| New Jersey Transportation Trust Fund Authority, Transportation System Bonds, Series 2015AA: | ||||||||||||
| 1,690 | 5.250%, 6/15/33 | 6/25 at 100.00 | 1,705,540 | |||||||||
| 2,840 | 5.000%, 6/15/45 | 6/25 at 100.00 | 2,735,349 | |||||||||
| 2,800 | New Jersey Transportation Trust Fund Authority, Transportation System Bonds, Series 2018A, 5.000%, 12/15/36 | 12/28 at 100.00 | 2,839,255 | |||||||||
| 665 | New Jersey Transportation Trust Fund Authority, Transportation System Bonds, Series 2019A, 4.000%, 12/15/39 | 12/29 at 100.00 | 595,104 | |||||||||
| 2,460 | New Jersey Turnpike Authority, Revenue Bonds, Series 2017B, 4.000%, 1/01/34 | 1/28 at 100.00 | 2,411,227 | |||||||||
| 5,250 | (g) | New Jersey Turnpike Authority, Turnpike Revenue Bonds, Series 2022B, 5.250%, 1/01/52, (UB) | 1/33 at 100.00 | 5,356,811 | ||||||||
| NAD | Nuveen Quality Municipal Income Fund (continued) Portfolio of Investments October 31, 2023 |
Principal Amount (000) | Description (a) | Optional Call Provisions (b) | Value | |||||||||
New Jersey | ||||||||||||
| $ 7,810 | South Jersey Transportation Authority, New Jersey, Transportation System Revenue Bonds, Series 2020A, 5.000%, 11/01/45 | 11/30 at 100.00 | $ | 7,414,811 | ||||||||
| Tobacco Settlement Financing Corporation, New Jersey, Tobacco Settlement Asset-Backed Bonds, Series 2018A: | ||||||||||||
| 3,215 | 5.000%, 6/01/36 | 6/28 at 100.00 | 3,274,366 | |||||||||
| 1,405 | 5.000%, 6/01/46 | 6/28 at 100.00 | 1,318,175 | |||||||||
| 1,285 | Tobacco Settlement Financing Corporation, New Jersey, Tobacco Settlement Asset-Backed Bonds, Series 2018B, 5.000%, 6/01/46 | 6/28 at 100.00 | 1,193,031 | |||||||||
| Total New Jersey | 144,478,152 | |||||||||||
New Mexico - 0.5% (0.3% of Total Investments) | ||||||||||||
| 3,370 | New Mexico Hospital Equipment Loan Council, Hospital Revenue Bonds, Presbyterian Healthcare Services, Series 2017A, 5.000%, 8/01/46 | 11/27 at 100.00 | 3,283,701 | |||||||||
| New Mexico Hospital Equipment Loan Council, Hospital Revenue Bonds, Presbyterian Healthcare Services, Series 2019A: | ||||||||||||
| 1,575 | 5.000%, 8/01/44 | 8/29 at 100.00 | 1,538,480 | |||||||||
| 7,000 | 4.000%, 8/01/48 | 8/29 at 100.00 | 5,599,757 | |||||||||
| 2,845 | Santa Fe County, New Mexico, Correctional System Gross Receipts Tax Revenue Bonds, Series 1997, 6.000%, 2/01/27 - AGM Insured | No Opt. Call | 2,938,047 | |||||||||
| Total New Mexico | 13,359,985 | |||||||||||
New York - 10.1% (5.9% of Total Investments) | ||||||||||||
| 6,600 | Brooklyn Arena Local Development Corporation, New York, Payment in Lieu of Taxes Revenue Bonds, Barclays Center Project, Series 2009, 0.000%, 7/15/44 | No Opt. Call | 1,972,406 | |||||||||
| 490 | Buffalo and Erie County Industrial Land Development Corporation, New York, Revenue Bonds, Catholic Health System, Inc. Project, Series 2015, 5.250%, 7/01/35 | 7/25 at 100.00 | 405,896 | |||||||||
| Dormitory Authority of the State of New York, Revenue Bonds, North Shore Long Island Jewish Obligated Group, Series 2015A: | ||||||||||||
| 1,680 | 4.125%, 5/01/42 | 5/25 at 100.00 | 1,414,760 | |||||||||
| 3,195 | 5.000%, 5/01/43 | 5/25 at 100.00 | 3,141,345 | |||||||||
| 600 | Dormitory Authority of the State of New York, Revenue Bonds, Orange Regional Medical Center Obligated Group, Series 2017, 5.000%, 12/01/34, 144A | 6/27 at 100.00 | 543,630 | |||||||||
| 3,000 | Dormitory Authority of the State of New York, State Personal Income Tax Revenue Bonds, General Purpose Series 2022A, 5.000%, 3/15/46 | 3/32 at 100.00 | 3,024,038 | |||||||||
| 4,000 | Dormitory Authority of the State of New York, State Personal Income Tax Revenue Bonds, General Purpose, Series 2019A. Bidding Group 1,2,3,4, 5.000%, 3/15/44 | 3/29 at 100.00 | 3,994,690 | |||||||||
| 20,000 | Dormitory Authority of the State of New York, State Personal Income Tax Revenue Bonds, General Purpose, Series 2019D, 4.000%, 2/15/47 | 2/30 at 100.00 | 17,200,838 | |||||||||
| 5,000 | Liberty Development Corporation, New York, Goldman Sachs Headquarter Revenue Bonds, Series 2005, 5.250%, 10/01/35 | No Opt. Call | 5,245,719 | |||||||||
| Long Island Power Authority, New York, Electric System General Revenue Bonds, Series 2014A: | ||||||||||||
| 1,155 | 4.000%, 9/01/39 - AGM Insured | 9/24 at 100.00 | 1,043,356 | |||||||||
| 3,000 | 5.000%, 9/01/39 | 9/24 at 100.00 | 2,997,814 | |||||||||
| 860 | 5.000%, 9/01/44 | 9/24 at 100.00 | 850,747 | |||||||||
| 5,000 | Long Island Power Authority, New York, Electric System General Revenue Bonds, Series 2018, 5.000%, 9/01/37 | 9/28 at 100.00 | 5,129,541 | |||||||||
| 10,000 | Metropolitan Transportation Authority, New York, Dedicated Tax Fund Bonds, Refunding Series 2012A, 0.000%, 11/15/32 | No Opt. Call | 6,618,299 | |||||||||
Principal Amount (000) | Description (a) | Optional Call Provisions (b) | Value | |||||||||
New York | ||||||||||||
| $ 5,000 | Metropolitan Transportation Authority, New York, Transportation Revenue Bonds, Series 2013A, 5.000%, 11/15/38 | 1/24 at 100.00 | $ | 5,008,358 | ||||||||
| New York City Industrial Development Agency, New York, Civic Facility Revenue Bonds, Bronx Parking Development Company, LLC Project, Series 2007: | ||||||||||||
| 500 | (d) | 5.750%, 10/01/37 | 12/23 at 100.00 | 400,000 | ||||||||
| 1,000 | (d) | 2.350%, 10/01/46 | 12/23 at 100.00 | 800,000 | ||||||||
| 5,000 | New York City Municipal Water Finance Authority, New York, Water and Sewer System Second General Resolution Revenue Bonds, Fiscal 2020 Series EE, 4.000%, 6/15/42 | 6/30 at 100.00 | 4,386,649 | |||||||||
| 2,000 | New York City Transitional Finance Authority, New York, Future Tax Secured Bonds, Subordinate Fiscal 2017 Series A-1, 5.000%, 5/01/40 | 5/26 at 100.00 | 1,999,907 | |||||||||
| 3,760 | New York City Transitional Finance Authority, New York, Future Tax Secured Bonds, Subordinate Fiscal 2017 Series E-1, 5.000%, 2/01/43 | 2/27 at 100.00 | 3,731,213 | |||||||||
| 5,000 | New York City Transitional Finance Authority, New York, Future Tax Secured Bonds, Subordinate Fiscal 2019 Series A-1, 5.000%, 8/01/40 | 8/28 at 100.00 | 5,043,096 | |||||||||
| 20,000 | New York City Transitional Finance Authority, New York, Future Tax Secured Bonds, Subordinate Fiscal 2019 Subseries C-1, 4.000%, 11/01/42 | 5/29 at 100.00 | 17,671,940 | |||||||||
| 9,530 | New York City Transitional Finance Authority, New York, Future Tax Secured Bonds, Subordinate Fiscal 2022 Subseries B-1, 4.000%, 8/01/45 | 8/31 at 100.00 | 8,221,298 | |||||||||
| 5,000 | New York City Transitional Finance Authority, New York, Future Tax Secured Bonds, Subordinate Fiscal 2022 Subseries F-1, 5.000%, 2/01/47 | 2/32 at 100.00 | 5,017,625 | |||||||||
| 2,060 | New York City, New York, General Obligation Bonds, Fiscal 2017 Series B-1, 5.000%, 12/01/41 | 12/26 at 100.00 | 2,070,385 | |||||||||
| 11,000 | New York City, New York, General Obligation Bonds, Fiscal 2020 Series A-1, 4.000%, 8/01/42 | 8/29 at 100.00 | 9,634,685 | |||||||||
| 2,000 | New York City, New York, General Obligation Bonds, Fiscal 2021 Series F-1, 5.000%, 3/01/43 | 3/31 at 100.00 | 2,022,854 | |||||||||
| 3,000 | New York City, New York, General Obligation Bonds, Fiscal 2022 Series A-1, 5.000%, 8/01/47 | 8/31 at 100.00 | 2,993,029 | |||||||||
| 5 | New York City, New York, General Obligation Bonds, Fiscal Series 2005M, 5.000%, 4/01/24 | 12/23 at 100.00 | 5,004 | |||||||||
| 2,000 | New York Convention Center Development Corporation, New York, Revenue Bonds, Hotel Unit Fee Secured, Refunding Series 2015, 5.000%, 11/15/45 | 11/25 at 100.00 | 1,923,585 | |||||||||
| 125 | New York Counties Tobacco Trust I, Tobacco Settlement Pass-Through Bonds, Series 2000B, 6.500%, 6/01/35 | 12/23 at 100.00 | 125,009 | |||||||||
| 1,010 | New York Counties Tobacco Trust VI, New York, Tobacco Settlement Pass- Through Bonds, Series Series 2016A-1, 5.625%, 6/01/35 | No Opt. Call | 1,022,561 | |||||||||
| 25,170 | New York Liberty Development Corporation, New York, Liberty Revenue Bonds, 3 World Trade Center Project, Class 1 Series 2014, 5.000%, 11/15/44, 144A | 11/24 at 100.00 | 22,543,518 | |||||||||
| New York State Urban Development Corporation, State Personal Income Tax Revenue Bonds, General Purpose, Series 2020C: | ||||||||||||
| 13,370 | 5.000%, 3/15/47 | 9/30 at 100.00 | 13,379,757 | |||||||||
| 4,120 | 5.000%, 3/15/50 | 9/30 at 100.00 | 4,099,220 | |||||||||
| 2,000 | New York State Urban Development Corporation, State Personal Income Tax Revenue Bonds, General Purpose, Series 2022A, 5.000%, 3/15/46 | 9/32 at 100.00 | 2,005,370 | |||||||||
| 19,000 | New York State Urban Development Corporation, State Sales Tax Revenue Bonds, Empire Series 2021A, 4.000%, 3/15/47 | 9/31 at 100.00 | 16,332,132 | |||||||||
| NAD | Nuveen Quality Municipal Income Fund (continued) Portfolio of Investments October 31, 2023 |
Principal Amount (000) | Description (a) | Optional Call Provisions (b) | Value | |||||||||
New York | ||||||||||||
| New York Transportation Development Corporation, New York, Special Facilities Bonds, LaGuardia Airport Terminal B Redevelopment Project, Series 2016A: | ||||||||||||
| $ 2,000 | 4.000%, 7/01/35 - AGM Insured, (AMT) | 7/24 at 100.00 | $ | 1,860,951 | ||||||||
| 14,390 | 5.000%, 7/01/46, (AMT) | 7/24 at 100.00 | 13,251,050 | |||||||||
| 28,800 | 5.250%, 1/01/50, (AMT) | 7/24 at 100.00 | 27,142,102 | |||||||||
| New York Transportation Development Corporation, New York, Special Facility Revenue Bonds, American Airlines, Inc. John F Kennedy International Airport Project, Refunding Series 2016: | ||||||||||||
| 110 | 5.000%, 8/01/26, (AMT) | 11/23 at 100.00 | 109,102 | |||||||||
| 5,940 | 5.000%, 8/01/31, (AMT) | 11/23 at 100.00 | 5,750,544 | |||||||||
| 3,465 | New York Transportation Development Corporation, New York, Special Facility Revenue Bonds, American Airlines, Inc. John F Kennedy International Airport Project, Series 2020, 5.250%, 8/01/31, (AMT) | 8/30 at 100.00 | 3,461,684 | |||||||||
| 3,000 | New York Transportation Development Corporation, New York, Special Facility Revenue Bonds, Terminal 4 John F Kennedy International Airport Project, Series 2022, 5.000%, 12/01/39, (AMT) | 12/32 at 100.00 | 2,904,075 | |||||||||
| 3,050 | New York Transportation Development Corporation, Special Facility Revenue Bonds, Delta Air Lines, Inc. - LaGuardia Airport Terminals C&D Redevelopment Project, Series 2018, 5.000%, 1/01/33, (AMT) | 1/28 at 100.00 | 2,954,644 | |||||||||
| 1,100 | New York Transportation Development Corporation, Special Facility Revenue Bonds, Delta Air Lines, Inc. - LaGuardia Airport Terminals C&D Redevelopment Project, Series 2023, 6.000%, 4/01/35, (AMT) | 4/31 at 100.00 | 1,139,804 | |||||||||
| 1,310 | Port Authority of New York and New Jersey, Consolidated Revenue Bonds, One Hundred Seventy Eighth Series 2013, 5.000%, 12/01/43, (AMT) | 12/23 at 100.00 | 1,311,388 | |||||||||
| 4,320 | (c) | Port Authority of New York and New Jersey, Consolidated Revenue Bonds, One Hundred Seventy Ninth Series 2013, 5.000%, 12/01/38, (Pre-refunded 12/14/23) | 12/23 at 100.00 | 4,325,088 | ||||||||
| 10,000 | Port Authority of New York and New Jersey, Consolidated Revenue Bonds, Taxable Two Hundred Forty First Series 2023, 5.000%, 7/15/53 | 7/33 at 100.00 | 9,905,396 | |||||||||
| 5,000 | Port Authority of New York and New Jersey, Consolidated Revenue Bonds, Two Hundred Seventeen Series 2019, 5.000%, 11/01/44 | 11/29 at 100.00 | 5,030,864 | |||||||||
| 2,000 | Port Authority of New York and New Jersey, Consolidated Revenue Bonds, Two Hundred Twenty-One Series 2020, 4.000%, 7/15/50, (AMT) | 7/30 at 100.00 | 1,580,215 | |||||||||
| Syracuse Industrial Development Authority, New York, PILOT Revenue Bonds, Carousel Center Project, Refunding Series 2016A: | ||||||||||||
| 2,835 | 5.000%, 1/01/29, (AMT) | 1/26 at 100.00 | 2,053,636 | |||||||||
| 2,700 | 5.000%, 1/01/34, (AMT) | 1/26 at 100.00 | 1,939,257 | |||||||||
| TSASC Inc., New York, Tobacco Asset-Backed Bonds, Series 2006: | ||||||||||||
| 1,250 | 5.000%, 6/01/45 | 6/27 at 100.00 | 1,071,455 | |||||||||
| 2,850 | 5.000%, 6/01/48 | 6/27 at 100.00 | 2,395,986 | |||||||||
| Total New York | 272,207,515 | |||||||||||
North Carolina - 1.5% (0.9% of Total Investments) | ||||||||||||
| 2,500 | Greater Asheville Regional Airport Authority, North Carolina, Airport System Revenue Bonds, Series 2022A, 5.500%, 7/01/47 - AGM Insured, (AMT) | 7/32 at 100.00 | 2,531,358 | |||||||||
| 5,730 | North Carolina Department of Transportation, Private Activity Revenue Bonds, I-77 Hot Lanes Project, Series 2015, 5.000%, 6/30/54, (AMT) | 6/25 at 100.00 | 5,158,020 | |||||||||
| 11,145 | North Carolina Medial Care Commission, Health Care Facilities Revenue Bonds, Rex Healthcare, Series 2020A, 4.000%, 7/01/49 | 1/30 at 100.00 | 8,846,096 | |||||||||
Principal Amount (000) | Description (a) | Optional Call Provisions (b) | Value | |||||||||
North Carolina | ||||||||||||
| $ 1,570 | North Carolina Medical Care Commission, Retirement Facilities First Mortgage Revenue Bonds, Southminster Project, Refunding Series 2016, 5.000%, 10/01/31 | 10/24 at 102.00 | $ | 1,493,009 | ||||||||
| 1,655 | North Carolina Medical Care Commission, Health Care Facilities Revenue Bonds, Deerfield Episcopal Retirement Community, Refunding First Mortgage Series 2016, 5.000%, 11/01/37 | 11/26 at 100.00 | 1,612,647 | |||||||||
| 9,245 | North Carolina Medical Care Commission, Health Care Facilities Revenue Bonds, Novant Health Obligated Group, Series 2019A, 4.000%, 11/01/49 | 11/29 at 100.00 | 7,860,949 | |||||||||
| 500 | North Carolina Municipal Power Agency 1, Catawba Electric Revenue Bonds, Refunding Series 2015A, 5.000%, 1/01/32 | 1/26 at 100.00 | 505,912 | |||||||||
| 11,480 | North Carolina Turnpike Authority, Triangle Expressway System Revenue Bonds, Senior Lien Series 2019, 5.000%, 1/01/49 | 1/30 at 100.00 | 10,989,100 | |||||||||
| 1,100 | Union County, North Carolina, Enterprise System Revenue Bonds, Series 2019A, 4.000%, 6/01/44 | 6/29 at 100.00 | 956,524 | |||||||||
| Total North Carolina | 39,953,615 | |||||||||||
North Dakota - 0.2% (0.1% of Total Investments) | ||||||||||||
| 5,000 | Grand Forks, North Dakota, Health Care System Revenue Bonds, Altru Health System Obligated Group, Series 2017A, 4.000%, 12/01/47 | 12/27 at 100.00 | 3,751,986 | |||||||||
| 520 | Grand Forks, North Dakota, Health Care System Revenue Bonds, Altru Health System Obligated Group, Series 2023A, 5.000%, 12/01/53 - AGM Insured | 12/33 at 100.00 | 495,039 | |||||||||
| 700 | Grand Forks, North Dakota, Senior Housing & Nursing Facilities Revenue Bonds, Valley Homes and Services Obligated Group, Series 2017, 5.000%, 12/01/36 | 12/26 at 100.00 | 592,472 | |||||||||
| 2,000 | University of North Dakota, Certificates of Participation, Housing Infrastructure Project, Series 2021A, 4.000%, 6/01/46 - AGM Insured | 6/30 at 100.00 | 1,633,788 | |||||||||
| Total North Dakota | 6,473,285 | |||||||||||
Ohio - 4.2% (2.5% of Total Investments) | ||||||||||||
| 6,250 | Akron, Bath and Copley Joint Township Hospital District, Ohio, Hospital Facilities Revenue Bonds, Summa Health System, Refunding & Improvement Series 2016, 5.250%, 11/15/46 | 11/26 at 100.00 | 5,748,023 | |||||||||
| 6,000 | Allen County, Ohio, Hospital Facilities Revenue Bonds, Mercy Health, Series 2017A, 4.000%, 8/01/36 | 2/28 at 100.00 | 5,546,512 | |||||||||
| 1,340 | Bowling Green State University, Ohio, General Receipts Bonds, Series 2017B, 5.000%, 6/01/45 | 6/27 at 100.00 | 1,341,824 | |||||||||
| 24,740 | Buckeye Tobacco Settlement Financing Authority, Ohio, Tobacco Settlement Asset-Backed Revenue Bonds, Refunding Senior Lien Capital Appreciation Series 2020B-3 Class 2, 0.000%, 6/01/57 | 6/30 at 22.36 | 2,087,472 | |||||||||
| 790 | Buckeye Tobacco Settlement Financing Authority, Ohio, Tobacco Settlement Asset-Backed Revenue Bonds, Refunding Senior Lien Series 2020A-2 Class 1, 4.000%, 6/01/48 | 6/30 at 100.00 | 632,278 | |||||||||
| 38,565 | Buckeye Tobacco Settlement Financing Authority, Ohio, Tobacco Settlement Asset-Backed Revenue Bonds, Refunding Senior Lien Series 2020B-2 Class 2, 5.000%, 6/01/55 | 6/30 at 100.00 | 31,592,244 | |||||||||
| Butler County, Ohio, Hospital Facilities Revenue Bonds, UC Health, Refunding Series 2017: | ||||||||||||
| 3,960 | 4.000%, 11/15/34 | 11/27 at 100.00 | 3,479,513 | |||||||||
| 3,000 | 4.000%, 11/15/35 | 11/27 at 100.00 | 2,590,964 | |||||||||
| 2,000 | Columbus-Franklin County Finance Authority, Ohio, Tax Increment Financing Revenue Bonds, Bridge Park D Block Project, Series 2019A-1, 5.000%, 12/01/51 | 6/29 at 100.00 | 1,717,893 | |||||||||
| NAD | Nuveen Quality Municipal Income Fund (continued) Portfolio of Investments October 31, 2023 |
Principal Amount (000) | Description (a) | Optional Call Provisions (b) | Value | |||||||||
Ohio | ||||||||||||
| $ 4,795 | Fairfield County, Ohio, Hospital Facilities Revenue Bonds, Fairfield Medical Center Project, Series 2013, 5.000%, 6/15/43 | 12/23 at 100.00 | $ | 3,766,076 | ||||||||
| 5,000 | Hamilton County, Ohio, Hospital Facilities Revenue Bonds, TriHealth, Inc. Obligated Group Project, Series 2017A, 5.000%, 8/15/42 | 8/27 at 100.00 | 4,852,067 | |||||||||
| 8,360 | (c) | Lake County, Ohio, Hospital Facilities Revenue Bonds, Lake Hospital System, Inc., Refunding Series 2015, 5.000%, 8/15/45, (Pre-refunded 8/15/25) | 8/25 at 100.00 | 8,464,795 | ||||||||
| 2,000 | Muskingum County, Ohio, Hospital Facilities Revenue Bonds, Genesis HealthCare System Obligated Group Project, Series 2013, 5.000%, 2/15/33 | 12/23 at 100.00 | 1,842,514 | |||||||||
| 3,000 | Ohio Air Quality Development Authority, Ohio, Pollution Control Revenue Bonds, FirstEnergy Generation Corporation Project, Refunding Series 2009D, 3.375%, 8/01/29, (Mandatory Put 9/15/21) | No Opt. Call | 2,642,945 | |||||||||
| 4,350 | Ohio Higher Educational Facility Commission, Revenue Bonds, University of Dayton, Series 2015A, 5.000%, 12/01/44 | 6/25 at 100.00 | 4,292,322 | |||||||||
| 3,710 | Ohio State, Turnpike Revenue Bonds, Ohio Turnpike and Infrastructutre Commission Infrastructure Projects, Junior Lien, Capital Appreciation Series 2013A-3, 5.800%, 2/15/36 | 2/31 at 100.00 | 4,115,976 | |||||||||
| Ohio State, Turnpike Revenue Bonds, Ohio Turnpike and Infrastructutre Commission, Infrastructure Projects, Junior Lien Series 2018A: | ||||||||||||
| 3,375 | 4.000%, 2/15/38 | 2/28 at 100.00 | 3,044,524 | |||||||||
| 16,325 | 5.000%, 2/15/43 | 2/28 at 100.00 | 16,513,049 | |||||||||
| 5,450 | Ohio Water Development Authority, Pollution Control Revenue Refunding Bonds, FirstEnergy Nuclear Generating Corporation Project, Series 2009A, 4.750%, 6/01/33, (Mandatory Put 6/01/22) | No Opt. Call | 4,985,391 | |||||||||
| 4,250 | Pickerington Local School District, Fairfield and Franklin Counties, Ohio, General Obligation Bonds, School Facilities Construction & Improvement, Series 2023, 5.250%, 12/01/59 | 12/32 at 100.00 | 4,332,382 | |||||||||
| 725 | Warren County, Ohio, Healthcare Facilities Revenue Bonds, Otterbein Homes Obligated Group, Refunding Series 2019A, 4.000%, 7/01/45 | 7/29 at 100.00 | 573,814 | |||||||||
| Total Ohio | 114,162,578 | |||||||||||
Oklahoma - 0.3% (0.2% of Total Investments) | ||||||||||||
| 1,800 | Oklahoma Development Finance Authority, Health System Revenue Bonds, OU Medicine Project, Taxable Series 2022, 5.500%, 8/15/41 | 8/32 at 100.00 | 1,582,852 | |||||||||
| 4,985 | (c) | Tulsa Airports Improvement Trust, Oklahoma, General Airport Revenue Bonds, Series 2015A, 5.000%, 6/01/45, (Pre-refunded 6/01/24) - BAM Insured, (AMT) | 6/24 at 100.00 | 5,003,230 | ||||||||
| 1,000 | Tulsa County Industrial Authority, Oklahoma, Senior Living Community Revenue Bonds, Montereau, Inc Project, Refunding Series 2017, 5.250%, 11/15/37 | 11/25 at 102.00 | 943,067 | |||||||||
| Total Oklahoma | 7,529,149 | |||||||||||
Oregon - 2.5% (1.4% of Total Investments) | ||||||||||||
| 2,435 | Beaverton School District 48J, Washington and Multnomah Counties, Oregon, General Obligation Bonds, Convertible Deferred Interest Series 2017D, 5.000%, 6/15/36 | 6/27 at 100.00 | 2,500,697 | |||||||||
| 725 | Clackamas County Hospital Facility Authority, Oregon, Revenue Bonds, Rose Villa Inc., Series 2020A, 5.250%, 11/15/50 | 11/25 at 102.00 | 603,101 | |||||||||
| 4,875 | Deschutes County Hospital Facility Authority, Oregon, Hospital Revenue Bonds, Saint Charles Health System, Inc., Series 2016A, 5.000%, 1/01/48 | 1/26 at 100.00 | 4,600,436 | |||||||||
| 3,180 | Oregon Facilities Authority, Revenue Bonds, Legacy Health Project, Series 2016A, 5.000%, 6/01/46 | 6/26 at 100.00 | 3,032,327 | |||||||||
Principal Amount (000) | Description (a) | Optional Call Provisions (b) | Value | |||||||||
Oregon | ||||||||||||
| $ 2,410 | Oregon Facilities Authority, Revenue Bonds, Legacy Health Project, Series 2022A, 5.000%, 6/01/52 | 6/32 at 100.00 | $ | 2,214,839 | ||||||||
| 1,500 | Oregon Health and Science University, Revenue Bonds, Refunding Series 2016B, 5.000%, 7/01/39 | 7/26 at 100.00 | 1,513,803 | |||||||||
| 4,250 | Port of Portland, Oregon, International Airport Revenue Bonds, Green Series 2023-29, 5.500%, 7/01/53, (AMT) | 7/33 at 100.00 | 4,300,025 | |||||||||
| 7,645 | Port of Portland, Oregon, International Airport Revenue Bonds, Series 2017-24B, 5.000%, 7/01/47, (AMT) | 1/27 at 100.00 | 7,261,831 | |||||||||
| 15,440 | Salem Hospital Facility Authority, Oregon, Revenue Bonds, Salem Health Projects, Refunding Series 2016A, 5.000%, 5/15/46 | 5/26 at 100.00 | 14,707,658 | |||||||||
| 30,870 | Salem Hospital Facility Authority, Oregon, Revenue Bonds, Salem Health Projects, Series 2019A, 4.000%, 5/15/49 | 5/29 at 100.00 | 24,291,334 | |||||||||
| 2,000 | University of Oregon, General Revenue Bonds, Series 2018A, 5.000%, 4/01/48 | 4/28 at 100.00 | 2,003,346 | |||||||||
| Total Oregon | 67,029,397 | |||||||||||
Pennsylvania - 6.6% (3.8% of Total Investments) | ||||||||||||
| 13,000 | Allegheny County Airport Authority, Pennsylvania, Airport Revenue Bonds, Pittsburgh International Airport, Series 2021A, 5.000%, 1/01/56, (AMT) | 1/31 at 100.00 | 12,039,375 | |||||||||
| Allegheny County Sanitary Authority, Pennsylvania, Sewer Revenue Bonds, Series 2020B: | ||||||||||||
| 1,000 | 4.000%, 6/01/45 | 12/30 at 100.00 | 843,689 | |||||||||
| 1,765 | 4.000%, 6/01/50 | 12/30 at 100.00 | 1,439,411 | |||||||||
| 3,800 | Beaver County Industrial Development Authority, Pennsylvania, Pollution Control Revenue Bonds, FirstEnergy Generation Project, Refunding Series 2006A, 4.375%, 1/01/35, (Mandatory Put 7/01/33) | No Opt. Call | 3,528,347 | |||||||||
| 345 | Commonwealth Financing Authority, Pennsylvania, State Appropriation Lease Bonds, Master Settlement, Series 2018, 5.000%, 6/01/34 | 6/28 at 100.00 | 352,529 | |||||||||
| Delaware River Joint Toll Bridge Commission, New Jersey and Pennsylvania, Bridge System Revenue Bonds, Series 2017: | ||||||||||||
| 3,500 | 5.000%, 7/01/37 | 7/27 at 100.00 | 3,559,777 | |||||||||
| 8,385 | 5.000%, 7/01/42 | 7/27 at 100.00 | 8,459,569 | |||||||||
| 16,515 | Lancaster County Hospital Authority, Pennsylvania, Revenue Bonds, Penn State Health, Series 2021, 5.000%, 11/01/51 | 11/29 at 100.00 | 15,594,029 | |||||||||
| Lehigh County Authority, Pennsylvania, Water and Sewer Revenue Bonds, Allentown Concession, Capital Appreciation Series 2013B: | ||||||||||||
| 5,400 | 0.000%, 12/01/33 | No Opt. Call | 3,290,637 | |||||||||
| 11,000 | 0.000%, 12/01/38 | No Opt. Call | 4,812,226 | |||||||||
| Lehigh County Authority, Pennsylvania, Water and Sewer Revenue Bonds, Allentown Concession, Series 2013A: | ||||||||||||
| 2,875 | (c) | 5.125%, 12/01/47, (Pre-refunded 12/01/23) | 12/23 at 100.00 | 2,877,845 | ||||||||
| 2,500 | 5.125%, 12/01/47 | 12/23 at 100.00 | 2,500,340 | |||||||||
| Montgomery County Higher Education and Health Authority, Pennsylvania, Revenue Bonds, Thomas Jefferson University, Series 2018A: | ||||||||||||
| 2,400 | 5.000%, 9/01/35 | 9/28 at 100.00 | 2,412,574 | |||||||||
| 5,410 | 5.000%, 9/01/48 | 9/28 at 100.00 | 5,077,312 | |||||||||
| 500 | Montgomery County Higher Education and Health Authority, Pennsylvania, Revenue Bonds, Thomas Jefferson University, Series 2019, 4.000%, 9/01/44 | 9/29 at 100.00 | 419,481 | |||||||||
| 3,430 | (c) | Montgomery County Industrial Development Authority, Pennsylvania, Health System Revenue Bonds, Albert Einstein Healthcare Network Issue, Series 2015A, 5.250%, 1/15/45, (Pre-refunded 1/15/25) | 1/25 at 100.00 | 3,482,820 | ||||||||
| NAD | Nuveen Quality Municipal Income Fund (continued) Portfolio of Investments October 31, 2023 |
Principal Amount (000) | Description (a) | Optional Call Provisions (b) | Value | |||||||||
Pennsylvania | ||||||||||||
| $ 1,900 | Montgomery County Industrial Development Authority, Pennsylvania, Revenue Bonds, ACTS Retirement-Life Communities, Inc. Obligated Group, Series 2020, 4.000%, 11/15/43 | 11/27 at 103.00 | $ | 1,486,468 | ||||||||
| 5,155 | Neshaminy School District, Bucks County, Pennsylvania, General Obligation Bonds, Series 2022, 4.000%, 11/01/46 | 5/30 at 100.00 | 4,379,352 | |||||||||
| 235 | Pennsylvania Economic Development Financing Authority, Exempt Facilities Revenue Bonds, National Gypsum Company, Refunding Series 2014, 5.500%, 11/01/44, (AMT) | 11/24 at 100.00 | 222,685 | |||||||||
| 9,575 | Pennsylvania Higher Educational Facilities Authority, Revenue Bonds, University of Pennsylvania Health System, Series 2019, 4.000%, 8/15/44 | 8/29 at 100.00 | 8,077,208 | |||||||||
| 16,750 | Pennsylvania Turnpike Commission, Turnpike Revenue Bonds, Capital Appreciation Series 2009E, 6.375%, 12/01/38 | 12/27 at 100.00 | 17,877,303 | |||||||||
| 4,210 | Pennsylvania Turnpike Commission, Turnpike Revenue Bonds, Series 2015B, 5.000%, 12/01/45 | 12/25 at 100.00 | 4,139,151 | |||||||||
| 7,235 | Pennsylvania Turnpike Commission, Turnpike Revenue Bonds, Series 2021B, 5.000%, 12/01/51 | 6/31 at 100.00 | 7,214,132 | |||||||||
| 3,635 | Pennsylvania Turnpike Commission, Turnpike Revenue Bonds, Series 2022B, 5.250%, 12/01/52 | 12/32 at 100.00 | 3,697,759 | |||||||||
| 2,000 | Pennsylvania Turnpike Commission, Turnpike Revenue Bonds, Subordinate Lien Series 2014A-1, 5.000%, 12/01/38 | 12/24 at 100.00 | 1,999,089 | |||||||||
| 14,500 | Pennsylvania Turnpike Commission, Turnpike Revenue Bonds, Subordinate Series 2009C, 6.250%, 6/01/33 - AGM Insured | 6/26 at 100.00 | 15,326,036 | |||||||||
| 6,890 | Pennsylvania Turnpike Commission, Turnpike Revenue Bonds, Subordinate Series 2015B-1, 5.000%, 12/01/45 | 12/25 at 100.00 | 6,755,436 | |||||||||
| 5,000 | Pennsylvania Turnpike Commission, Turnpike Revenue Bonds, Subordinate Series 2016A-1, 5.000%, 12/01/46 | 12/25 at 100.00 | 4,910,102 | |||||||||
| 9,240 | Pennsylvania Turnpike Commission, Turnpike Revenue Bonds, Subordinate Series 2021A, 4.000%, 12/01/50 | 12/30 at 100.00 | 7,503,342 | |||||||||
| 7,500 | Philadelphia School District, Pennsylvania, General Obligation Bonds, Series 2021A, 4.000%, 9/01/46 - BAM Insured | 9/31 at 100.00 | 6,268,967 | |||||||||
| 7,400 | Philadelphia, Pennsylvania, Airport Revenue Bonds, Refunding Series 2017B, 5.000%, 7/01/47, (AMT) | 7/27 at 100.00 | 6,935,063 | |||||||||
| 10,000 | Westmoreland County Municipal Authority, Pennsylvania, Municipal Service Revenue Bonds, Series 2016, 5.000%, 8/15/38 - BAM Insured | 8/25 at 100.00 | 10,019,061 | |||||||||
| Total Pennsylvania | 177,501,115 | |||||||||||
Puerto Rico - 1.7% (1.0% of Total Investments) | ||||||||||||
| 2,815 | Children’s Trust Fund, Puerto Rico, Tobacco Settlement Asset-Backed Bonds, Refunding Series 2002, 5.500%, 5/15/39 | 12/23 at 100.00 | 2,821,364 | |||||||||
| 155 | Puerto Rico Public Finance Corporation, Commonwealth Appropriation Bonds, Series 1998A, 5.125%, 6/01/24 - AMBAC Insured | No Opt. Call | 155,987 | |||||||||
| Puerto Rico Sales Tax Financing Corporation, Sales Tax Revenue Bonds, Restructured 2018A-1: | ||||||||||||
| 20 | 0.000%, 7/01/24 | No Opt. Call | 19,404 | |||||||||
| 90 | 0.000%, 7/01/27 | No Opt. Call | 76,144 | |||||||||
| 88 | 0.000%, 7/01/29 | 7/28 at 98.64 | 67,749 | |||||||||
| 114 | 0.000%, 7/01/31 | 7/28 at 91.88 | 79,374 | |||||||||
| 128 | 0.000%, 7/01/33 | 7/28 at 86.06 | 80,175 | |||||||||
| 1,093 | 4.500%, 7/01/34 | 7/25 at 100.00 | 1,043,831 | |||||||||
| 21,208 | 0.000%, 7/01/51 | 7/28 at 30.01 | 3,833,599 | |||||||||
| 16,965 | 4.750%, 7/01/53 | 7/28 at 100.00 | 14,371,403 | |||||||||
| 19,870 | 5.000%, 7/01/58 | 7/28 at 100.00 | 17,396,342 | |||||||||
Principal Amount (000) | Description (a) | Optional Call Provisions (b) | Value | |||||||||
Puerto Rico | ||||||||||||
| Puerto Rico Sales Tax Financing Corporation, Sales Tax Revenue Bonds, Taxable Restructured Cofina Project Series 2019A-2: | ||||||||||||
| $ 3,875 | 4.329%, 7/01/40 | 7/28 at 100.00 | $ | 3,357,012 | ||||||||
| 3,291 | 4.329%, 7/01/40 | 7/28 at 100.00 | 2,851,077 | |||||||||
| 20 | 4.536%, 7/01/53 | 7/28 at 100.00 | 16,342 | |||||||||
| Total Puerto Rico | 46,169,803 | |||||||||||
Rhode Island - 0.3% (0.2% of Total Investments) | ||||||||||||
| 3,320 | Rhode Island Health and Educational Building Corporation, Hospital Financing Revenue Bonds, Lifespan Obligated Group, Refunding Series 2016, 5.000%, 5/15/39 | 5/26 at 100.00 | 3,089,769 | |||||||||
| 30,175 | Rhode Island Tobacco Settlement Financing Corporation, Tobacco Settlement Asset-Backed Bonds, Series 2007A, 0.000%, 6/01/52 | 11/23 at 18.50 | 4,234,865 | |||||||||
| Total Rhode Island | 7,324,634 | |||||||||||
South Carolina - 5.2% (3.0% of Total Investments) | ||||||||||||
| 7,500 | Lexington County Health Services District, Inc., South Carolina, Hospital Revenue Bonds, Lexington Medical Center, Series 2016, 5.000%, 11/01/41 | 5/26 at 100.00 | 7,336,970 | |||||||||
| Piedmont Municipal Power Agency, South Carolina, Electric Revenue Bonds, Series 2004A-2: | ||||||||||||
| 21,565 | 0.000%, 1/01/30 - AMBAC Insured | No Opt. Call | 16,043,806 | |||||||||
| 1,250 | 0.000%, 1/01/31 - AGC Insured | No Opt. Call | 889,173 | |||||||||
| 6,000 | Rock Hill, South Carolina, Combined Utility System Revenue Bonds, Series 2016, 5.000%, 1/01/41 | 1/26 at 100.00 | 5,999,949 | |||||||||
| South Carolina Jobs-Economic Development Authority, Economic Development Revenue Bonds, Bishop Gadsden Episcopal Retirement Community, Series 2019A: | ||||||||||||
| 645 | 5.000%, 4/01/44 | 4/26 at 103.00 | 546,765 | |||||||||
| 625 | 5.000%, 4/01/49 | 4/26 at 103.00 | 511,115 | |||||||||
| 1,640 | South Carolina Jobs-Economic Development Authority, Economic Development Revenue Bonds, Furman University, Refunding Series 2015, 5.000%, 10/01/45 | 10/25 at 100.00 | 1,642,838 | |||||||||
| 9,255 | South Carolina Jobs-Economic Development Authority, Hospital Revenue Bonds, Bon Secours Mercy Health, Inc, Series 2020A, 5.000%, 12/01/46 | 6/30 at 100.00 | 8,954,922 | |||||||||
| South Carolina Jobs-Economic Development Authority, Hospital Revenue Bonds, McLeod Health Projects, Refunding & Improvement Series 2018: | ||||||||||||
| 1,000 | 5.000%, 11/01/43 | 5/28 at 100.00 | 986,054 | |||||||||
| 2,500 | 4.000%, 11/01/48 | 5/28 at 100.00 | 2,064,684 | |||||||||
| 13,220 | 5.000%, 11/01/48 | 5/28 at 100.00 | 12,780,598 | |||||||||
| 9,135 | South Carolina Public Service Authority, Santee Cooper Revenue Obligations, Refunding & Improvement Series 2015A, 5.000%, 12/01/50 | 6/25 at 100.00 | 8,575,378 | |||||||||
| South Carolina Public Service Authority, Santee Cooper Revenue Obligations, Refunding Series 2016B: | ||||||||||||
| 9,750 | 5.000%, 12/01/46 | 12/26 at 100.00 | 9,298,581 | |||||||||
| 9,000 | 5.000%, 12/01/56 | 12/26 at 100.00 | 8,354,180 | |||||||||
| 2,500 | South Carolina Public Service Authority, Santee Cooper Revenue Obligations, Refunding Series 2022A, 4.000%, 12/01/52 | 6/32 at 100.00 | 1,935,814 | |||||||||
| South Carolina Public Service Authority, Santee Cooper Revenue Obligations, Refunding Series 2022B: | ||||||||||||
| 2,000 | 4.000%, 12/01/39 | 6/32 at 100.00 | 1,730,768 | |||||||||
| 11,922 | 4.000%, 12/01/43 | 6/32 at 100.00 | 9,838,001 | |||||||||
| NAD | Nuveen Quality Municipal Income Fund (continued) Portfolio of Investments October 31, 2023 |
Principal Amount (000) | Description (a) | Optional Call Provisions (b) | Value | |||||||||
South Carolina | ||||||||||||
| South Carolina Public Service Authority, Santee Cooper Revenue Obligations, Series 2014A: | ||||||||||||
| $ 8,615 | 5.000%, 12/01/49 | 6/24 at 100.00 | $ | 8,113,175 | ||||||||
| 3,455 | 5.500%, 12/01/54 | 6/24 at 100.00 | 3,373,686 | |||||||||
| South Carolina State Ports Authority, Revenue Bonds, Series 2015: | ||||||||||||
| 4,140 | (c) | 5.250%, 7/01/55, (Pre-refunded 7/01/25), (AMT) | 7/25 at 100.00 | 4,191,526 | ||||||||
| 860 | (c) | 5.250%, 7/01/55, (Pre-refunded 7/01/25), (AMT) | 7/25 at 100.00 | 870,703 | ||||||||
| South Carolina State Ports Authority, Revenue Bonds, Series 2018: | ||||||||||||
| 5,350 | 5.000%, 7/01/48, (AMT) | 7/28 at 100.00 | 5,059,806 | |||||||||
| 1,000 | 5.000%, 7/01/55, (AMT) | 7/28 at 100.00 | 923,724 | |||||||||
| South Carolina State Ports Authority, Revenue Bonds, Series 2019B: | ||||||||||||
| 10,000 | 5.000%, 7/01/44, (AMT) | 7/29 at 100.00 | 9,588,931 | |||||||||
| 10,365 | 5.000%, 7/01/54, (AMT) | 7/29 at 100.00 | 9,528,746 | |||||||||
| Total South Carolina | 139,139,893 | |||||||||||
South Dakota - 1.0% (0.6% of Total Investments) | ||||||||||||
| 3,750 | Clay County, South Dakota, General Obligation Bonds, Series 2023, 5.000%, 12/01/44 | 12/31 at 100.00 | 3,766,619 | |||||||||
| 11,320 | South Dakota Board of Regents, Housing and Auxiliary Facilities System Revenue Bonds, Series 2017, 4.000%, 4/01/42 | 10/27 at 100.00 | 9,705,385 | |||||||||
| 5,915 | South Dakota Health and Educational Facilities Authority, Revenue Bonds, Regional Health, Refunding Series 2017, 5.000%, 9/01/40 | 9/27 at 100.00 | 5,749,153 | |||||||||
| 3,500 | South Dakota Health and Educational Facilities Authority, Revenue Bonds, Sanford Health, Series 2014B, 5.000%, 11/01/44 | 11/24 at 100.00 | 3,284,103 | |||||||||
| 5,165 | South Dakota Health and Educational Facilities Authority, Revenue Bonds, Sanford Health, Series 2015, 5.000%, 11/01/45 | 11/25 at 100.00 | 4,815,722 | |||||||||
| Total South Dakota | 27,320,982 | |||||||||||
Tennessee - 1.8% (1.0% of Total Investments) | ||||||||||||
| 9,000 | Greeneville Health and Educational Facilities Board, Tennessee, Hospital Revenue Bonds, Ballad Health, Series 2018A, 5.000%, 7/01/36 | 7/28 at 100.00 | 9,009,896 | |||||||||
| 17,000 | Knox County Health, Educational and Housing Facility Board, Tennessee, Hospital Revenue Bonds, Covenant Health, Refunding Series 2016A, 5.000%, 1/01/42 | 1/27 at 100.00 | 15,846,089 | |||||||||
| Metropolitan Government of Nashville and Davidson County Sports Authority, Tennessee, Revenue Bonds, Stadium Project, Subordinate Senior Series 2023A: | ||||||||||||
| 6,000 | 5.250%, 7/01/48 - AGM Insured | 1/34 at 100.00 | 6,156,469 | |||||||||
| 3,000 | Metropolitan Government of Nashville-Davidson County Health and Educational Facilities Board, Tennessee, Revenue Bonds, Belmont University, Series 2023, 5.250%, 5/01/48 | 5/33 at 100.00 | 3,000,394 | |||||||||
| Metropolitan Nashville Airport Authority, Tennessee, Airport Improvement Revenue Bonds, Series 2022B: | ||||||||||||
| 4,500 | (g) | 5.250%, 7/01/47, (AMT), (UB) | 7/32 at 100.00 | 4,418,159 | ||||||||
| 2,000 | (g) | 5.500%, 7/01/52, (AMT), (UB) | 7/32 at 100.00 | 2,005,388 | ||||||||
| 3,505 | Metropolitan Nashville Airport Authority, Tennessee, Airport Revenue Bonds, Subordinate Series 2019B, 5.000%, 7/01/49, (AMT) | 7/30 at 100.00 | 3,302,248 | |||||||||
| 4,000 | The Tennessee Energy Acquisition Corporation, Gas Revenue Bonds, Series 2006A, 5.250%, 9/01/26 | No Opt. Call | 4,012,644 | |||||||||
| Total Tennessee | 47,751,287 | |||||||||||
Principal Amount (000) | Description (a) | Optional Call Provisions (b) | Value | |||||||||
Texas - 17.3% (10.1% of Total Investments) | ||||||||||||
| $ | 1,975 | Allen Independent School District, Collin County, Texas, General Obligation Bonds, School Building Series 2016, 5.000%, 2/15/39 | 2/26 at 100.00 | $ | 2,002,807 | |||||||
| 3,000 | Austin, Texas, Airport System Revenue Bonds, Series 2015, 5.000%, 11/15/39, (AMT) | 11/24 at 100.00 | 2,916,938 | |||||||||
| Austin, Texas, Airport System Revenue Bonds, Series 2019B: | ||||||||||||
| 16,615 | 5.000%, 11/15/44, (AMT) | 11/29 at 100.00 | 15,865,469 | |||||||||
| 14,450 | 5.000%, 11/15/48, (AMT) | 11/29 at 100.00 | 13,623,495 | |||||||||
| Austin, Texas, Electric Utility System Revenue Bonds, Refunding Series 2015A: | ||||||||||||
| 3,000 | 5.000%, 11/15/38 | 11/25 at 100.00 | 3,007,810 | |||||||||
| 13,705 | (g) | 5.000%, 11/15/45, (UB) | 11/25 at 100.00 | 13,583,986 | ||||||||
| 1,450 | Austin, Texas, Water and Wastewater System Revenue Bonds, Refunding Series 2016, 5.000%, 11/15/41 | 11/26 at 100.00 | 1,457,245 | |||||||||
| 4,390 | Bastrop Independent School District, Bastrop County, Texas, General Obligation Bonds, School Building Series 2023, 5.000%, 2/15/53 | 2/33 at 100.00 | 4,424,412 | |||||||||
| Bexar County, Texas, Venue Project Revenue Bonds, Refunding Combined Venue Tax Series 2015: | ||||||||||||
| 1,060 | (c) | 5.000%, 8/15/34, (Pre-refunded 8/15/24) - AGM Insured | 8/24 at 100.00 | 1,068,561 | ||||||||
| 1,160 | (c) | 5.000%, 8/15/35, (Pre-refunded 8/15/24) - AGM Insured | 8/24 at 100.00 | 1,169,368 | ||||||||
| 2,000 | Brownsville, Texas, Utility System Revenue Bonds, Refunding Series 2015, 5.000%, 9/01/31 | 9/25 at 100.00 | 2,030,969 | |||||||||
| Central Texas Regional Mobility Authority, Revenue Bonds, Senior Lien Series 2010: | ||||||||||||
| 2,945 | 0.000%, 1/01/36 | No Opt. Call | 1,627,036 | |||||||||
| 2,205 | 0.000%, 1/01/37 | No Opt. Call | 1,127,015 | |||||||||
| 2,160 | 0.000%, 1/01/38 | No Opt. Call | 1,017,209 | |||||||||
| 1,000 | 0.000%, 1/01/40 | No Opt. Call | 411,918 | |||||||||
| Central Texas Regional Mobility Authority, Revenue Bonds, Senior Lien, Series 2015A: | ||||||||||||
| 2,600 | (c) | 5.000%, 1/01/35, (Pre-refunded 7/01/25) | 7/25 at 100.00 | 2,645,023 | ||||||||
| 3,035 | (c) | 5.000%, 1/01/45, (Pre-refunded 7/01/25) | 7/25 at 100.00 | 3,087,555 | ||||||||
| 1,000 | Clifton Higher Education Finance Corporation, Texas, Education Revenue Bonds, Idea Public Schools, Series 2013, 6.000%, 8/15/43 | 12/23 at 100.00 | 1,000,288 | |||||||||
| Clifton Higher Education Finance Corporation, Texas, Education Revenue Bonds, Uplift Education Charter School, Series 2013A: | ||||||||||||
| 1,000 | 4.350%, 12/01/42 | 12/23 at 100.00 | 834,699 | |||||||||
| 1,000 | 4.400%, 12/01/47 | 12/23 at 100.00 | 802,248 | |||||||||
| 2,000 | Dallas Area Rapid Transit, Texas, Sales Tax Revenue Bonds, Refunding & Improvement Senior Lien Series 2021B, 5.000%, 12/01/47 | 12/30 at 100.00 | 2,008,398 | |||||||||
| 1,175 | (c) | Dallas Area Rapid Transit, Texas, Sales Tax Revenue Bonds, Refunding Senior Lien Series 2014A, 5.000%, 12/01/36, (Pre-refunded 12/01/24) | 12/24 at 100.00 | 1,186,980 | ||||||||
| 1,680 | (c) | Dallas Area Rapid Transit, Texas, Sales Tax Revenue Bonds, Refunding Series 2016A, 5.000%, 12/01/48, (Pre-refunded 12/01/25) | 12/25 at 100.00 | 1,722,014 | ||||||||
| 5,000 | Dallas, Texas, Waterworks and Sewer System Revenue Bonds, Refunding Series 2016A, 5.000%, 10/01/41 | 10/26 at 100.00 | 5,033,700 | |||||||||
| 200 | Decatur Hospital Authority, Texas, Revenue Bonds, Wise Regional Health System, Series 2014A, 5.250%, 9/01/44 | 9/24 at 100.00 | 184,286 | |||||||||
| 5,000 | Deer Park Independent School District, Harris County, Texas, General Obligation Bonds, School Building Series 2022, 5.000%, 8/15/47 | 8/32 at 100.00 | 5,066,654 | |||||||||
| NAD | Nuveen Quality Municipal Income Fund (continued) Portfolio of Investments October 31, 2023 |
Principal Amount (000) | Description (a) | Optional Call Provisions (b) | Value | |||||||||
Texas | ||||||||||||
| $ | 5,185 | (g) | Denton Independent School District, Denton County, Texas, General Obligation Bonds, School Building Series 2023, 5.000%, 8/15/53, (UB) | 8/33 at 100.00 | $ | 5,227,989 | ||||||
| 1,000 | El Paso County Hospital District, Texas, General Obligtion Bonds, Refunding Series 2013, 5.000%, 8/15/33 | 12/23 at 100.00 | 981,102 | |||||||||
| 8,120 | Fredericksburg Independent School District, Gillespie, Blanco, and Kendall Counties, Texas, School Building Series 2022, 5.000%, 2/15/47 | 2/32 at 100.00 | 8,213,428 | |||||||||
| Grand Parkway Transportation Corporation, Texas, System Toll Revenue Bonds, Refunding First Tier Series 2020C: | ||||||||||||
| 10,000 | 4.000%, 10/01/49 | 4/30 at 100.00 | 8,079,184 | |||||||||
| 1,000 | 4.000%, 10/01/49 - AGM Insured | 4/30 at 100.00 | 819,815 | |||||||||
| 5,295 | Grand Parkway Transportation Corporation, Texas, System Toll Revenue Bonds, Subordinate Lien Series 2018A. Tela Supported, 5.000%, 10/01/48 | 4/28 at 100.00 | 5,258,905 | |||||||||
| 4,960 | Gulf Coast Industrial Development Authority, Texas, Solid Waste Disposal Revenue Bonds, Citgo Petroleum Corporation Project, Series 1995, 4.875%, 5/01/25, (AMT) | 12/23 at 100.00 | 4,901,356 | |||||||||
| Harris County Cultural Education Facilities Finance Corporation, Texas, Revenue Bonds, Houston Methodist Hospital System, Series 2015: | ||||||||||||
| 1,895 | 4.000%, 12/01/45 | 6/25 at 100.00 | 1,535,077 | |||||||||
| 4,850 | 5.000%, 12/01/45 | 6/25 at 100.00 | 4,693,683 | |||||||||
| Harris County Cultural Education Facilities Finance Corporation, Texas, Revenue Refunding Bonds, Young Men’s Christian Association of the Greater Houston Area, Series 2013A: | ||||||||||||
| 1,615 | 5.000%, 6/01/28 | 12/23 at 100.00 | 1,541,127 | |||||||||
| 3,000 | 5.000%, 6/01/38 | 12/23 at 100.00 | 2,461,775 | |||||||||
| 5,150 | Harris County, Texas, Toll Road Revenue Bonds, Refunding Senior Lien Series 2016A, 5.000%, 8/15/41 | 8/26 at 100.00 | 5,156,103 | |||||||||
| 5,000 | Harris County, Texas, Toll Road Revenue Bonds, Refunding Senior Lien Series 2018A, 4.000%, 8/15/48 | 2/28 at 100.00 | 4,133,377 | |||||||||
| Harris County-Houston Sports Authority, Texas, Revenue Bonds, Capital Appreciation Refunding Senior Lien Series 2014A: | ||||||||||||
| 510 | 0.000%, 11/15/41 - AGM Insured | 11/31 at 62.66 | 178,786 | |||||||||
| 1,020 | 0.000%, 11/15/42 - AGM Insured | 11/31 at 59.73 | 333,328 | |||||||||
| 1,255 | 0.000%, 11/15/43 - AGM Insured | 11/31 at 56.93 | 384,500 | |||||||||
| 3,305 | 0.000%, 11/15/44 - AGM Insured | 11/31 at 54.25 | 947,153 | |||||||||
| 4,460 | 0.000%, 11/15/45 - AGM Insured | 11/31 at 51.48 | 1,200,401 | |||||||||
| 6,500 | 0.000%, 11/15/47 - AGM Insured | 11/31 at 46.45 | 1,545,547 | |||||||||
| Harris County-Houston Sports Authority, Texas, Revenue Bonds, Junior Lien Series 2001H: | ||||||||||||
| 495 | 0.000%, 11/15/24 - NPFG Insured | No Opt. Call | 470,480 | |||||||||
| 105 | (c) | 0.000%, 11/15/24 - NPFG Insured, (ETM) | No Opt. Call | 100,274 | ||||||||
| 4,390 | 0.000%, 11/15/29 - NPFG Insured | No Opt. Call | 3,219,221 | |||||||||
| 50 | (c) | 0.000%, 11/15/29 - NPFG Insured, (ETM) | No Opt. Call | 38,413 | ||||||||
| 625 | 0.000%, 11/15/30 - NPFG Insured | No Opt. Call | 432,830 | |||||||||
| 105 | (c) | 0.000%, 11/15/30 - NPFG Insured, (ETM) | No Opt. Call | 77,142 | ||||||||
| 7,570 | 0.000%, 11/15/31 - NPFG Insured | No Opt. Call | 4,941,796 | |||||||||
| 210 | 0.000%, 11/15/32 - NPFG Insured | 11/31 at 94.05 | 128,104 | |||||||||
| 260 | 0.000%, 11/15/33 | 11/31 at 88.44 | 148,066 | |||||||||
| 2,045 | 0.000%, 11/15/34 - NPFG Insured | 11/31 at 83.17 | 1,088,626 | |||||||||
| 1,130 | 0.000%, 11/15/36 - NPFG Insured | 11/31 at 73.51 | 519,527 | |||||||||
| 4,370 | 0.000%, 11/15/38 - NPFG Insured | 11/31 at 64.91 | 1,740,945 | |||||||||
| 2,260 | 0.000%, 11/15/39 - NPFG Insured | 11/31 at 60.98 | 839,910 | |||||||||
Principal Amount (000) | Description (a) | Optional Call Provisions (b) | Value | |||||||||
Texas | ||||||||||||
| Harris County-Houston Sports Authority, Texas, Revenue Bonds, Refunding Second Lien Series 2014C: | ||||||||||||
| $ 600 | 5.000%, 11/15/33 | 11/24 at 100.00 | $ | 600,391 | ||||||||
| 400 | 5.000%, 11/15/34 | 11/24 at 100.00 | 400,074 | |||||||||
| Harris County-Houston Sports Authority, Texas, Revenue Bonds, Refunding Senior Lien Series 2014A: | ||||||||||||
| 1,000 | 5.000%, 11/15/28 | 11/24 at 100.00 | 1,003,482 | |||||||||
| 1,000 | 5.000%, 11/15/30 | 11/24 at 100.00 | 1,002,875 | |||||||||
| 3,440 | Harris County-Houston Sports Authority, Texas, Revenue Bonds, Senior Lien Series 2001G, 0.000%, 11/15/41 - NPFG Insured | 11/31 at 53.78 | 1,132,862 | |||||||||
| 1,000 | Harris County-Houston Sports Authority, Texas, Revenue Bonds, Third Lien Series 2004A-3, 0.000%, 11/15/33 - NPFG Insured | 11/24 at 59.10 | 552,356 | |||||||||
| 1,000 | Hidalgo County Regional Mobility Authority, Texas, Toll and Vehicle Registration Fee Revenue Bonds, Senior Lien Series 2022A, 4.000%, 12/01/39 | 12/31 at 100.00 | 844,062 | |||||||||
| 5,000 | Houston, Texas, Airport System Revenue Bonds, Refunding Subordinate Lien Series 2023A, 5.250%, 7/01/53 - AGM Insured, (AMT) | 7/33 at 100.00 | 4,881,069 | |||||||||
| 5,000 | Houston, Texas, Airport System Special Facilities Revenue Bonds, United Airlines, Inc. Technical Operations Center Project, Series 2018, 5.000%, 7/15/28, (AMT) | No Opt. Call | 4,849,758 | |||||||||
| 380 | Houston, Texas, Airport System Special Facilities Revenue Bonds, United Airlines, Inc. Terminal E Project, Refunding Series 2014, 5.000%, 7/01/29, (AMT) | 7/24 at 100.00 | 367,426 | |||||||||
| 1,885 | Houston, Texas, Airport System Special Facilities Revenue Bonds, United Airlines, Inc. Terminal E Project, Refunding Series 2020A, 5.000%, 7/01/27, (AMT) | No Opt. Call | 1,823,063 | |||||||||
| 1,000 | Houston, Texas, Airport System Special Facilities Revenue Bonds, United Airlines, Inc. Terminal Improvements Project, Refunding Series 2020B-2, 5.000%, 7/15/27, (AMT) | No Opt. Call | 966,823 | |||||||||
| 1,015 | Houston, Texas, Hotel Occupancy Tax and Special Revenue Bonds, Convention and Entertainment Facilities Department, Refunding Series 2014, 5.000%, 9/01/34 | 9/24 at 100.00 | 1,018,989 | |||||||||
| Houston, Texas, Hotel Occupancy Tax and Special Revenue Bonds, Convention and Entertainment Project, Series 2001B: | ||||||||||||
| 3,250 | 0.000%, 9/01/25 - AMBAC Insured | No Opt. Call | 3,004,974 | |||||||||
| 4,130 | 0.000%, 9/01/26 - AMBAC Insured | No Opt. Call | 3,655,778 | |||||||||
| 3,130 | 0.000%, 9/01/30 - AMBAC Insured | No Opt. Call | 2,283,606 | |||||||||
| 12,030 | 0.000%, 9/01/31 - AMBAC Insured | No Opt. Call | 8,344,434 | |||||||||
| 1,470 | 0.000%, 9/01/32 - AMBAC Insured | No Opt. Call | 968,671 | |||||||||
| 1,360 | (c) | Jacksonville Independent School District, Cherokee County, Texas, General Obligation Bonds, School Building Series 2014, 5.000%, 2/15/39, (Pre-refunded 2/15/24) | 2/24 at 100.00 | 1,364,016 | ||||||||
| 2,675 | (c) | Laredo Community College District, Webb County, Texas, General Obligation Bonds, Series 2014, 5.000%, 8/01/34, (Pre-refunded 8/01/24) | 8/24 at 100.00 | 2,696,523 | ||||||||
| Leander Independent School District, Williamson and Travis Counties, Texas, General Obligation Bonds, Refunding Series 2015A: | ||||||||||||
| 8,000 | 4.000%, 8/15/37 | 8/25 at 100.00 | 7,411,703 | |||||||||
| 2,275 | 5.000%, 8/15/40 | 8/25 at 100.00 | 2,286,516 | |||||||||
| 1,750 | Love Field Airport Modernization Corporation, Texas, General Airport Revenue Bonds Series 2015, 5.000%, 11/01/35, (AMT) | 11/25 at 100.00 | 1,721,592 | |||||||||
| 4,660 | Lower Colorado River Authority, Texas, Transmission Contract Revenue Bonds, LCRA Transmission Services Corporation Project, Refunding Series 2020A, 5.000%, 5/15/50 | 5/30 at 100.00 | 4,463,528 | |||||||||
| NAD | Nuveen Quality Municipal Income Fund (continued) Portfolio of Investments October 31, 2023 |
Principal Amount (000) | Description (a) | Optional Call Provisions (b) | Value | |||||||||
Texas | ||||||||||||
| $ 9,180 | Matagorda County Navigation District 1, Texas, Collateralized Revenue Refunding Bonds, Houston Light and Power Company, Series 1997, 5.125%, 11/01/28 - AMBAC Insured, (AMT) | No Opt. Call | $ | 9,222,602 | ||||||||
| McCamey County Hospital District, Texas, General Obligation Bonds, Series 2013: | ||||||||||||
| 1,000 | 5.750%, 12/01/33 | 12/25 at 100.00 | 986,844 | |||||||||
| 3,000 | 6.125%, 12/01/38 | 12/25 at 100.00 | 2,898,842 | |||||||||
| 3,470 | Midland, Texas, General Obligation Bonds, Refunding Series 2022B, 5.000%, 3/01/47 | 3/32 at 100.00 | 3,493,325 | |||||||||
| 2,835 | Mission Economic Development Corporation, Texas, Revenue Bonds, Natgasoline Project, Senior Lien Series 2018, 4.625%, 10/01/31, (AMT), 144A | 11/23 at 103.00 | 2,668,745 | |||||||||
| 4,735 | New Hope Cultural Education Facilities Finance Corporation, Texas, Student Housing Revenue Bonds, CHF-Collegiate Housing Foundation - College Station I LLC - Texas A&M University Project, Series 2014A, 5.000%, 4/01/46 - AGM Insured | 4/24 at 100.00 | 4,241,238 | |||||||||
| 355 | (c) | North Central Texas Health Facilities Development Corporation, Hospital Revenue Bonds, Presbyterian Healthcare System, Series 1996A, 5.750%, 6/01/26 - NPFG Insured, (ETM) | 7/21 at 100.00 | 363,832 | ||||||||
| 3,860 | North Harris County Regional Water Authority, Texas, Water Revenue Bonds, Refunding Senior Lien Series 2013, 5.000%, 12/15/33 | 12/23 at 100.00 | 3,860,747 | |||||||||
| North Texas Tollway Authority, Special Projects System Revenue Bonds, Convertible Capital Appreciation Series 2011C: | ||||||||||||
| 4,030 | (c) | 7.000%, 9/01/43, (Pre-refunded 9/01/31) | 9/31 at 100.00 | 4,753,519 | ||||||||
| 8,470 | (c) | 6.750%, 9/01/45, (Pre-refunded 9/01/31) | 9/31 at 100.00 | 10,036,777 | ||||||||
| 7,000 | (c) | North Texas Tollway Authority, System Revenue Bonds, Refunding First Tier Capital Appreciation Series 2008I, 6.500%, 1/01/43, (Pre-refunded 1/01/25) | 1/25 at 100.00 | 7,196,479 | ||||||||
| 2,500 | North Texas Tollway Authority, System Revenue Bonds, Refunding First Tier, Series 2008D, 0.000%, 1/01/36 - AGC Insured | No Opt. Call | 1,397,682 | |||||||||
| North Texas Tollway Authority, System Revenue Bonds, Refunding Second Tier, Series 2015A: | ||||||||||||
| 13,355 | 5.000%, 1/01/33 | 1/25 at 100.00 | 13,393,755 | |||||||||
| 1,000 | 5.000%, 1/01/35 | 1/25 at 100.00 | 1,001,719 | |||||||||
| 1,425 | Port of Houston Authority, Harris County, Texas, General Obligation Bonds, Series 2010E, 0.000%, 10/01/35 | No Opt. Call | 858,798 | |||||||||
| 205 | Reagan Hospital District of Reagan County, Texas, Limited Tax Revenue Bonds, Series 2014A, 5.125%, 2/01/39 | 2/24 at 100.00 | 192,931 | |||||||||
| 2,500 | San Antonio, Texas, Airport System Revenue Bonds, Refunding Series 2012, 5.000%, 7/01/27, (AMT) | 12/23 at 100.00 | 2,496,872 | |||||||||
| 7,950 | San Antonio, Texas, Water System Revenue Bonds, Junior Lien Series 2022B, 5.250%, 5/15/52 | 5/32 at 100.00 | 8,156,446 | |||||||||
| 1,925 | Stephen F. Austin State University, Texas, Revenue Bonds, Refunding & Improvement Series 2016, 5.000%, 10/15/42 | 10/28 at 100.00 | 1,946,060 | |||||||||
| 7,500 | Tarrant County College District, Texas, General Obligation Bonds, Series 2022, 5.000%, 8/15/40 | 8/32 at 100.00 | 7,707,986 | |||||||||
| 5,675 | Tarrant County Cultural Education Facilities Finance Corporation, Texas, Hospital Revenue Bonds, Methodist Hospital of Dallas, Series 2022, 4.000%, 10/01/47 | 4/32 at 100.00 | 4,685,075 | |||||||||
| 2,185 | Tarrant County Cultural Education Facilities Finance Corporation, Texas, Hospital Revenue Bonds, Scott & White Healthcare Project, Series 2022D, 5.500%, 11/15/47 | 11/32 at 100.00 | 2,225,845 | |||||||||
Principal Amount (000) | Description (a) | Optional Call Provisions (b) | Value | |||||||||
Texas | ||||||||||||
| $ 3,195 | Tarrant County Cultural Education Facilities Finance Corporation, Texas, Revenue Bonds, Christus Health, Series 2022A, 4.000%, 7/01/53 | 7/32 at 100.00 | $ | 2,460,292 | ||||||||
| 2,000 | Tarrant County Cultural Education Facilities Finance Corporation, Texas, Revenue Bonds, Texas Health Resources System, Series 2016A, 5.000%, 2/15/41 | 8/26 at 100.00 | 1,979,512 | |||||||||
| 2,015 | Texas Municipal Gas Acquisition and Supply Corporation I, Gas Supply Revenue Bonds, Senior Lien Series 2008D, 6.250%, 12/15/26 | No Opt. Call | 2,054,163 | |||||||||
| 8,330 | Texas Private Activity Bond Surface Transpiration Corporation, Revenue Bonds, NTE Mobility Partners LLC North Tarrant Express Managed Lanes Project, Senior Lien Series 2023, 5.500%, 12/31/58, (AMT) | 12/33 at 100.00 | 8,379,963 | |||||||||
| 530 | Texas Private Activity Bond Surface Transporation Corporation, Revenue Bonds, NTE Mobility Partners LLC North Tarrant Express Managed Lanes Project, Refunding Senior Lien Series 2019A, 4.000%, 12/31/39 | 12/29 at 100.00 | 460,088 | |||||||||
| 19,735 | Texas Private Activity Bond Surface Transporation Corporation, Senior Lien Revenue Bonds, Blueridge Transportation Group, LLC SH 288 Toll Lanes Project, Series 2016, 5.000%, 12/31/55, (AMT) | 12/25 at 100.00 | 17,285,427 | |||||||||
| 9,395 | Texas Private Activity Bond Surface Transporation Corporation, Senior Lien Revenue Bonds, NTE Mobility Partners Segments 3 LLC Segments 3C Project, Series 2019, 5.000%, 6/30/58, (AMT) | 6/29 at 100.00 | 8,602,865 | |||||||||
| 1,200 | (c) | Texas State, General Obligation Bonds, Texas Transportation Commission, Highway Improvement Series 2014, 5.000%, 4/01/44, (Pre-refunded 4/01/24) | 4/24 at 100.00 | 1,205,994 | ||||||||
| 2,000 | (c) | Texas State, General Obligation Bonds, Transportation Commission Mobility Fund, Refunding Series 2014, 5.000%, 10/01/34, (Pre-refunded 4/01/24) | 4/24 at 100.00 | 2,008,347 | ||||||||
| Texas Transportation Commission, Central Texas Turnpike System Revenue Bonds, Refunding First Tier Series 2015B: | ||||||||||||
| 8,335 | 0.000%, 8/15/36 | 8/24 at 59.60 | 4,098,326 | |||||||||
| 10,960 | 5.000%, 8/15/37 | 8/24 at 100.00 | 10,884,447 | |||||||||
| Texas Transportation Commission, Central Texas Turnpike System Revenue Bonds, Refunding Second Tier Series 2015C: | ||||||||||||
| 2,100 | 5.000%, 8/15/33 | 8/24 at 100.00 | 2,063,464 | |||||||||
| 15,750 | 5.000%, 8/15/42 | 8/24 at 100.00 | 14,899,761 | |||||||||
| 1,875 | Texas Transportation Commission, State Highway 249 System Revenue Bonds, First Tier Toll Series 2019A, 5.000%, 8/01/57 | 2/29 at 100.00 | 1,648,417 | |||||||||
| Texas Turnpike Authority, Central Texas Turnpike System Revenue Bonds, First Tier Series 2002A: | ||||||||||||
| 21,170 | 0.000%, 8/15/24 - AMBAC Insured | No Opt. Call | 20,475,821 | |||||||||
| 3,830 | (c) | 0.000%, 8/15/24 - AMBAC Insured, (ETM) | No Opt. Call | 3,712,342 | ||||||||
| Texas Water Development Board, State Water Implementation Revenue Fund Bonds, Master Trust Series 2017A: | ||||||||||||
| 10,000 | (g) | 4.000%, 10/15/42, (UB) | 10/27 at 100.00 | 8,794,746 | ||||||||
| 16,600 | (g) | 5.000%, 10/15/42, (UB) | 10/27 at 100.00 | 16,741,732 | ||||||||
| 2,500 | Texas Water Development Board, State Water Implementation Revenue Fund Bonds, Master Trust Series 2021, 4.000%, 10/15/51 | 10/31 at 100.00 | 2,079,818 | |||||||||
| 17,220 | University of Houston, Texas, Consolidated Revenue Bonds, Refunding Series 2022A, 5.000%, 2/15/52 | 2/32 at 100.00 | 17,251,860 | |||||||||
| 2,490 | Uptown Development Authority, Houston, Texas, Tax Increment Contract Revenue Bonds, Infrastructure Improvement Facilities, Series 2018, 5.000%, 9/01/40 | 9/25 at 100.00 | 2,296,911 | |||||||||
| NAD | Nuveen Quality Municipal Income Fund (continued) Portfolio of Investments October 31, 2023 |
Principal Amount (000) | Description (a) | Optional Call Provisions (b) | Value | |||||||||
Texas | ||||||||||||
| $ 1,735 | (c) | Via Metropolitan Transit Advanced Transportation District, Texas, Sales Tax Revenue Bonds, Refunding & Improvement Series 2014, 5.000%, 8/01/38, (Pre-refunded 8/01/24) | 8/24 at 100.00 | $ | 1,749,599 | |||||||
| 160 | Winter Garden Housing Finance Corporation, Texas, GNMA/FNMA Mortgage-Backed Securities Program Single Family Mortgage Revenue Bonds, Series 1994, 6.950%, 10/01/27, (AMT) | 12/23 at 100.00 | 160,295 | |||||||||
| 780 | (c) | Wylie Independent School District, Collin County, Texas, General Obligation Bonds, Capital Appreciation Series 2015, 0.000%, 8/15/50, (Pre-refunded 8/15/25) | 8/25 at 35.55 | 256,955 | ||||||||
| Wylie Independent School District, Collin County, Texas, General Obligation Bonds, School Building Series 2015B: | ||||||||||||
| 8,000 | 0.000%, 8/15/45 | 8/25 at 44.15 | 2,383,638 | |||||||||
| 1,000 | (c) | 0.000%, 8/15/45, (Pre-refunded 8/15/25) | 8/25 at 44.15 | 409,119 | ||||||||
| 4,370 | 0.000%, 8/15/50 | 8/25 at 35.55 | 956,145 | |||||||||
| 1,850 | (c) | 0.000%, 8/15/50, (Pre-refunded 8/15/25) | 8/25 at 35.55 | 609,445 | ||||||||
| Total Texas | 467,584,235 | |||||||||||
Utah - 1.8% (1.1% of Total Investments) | ||||||||||||
| 15,000 | Salt Lake City, Utah, Airport Revenue Bonds, International Airport Series 2017A, 5.000%, 7/01/42, (AMT) | 7/27 at 100.00 | 14,551,896 | |||||||||
| 11,750 | Salt Lake City, Utah, Airport Revenue Bonds, International Airport Series 2018A, 5.000%, 7/01/43, (AMT) | 7/28 at 100.00 | 11,388,683 | |||||||||
| 9,850 | Salt Lake City, Utah, Airport Revenue Bonds, International Airport Series 2021A, 5.000%, 7/01/46, (AMT) | 7/31 at 100.00 | 9,360,726 | |||||||||
| Salt Lake City, Utah, Airport Revenue Bonds, International Airport Series 2023A: | ||||||||||||
| 4,645 | 5.250%, 7/01/53, (AMT) | 7/33 at 100.00 | 4,541,222 | |||||||||
| 4,250 | 5.500%, 7/01/53, (AMT) | 7/33 at 100.00 | 4,274,522 | |||||||||
| 5,795 | Utah Charter School Finance Authoirty, Charter School Revenue Bonds, Hawthorn Academy Project, Series 2016, 5.000%, 10/15/46 | 4/26 at 100.00 | 5,354,771 | |||||||||
| Total Utah | 49,471,820 | |||||||||||
Virgin Islands - 0.4% (0.2% of Total Investments) | ||||||||||||
| 3,825 | Matching Fund Special Purpose Securitization Corporation, Virgin Islands, Revenue Bonds, Series 2022A, 5.000%, 10/01/32 | No Opt. Call | 3,761,122 | |||||||||
| 1,800 | Virgin Islands Public Finance Authority, Federal Highway Grant Anticipation Loan Note Revenue Bonds, Series 2015, 5.000%, 9/01/33, 144A | 9/25 at 100.00 | 1,789,001 | |||||||||
| 2,000 | Virgin Islands Public Finance Authority, Gross Receipts Taxes Loan Note, Refunding Series 2006, 5.000%, 10/01/27 - FGIC Insured | 12/23 at 100.00 | 2,021,405 | |||||||||
| 2,240 | Virgin Islands Public Finance Authority, Gross Receipts Taxes Loan Note, Working Capital Series 2014A, 5.000%, 10/01/34 - AGM Insured, 144A | 10/24 at 100.00 | 2,242,041 | |||||||||
| 730 | Virgin Islands Water and Power Authority, Electric System Revenue Bonds, Refunding Series 2007A, 5.000%, 7/01/24 | 12/23 at 100.00 | 716,558 | |||||||||
| Total Virgin Islands | 10,530,127 | |||||||||||
Virginia - 2.4% (1.4% of Total Investments) | ||||||||||||
| 420 | Amherst Industrial Development Authority, Virginia, Revenue Bonds, Sweet Briar College, Series 2006, 5.000%, 9/01/26 | 12/23 at 100.00 | 407,907 | |||||||||
| 1,435 | Arlington County Industrial Development Authority, Virginia, Hospital Facility Revenue Bonds, Virginia Hospital Center, Series 2020, 4.000%, 7/01/45 | 7/30 at 100.00 | 1,197,265 | |||||||||
| 515 | Chesapeake, Virginia, Transportation System Senior Toll Road Revenue Bonds, Capital Appreciation Series 2012B, 4.875%, 7/15/40 | 7/28 at 100.00 | 495,146 | |||||||||
Principal Amount (000) | Description (a) | Optional Call Provisions (b) | Value | |||||||||
Virginia | ||||||||||||
| $ 1,000 | (g) | Fairfax County Industrial Development Authority, Virginia, Healthcare Revenue Bonds, Inova Health System, Series 2018A, 4.000%, 5/15/48, (UB) | 5/28 at 100.00 | $ | 827,000 | |||||||
| 1,000 | Fairfax County Redevelopment and Housing Authority, Virginia, Multifamily Housing Revenue Bonds, FHA-Insured Mortgage - Cedar Ridge Project, Series 2007, 4.850%, 10/01/48, (AMT) | 12/23 at 100.00 | 1,001,134 | |||||||||
| 16,445 | Hampton Roads Transportation Accountability Commission, Virginia, Revenue Bonds, Hampton Roads Transportation Fund, Senior Lien Series 2022A, 4.000%, 7/01/52 | 7/32 at 100.00 | 13,871,969 | |||||||||
| 2,300 | Lynchburg Economic Development Authority, Virginia, Hospital Revenue Bonds, Centra Health Obligated Group, Refunding Series 2021, 4.000%, 1/01/47 | 1/32 at 100.00 | 1,907,336 | |||||||||
| 6,250 | Northern Virginia Transportation Commission, Transportation District Special Obligation Revenue Bonds, Transforming Rail In Virginia Program, Green Series 2022, 5.000%, 6/01/47 | 6/32 at 100.00 | 6,360,590 | |||||||||
| 6,115 | Tobacco Settlement Financing Corporation of Virginia, Tobacco Settlement Asset Backed Bonds, Series 2007B1, 5.000%, 6/01/47 | 11/23 at 100.00 | 5,245,252 | |||||||||
| Virginia Small Business Financing Authority, Private Activity Revenue Bonds, Transform 66 P3 Project, Senior Lien Series 2017: | ||||||||||||
| 10,000 | 5.000%, 12/31/52, (AMT) | 6/27 at 100.00 | 9,276,970 | |||||||||
| 15,605 | 5.000%, 12/31/56, (AMT) | 6/27 at 100.00 | 14,309,069 | |||||||||
| 9,625 | Virginia Small Business Financing Authority, Revenue Bonds, 95 Express Lanes LLC Project, Refunding Senior Lien Series 2022, 5.000%, 12/31/47, (AMT) | 12/32 at 100.00 | 9,087,877 | |||||||||
| Total Virginia | 63,987,515 | |||||||||||
Washington - 3.4% (2.0% of Total Investments) | ||||||||||||
| 2,000 | Energy Northwest, Washington, Electric Revenue Bonds, Columbia Generating Station, Refunding Series 2014A, 5.000%, 7/01/40 | 7/24 at 100.00 | 2,005,380 | |||||||||
| 2,375 | (c) | Grant County Public Utility District 2, Washington, Revenue Bonds, Priest Rapids Hydroelectric Project, Refunding Series 2015A, 5.000%, 1/01/41, (Pre-refunded 1/01/26) | 1/26 at 100.00 | 2,436,482 | ||||||||
| 8,840 | King County Public Hospital District 2, Washington, General Obligation Bonds, EvergreenHealth, Limited Tax 2020A, 4.000%, 12/01/45 | 12/29 at 100.00 | 7,361,819 | |||||||||
| 2,270 | Port Everett, Washington, Revenue Bonds, Refunding Series 2016, 5.000%, 12/01/46 | 6/26 at 100.00 | 2,281,037 | |||||||||
| 15,220 | Port of Seattle, Washington, Revenue Bonds, Intermediate Lien Series 2018A, 5.000%, 5/01/43, (AMT) | 5/27 at 100.00 | 14,593,603 | |||||||||
| 13,725 | Port of Seattle, Washington, Revenue Bonds, Refunding Intermediate Lien Series 2021C, 5.000%, 8/01/46, (AMT) | 8/31 at 100.00 | 13,109,087 | |||||||||
| 15,000 | Seattle, Washington, Municipal Light and Power Revenue Bonds, Refunding & Improvement Series 2021A, 4.000%, 7/01/51 | 7/31 at 100.00 | 12,516,514 | |||||||||
| 10,000 | Seattle, Washington, Municipal Light and Power Revenue Bonds, Refunding & Improvement Series 2023, 5.000%, 3/01/53 | 3/33 at 100.00 | 10,026,372 | |||||||||
| 4,000 | Washington Health Care Facilities Authority, Revenue Bonds, Providence Health & Services, Refunding Series 2012A, 5.000%, 10/01/32 | 12/23 at 100.00 | 4,000,296 | |||||||||
| 11,500 | Washington Health Care Facilities Authority, Revenue Bonds, Seattle Children’s Hospital, Series 2015A, 5.000%, 10/01/45 | 4/25 at 100.00 | 11,079,049 | |||||||||
| 6,200 | Washington State Convention Center Public Facilities District, Lodging Tax Revenue Bonds, Refunding Series2021B. Exchange Purchase, 3.000%, 7/01/58 | 7/31 at 100.00 | 3,599,807 | |||||||||
| NAD | Nuveen Quality Municipal Income Fund (continued) Portfolio of Investments October 31, 2023 |
Principal Amount (000) | Description (a) | Optional Call Provisions (b) | Value | |||||||||
Washington | ||||||||||||
| $ 2,410 | Washington State Higher Education Facilities Authority, Revenue Bonds, Seattle University, Series 2020, 4.000%, 5/01/50 | 5/30 at 100.00 | $ | 1,885,223 | ||||||||
| 320 | Washington State Housing Finance Commission, Revenue Bonds, Riverview Retirement Community, Refunding Series 2012, 5.000%, 1/01/48 | 12/23 at 100.00 | 254,008 | |||||||||
| 6,480 | Washington State, Motor Vehicle Fuel Tax General Obligation Bonds, Series 2002-03C, 0.000%, 6/01/24 - NPFG Insured | No Opt. Call | 6,336,353 | |||||||||
| Total Washington | 91,485,030 | |||||||||||
West Virginia - 0.8% (0.5% of Total Investments) | ||||||||||||
| 15,000 | West Virginia Hospital Finance Authority, Hospital Revenue Bonds, West Virginia United Health System Obligated Group, Series 2018A, 5.000%, 6/01/52 | 6/28 at 100.00 | 14,246,243 | |||||||||
| 2,000 | West Virginia Hospital Finance Authority, Revenue Bonds, West Virginia University Health System Obligated Group, Improvement Series 2017A, 5.000%, 6/01/47 | 6/27 at 100.00 | 1,918,124 | |||||||||
| 6,750 | West Virginia Parkways Authority, Turnpike Toll Revenue Bonds, Senior Lien Series 2021, 4.000%, 6/01/43 | 6/31 at 100.00 | 5,838,024 | |||||||||
| Total West Virginia | 22,002,391 | |||||||||||
Wisconsin - 2.9% (1.7% of Total Investments) | ||||||||||||
| 3,235 | Milwaukee, Wisconsin, General Obligation Bonds, Promissory Note Series 2022-B4, 5.000%, 4/01/36 - AGM Insured | 4/32 at 100.00 | 3,326,825 | |||||||||
| Public Finance Authority of Wisconsin, Conference Center and Hotel Revenue Bonds, Lombard Public Facilities Corporation, First Tier Series 2018A-1: | ||||||||||||
| 34 | (d) | 0.000%, 1/01/47, 144A | No Opt. Call | 688 | ||||||||
| 30 | (d) | 0.000%, 1/01/48, 144A | No Opt. Call | 567 | ||||||||
| 29 | (d) | 0.000%, 1/01/49, 144A | No Opt. Call | 523 | ||||||||
| 29 | (d) | 0.000%, 1/01/50, 144A | No Opt. Call | 468 | ||||||||
| 28 | (d) | 0.000%, 1/01/51, 144A | No Opt. Call | 433 | ||||||||
| 36 | (d) | 0.000%, 1/01/52, 144A | No Opt. Call | 521 | ||||||||
| 36 | (d) | 0.000%, 1/01/53, 144A | No Opt. Call | 485 | ||||||||
| 35 | (d) | 0.000%, 1/01/54, 144A | No Opt. Call | 439 | ||||||||
| 34 | (d) | 0.000%, 1/01/55, 144A | No Opt. Call | 404 | ||||||||
| 33 | (d) | 0.000%, 1/01/56, 144A | No Opt. Call | 374 | ||||||||
| 1,811 | (d) | 5.500%, 7/01/56, 144A | 3/28 at 100.00 | 941,971 | ||||||||
| 37 | (d) | 0.000%, 1/01/57, 144A | No Opt. Call | 389 | ||||||||
| 36 | (d) | 0.000%, 1/01/58, 144A | No Opt. Call | 356 | ||||||||
| 35 | (d) | 0.000%, 1/01/59, 144A | No Opt. Call | 328 | ||||||||
| 34 | (d) | 0.000%, 1/01/60, 144A | No Opt. Call | 300 | ||||||||
| 34 | (d) | 0.000%, 1/01/61, 144A | No Opt. Call | 277 | ||||||||
| 33 | (d) | 0.000%, 1/01/62, 144A | No Opt. Call | 253 | ||||||||
| 32 | (d) | 0.000%, 1/01/63, 144A | No Opt. Call | 234 | ||||||||
| 31 | (d) | 0.000%, 1/01/64, 144A | No Opt. Call | 217 | ||||||||
| 31 | (d) | 0.000%, 1/01/65, 144A | No Opt. Call | 199 | ||||||||
| 33 | (d) | 0.000%, 1/01/66, 144A | No Opt. Call | 198 | ||||||||
| 401 | (d) | 0.000%, 1/01/67, 144A | No Opt. Call | 2,141 | ||||||||
| Public Finance Authority of Wisconsin, Conference Center and Hotel Revenue Bonds, Lombard Public Facilities Corporation, Second Tier Series 2018B: | ||||||||||||
| 59 | (d) | 0.000%, 1/01/46, 144A | No Opt. Call | 1,296 | ||||||||
| 59 | (d) | 0.000%, 1/01/47, 144A | No Opt. Call | 1,179 | ||||||||
| 58 | (d) | 0.000%, 1/01/48, 144A | No Opt. Call | 1,103 | ||||||||
| 58 | (d) | 0.000%, 1/01/49, 144A | No Opt. Call | 1,027 | ||||||||
| 57 | (d) | 0.000%, 1/01/50, 144A | No Opt. Call | 935 | ||||||||
| 62 | (d) | 0.000%, 1/01/51, 144A | No Opt. Call | 966 | ||||||||
Principal Amount (000) | Description (a) | Optional Call Provisions (b) | Value | |||||||||
Wisconsin | ||||||||||||
| $ 1,606 | (d) | 1.000%, 7/01/51, 144A | 3/28 at 100.00 | $ | 848,688 | |||||||
| 62 | (d) | 0.000%, 1/01/52, 144A | No Opt. Call | 888 | ||||||||
| 61 | (d) | 0.000%, 1/01/53, 144A | No Opt. Call | 826 | ||||||||
| 61 | (d) | 0.000%, 1/01/54, 144A | No Opt. Call | 768 | ||||||||
| 60 | (d) | 0.000%, 1/01/55, 144A | No Opt. Call | 712 | ||||||||
| 59 | (d) | 0.000%, 1/01/56, 144A | No Opt. Call | 665 | ||||||||
| 59 | (d) | 0.000%, 1/01/57, 144A | No Opt. Call | 618 | ||||||||
| 58 | (d) | 0.000%, 1/01/58, 144A | No Opt. Call | 574 | ||||||||
| 57 | (d) | 0.000%, 1/01/59, 144A | No Opt. Call | 538 | ||||||||
| 57 | (d) | 0.000%, 1/01/60, 144A | No Opt. Call | 499 | ||||||||
| 56 | (d) | 0.000%, 1/01/61, 144A | No Opt. Call | 461 | ||||||||
| 56 | (d) | 0.000%, 1/01/62, 144A | No Opt. Call | 430 | ||||||||
| 55 | (d) | 0.000%, 1/01/63, 144A | No Opt. Call | 400 | ||||||||
| 54 | (d) | 0.000%, 1/01/64, 144A | No Opt. Call | 376 | ||||||||
| 54 | (d) | 0.000%, 1/01/65, 144A | No Opt. Call | 349 | ||||||||
| 53 | (d) | 0.000%, 1/01/66, 144A | No Opt. Call | 316 | ||||||||
| 693 | (d) | 0.000%, 1/01/67, 144A | No Opt. Call | 3,702 | ||||||||
| 5,455 | Public Finance Authority of Wisconsin, Health Care System Revenue Bonds, Cone Health, Series 2022A, 4.000%, 10/01/52 | 10/32 at 100.00 | 4,486,017 | |||||||||
| 2,545 | Wisconsin Health and Educational Facilities Authority, Revenue Bonds, Ascension Health Alliance Senior Credit Group, Series 2013B-1, 4.000%, 11/15/43 | 5/28 at 100.00 | 2,200,965 | |||||||||
| 10,715 | Wisconsin Health and Educational Facilities Authority, Revenue Bonds, Aspirus, Inc. Obligated Group, Inc. Project, Series 2021, 4.000%, 8/15/46 | 8/31 at 100.00 | 8,669,439 | |||||||||
| 5,810 | Wisconsin Health and Educational Facilities Authority, Revenue Bonds, Bellin Memorial Hospital Incorporated Series 2022B, 5.250%, 12/01/48 | 12/32 at 100.00 | 5,589,174 | |||||||||
| Wisconsin Health and Educational Facilities Authority, Revenue Bonds, PHW Muskego, Inc. Project, Series 2021: | ||||||||||||
| 1,690 | 4.000%, 10/01/41 | 10/28 at 102.00 | 1,246,587 | |||||||||
| 2,000 | 4.000%, 10/01/61 | 10/28 at 102.00 | 1,214,651 | |||||||||
| 10,225 | Wisconsin Health and Educational Facilities Authority, Wisconsin, Revenue Bonds, Ascension Health Alliance Senior Credit Group, Series 2016A, 4.500%, 11/15/39 | 5/26 at 100.00 | 9,649,087 | |||||||||
| 1,870 | Wisconsin Health and Educational Facilities Authority, Wisconsin, Revenue Bonds, Beloit Health System, Inc., Series 2016, 4.000%, 7/01/46 | 7/26 at 100.00 | 1,454,749 | |||||||||
| 4,220 | Wisconsin Health and Educational Facilities Authority, Wisconsin, Revenue Bonds, Children’s Hospital of Wisconsin, Inc., Series 2017, 4.000%, 8/15/42 | 8/27 at 100.00 | 3,600,436 | |||||||||
| Wisconsin Health and Educational Facilities Authority, Wisconsin, Revenue Bonds, Marshfield Clinic, Series 2016A: | ||||||||||||
| 11,440 | 5.000%, 2/15/42 | 2/26 at 100.00 | 10,546,008 | |||||||||
| 7,000 | 5.000%, 2/15/46 | 2/26 at 100.00 | 6,262,555 | |||||||||
| 1,525 | Wisconsin Health and Educational Facilities Authority, Wisconsin, Revenue Bonds, Oakwood Lutheran Senior Ministries, Series 2021, 4.000%, 1/01/57 | 1/27 at 103.00 | 804,266 | |||||||||
| 10,235 | Wisconsin Health and Educational Facilities Authority, Wisconsin, Revenue Bonds, Saint John’s Communities Inc., Refunding Series 2022A, 5.000%, 4/01/52 | 4/32 at 100.00 | 9,840,285 | |||||||||
| 11,270 | Wisconsin Health and Educational Facilities Authority, Wisconsin, Revenue Bonds, ThedaCare Inc, Series 2019, 4.000%, 12/15/49 | 12/29 at 100.00 | 8,912,813 | |||||||||
| Total Wisconsin | 79,622,938 | |||||||||||
| Total Municipal Bonds (cost $4,848,713,829) | 4,552,790,983 | |||||||||||
| NAD | Nuveen Quality Municipal Income Fund (continued) Portfolio of Investments October 31, 2023 |
Shares | Description (a) | Value | ||||||||||
INVESTMENT COMPANIES - 0.0% (0.0% of Total Investments) | ||||||||||||
| 8,812 | BlackRock MuniHoldings Fund Inc | $ | 89,177 | |||||||||
| 32,524 | Invesco Quality Municipal Income Trust | 265,396 | ||||||||||
| Total Investment Companies (cost $530,611) | 354,573 | |||||||||||
Total Long-Term Investments (cost $4,849,244,440) | 4,553,145,556 | |||||||||||
Principal Amount (000) | Description (a) | Optional Call Provisions (b) | Value | |||||||||
SHORT-TERM INVESTMENTS - 2.7% (1.6% of Total Investments) | ||||||||||||
MUNICIPAL BONDS - 2.7% (1.6% of Total Investments) | ||||||||||||
Colorado - 0.1% (0.1% of Total Investments) | ||||||||||||
| $ 2,000 | (h) | University of Colorado Hospital Authority, Colorado, Revenue Bonds, Variable Rate Series 2018B, 4.050%, 11/15/35, (Mandatory Put 11/7/2023) | 11/23 at 100.00 | $ | 2,000,000 | |||||||
| Total Colorado | 2,000,000 | |||||||||||
Iowa - 0.3% (0.2% of Total Investments) | ||||||||||||
| 8,265 | (h) | Iowa Finance Authority, Single Family Mortgage Revenue Bonds, Mortgage Backed Securities Program Variable Rate Series 2020E, 4.100%, 7/01/49, (Mandatory Put 10/13/2023) | 10/23 at 100.00 | 8,265,000 | ||||||||
| Total Iowa | 8,265,000 | |||||||||||
Missouri - 0.3% (0.2% of Total Investments) | ||||||||||||
| 6,750 | (h) | Missouri Health and Educational Facilities Authority, Revenue Bonds, BJC Health System, Variable Rate Demand Obligations, Series 2008C, 4.060%, 5/15/38, (Mandatory Put 11/7/2023) | 10/23 at 100.00 | 6,750,000 | ||||||||
| Total Missouri | 6,750,000 | |||||||||||
New York - 0.4% (0.2% of Total Investments) | ||||||||||||
| 10,000 | (h) | New York City Housing Development Corporation, New York, Multifamily Housing Revenue Bonds, Series 2018L-2, 4.060%, 5/01/50, (Mandatory Put 11/7/2023) | 10/23 at 100.00 | 10,000,000 | ||||||||
| Total New York | 10,000,000 | |||||||||||
Texas - 0.9% (0.5% of Total Investments) | ||||||||||||
| 25,000 | (h) | Harris County Cultural Education Facilities Finance Corporation, Texas, Hospital Revenue Bonds, Texas Children’s Hospital, Series 2015-3, 4.050%, 10/01/45, (Mandatory Put 11/7/2023) | No Opt. Call | 25,000,000 | ||||||||
| Total Texas | 25,000,000 | |||||||||||
Utah - 0.7% (0.4% of Total Investments) | ||||||||||||
| 20,000 | (h) | Utah County, Utah, Hospital Revenue Bonds, IHC Health Services Inc., Series 2018C, 3.900%, 5/15/58, (Mandatory Put 10/31/2023) | 10/23 at 100.00 | 20,000,000 | ||||||||
| Total Utah | 20,000,000 | |||||||||||
| Total Municipal Bonds (cost $72,015,000) | 72,015,000 | |||||||||||
Total Short-Term Investments (cost $72,015,000) | 72,015,000 | |||||||||||
Total Investments (cost $4,921,259,440) - 171.5% | 4,625,160,556 | |||||||||||
Floating Rate Obligations - (2.9)% | (78,400,000) | |||||||||||
AMTP Shares, Net- (27.0)%(i) | (727,262,648) | |||||||||||
MFP Shares, Net - (25.2)%(j) | (678,526,753) | |||||||||||
VRDP Shares, Net- (18.7)%(k) | (503,596,953) | |||||||||||
Other Assets & Liabilities, Net - 2.3% | 60,011,626 | |||||||||||
Net Assets Applicable to Common Shares - 100% | $ | 2,697,385,828 | ||||||||||
| (a) | All percentages shown in the Portfolio of Investments are based on net assets applicable to common shares unless otherwise noted. |
| (b) | Optional Call Provisions: Dates (month and year) and prices of the earliest optional call or redemption. There may be other call provisions at varying prices at later dates. Certain mortgage-backed securities may be subject to periodic principal paydowns. Optional Call Provisions are not covered by the report of independent registered public accounting firm. |
| (c) | Backed by an escrow or trust containing sufficient U.S. Government or U.S. Government agency securities, which ensure the timely payment of principal and interest. |
| (d) | Defaulted security. A security whose issuer has failed to fully pay principal and/or interest when due, or is under the protection of bankruptcy. |
| (e) | For fair value measurement disclosure purposes, investment classified as Level 3. |
| (f) | Step-up coupon bond, a bond with a coupon that increases (“steps up”), usually at regular intervals, while the bond is outstanding. The rate shown is the coupon as of the end of the reporting period. |
| (g) | Investment, or portion of investment, has been pledged to collateralize the net payment obligations for investments in inverse floating rate transactions. |
| (h) | Investment has a maturity of greater than one year, but has variable rate and/or demand features which qualify it as a short-term investment. The rate disclosed, as well as the reference rate and spread, where applicable, is that in effect as of the end of the reporting period. This rate changes periodically based on market conditions or a specified market index. |
| (i) | AMTP Shares, Net as a percentage of Total Investments is 15.7%. |
| (j) | MFP Shares, Net as a percentage of Total Investments is 14.7%. |
| (k) | VRDP Shares, Net as a percentage of Total Investments is 10.9%. |
| 144A | Investment is exempt from registration under Rule 144A of the Securities Act of 1933, as amended. These investments may only be resold in transactions exempt from registration, which are normally those transactions with qualified institutional buyers. |
| AMT | Alternative Minimum Tax |
| ETM | Escrowed to maturity |
| IF | Inverse floating rate security issued by a tender option bond (“TOB”) trust, the interest rate on which varies inversely with the Securities Industry Financial Markets Association (SIFMA) short-term rate, which resets weekly, or a similar short-term rate, and is reduced by the expenses related to the TOB trust. |
| UB | Underlying bond of an inverse floating rate trust reflected as a financing transaction. |
| WI/DD | When-issued or delayed delivery security. |
| NEA | Nuveen AMT-Free Quality Municipal Income Fund Portfolio of Investments October 31, 2023 |
Principal Amount (000) | Description (a) | Optional Call Provisions (b) | Value | |||||||||
LONG-TERM INVESTMENTS - 169.1% (99.0% of Total Investments) | ||||||||||||
MUNICIPAL BONDS - 169.1% (99.0% of Total Investments) | ||||||||||||
Alabama - 1.1% (0.6% of Total Investments) | ||||||||||||
| $ | 15,520 | Alabama Special Care Facilities Financing Authority, Revenue Bonds, Ascension Health, Series 2016B, 5.000%, 11/15/46 | 5/26 at 100.00 | $ | 14,820,065 | |||||||
| 5,920 | Autauga County Board of Education, Alabama, Special Tax Warrants, Series 2021, 4.000%, 4/01/51 | 10/31 at 100.00 | 4,761,383 | |||||||||
| 35 | Birmingham Airport Authority, Alabama, Airport Revenue Bonds, Series 2020, 4.000%, 7/01/35 - BAM Insured | 7/30 at 100.00 | 33,626 | |||||||||
| 4,250 | Infirmary Health System Special Care Facilities Financing Authority of Mobile, Alabama, Revenue Bonds, Infirmary Health System, Inc., Series 2016A, 5.000%, 2/01/41 | 2/26 at 100.00 | 3,936,756 | |||||||||
| 4,900 | Mobile Spring Hill College Educational Building Authority, Alabama, Revenue Bonds, Spring Hill College Project, Series 2015, 5.875%, 4/15/45 | 4/25 at 100.00 | 4,448,352 | |||||||||
| 2,410 | Pike Road, Alabama, General Obligation Warrants, Series 2023, 5.000%, 3/01/52 | 3/33 at 100.00 | 2,433,221 | |||||||||
| 1,000 | Southeast Energy Authority, Alabama, Commodity Supply Revenue Bonds, Project 3, Fixed Rate Series 2022A-1, 5.500%, 1/01/53, (Mandatory Put 12/01/29) | 9/29 at 100.10 | 1,015,347 | |||||||||
| 5,310 | Tuscaloosa County Industrial Development Authority, Alabama, Gulf Opportunity Zone Bonds, Hunt Refining Project, Refunding Series 2019A, 5.250%, 5/01/44, 144A | 5/29 at 100.00 | 4,376,493 | |||||||||
| Total Alabama | 35,825,243 | |||||||||||
Arizona - 1.9% (1.1% of Total Investments) | ||||||||||||
| 1,150 | Arizona Industrial Development Authority, Arizona, Education Revenue Bonds, Academies of Math & Science Projects, Series 2017A, 5.000%, 7/01/47 | 7/27 at 100.00 | 1,057,744 | |||||||||
| 7,115 | Lake Havasu City, Arizona, Wastewater System Revenue Bonds, Refunding Senior Lien Series 2015B, 5.000%, 7/01/43 - AGM Insured | 7/25 at 100.00 | 7,135,719 | |||||||||
| 1,315 | Maricopa County Industrial Development Authority, Arizona, Hospital Revenue Bonds, HonorHealth, Series 2019A, 5.000%, 9/01/42 | 9/28 at 100.00 | 1,286,385 | |||||||||
| 8,895 | Maricopa County Industrial Development Authority, Arizona, Hospital Revenue Bonds, HonorHealth, Series 2021A, 4.000%, 9/01/51 | 3/31 at 100.00 | 7,062,368 | |||||||||
| 5,135 | Maricopa County Industrial Development Authority, Arizona, Revenue Bonds, Banner Health, Refunding Series 2016A, 4.000%, 1/01/36 | 1/27 at 100.00 | 4,808,522 | |||||||||
| 3,130 | Maricopa County Industrial Development Authority, Arizona, Revenue Bonds, Banner Health, Series 2017D, 4.000%, 1/01/48 | 7/30 at 100.00 | 2,586,933 | |||||||||
| Phoenix Civic Improvement Corporation, Arizona, Airport Revenue Bonds, Junior Lien Series 2019A: | ||||||||||||
| 6,550 | 4.000%, 7/01/49 | 7/29 at 100.00 | 5,427,181 | |||||||||
| 1,500 | 5.000%, 7/01/49 | 7/29 at 100.00 | 1,453,640 | |||||||||
| Phoenix Civic Improvement Corporation, Arizona, Revenue Bonds, Civic Plaza Expansion Project, Series 2005B: | ||||||||||||
| 6,545 | 5.500%, 7/01/37 - FGIC Insured | No Opt. Call | 7,239,633 | |||||||||
| 10,000 | 5.500%, 7/01/40 - FGIC Insured | No Opt. Call | 10,864,436 | |||||||||
| 3,000 | Queen Creek, Arizona, Excise Tax & State Shared Revenue Obligation Bonds, Series 2018A, 5.000%, 8/01/47 | 8/28 at 100.00 | 3,032,576 | |||||||||
Principal Amount (000) | Description (a) | Optional Call Provisions (b) | Value | |||||||||
Arizona | ||||||||||||
| $ | 11,080 | Salt Verde Financial Corporation, Arizona, Senior Gas Revenue Bonds, Citigroup Energy Inc Prepay Contract Obligations, Series 2007, 5.000%, 12/01/37 | No Opt. Call | $ | 10,755,744 | |||||||
| Total Arizona | 62,710,881 | |||||||||||
California - 7.0% (4.1% of Total Investments) | �� | |||||||||||
| 3,335 | Alameda Corridor Transportation Authority, California, Revenue Bonds, Refunding Second Subordinate Lien Series 2022C, 5.000%, 10/01/52 - AGM Insured | 10/32 at 100.00 | 3,335,222 | |||||||||
| 22,880 | Alameda Corridor Transportation Authority, California, Revenue Bonds, Senior Lien Series 1999A, 0.000%, 10/01/32 - NPFG Insured | No Opt. Call | 15,281,648 | |||||||||
| 4,225 | Alameda Unified School District, Alameda County, California, General Obligation Bonds, Series 2005B, 0.000%, 8/01/28 - AGM Insured | No Opt. Call | 3,468,848 | |||||||||
| 3,450 | Antelope Valley Joint Union High School District, Los Angeles and Kern Counties, California, General Obligation Bonds, Series 2004B, 0.000%, 8/01/29 - NPFG Insured | No Opt. Call | 2,706,429 | |||||||||
| 10,000 | (c) | Bay Area Toll Authority, California, Revenue Bonds, San Francisco Bay Area Toll Bridge, Series 2014F-1, 5.000%, 4/01/54,(Pre-refunded 4/01/24) | 4/24 at 100.00 | 10,060,248 | ||||||||
| 8,000 | Beverly Hills Unified School District, Los Angeles County, California, General Obligation Bonds, 2008 Election Series 2009, 0.000%, 8/01/33 | No Opt. Call | 5,363,695 | |||||||||
| Burbank Unified School District, Los Angeles County, California, General Obligation Bonds, Election 2013, Series 2015A: | ||||||||||||
| 2,250 | (c) | 5.000%, 8/01/32, (Pre-refunded 2/01/25) | 2/25 at 100.00 | 2,286,036 | ||||||||
| 1,350 | (c) | 5.000%, 8/01/33, (Pre-refunded 2/01/25) | 2/25 at 100.00 | 1,371,622 | ||||||||
| 85 | California County Tobacco Securitization Agency, Tobacco Settlement Asset-Backed Bonds, Los Angeles County Securitization Corporation, Series 2020B-1, 5.000%, 6/01/49 | 6/30 at 100.00 | 81,562 | |||||||||
| California Educational Facilities Authority, Revenue Refunding Bonds, Loyola Marymount University, Series 2001A: | ||||||||||||
| 5,890 | 0.000%, 10/01/24 - NPFG Insured | No Opt. Call | 5,663,789 | |||||||||
| 7,615 | 0.000%, 10/01/25 - NPFG Insured | No Opt. Call | 7,010,357 | |||||||||
| 1,350 | 0.000%, 10/01/39 - NPFG Insured | No Opt. Call | 585,258 | |||||||||
| 1,500 | California Municipal Finance Authority, Revenue Bonds, Eisenhower Medical Center, Refunding Series 2017A, 5.000%, 7/01/42 | 7/27 at 100.00 | 1,397,740 | |||||||||
| 965 | California Public Finance Authority, Revenue Bonds, Henry Mayo Newhall Hospital, Series 2017, 5.000%, 10/15/47 | 10/26 at 100.00 | 878,908 | |||||||||
| 2,930 | (c) | California State Public Works Board, Lease Revenue Bonds, Various Capital Projects, Series 2013I, 5.000%, 11/01/38, (Pre-refunded 1/02/24) | 1/24 at 100.00 | 2,936,169 | ||||||||
| 5,000 | California State, General Obligation Bonds, Refunding Various Purpose Series 2017, 4.000%, 8/01/36 | 8/26 at 100.00 | 4,861,444 | |||||||||
| 5 | California State, General Obligation Bonds, Series 2004, 5.000%, 4/01/31 - AMBAC Insured | 12/23 at 100.00 | 5,004 | |||||||||
| 9,130 | California Statewide Communities Development Authority, California, Revenue Bonds, Loma Linda University Medical Center, Series 2016A, 5.250%, 12/01/56, 144A | 6/26 at 100.00 | 8,088,646 | |||||||||
| California Statewide Community Development Authority, Revenue Bonds, Daughters of Charity Health System, Series 2005A: | ||||||||||||
| 43 | (d),(e) | 5.750%, 7/01/30 | 1/22 at 100.00 | 42,821 | ||||||||
| 55 | (d),(e) | 5.750%, 7/01/35 | 1/22 at 100.00 | 54,969 | ||||||||
| 66 | (d),(e) | 5.500%, 7/01/39 | 1/22 at 100.00 | 65,962 | ||||||||
| 10,445 | Castaic Lake Water Agency, California, Certificates of Participation, Water System Improvement Project, Series 1999a, 0.000%, 8/01/29 - AMBAC Insured | No Opt. Call | 8,277,264 | |||||||||
| NEA | Nuveen AMT-Free Quality Municipal Income Fund (continued) Portfolio of Investments October 31, 2023 |
Principal Amount (000) | Description (a) | Optional Call Provisions (b) | Value | |||||||||
California | ||||||||||||
| $ | 4,775 | (c) | Clovis Unified School District, Fresno County, California, General Obligation Bonds, Series 2001A, 0.000%, 8/01/25 - FGIC Insured, (ETM) | No Opt. Call | $ | 4,462,630 | ||||||
| 7,775 | Foothill/Eastern Transportation Corridor Agency, California, Toll Road Revenue Bonds, Refunding Senior Lien Series 2015A, 0.000%, 1/15/34 - AGM Insured | No Opt. Call | 4,880,388 | |||||||||
| Foothill/Eastern Transportation Corridor Agency, California, Toll Road Revenue Bonds, Refunding Series 2013A: | ||||||||||||
| 910 | (f) | 0.000%, 1/15/42 | 1/31 at 100.00 | 1,025,270 | ||||||||
| 3,350 | (c) | 5.750%, 1/15/46, (Pre-refunded 1/15/24) | 1/24 at 100.00 | 3,363,617 | ||||||||
| 8,350 | (c) | 6.000%, 1/15/49, (Pre-refunded 1/15/24) | 1/24 at 100.00 | 8,387,583 | ||||||||
| 118,565 | Golden State Tobacco Securitization Corporation, California, Tobacco Settlement Asset-Backed Bonds, Capital Appreciation Series 2021B-2, 0.000%, 6/01/66 | 12/31 at 27.75 | 9,724,974 | |||||||||
| 5,000 | Huntington Beach Union High School District, Orange County, California, General Obligation Bonds, Series 2007, 0.000%, 8/01/32 - FGIC Insured | No Opt. Call | 3,437,314 | |||||||||
| 3,040 | Kern Community College District, California, General Obligation Bonds, Safety, Repair & Improvement, Election 2002 Series 2006, 0.000%, 11/01/23 - AGM Insured | No Opt. Call | 3,040,000 | |||||||||
| 1,500 | Lincoln Unified School District, Placer County, California, Special Tax Bonds, Community Facilities District 1, Series 2005, 0.000%, 9/01/26 - AMBAC Insured | No Opt. Call | 1,312,058 | |||||||||
| 995 | (c) | Los Angeles Department of Water and Power, California, Electric Plant Revenue Bonds, Series 1994, 5.375%, 2/15/34, (ETM) | 12/23 at 100.00 | 996,124 | ||||||||
| 2,490 | Madera Unified School District, Madera County, California, General Obligation Bonds, Election 2002 Series 2005, 0.000%, 8/01/27 - NPFG Insured | No Opt. Call | 2,120,732 | |||||||||
| 10,335 | (f) | Mount San Antonio Community College District, Los Angeles County, California, General Obligation Bonds, Election of 2008, Series 2013A, 0.000%, 8/01/43 | 8/35 at 100.00 | 8,999,916 | ||||||||
| 5,500 | M-S-R | No Opt. Call | 6,194,826 | |||||||||
| 120 | (c) | Mt. Diablo Hospital District, California, Insured Hospital Revenue Bonds, Series 1993A, 5.125%, 12/01/23 - AMBAC Insured, (ETM) | 10/21 at 100.00 | 120,109 | ||||||||
| 14,100 | New Haven Unified School District, California, General Obligation Bonds, Refunding Series 2009, 0.000%, 8/01/34 - AGC Insured | No Opt. Call | 8,719,699 | |||||||||
| 2,500 | Norwalk La Mirada Unified School District, Los Angeles County, California, General Obligation Bonds, Election 2002 Series 2005B, 0.000%, 8/01/29 | No Opt. Call | 1,958,975 | |||||||||
| 1,145 | Ontario Redevelopment Financing Authority, San Bernardino County, California, Revenue Bonds, Redevelopment Project 1, Refunding Series 1995, 7.400%, 8/01/25 - NPFG Insured | No Opt. Call | 1,173,472 | |||||||||
| Orange County Water District, California, Revenue Certificates of Participation, Series 2003B: | ||||||||||||
| 1,745 | (c) | 5.000%, 8/15/34, (Pre-refunded 8/15/32) - NPFG Insured | 8/32 at 100.00 | 1,927,616 | ||||||||
| 1,490 | (c) | 5.000%, 8/15/34 - NPFG Insured, (ETM) | 5/21 at 100.00 | 1,600,651 | ||||||||
| 1,000 | Pajaro Valley Unified School District, Santa Cruz County, California, General Obligation Bonds, Series 2005B, 0.000%, 8/01/29 - AGM Insured | No Opt. Call | 789,344 | |||||||||
| 2,000 | Palomar Pomerado Health, California, General Obligation Bonds, Capital Appreciation, Election of 2004, Series 2007A, 0.000%, 8/01/24 - NPFG Insured | No Opt. Call | 1,937,540 | |||||||||
| 9,320 | Palomar Pomerado Health, California, General Obligation Bonds, Series 2009A, 0.000%, 8/01/33 - AGC Insured | No Opt. Call | 6,014,747 | |||||||||
Principal Amount (000) | Description (a) | Optional Call Provisions (b) | Value | |||||||||
California | ||||||||||||
| $ | 1,800 | Rialto Unified School District, San Bernardino County, California, General Obligation Bonds, 2010 Election Series 2011A, 0.000%, 8/01/28 | No Opt. Call | $ | 1,481,293 | |||||||
| 4,080 | San Diego County Regional Airport Authority, California, Airport Revenue Bonds, Subordinate Series 2017A, 5.000%, 7/01/47 | 7/27 at 100.00 | 4,086,987 | |||||||||
| San Joaquin Hills Transportation Corridor Agency, Orange County, California, Toll Road Revenue Bonds, Refunding Senior Lien Series 2014A: | ||||||||||||
| 10,595 | (c) | 5.000%, 1/15/44, (Pre-refunded 1/15/25) | 1/25 at 100.00 | 10,764,824 | ||||||||
| 32,725 | (c) | 5.000%, 1/15/50, (Pre-refunded 1/15/25) | 1/25 at 100.00 | 33,249,539 | ||||||||
| 2,965 | San Juan Unified School District, Sacramento County, California, General Obligation Bonds, Series 2004A, 0.000%, 8/01/28 - NPFG Insured | No Opt. Call | 2,416,315 | |||||||||
| 4,005 | San Mateo Union High School District, San Mateo County, California, General Obligation Bonds, Election of 2000, Series 2002B, 0.000%, 9/01/26 - FGIC Insured | No Opt. Call | 3,579,019 | |||||||||
| 15,750 | San Ysidro School District, San Diego County, California, General Obligation Bonds, 1997 Election Series 2012G, 0.000%, 8/01/39 - AGM Insured | No Opt. Call | 7,053,562 | |||||||||
| San Ysidro School District, San Diego County, California, General Obligation Bonds, Refunding Series 2015: | ||||||||||||
| 5,000 | 0.000%, 8/01/46 | 8/25 at 32.80 | 1,462,264 | |||||||||
| 6,570 | 0.000%, 8/01/47 | 8/25 at 30.90 | 1,811,007 | |||||||||
| 2,630 | Union Elementary School District, Santa Clara County, California, General Obligation Bonds, Series 2001B, 0.000%, 9/01/25 - FGIC Insured | No Opt. Call | 2,447,555 | |||||||||
| Total California | 234,363,591 | |||||||||||
Colorado - 15.6% (9.1% of Total Investments) | ||||||||||||
| 1,845 | Aerotropolis Regional Transportation Authority, Colorado, Special Revenue Bonds, Series 2019, 5.000%, 12/01/51 | 12/24 at 102.00 | 1,508,068 | |||||||||
| 6,600 | Aerotropolis Regional Transportation Authority, Colorado, Special Revenue Bonds, Series 2021, 4.375%, 12/01/52 | 12/26 at 103.00 | 4,764,427 | |||||||||
| 2,500 | Arapahoe County Water and Wastewater Authority, Colorado, Revenue Bonds, Refunding Series 2019, 4.000%, 12/01/38 | 12/29 at 100.00 | 2,262,980 | |||||||||
| Arvada, Colorado, Water Enterprise Revenue Bonds, Series 2022: | ||||||||||||
| 1,610 | 4.000%, 12/01/48 | 12/32 at 100.00 | 1,346,293 | |||||||||
| 2,220 | 4.000%, 12/01/52 | 12/32 at 100.00 | 1,819,576 | |||||||||
| Aurora, Colorado, Sewer Improvement Revenue Bonds, Seam Facility and Other System Improvements Project, First Lien Series 2021: | ||||||||||||
| 3,315 | 4.000%, 8/01/46 | 8/31 at 100.00 | 2,746,689 | |||||||||
| 2,000 | 4.000%, 8/01/51 | 8/31 at 100.00 | 1,607,897 | |||||||||
| 9,000 | Boulder Valley School District RE2, Boulder County, Colorado, General Obligation Bonds, Series 2019A, 4.000%, 12/01/48 | 6/29 at 100.00 | 7,624,771 | |||||||||
| Brighton, Colorado, Water Activity Enterprise Revenue Bonds, Water System Project, Series 2022: | ||||||||||||
| 6,650 | 5.000%, 6/01/47 | 6/32 at 100.00 | 6,734,917 | |||||||||
| 4,430 | 5.000%, 6/01/52 | 6/32 at 100.00 | 4,459,110 | |||||||||
| 1,150 | Castle Oaks Metropolitan District 3, Castle Rock, Douglas County, Colorado, General Obligation Limited Tax Bonds, Refunding & Improvement Series 2020, 4.000%, 12/01/50 - AGM Insured | 12/30 at 100.00 | 914,158 | |||||||||
| 1,060 | Centerra Metropolitan District 1, Loveland, Colorado, Special Revenue Bonds, Improvement Series 2018, 5.250%, 12/01/48 | 12/23 at 103.00 | 912,276 | |||||||||
| Centerra Metropolitan District 1, Loveland, Colorado, Special Revenue Bonds, Refunding & Improvement Series 2017: | ||||||||||||
| 1,575 | 5.000%, 12/01/37, 144A | 12/23 at 102.00 | 1,415,802 | |||||||||
| NEA | Nuveen AMT-Free Quality Municipal Income Fund (continued) Portfolio of Investments October 31, 2023 |
Principal Amount (000) | Description (a) | Optional Call Provisions (b) | Value | |||||||||
Colorado | ||||||||||||
| $ | 3,620 | 5.000%, 12/01/47, 144A | 12/23 at 102.00 | $ | 3,028,807 | |||||||
| 1,250 | (c) | Central Platte Valley Metropolitan District, Colorado, General Obligation Bonds, Refunding Series 2013A, 5.375%, 12/01/33, (Pre-refunded 12/01/23) | 12/23 at 100.00 | 1,251,278 | ||||||||
| 115 | (c) | Central Platte Valley Metropolitan District, Colorado, General Obligation Bonds, Refunding Series 2014, 5.000%, 12/01/43, (Pre-refunded 12/01/23) | 12/23 at 100.00 | 115,065 | ||||||||
| 1,700 | Colorado Educational and Cultural Facilities Authority, Charter School Revenue Bonds, Skyview Academy Project, Series 2014, 5.375%, 7/01/44, 144A | 7/24 at 100.00 | 1,556,172 | |||||||||
| Colorado Health Facilities Authority, Colorado, Health Facilities Revenue Bonds, The Evangelical Lutheran Good Samaritan Society Project, Refunding Series 2017: | ||||||||||||
| 2,005 | (c) | 5.000%, 6/01/34, (Pre-refunded 6/01/27) | 6/27 at 100.00 | 2,079,230 | ||||||||
| 4,615 | (c) | 5.000%, 6/01/35, (Pre-refunded 6/01/27) | 6/27 at 100.00 | 4,785,859 | ||||||||
| 7,205 | (c) | 5.000%, 6/01/36, (Pre-refunded 6/01/27) | 6/27 at 100.00 | 7,471,747 | ||||||||
| 8,715 | (c) | 5.000%, 6/01/37, (Pre-refunded 6/01/27) | 6/27 at 100.00 | 9,037,651 | ||||||||
| 4,105 | (c) | 5.000%, 6/01/42, (Pre-refunded 6/01/27) | 6/27 at 100.00 | 4,256,978 | ||||||||
| 8,545 | (c) | 5.000%, 6/01/47, (Pre-refunded 6/01/27) | 6/27 at 100.00 | 8,861,357 | ||||||||
| Colorado Health Facilities Authority, Colorado, Revenue Bonds, AdventHealth Obligated Group, Series 2021A: | ||||||||||||
| 10,575 | 4.000%, 11/15/46 | 11/31 at 100.00 | 8,879,271 | |||||||||
| 33,390 | 4.000%, 11/15/50 | 11/31 at 100.00 | 27,252,584 | |||||||||
| 3,000 | Colorado Health Facilities Authority, Colorado, Revenue Bonds, Adventist Health System/Sunbelt Obligated Group, Series 2018A, 5.000%, 11/15/48 | 5/28 at 100.00 | 2,916,119 | |||||||||
| 5,000 | (c) | Colorado Health Facilities Authority, Colorado, Revenue Bonds, Children’s Hospital Colorado Project, Series 2013A, 5.000%, 12/01/36, (Pre-refunded 12/01/23) | 12/23 at 100.00 | 5,000,354 | ||||||||
| Colorado Health Facilities Authority, Colorado, Revenue Bonds, Christian Living Neighborhoods Project, Refunding Series 2016: | ||||||||||||
| 1,000 | 5.000%, 1/01/31 | 1/24 at 102.00 | 955,822 | |||||||||
| 4,290 | 5.000%, 1/01/37 | 1/24 at 102.00 | 3,884,837 | |||||||||
| Colorado Health Facilities Authority, Colorado, Revenue Bonds, CommonSpirit Health, Series 2019A-2: | ||||||||||||
| 21,340 | 5.000%, 8/01/44 | 8/29 at 100.00 | 20,177,391 | |||||||||
| 28,740 | 4.000%, 8/01/49 | 8/29 at 100.00 | 22,232,416 | |||||||||
| 3,410 | Colorado Health Facilities Authority, Colorado, Revenue Bonds, CommonSpirit Health, Series 2022A, 5.500%, 11/01/47 | 11/32 at 100.00 | 3,384,690 | |||||||||
| 4,600 | Colorado Health Facilities Authority, Colorado, Revenue Bonds, Covenant Living Communities & Services, Series 2020A, 4.000%, 12/01/50 | 12/27 at 103.00 | 3,291,999 | |||||||||
| 750 | Colorado Health Facilities Authority, Colorado, Revenue Bonds, Frasier Meadows Project, Refunding & Improvement Series 2017A, 5.250%, 5/15/37 | 5/27 at 100.00 | 703,633 | |||||||||
| 1,500 | Colorado Health Facilities Authority, Colorado, Revenue Bonds, Parkview Medical Center, Refunding Series 2015B, 4.000%, 9/01/34 | 9/25 at 100.00 | 1,361,194 | |||||||||
| Colorado Health Facilities Authority, Colorado, Revenue Bonds, Parkview Medical Center, Series 2020A: | ||||||||||||
| 7,080 | 4.000%, 9/01/45 | 9/30 at 100.00 | 5,575,365 | |||||||||
| 3,000 | 4.000%, 9/01/50 | 9/30 at 100.00 | 2,261,497 | |||||||||
| 4,000 | Colorado Health Facilities Authority, Colorado, Revenue Bonds, Sanford Health, Series 2019A, 4.000%, 11/01/39 | 11/29 at 100.00 | 3,519,688 | |||||||||
Principal Amount (000) | Description (a) | Optional Call Provisions (b) | Value | |||||||||
Colorado | ||||||||||||
| $ | 3,300 | Colorado Health Facilities Authority, Colorado, Revenue Bonds, SCL Health System, Refunding Series 2019A, 4.000%, 1/01/38 | 1/30 at 100.00 | $ | 3,001,078 | |||||||
| 5,000 | Colorado Health Facilities Authority, Colorado, Revenue Bonds, SCL Health System, Refunding Series 2019B, 4.000%, 1/01/40 | 1/30 at 100.00 | 4,441,218 | |||||||||
| 4,150 | Colorado High Performance Transportation Enterprise, C-470 Express Lanes Revenue Bonds, Senior Lien Series 2017, 5.000%, 12/31/56 | 12/24 at 100.00 | 3,736,074 | |||||||||
| Colorado International Center Metropolitan District 14, Denver, Colorado, Limited Tax General Obligation Bonds, Refunding & Improvement Series 2018: | ||||||||||||
| 1,895 | 5.625%, 12/01/32 | 12/23 at 103.00 | 1,798,521 | |||||||||
| 2,660 | 5.875%, 12/01/46 | 12/23 at 103.00 | 2,390,936 | |||||||||
| 2,000 | Colorado School of Mines Board of Trustees, Golden, Colorado, Institutional Enterprise Revenue Bonds, Green Series 2023C, 5.250%, 12/01/53, (WI/DD) | 12/33 at 100.00 | 2,018,389 | |||||||||
| 2,000 | Colorado School of Mines Board of Trustees, Golden, Colorado, Institutional Enterprise Revenue Bonds, Series 2017B, 5.000%, 12/01/42 | 12/27 at 100.00 | 2,004,605 | |||||||||
| 1,500 | (c) | Colorado State Board of Governors, Colorado State University Auxiliary Enterprise System Revenue Bonds, Refunding Series 2016B, 5.000%, 3/01/41, (Pre-refunded 3/01/27) | 3/27 at 100.00 | 1,562,945 | ||||||||
| 6,000 | Colorado State Board of Governors, Colorado State University Auxiliary Enterprise System Revenue Bonds, Refunding Series 2017E, 4.000%, 3/01/43 | 3/28 at 100.00 | 5,226,643 | |||||||||
| 7,000 | Colorado State, Building Excellent Schools Today, Certificates of Participation, Series 2019O, 4.000%, 3/15/44 | 3/29 at 100.00 | 5,996,971 | |||||||||
| 2,550 | Colorado State, Certificates of Participation, Lease Purchase Agreement Department of Transportation Second Amended & Restated Headquaters Facilities, Refunding Series 2020, 4.000%, 6/15/41 | 6/30 at 100.00 | 2,250,912 | |||||||||
| 5,000 | Colorado State, Certificates of Participation, Rural Series 2018A, 4.000%, 12/15/35 | 12/28 at 100.00 | 4,802,482 | |||||||||
| Commerce City, Colorado, Sales and Use Tax Revenue Bonds, Series 2016: | ||||||||||||
| 7,115 | (c) | 5.000%, 8/01/41, (Pre-refunded 8/01/26) | 8/26 at 100.00 | 7,336,706 | ||||||||
| 1,000 | (c) | 5.000%, 8/01/46, (Pre-refunded 8/01/26) | 8/26 at 100.00 | 1,031,161 | ||||||||
| 1,250 | Copper Ridge Metropolitan District, Colorado Springs, Colorado, Tax Increment and Sales Tax Supported Revenue Bonds, Series 2019, 5.000%, 12/01/39 | 12/24 at 103.00 | 1,082,973 | |||||||||
| Denver City and County, Colorado, Airport System Revenue Bonds, Series 2022B: | ||||||||||||
| 2,930 | 5.000%, 11/15/47 | 11/32 at 100.00 | 2,960,445 | |||||||||
| 6,700 | 5.250%, 11/15/53 | 11/32 at 100.00 | 6,868,722 | |||||||||
| 12,900 | Denver City and County, Colorado, Airport System Revenue Bonds, Subordinate Lien Series 2013B, 5.000%, 11/15/43 | 12/23 at 100.00 | 12,735,691 | |||||||||
| Denver City and County, Colorado, Airport System Revenue Bonds, Subordinate Lien Series 2018B: | ||||||||||||
| 5,000 | 5.000%, 12/01/43 | 12/28 at 100.00 | 4,936,125 | |||||||||
| 2,500 | 5.000%, 12/01/48 | 12/28 at 100.00 | 2,447,425 | |||||||||
| 6,500 | Denver City and County, Colorado, Dedicated Tax Revenue Bonds, Current Interest Series 2018A-1, 5.000%, 8/01/48 | 8/26 at 100.00 | 6,522,195 | |||||||||
| 5,000 | Denver City and County, Colorado, Dedicated Tax Revenue Bonds, Series 2021A, 4.000%, 8/01/51 | 8/31 at 100.00 | 4,094,023 | |||||||||
| NEA | Nuveen AMT-Free Quality Municipal Income Fund (continued) Portfolio of Investments October 31, 2023 |
Principal Amount (000) | Description (a) | Optional Call Provisions (b) | Value | |||||||||
Colorado | ||||||||||||
| Denver Convention Center Hotel Authority, Colorado, Revenue Bonds, Convention Center Hotel, Refunding Senior Lien Series 2016: | ||||||||||||
| $ | 5,120 | 5.000%, 12/01/32 | 12/26 at 100.00 | $ | 5,060,704 | |||||||
| 2,935 | 5.000%, 12/01/35 | 12/26 at 100.00 | 2,835,297 | |||||||||
| 1,800 | 5.000%, 12/01/40 | 12/26 at 100.00 | 1,633,690 | |||||||||
| 345 | Denver Urban Renewal Authority, Colorado, Tax Increment Revenue Bonds, 9th and Colorado Urban Redevelopement Area, Series 2018A, 5.250%, 12/01/39, 144A | 12/23 at 103.00 | 329,477 | |||||||||
| 1,500 | DIATC Metropolitan District, Commerce City, Adams County, Colorado, General Obligation Limited Tax Bonds, Refunding & Improvement Series 2019, 5.000%, 12/01/49, 144A | 9/24 at 103.00 | 1,258,498 | |||||||||
E-470 Public Highway Authority, Colorado, Senior Revenue Bonds, Series 2000B: | ||||||||||||
| 45,540 | 0.000%, 9/01/30 - NPFG Insured | No Opt. Call | 33,897,890 | |||||||||
| 16,635 | 0.000%, 9/01/32 - NPFG Insured | No Opt. Call | 11,249,339 | |||||||||
| 49,250 | 0.000%, 9/01/33 - NPFG Insured | No Opt. Call | 31,680,664 | |||||||||
E-470 Public Highway Authority, Colorado, Toll Revenue Bonds, Series 2004A: | ||||||||||||
| 9,310 | 0.000%, 9/01/28 - NPFG Insured | No Opt. Call | 7,596,875 | |||||||||
| 2,900 | 0.000%, 9/01/34 - NPFG Insured | No Opt. Call | 1,770,526 | |||||||||
| 18,500 | 0.000%, 3/01/36 - NPFG Insured | No Opt. Call | 10,292,266 | |||||||||
| 5,950 | Falcon Area Water and Wastewater Authority (El Paso County, Colorado), Tap Fee Revenue Bonds, Series 2022A, 6.750%, 12/01/34, 144A | 9/27 at 103.00 | 5,523,540 | |||||||||
| 3,850 | Firestone, Colorado, Water Enterprise Revenue Bones, Series 2020, 4.000%, 12/01/49 - BAM Insured | 12/30 at 100.00 | 3,072,484 | |||||||||
| 10,650 | Gunnison Watershed School District RE1J, Gunnison and Saguache Counties, Colorado, General Obligation Bonds, Series 2023, 5.000%, 12/01/47 | 12/32 at 100.00 | 10,829,707 | |||||||||
| Johnstown, Colorado, Wastewater Revenue Bonds, Series 2021: | ||||||||||||
| 5,700 | 4.000%, 12/01/46 - AGM Insured | 12/31 at 100.00 | 4,681,852 | |||||||||
| 1,440 | 4.000%, 12/01/51 - AGM Insured | 12/31 at 100.00 | 1,142,519 | |||||||||
| 2,000 | Leyden Rock Metropolitan District, Arvada, Jefferson County, Colorado, General Obligation Limited Tax Bonds, Convertible to Unlimited Tax, Refunding & Improvement Series 2021, 4.000%, 12/01/51 - AGM Insured | 12/31 at 100.00 | 1,586,832 | |||||||||
| 1,000 | Lorson Ranch Metropolitan District 2, El Paso County, Colorado, Limited Tax General Obligation Bonds, Series 2016, 5.000%, 12/01/36 | 12/26 at 100.00 | 994,994 | |||||||||
| 1,000 | Louisville, Boulder County, Colorado, General Obligation Bonds, Limited Tax, Series 2017, 4.000%, 12/01/36 | 12/26 at 100.00 | 943,409 | |||||||||
| 1,730 | Meridian Ranch Metropolitan District 2018, Subdistrict, El Paso County, Colorado, General Obligation Limited Tax Bonds, Series 2022, 6.750%, 12/01/52 | 12/27 at 103.00 | 1,567,785 | |||||||||
| 1,230 | North Pine Vistas Metropolitan District 3, Castle Pines, Douglas County, Colorado, Limited Tax General Obligation Bonds, Refunding & Improvement Senior Series 2021A, 4.000%, 12/01/51 - AGM Insured | 12/31 at 100.00 | 960,026 | |||||||||
| 1,085 | North Range Metropolitan District 2, Adams County, Colorado , Limited Tax General Obligation Bonds, Refunding Special Revenue & Improvement Series 2017A, 5.750%, 12/01/47 | 12/23 at 102.00 | 1,031,430 | |||||||||
| 5,000 | Northern Colorado Water Conservancy District Building Corporation, Certificates of Participation, Refunding Series 2021, 4.000%, 7/01/51 | 7/31 at 100.00 | 4,082,065 | |||||||||
| Northern Colorado Water Conservancy District, Certificates of Participation, Series 2022: | ||||||||||||
| 2,325 | 5.000%, 7/01/42 | 7/31 at 100.00 | 2,367,174 | |||||||||
Principal Amount (000) | Description (a) | Optional Call Provisions (b) | Value | |||||||||
Colorado | ||||||||||||
| $ 16,320 | Park Creek Metropolitan District, Colorado, Senior Limited Property Tax Supported Revenue Bonds, Refunding Series 2015A, 5.000%, 12/01/45 | 12/25 at 100.00 | $ | 15,730,239 | ||||||||
| 3,680 | Park Creek Metropolitan District, Colorado, Senior Limited Property Tax Supported Revenue Bonds, Series 2017A, 5.000%, 12/01/46 | 12/25 at 100.00 | 3,513,302 | |||||||||
| 4,055 | Park Creek Metropolitan District, Colorado, Senior Limited Property Tax Supported Revenue Bonds, Series 2019A, 4.000%, 12/01/39 - AGM Insured | 12/29 at 100.00 | 3,554,467 | |||||||||
| 3,000 | Parker Water and Sanitation District, Douglas County, Colorado, Water and Sewer Enterprise Revenue Bonds, Refunding & Improvement Series 2022, 4.000%, 11/01/47 | 11/32 at 100.00 | 2,518,732 | |||||||||
| 6,065 | Platte River Metropolitan District, Weld County, Colorado, General Obligation Bonds, Limited Tax Refunding Series 2023A, 6.500%, 8/01/53, 144A, (WI/DD) | 8/29 at 103.00 | 5,701,258 | |||||||||
| 600 | Pueblo Urban Renewal Authority, Colorado, Tax Increment Revenue Bonds, EVRAZ Project, Series 2021A, 4.750%, 12/01/45, 144A | 12/30 at 100.00 | 408,000 | |||||||||
| Rampart Range Metropolitan District 1, Lone Tree, Colorado, Limited Tax Supported and Special Revenue Bonds, Refunding & Improvement Series 2017: | ||||||||||||
| 9,865 | 5.000%, 12/01/42 | 12/27 at 100.00 | 9,914,271 | |||||||||
| 3,600 | 5.000%, 12/01/47 | 12/27 at 100.00 | 3,580,723 | |||||||||
| 2,350 | Roaring Fork Transporation Authority, Colorado, Property Tax Revenue Bonds, Series 2021A, 4.000%, 12/01/46 | 12/31 at 100.00 | 1,979,395 | |||||||||
| 850 | Sierra Ridge Metropolitan District 2, Douglas County, Colorado, Limited Tax General Obligation Bonds, Refunding Bonds, Series 2022, 5.000%, 12/01/52 - AGM Insured | 12/32 at 100.00 | 824,568 | |||||||||
| 1,000 | Sky Ranch Community Authority Board (Arapahoe County, Colorado), Limited Tax Supported District No. 3 Senior Bonds (Tax-Exempt Fixed Rate), Series 2022A and Subordinate Bonds(Tax-Exempt Fixed Rate), Series 2022B(3), 5.750%, 12/01/52, 144A | 9/27 at 103.00 | 856,447 | |||||||||
| 1,625 | South Maryland Creek Ranch Metropolitan District, Summitt County, Colorado, Limited Tax General Obligation Bonds, Limited Tax Convertible to Unlimited Tax Series 2018A, 5.625%, 12/01/47 | 12/23 at 103.00 | 1,675,713 | |||||||||
| 1,000 | STC Metropolitan District 2, Superior, Boulder County, Colorado, Limited Tax General Obligation and Special Revenue Bonds, Refunding & improvement Series 2019A, 5.000%, 12/01/49 | 12/24 at 103.00 | 819,229 | |||||||||
| 3,250 | Thompson Crossing Metropolitan District 2, Johnstown, Larimer County, Colorado, General Obligation Bonds, Limited Tax Convertible to Unlimited Tax, Series 2016B, 5.000%, 12/01/46 - AGM Insured | 12/26 at 100.00 | 3,275,633 | |||||||||
| Thompson Crossing Metropolitan District 6, Larimer County, Colorado, General Obligation Limited Tax Bonds, Refunding & Improvement Convertible to Unlimited Tax Series 2020: | ||||||||||||
| 760 | 3.000%, 12/01/30, 144A | No Opt. Call | 612,930 | |||||||||
| 1,300 | 5.000%, 12/01/44, 144A | 12/30 at 100.00 | 1,122,411 | |||||||||
| 995 | Transport Metropolitan District 3, In the City of Aurora, Adams County, Colorado, General Obligation Limited Bonds, Series 2021A-1, 5.000%, 12/01/51 | 3/26 at 103.00 | 721,469 | |||||||||
| 1,000 | Triview Metropolitan District, El Paso County, Colorado, Water and Wastewater Enterprise Revenue Bonds, Green Series 2020, 3.250%, 12/01/45 - BAM Insured | 12/28 at 100.00 | 719,051 | |||||||||
| 2,500 | University of Colorado, Enterprise System Revenue Bonds, Refunding Green Series 2021A, 4.000%, 6/01/46 | 6/31 at 100.00 | 2,157,224 | |||||||||
| 14,500 | (c) | University of Colorado, Enterprise System Revenue Bonds, Series 2014A, 5.000%, 6/01/46, (Pre-refunded 6/01/24) | 6/24 at 100.00 | 14,590,307 | ||||||||
| NEA | Nuveen AMT-Free Quality Municipal Income Fund (continued) Portfolio of Investments October 31, 2023 |
Principal Amount (000) | Description (a) | Optional Call Provisions (b) | Value | |||||||||
Colorado | ||||||||||||
| $ | 2,500 | Vista Ridge Metropolitan District, In the Town of Erie, Weld County, Colorado, General Obligation Refunding Bonds, Series 2016A, 4.000%, 12/01/36 - BAM Insured | 12/26 at 100.00 | $ | 2,358,307 | |||||||
| 5,000 | Weld County School District 6, Greeley, Colorado, General Obligation Bonds, Series 2020, 5.000%, 12/01/44 | 12/29 at 100.00 | 5,090,988 | |||||||||
| 2,175 | Weld County School District RE1, Colorado, General Obligation Bonds, Series 2017, 5.000%, 12/15/30 | 12/26 at 100.00 | 2,241,977 | |||||||||
| 7,810 | West Globeville Metropolitan District 1, Denver, Colorado, General Obligation Limited Tax Bonds, Series 2022, 6.750%, 12/01/52 | 12/29 at 103.00 | 6,752,575 | |||||||||
| 1,785 | West Meadow Metropolitan District, Town of Fraser, Grand County, Colorado, Limited Tax General Obligation Bonds, Senior Series 2023A, 6.500%, 12/01/50, 144A | 12/28 at 103.00 | 1,734,026 | |||||||||
| 500 | Westerly Metropolitan District 4, Weld County, Colorado, General Obligation Limited Tax Bonds, Series 2021A-1, 5.000%, 12/01/50 | 3/26 at 103.00 | 392,332 | |||||||||
| Total Colorado | 520,438,825 | |||||||||||
Connecticut - 0.8% (0.5% of Total Investments) | ||||||||||||
| 1,650 | Connecticut Health and Educational Facilities Authority, Revenue Bonds, Fairfield University, Series 2016Q-1, 5.000%, 7/01/46 | 7/26 at 100.00 | 1,604,198 | |||||||||
| 6,000 | Connecticut Health and Educational Facilities Authority, Revenue Bonds, Hartford HealthCare Issue, Series 2021A, 4.000%, 7/01/51 | 7/31 at 100.00 | 4,718,415 | |||||||||
| 2,800 | Connecticut Health and Educational Facilities Authority, Revenue Bonds, McLean Affiliates, Series 2020A, 5.000%, 1/01/55, 144A | 1/26 at 102.00 | 2,087,439 | |||||||||
| 7,165 | Connecticut Health and Educational Facilities Authority, Revenue Bonds, Quinnipiac University, Refunding Series 2015L, 5.000%, 7/01/45 | 7/25 at 100.00 | 6,985,103 | |||||||||
| Connecticut Health and Educational Facilities Authority, Revenue Bonds, Sacred Heart University, Series 2017I-1: | ||||||||||||
| 500 | 5.000%, 7/01/34 | 7/27 at 100.00 | 508,934 | |||||||||
| 2,425 | 5.000%, 7/01/42 | 7/27 at 100.00 | 2,364,273 | |||||||||
| 7,500 | Connecticut State, Special Tax Obligation Bonds, Transportation Infrastructure Purposes, Series 2020A, 5.000%, 5/01/37 | 5/30 at 100.00 | 7,824,776 | |||||||||
| Total Connecticut | 26,093,138 | |||||||||||
Delaware - 0.3% (0.2% of Total Investments) | ||||||||||||
| 1,000 | Delaware Health Facilities Authroity, Revenue Bonds, Beebe Medical Center Project, Series 2018, 5.000%, 6/01/48 | 12/28 at 100.00 | 904,329 | |||||||||
| 9,070 | Delaware Transportation Authority, Revenue Bonds, US 301 Project, Series 2015, 5.000%, 6/01/55 | 6/25 at 100.00 | 8,940,045 | |||||||||
| Total Delaware | 9,844,374 | |||||||||||
District of Columbia - 3.6% (2.1% of Total Investments) | ||||||||||||
| 1,250 | District of Columbia Student Dormitory Revenue Bonds, Provident Group - Howard Properties LLC Issue, Series 2013, 5.000%, 10/01/45 | 11/23 at 100.00 | 1,075,485 | |||||||||
| 107,000 | District of Columbia Tobacco Settlement Corporation, Tobacco Settlement Asset-Backed Bonds, Series 2006A, 0.000%, 6/15/46 | 12/23 at 24.98 | 22,963,965 | |||||||||
| 5,000 | District of Columbia, General Obligation Bonds, Series 2021D, 4.000%, 2/01/46 | 2/31 at 100.00 | 4,302,150 | |||||||||
| District of Columbia, Revenue Bonds, Georgetown University, Refunding Series 2017: | ||||||||||||
| 3,500 | 5.000%, 4/01/35 | 4/27 at 100.00 | 3,542,453 | |||||||||
| 3,440 | 5.000%, 4/01/36 | 4/27 at 100.00 | 3,465,877 | |||||||||
| 60 | (c) | 5.000%, 4/01/36, (Pre-refunded 4/01/27) | 4/27 at 100.00 | 62,394 | ||||||||
Principal Amount (000) | Description (a) | Optional Call Provisions (b) | Value | |||||||||
District of Columbia | ||||||||||||
| �� | Metropolitan Washington Airports Authority, District of Columbia, Dulles Toll Road Revenue Bonds, Dulles Metrorail & Capital improvement Projects, Refunding & Subordinate Lien Series 2019B: | |||||||||||
| $ 12,455 | 4.000%, 10/01/44 | 10/29 at 100.00 | $ | 10,190,104 | ||||||||
| 4,750 | 5.000%, 10/01/47 | 10/29 at 100.00 | 4,474,269 | |||||||||
| 13,710 | 4.000%, 10/01/49 | 10/29 at 100.00 | 10,745,158 | |||||||||
| 7,000 | Metropolitan Washington Airports Authority, District of Columbia, Dulles Toll Road Revenue Bonds, Dulles Metrorail & Capital improvement Projects, Second Senior Lien Series 2009B, 0.000%, 10/01/36 - AGC Insured | No Opt. Call | 3,676,860 | |||||||||
| 32,000 | (c) | Metropolitan Washington Airports Authority, District of Columbia, Dulles Toll Road Revenue Bonds, Dulles Metrorail & Capital improvement Projects, Second Senior Lien Series 2009C, 6.500%, 10/01/41, (Pre- refunded 10/01/26) - AGC Insured | 10/26 at 100.00 | 34,343,450 | ||||||||
| 18,000 | Metropolitan Washington Airports Authority, District of Columbia, Dulles Toll Road Revenue Bonds, Dulles Metrorail Capital Appreciation, Second Senior Lien Series 2010B, 6.500%, 10/01/44 | 10/28 at 100.00 | 18,994,255 | |||||||||
| 3,000 | Washington Metropolitan Area Transit Authority, District of Columbia, Gross Revenue Bonds, Series 2018, 5.000%, 7/01/43 | 7/27 at 100.00 | 2,975,472 | |||||||||
| Total District of Columbia | 120,811,892 | |||||||||||
Florida - 7.9% (4.6% of Total Investments) | ||||||||||||
| 2,800 | Bay County, Florida, Educational Facilities Revenue Refunding Bonds, Bay Haven Charter Academy, Inc. Project, Series 2016, 5.000%, 9/01/46 | 12/23 at 100.00 | 2,625,435 | |||||||||
| 2,830 | City of Miami Beach, Florida, Stormwater Revenue Bonds, Series 2015, 5.000%, 9/01/41 | 9/25 at 100.00 | 2,841,422 | |||||||||
| 5,810 | Collier County, Florida, Tourist Development Tax Revenue Bonds, Series 2018, 4.000%, 10/01/43 | 10/28 at 100.00 | 4,957,213 | |||||||||
| 530 | Florida Development Finance Corporation, Educational Facilities Revenue Bonds, Renaissance Charter School, Inc. Projects, Series 2020C, 5.000%, 9/15/50, 144A | 9/27 at 100.00 | 401,852 | |||||||||
| Florida Municipal Loan Council, Revenue Bonds, Series 2000B: | ||||||||||||
| 1,040 | 0.000%, 11/01/25 - NPFG Insured | No Opt. Call | 941,496 | |||||||||
| 1,590 | 0.000%, 11/01/26 - NPFG Insured | No Opt. Call | 1,370,760 | |||||||||
| 2,000 | Fort Myers, Florida, Utility System Revenue Bonds, Refunding Series 2019A, 4.000%, 10/01/49 | 10/28 at 100.00 | 1,639,631 | |||||||||
| 15,000 | (g) | Hillsborough County Aviation Authority, Florida, Revenue Bonds, Tampa International Airport, Series 2018F, 5.000%, 10/01/48, (UB) | 10/28 at 100.00 | 14,998,952 | ||||||||
| Hillsborough County Aviation Authority, Florida, Revenue Bonds, Tampa International Airport, Subordinate Lien Series 2015B: | ||||||||||||
| 5,730 | (c) | 5.000%, 10/01/40, (Pre-refunded 10/01/24) | 10/24 at 100.00 | 5,786,889 | ||||||||
| 12,885 | (c) | 5.000%, 10/01/44, (Pre-refunded 10/01/24) | 10/24 at 100.00 | 13,012,926 | ||||||||
| 13,480 | Hillsborough County Industrial Development Authority, Florida, Hospital Revenue Bonds, Florida Health Sciences Center Inc D/B/A Tampa General Hospital, Series 2020A, 4.000%, 8/01/50 | 2/31 at 100.00 | 10,578,148 | |||||||||
| 5,060 | Hollywood, Florida, General Obligation Bonds, Series 2022, 5.000%, 7/01/47 | 7/32 at 100.00 | 5,033,205 | |||||||||
| 2,500 | Lakeland, Florida, Hospital System Revenue Bonds, Lakeland Regional Health, Series 2015, 5.000%, 11/15/45 | 11/24 at 100.00 | 2,342,254 | |||||||||
| Miami Beach Redevelopment Agency, Florida, Tax Increment Revenue Bonds, City Center/Historic Convention Village, Series 2015A: | ||||||||||||
| 3,810 | 5.000%, 2/01/40 - AGM Insured | 2/24 at 100.00 | 3,811,444 | |||||||||
| 19,145 | 5.000%, 2/01/44 - AGM Insured | 2/24 at 100.00 | 19,145,622 | |||||||||
| NEA | Nuveen AMT-Free Quality Municipal Income Fund (continued) Portfolio of Investments October 31, 2023 |
Principal Amount (000) | Description (a) | Optional Call Provisions (b) | Value | |||||||||
Florida | ||||||||||||
| Miami Health Facilities Authority, Florida, Health Facilities Revenue Bonds, Miami Jewish Health System Inc. Project, Series 2017: | ||||||||||||
| $ 205 | 5.000%, 7/01/32 | 7/27 at 100.00 | $ | 176,546 | ||||||||
| 5,035 | 5.125%, 7/01/46 | 7/27 at 100.00 | 3,771,886 | |||||||||
| 7,390 | Miami-Dade County Educational Facilities Authority, Florida, Revenue Bonds, University of Miami, Series 2015A, 5.000%, 4/01/45 | 4/25 at 100.00 | 7,149,180 | |||||||||
| 27,470 | Miami-Dade County Educational Facilities Authority, Florida, Revenue Bonds, University of Miami, Series 2018A, 5.000%, 4/01/53 | 4/28 at 100.00 | 25,841,359 | |||||||||
| 10,000 | Miami-Dade County Expressway Authority, Florida, Toll System Revenue Bonds, Series 2010A, 5.000%, 7/01/35 | 12/23 at 100.00 | 10,003,084 | |||||||||
| 5,560 | Miami-Dade County Health Facility Authority, Florida, Hospital Revenue Bonds, Nicklaus Children’s Hospital Project, Refunding Series 2021A, 4.000%, 8/01/51 | 8/31 at 100.00 | 4,457,216 | |||||||||
| 3,000 | Miami-Dade County Industrual Development Authority, Florida, Revenue Bonds, Doral Academy, Seres 2018, 5.000%, 1/15/48 | 1/28 at 100.00 | 2,525,168 | |||||||||
| 7,000 | Miami-Dade County School District, Florida, General Obligation Bonds, School Series 2022A, 5.000%, 3/15/52 - BAM Insured | 3/32 at 100.00 | 7,031,774 | |||||||||
| 1,000 | Miami-Dade County, Florida, Aviation Revenue Bonds, Miami International Airport, Refunding Series 2014B, 5.000%, 10/01/37 | 10/24 at 100.00 | 989,185 | |||||||||
| 14,015 | Miami-Dade County, Florida, Aviation Revenue Bonds, Refunding Series 2016A, 5.000%, 10/01/41 | 10/26 at 100.00 | 13,552,195 | |||||||||
| 4,715 | Miami-Dade County, Florida, Public Facilities Revenue Bonds, Jackson Health System, Series 2017, 5.000%, 6/01/38 | 6/27 at 100.00 | 4,704,309 | |||||||||
| 7,000 | Miami-Dade County, Florida, Transit System Sales Surtax Revenue Bonds, Series 2018, 4.000%, 7/01/48 | 7/28 at 100.00 | 5,766,300 | |||||||||
| 5,000 | Miami-Dade County, Florida, Transit System Sales Surtax Revenue Bonds, Series 2022, 5.000%, 7/01/51 | 7/32 at 100.00 | 4,952,680 | |||||||||
| Miami-Dade County, Florida, Water and Sewer System Revenue Bonds, Series 2019B: | ||||||||||||
| 6,000 | 4.000%, 10/01/44 | 10/29 at 100.00 | 5,157,967 | |||||||||
| 3,965 | 4.000%, 10/01/49 | 10/29 at 100.00 | 3,255,886 | |||||||||
| 11,240 | Orange County Health Facilities Authority, Florida, Hospital Revenue Bonds, Orlando Health Obligated Group, Inc., Series 2022, 4.000%, 10/01/52 | 4/32 at 100.00 | 9,049,891 | |||||||||
| 1,095 | Osceola County, Florida, Transportation Revenue Bonds, Osceola Parkway, Refunding & Improvement Capital Appreciation Series 2019A-2, 0.000%, 10/01/32 | 10/29 at 91.18 | 691,256 | |||||||||
| 4,250 | Osceola County, Florida, Transportation Revenue Bonds, Osceola Parkway, Refunding & Improvement Series 2019A-1, 5.000%, 10/01/49 | 10/29 at 100.00 | 3,865,466 | |||||||||
| 2,000 | Palm Beach County Health Facilities Authority, Florida Retirement Communities Revenue Bonds, ACTS Retirement - Life Communities, Inc Obligated Group, Series 2018A, 5.000%, 11/15/45 | 11/25 at 103.00 | 1,795,473 | |||||||||
| 5,680 | Palm Beach County Health Facilities Authority, Florida, Retirement Communities Revenue Bonds, ACTS Retirement - Life Communities, Inc Obligated Group, Series 2016, 5.000%, 11/15/32 | 11/26 at 100.00 | 5,627,015 | |||||||||
| 8,200 | Putnam County Development Authority, Florida, Pollution Control Revenue Bonds, Seminole Electric Cooperatice, Inc. Project, Refunding Series 2018A, 5.000%, 3/15/42 | 5/28 at 100.00 | 7,892,696 | |||||||||
| 12,170 | Sarasota County Public Hospital District, Florida, Hospital Revenue Bonds, Sarasota Memorial Hospital Project, Series 2018, 4.000%, 7/01/48 | 7/28 at 100.00 | 10,031,771 | |||||||||
Principal Amount (000) | Description (a) | Optional Call Provisions (b) | Value | |||||||||
Florida | ||||||||||||
| $ 6,625 | South Broward Hospital District, Florida, Hospital Revenue Bonds, Refunding Series 2015, 4.000%, 5/01/33 | 5/25 at 100.00 | $ | 6,366,153 | ||||||||
| South Miami Health Facilities Authority, Florida, Hospital Revenue Bonds, Baptist Health Systems of South Florida Obligated Group, Refunding Series 2017: | ||||||||||||
| 8,000 | 5.000%, 8/15/42 | 8/27 at 100.00 | 7,748,580 | |||||||||
| 8,595 | 5.000%, 8/15/47 | 8/27 at 100.00 | 8,190,915 | |||||||||
| 1,205 | Tampa Sports Authority, Hillsborough County, Florida, Sales Tax Payments Special Purpose Bonds, Stadium Project, Series 1995, 5.750%, 10/01/25 - NPFG Insured | No Opt. Call | 1,230,928 | |||||||||
| 4,000 | Tampa, Florida, Health System Revenue Bonds, Baycare Health System, Series 2016A, 4.000%, 11/15/46 | 5/26 at 100.00 | 3,344,420 | |||||||||
| 2,000 | (c) | Volusia County Educational Facilities Authority, Florida, Revenue Bonds, Embry-Riddle Aeronautical University, Series 2015B, 5.000%, 10/15/45, (Pre-refunded 4/15/25) | 4/25 at 100.00 | 2,031,688 | ||||||||
| 7,400 | Volusia County Educational Facilities Authority, Florida, Revenue Bonds, Stetson University Inc. Project, Series 2015, 5.000%, 6/01/45 | 6/25 at 100.00 | 7,097,068 | |||||||||
| Total Florida | 263,785,304 | |||||||||||
Georgia - 4.9% (2.8% of Total Investments) | ||||||||||||
| Atlanta, Georgia, Water and Wastewater Revenue Bonds, Refunding Series 2015: | ||||||||||||
| 3,400 | (c) | 5.000%, 11/01/33, (Pre-refunded 5/01/25) | 5/25 at 100.00 | 3,463,559 | ||||||||
| 2,040 | (c) | 5.000%, 11/01/35, (Pre-refunded 5/01/25) | 5/25 at 100.00 | 2,078,136 | ||||||||
| 10,235 | Clarke County Hospital Authority, Georgia, Revenue Anticipation Certificates, Piedmont Healthcare, Inc. Project, Series 2016A, 5.000%, 7/01/46 | 7/26 at 100.00 | 9,880,536 | |||||||||
| Cobb County Kennestone Hospital Authority, Georgia, Revenue Anticipation Certificates, Wellstar Health System, Series 2017A: | ||||||||||||
| 2,000 | 5.000%, 4/01/42 | 4/27 at 100.00 | 1,940,314 | |||||||||
| 10,000 | 5.000%, 4/01/47 | 4/27 at 100.00 | 9,507,421 | |||||||||
| 2,500 | Columbia County Hospital Authority, Georgia, Revenue Anticipation Certificates, WellStar Health System, Inc. Project, Series 2023B, 5.125%, 4/01/53, (WI/DD) | 4/33 at 100.00 | 2,433,449 | |||||||||
| 5,300 | Crisp County Hospital Authority, Georgia, Revenue Anticipation Certificates, Crisp County Hospital Project, Series 2021, 4.000%, 7/01/46 | 7/31 at 100.00 | 4,173,070 | |||||||||
| 5,725 | Fayette County Hospital Authority, Georgia, Revenue Anticipation Certificates, Piedmont Healthcare, Inc. Project, Series 2016A, 5.000%, 7/01/46 | 7/26 at 100.00 | 5,526,729 | |||||||||
| Fulton County Development Authority, Georgia, Hospital Revenue Bonds, Wellstar Health System, Inc Project, Series 2017A: | ||||||||||||
| 4,330 | 5.000%, 4/01/42 | 4/27 at 100.00 | 4,200,780 | |||||||||
| 10,000 | 5.000%, 4/01/47 | 4/27 at 100.00 | 9,507,421 | |||||||||
| 6,370 | 4.000%, 4/01/50 | 4/30 at 100.00 | 5,057,643 | |||||||||
| 4,000 | Fulton County Development Authority, Georgia, Revenue Bonds, Piedmont Healthcare, Inc. Project, Series 2016A, 5.000%, 7/01/46 | 7/26 at 100.00 | 3,861,470 | |||||||||
| 5,000 | Fulton County Development Authority, Georgia, Revenue Bonds, Piedmont Healthcare, Inc. Project, Series 2019A, 4.000%, 7/01/49 | 7/29 at 100.00 | 4,043,754 | |||||||||
| 12,590 | (c) | Gainesville and Hall County Hospital Authority, Georgia, Revenue Anticipation Certificates, Northeast Georgia Health Services Inc., Series 2014A, 5.500%, 8/15/54, (Pre-refunded 2/15/25) | 2/25 at 100.00 | 12,844,290 | ||||||||
| NEA | Nuveen AMT-Free Quality Municipal Income Fund (continued) Portfolio of Investments October 31, 2023 |
Principal Amount (000) | Description (a) | Optional Call Provisions (b) | Value | |||||||||
Georgia | ||||||||||||
| $ 7,500 | Gainesville and Hall County Hospital Authority, Georgia, Revenue Anticipation Certificates, Northeast Georgia Health Services Inc., Series 2017B, 5.500%, 2/15/42 | 2/27 at 100.00 | $ | 7,657,379 | ||||||||
| 2,000 | Gainesville and Hall County Hospital Authority, Georgia, Revenue Anticipation Certificates, Northeast Georgia Health Services Inc., Series 2021A, 4.000%, 2/15/40 | 2/31 at 100.00 | 1,739,586 | |||||||||
| 8,000 | Georgia Ports Authority, Revenue Bonds, Series 2021, 4.000%, 7/01/51 | 7/31 at 100.00 | 6,681,675 | |||||||||
| 1,860 | Georgia Ports Authority, Revenue Bonds, Series 2022, 4.000%, 7/01/52 | 7/32 at 100.00 | 1,546,892 | |||||||||
| 11,000 | Griffin-Spalding County Hospital Authority, Georgia, Revenue Anticipation Certificates, Wellstar Health System Inc., Series 2017A, 4.000%, 4/01/42 | 4/27 at 100.00 | 9,482,396 | |||||||||
| 1,350 | Henry County Water and Sewerage Authority, Georgia, Revenue Bonds, Refunding Series 2005, 5.250%, 2/01/27 | No Opt. Call | 1,413,197 | |||||||||
| Main Street Natural Gas Inc., Georgia, Gas Supply Revenue Bonds, Series 2019A: | ||||||||||||
| 1,860 | 5.000%, 5/15/43 | 5/29 at 100.00 | 1,749,010 | |||||||||
| 14,100 | 5.000%, 5/15/49 | No Opt. Call | 13,121,356 | |||||||||
| 10,160 | (g) | Main Street Natural Gas Inc., Georgia, Gas Supply Revenue Bonds, Series 2023C, 5.000%, 9/01/53, (Mandatory Put 9/01/30), (UB) | 6/30 at 100.15 | 10,094,703 | ||||||||
| 3,425 | (g) | Main Street Natural Gas Inc., Georgia, Gas Supply Revenue Bonds, Series 2023C, 5.000%, 9/01/53, (Mandatory Put 9/01/30) | 6/30 at 100.15 | 3,402,988 | ||||||||
| 6,310 | Metropolitan Atlanta Rapid Transit Authority, Georgia, Sales Tax Revenue Bonds, Third Indenture, Series 2015B, 5.000%, 7/01/43 | 7/26 at 100.00 | 6,332,647 | |||||||||
| Municipal Electric Authority of Georgia, Plant Vogtle Units 3 & 4 Project J Bonds, Series 2015A: | ||||||||||||
| 5,680 | 5.000%, 7/01/60 | 7/25 at 100.00 | 5,257,820 | |||||||||
| 3,300 | 5.500%, 7/01/60 | 7/25 at 100.00 | 3,193,060 | |||||||||
| 8,230 | Private Colleges and Universities Authority, Georgia, Revenue Bonds, Mercer University, Series 2015, 5.000%, 10/01/40 | 10/25 at 100.00 | 7,851,207 | |||||||||
| 5,000 | Rockdale County Development Authority, Georgia, Revenue Bonds, Piedmont Healthcare, Inc. Project, Series 2019A, 4.000%, 7/01/44 | 7/29 at 100.00 | 4,161,381 | |||||||||
| Total Georgia | 162,203,869 | |||||||||||
Hawaii - 0.1% (0.1% of Total Investments) | ||||||||||||
| 275 | Hawaii Department of Budget and Finance, Special Purpose Revenue Bonds, Hawaii Pacific University, Series 2013A, 6.875%, 7/01/43, 144A | 12/23 at 100.00 | 274,980 | |||||||||
| 3,500 | Honolulu City and County, Hawaii, Wastewater System Revenue Bonds, First Bond Resolution, Green Senior Series 2023, 5.000%, 7/01/48 | 7/33 at 100.00 | 3,526,460 | |||||||||
| Total Hawaii | 3,801,440 | |||||||||||
Idaho - 0.5% (0.3% of Total Investments) | ||||||||||||
| 3,860 | Boise State University, Idaho, General Revenue Bonds, Series 2023A, 5.250%, 4/01/53 | 4/33 at 100.00 | 3,899,398 | |||||||||
| 7,885 | Idaho Health Facilities Authority, Revenue Bonds, Saint Luke’s Health System Project, Series 2021A, 4.000%, 3/01/51 | 3/32 at 100.00 | 6,121,415 | |||||||||
| 2,235 | Idaho Housing and Finance Association, GNMA Housing Revenue Refunding Bonds, Wedgewood Terrace Project, Series 2002A-1, 7.250%, 3/20/37 | 11/23 at 101.00 | 2,259,584 | |||||||||
| 5,000 | Idaho Housing and Finance Association, Nonprofit Facilities Revenue Bonds, The College of Idaho Project, Series 2023, 5.875%, 11/01/53, 144A, (WI/DD) | 11/33 at 100.00 | 4,746,425 | |||||||||
| Total Idaho | 17,026,822 | |||||||||||
Principal Amount (000) | Description (a) | Optional Call Provisions (b) | Value | |||||||||
Illinois - 18.4% (10.8% of Total Investments) | ||||||||||||
| Board of Regents of Illinois State University, Auxiliary Facilities System Revenue Bonds, Series 2018A: | ||||||||||||
| $ 1,000 | 5.000%, 4/01/34 - AGM Insured | 4/28 at 100.00 | $ | 1,035,000 | ||||||||
| 285 | 5.000%, 4/01/37 - AGM Insured | 4/28 at 100.00 | 290,713 | |||||||||
| 1,370 | 5.000%, 4/01/38 - AGM Insured | 4/28 at 100.00 | 1,389,584 | |||||||||
| Bolingbrook, Will and DuPage Counties, Illinois, General Obligation Bonds, Refunding Series 2002B: | ||||||||||||
| 4,595 | 0.000%, 1/01/32 - FGIC Insured | No Opt. Call | 3,075,707 | |||||||||
| 4,000 | 0.000%, 1/01/34 - FGIC Insured | No Opt. Call | 2,419,437 | |||||||||
| 11,000 | Chicago Board of Education, Illinois, Dedicated Capital Improvement Tax Revenue Bonds, Series 2016, 6.000%, 4/01/46 | 4/27 at 100.00 | 11,066,184 | |||||||||
| 3,155 | Chicago Board of Education, Illinois, Dedicated Capital Improvement Tax Revenue Bonds, Series 2023, 5.750%, 4/01/48 | 4/33 at 100.00 | 3,172,861 | |||||||||
| 5,750 | Chicago Board of Education, Illinois, General Obligation Bonds, Dedicated Revenues, Refunding Series 2017H, 5.000%, 12/01/36 | 12/27 at 100.00 | 5,439,786 | |||||||||
| 6,920 | Chicago Board of Education, Illinois, General Obligation Bonds, Dedicated Revenues, Refunding Series 2018D, 5.000%, 12/01/46 | 12/28 at 100.00 | 6,090,900 | |||||||||
| 11,450 | Chicago Board of Education, Illinois, General Obligation Bonds, Dedicated Revenues, Series 2016A, 7.000%, 12/01/44 | 12/25 at 100.00 | 11,701,891 | |||||||||
| 1,785 | Chicago Board of Education, Illinois, General Obligation Bonds, Dedicated Revenues, Series 2016B, 6.500%, 12/01/46 | 12/26 at 100.00 | 1,813,295 | |||||||||
| 23,535 | Chicago Board of Education, Illinois, General Obligation Bonds, Dedicated Revenues, Series 2017A, 7.000%, 12/01/46, 144A | 12/27 at 100.00 | 24,436,541 | |||||||||
| Chicago Board of Education, Illinois, General Obligation Bonds, Dedicated Revenues, Series 2021A: | ||||||||||||
| 1,500 | 5.000%, 12/01/38 | 12/30 at 100.00 | 1,394,644 | |||||||||
| 1,750 | 5.000%, 12/01/40 | 12/30 at 100.00 | 1,602,171 | |||||||||
| 2,175 | Chicago Board of Education, Illinois, General Obligation Bonds, Dedicated Revenues, Series 2023A, 6.000%, 12/01/49, (WI/DD) | 12/33 at 100.00 | 2,174,896 | |||||||||
| 1,000 | Chicago Board of Education, Illinois, Unlimited Tax General Obligation Bonds, Dedicated Tax Revenues, Series 1999A, 5.500%, 12/01/26 - NPFG Insured | No Opt. Call | 1,007,368 | |||||||||
| Chicago Transit Authority, Illinois, Sales Tax Receipts Revenue Bonds, Second Lien Series 2020A: | ||||||||||||
| 14,765 | 4.000%, 12/01/50 - BAM Insured | 12/29 at 100.00 | 11,775,340 | |||||||||
| 4,000 | 4.000%, 12/01/50 | 12/29 at 100.00 | 3,088,580 | |||||||||
| 9,285 | Chicago Transit Authority, Illinois, Sales Tax Receipts Revenue Bonds, Series 2014, 5.250%, 12/01/49 | 12/24 at 100.00 | 9,128,259 | |||||||||
| 4,000 | Chicago, Illinois, General Airport Revenue Bonds, O’Hare International Airport, Senior Lien Series 2018B, 5.000%, 1/01/53 | 1/29 at 100.00 | 3,867,819 | |||||||||
| 1,000 | (g) | Chicago, Illinois, General Obligation Bonds, Chicago Works Series 2023A, 5.500%, 1/01/40, (UB) | 1/32 at 100.00 | 1,008,526 | ||||||||
| 22,670 | Chicago, Illinois, General Obligation Bonds, City Colleges, Series 1999, 0.000%, 1/01/25 - FGIC Insured | No Opt. Call | 21,471,544 | |||||||||
| 10,565 | Chicago, Illinois, General Obligation Bonds, Project & Refunding Series 2017A, 6.000%, 1/01/38 | 1/27 at 100.00 | 10,824,103 | |||||||||
| 4,000 | Chicago, Illinois, General Obligation Bonds, Series 2019A, 5.000%, 1/01/40 | 1/29 at 100.00 | 3,876,590 | |||||||||
| NEA | Nuveen AMT-Free Quality Municipal Income Fund (continued) Portfolio of Investments October 31, 2023 |
Principal Amount (000) | Description (a) | Optional Call Provisions (b) | Value | |||||||||
Illinois | ||||||||||||
| Chicago, Illinois, Wastewater Transmission Revenue Bonds, Second Lien Project, Series 2023A: | ||||||||||||
| $ | 12,190 | 5.250%, 1/01/53 - AGM Insured | 7/33 at 100.00 | $ | 12,307,420 | |||||||
| 2,000 | 5.250%, 1/01/58 - AGM Insured | 7/33 at 100.00 | 2,001,139 | |||||||||
| 6,030 | 5.500%, 1/01/62 - AGM Insured | 7/33 at 100.00 | 6,132,855 | |||||||||
| 7,240 | Chicago, Illinois, Water Revenue Bonds, Second Lien Series 2023A, 5.250%, 11/01/53 - AGM Insured | 5/33 at 100.00 | 7,298,477 | |||||||||
| 5,125 | Cook County Community College District 508, Illinois, General Obligation Bonds, Chicago City Colleges, Series 2013, 5.250%, 12/01/43 | 12/23 at 100.00 | 4,762,368 | |||||||||
| 4,500 | Cook County Community College District 508, Illinois, General Obligation Bonds, Chicago City Colleges, Series 2017, 5.000%, 12/01/47 | 12/27 at 100.00 | 4,409,517 | |||||||||
| 3,500 | Evanston, Cook County, Illinois, General Obligation Bonds, Corporate Purpose Series 2018A, 4.000%, 12/01/43 | 6/28 at 100.00 | 2,991,817 | |||||||||
| Illinois Educational Facilities Authority, Revenue Bonds, Field Museum of Natural History, Series 2002.RMKT: | ||||||||||||
| 2,750 | 3.900%, 11/01/36 | 11/27 at 102.00 | 2,484,369 | |||||||||
| 5,265 | 5.500%, 11/01/36 | 12/23 at 100.00 | 5,271,770 | |||||||||
| 3,215 | Illinois Finance Authority, Health Services Facility Lease Revenue Bonds, Provident Group - UIC Surgery Center, LLC - University of Illinois Health Services Facility Project, Series 2020, 4.000%, 10/01/50 | 10/30 at 100.00 | 2,412,017 | |||||||||
| Illinois Finance Authority, Revenue Bonds, Ascension Health/fkaPresence Health Network, Series 2016C: | ||||||||||||
| 3,500 | 5.000%, 2/15/32 | 2/27 at 100.00 | 3,585,505 | |||||||||
| 25,880 | 4.000%, 2/15/41 | 2/27 at 100.00 | 22,826,693 | |||||||||
| 1,200 | (c) | 4.000%, 2/15/41, (Pre-refunded 2/15/27) | 2/27 at 100.00 | 1,199,772 | ||||||||
| 55 | (c) | 4.000%, 2/15/41, (Pre-refunded 2/15/27) | 2/27 at 100.00 | 54,989 | ||||||||
| 3,000 | 5.000%, 2/15/41 | 2/27 at 100.00 | 2,922,167 | |||||||||
| 2,500 | Illinois Finance Authority, Revenue Bonds, Bradley University, Refunding Series 2021A, 4.000%, 8/01/51 | 8/31 at 100.00 | 1,863,887 | |||||||||
| Illinois Finance Authority, Revenue Bonds, Centegra Health System, Series 2014A: | ||||||||||||
| 8,750 | (c) | 5.000%, 9/01/39, (Pre-refunded 9/01/24) | 9/24 at 100.00 | 8,821,444 | ||||||||
| 11,030 | (c) | 5.000%, 9/01/42, (Pre-refunded 9/01/24) | 9/24 at 100.00 | 11,120,060 | ||||||||
| 1,000 | Illinois Finance Authority, Revenue Bonds, DePaul College Prep Foundation, Series 2023A, 5.625%, 8/01/53, 144A | 8/33 at 100.00 | 923,484 | |||||||||
| 16,165 | Illinois Finance Authority, Revenue Bonds, Mercy Health Corporation, Series 2016, 5.000%, 12/01/40 | 6/26 at 100.00 | 15,643,860 | |||||||||
| Illinois Finance Authority, Revenue Bonds, Northshore - Edward-Elmhurst Health Credit Group, Series 2022A: | ||||||||||||
| 10,945 | 4.000%, 8/15/42 | 8/32 at 100.00 | 9,303,047 | |||||||||
| 4,155 | 5.000%, 8/15/51 | 8/32 at 100.00 | 3,942,547 | |||||||||
| 22,590 | Illinois Finance Authority, Revenue Bonds, OSF Healthcare System, Series 2015A, 5.000%, 11/15/45 | 11/25 at 100.00 | 21,413,122 | |||||||||
| Illinois Finance Authority, Revenue Bonds, Silver Cross Hospital and Medical Centers, Refunding Series 2015C: | ||||||||||||
| 7,285 | 5.000%, 8/15/35 | 8/25 at 100.00 | 6,986,825 | |||||||||
| 4,135 | 5.000%, 8/15/44 | 8/25 at 100.00 | 3,889,148 | |||||||||
| 5,410 | Illinois FInance Authority, Revenue Bonds, Southern Illinois Healthcare Enterprises, Inc., Series 2017A, 5.000%, 3/01/47 | 3/27 at 100.00 | 4,995,879 | |||||||||
| 14,200 | Illinois Finance Authority, Revenue Bonds, The Carle Foundation, Fixed Period Series 2021A, 4.000%, 8/15/41 | 8/31 at 100.00 | 12,198,805 | |||||||||
Principal Amount (000) | Description (a) | Optional Call Provisions (b) | Value | |||||||||
Illinois | ||||||||||||
| $ 15,030 | Illinois Finance Authority, Revenue Bonds, University of Chicago, Series 2023A, 5.250%, 5/15/54 | 5/33 at 100.00 | $ | 15,448,061 | ||||||||
| Illinois State, General Obligation Bonds, April Series 2014: | ||||||||||||
| 2,500 | 5.000%, 4/01/31 | 4/24 at 100.00 | 2,469,949 | |||||||||
| 3,000 | 5.000%, 4/01/38 | 4/24 at 100.00 | 2,886,980 | |||||||||
| Illinois State, General Obligation Bonds, December Series 2017A: | ||||||||||||
| 5,000 | 5.000%, 12/01/34 | 12/27 at 100.00 | 5,035,377 | |||||||||
| 2,000 | 5.000%, 12/01/35 | 12/27 at 100.00 | 2,006,847 | |||||||||
| 5,420 | 5.000%, 12/01/39 | 12/27 at 100.00 | 5,148,310 | |||||||||
| 2,300 | Illinois State, General Obligation Bonds, February Series 2014, 5.250%, 2/01/32 | 2/24 at 100.00 | 2,283,984 | |||||||||
| 1,750 | Illinois State, General Obligation Bonds, January Series 2016, 5.000%, 1/01/32 | 1/26 at 100.00 | 1,762,426 | |||||||||
| 3,565 | Illinois State, General Obligation Bonds, June Series 2016, 5.000%, 6/01/26 | No Opt. Call | 3,622,881 | |||||||||
| 4,170 | Illinois State, General Obligation Bonds, June Series 2022A, 5.500%, 3/01/47 | 3/32 at 100.00 | 4,194,739 | |||||||||
| Illinois State, General Obligation Bonds, May Series 2018A: | ||||||||||||
| 17,000 | 6.000%, 5/01/26 | No Opt. Call | 17,665,835 | |||||||||
| 4,485 | 6.000%, 5/01/27 | No Opt. Call | 4,723,150 | |||||||||
| Illinois State, General Obligation Bonds, May Series 2020: | ||||||||||||
| 1,115 | 5.500%, 5/01/30 | No Opt. Call | 1,167,620 | |||||||||
| 5,305 | 5.500%, 5/01/39 | 5/30 at 100.00 | 5,430,154 | |||||||||
| 2,360 | 5.750%, 5/01/45 | 5/30 at 100.00 | 2,408,318 | |||||||||
| 4,825 | Illinois State, General Obligation Bonds, May Series 2023B, 5.500%, 5/01/47 | 5/32 at 100.00 | 4,853,025 | |||||||||
| 2,515 | Illinois State, General Obligation Bonds, November Series 2016, 5.000%, 11/01/23 | No Opt. Call | 2,515,000 | |||||||||
| 9,710 | Illinois State, General Obligation Bonds, October Series 2016, 5.000%, 2/01/27 | No Opt. Call | 9,910,952 | |||||||||
| 5,000 | Illinois State, General Obligation Bonds, October Series 2022C, 5.500%, 10/01/41 | 10/32 at 100.00 | 5,096,925 | |||||||||
| 5,030 | Illinois Toll Highway Authority, Toll Highway Revenue Bonds, Senior Lien Series 2013A, 5.000%, 1/01/38 | 12/23 at 100.00 | 5,029,585 | |||||||||
| 6,500 | Illinois Toll Highway Authority, Toll Highway Revenue Bonds, Senior Lien Series 2014B, 5.000%, 1/01/39 | 1/24 at 100.00 | 6,467,126 | |||||||||
| 29,430 | Illinois Toll Highway Authority, Toll Highway Revenue Bonds, Senior Lien Series 2015A, 5.000%, 1/01/40 | 7/25 at 100.00 | 29,373,368 | |||||||||
| 10,000 | Illinois Toll Highway Authority, Toll Highway Revenue Bonds, Senior Lien Series 2019A, 5.000%, 1/01/44 | 7/29 at 100.00 | 10,000,877 | |||||||||
| 12,010 | Illinois Toll Highway Authority, Toll Highway Revenue Bonds, Senior Lien Series 2020A, 5.000%, 1/01/45 | 1/31 at 100.00 | 12,002,405 | |||||||||
| Illinois Toll Highway Authority, Toll Highway Revenue Bonds, Senior Lien Series 2021A: | ||||||||||||
| 9,640 | 4.000%, 1/01/42 | 1/32 at 100.00 | 8,415,748 | |||||||||
| 10,455 | 5.000%, 1/01/46 | 1/32 at 100.00 | 10,451,890 | |||||||||
| 5,410 | Illinois Toll Highway Authority, Toll Highway Revenue Bonds, Senior Series 2023A, 5.250%, 1/01/43 | 7/33 at 100.00 | 5,569,930 | |||||||||
| 1,115 | Illinois Toll Highway Authority, Toll Highway Revenue Bonds, Tender Option Bond Trust 2015-XF0052, 5.791%, 1/01/38, 144A, (IF) | 1/23 at 100.00 | 1,114,632 | |||||||||
| NEA | Nuveen AMT-Free Quality Municipal Income Fund (continued) Portfolio of Investments October 31, 2023 |
Principal Amount (000) | Description (a) | Optional Call Provisions (b) | Value | |||||||||
Illinois | ||||||||||||
| $ 11,050 | Illinois, General Obligation Bonds, Illinois FIRST Program, Series 2001, 6.000%, 11/01/26 - FGIC Insured | No Opt. Call | $ | 11,188,989 | ||||||||
| 1,175 | Macon and DeWitt Counties Community Unit School District 2 Maroa- Forsyth, Illinois, General Obligation Bonds, Series 2021, 4.000%, 12/01/41 - AGM Insured | 12/30 at 100.00 | 1,037,479 | |||||||||
| 5,080 | Metropolitan Pier and Exposition Authority, Illinois, McCormick Place Expansion Project Bonds, Refunding Series 2020A, 5.000%, 6/15/50 | 12/29 at 100.00 | 4,723,904 | |||||||||
| 8,800 | Metropolitan Pier and Exposition Authority, Illinois, McCormick Place Expansion Project Bonds, Series 2015A, 5.500%, 6/15/53 | 12/25 at 100.00 | 8,746,654 | |||||||||
| 4,750 | Metropolitan Pier and Exposition Authority, Illinois, McCormick Place Expansion Project Bonds, Series 2017A, 5.000%, 6/15/57 | 12/27 at 100.00 | 4,346,033 | |||||||||
| Metropolitan Pier and Exposition Authority, Illinois, Revenue Bonds, McCormick Place Expansion Project, Capital Appreciation Refunding Series 2010B-1: | ||||||||||||
| 33,000 | 0.000%, 6/15/45 - AGM Insured | No Opt. Call | 10,050,022 | |||||||||
| 5,355 | 0.000%, 6/15/46 - AGM Insured | No Opt. Call | 1,538,254 | |||||||||
| 13,350 | Metropolitan Pier and Exposition Authority, Illinois, Revenue Bonds, McCormick Place Expansion Project, Refunding Series 1996A, 0.000%, 12/15/24 - NPFG Insured | No Opt. Call | 12,682,862 | |||||||||
| 970 | Metropolitan Pier and Exposition Authority, Illinois, Revenue Bonds, McCormick Place Expansion Project, Refunding Series 1998A, 5.500%, 12/15/23 - NPFG Insured | No Opt. Call | 970,833 | |||||||||
| Metropolitan Pier and Exposition Authority, Illinois, Revenue Bonds, McCormick Place Expansion Project, Series 2002A: | ||||||||||||
| 3,505 | 0.000%, 6/15/30 | 9/23 at 67.44 | 2,555,832 | |||||||||
| 195 | (c) | 0.000%, 6/15/30, (ETM) | No Opt. Call | 148,788 | ||||||||
| 28,000 | 0.000%, 12/15/35 - AGM Insured | No Opt. Call | 15,699,099 | |||||||||
| 3,280 | 0.000%, 6/15/37 - NPFG Insured | No Opt. Call | 1,626,228 | |||||||||
| 11,715 | 0.000%, 12/15/38 - NPFG Insured | No Opt. Call | 5,274,643 | |||||||||
| 4,290 | (c) | Metropolitan Pier and Exposition Authority, Illinois, Revenue Bonds, McCormick Place Hospitality Facility, Series 1996A, 7.000%, 7/01/26, (ETM) | No Opt. Call | 4,472,208 | ||||||||
| 2,300 | Regional Transportation Authority, Cook, DuPage, Kane, Lake, McHenry and Will Counties, Illinois, General Obligation Bonds, Series 2000A, 6.500%, 7/01/30 - NPFG Insured | No Opt. Call | 2,556,831 | |||||||||
| 2,855 | Sangamon County School District 186 Springfield, Illinois, General Obligation Bonds, Alternate Revenue Source Series 2023, 5.500%, 6/01/58 - AGM Insured | 6/33 at 100.00 | 2,901,312 | |||||||||
| 2,500 | Sangamon County Water Reclamation District, Illinois, General Obligation Bonds Alternate Revenue Source, Project & Refunding Series 2019A, 4.000%, 1/01/44 - BAM Insured | 1/29 at 100.00 | 2,125,972 | |||||||||
| Springfield, Illinois, Electric Revenue Bonds, Refunding Senior Lien Series 2015: | ||||||||||||
| 2,250 | 5.000%, 3/01/29 | 3/25 at 100.00 | 2,262,548 | |||||||||
| 7,000 | 5.000%, 3/01/31 | 3/25 at 100.00 | 7,047,130 | |||||||||
| Total Illinois | 613,926,437 | |||||||||||
Indiana - 2.7% (1.6% of Total Investments) | ||||||||||||
| 6,000 | Indiana Finance Authority, Educational Facilities Revenue Bonds, Valparaiso University Project, Series 2014, 5.000%, 10/01/44 | 10/24 at 100.00 | 5,335,913 | |||||||||
| 7,000 | Indiana Finance Authority, Hospital Revenue Bonds, Indiana Unversity Health Obligation Group, Fixed Rate Series 2019A, 4.000%, 12/01/49 | 12/29 at 100.00 | 5,781,151 | |||||||||
Principal Amount (000) | Description (a) | Optional Call Provisions (b) | Value | |||||||||
Indiana | ||||||||||||
| Indiana Finance Authority, Hospital Revenue Bonds, Indiana Unversity Health Obligation Group, Refunding 2015A: | ||||||||||||
| $ 1,875 | 4.000%, 12/01/40 | 6/25 at 100.00 | $ | 1,661,709 | ||||||||
| 3,400 | 5.000%, 12/01/40 | 6/25 at 100.00 | 3,404,576 | |||||||||
| 13,415 | Indiana Finance Authority, Hospital Revenue Bonds, Reid Health Series 2022, 5.000%, 1/01/52 - AGM Insured | 1/32 at 100.00 | 12,550,091 | |||||||||
| 11,000 | Indiana Finance Authority, Wastewater Utility Revenue Bonds, CWA Authority Project, First Lien Green Series 2016A, 5.000%, 10/01/46 | 10/26 at 100.00 | 10,765,558 | |||||||||
| 12,820 | Indiana Finance Authority, Wastewater Utility Revenue Bonds, CWA Authority Project, First Lien Green Series 2022B, 5.250%, 10/01/52 | 10/30 at 100.00 | 12,961,182 | |||||||||
| 13,215 | Indiana Finance Authority, Wastewater Utility Revenue Bonds, CWA Authority Project, Series 2014A, 5.000%, 10/01/44 | 10/24 at 100.00 | 13,346,202 | |||||||||
| 5,130 | Indiana Finance Authority, Water Utility Revenue Bonds, Citizens Energy Group Project, First Lien Series 2016A, 5.000%, 10/01/46 | 10/26 at 100.00 | 5,034,185 | |||||||||
| Indianapolis Local Public Improvement Bond Bank, Indiana, Series 1999E: | ||||||||||||
| 9,255 | 0.000%, 2/01/25 - AMBAC Insured | No Opt. Call | 8,767,095 | |||||||||
| 9,560 | 0.000%, 2/01/26 - AMBAC Insured | No Opt. Call | 8,668,470 | |||||||||
| 1,580 | Zionsville Community Schools Building Corporation, Boone County, Indiana, First Mortgage Bonds, Series 2005Z, 0.000%, 1/15/28 - AGM Insured | No Opt. Call | 1,322,085 | |||||||||
| Total Indiana | 89,598,217 | |||||||||||
Iowa - 0.8% (0.5% of Total Investments) | ||||||||||||
| 6,775 | Iowa Finance Authority Senior Living Facilities Revenue Bonds, Sunrise Retirement Community Project, Refunding Series 2021, 5.000%, 9/01/51 | 9/28 at 102.00 | 4,564,000 | |||||||||
| Iowa Finance Authority, Iowa, Midwestern Disaster Area Revenue Bonds, Iowa Fertilizer Company Project, Refunding Series 2022: | ||||||||||||
| 8,250 | 5.000%, 12/01/50 | 12/29 at 103.00 | 7,322,814 | |||||||||
| 1,000 | 5.000%, 12/01/50, (Mandatory Put 12/01/42) | 12/29 at 103.00 | 910,502 | |||||||||
| 3,085 | Iowa Finance Authority, Senior Housing Revenue Bonds, Northcrest Inc. Project, Series 2018A, 5.000%, 3/01/48 | 3/24 at 103.00 | 2,395,280 | |||||||||
| 8,265 | Iowa Tobacco Settlement Authority, Tobacco Settlement Asset-Backed Bonds, Class 2 Capital Appreciation Senior Lien Series 2021B-2, 0.000%, 6/01/65 | 6/31 at 25.58 | 766,949 | |||||||||
| Xenia Rural Water District, Iowa, Water Revenue Bonds, Refunding Capital Loan Note Series 2016: | ||||||||||||
| 4,700 | (c) | 5.000%, 12/01/36, (Pre-refunded 12/01/26) | 12/26 at 100.00 | 4,867,035 | ||||||||
| 5,990 | (c) | 5.000%, 12/01/41, (Pre-refunded 12/01/26) | 12/26 at 100.00 | 6,202,881 | ||||||||
| Total Iowa | 27,029,461 | |||||||||||
Kansas - 0.7% (0.4% of Total Investments) | ||||||||||||
| Ellis County Unified School District 489 Hays, Kansas, General Obligation Bonds, Refunding & Improvement Series 2022B: | ||||||||||||
| 5,000 | 5.000%, 9/01/42 - AGM Insured | 9/31 at 100.00 | 5,045,302 | |||||||||
| 3,050 | 5.000%, 9/01/47 - AGM Insured | 9/31 at 100.00 | 3,032,049 | |||||||||
| 3,700 | Kansas Municipal Energy Agency, Power Project Revenue Bonds, Dogwood Project, Series 2018A, 5.000%, 4/01/38 - BAM Insured | 4/26 at 100.00 | 3,777,622 | |||||||||
| Lawrence, Kansas, Hospital Revenue Bonds, Lawrence Memorial Hospital, Series 2018A: | ||||||||||||
| 6,000 | 5.000%, 7/01/43 | 7/28 at 100.00 | 5,632,136 | |||||||||
| 6,465 | 5.000%, 7/01/48 | 7/28 at 100.00 | 5,873,266 | |||||||||
| Total Kansas | 23,360,375 | |||||||||||
| NEA | Nuveen AMT-Free Quality Municipal Income Fund (continued) Portfolio of Investments October 31, 2023 |
Principal Amount (000) | Description (a) | Optional Call Provisions (b) | Value | |||||||||
Kentucky - 0.7% (0.4% of Total Investments) | ||||||||||||
| $ 6,010 | Kentucky Economic Development Finance Authority, Health System Revenue Bonds, Norton Healthcare Inc., Series 2000B, 0.000%, 10/01/28 - NPFG Insured | No Opt. Call | $ | 4,730,527 | ||||||||
| 1,300 | Kentucky Economic Development Finance Authority, Hospital Revenue Bonds, Owensboro Health, Refunding Series 2017A, 5.000%, 6/01/37 | 6/27 at 100.00 | 1,251,269 | |||||||||
| Kentucky Public Transportation Infrastructure Authority, Toll Revenue Bonds, Downtown Crossing Project, Convertible Capital Appreciation First Tier Series 2013C: | ||||||||||||
| 5,000 | 6.750%, 7/01/43 | 7/31 at 100.00 | 5,460,627 | |||||||||
| 8,610 | 6.875%, 7/01/46 | 7/31 at 100.00 | 9,421,859 | |||||||||
| 1,380 | University of Kentucky, General Receipts Bonds, University of Kentucky Mixed-Use Parking Project, Series 2019A, 4.000%, 5/01/44 | 5/29 at 100.00 | 1,168,755 | |||||||||
| Total Kentucky | 22,033,037 | |||||||||||
Louisiana - 1.9% (1.1% of Total Investments) | ||||||||||||
| 6,305 | Ascension Parish Industrial development Board, Louisiana, Revenue Bonds, Impala Warehousing (US) LLC Project, Series 2013, 6.000%, 7/01/36 | 12/23 at 100.00 | 6,077,156 | |||||||||
| 4,000 | East Baton Rouge Parish Capital Improvement District, Louisiana, MOVEBR Sales Tax Revenue Bonds, Series 2019, 5.000%, 8/01/48 | 8/29 at 100.00 | 3,941,528 | |||||||||
| 1,870 | Jefferson Sales Tax District, Jefferson Parish, Louisiana, Special Sales Tax Revenue Bonds, Series 2017B, 5.000%, 12/01/42 - AGM Insured | 12/27 at 100.00 | 1,848,594 | |||||||||
| 13,590 | Louisiana Publc Facilities Authority, Lousiana, Revenue Bonds, Ochsner Clinic Foundation Project, Refunding Series 2017, 5.000%, 5/15/46 | 5/27 at 100.00 | 12,700,526 | |||||||||
| 1,695 | Louisiana Public Facilities Authority, Lease Revenue Bonds, Provident Group-Flagship Properties LLC - Louisiana State University Nicolson Gateway Project, Series 2016A, 5.000%, 7/01/46 | 7/26 at 100.00 | 1,623,644 | |||||||||
| Louisiana Public Facilities Authority, Revenue Bonds, Ochsner Clinic Foundation Project, Refunding Series 2016: | ||||||||||||
| 20 | (c) | 4.000%, 5/15/35, (Pre-refunded 5/15/26) | 5/26 at 100.00 | 20,017 | ||||||||
| 2,345 | 4.000%, 5/15/36 | 5/26 at 100.00 | 2,176,213 | |||||||||
| 20 | (c) | 5.000%, 5/15/47, (Pre-refunded 5/15/26) | 5/26 at 100.00 | 20,496 | ||||||||
| 1,975 | Louisiana Public Facilities Authority, Revenue Bonds, Ochsner Clinic Foundation Project, Series 2015, 5.000%, 5/15/47 | 5/25 at 100.00 | 1,864,150 | |||||||||
| Louisiana Stadium and Exposition District, Revenue Bonds, Senior Series 2023A: | ||||||||||||
| 3,615 | 5.000%, 7/01/48 | 7/33 at 100.00 | 3,568,259 | |||||||||
| 10,765 | 5.250%, 7/01/53 | 7/33 at 100.00 | 10,790,544 | |||||||||
| 1,015 | Louisiana State, Gasoline and Fuels Tax Revenue Bonds, Refunding Second Lien Series 2017C, 5.000%, 5/01/45 | 11/27 at 100.00 | 1,014,580 | |||||||||
| 5,000 | New Orleans Aviation Board, Louisiana, General Airport Revenue Bonds, North Terminal Project, Series 2017A, 5.000%, 1/01/48 | 1/27 at 100.00 | 4,836,269 | |||||||||
| 6,280 | (c) | New Orleans, Louisiana, Sewerage Service Revenue Bonds, Refunding Series 2014, 5.000%, 6/01/44, (Pre-refunded 6/01/24) | 6/24 at 100.00 | 6,319,112 | ||||||||
| 5,000 | Saint Tammany Parish Hospital Service District 1, Louisiana, Hospital Revenue Bonds, St. Tammany Parish Hospital Project, Refunding Series 2018A, 5.000%, 7/01/48 | 7/28 at 100.00 | 4,645,099 | |||||||||
| 1,355 | Shreveport, Louisiana, Water and Sewer Revenue Bonds, Refunding Series 2015, 5.000%, 12/01/40 | 12/25 at 100.00 | 1,349,002 | |||||||||
| Total Louisiana | 62,795,189 | |||||||||||
Principal Amount (000) | Description (a) | Optional Call Provisions (b) | Value | |||||||||
Maine - 0.7% (0.4% of Total Investments) | ||||||||||||
| $ | 6,300 | Maine Health and Higher Educational Facilities Authority Revenue Bonds, Eastern Maine Medical Center Obligated Group Issue, Series 2016A, 5.000%, 7/01/41 | 7/26 at 100.00 | $ | 5,401,489 | |||||||
| 8,675 | Maine Health and Higher Educational Facilities Authority Revenue Bonds, MaineHealth Issue, Series 2018A, 5.000%, 7/01/43 | 7/28 at 100.00 | 8,452,959 | |||||||||
| 11,150 | Maine Health and Higher Educational Facilities Authority, Revenue Bonds, MaineHealth Issue, Series 2020A, 4.000%, 7/01/50 | 7/30 at 100.00 | 8,917,472 | |||||||||
| Total Maine | 22,771,920 | |||||||||||
Maryland - 1.8% (1.1% of Total Investments) | ||||||||||||
| 5,905 | Baltimore, Maryland, Convention Center Hotel Revenue Bonds, Refunding Series 2017, 5.000%, 9/01/46 | 9/27 at 100.00 | 4,761,636 | |||||||||
| 8,610 | Baltimore, Maryland, Revenue Bonds, Water Projects, Subordinate Series 2017A, 5.000%, 7/01/41 | 1/27 at 100.00 | 8,672,728 | |||||||||
| 2,000 | Maryland Health and Higher Educational Facilities Authority, Revenue Bonds, LifeBridge Health Issue, Series 2016, 5.000%, 7/01/47 | 7/26 at 100.00 | 1,940,980 | |||||||||
| 4,000 | Maryland Health and Higher Educational Facilities Authority, Revenue Bonds, University of Maryland Medical System Issue, Taxable Series 2017D, 4.000%, 7/01/48 | 1/28 at 100.00 | 3,350,546 | |||||||||
| 4,125 | Maryland Stadium Authority, Lease Revenue Bonds, Built To Learn, Series 2022A, 4.000%, 6/01/47 | 6/32 at 100.00 | 3,445,502 | |||||||||
| 17,000 | Maryland Stadium Authority, Revenue Bonds, Baltimore City Public Schools Construction & Revitalization Program, Series 2018A, 5.000%, 5/01/42 | 5/28 at 100.00 | 17,148,036 | |||||||||
| Maryland Transportation Authority, Revenue Bonds, Transportation Facilities Projects, Series 2020: | ||||||||||||
| 3,000 | 4.000%, 7/01/39 | 7/30 at 100.00 | 2,726,465 | |||||||||
| 3,000 | 4.000%, 7/01/50 | 7/30 at 100.00 | 2,500,739 | |||||||||
| 9,095 | Maryland Transportation Authority, Revenue Bonds, Transportation Facilities Projects, Series 2021A, 5.000%, 7/01/51 | 7/31 at 100.00 | 9,182,015 | |||||||||
| 4,000 | Montgomery County, Maryland, Revenue Bonds, Trinity Health Credit Group, Series 2015, 5.000%, 12/01/44 | 6/25 at 100.00 | 3,912,032 | |||||||||
| 1,150 | Rockville Mayor and Council, Maryland, Economic Development Revenue Bonds, Ingleside King Farm Project, Series 2017A-1, 5.000%, 11/01/37 | 11/24 at 103.00 | 981,673 | |||||||||
| 2,250 | Rockville Mayor and Council, Maryland, Economic Development Revenue Bonds, Series 2017B, 5.000%, 11/01/47 | 11/24 at 103.00 | 1,756,470 | |||||||||
| Total Maryland | 60,378,822 | |||||||||||
Massachusetts - 1.9% (1.1% of Total Investments) | ||||||||||||
| 5,000 | Massachusetts Bay Transportation Authority, Sales Tax Revenue Bonds, Subordinated Series 2021A-1, 4.000%, 7/01/51 | 7/31 at 100.00 | 4,147,918 | |||||||||
| 930 | Massachusetts Development Finance Agency, Revenue Bonds, Boston Medical Center Issue, Green Bonds, Series 2015D, 5.000%, 7/01/44 | 7/25 at 100.00 | 865,591 | |||||||||
| 3,890 | Massachusetts Development Finance Agency, Revenue Bonds, Boston University, Refunding Series 2023FF, 5.000%, 10/01/48 | 10/33 at 100.00 | 3,950,648 | |||||||||
| 3,630 | Massachusetts Development Finance Agency, Revenue Bonds, CareGroup Issue, Series 2018J-2, 5.000%, 7/01/53 | 7/28 at 100.00 | 3,448,349 | |||||||||
| 1,100 | Massachusetts Development Finance Agency, Revenue Bonds, Dana- Farber Cancer Institute Issue, Series 2016N, 5.000%, 12/01/46 | 12/26 at 100.00 | 1,057,220 | |||||||||
| Massachusetts Development Finance Agency, Revenue Bonds, Emerson College, Series 2015: | ||||||||||||
| 2,070 | 4.500%, 1/01/45 | 1/25 at 100.00 | 1,747,431 | |||||||||
| NEA | Nuveen AMT-Free Quality Municipal Income Fund (continued) Portfolio of Investments October 31, 2023 |
Principal Amount (000) | Description (a) | Optional Call Provisions (b) | Value | |||||||||
Massachusetts | ||||||||||||
| $ | 8,800 | 5.000%, 1/01/45 | 1/25 at 100.00 | $ | 8,062,048 | |||||||
| 4,100 | Massachusetts Development Finance Agency, Revenue Bonds, Partners HealthCare System Issue, Series 2017S-1, 4.000%, 7/01/36 | 1/28 at 100.00 | 3,804,132 | |||||||||
| Massachusetts Development Finance Agency, Revenue Bonds, Western New England University, Series 2015: | ||||||||||||
| 1,380 | 5.000%, 9/01/40 | 9/25 at 100.00 | 1,241,266 | |||||||||
| 1,545 | 5.000%, 9/01/45 | 9/25 at 100.00 | 1,328,706 | |||||||||
| 3,000 | Massachusetts Development Finance Authority, Revenue Bonds, WGBH Educational Foundation, Series 2002A, 5.750%, 1/01/42 - AMBAC Insured | No Opt. Call | 3,370,430 | |||||||||
| 5,000 | Massachusetts State, General Obligation Bonds, Consolidated Loan, Series 2022C, 5.250%, 10/01/52 | 10/32 at 100.00 | 5,139,722 | |||||||||
| 14,000 | Massachusetts State, General Obligation Bonds, Consolidated Loan, Series 2023A, 5.000%, 5/01/48 | 5/33 at 100.00 | 14,211,561 | |||||||||
| 12,000 | Massachusetts State, Transportation Fund Revenue Bonds, Rail Enhancement Program, Series 2022B, 5.000%, 6/01/52 | 6/32 at 100.00 | 12,091,645 | |||||||||
| Total Massachusetts | 64,466,667 | |||||||||||
Michigan - 12.2% (7.1% of Total Investments) | ||||||||||||
| 315 | Advanced Technology Academy, Michigan, Public School Academy Revenue Bonds, Refunding Series 2019, 5.000%, 11/01/34 | 11/27 at 102.00 | 297,657 | |||||||||
| 4,445 | Byron Center Public Schools, Kent County, Michigan, General Obligation Bonds, School Building & Site Series 2017I, 5.000%, 5/01/47 | 5/27 at 100.00 | 4,376,211 | |||||||||
| 1,135 | Caledonia Community Schools, Kent, Allegan and Barry Counties, Michigan, General Obligation Bonds, School Building & Site Series 2014, 5.000%, 5/01/39 | 5/24 at 100.00 | 1,139,114 | |||||||||
| 1,220 | Central Michigan University Board of Trustees, General Revenue Bonds, Refunding Series 2014, 5.000%, 10/01/39 | 10/24 at 100.00 | 1,164,282 | |||||||||
| 1,000 | Conner Creek Academy East, Michigan, Public School Revenue Bonds, Series 2007, 5.250%, 11/01/36 | 12/23 at 100.00 | 716,030 | |||||||||
| 2,000 | County of Calhoun Hospital Finance Authority, Michigan, Hospital Revenue Bonds, Oaklawn Hospital, Refunding Series 2016, 5.000%, 2/15/47 | 2/27 at 100.00 | 1,657,681 | |||||||||
| 4,400 | Detroit Downtown Development Authority, Michigan, Tax Increment Revenue Bonds, Catalyst Development Project, Series 2018A, 5.000%, 7/01/48 - AGM Insured | 7/24 at 100.00 | 4,099,292 | |||||||||
| 2,755 | Detroit, Michigan, Senior Lien Sewerage Disposal System Revenue Bonds, Series 2001B, 5.500%, 7/01/29 - NPFG Insured | No Opt. Call | 2,809,170 | |||||||||
| 15 | Detroit, Michigan, Water Supply System Revenue Bonds, Refunding Second Lien Series 2004A, 5.000%, 7/01/34 - AGM Insured | 12/23 at 100.00 | 15,016 | |||||||||
| 1,700 | Downriver Utility Wastewater Authority, Michigan, Sewer System Revenue Bonds, Series 2018, 5.000%, 4/01/43 - AGM Insured | 4/28 at 100.00 | 1,670,765 | |||||||||
| Eastern Michigan University, General Revenue Bonds, Refunding Series 2017A: | ||||||||||||
| 1,100 | 5.000%, 3/01/33 - BAM Insured | 3/27 at 100.00 | 1,124,842 | |||||||||
| 2,270 | 5.000%, 3/01/36 - BAM Insured | 3/27 at 100.00 | 2,316,624 | |||||||||
| Eastern Michigan University, General Revenue Bonds, Series 2018A: | ||||||||||||
| 10,710 | 4.000%, 3/01/44 - AGM Insured | 3/28 at 100.00 | 8,894,229 | |||||||||
| 455 | (c) | 4.000%, 3/01/44, (Pre-refunded 3/01/28) - AGM Insured | 3/28 at 100.00 | 460,554 | ||||||||
| 500 | Ferris State University, Michigan, General Revenue Bonds, Series 2020A, 4.000%, 10/01/39 | 10/29 at 100.00 | 419,744 | |||||||||
Principal Amount (000) | Description (a) | Optional Call Provisions (b) | Value | |||||||||
Michigan | ||||||||||||
| Grand Rapids and Kent County Joint Building Authority, Michigan, Limited Tax General Obligation Bonds, Devos Place Project, Series 2001: | ||||||||||||
| $ | 8,260 | 0.000%, 12/01/23 | No Opt. Call | $ | 8,233,265 | |||||||
| 8,575 | 0.000%, 12/01/24 | No Opt. Call | 8,212,888 | |||||||||
| 8,900 | 0.000%, 12/01/25 | No Opt. Call | 8,186,364 | |||||||||
| 3,000 | 0.000%, 12/01/26 | No Opt. Call | 2,653,328 | |||||||||
| 100 | 0.000%, 12/01/27 | No Opt. Call | 85,078 | |||||||||
| 4,305 | 0.000%, 12/01/29 | No Opt. Call | 3,380,486 | |||||||||
| 1,000 | Grand Rapids Public Schools, Kent County, Michigan, General Obligation Bonds, Refunding School Building & Site Series 2016, 5.000%, 5/01/38 - AGM Insured | 5/26 at 100.00 | 1,012,545 | |||||||||
| Grand Rapids Public Schools, Kent County, Michigan, General Obligation Bonds, School Building & Site Series 2019: | ||||||||||||
| 1,250 | 5.000%, 11/01/42 - AGM Insured | 5/29 at 100.00 | 1,230,047 | |||||||||
| 1,850 | 5.000%, 11/01/43 - AGM Insured | 5/29 at 100.00 | 1,815,118 | |||||||||
| Grand Rapids, Michigan, Sanitary Sewer System Revenue Bonds, Improvement & Refunding Series 2014: | ||||||||||||
| 1,000 | (c) | 5.000%, 1/01/32, (Pre-refunded 1/01/24) | 1/24 at 100.00 | 1,001,655 | ||||||||
| 1,000 | (c) | 5.000%, 1/01/33, (Pre-refunded 1/01/24) | 1/24 at 100.00 | 1,001,655 | ||||||||
| 1,000 | (c) | 5.000%, 1/01/34, (Pre-refunded 1/01/24) | 1/24 at 100.00 | 1,001,655 | ||||||||
| 1,855 | (c) | 5.000%, 1/01/44, (Pre-refunded 1/01/24) | 1/24 at 100.00 | 1,858,071 | ||||||||
| Grand Rapids, Michigan, Sanitary Sewer System Revenue Bonds, Series 2018: | ||||||||||||
| 2,500 | 5.000%, 1/01/43 | 1/28 at 100.00 | 2,498,060 | |||||||||
| 6,055 | 5.000%, 1/01/48 | 1/28 at 100.00 | 6,045,899 | |||||||||
| 4,295 | Grand Rapids, Michigan, Water Supply System Revenue Bonds, Series 2020, 5.000%, 1/01/45 | 1/30 at 100.00 | 4,357,398 | |||||||||
Grand Traverse County Hospital Finance Authority, Michigan, Revenue Bonds, Munson Healthcare, Series 2019A: | ||||||||||||
| 1,720 | 5.000%, 7/01/36 | 7/28 at 100.00 | 1,752,696 | |||||||||
| 1,995 | 5.000%, 7/01/39 | 7/28 at 100.00 | 1,989,608 | |||||||||
| 500 | Grand Valley State University, Michigan, General Revenue Bonds, Refunding Series 2014B, 5.000%, 12/01/28 | 12/24 at 100.00 | 504,227 | |||||||||
| 1,005 | Great Lakes Water Authority, Michigan, Sewer Disposal System Revenue Bonds, Refunding Second Lien Series 2016C, 5.000%, 7/01/32 | 7/26 at 100.00 | 1,023,673 | |||||||||
| Great Lakes Water Authority, Michigan, Water Supply Revenue Bonds, Refunding Senior Lien Series 2016C: | ||||||||||||
| 6,245 | 5.000%, 7/01/32 | 7/26 at 100.00 | 6,321,788 | |||||||||
| 10,000 | 5.000%, 7/01/35 | 7/26 at 100.00 | 10,095,897 | |||||||||
| 27,955 | Great Lakes Water Authority, Michigan, Water Supply Revenue Bonds, Senior Lien Series 2016A, 5.000%, 7/01/46 | 7/26 at 100.00 | 27,203,265 | |||||||||
| 6,910 | Hudsonville Public Schools, Ottawa and Allegan Counties, Michigan, General Obligation Bonds, School Building & Site Series 2020-I, 4.000%, 5/01/47 | 5/30 at 100.00 | 5,794,103 | |||||||||
| 1,265 | Jenison Public Schools, Ottawa County, Michigan, General Obligation Bonds, Series 2017, 5.000%, 5/01/30 | 5/27 at 100.00 | 1,312,687 | |||||||||
| Kent County, Michigan, General Obligation Bonds, Limited Tax Capital Improvement Series 2016: | ||||||||||||
| 1,000 | 5.000%, 6/01/31 | 6/26 at 100.00 | 1,026,420 | |||||||||
| 1,445 | 5.000%, 6/01/34 | 6/26 at 100.00 | 1,476,763 | |||||||||
| NEA | Nuveen AMT-Free Quality Municipal Income Fund (continued) Portfolio of Investments October 31, 2023 |
Principal Amount (000) | Description (a) | Optional Call Provisions (b) | Value | |||||||||
Michigan | ||||||||||||
| Kent County, Michigan, General Obligation Bonds, Limited Tax Capital Improvement Series 2017A: | ||||||||||||
| $ | 1,570 | 5.000%, 6/01/36 | 6/27 at 100.00 | $ | 1,633,259 | |||||||
| 1,650 | 5.000%, 6/01/37 | 6/27 at 100.00 | 1,707,133 | |||||||||
| 1,025 | Kent County, Michigan, General Obligation Bonds, Limited Tax Series 2015, 5.000%, 1/01/34 | 1/25 at 100.00 | 1,031,516 | |||||||||
| 3,440 | Kent County, Michigan, General Obligation Bonds, Refunding Limited Tax Series 2015, 5.000%, 1/01/31 | 1/25 at 100.00 | 3,462,907 | |||||||||
| 2,375 | Kentwood Public Schools, Kent County, Michigan, General Obligation Bonds, School Building & Site Series 2023-II, 5.000%, 5/01/49 - AGM Insured | 5/33 at 100.00 | 2,385,798 | |||||||||
| Lake Superior State University Board of Trustees, Michigan, General Revenue Bonds, Series 2018: | ||||||||||||
| 2,395 | 5.000%, 1/15/38 - AGM Insured | 1/28 at 100.00 | 2,423,881 | |||||||||
| 4,000 | 5.000%, 1/15/43 - AGM Insured | 1/28 at 100.00 | 4,003,218 | |||||||||
| 10,900 | Lansing Board of Water and Light, Michigan, Utility System Revenue Bonds, Series 2019A, 5.000%, 7/01/44 | 7/29 at 100.00 | 10,968,272 | |||||||||
| 13,000 | Lansing Board of Water and Light, Michigan, Utility System Revenue Bonds, Series 2021A, 5.000%, 7/01/51 | 7/31 at 100.00 | 12,819,830 | |||||||||
| 1,325 | Lansing School District, Ingham County, Michigan, General Obligation Bonds, School Building and Site Series 2019II, 5.000%, 5/01/40 | 5/29 at 100.00 | 1,359,838 | |||||||||
| Lansing School District, Ingham County, Michigan, General Obligation Bonds, Series 2016I: | ||||||||||||
| 2,085 | 5.000%, 5/01/38 | 5/26 at 100.00 | 2,094,532 | |||||||||
| 2,200 | 5.000%, 5/01/41 | 5/26 at 100.00 | 2,209,544 | |||||||||
| 2,200 | Lansing Township Downtown Development Authority, Ingham County, Michigan, Tax Increment Bonds, Series 2013A, 5.950%, 2/01/42 | 2/24 at 103.00 | 1,976,264 | |||||||||
| 500 | Marquettte, Michigan, Electric Utility System Revenue Bonds, Refunding Series 2016A, 5.000%, 7/01/33 | 7/26 at 100.00 | 504,268 | |||||||||
| 1,500 | Michigan Finance Authority, Distributable State Aid Revenue Bonds, Charter County of Wayne Criminal Justice Center Project, Senior Lien Series 2018, 5.000%, 11/01/43 | 11/28 at 100.00 | 1,511,720 | |||||||||
| Michigan Finance Authority, Distributable State Aid Revenue Bonds, Charter County of Wayne, Second Lien Refunding Series 2020: | ||||||||||||
| 17,500 | 4.000%, 11/01/50 | 11/30 at 100.00 | 14,217,521 | |||||||||
| 10,005 | 4.000%, 11/01/55 | 11/30 at 100.00 | 7,923,297 | |||||||||
| 3,500 | Michigan Finance Authority, Higher Education Limited Obligation Revenue Bonds, Kalamazoo College Project, Refunding Series 2018, 5.000%, 12/01/43 | 12/28 at 100.00 | 3,335,555 | |||||||||
| 1,780 | (c) | Michigan Finance Authority, Hospital Revenue Bonds, Beaumont Health Credit Group, Refunding Series 2015A, 5.000%, 8/01/32, (Pre-refunded 8/01/24) | 8/24 at 100.00 | 1,793,013 | ||||||||
| 4,850 | (c) | Michigan Finance Authority, Hospital Revenue Bonds, MidMichigan Health Credit Group, Refunding Series 2014, 5.000%, 6/01/39, (Pre- refunded 6/01/24) | 6/24 at 100.00 | 4,876,043 | ||||||||
| Michigan Finance Authority, Hospital Revenue Bonds, Sparrow Obligated Group, Refunding Series 2015: | ||||||||||||
| 3,330 | (c) | 5.000%, 11/15/45, (Pre-refunded 5/15/25) | 5/25 at 100.00 | 3,380,828 | ||||||||
| 2,730 | (c) | 5.000%, 11/15/45, (Pre-refunded 5/15/25) | 5/25 at 100.00 | 2,771,669 | ||||||||
Principal Amount (000) | Description (a) | Optional Call Provisions (b) | Value | |||||||||
Michigan | ||||||||||||
| Michigan Finance Authority, Local Government Loan Program Revenue Bonds, Detroit Regional Convention Facility Authority Local Project, Series 2014H-1: | ||||||||||||
| $ | 895 | 5.000%, 10/01/24 | 12/23 at 100.00 | $ | 895,629 | |||||||
| 2,000 | 5.000%, 10/01/25 | 10/24 at 100.00 | 2,015,827 | |||||||||
| 11,025 | 5.000%, 10/01/39 | 10/24 at 100.00 | 10,773,942 | |||||||||
| Michigan Finance Authority, Local Government Loan Program Revenue Bonds, Detroit Water & Sewerage Department Sewage Disposal System Local Project, Second Lien Series 2015C: | ||||||||||||
| 4,665 | 5.000%, 7/01/34 | 7/25 at 100.00 | 4,699,347 | |||||||||
| 1,070 | 5.000%, 7/01/35 | 7/25 at 100.00 | 1,078,902 | |||||||||
| Michigan Finance Authority, Local Government Loan Program Revenue Bonds, Detroit Water & Sewerage Department Water Supply System Local Project, Refunding Senior Loan Series 2014D-1: | ||||||||||||
| 1,500 | 5.000%, 7/01/35 - AGM Insured | 7/24 at 100.00 | 1,506,572 | |||||||||
| 1,625 | 5.000%, 7/01/37 - AGM Insured | 7/24 at 100.00 | 1,629,160 | |||||||||
| Michigan Finance Authority, Michigan, Revenue Bonds, Trinity Health Credit Group, Refunding Series 2016MI: | ||||||||||||
| 5,340 | 5.000%, 12/01/45 | 6/26 at 100.00 | 5,201,942 | |||||||||
| 175 | (c) | 5.000%, 12/01/45, (Pre-refunded 6/01/26) | 6/26 at 100.00 | 180,299 | ||||||||
| 9,000 | Michigan Finance Authority, Michigan, Revenue Bonds, Trinity Health Credit Group, Refunding Series 2016MI-2, 4.000%, 3/01/51 | 3/32 at 100.00 | 7,244,056 | |||||||||
| 12,520 | Michigan Finance Authority, Michigan, Revenue Bonds, Trinity Health Credit Group, Refunding Series 2017A-MI, 4.000%, 12/01/36 | 12/27 at 100.00 | 11,516,911 | |||||||||
| 1,900 | Michigan Finance Authority, Michigan, Revenue Bonds, Trinity Health Credit Group, Refunding Series 2017MI, 5.000%, 12/01/30 | 6/27 at 100.00 | 1,948,601 | |||||||||
| 2,000 | Michigan Finance Authority, Michigan, Revenue Bonds, Trinity Health Credit Group, Refunding Series 2019A-MI, 4.000%, 12/01/49 | 12/29 at 100.00 | 1,634,562 | |||||||||
| 11,730 | Michigan Finance Authority, Tobacco Settlement Asset- Backed Bonds, 2006 Sold Tobacco Receipts Senior Current Interest Series 2020A-2, 5.000%, 6/01/40 | 12/30 at 100.00 | 11,534,883 | |||||||||
| 10,330 | Michigan Hospital Finance Authority, Revenue Bonds, Ascension Health Senior Credit Group, Refunding & Project Series 2010F-6, 4.000%, 11/15/47 | 11/26 at 100.00 | 8,508,262 | |||||||||
| 200 | Michigan Public Educational Facilities Authority, Charter School Revenue Bonds, American Montessori Academy, Series 2007, 6.500%, 12/01/37 | 12/23 at 100.00 | 192,330 | |||||||||
| Michigan State Building Authority, Revenue Bonds, Facilities Program, Refunding Series 2015-I: | ||||||||||||
| 14,915 | 5.000%, 4/15/31 | 10/25 at 100.00 | 15,157,725 | |||||||||
| 2,085 | (c) | 5.000%, 4/15/31, (Pre-refunded 10/15/25) | 10/25 at 100.00 | 2,127,421 | ||||||||
| 5,615 | 5.000%, 4/15/38 | 10/25 at 100.00 | 5,611,161 | |||||||||
| 960 | (c) | Michigan State Hospital Finance Authority, Hospital Revenue Refunding Bonds, St. John’s Health System, Series 1998A, 5.000%, 5/15/28 - AMBAC Insured, (ETM) | 12/23 at 100.00 | 1,031,131 | ||||||||
| 8,300 | Michigan State University, General Revenue Bonds, Refunding Series 2019C, 4.000%, 2/15/44 | 8/29 at 100.00 | 7,030,078 | |||||||||
| 3,000 | Michigan State University, General Revenue Bonds, Taxable Series 2019A, 5.000%, 2/15/48 | 2/29 at 100.00 | 3,010,373 | |||||||||
| 1,950 | Michigan State, Comprehensive Transportation Revenue Bonds, Refunding Series 2015, 5.000%, 11/15/29 | 11/24 at 100.00 | 1,966,110 | |||||||||
| 4,790 | Mona Shores Public Schools, Muskegon County, Michigan, General Obligation Bonds, School Building & Site Series 2019I, 5.000%, 5/01/48 | 5/29 at 100.00 | 4,801,807 | |||||||||
| NEA | Nuveen AMT-Free Quality Municipal Income Fund (continued) Portfolio of Investments October 31, 2023 |
Principal Amount (000) | Description (a) | Optional Call Provisions (b) | Value | |||||||||
Michigan | ||||||||||||
| $ | 2,945 | Muskegon Community College District, Michigan, General Obligation Bonds, Community Facility Series 2013I, 5.000%, 5/01/38 | 5/24 at 100.00 | $ | 2,950,789 | |||||||
| Muskegon County, Michigan, General Obligation Wastewater Bonds, Management System 1, Refunding Series 2015: | ||||||||||||
| 1,350 | 5.000%, 11/01/33 | 11/25 at 100.00 | 1,370,615 | |||||||||
| 1,730 | 5.000%, 11/01/36 | 11/25 at 100.00 | 1,752,777 | |||||||||
| Northern Michigan University, General Revenue Bonds, Series 2018A: | ||||||||||||
| 400 | 5.000%, 12/01/33 | 6/28 at 100.00 | 415,963 | |||||||||
| 650 | 5.000%, 12/01/35 | 6/28 at 100.00 | 674,232 | |||||||||
| 1,200 | Novi Community School District, Oakland County, Michigan, General Obligation Bonds, School Building & Site Series 2022-II, 4.000%, 5/01/47 | 5/32 at 100.00 | 1,004,613 | |||||||||
| 3,805 | Rockford Public Schools, Kent County, Michigan, General Obligation Bonds, School Building & Site Series 2023II, 5.000%, 5/01/44 | 5/33 at 100.00 | 3,813,552 | |||||||||
| 5,380 | (c) | Royal Oak Hospital Finance Authority, Michigan, Hospital Revenue Bonds, William Beaumont Hospital Obligated Group, Refunding Series 2014D, 5.000%, 9/01/39, (Pre-refunded 3/01/24) | 3/24 at 100.00 | 5,394,086 | ||||||||
| 1,510 | Royal Oak, Oakland County, Michigan, General Obligation Bonds, Taxable Limited Tax Series 2018, 5.000%, 4/01/43 | 4/28 at 100.00 | 1,546,497 | |||||||||
| 810 | Saginaw Valley State University, Michigan, General Revenue Bonds, Refunding Series 2016A, 5.000%, 7/01/35 | 7/26 at 100.00 | 818,712 | |||||||||
| 1,435 | South Haven Public Schools, Van Buren Couty, Michigan, General Obligation Bonds, School Building & Site, Series 2014A, 5.000%, 5/01/41 - BAM Insured | 5/24 at 100.00 | 1,440,552 | |||||||||
| 4,000 | (c) | University of Michigan, General Revenue Bonds, Series 2014A, 5.000%, 4/01/44, (Pre-refunded 4/01/24) | 4/24 at 100.00 | 4,020,146 | ||||||||
| University of Michigan, Michigan, General Revenue Bonds, Series 2017A: | ||||||||||||
| 1,065 | (c) | 5.000%, 4/01/36, (Pre-refunded 4/01/27) | 4/27 at 100.00 | 1,114,448 | ||||||||
| 2,000 | (c) | 5.000%, 4/01/42, (Pre-refunded 4/01/27) | 4/27 at 100.00 | 2,092,860 | ||||||||
| 7,200 | (c) | 5.000%, 4/01/47, (Pre-refunded 4/01/27), (UB) | 4/27 at 100.00 | 7,534,296 | ||||||||
| 5,000 | (c) | 5.000%, 4/01/47, (Pre-refunded 4/01/27) | 4/27 at 100.00 | 5,232,150 | ||||||||
| 1,000 | Wayne County Airport Authority, Michigan, Revenue Bonds, Detroit Metropolitan Wayne County Airport, Senior Series 2017A, 5.000%, 12/01/42 | 12/27 at 100.00 | 986,355 | |||||||||
| 4,000 | Wayne County Airport Authority, Michigan, Revenue Bonds, Detroit Metropolitan Wayne County Airport, Series 2012A, 5.000%, 12/01/42 - AGM Insured | 12/23 at 100.00 | 4,003,235 | |||||||||
| 2,200 | Wayne County Airport Authority, Michigan, Revenue Bonds, Detroit Metropolitan Wayne County Airport, Series 2015D, 5.000%, 12/01/45 | 12/25 at 100.00 | 2,160,756 | |||||||||
| 5,000 | Wayne State University, Michigan, General Revenue Bonds, Series 2018A, 5.000%, 11/15/43 | 11/28 at 100.00 | 4,929,379 | |||||||||
| 2,590 | West Bloomfield School District, Oakland County, Michigan, General Obligation Bonds, School Building & Site Series 2017, 5.000%, 5/01/36 - AGM Insured | 5/27 at 100.00 | 2,692,857 | |||||||||
| Western Michigan University, General Revenue Bonds, Refunding Series 2015A: | ||||||||||||
| 1,500 | 5.000%, 11/15/40 | 5/25 at 100.00 | 1,492,234 | |||||||||
| 850 | 5.000%, 11/15/45 | 5/25 at 100.00 | 832,551 | |||||||||
| 3,335 | Western Michigan University, General Revenue Bonds, Refunding Series 2019A, 5.000%, 11/15/44 | 11/29 at 100.00 | 3,253,912 | |||||||||
| 350 | Williamston Community School District, Michigan, Unlimited Tax General Obligation QSBLF Bonds, Series 1996, 5.500%, 5/01/25 - NPFG Insured | No Opt. Call | 355,424 | |||||||||
Principal Amount (000) | Description (a) | Optional Call Provisions (b) | Value | |||||||||
Michigan | ||||||||||||
| $ 2,700 | Wyandotte, Michigan, Electric Revenue Bonds, Refunding Series 2015A, 5.000%, 10/01/44 - BAM Insured | 10/25 at 100.00 | $ | 2,728,621 | ||||||||
| Total Michigan | 406,534,399 | |||||||||||
Minnesota - 5.2% (3.1% of Total Investments) | ||||||||||||
| 285 | Baytown Township, Minnesota Charter School Lease Revenue Bonds, Saint Croix Preparatory Academy, Refunding Series 2016A, 4.000%, 8/01/36 | 8/26 at 100.00 | 231,377 | |||||||||
| 3,565 | Brooklyn Center, Minnesota, Charter School Lease Revenue Bonds, Tesfa International dba Twin Lakes STEM Academy Project, Series 2021A, 5.250%, 6/15/56 | 6/29 at 100.00 | 2,344,113 | |||||||||
| 730 | Brooklyn Center, Minnesota, Charter School Lease Revenue Bonds, Tesfa International dba Twin Lakes STEM Academy Project, Taxable Series 2021B, 6.000%, 6/15/31 | 6/29 at 100.00 | 639,914 | |||||||||
| 3,000 | Carlton County, Minnesota, General Obligation Bonds, Minnesota State Credit Enhancement Program Series 2022A, 4.000%, 2/01/47 | 2/32 at 100.00 | 2,539,901 | |||||||||
| 350 | Chatfield, Minnesota, Healthcare and Housing Facilities Revenue Bonds, Chosen Valley Care Center Project, Refunding Series 2019, 4.000%, 9/01/39 | 9/26 at 102.00 | 243,375 | |||||||||
| 1,000 | City of Ham Lake, Minnesota, Charter School Lease Revenue Bonds, DaVinci Academy Project,Series 2016A, 5.000%, 7/01/36 | 7/24 at 102.00 | 876,116 | |||||||||
| 4,005 | City of Milaca, Minnesota Refunding Revenue Bonds, Grandview Christian Home Project, Series 2016, 5.000%, 10/01/41 | 10/24 at 102.00 | 3,268,180 | |||||||||
| Dakota County Community Development Agency, Minnesota, Senior Housing Revenue Bonds, Walker Highview Hills LLC Project, Refunding Series 2016A: | ||||||||||||
| 1,105 | 3.500%, 8/01/25, 144A | 12/23 at 100.00 | 1,071,979 | |||||||||
| 1,000 | 5.000%, 8/01/46, 144A | 12/23 at 100.00 | 846,015 | |||||||||
| 590 | Deephaven, Minnesota, Charter School Lease Revenue Bonds, Eagle Ridge Academy Project, Series 2015A, 5.250%, 7/01/37 | 7/25 at 100.00 | 544,937 | |||||||||
| Duluth Economic Development Authority, Minnesota, Health Care Facilities Revenue Bonds, Essentia Health Obligated Group, Series 2018A: | ||||||||||||
| 2,000 | 4.250%, 2/15/43 | 2/28 at 100.00 | 1,741,272 | |||||||||
| 1,300 | 5.000%, 2/15/43 | 2/28 at 100.00 | 1,226,770 | |||||||||
| 4,050 | 5.000%, 2/15/48 | 2/28 at 100.00 | 3,688,020 | |||||||||
| 6,650 | 5.000%, 2/15/53 | 2/28 at 100.00 | 5,987,668 | |||||||||
| 3,000 | 5.250%, 2/15/53 | 2/28 at 100.00 | 2,889,966 | |||||||||
| 7,240 | 5.250%, 2/15/58 | 2/28 at 100.00 | 6,938,463 | |||||||||
| 3,600 | Duluth Economic Development Authority, Minnesota, Health Care Facilities Revenue Bonds, Saint Luke’s Hospital of Duluth Obligated Group, Series 2022B, 5.250%, 6/15/47 | 6/32 at 100.00 | 3,235,194 | |||||||||
| GFW Independent School District No. 2365, Sibley, Renville, McLeod and Nicollet Counties, Minnesota, General Obligation School Building Bonds, Series 2023A: | ||||||||||||
| 1,725 | 5.000%, 2/01/43 | 2/31 at 100.00 | 1,768,070 | |||||||||
| 1,125 | 4.125%, 2/01/52 | 2/31 at 100.00 | 968,881 | |||||||||
| 535 | Independence, Minnesota, Charter School Lease Revenue Bonds, Paladin Career & Technical High School Project, Series 2021A, 4.000%, 6/01/41 | 6/29 at 102.00 | 378,348 | |||||||||
| 9,840 | Independent School District 621, Mounds View, Minnesota, General Obligation Bonds, School Building Series 2018A, 4.000%, 2/01/41 | 2/27 at 100.00 | 8,847,208 | |||||||||
| 2,800 | Itasca County Independent School District 318, Minnesota, General Obligation Bonds, Series 2018A, 4.000%, 2/01/37 | 2/27 at 100.00 | 2,732,773 | |||||||||
| NEA | Nuveen AMT-Free Quality Municipal Income Fund (continued) Portfolio of Investments October 31, 2023 |
Principal Amount (000) | Description (a) | Optional Call Provisions (b) | Value | |||||||||
Minnesota | ||||||||||||
| $ 1,000 | Maple River Independent School District 2135, Minnesota, General Obligation Bonds, School Building Series 2020A, 4.000%, 2/01/50 | 2/30 at 100.00 | $ | 831,873 | ||||||||
| 405 | Minneapolis, Minnesota, Charter School Lease Revenue Bonds, Cyber Village Academy Project, Series 2022A, 5.500%, 6/01/57 | 6/32 at 100.00 | 348,964 | |||||||||
| 2,250 | Minneapolis, Minnesota, Health Care System Revenue Bonds, Allina Health System, Series 2021, 4.000%, 11/15/40 | 11/31 at 100.00 | 1,971,504 | |||||||||
| 2,530 | Minneapolis, Minnesota, Health Care System Revenue Bonds, Fairview Health Services, Series 2018A, 4.000%, 11/15/48 | 11/28 at 100.00 | 1,918,752 | |||||||||
Minneapolis-St. Paul Metropolitan Airports Commission, Minnesota, Airport Revenue Bonds, Refunding Subordinate Lien Series 2019A: | ||||||||||||
| 1,000 | 5.000%, 1/01/33 | 7/29 at 100.00 | 1,033,700 | |||||||||
| 2,245 | 5.000%, 1/01/44 | 7/29 at 100.00 | 2,216,769 | |||||||||
| 3,500 | 5.000%, 1/01/49 | 7/29 at 100.00 | 3,416,800 | |||||||||
Minneapolis-St. Paul Metropolitan Airports Commission, Minnesota, Airport Revenue Bonds, Senior Lien Series 2016C: | ||||||||||||
| 1,630 | 5.000%, 1/01/37 | 1/27 at 100.00 | 1,652,055 | |||||||||
| 7,000 | 5.000%, 1/01/46 | 1/27 at 100.00 | 6,905,952 | |||||||||
Minneapolis-St. Paul Metropolitan Airports Commission, Minnesota, Airport Revenue Bonds, Subordinate Lien Series 2022A: | ||||||||||||
| 2,000 | 4.125%, 1/01/47 | 1/32 at 100.00 | 1,706,004 | |||||||||
| 2,000 | 4.250%, 1/01/52 | 1/32 at 100.00 | 1,692,042 | |||||||||
| 11,885 | 5.000%, 1/01/52 | 1/32 at 100.00 | 11,518,722 | |||||||||
| Minnesota Higher Education Facilities Authority, Revenue Bonds, University of Saint Thomas, Series 2022B: | ||||||||||||
| 1,000 | 4.125%, 10/01/42 | 10/30 at 100.00 | 842,306 | |||||||||
| 610 | 4.125%, 10/01/42 | 10/30 at 100.00 | 513,806 | |||||||||
| 2,140 | 5.000%, 10/01/47 | 10/30 at 100.00 | 2,046,657 | |||||||||
| 1,000 | Minnesota Housing Finance Agency, Housing Infrastructure State Appropriation Bonds, Series 2020D, 4.000%, 8/01/42 | 8/30 at 100.00 | 860,136 | |||||||||
| 280 | Minnesota Housing Finance Agency, Housing Infrastructure State Appropriation Bonds, Series 2021A, 3.000%, 8/01/37 | 8/31 at 100.00 | 230,227 | |||||||||
| 650 | Minnesota Housing Finance Agency, Housing Infrastructure State Appropriation Bonds, Series 2021B, 3.000%, 8/01/35 | 8/31 at 100.00 | 545,100 | |||||||||
| 3,165 | Minnesota Housing Finance Agency, Housing Infrastructure State Appropriation Bonds, Series 2021C, 4.000%, 8/01/43 | 8/31 at 100.00 | 2,692,570 | |||||||||
| 3,805 | Minnesota Housing Finance Agency, Housing Infrastructure State Appropriation Bonds, Series 2022C, 5.000%, 8/01/41 | 8/32 at 100.00 | 3,866,377 | |||||||||
| 2,000 | Rochester, Minnesota, Electric Utility Revenue Bonds, Refunding Series 2017A, 5.000%, 12/01/42 | 12/26 at 100.00 | 2,006,678 | |||||||||
| 10,000 | Rochester, Minnesota, Health Care Facilities Revenue Bonds, Mayo Clinic, Series 2022, 5.000%, 11/15/57 | 11/32 at 100.00 | 10,158,669 | |||||||||
| Saint Cloud, Minnesota, Health Care Revenue Bonds, CentraCare Health System, Series 2019: | ||||||||||||
| 10,325 | 5.000%, 5/01/48 | 5/29 at 100.00 | 10,036,285 | |||||||||
| 6,000 | 4.000%, 5/01/49 | 5/29 at 100.00 | 4,901,758 | |||||||||
| 4,825 | Saint Paul Housing & Redevelopment Authority, Minnesota, Charter School Lease Revenue Bonds, Community School of Excellence, Series 2023, 5.500%, 3/01/53, 144A | 3/33 at 100.00 | 4,079,991 | |||||||||
| 2,000 | Saint Paul Housing & Redevelopment Authority, Minnesota, Charter School Lease Revenue Bonds, Hmong College Prep Academy Project, Refunding Series 2020A, 5.000%, 9/01/55 | 9/30 at 100.00 | 1,585,690 | |||||||||
Principal Amount (000) | Description (a) | Optional Call Provisions (b) | Value | |||||||||
Minnesota | ||||||||||||
| Saint Paul Housing & Redevelopment Authority, Minnesota, Charter School Lease Revenue Bonds, Hmong College Prep Academy Project, Series 2016A: | ||||||||||||
| $ 2,000 | 5.750%, 9/01/46 | 9/26 at 100.00 | $ | 1,851,644 | ||||||||
| 3,850 | 6.000%, 9/01/51 | 9/26 at 100.00 | 3,612,746 | |||||||||
| 530 | Saint Paul Housing & Redevelopment Authority, Minnesota, Charter School Lease Revenue Bonds, Hope Community Academy Project, Series 2020A, 3.875%, 12/01/30 | 12/28 at 102.00 | 458,839 | |||||||||
| 4,170 | Saint Paul Housing & Redevelopment Authority, Minnesota, Charter School Lease Revenue Bonds, Nova Classical Academy, Series 2016A, 4.125%, 9/01/47 | 9/24 at 102.00 | 2,958,173 | |||||||||
| Saint Paul Housing and Redevelopment Authority, Minnesota, Health Care Facility Revenue Bonds, HealthPartners Obligated Group, Refunding Series 2015A: | ||||||||||||
| 1,000 | 5.000%, 7/01/29 | 7/25 at 100.00 | 1,004,685 | |||||||||
| 3,420 | 5.000%, 7/01/33 | 7/25 at 100.00 | 3,427,858 | |||||||||
| Saint Paul Housing and Redevelopment Authority, Minnesota, Health Care Revenue Bonds, Fairview Health Services, Series 2017A: | ||||||||||||
| 595 | 4.000%, 11/15/35 | 11/27 at 100.00 | 522,949 | |||||||||
| 1,470 | 4.000%, 11/15/43 | 11/27 at 100.00 | 1,174,920 | |||||||||
| 3,315 | 5.000%, 11/15/47 | 11/27 at 100.00 | 3,083,148 | |||||||||
| 800 | Saint Paul Port Authority, Minnesota, District Energy Revenue Bonds, Series 2023-3, 4.750%, 10/01/43 | 10/33 at 100.00 | 711,088 | |||||||||
| Saint Paul, Minnesota, Housing and Redevelopment Authority, Minnesota Charter School Lease Revenue Bonds, Series 2022A: | ||||||||||||
| 210 | 6.500%, 6/01/29 | No Opt. Call | 203,853 | |||||||||
| 1,070 | 6.375%, 6/01/42 | 6/29 at 103.00 | 975,672 | |||||||||
| 3,055 | 6.500%, 6/01/57 | 6/29 at 103.00 | 2,736,207 | |||||||||
| 850 | Sartell, Minnesota, Health Care Facilities Revenue Bonds, Country Manor Campus LLC Project, Refunding Series 2017, 5.000%, 9/01/42 | 9/27 at 100.00 | 691,903 | |||||||||
| 4,270 | St. Paul Housing and Redevelopment Authority, Minnesota, Charter School Revenue Bonds, Higher Ground Academy Charter School, Series 2018, 5.000%, 12/01/43 | 12/26 at 102.00 | 3,734,649 | |||||||||
| St. Paul Housing and Redevelopment Authority, Minnesota, Hospital Revenue Bonds, HealthEast Inc., Series 2015A: | ||||||||||||
| 3,595 | (c) | 5.000%, 11/15/40, (Pre-refunded 11/15/25) | 11/25 at 100.00 | 3,639,666 | ||||||||
| 5,315 | (c) | 5.000%, 11/15/44, (Pre-refunded 11/15/25) | 11/25 at 100.00 | 5,381,037 | ||||||||
| Wayzata, Minnesota Senior Housing Revenue Bonds, Folkestone Senior Living Community, Refunding Series 2019: | ||||||||||||
| 300 | 5.000%, 8/01/32 | 8/24 at 102.00 | 297,255 | |||||||||
| 150 | 5.000%, 8/01/33 | 8/24 at 102.00 | 147,942 | |||||||||
| 250 | 5.000%, 8/01/35 | 8/24 at 102.00 | 242,845 | |||||||||
| 600 | 4.000%, 8/01/39 | 8/24 at 102.00 | 498,709 | |||||||||
| 2,000 | 5.000%, 8/01/49 | 8/24 at 102.00 | 1,763,004 | |||||||||
| 3,000 | Western Minnesota Municipal Power Agency, Minnesota, Power Supply Revenue Bonds, Series 2018A, 5.000%, 1/01/49 | 7/28 at 100.00 | 2,960,348 | |||||||||
| Total Minnesota | 174,667,067 | |||||||||||
Mississippi - 0.1% (0.1% of Total Investments) | ||||||||||||
| 4,500 | Medical Center Educational Building Corporation, Mississippi, Revenue Bonds, University of Mississippi Medical Center New Facilities & Refinancing Project, Series 2017A, 4.000%, 6/01/47 | 6/27 at 100.00 | 3,778,446 | |||||||||
| Total Mississippi | 3,778,446 | |||||||||||
| NEA | Nuveen AMT-Free Quality Municipal Income Fund (continued) Portfolio of Investments October 31, 2023 |
Principal Amount (000) | Description (a) | Optional Call Provisions (b) | Value | |||||||||
Missouri - 5.6% (3.3% of Total Investments) | ||||||||||||
| Boone County, Missouri, Hospital Revenue Bonds, Boone Hospital Center, Refunding Series 2016: | ||||||||||||
| $ 2,470 | 4.000%, 8/01/33 | 8/26 at 100.00 | $ | 1,899,903 | ||||||||
| 4,590 | 5.000%, 8/01/35 | 8/26 at 100.00 | 3,756,339 | |||||||||
| 3,700 | Hannibal Industrial Development Authority, Missouri, Health Facilities Revenue Bonds, Hannibal Regional Healthcare System, Series 2017, 5.000%, 10/01/47 | 10/27 at 100.00 | 3,298,275 | |||||||||
| 4,000 | Hazelwood School District, St. Louis County, Missouri, General Obligation Bonds, Refunding and Improvement Series 2023A, 5.000%, 3/01/42 - BAM Insured | 3/32 at 100.00 | 4,069,045 | |||||||||
| 6,940 | Jackson County, Missouri, Special Obligation Bonds, Series 2023A, 5.250%, 12/01/47 | 12/33 at 100.00 | 7,072,307 | |||||||||
| Kansas City Municipal Assistance Corporation, Missouri, Leasehold Revenue Bonds, Improvement Series 2004B-1: | ||||||||||||
| 8,150 | 0.000%, 4/15/27 - AMBAC Insured | No Opt. Call | 7,050,819 | |||||||||
| 5,000 | 0.000%, 4/15/31 - AMBAC Insured | No Opt. Call | 3,582,477 | |||||||||
| Kansas City, Missouri, Sanitary Sewer System Revenue Bonds, Improvement Series 2018A: | ||||||||||||
| 2,475 | 4.000%, 1/01/38 | 1/28 at 100.00 | 2,219,617 | |||||||||
| 4,470 | 4.000%, 1/01/42 | 1/28 at 100.00 | 3,863,266 | |||||||||
| 1,475 | Kansas City, Missouri, Special Obligation Bonds, Kansas City Missouri Projects, Series 2021A, 5.000%, 4/01/40 | 4/31 at 100.00 | 1,485,382 | |||||||||
| 1,750 | Kansas City, Missouri, Water Revenue Bonds, Series 2023A, 4.000%, 12/01/47 | 12/33 at 100.00 | 1,490,060 | |||||||||
| 2,700 | Maryland Heights, Missouri, Tax Increment and Special District Revenue Bonds, Westport Plaza Redevelopment Area, Series 2020, 4.125%, 11/01/38 | 11/29 at 100.00 | 2,356,775 | |||||||||
| Metropolitan St. Louis Sewerage District, Missouri, Wastewater System Revenue Bonds, Series 2019B: | ||||||||||||
| 2,695 | 5.000%, 5/01/44 | 5/29 at 100.00 | 2,757,193 | |||||||||
| 2,160 | Missouri Development Finance Board, Infrastructure Facilities Revenue Bonds, City of Independence Annual Appropriation Electric System, Refunding Series 2022, 5.000%, 6/01/34 - AGM Insured | 6/32 at 100.00 | 2,303,734 | |||||||||
| 3,000 | Missouri Environmental Improvement and Energy Resources Authority, Revenue Bonds, Union Electric Company Project, Refunding Series 1998A, 2.900%, 9/01/33 | 7/27 at 102.00 | 2,611,297 | |||||||||
| 1,350 | Missouri Health and Education Facilities Authority, Health Facilities Revenue Bonds, Saint Luke’s Health System, Inc., Series 2016, 5.000%, 11/15/35 | 5/26 at 100.00 | 1,360,821 | |||||||||
| 1,400 | Missouri Health and Educational Facilities Authority, Educational Facilities Revenue Bonds, Kansas City University of Medicine and Biosciences, Series 2017A, 5.000%, 6/01/42 | 6/27 at 100.00 | 1,384,021 | |||||||||
| 1,830 | Missouri Health and Educational Facilities Authority, Health Facilities Revenue Bonds, BJC Health System, Series 2021A, 4.000%, 7/01/40 | 7/31 at 100.00 | 1,623,730 | |||||||||
| 1,500 | Missouri Health and Educational Facilities Authority, Health Facilities Revenue Bonds, BJC Health System, Variable Rate Demand Obligation Series 2013C, 4.000%, 1/01/50, (Mandatory Put 1/01/46) | 7/26 at 100.00 | 1,250,499 | |||||||||
| 14,000 | (g) | Missouri Health and Educational Facilities Authority, Health Facilities Revenue Bonds, BJC Health System, Variable Rate Demand Obligation Series 2017D, 4.000%, 1/01/58, (Mandatory Put 1/01/48), (UB) | 1/28 at 100.00 | 11,549,639 | ||||||||
Principal Amount (000) | Description (a) | Optional Call Provisions (b) | Value | |||||||||
Missouri | ||||||||||||
| Missouri Health and Educational Facilities Authority, Health Facilities Revenue Bonds, CoxHealth, Fixed Series 2019A: | ||||||||||||
| $ | 4,165 | 4.000%, 11/15/44 | 5/29 at 100.00 | $ | 3,501,189 | |||||||
| 4,220 | 4.000%, 11/15/49 | 5/29 at 100.00 | 3,434,558 | |||||||||
| 17,300 | Missouri Health and Educational Facilities Authority, Health Facilities Revenue Bonds, CoxHealth, Series 2013A, 5.000%, 11/15/48 | 12/23 at 100.00 | 16,242,930 | |||||||||
| 5,110 | Missouri Health and Educational Facilities Authority, Health Facilities Revenue Bonds, CoxHealth, Series 2015A, 5.000%, 11/15/39 | 11/25 at 100.00 | 4,860,879 | |||||||||
| 1,400 | Missouri Health and Educational Facilities Authority, Health Facilities Revenue Bonds, Mercy Health, Series 2014F, 5.000%, 11/15/45 | 11/24 at 100.00 | 1,363,987 | |||||||||
| Missouri Health and Educational Facilities Authority, Health Facilities Revenue Bonds, Mercy Health, Series 2017C: | ||||||||||||
| 1,050 | 4.000%, 11/15/36 | 11/27 at 100.00 | 969,575 | |||||||||
| 2,980 | 4.000%, 11/15/37 | 11/27 at 100.00 | 2,700,496 | |||||||||
| 2,620 | 5.000%, 11/15/42 | 11/27 at 100.00 | 2,561,983 | |||||||||
| 2,500 | 5.000%, 11/15/47 | 11/27 at 100.00 | 2,412,579 | |||||||||
| 28,565 | Missouri Health and Educational Facilities Authority, Health Facilities Revenue Bonds, Mercy Health, Series 2020, 4.000%, 6/01/53 | 6/30 at 100.00 | 22,631,281 | |||||||||
| Missouri Health and Educational Facilities Authority, Health Facilities Revenue Bonds, Mosaic Health System, Series 2019A: | ||||||||||||
| 1,500 | 4.000%, 2/15/44 | 2/29 at 100.00 | 1,207,719 | |||||||||
| 2,000 | 4.000%, 2/15/49 | 2/29 at 100.00 | 1,589,103 | |||||||||
| 9,425 | 4.000%, 2/15/54 | 2/29 at 100.00 | 7,326,313 | |||||||||
| 3,000 | (c) | Missouri Health and Educational Facilities Authority, Health Facilities Revenue Bonds, SSM Health Care, Series 2014A, 4.000%, 6/01/33, (Pre- refunded 6/01/24) | 6/24 at 100.00 | 2,999,939 | ||||||||
| 3,000 | Missouri Health and Educational Facilities Authority, Health Facilities Revenue Bonds, SSM Health Care, Series 2022A, 4.000%, 6/01/52 | 6/32 at 100.00 | 2,346,367 | |||||||||
| 10,000 | Missouri Health and Educational Facilities Authority, Revenue Bonds, Children’s Mercy Hospital, Series 2017A, 4.000%, 5/15/42 | 5/25 at 102.00 | 8,489,794 | |||||||||
| Missouri Health and Educational Facilities Authority, Revenue Bonds, Lutheran Senior Services Projects, Series 2014A: | ||||||||||||
| 1,540 | 5.000%, 2/01/35 | 2/24 at 100.00 | 1,467,228 | |||||||||
| 2,000 | 5.000%, 2/01/44 | 2/24 at 100.00 | 1,756,545 | |||||||||
| 1,150 | Missouri Health and Educational Facilities Authority, Revenue Bonds, Lutheran Senior Services Projects, Series 2016A, 5.000%, 2/01/46 | 2/26 at 100.00 | 995,734 | |||||||||
| 700 | Missouri Health and Educational Facilities Authority, Revenue Bonds, Lutheran Senior Services Projects, Series 2016B, 5.000%, 2/01/34 | 2/26 at 100.00 | 672,800 | |||||||||
| 1,950 | Missouri Health and Educational Facilities Authority, Revenue Bonds, Lutheran Senior Services Projects, Series 2019A, 5.000%, 2/01/42 | 2/24 at 104.00 | 1,747,285 | |||||||||
| Missouri Health and Educational Facilities Authority, Revenue Bonds, Lutheran Senior Services Projects, Series 2019C: | ||||||||||||
| 1,500 | 5.000%, 2/01/42 | 2/29 at 102.00 | 1,344,065 | |||||||||
| 1,000 | 4.000%, 2/01/48 | 2/29 at 100.00 | 729,810 | |||||||||
| 7,085 | Missouri Joint Municipal Electric Utility Commission, Power Project Revenue Bonds, Pairie State Power Project, Refunding Series 2016A, 5.000%, 12/01/34 | 6/26 at 100.00 | 7,177,758 | |||||||||
| 5,000 | Saint Charles County Francis Howell School District, Missouri, General Obligation Bonds, Series 2022, 5.000%, 3/01/41 | 3/31 at 100.00 | 5,118,388 | |||||||||
Principal Amount (000) | Description (a) | Optional Call Provisions (b) | Value | |||||||||
Missouri | ||||||||||||
| Saint Charles County Public Water Supply District 2, Missouri, Certificates of Participation, Refudning Series 2016C: | ||||||||||||
| $ | 1,675 | 4.000%, 12/01/31 | 12/25 at 100.00 | $ | 1,661,195 | |||||||
| 2,535 | 5.000%, 12/01/32 | 12/25 at 100.00 | 2,573,331 | |||||||||
| 3,500 | Saint Louis County Industrial Development Authority, Missouri, Health Facilities Revenue Bonds, Ranken-Jordan Project, Refunding & Improvement Series 2016, 5.000%, 11/15/41 | 11/25 at 100.00 | 3,100,823 | |||||||||
| 220 | Saint Louis County Industrial Development Authority, Missouri, Revenue Bonds, Friendship Village of Sunset Hills, Series 2013A, 5.875%, 9/01/43 | 12/23 at 100.00 | 209,474 | |||||||||
| 7,250 | Saint Louis County Industrial Development Authority, Missouri, Revenue Bonds, Friendship Village Saint Louis Obligated Group, Series 2018A, 5.250%, 9/01/53 | 9/25 at 103.00 | 5,792,475 | |||||||||
| 2,300 | Taney County Industrial Development Authority, Missouri, Sales Tax Revenue Improvement Bonds, Big Cedar Infrastructure Project Series 2023, 6.000%, 10/01/49, 144A | 10/30 at 100.00 | 2,074,508 | |||||||||
| 605 | The Industrial Development Authority of the City of Saint Louis, Missouri, Development Financing Revenue Bonds, Ballpark Village Development Project, Series 2017A, 3.875%, 11/15/29 | 11/26 at 100.00 | 509,292 | |||||||||
| Total Missouri | 188,554,602 | |||||||||||
Montana - 0.5% (0.3% of Total Investments) | ||||||||||||
| 2,975 | Kalispell, Montana, Housing and Healthcare Facilities Revenue Bonds, Immanuel Lutheran Corporation, Series 2017A, 5.250%, 5/15/47 | 5/25 at 102.00 | 2,216,563 | |||||||||
| 4,965 | Montana Facility Finance Authority, Healthcare Facility Revenue Bonds, Kalispell Regional Medical Center, Series 2018B, 5.000%, 7/01/48 | 7/28 at 100.00 | 4,291,724 | |||||||||
| 3,310 | Montana Facility Finance Authority, Montana, Health Facilities Reveue Bonds, Bozeman Deaconess Health Services Obligated Group, Series 2018, 5.000%, 6/01/48 | 6/28 at 100.00 | 3,035,638 | |||||||||
| 1,825 | Montana Facility Finance Authority, Revenue Bonds, Billings Clinic Obligated Group, Series 2018A, 5.000%, 8/15/48 | 8/28 at 100.00 | 1,750,998 | |||||||||
| 6,130 | Montana State Board of Regents of Higher Education, General Revenue Bonds, Series 2022, 5.250%, 11/15/52 - AGM Insured | 11/32 at 100.00 | 6,235,784 | |||||||||
| Total Montana | 17,530,707 | |||||||||||
Nebraska - 1.0% (0.6% of Total Investments) | ||||||||||||
| 14,165 | Central Plains Energy Project, Nebraska, Gas Project 3 Revenue Bonds, Refunding Crossover Series 2017A, 5.000%, 9/01/42 | No Opt. Call | 13,320,042 | |||||||||
| 3,000 | Douglas County Hospital Authority 2, Nebraska, Health Facilities Revenue Bonds, Children’s Hospital Obligated Group, Series 2017, 5.000%, 11/15/47 | 5/27 at 100.00 | 2,875,357 | |||||||||
| 3,500 | Douglas County Hospital Authority 3, Nebraska, Health Facilities Revenue Bonds, Nebraska Methodist Health System, Refunding Series 2015, 5.000%, 11/01/45 | 11/25 at 100.00 | 3,384,075 | |||||||||
| Madison County Hospital Authority 1, Nebraska, Hospital Revenue Bonds, Faith Regional Health Services Project, Refunding Series 2017A: | ||||||||||||
| 2,150 | 5.000%, 7/01/29 | 7/27 at 100.00 | 2,124,166 | |||||||||
| 2,000 | 5.000%, 7/01/30 | 7/27 at 100.00 | 1,971,103 | |||||||||
| Madison County Hospital Authority 1, Nebraska, Hospital Revenue Bonds, Faith Regional Health Services Project, Series 2018: | ||||||||||||
| 1,000 | 5.000%, 7/01/32 | 7/25 at 100.00 | 1,001,210 | |||||||||
| 820 | 5.000%, 7/01/33 | 7/25 at 100.00 | 820,501 | |||||||||
| 2,000 | 5.000%, 7/01/34 | 7/25 at 100.00 | 1,994,839 | |||||||||
Principal Amount (000) | Description (a) | Optional Call Provisions (b) | Value | |||||||||
Nebraska | ||||||||||||
| $ | 5,110 | Municipal Energy Agency of Nebraska, Power Supply System Revenue Bonds, Refunding Series 2016A, 5.000%, 4/01/38 | 10/26 at 100.00 | $ | 5,221,567 | |||||||
| Total Nebraska | 32,712,860 | |||||||||||
Nevada - 2.7% (1.6% of Total Investments) | ||||||||||||
| 6,480 | Carson City, Nevada, Hospital Revenue Bonds, Carson Tahoe Regional Healthcare Project, Series 2017A, 5.000%, 9/01/47 | 9/27 at 100.00 | 5,851,464 | |||||||||
| 7,525 | Clark County, Nevada, General Obligation Bonds, Stadium Improvement, Limited Tax Additionally Secured by Pledged Revenues, Series 2018A, 5.000%, 5/01/48 | 6/28 at 100.00 | 7,525,233 | |||||||||
| 365 | Director of the State of Nevada Department of Business and Industry, Charter School Lease Revenue Bonds, Somerset Academy, Series 2018A, 5.000%, 12/15/38, 144A | 12/25 at 100.00 | 327,020 | |||||||||
| Henderson, Nevada, Limited Obligation Bonds, Local Improvement District T-18 Inspirada, Refunding Series 2016: | ||||||||||||
| 2,260 | 4.000%, 9/01/26 | No Opt. Call | 2,198,880 | |||||||||
| 1,505 | 4.000%, 9/01/27 | 9/26 at 100.00 | 1,445,606 | |||||||||
| 2,615 | 4.000%, 9/01/29 | 9/26 at 100.00 | 2,445,902 | |||||||||
| 2,870 | 4.000%, 9/01/30 | 9/26 at 100.00 | 2,651,134 | |||||||||
| 18,000 | Las Vegas Convention and Visitors Authority, Nevada, Convention Center Expansion Revenue Bonds, Series 2018B, 5.000%, 7/01/43 | 7/28 at 100.00 | 18,083,768 | |||||||||
| Las Vegas Valley Water District, Nevada, General Obligation Bonds, Refunding Series 2015: | ||||||||||||
| 5,000 | 5.000%, 6/01/32 | 12/24 at 100.00 | 5,052,954 | |||||||||
| 26,590 | 5.000%, 6/01/39 | 12/24 at 100.00 | 26,706,621 | |||||||||
| 11,915 | (g) | 5.000%, 6/01/39, (UB) | 12/24 at 100.00 | 11,967,258 | ||||||||
| Las Vegas Valley Water District, Nevada, General Obligation Bonds, Tender Option Bond Trust 2015-XF0233: | ||||||||||||
| 2,500 | (g) | 6.281%, 6/01/39, 144A, (IF) | 12/24 at 100.00 | 2,543,859 | ||||||||
| 1,250 | (g) | 6.281%, 6/01/39, 144A, (IF) | 12/24 at 100.00 | 1,271,930 | ||||||||
| 1,250 | (g) | 6.281%, 6/01/39, 144A, (IF) | 12/24 at 100.00 | 1,271,929 | ||||||||
| Total Nevada | 89,343,558 | |||||||||||
New Hampshire - 0.2% (0.1% of Total Investments) | ||||||||||||
| 1,500 | New Hampshire Health and Education Facilities Authority, Revenue Bonds, Concord Hospital, Series 2017, 5.000%, 10/01/47 | 10/27 at 100.00 | 1,381,252 | |||||||||
| New Hampshire Health and Education Facilities Authority, Revenue Bonds, Dartmouth-Hitchcock Obligated Group, Series 2018A: | ||||||||||||
| 1,115 | 5.000%, 8/01/36 | 2/28 at 100.00 | 1,122,695 | |||||||||
| 2,935 | 5.000%, 8/01/37 | 2/28 at 100.00 | 2,938,021 | |||||||||
| Total New Hampshire | 5,441,968 | |||||||||||
New Jersey - 7.7% (4.5% of Total Investments) | ||||||||||||
| 10,600 | New Jersey Economic Development Authority, Revenue Bonds, New Jersey Transit Corporation Projects Sublease, Refunding Series 2017B, 5.000%, 11/01/25 | No Opt. Call | 10,788,321 | |||||||||
| 6,000 | New Jersey Economic Development Authority, Revenue Bonds, Provident Group - Montclair Properties LLC, Montclair State University Student Housing Project, Refunding Series 2017, 5.000%, 6/01/42 - AGM Insured | 6/27 at 100.00 | 5,849,183 | |||||||||
| 20,890 | (c) | New Jersey Economic Development Authority, School Facilities Construction Bonds, Refunding Series 2016BBB, 5.500%, 6/15/30, (Pre- refunded 12/15/26) | 12/26 at 100.00 | 21,945,668 | ||||||||
Principal Amount (000) | Description (a) | Optional Call Provisions (b) | Value | |||||||||
New Jersey | ||||||||||||
| New Jersey Economic Development Authority, School Facilities Construction Bonds, Series 2014UU: | ||||||||||||
| $ | 5,515 | (c) | 5.000%, 6/15/30, (Pre-refunded 6/15/24) | 6/24 at 100.00 | $ | 5,551,572 | ||||||
| 4,065 | 5.000%, 6/15/40 | 6/24 at 100.00 | 4,084,517 | |||||||||
| 935 | (c) | 5.000%, 6/15/40, (Pre-refunded 6/15/24) | 6/24 at 100.00 | 941,200 | ||||||||
| New Jersey Economic Development Authority, School Facilities Construction Bonds, Series 2018EEE: | ||||||||||||
| 2,515 | 5.000%, 6/15/43 | 12/28 at 100.00 | 2,503,537 | |||||||||
| 370 | (c) | 5.000%, 6/15/43, (Pre-refunded 12/15/28) | 12/28 at 100.00 | 394,523 | ||||||||
| 2,415 | New Jersey Economic Development Authority, School Facilities Construction Bonds, Social Series 2021QQQ, 4.000%, 6/15/50 | 12/30 at 100.00 | 1,986,684 | |||||||||
| 2,500 | New Jersey Health Care Facilities Financing Authority, Revenue Bonds, Hackensack Meridian Health Obligated Group, Refunding Series 2017A, 5.000%, 7/01/37 | 7/27 at 100.00 | 2,540,730 | |||||||||
| 720 | New Jersey Health Care Facilities Financing Authority, Revenue Bonds, Robert Wood Johnson University Hospital, Series 2013A, 5.500%, 7/01/43 | 12/23 at 100.00 | 720,067 | |||||||||
| 19,385 | New Jersey Health Care Facilities Financing Authority, Revenue Bonds, RWJ Barnabas Health Obligated Group, Refunding Series 2016A, 5.000%, 7/01/43 | 7/26 at 100.00 | 19,178,928 | |||||||||
| 12,775 | New Jersey Health Care Facilities Financing Authority, Revenue Bonds, RWJ Barnabas Health Obligated Group, Series 2021A, 4.000%, 7/01/51 | 7/31 at 100.00 | 10,697,227 | |||||||||
| New Jersey Transportation Trust Fund Authority, Federal Highway Reimbursement Revenue Notes, Series 2016A-1: | ||||||||||||
| 3,050 | 5.000%, 6/15/28 | 6/26 at 100.00 | 3,102,351 | |||||||||
| 7,795 | 5.000%, 6/15/29 | 6/26 at 100.00 | 7,932,738 | |||||||||
| 5,450 | New Jersey Transportation Trust Fund Authority, Transportation Program Bonds, Series 2022BB, 4.000%, 6/15/46 | 12/31 at 100.00 | 4,647,224 | |||||||||
| 4,390 | New Jersey Transportation Trust Fund Authority, Transportation Program Bonds, Series 2022CC, 5.500%, 6/15/50 | 12/32 at 100.00 | 4,505,852 | |||||||||
| 4,000 | New Jersey Transportation Trust Fund Authority, Transportation Program Bonds, Series 2023AA, 5.000%, 6/15/40 | 6/33 at 100.00 | 4,035,342 | |||||||||
| New Jersey Transportation Trust Fund Authority, Transportation System Bonds, Capital Appreciation Series 2010A: | ||||||||||||
| 5,000 | 0.000%, 12/15/26 | No Opt. Call | 4,378,120 | |||||||||
| 16,495 | 0.000%, 12/15/33 | No Opt. Call | 10,210,636 | |||||||||
| New Jersey Transportation Trust Fund Authority, Transportation System Bonds, Refunding Series 2006C: | ||||||||||||
| 1,815 | 0.000%, 12/15/26 | No Opt. Call | 1,594,119 | |||||||||
| 10,000 | 0.000%, 12/15/30 - FGIC Insured | No Opt. Call | 7,253,656 | |||||||||
| 38,000 | 0.000%, 12/15/33 - AGM Insured | No Opt. Call | 24,039,826 | |||||||||
| 45,000 | 0.000%, 12/15/35 - AMBAC Insured | No Opt. Call | 24,993,014 | |||||||||
| 10,000 | 0.000%, 12/15/36 - AMBAC Insured | No Opt. Call | 5,192,730 | |||||||||
| 5,000 | New Jersey Transportation Trust Fund Authority, Transportation System Bonds, Series 2010D, 5.000%, 12/15/23 | No Opt. Call | 5,005,798 | |||||||||
| 5,000 | New Jersey Transportation Trust Fund Authority, Transportation System Bonds, Series 2019A, 5.000%, 12/15/32 | 12/29 at 100.00 | 5,205,770 | |||||||||
| 5,000 | New Jersey Transportation Trust Fund Authority, Transportation System Bonds, Series 2019BB, 4.000%, 6/15/44 | 12/28 at 100.00 | 4,282,366 | |||||||||
| 10,000 | New Jersey Transportation Trust Fund Authority, Transportation System Bonds, Series 2020AA, 4.000%, 6/15/50 | 12/30 at 100.00 | 8,314,125 | |||||||||
| 14,000 | New Jersey Turnpike Authority, Revenue Bonds, Refunding Series 2005D- 1, 5.250%, 1/01/26 - AGM Insured | No Opt. Call | 14,396,157 | |||||||||
Principal Amount (000) | Description (a) | Optional Call Provisions (b) | Value | |||||||||
New Jersey | ||||||||||||
| $ | 1,160 | New Jersey Turnpike Authority, Revenue Bonds, Series 2017B, 4.000%, 1/01/34 | 1/28 at 100.00 | $ | 1,137,001 | |||||||
| 1,500 | New Jersey Turnpike Authority, Turnpike Revenue Bonds, Series 2017G, 4.000%, 1/01/33 | 1/28 at 100.00 | 1,478,604 | |||||||||
| 5,500 | (g) | New Jersey Turnpike Authority, Turnpike Revenue Bonds, Series 2022B, 5.000%, 1/01/46, (UB) | 1/33 at 100.00 | 5,543,194 | ||||||||
| 3,000 | Rahway Valley Sewerage Authority, New Jersey, Sewer Revenue Bonds, Series 2005A, 0.000%, 9/01/25 - NPFG Insured | No Opt. Call | 2,779,794 | |||||||||
| 5,000 | South Jersey Transportation Authority, New Jersey, Transportation System Revenue Bonds, Series 2022A, 5.250%, 11/01/52 | 11/32 at 100.00 | 4,813,284 | |||||||||
| Tobacco Settlement Financing Corporation, New Jersey, Tobacco Settlement Asset-Backed Bonds, Series 2018A: | ||||||||||||
| 10,355 | 5.000%, 6/01/46 | 6/28 at 100.00 | 9,715,089 | |||||||||
| 4,710 | 5.250%, 6/01/46 | 6/28 at 100.00 | 4,630,288 | |||||||||
| 2,440 | Tobacco Settlement Financing Corporation, New Jersey, Tobacco Settlement Asset-Backed Bonds, Series 2018B, 5.000%, 6/01/46 | 6/28 at 100.00 | 2,265,367 | |||||||||
| Total New Jersey | 258,634,602 | |||||||||||
New Mexico - 0.2% (0.1% of Total Investments) | ||||||||||||
| 3,955 | New Mexico Hospital Equipment Loan Council, Hospital Revenue Bonds, Presbyterian Healthcare Services, Series 2019A, 4.000%, 8/01/48 | 8/29 at 100.00 | 3,163,863 | |||||||||
| 2,500 | University of New Mexico, Revenue Bonds, System Improvement Series 2023, 5.500%, 6/01/53 - AGM Insured | 6/33 at 100.00 | 2,611,270 | |||||||||
| Total New Mexico | 5,775,133 | |||||||||||
New York - 10.5% (6.2% of Total Investments) | ||||||||||||
| 7,000 | Brooklyn Arena Local Development Corporation, New York, Payment in Lieu of Taxes Revenue Bonds, Barclays Center Project, Series 2009, 0.000%, 7/15/45 | No Opt. Call | 1,960,953 | |||||||||
| Dormitory Authority of the State of New York, Revenue Bonds, New School University, Series 2015A: | ||||||||||||
| 11,930 | 5.000%, 7/01/50 | 7/25 at 100.00 | 11,077,303 | |||||||||
| 900 | (c) | 5.000%, 7/01/50, (Pre-refunded 7/01/25) | 7/25 at 100.00 | 917,040 | ||||||||
| 1,000 | Dormitory Authority of the State of New York, Revenue Bonds, Orange Regional Medical Center Obligated Group, Series 2017, 5.000%, 12/01/33, 144A | 6/27 at 100.00 | 914,184 | |||||||||
| Dormitory Authority of the State of New York, State Personal Income Tax Revenue Bonds, General Purpose Series 2015B Group C: | ||||||||||||
| 14,070 | 5.000%, 2/15/36 | 2/25 at 100.00 | 14,005,731 | |||||||||
| 5 | (c) | 5.000%, 2/15/36, (Pre-refunded 2/15/25) | 2/25 at 100.00 | 5,080 | ||||||||
| Dormitory Authority of the State of New York, State Personal Income Tax Revenue Bonds, General Purpose Series 2022A: | ||||||||||||
| 10,000 | 4.000%, 3/15/39 | 3/32 at 100.00 | 9,004,556 | |||||||||
| 19,335 | 5.000%, 3/15/46 | 3/32 at 100.00 | 19,489,923 | |||||||||
| 4,115 | 4.000%, 3/15/49 | 3/32 at 100.00 | 3,514,993 | |||||||||
| 14,800 | Dormitory Authority of the State of New York, State Personal Income Tax Revenue Bonds, General Purpose, Series 2019A. Bidding Group 1,2,3,4, 4.000%, 3/15/48 | 3/29 at 100.00 | 12,665,667 | |||||||||
| 37,175 | Dormitory Authority of the State of New York, State Personal Income Tax Revenue Bonds, General Purpose, Series 2019D, 4.000%, 2/15/47 | 2/30 at 100.00 | 31,972,058 | |||||||||
| 10,000 | Dormitory Authority of the State of New York, State Sales Tax Revenue Bonds, Series 2018E Group 2, 5.000%, 3/15/40 | 9/28 at 100.00 | 10,136,018 | |||||||||
Principal Amount (000) | Description (a) | Optional Call Provisions (b) | Value | |||||||||
New York | ||||||||||||
| $ | 1,645 | Genesee County Funding Corporation, New York, Revenue Bonds, Rochester Regional Health Project, Series 2022A, 5.250%, 12/01/52 | 12/32 at 100.00 | $ | 1,558,370 | |||||||
| 10,000 | Liberty Development Corporation, New York, Goldman Sachs Headquarter Revenue Bonds, Series 2005, 5.250%, 10/01/35 | No Opt. Call | 10,491,438 | |||||||||
| Long Island Power Authority, New York, Electric System General Revenue Bonds, Series 2014A: | ||||||||||||
| 1,045 | 4.000%, 9/01/39 - AGM Insured | 9/24 at 100.00 | 943,988 | |||||||||
| 780 | 5.000%, 9/01/44 | 9/24 at 100.00 | 771,608 | |||||||||
| 5,000 | Long Island Power Authority, New York, Electric System General Revenue Bonds, Series 2018, 5.000%, 9/01/37 | 9/28 at 100.00 | 5,129,540 | |||||||||
| 5,000 | New York City Municipal Water Finance Authority, New York, Water and Sewer System Second General Resolution Revenue Bonds, Fiscal 2020 Series EE, 4.000%, 6/15/42 | 6/30 at 100.00 | 4,386,649 | |||||||||
| 5,500 | New York City Municipal Water Finance Authority, New York, Water and Sewer System Second General Resolution Revenue Bonds, Fiscal 2020 Series GG-1, 4.000%, 6/15/50 | 6/30 at 100.00 | 4,643,612 | |||||||||
| 5,000 | New York City Transitional Finance Authority, New York, Future Tax Secured Bonds, Subordinate Fiscal 2019 Series A-1, 5.000%, 8/01/40 | 8/28 at 100.00 | 5,043,097 | |||||||||
| 7,000 | New York City Transitional Finance Authority, New York, Future Tax Secured Bonds, Subordinate Fiscal 2021 Subseries C-1, 4.000%, 5/01/46 | 11/30 at 100.00 | 5,998,572 | |||||||||
| 9,500 | New York City Transitional Finance Authority, New York, Future Tax Secured Bonds, Subordinate Fiscal 2021 Subseries E-1, 4.000%, 2/01/42 | 2/31 at 100.00 | 8,419,464 | |||||||||
| New York City Transitional Finance Authority, New York, Future Tax Secured Bonds, Subordinate Fiscal 2022 Subseries F-1: | ||||||||||||
| 13,000 | 5.000%, 2/01/47 | 2/32 at 100.00 | 13,045,825 | |||||||||
| 1,500 | 5.000%, 2/01/51 | 2/32 at 100.00 | 1,491,484 | |||||||||
| 2,060 | New York City, New York, General Obligation Bonds, Fiscal 2017 Series B-1, 5.000%, 12/01/41 | 12/26 at 100.00 | 2,070,385 | |||||||||
| 10,370 | New York City, New York, General Obligation Bonds, Fiscal 2020 Series A-1, 4.000%, 8/01/42 | 8/29 at 100.00 | 9,082,881 | |||||||||
| 3,500 | New York City, New York, General Obligation Bonds, Fiscal 2020 SeriesD-1, 4.000%, 3/01/50 | 3/30 at 100.00 | 2,929,779 | |||||||||
| 12,000 | New York City, New York, General Obligation Bonds, Fiscal 2021 Series F-1, 4.000%, 3/01/47 | 3/31 at 100.00 | 10,208,164 | |||||||||
| 12,000 | New York City, New York, General Obligation Bonds, Fiscal 2022 Series A-1, 5.000%, 8/01/47 | 8/31 at 100.00 | 11,972,114 | |||||||||
| 3,665 | New York City, New York, General Obligation Bonds, Fiscal 2024 Series A, 5.000%, 8/01/51 | 8/33 at 100.00 | 3,638,600 | |||||||||
| 10 | New York City, New York, General Obligation Bonds, Fiscal Series 1996J, 5.500%, 2/15/26 | 12/23 at 100.00 | 10,015 | |||||||||
| 5 | New York City, New York, General Obligation Bonds, Fiscal Series 1997H, 6.125%, 8/01/25 | 12/23 at 100.00 | 5,009 | |||||||||
| 23,920 | New York Liberty Development Corporation, New York, Liberty Revenue Bonds, 3 World Trade Center Project, Class 1 Series 2014, 5.000%, 11/15/44, 144A | 11/24 at 100.00 | 21,423,955 | |||||||||
| 1,590 | New York Liberty Development Corporation, New York, Liberty Revenue Bonds, Secured by Port Authority Consolidated Bonds, Refunding Series 1WTC-2021, 4.000%, 2/15/43 - BAM Insured | 2/30 at 100.00 | 1,349,087 | |||||||||
| 10,000 | New York State Thruway Authority, General Revenue Junior Indebtedness Obligations, Series 2016A, 5.250%, 1/01/56 | 1/26 at 100.00 | 9,889,816 | |||||||||
Principal Amount (000) | Description (a) | Optional Call Provisions (b) | Value | |||||||||
New York | ||||||||||||
| $ | 5,900 | New York State Thruway Authority, State Personal Income Tax Revenue Bonds, Bidding Group 1 Series 2022A, 4.000%, 3/15/50 | 9/32 at 100.00 | $ | 5,032,107 | |||||||
| 4,000 | New York State Thruway Authority, State Personal Income Tax Revenue Bonds, Transportation Series 2021A-1, 4.000%, 3/15/44 | 3/31 at 100.00 | 3,484,491 | |||||||||
| New York State Urban Development Corporation, State Personal Income Tax Revenue Bonds, General Purpose, Series 2022A: | ||||||||||||
| 25,035 | 5.000%, 3/15/45 | 9/32 at 100.00 | 25,201,731 | |||||||||
| 5,500 | 5.000%, 3/15/46 | 9/32 at 100.00 | 5,514,768 | |||||||||
| 7,500 | New York State Urban Development Corporation, State Sales Tax Revenue Bonds, Series 2019A, 5.000%, 3/15/40 | 9/29 at 100.00 | 7,662,797 | |||||||||
| 3,925 | (c) | Port Authority of New York and New Jersey, Consolidated Revenue Bonds, One Hundred Seventy Ninth Series 2013, 5.000%, 12/01/38, (Pre- refunded 12/14/23) | 12/23 at 100.00 | 3,929,622 | ||||||||
| 5,000 | Triborough Bridge and Tunnel Authority, New York, General Purpose Revenue Bonds, Refunding Series 2015A, 5.000%, 11/15/50 | 5/25 at 100.00 | 4,945,096 | |||||||||
| Triborough Bridge and Tunnel Authority, New York, General Purpose Revenue Bonds, Refunding Subordinate Lien Series 2013A: | ||||||||||||
| 10,725 | 0.000%, 11/15/31 | No Opt. Call | 7,419,619 | |||||||||
| 1,105 | 0.000%, 11/15/32 | No Opt. Call | 726,816 | |||||||||
| 1,300 | Triborough Bridge and Tunnel Authority, New York, General Revenue Bonds, MTA Bridges & Tunnels, Series 2020A, 5.000%, 11/15/54 | 11/30 at 100.00 | 1,285,535 | |||||||||
| Triborough Bridge and Tunnel Authority, New York, Payroll Mobility Tax Bonds, Senior Lien Series 2022 A: | ||||||||||||
| 3,265 | 5.000%, 5/15/44 | 5/32 at 100.00 | 3,298,835 | |||||||||
| 9,695 | 5.000%, 5/15/57 | 5/32 at 100.00 | 9,507,109 | |||||||||
| Triborough Bridge and Tunnel Authority, New York, Sales Tax Revenue Bonds, MTA Bridges & Tunnels, TBTA Capital Lockbox-City Sales Tax, Series 2022A: | ||||||||||||
| 6,500 | 5.000%, 5/15/47 | 11/32 at 100.00 | 6,548,619 | |||||||||
| 12,000 | 5.250%, 5/15/52 | 11/32 at 100.00 | 12,286,391 | |||||||||
| 5,000 | TSASC Inc., New York, Tobacco Asset-Backed Bonds, Series 2006, 5.000%, 6/01/45 | 6/27 at 100.00 | 4,285,819 | |||||||||
| Total New York | 351,296,313 | |||||||||||
North Carolina - 4.0% (2.3% of Total Investments) | ||||||||||||
| Buncombe County, North Carolina, Limited Obligation Bonds, Refunding Series 2014A: | ||||||||||||
| 1,085 | (c) | 5.000%, 6/01/33, (Pre-refunded 6/01/24) | 6/24 at 100.00 | 1,091,757 | ||||||||
| 1,600 | (c) | 5.000%, 6/01/34, (Pre-refunded 6/01/24) | 6/24 at 100.00 | 1,609,965 | ||||||||
| Catawba County, North Carolina, General Obligation Bonds, Limited Obligation Series 2014A: | ||||||||||||
| 1,000 | 5.000%, 6/01/30 | 6/24 at 100.00 | 1,003,035 | |||||||||
| 730 | 5.000%, 6/01/31 | 6/24 at 100.00 | 731,814 | |||||||||
| Charlotte, North Carolina, Airport Revenue Bonds, Charlotte Douglas International, Refunding Series 2017A: | ||||||||||||
| 1,365 | (g) | 5.000%, 7/01/42, (UB) | 7/27 at 100.00 | 1,371,141 | ||||||||
| 5,390 | (g) | 5.000%, 7/01/47, (UB) | 7/27 at 100.00 | 5,393,867 | ||||||||
| 5,000 | Charlotte, North Carolina, Airport Revenue Bonds, Charlotte Douglas International, Series 2023A, 5.000%, 7/01/48 | 7/33 at 100.00 | 5,045,468 | |||||||||
| 2,045 | Charlotte, North Carolina, Storm Water Fee Revenue Bonds, Refunding Series 2014, 5.000%, 12/01/39 | 12/24 at 100.00 | 2,048,163 | |||||||||
Principal Amount (000) | Description (a) | Optional Call Provisions (b) | Value | |||||||||
North Carolina | ||||||||||||
| $ | 2,325 | Charlotte, North Carolina, Water and Sewer System Revenue Bonds, Refunding Series 2015, 5.000%, 7/01/40 | 7/25 at 100.00 | $ | 2,335,777 | |||||||
| 4,000 | Charlotte-Mecklenburg Hospital Authority, North Carolina, Health Care Revenue Bonds, Doing Business as Atrium Health, Refunding Series 2018A, 5.000%, 1/15/36 | 1/29 at 100.00 | 4,103,145 | |||||||||
| 4,750 | Greensboro, North Carolina, Combined Enterprise System Revenue Bonds, Series 2017A, 4.000%, 6/01/47 | 6/27 at 100.00 | 4,096,922 | |||||||||
| 2,000 | (c) | Greensboro, North Carolina, Limited Obligation Bonds, Coliseum Complex Project, Series 2018A, 5.000%, 4/01/42, (Pre-refunded 4/01/28) | 4/28 at 100.00 | 2,122,616 | ||||||||
| 500 | Henderson County, North Carolina, Limited Obligation Bonds, Series 2015, 5.000%, 10/01/31 | 10/25 at 100.00 | 507,106 | |||||||||
| 84 | Hillsborough, North Carolina, Special Assessement Revenue Bonds, Series 2013, 7.750%, 2/01/24 | 12/23 at 100.00 | 83,833 | |||||||||
| 6,140 | (c) | New Hanover County, North Carolina, Hospital Revenue Bonds, New Hanover Regional Medical Center, Series 2017, 5.000%, 10/01/47, (Pre-refunded 10/01/27) | 10/27 at 100.00 | 6,426,251 | ||||||||
| 1,800 | North Carolina Agricultural & Technical State University, General Revenue Bonds, Refunding Series 2015A, 5.000%, 10/01/40 | 10/25 at 100.00 | 1,812,838 | |||||||||
| 3,900 | North Carolina Capital Facilities Finance Agency, Revenue Bonds, Duke University Project, Refunding Series 2016B, 5.000%, 7/01/42 | 10/26 at 100.00 | 3,916,013 | |||||||||
| 9,485 | (c),(g) | North Carolina Capital Facilities Finance Agency, Revenue Bonds, Duke University Project, Series 2015 A, 5.000%, 10/01/55, (Pre-refunded 10/01/25), (UB) | 10/25 at 100.00 | 9,700,529 | ||||||||
| 1,605 | (c),(g) | North Carolina Capital Facilities Finance Agency, Revenue Bonds, Duke University Project, Series 2015 A, 5.000%, 10/01/55, (Pre-refunded 10/01/25) | 10/25 at 100.00 | 1,641,471 | ||||||||
| 5,000 | North Carolina Capital Facilities Financing Agency, Educational Facility Revenue Bonds, Wake Forest University, Refunding Series 2016, 4.000%, 1/01/37 | 7/26 at 100.00 | 4,668,178 | |||||||||
| 2,500 | North Carolina Capital Facilities Financing Agency, Educational Facility Revenue Bonds, Wake Forest University, Series 2018, 5.000%, 1/01/48 | 1/28 at 100.00 | 2,503,523 | |||||||||
| North Carolina Medical Care Commission, Retirement Facilities First Mortgage Revenue Bonds, Southminster Project, Refunding Series 2016: | ||||||||||||
| 700 | 5.000%, 10/01/31 | 10/24 at 102.00 | 665,673 | |||||||||
| 2,720 | 5.000%, 10/01/37 | 10/24 at 102.00 | 2,404,590 | |||||||||
| 3,000 | North Carolina Medical Care Commission, Health Care Facilities Revenue Bonds, Wake Forest Baptist Obligated Group, Series 2012A, 5.000%, 12/01/45 | 12/23 at 100.00 | 2,896,546 | |||||||||
| 500 | North Carolina Medical Care Commission, Revenue Bonds, First Mortgage Galloway Ridge Project, Refunding Series 2019A, 5.000%, 1/01/39 | 1/27 at 103.00 | 427,020 | |||||||||
| North Carolina Municipal Power Agency 1, Catawba Electric Revenue Bonds, Refunding Series 2015A: | ||||||||||||
| 1,545 | 5.000%, 1/01/28 | 1/26 at 100.00 | 1,569,999 | |||||||||
| 1,500 | 5.000%, 1/01/32 | 1/26 at 100.00 | 1,517,735 | |||||||||
| North Carolina Turnpike Authority, Monroe Expressway Toll Revenue Bonds, Capital Appreciation Series 2017C: | ||||||||||||
| 835 | 0.000%, 7/01/28 | 7/26 at 91.99 | 661,711 | |||||||||
| 800 | 0.000%, 7/01/30 | 7/26 at 83.69 | 572,354 | |||||||||
| 850 | 0.000%, 7/01/31 | 7/26 at 79.58 | 577,170 | |||||||||
| 2,400 | 0.000%, 7/01/33 | 7/26 at 71.99 | 1,471,443 | |||||||||
| 3,160 | 0.000%, 7/01/36 | 7/26 at 61.63 | 1,616,932 | |||||||||
| 3,100 | 0.000%, 7/01/37 | 7/26 at 58.52 | 1,476,236 | |||||||||
| 1,900 | 0.000%, 7/01/40 | 7/26 at 50.36 | 733,608 | |||||||||
Principal Amount (000) | Description (a) | Optional Call Provisions (b) | Value | |||||||||
North Carolina | ||||||||||||
| $ | 400 | North Carolina Turnpike Authority, Monroe Expressway Toll Revenue Bonds, Series 2017A, 5.000%, 7/01/47 | 7/26 at 100.00 | $ | 379,439 | |||||||
| 2,200 | North Carolina Turnpike Authority, Triangle Expressway System Revenue Bonds, Refunding Senior Lien Series 2017, 5.000%, 1/01/39 - AGM Insured | 1/27 at 100.00 | 2,206,390 | |||||||||
| 1,000 | North Carolina Turnpike Authority, Triangle Expressway System Revenue Bonds, Refunding Series 2018, 5.000%, 1/01/40 | 1/29 at 100.00 | 987,594 | |||||||||
| North Carolina Turnpike Authority, Triangle Expressway System Revenue Bonds, Senior Lien Series 2009B: | ||||||||||||
| 150 | 0.000%, 1/01/31 - AGC Insured | No Opt. Call | 108,357 | |||||||||
| 4,375 | 0.000%, 1/01/33 - AGC Insured | No Opt. Call | 2,850,097 | |||||||||
| 2,300 | 0.000%, 1/01/34 - AGC Insured | No Opt. Call | 1,423,286 | |||||||||
| 2,380 | 0.000%, 1/01/35 - AGC Insured | No Opt. Call | 1,393,847 | |||||||||
| 7,575 | 0.000%, 1/01/37 - AGC Insured | No Opt. Call | 3,906,659 | |||||||||
| 1,470 | 0.000%, 1/01/38 - AGC Insured | No Opt. Call | 701,884 | |||||||||
| 10,000 | North Carolina Turnpike Authority, Triangle Expressway System Revenue Bonds, Senior Lien Series 2019, 5.000%, 1/01/49 | 1/30 at 100.00 | 9,572,387 | |||||||||
| 3,040 | Oak Island, North Carolina, Enterprise System Revenue Bonds, Refunding Series 2015, 5.000%, 6/01/33 | 6/25 at 100.00 | 3,070,864 | |||||||||
| 5,000 | Raleigh, North Carolina, Combined Enterprise System Revenue Bonds, Refunding Series 2016A, 4.000%, 3/01/46 | 3/27 at 100.00 | 4,344,451 | |||||||||
| Sampson County, North Carolina, Limited Obligaiton Bonds, Refunding Series 2017: | ||||||||||||
| 1,250 | 4.000%, 9/01/35 | 9/27 at 100.00 | 1,178,440 | |||||||||
| 1,265 | 4.000%, 9/01/36 | 9/27 at 100.00 | 1,169,137 | |||||||||
| 1,000 | 4.000%, 9/01/37 | 9/27 at 100.00 | 904,529 | |||||||||
| 800 | (c) | University of North Carolina, Charlotte, General Revenue Bonds, Refunding Series 2015, 5.000%, 4/01/45, (Pre-refunded 4/01/25) | 4/25 at 100.00 | 813,438 | ||||||||
| University of North Carolina, Charlotte, General Revenue Bonds, Series 2014: | ||||||||||||
| 2,070 | (c) | 5.000%, 4/01/32, (Pre-refunded 4/01/24) | 4/24 at 100.00 | 2,079,915 | ||||||||
| 1,175 | (c) | 5.000%, 4/01/33, (Pre-refunded 4/01/24) | 4/24 at 100.00 | 1,180,628 | ||||||||
| 1,385 | (c) | 5.000%, 4/01/35, (Pre-refunded 4/01/24) | 4/24 at 100.00 | 1,391,634 | ||||||||
| 4,735 | University of North Carolina, Charlotte, General Revenue Bonds, Series 2017, 5.000%, 10/01/42 | 10/27 at 100.00 | 4,785,796 | |||||||||
| University of North Carolina, Greensboro, General Revenue Bonds, Series 2014: | ||||||||||||
| 1,000 | 5.000%, 4/01/32 | 4/24 at 100.00 | 1,002,943 | |||||||||
| 3,065 | 5.000%, 4/01/39 | 4/24 at 100.00 | 3,074,020 | |||||||||
| 4,765 | University of North Carolina, Greensboro, General Revenue Bonds, Series 2018, 5.000%, 4/01/43 | 4/28 at 100.00 | 4,840,035 | |||||||||
| 1,250 | Western Carolina University, North Carolina, General Revenue Bonds, Refunding Series 2015A, 5.000%, 10/01/45 | 10/25 at 100.00 | 1,253,919 | |||||||||
| Total North Carolina | 133,424,118 | |||||||||||
North Dakota - 0.9% (0.5% of Total Investments) | ||||||||||||
| Grand Forks, North Dakota, Health Care System Revenue Bonds, Altru Health System Obligated Group, Series 2017A: | ||||||||||||
| 1,000 | 5.000%, 12/01/37 | 12/27 at 100.00 | 931,240 | |||||||||
| 8,525 | 5.000%, 12/01/42 | 12/27 at 100.00 | 7,637,111 | |||||||||
| 7,070 | 4.000%, 12/01/47 | 12/27 at 100.00 | 5,305,308 | |||||||||
| 1,800 | Grand Forks, North Dakota, Health Care System Revenue Bonds, Altru Health System Obligated Group, Series 2021, 4.000%, 12/01/51 | 12/31 at 100.00 | 1,318,262 | |||||||||
Principal Amount (000) | Description (a) | Optional Call Provisions (b) | Value | |||||||||
North Dakota | ||||||||||||
| $ | 645 | Grand Forks, North Dakota, Health Care System Revenue Bonds, Altru Health System Obligated Group, Series 2023A, 5.000%, 12/01/53 - AGM Insured | 12/33 at 100.00 | $ | 614,039 | |||||||
| 900 | Grand Forks, North Dakota, Senior Housing & Nursing Facilities Revenue Bonds, Valley Homes and Services Obligated Group, Series 2017, 5.000%, 12/01/36 | 12/26 at 100.00 | 761,749 | |||||||||
| 500 | Grand Forks, North Dakota, Senior Housing and Nursing Facilities Revenue Bonds, Valley Homes Obligated Group, Series 2016A, 5.125%, 12/01/24 | No Opt. Call | 496,232 | |||||||||
| 2,700 | University of North Dakota, Certificates of Participation, Housing Infrastructure Project, Series 2021A, 4.000%, 6/01/51 - AGM Insured | 6/30 at 100.00 | 2,137,154 | |||||||||
| Ward County Health Care, North Dakota, Revenue Bonds, Trinity Obligated Group, Series 2017C: | ||||||||||||
| 11,065 | 5.000%, 6/01/43 | 6/28 at 100.00 | 8,320,170 | |||||||||
| 2,610 | 5.000%, 6/01/48 | 6/28 at 100.00 | 1,855,212 | |||||||||
| 1,420 | (d) | Williston, North Dakota, Multifamily Housing Revenue Bonds, Eagle Crest Apartments LLC Project, Series 2013, 7.750%, 9/01/38 | 12/23 at 100.00 | 994,000 | ||||||||
| Total North Dakota | 30,370,477 | |||||||||||
Ohio - 5.1% (3.0% of Total Investments) | ||||||||||||
| Akron, Bath and Copley Joint Township Hospital District, Ohio, Hospital Facilities Revenue Bonds, Summa Health System, Refunding & Improvement Series 2016: | ||||||||||||
| 3,020 | 5.250%, 11/15/41 | 11/26 at 100.00 | 2,885,355 | |||||||||
| 8,255 | 5.250%, 11/15/46 | 11/26 at 100.00 | 7,591,988 | |||||||||
| 10,940 | Allen County, Ohio, Hospital Facilities Revenue Bonds, Mercy Health, Refunding & Improvement Series 2015A, 5.000%, 11/01/43 | 11/24 at 100.00 | 10,747,079 | |||||||||
| 8,655 | Allen County, Ohio, Hospital Facilities Revenue Bonds, Mercy Health, Series 2017A, 4.000%, 8/01/38 | 2/28 at 100.00 | 7,743,384 | |||||||||
| 2,750 | Bowling Green State University, Ohio, General Receipts Bonds, Series 2017B, 5.000%, 6/01/42 | 6/27 at 100.00 | 2,766,404 | |||||||||
| 25,315 | Buckeye Tobacco Settlement Financing Authority, Ohio, Tobacco Settlement Asset-Backed Revenue Bonds, Refunding Senior Lien Capital Appreciation Series 2020B-3 Class 2, 0.000%, 6/01/57 | 6/30 at 22.36 | 2,135,989 | |||||||||
| 1,095 | Buckeye Tobacco Settlement Financing Authority, Ohio, Tobacco Settlement Asset-Backed Revenue Bonds, Refunding Senior Lien Series 2020A-2 Class 1, 4.000%, 6/01/48 | 6/30 at 100.00 | 876,385 | |||||||||
| 40,755 | Buckeye Tobacco Settlement Financing Authority, Ohio, Tobacco Settlement Asset-Backed Revenue Bonds, Refunding Senior Lien Series 2020B-2 Class 2, 5.000%, 6/01/55 | 6/30 at 100.00 | 33,386,280 | |||||||||
| 5,000 | Cleveland Clinic Health System Obligated Group, Ohio, Martin County Health Facilities Authority, Hospital Revenue Bonds, Series 2019B, 4.000%, 1/01/43 | 1/29 at 100.00 | 4,280,499 | |||||||||
| Cleveland-Cuyahoga County Port Authroity, Ohio, Cultural Facility Revenue Bonds, The Cleveland Museum of Natural History Project, Series 2021: | ||||||||||||
| 300 | 4.000%, 7/01/37 | 7/31 at 100.00 | 270,876 | |||||||||
| 300 | 4.000%, 7/01/38 | 7/31 at 100.00 | 264,135 | |||||||||
| 1,000 | 4.000%, 7/01/51 | 7/31 at 100.00 | 786,015 | |||||||||
| 5,165 | Cuyahoga Community College District, Ohio, General Obligation Bonds, Facilities Construction & Improvement Series 2018, 4.000%, 12/01/38 | 6/26 at 100.00 | 4,644,488 | |||||||||
| 5,975 | Fairfield County, Ohio, Hospital Facilities Revenue Bonds, Fairfield Medical Center Project, Series 2013, 5.000%, 6/15/43 | 12/23 at 100.00 | 4,692,868 | |||||||||
Principal Amount (000) | Description (a) | Optional Call Provisions (b) | Value | |||||||||
Ohio | ||||||||||||
| Hamilton County, Ohio, Healthcare Revenue Bonds, Life Enriching Communities Project, Series 2017A: | ||||||||||||
| $ | 1,500 | 5.000%, 1/01/47 | 1/27 at 100.00 | $ | 1,251,163 | |||||||
| 1,120 | 5.000%, 1/01/52 | 1/27 at 100.00 | 909,011 | |||||||||
| Hamilton County, Ohio, Healthcare Revenue Bonds, Life Enriching Communities, Refunding & Improvement Series 2016: | ||||||||||||
| 3,425 | 5.000%, 1/01/46 | 1/26 at 100.00 | 2,878,733 | |||||||||
| 6,000 | 5.000%, 1/01/51 | 1/26 at 100.00 | 4,891,105 | |||||||||
| 3,000 | Hamilton County, Ohio, Hospital Facilities Revenue Bonds, TriHealth, Inc. Obligated Group Project, Series 2017A, 5.000%, 8/15/42 | 8/27 at 100.00 | 2,911,240 | |||||||||
| 5,000 | Miami County, Ohio, Hospital Facilities Revenue Bonds, Kettering Health Network Obligated Group Project, Refunding Improvement Series 2019, 5.000%, 8/01/49 | 8/28 at 100.00 | 4,780,292 | |||||||||
| 6,000 | Middletown City School District, Butler County, Ohio, General Obligation Bonds, Refunding Series 2007, 5.250%, 12/01/31 - AGM Insured | No Opt. Call | 6,454,684 | |||||||||
| 21,000 | (c) | Northeast Ohio Regional Sewer District, Wastewater Improvement Revenue Bonds, Refunding & Improvement Series 2014, 5.000%, 11/15/49, (Pre-refunded 11/15/24) | 11/24 at 100.00 | 21,216,096 | ||||||||
| 3,000 | Ohio Higher Educational Facility Commission, Revenue Bonds, University of Dayton, Series 2018A, 5.000%, 12/01/48 | 6/28 at 100.00 | 2,932,087 | |||||||||
| 3,195 | Ohio State, Hospital Revenue Bonds, University Hospitals Health System, Inc., Fixed Interest Rate Series 2020A, 5.000%, 1/15/50 | 1/30 at 100.00 | 2,934,906 | |||||||||
| 7,065 | Ohio State, Hospital Revenue Bonds, University Hospitals Health System, Inc., Series 2021A, 4.000%, 1/15/46 | 7/31 at 100.00 | 5,681,874 | |||||||||
| 7,550 | Ohio State, Turnpike Revenue Bonds, Ohio Turnpike and Infrastructutre Commission Infrastructure Projects, Junior Lien, Capital Appreciation Series 2013A-3, 5.800%, 2/15/36 | 2/31 at 100.00 | 8,376,178 | |||||||||
| 9,000 | Ohio State, Turnpike Revenue Bonds, Ohio Turnpike and Infrastructutre Commission, Infrastructure Projects, Junior Lien Series 2018A, 4.000%, 2/15/46 | 2/28 at 100.00 | 7,517,813 | |||||||||
| 2,400 | Ohio Water Development Authority, Water Pollution Control Loan Fund Revenue Bonds, Green Series 2023B, 5.000%, 12/01/43 | 6/33 at 100.00 | 2,484,518 | |||||||||
| 4,250 | Pickerington Local School District, Fairfield and Franklin Counties, Ohio, General Obligation Bonds, School Facilities Construction & Improvement, Series 2023, 5.250%, 12/01/59 | 12/32 at 100.00 | 4,332,382 | |||||||||
| 4,190 | Springboro Community City School District, Warren County, Ohio, General Obligation Bonds, Refunding Series 2007, 5.250%, 12/01/26 - AGM Insured | No Opt. Call | 4,343,170 | |||||||||
| 3,670 | Tuscarawas County Economic Development and Finance Alliance, Ohio, Higher Education Facilities Revenue Bonds, Ashland University, Refunding & Improvement Series 2015, 6.000%, 3/01/45 | 3/25 at 100.00 | 3,345,361 | |||||||||
| Total Ohio | 170,312,358 | |||||||||||
Oklahoma - 0.3% (0.2% of Total Investments) | ||||||||||||
| 1,165 | Norman Regional Hospital Authority, Oklahoma, Hospital Revenue Bonds, Series 2019, 5.000%, 9/01/45 | 9/29 at 100.00 | 1,048,254 | |||||||||
| Oklahoma Development Finance Authority, Health System Revenue Bonds, OU Medicine Project, Series 2018B: | ||||||||||||
| 3,135 | 5.500%, 8/15/52 | 8/28 at 100.00 | 2,718,173 | |||||||||
| 6,340 | 5.500%, 8/15/57 | 8/28 at 100.00 | 5,421,946 | |||||||||
Principal Amount (000) | Description (a) | Optional Call Provisions (b) | Value | |||||||||
Oklahoma | ||||||||||||
| $ | 1,125 | Tulsa County Industrial Authority, Oklahoma, Senior Living Community Revenue Bonds, Montereau, Inc Project, Refunding Series 2017, 5.250%, 11/15/37 | 11/25 at 102.00 | $ | 1,060,951 | |||||||
| Total Oklahoma | 10,249,324 | |||||||||||
Oregon - 2.9% (1.7% of Total Investments) | ||||||||||||
| Clackamas Community College District, Oregon, General Obligation Bonds, Deferred Interest Series 2017A: | ||||||||||||
| 760 | 5.000%, 6/15/38 | 6/27 at 100.00 | 775,387 | |||||||||
| 1,000 | 5.000%, 6/15/39 | 6/27 at 100.00 | 1,018,235 | |||||||||
| 1,725 | 5.000%, 6/15/40 | 6/27 at 100.00 | 1,754,148 | |||||||||
| 1,185 | Clackamas County Hospital Facility Authority, Oregon, Revenue Bonds, Rose Villa Inc., Series 2020A, 5.375%, 11/15/55 | 11/25 at 102.00 | 984,358 | |||||||||
| 1,310 | Columbia County School District 502 Saint Helens, Oregon, General Obligation Bonds, Series 2017, 5.000%, 6/15/38 | 6/27 at 100.00 | 1,341,365 | |||||||||
| 4,170 | Eugene, Oregon, Electric Utility Revenue Bonds, Series 2020A, 4.000%, 8/01/45 | 8/30 at 100.00 | 3,535,455 | |||||||||
| 2,250 | Eugene, Oregon, Water Utility System Revenue Bonds, Series 2023, 5.000%, 8/01/52 | 8/33 at 100.00 | 2,282,899 | |||||||||
| 2,820 | Oregon Facilities Authority, Revenue Bonds, Legacy Health Project, Series 2016A, 5.000%, 6/01/46 | 6/26 at 100.00 | 2,689,045 | |||||||||
| 7,895 | Oregon Facilities Authority, Revenue Bonds, Legacy Health Project, Series 2022A, 5.000%, 6/01/52 | 6/32 at 100.00 | 7,255,666 | |||||||||
| Oregon Facilities Authority, Revenue Bonds, Samaritan Health Services, Refunding Series 2016A: | ||||||||||||
| 6,275 | 5.000%, 10/01/35 | 10/26 at 100.00 | 6,280,460 | |||||||||
| 2,120 | 5.000%, 10/01/46 | 10/26 at 100.00 | 1,886,405 | |||||||||
| 140 | (c) | 5.000%, 10/01/46, (Pre-refunded 10/01/26) | 10/26 at 100.00 | 144,281 | ||||||||
| 23,400 | Oregon Health and Science University, Revenue Bonds, Green Series 2021A, 4.000%, 7/01/51 | 1/32 at 100.00 | 19,135,996 | |||||||||
| 4,100 | Port of Portland, Oregon, Portland International Airport, Revenue Bonds, Series 2019 25A, 5.000%, 7/01/49 | 7/29 at 100.00 | 4,001,599 | |||||||||
| Salem Hospital Facility Authority, Oregon, Revenue Bonds, Salem Health Projects, Refunding Series 2016A: | ||||||||||||
| 4,000 | 4.000%, 5/15/41 | 5/26 at 100.00 | 3,334,380 | |||||||||
| 13,220 | 5.000%, 5/15/46 | 5/26 at 100.00 | 12,592,955 | |||||||||
| 8,005 | Salem Hospital Facility Authority, Oregon, Revenue Bonds, Salem Health Projects, Series 2019A, 5.000%, 5/15/44 | 5/29 at 100.00 | 7,408,102 | |||||||||
| 10,805 | Tualatin Valley Water District, Oregon, Water Revenue Bonds, Series 2023, 5.000%, 6/01/48 | 6/33 at 100.00 | 10,944,139 | |||||||||
| 10,000 | University of Oregon, General Revenue Bonds, Series 2020A, 5.000%, 4/01/50 | 4/30 at 100.00 | 10,040,015 | |||||||||
| 500 | Warm Springs Reservation Confederated Tribes, Oregon, Hydroelectric Revenue Bonds, Tribal Economic Development Bond Pelton Round Butte Project, Taxable Refunding Green Series 2019B, 5.000%, 11/01/36, 144A | 5/29 at 100.00 | 516,462 | |||||||||
| Total Oregon | 97,921,352 | |||||||||||
Pennsylvania - 5.7% (3.3% of Total Investments) | ||||||||||||
| Allegheny County Sanitary Authority, Pennsylvania, Sewer Revenue Bonds, Series 2020B: | ||||||||||||
| 1,670 | 4.000%, 6/01/45 | 12/30 at 100.00 | 1,408,960 | |||||||||
| 2,000 | 4.000%, 6/01/50 | 12/30 at 100.00 | 1,631,061 | |||||||||
Principal Amount (000) | Description (a) | Optional Call Provisions (b) | Value | |||||||||
Pennsylvania | ||||||||||||
| Bethlehem Authority, Northampton and Lehigh Counties, Pennsylvania, Guaranteed Water Revenue Bonds, Series 1998: | ||||||||||||
| $ | 3,135 | 0.000%, 5/15/24 - AGM Insured | No Opt. Call | $ | 3,060,257 | |||||||
| 3,155 | 0.000%, 5/15/26 - AGM Insured | No Opt. Call | 2,814,093 | |||||||||
| 4,145 | 0.000%, 11/15/26 - AGM Insured | No Opt. Call | 3,614,805 | |||||||||
| 2,800 | 0.000%, 5/15/28 - AGM Insured | No Opt. Call | 2,284,701 | |||||||||
| 3,000 | 0.000%, 11/15/28 - AGM Insured | No Opt. Call | 2,392,965 | |||||||||
| 1,200 | Centre County Hospital Authority, Pennsylvania, Hospital Revenue Bonds, Mount Nittany Medical Center Project, Series 2018A, 5.000%, 11/15/42 | 11/27 at 100.00 | 1,113,022 | |||||||||
| 895 | Commonwealth Financing Authority, Pennsylvania, State Appropriation Lease Bonds, Master Settlement, Series 2018, 5.000%, 6/01/34 | 6/28 at 100.00 | 914,532 | |||||||||
| Delaware River Joint Toll Bridge Commission, New Jersey and Pennsylvania, Bridge System Revenue Bonds, Series 2017: | ||||||||||||
| 3,595 | 5.000%, 7/01/42 | 7/27 at 100.00 | 3,626,971 | |||||||||
| 5,000 | 5.000%, 7/01/47 | 7/27 at 100.00 | 4,987,234 | |||||||||
| 395 | Delaware Valley Regional Finance Authority, Pennsylvania, Local Government Revenue Bonds, Series 1997B, 5.700%, 7/01/27 - AMBAC Insured | No Opt. Call | 416,745 | |||||||||
| 5,000 | Lancaster County Hospital Authority, Pennsylvania, Revenue Bonds, Penn State Health, Series 2021, 5.000%, 11/01/51 | 11/29 at 100.00 | 4,721,171 | |||||||||
| 4,915 | Lancaster County Hospital Authority, Pennsylvania, Revenue Bonds, United Zion Retirement Community, Series 2017A, 5.000%, 12/01/47 | 6/27 at 100.00 | 3,567,440 | |||||||||
| Lehigh County Authority, Pennsylvania, Water and Sewer Revenue Bonds, Allentown Concession, Capital Appreciation Series 2013B: | ||||||||||||
| 4,480 | 0.000%, 12/01/31 | No Opt. Call | 3,039,715 | |||||||||
| 5,180 | 0.000%, 12/01/32 | No Opt. Call | 3,334,317 | |||||||||
| Lehigh County Authority, Pennsylvania, Water and Sewer Revenue Bonds, Allentown Concession, Series 2013A: | ||||||||||||
| 4,960 | (c) | 5.125%, 12/01/47, (Pre-refunded 12/01/23) | 12/23 at 100.00 | 4,964,908 | ||||||||
| 4,310 | 5.125%, 12/01/47 | 12/23 at 100.00 | 4,310,587 | |||||||||
| 5,210 | Montgomery County Higher Education and Health Authority, Pennsylvania, Revenue Bonds, Thomas Jefferson University, Series 2018A, 5.000%, 9/01/43 | 9/28 at 100.00 | 4,991,118 | |||||||||
| 1,000 | Montgomery County Higher Education and Health Authority, Pennsylvania, Revenue Bonds, Thomas Jefferson University, Series 2019, 4.000%, 9/01/44 | 9/29 at 100.00 | 838,962 | |||||||||
| 5,000 | (c) | Montgomery County Industrial Development Authority, Pennsylvania, Health System Revenue Bonds, Albert Einstein Healthcare Network Issue, Series 2015A, 5.250%, 1/15/45, (Pre-refunded 1/15/25) | 1/25 at 100.00 | 5,076,997 | ||||||||
| 2,905 | Neshaminy School District, Bucks County, Pennsylvania, General Obligation Bonds, Series 2022, 4.000%, 11/01/43 | 5/30 at 100.00 | 2,514,944 | |||||||||
| 630 | Northampton County Industrial Development Authority, Pennsylvania, Recovery Revenue Bonds, Northampton Generating Project, Senior Lien Series 2013A0 & AE2, 0.900%, 12/31/23 | 12/23 at 100.00 | 113,437 | |||||||||
| 324 | Northampton County Industrial Development Authority, Pennsylvania, Recovery Revenue Bonds, Northampton Generating Project, Senior Lien Taxable Series 2013B, 0.900%, 12/31/23, (cash 5.000%, PIK 5.000%) | No Opt. Call | 58,192 | |||||||||
| 5,910 | Pennsylvania Higher Educational Facilities Authority, Revenue Bonds, University of Pennsylvania Health System, Series 2019, 4.000%, 8/15/44 | 8/29 at 100.00 | 4,985,514 | |||||||||
| 16,000 | Pennsylvania Turnpike Commission, Oil Franchise Tax Revenue Bonds, Senior Lien Series 2021A, 4.000%, 12/01/51 | 12/31 at 100.00 | 13,285,586 | |||||||||
Principal Amount (000) | Description (a) | Optional Call Provisions (b) | Value | |||||||||
Pennsylvania | ||||||||||||
| $ | 16,805 | Pennsylvania Turnpike Commission, Turnpike Revenue Bonds, Capital Appreciation Series 2009E, 6.375%, 12/01/38 | 12/27 at 100.00 | $ | 17,936,005 | |||||||
| 8,510 | Pennsylvania Turnpike Commission, Turnpike Revenue Bonds, Series 2015B, 5.000%, 12/01/45 | 12/25 at 100.00 | 8,366,787 | |||||||||
| 6,340 | Pennsylvania Turnpike Commission, Turnpike Revenue Bonds, Series 2016A-1, 5.000%, 12/01/41 | 6/26 at 100.00 | 6,284,966 | |||||||||
| 5,800 | Pennsylvania Turnpike Commission, Turnpike Revenue Bonds, Series 2019A, 5.000%, 12/01/49 | 12/29 at 100.00 | 5,749,072 | |||||||||
| 6,500 | Pennsylvania Turnpike Commission, Turnpike Revenue Bonds, Series 2021B, 5.000%, 12/01/46 | 6/31 at 100.00 | 6,487,784 | |||||||||
| 17,375 | Pennsylvania Turnpike Commission, Turnpike Revenue Bonds, Series 2023A, 5.250%, 12/01/53 | 12/33 at 100.00 | 17,699,183 | |||||||||
| 19,250 | Pennsylvania Turnpike Commission, Turnpike Revenue Bonds, Subordinate Series 2009C, 6.250%, 6/01/33 - AGM Insured | 6/26 at 100.00 | 20,346,634 | |||||||||
| 7,475 | Pennsylvania Turnpike Commission, Turnpike Revenue Bonds, Subordinate Series 2021A, 4.000%, 12/01/45 | 12/30 at 100.00 | 6,243,491 | |||||||||
| 1,445 | Philadelphia Authority for Industrial Development Senior Living Facilities, Philadelphia, Pennsylvania, Revenue Bonds, Wesley Enhanced Living Obligated Group, Series 2017A, 5.000%, 7/01/37 | 7/27 at 100.00 | 1,181,431 | |||||||||
| 7,500 | Philadelphia School District, Pennsylvania, General Obligation Bonds, Series 2021A, 4.000%, 9/01/46 - BAM Insured | 9/31 at 100.00 | 6,268,967 | |||||||||
| 3,410 | (c) | Philadelphia, Pennsylvania, Water and Wastewater Revenue Bonds, Series 1997A, 5.125%, 8/01/27 - AMBAC Insured, (ETM) | 10/21 at 100.00 | 3,563,801 | ||||||||
| 8,135 | Southcentral Pennsylvania General Authority, Revenue Bonds, Wellspan Health Obligated Group, Series 2019A, 4.000%, 6/01/49 | 6/29 at 100.00 | 6,612,461 | |||||||||
| Total Pennsylvania | 190,808,816 | |||||||||||
Puerto Rico - 2.1% (1.2% of Total Investments) | ||||||||||||
| 3,996 | Cofina Class 2 Trust Tax-Exempt Class 2054, Puerto Rico. Unit Exchanged From Cusip 74529JAP0, 0.000%, 8/01/54 | No Opt. Call | 722,359 | |||||||||
| 1,000 | Puerto Rico Electric Power Authority, Power Revenue Bonds, Refunding National Series 2007VV, 5.250%, 7/01/24 - NPFG Insured | No Opt. Call | 998,120 | |||||||||
| 625 | Puerto Rico Electric Power Authority, Power Revenue Bonds, Refunding Series 2005SS, 5.000%, 7/01/25 - SYNCORA GTY Insured | 12/23 at 100.00 | 620,019 | |||||||||
| Puerto Rico Sales Tax Financing Corporation, Sales Tax Revenue Bonds, Restructured 2018A-1: | ||||||||||||
| 5,281 | 4.500%, 7/01/34 | 7/25 at 100.00 | 5,043,434 | |||||||||
| 6,000 | 0.000%, 7/01/51 | 7/28 at 30.01 | 1,084,571 | |||||||||
| 23,031 | 4.750%, 7/01/53 | 7/28 at 100.00 | 19,510,037 | |||||||||
| 24,161 | 5.000%, 7/01/58 | 7/28 at 100.00 | 21,153,146 | |||||||||
| 1,370 | Puerto Rico Sales Tax Financing Corporation, Sales Tax Revenue Bonds, Restructured Cofina Project Series 2019A-2A, 4.550%, 7/01/40 | 7/28 at 100.00 | 1,219,458 | |||||||||
| Puerto Rico Sales Tax Financing Corporation, Sales Tax Revenue Bonds, Taxable Restructured Cofina Project Series 2019A-2: | ||||||||||||
| 10,580 | 4.329%, 7/01/40 | 7/28 at 100.00 | 9,165,724 | |||||||||
| 5,951 | 4.329%, 7/01/40 | 7/28 at 100.00 | 5,155,503 | |||||||||
| 5,000 | 4.784%, 7/01/58 | 7/28 at 100.00 | 4,205,518 | |||||||||
| Total Puerto Rico | 68,877,889 | |||||||||||
Principal Amount (000) | Description (a) | Optional Call Provisions (b) | Value | |||||||||
Rhode Island - 0.8% (0.5% of Total Investments) | ||||||||||||
| $ | 1,315 | Rhode Island Health and Educational Building Corporation, Hospital Financing Revenue Bonds, Lifespan Obligated Group, Refunding Series 2016, 5.000%, 5/15/39 | 5/26 at 100.00 | $ | 1,223,809 | |||||||
| 174,390 | Rhode Island Tobacco Settlement Financing Corporation, Tobacco Settlement Asset-Backed Bonds, Series 2007A, 0.000%, 6/01/52 | 11/23 at 18.50 | 24,474,503 | |||||||||
| 2,235 | Rhode Island Turnpike and Bridge Authority, Motor Fuel Tax Revenue Bonds, Series 2016A, 5.000%, 10/01/40 | 4/26 at 100.00 | 2,243,908 | |||||||||
| Total Rhode Island | 27,942,220 | |||||||||||
South Carolina - 3.7% (2.2% of Total Investments) | ||||||||||||
| Lexington County Health Services District, Inc., South Carolina, Hospital Revenue Bonds, Lexington Medical Center, Series 2016: | ||||||||||||
| 1,290 | 5.000%, 11/01/41 | 5/26 at 100.00 | 1,261,959 | |||||||||
| 4,000 | 5.000%, 11/01/46 | 5/26 at 100.00 | 3,830,579 | |||||||||
| Piedmont Municipal Power Agency, South Carolina, Electric Revenue Bonds, Series 2004A-2: | ||||||||||||
| 26,955 | 0.000%, 1/01/31 - AMBAC Insured | No Opt. Call | 19,040,503 | |||||||||
| 15,420 | 0.000%, 1/01/32 - AMBAC Insured | No Opt. Call | 10,329,748 | |||||||||
| 1,370 | South Carolina Jobs-Economic Development Authority, Economic Development Revenue Bonds, Bishop Gadsden Episcopal Retirement Community, Series 2019A, 5.000%, 4/01/54 | 4/26 at 103.00 | 1,094,400 | |||||||||
| 13,475 | South Carolina Jobs-Economic Development Authority, Hospital Revenue Bonds, Bon Secours Mercy Health, Inc, Series 2020A, 4.000%, 12/01/44 | 6/30 at 100.00 | 11,216,839 | |||||||||
| South Carolina Jobs-Economic Development Authority, Hospital Revenue Bonds, McLeod Health Projects, Refunding & Improvement Series 2018: | ||||||||||||
| 9,030 | 5.000%, 11/01/43 | 5/28 at 100.00 | 8,904,071 | |||||||||
| 6,210 | 4.000%, 11/01/48 | 5/28 at 100.00 | 5,128,676 | |||||||||
| 3,490 | 5.000%, 11/01/48 | 5/28 at 100.00 | 3,374,001 | |||||||||
| 16,760 | South Carolina Public Service Authority, Santee Cooper Revenue Obligations, Refunding Series 2014C, 5.000%, 12/01/46 | 12/24 at 100.00 | 15,984,022 | |||||||||
| South Carolina Public Service Authority, Santee Cooper Revenue Obligations, Refunding Series 2016B: | ||||||||||||
| 6,800 | 5.000%, 12/01/46 | 12/26 at 100.00 | 6,485,164 | |||||||||
| 10,000 | 5.000%, 12/01/56 | 12/26 at 100.00 | 9,282,422 | |||||||||
| 5,000 | South Carolina Public Service Authority, Santee Cooper Revenue Obligations, Refunding Series 2022A, 4.000%, 12/01/52 | 6/32 at 100.00 | 3,871,628 | |||||||||
| 8,686 | South Carolina Public Service Authority, Santee Cooper Revenue Obligations, Refunding Series 2022B, 4.000%, 12/01/39 | 6/32 at 100.00 | 7,516,724 | |||||||||
| 17,240 | South Carolina Public Service Authority, Santee Cooper Revenue Obligations, Series 2014A, 5.500%, 12/01/54 | 6/24 at 100.00 | 16,834,255 | |||||||||
| Total South Carolina | 124,154,991 | |||||||||||
South Dakota - 1.6% (0.9% of Total Investments) | ||||||||||||
| 4,000 | Clay County, South Dakota, General Obligation Bonds, Series 2023, 5.000%, 12/01/52 | 12/31 at 100.00 | 3,933,334 | |||||||||
| Sioux Falls, South Dakota, Health Facilities Revenue Bonds, Dow Rummel Village Project, Series 2017: | ||||||||||||
| 3,000 | 5.000%, 11/01/42 | 11/26 at 100.00 | 2,439,820 | |||||||||
| 3,150 | 5.125%, 11/01/47 | 11/26 at 100.00 | 2,495,678 | |||||||||
| 10,500 | South Dakota Health and Educational Facilities Authority, Revenue Bonds, Avera Health System, Series 2014, 5.000%, 7/01/44 | 7/24 at 100.00 | 10,170,602 | |||||||||
Principal Amount (000) | Description (a) | Optional Call Provisions (b) | Value | |||||||||
South Dakota | ||||||||||||
| $ | 5,205 | South Dakota Health and Educational Facilities Authority, Revenue Bonds, Avera Health, Refunding Series 2017, 5.000%, 7/01/46 | 7/27 at 100.00 | $ | 4,993,685 | |||||||
| 22,800 | South Dakota Health and Educational Facilities Authority, Revenue Bonds, Monument Health, Inc., Series 2020A, 4.000%, 9/01/50 | 9/30 at 100.00 | 18,352,468 | |||||||||
| 2,500 | South Dakota Health and Educational Facilities Authority, Revenue Bonds, Sanford Health, Series 2014B, 5.000%, 11/01/44 | 11/24 at 100.00 | 2,345,788 | |||||||||
| 9,325 | South Dakota Health and Educational Facilities Authority, Revenue Bonds, Sanford Health, Series 2015, 5.000%, 11/01/45 | 11/25 at 100.00 | 8,694,406 | |||||||||
| Total South Dakota | 53,425,781 | |||||||||||
Tennessee - 1.4% (0.8% of Total Investments) | ||||||||||||
| 2,180 | Greeneville Health and Educational Facilities Board, Tennessee, Hospital Revenue Bonds, Ballad Health, Series 2018A, 5.000%, 7/01/35 | 7/28 at 100.00 | 2,195,396 | |||||||||
| Knox County Health, Educational and Housing Facilities Board, Tennessee, Revenue Bonds, University Health System, Inc., Series 2016: | ||||||||||||
| 5,000 | 5.000%, 9/01/36 | 9/26 at 100.00 | 4,757,385 | |||||||||
| 1,000 | 5.000%, 9/01/47 | 9/26 at 100.00 | 858,997 | |||||||||
| Knox County Health, Educational and Housing Facilities Board, Tennessee, Revenue Bonds, University Health System, Inc., Series 2017: | ||||||||||||
| 445 | 5.000%, 4/01/31 | 4/27 at 100.00 | 445,487 | |||||||||
| 1,755 | 5.000%, 4/01/36 | 4/27 at 100.00 | 1,702,079 | |||||||||
| Metropolitan Government of Nashville and Davidson County Sports Authority, Tennessee, Revenue Bonds, Stadium Project, Subordinate Senior Series 2023A: | ||||||||||||
| 4,100 | 5.250%, 7/01/48 - AGM Insured | 1/34 at 100.00 | 4,206,920 | |||||||||
| 7,015 | 5.250%, 7/01/53 - AGM Insured | 1/34 at 100.00 | 7,168,962 | |||||||||
| 4,170 | Metropolitan Government of Nashville-Davidson County Health and Educational Facilities Board, Tennessee, Revenue Bonds, Belmont University, Series 2023, 5.250%, 5/01/53 | 5/33 at 100.00 | 4,123,463 | |||||||||
| Metropolitan Government of Nashville-Davidson County Health and Educational Facilities Board, Tennessee, Revenue Bonds, Lipscomb University, Refunding & Improvement Series 2016A: | ||||||||||||
| 2,225 | 5.000%, 10/01/41 | 10/26 at 100.00 | 2,102,282 | |||||||||
| 2,910 | 5.000%, 10/01/45 | 10/26 at 100.00 | 2,671,876 | |||||||||
| Metropolitan Government of Nashville-Davidson County Health and Educational Facilities Board, Tennessee, Revenue Bonds, Vanderbilt University Medical Center, Series 2016A: | ||||||||||||
| 5,000 | 5.000%, 7/01/40 | 7/26 at 100.00 | 4,897,435 | |||||||||
| 6,000 | 5.000%, 7/01/46 | 7/26 at 100.00 | 5,817,925 | |||||||||
| 7,325 | The Tennessee Energy Acquisition Corporation, Gas Project Revenue Bonds, Series 2023A-1, 5.000%, 5/01/53, (Mandatory Put 5/01/28) | 2/28 at 100.22 | 7,252,064 | |||||||||
| Total Tennessee | 48,200,271 | |||||||||||
Texas - 11.5% (6.7% of Total Investments) | ||||||||||||
| 2,260 | Austin, Texas, Electric Utility System Revenue Bonds, Refunding & Improvement Series 2023, 5.000%, 11/15/48 | 11/33 at 100.00 | 2,286,645 | |||||||||
| 14,615 | (g) | Austin, Texas, Electric Utility System Revenue Bonds, Refunding Series 2015A, 5.000%, 11/15/45, (UB) | 11/25 at 100.00 | 14,485,951 | ||||||||
| 8,805 | Bastrop Independent School District, Bastrop County, Texas, General Obligation Bonds, School Building Series 2023, 5.000%, 2/15/53 | 2/33 at 100.00 | 8,874,021 | |||||||||
| 1,000 | Cedar Hill Independent School District, Dallas County, Texas, General Obligation Bonds, Refunding Series 2002, 0.000%, 8/15/32 - FGIC Insured | No Opt. Call | 670,633 | |||||||||
Principal Amount (000) | Description (a) | Optional Call Provisions (b) | Value | |||||||||
Texas | ||||||||||||
| $ | 7,750 | (c) | Central Texas Regional Mobility Authority, Revenue Bonds, Senior Lien, Series 2015A, 5.000%, 1/01/45, (Pre-refunded 7/01/25) | 7/25 at 100.00 | $ | 7,884,202 | ||||||
| Clifton Higher Education Finance Corporation, Texas, Education Revenue Bonds, Uplift Education Charter School, Series 2013A: | ||||||||||||
| 1,925 | 4.350%, 12/01/42 | 12/23 at 100.00 | 1,606,795 | |||||||||
| 1,000 | 4.400%, 12/01/47 | 12/23 at 100.00 | 802,248 | |||||||||
| 10,000 | Dallas Area Rapid Transit, Texas, Sales Tax Revenue Bonds, Refunding & Improvement Senior Lien Series 2021B, 5.000%, 12/01/47 | 12/30 at 100.00 | 10,041,990 | |||||||||
| 6,125 | Dallas Fort Worth International Airport, Texas, Joint Revenue Bonds, Refunding Series 2021B., 4.000%, 11/01/45 | 11/30 at 100.00 | 5,192,961 | |||||||||
| 10,000 | Dallas Fort Worth International Airport, Texas, Joint Revenue Bonds, Refunding Series 2022B, 5.000%, 11/01/50 | 11/32 at 100.00 | 9,733,692 | |||||||||
| 9,000 | Dallas-Fort Worth International Airport, Texas, Joint Revenue Bonds, Refunding Series 2021A, 4.000%, 11/01/46 | 11/30 at 100.00 | 7,602,195 | |||||||||
| 160 | Decatur Hospital Authority, Texas, Revenue Bonds, Wise Regional Health System, Series 2014A, 5.250%, 9/01/44 | 9/24 at 100.00 | 147,429 | |||||||||
| 3,700 | El Paso Independent School District, El Paso County, Texas, General Obligation Bonds, School Building Series 2017, 5.000%, 8/15/42 | 8/26 at 100.00 | 3,743,122 | |||||||||
| Grand Parkway Transportation Corporation, Texas, System Toll Revenue Bonds, Refunding First Tier Series 2020C: | ||||||||||||
| 3,500 | 4.000%, 10/01/40 | 4/30 at 100.00 | 3,049,625 | |||||||||
| 27,280 | 4.000%, 10/01/45 | 4/30 at 100.00 | 22,506,895 | |||||||||
| 12,695 | 4.000%, 10/01/49 - AGM Insured | 4/30 at 100.00 | 10,407,556 | |||||||||
| 5,295 | Grand Parkway Transportation Corporation, Texas, System Toll Revenue Bonds, Subordinate Lien Series 2018A. Tela Supported, 5.000%, 10/01/48 | 4/28 at 100.00 | 5,258,904 | |||||||||
| 9,275 | Harris County Cultural Education Facilities Finance Corporation, Texas, Hospital Revenue Bonds, Memorial Hermann Health System, Series 2022A, 4.125%, 7/01/52 | 7/32 at 100.00 | 7,529,187 | |||||||||
| Harris County Cultural Education Facilities Finance Corporation, Texas, Revenue Bonds, Houston Methodist Hospital System, Series 2015: | ||||||||||||
| 2,845 | 4.000%, 12/01/45 | 6/25 at 100.00 | 2,304,640 | |||||||||
| 2,320 | 5.000%, 12/01/45 | 6/25 at 100.00 | 2,245,226 | |||||||||
| 5,000 | Harris County, Texas, Toll Road Revenue Bonds, Refunding Senior Lien Series 2018A, 4.000%, 8/15/48 | 2/28 at 100.00 | 4,133,377 | |||||||||
| 4,040 | (g) | Harris County, Texas, Toll Road Revenue Bonds, Tender Options Bond Trust 2015-XF2184. Formerly Tender Options Bond Trust 3028, 6.146%, 8/15/28 - AGM Insured, 144A, (IF) | No Opt. Call | 4,874,479 | ||||||||
| Harris County-Houston Sports Authority, Texas, Revenue Bonds, Capital Appreciation Refunding Senior Lien Series 2014A: | ||||||||||||
| 1,195 | 0.000%, 11/15/41 - AGM Insured | 11/31 at 62.66 | 418,920 | |||||||||
| 2,390 | 0.000%, 11/15/42 - AGM Insured | 11/31 at 59.73 | 781,033 | |||||||||
| 2,660 | 0.000%, 11/15/43 - AGM Insured | 11/31 at 56.93 | 814,957 | |||||||||
| 7,260 | 0.000%, 11/15/44 - AGM Insured | 11/31 at 54.25 | 2,080,583 | |||||||||
| 10,440 | 0.000%, 11/15/45 - AGM Insured | 11/31 at 51.48 | 2,809,908 | |||||||||
| 7,165 | 0.000%, 11/15/49 - AGM Insured | 11/31 at 41.91 | 1,502,929 | |||||||||
| 3,000 | 0.000%, 11/15/52 - AGM Insured | 11/31 at 35.81 | 521,225 | |||||||||
| 1,000 | Hidalgo County Regional Mobility Authority, Texas, Toll and Vehicle Registration Fee Revenue Bonds, Senior Lien Series 2022A, 4.000%, 12/01/40 | 12/31 at 100.00 | 832,002 | |||||||||
| 2,710 | Houston, Texas, Airport System Revenue Bonds, Refunding & Subordinate Lien Series 2018B, 5.000%, 7/01/48 | 7/28 at 100.00 | 2,634,969 | |||||||||
Principal Amount (000) | Description (a) | Optional Call Provisions (b) | Value | |||||||||
Texas | ||||||||||||
| $ | 365 | Houston, Texas, Airport System Revenue Bonds, Subordinate Lien Series 2000B, 5.450%, 7/01/24 - AGM Insured | No Opt. Call | $ | 368,449 | |||||||
| Houston, Texas, Hotel Occupancy Tax and Special Revenue Bonds, Convention and Entertainment Project, Series 2001B: | ||||||||||||
| 10,850 | 0.000%, 9/01/25 - AMBAC Insured | No Opt. Call | 10,014,036 | |||||||||
| 1,715 | 0.000%, 9/01/32 - AMBAC Insured | No Opt. Call | 1,130,117 | |||||||||
| Leander Independent School District, Williamson and Travis Counties, Texas, General Obligation Bonds, Refunding Series 2015A: | ||||||||||||
| 2,725 | 5.000%, 8/15/40 | 8/25 at 100.00 | 2,738,794 | |||||||||
| 4,000 | 4.000%, 8/15/41 | 8/25 at 100.00 | 3,519,074 | |||||||||
| 8,305 | Lower Colorado River Authority, Texas, Transmission Contract Revenue Bonds, LCRA Transmission Services Corporation Project, Refunding Series 2015, 5.000%, 5/15/45 | 5/25 at 100.00 | 8,155,108 | |||||||||
| McCamey County Hospital District, Texas, General Obligation Bonds, Series 2013: | ||||||||||||
| 1,780 | 5.750%, 12/01/33 | 12/25 at 100.00 | 1,756,582 | |||||||||
| 1,800 | 6.125%, 12/01/38 | 12/25 at 100.00 | 1,739,305 | |||||||||
| Midtown Redevelopment Authority, Texas, Tax Increment Contract Revenue, Refunding Series 2017: | ||||||||||||
| 16,285 | 5.000%, 1/01/36 | 1/27 at 100.00 | 16,626,943 | |||||||||
| 10,040 | 5.000%, 1/01/38 - AGM Insured | 1/27 at 100.00 | 10,173,032 | |||||||||
| Montgomery County Toll Road Authority, Texas, Toll Road Revenue Bonds, Senior Lien Series 2018: | ||||||||||||
| 2,100 | 5.000%, 9/15/43 | 9/25 at 100.00 | 1,916,585 | |||||||||
| 1,815 | 5.000%, 9/15/48 | 9/25 at 100.00 | 1,620,554 | |||||||||
| 4,240 | New Braunfels, Comal County, Texas, Utility System Revenue Bonds, Refunding Series 2022, 5.000%, 7/01/47 | 7/32 at 100.00 | 4,261,016 | |||||||||
| 850 | (c) | New Hope Cultural Education Facilities Finance Corporation, Texas, Retirement Facility Revenue Bonds, Methodist Retirement Communites Crestview Project, Series 2016, 5.000%, 11/15/31, (Pre-refunded 11/15/24) | 11/24 at 102.00 | 873,752 | ||||||||
| 3,900 | New Hope Cultural Education Facilities Finance Corporation, Texas, Student Housing Revenue Bonds, CHF-Collegiate Housing Foundation - College Station I LLC - Texas A&M University Project, Series 2014A, 5.000%, 4/01/46 - AGM Insured | 4/24 at 100.00 | 3,493,311 | |||||||||
| North Texas Tollway Authority, Special Projects System Revenue Bonds, Convertible Capital Appreciation Series 2011C: | ||||||||||||
| 1,880 | (c) | 7.000%, 9/01/43, (Pre-refunded 9/01/31) | 9/31 at 100.00 | 2,217,522 | ||||||||
| 7,990 | (c) | 6.750%, 9/01/45, (Pre-refunded 9/01/31) | 9/31 at 100.00 | 9,467,987 | ||||||||
| 4,000 | (c) | North Texas Tollway Authority, System Revenue Bonds, Refunding First Tier Capital Appreciation Series 2008I, 6.500%, 1/01/43, (Pre-refunded 1/01/25) | 1/25 at 100.00 | 4,112,274 | ||||||||
| 2,125 | North Texas Tollway Authority, System Revenue Bonds, Refunding First Tier, Series 2008D, 0.000%, 1/01/28 - AGC Insured | No Opt. Call | 1,779,505 | |||||||||
| 2,000 | North Texas Tollway Authority, System Revenue Bonds, Refunding First Tier, Series 2015B, 5.000%, 1/01/45 | 1/25 at 100.00 | 1,980,704 | |||||||||
| 14,610 | North Texas Tollway Authority, System Revenue Bonds, Refunding First Tier, Series 2017A, 5.000%, 1/01/43 | 1/28 at 100.00 | 14,682,140 | |||||||||
| 5,000 | North Texas Tollway Authority, System Revenue Bonds, Refunding Second Tier Series 2018, 5.000%, 1/01/48 | 1/28 at 100.00 | 4,977,429 | |||||||||
Principal Amount (000) | Description (a) | Optional Call Provisions (b) | Value | |||||||||
Texas | ||||||||||||
| North Texas Tollway Authority, System Revenue Bonds, Refunding Second Tier, Series 2015A: | ||||||||||||
| $ | 6,285 | 5.000%, 1/01/33 | 1/25 at 100.00 | $ | 6,303,238 | |||||||
| 8,000 | 5.000%, 1/01/35 | 1/25 at 100.00 | 8,013,754 | |||||||||
| 10,500 | Port of Houston Authority, Harris County, Texas, Revenue Bonds, First Lien Series 2023, 5.000%, 10/01/53 | 10/33 at 100.00 | 10,448,801 | |||||||||
| 2,250 | Red River Education Finance Corporation, Texas, Higher Education Revenue Bonds, Saint Edward?s University Project, Series 2016, 4.000%, 6/01/36 | 6/26 at 100.00 | 1,963,240 | |||||||||
| 2,000 | San Antonio, Texas, General Obligation Bonds, General Improvement Series 2021, 4.000%, 8/01/41 | 8/31 at 100.00 | 1,765,380 | |||||||||
| 7,975 | Tarrant County College District, Texas, General Obligation Bonds, Series 2022, 5.000%, 8/15/39 | 8/32 at 100.00 | 8,228,976 | |||||||||
| 2,500 | Tarrant County Cultural Education Facilities Finance Corporation, Texas, Hospital Revenue Bonds, Methodist Hospital of Dallas, Series 2022, 4.000%, 10/01/47 | 4/32 at 100.00 | 2,063,909 | |||||||||
| 1,500 | Tarrant County Cultural Education Facilities Finance Corporation, Texas, Revenue Bonds, Christus Health, Series 2022A, 4.000%, 7/01/53 | 7/32 at 100.00 | 1,155,067 | |||||||||
| 2,500 | Tarrant County Cultural Education Facilities Finance Corporation, Texas, Revenue Bonds, Texas Health Resources System, Series 2016A, 5.000%, 2/15/41 | 8/26 at 100.00 | 2,474,390 | |||||||||
| Texas Private Activity Bond Surface Transportation Corporation, Senior Lien Revenue Bonds, LBJ Infrastructure Group LLC IH-635 Managed Lanes Project, Refunding Series 2020A: | ||||||||||||
| 1,805 | 4.000%, 12/31/37 | 12/30 at 100.00 | 1,634,618 | |||||||||
| 1,200 | 4.000%, 6/30/38 | 12/30 at 100.00 | 1,078,836 | |||||||||
| 1,300 | 4.000%, 6/30/39 | 12/30 at 100.00 | 1,157,626 | |||||||||
| 7,345 | Texas Transportation Commission, Central Texas Turnpike System Revenue Bonds, Refunding First Tier Series 2015B, 5.000%, 8/15/37 | 8/24 at 100.00 | 7,294,367 | |||||||||
| Texas Transportation Commission, Central Texas Turnpike System Revenue Bonds, Refunding Second Tier Series 2015C: | ||||||||||||
| 3,650 | 5.000%, 8/15/33 | 8/24 at 100.00 | 3,586,497 | |||||||||
| 6,385 | 5.000%, 8/15/37 | 8/24 at 100.00 | 6,155,602 | |||||||||
| 44,120 | 5.000%, 8/15/42 | 8/24 at 100.00 | 41,738,252 | |||||||||
| 4,000 | Texas Turnpike Authority, Central Texas Turnpike System Revenue Bonds, First Tier Series 2002A, 0.000%, 8/15/25 - AMBAC Insured | No Opt. Call | 3,704,772 | |||||||||
| 5,000 | Texas Water Development Board, State Water Implementation Revenue Fund Bonds, Master Trust Series 2019A, 4.000%, 10/15/49 | 10/29 at 100.00 | 4,228,648 | |||||||||
| 10,500 | Texas Water Development Board, State Water Implementation Revenue Fund Bonds, Master Trust Series 2021, 4.000%, 10/15/51 | 10/31 at 100.00 | 8,735,235 | |||||||||
| 7,000 | West Harris County Regional Water Authority, Texas, Water System Revenue Bonds, Series 2022, 5.000%, 12/15/57 - AGM Insured | 12/32 at 100.00 | 6,918,876 | |||||||||
| Total Texas | 384,032,602 | |||||||||||
Utah - 0.4% (0.3% of Total Investments) | ||||||||||||
| Salt Lake City, Utah, Airport Revenue Bonds, International Airport Series 2017B: | ||||||||||||
| 3,560 | 5.000%, 7/01/42 | 7/27 at 100.00 | 3,516,179 | |||||||||
| 1,975 | 5.000%, 7/01/47 | 7/27 at 100.00 | 1,940,893 | |||||||||
| 4,000 | Salt Lake City, Utah, Airport Revenue Bonds, International Airport Series 2018B, 5.000%, 7/01/48 | 7/28 at 100.00 | 3,916,468 | |||||||||
Principal Amount (000) | Description (a) | Optional Call Provisions (b) | Value | |||||||||
Utah | ||||||||||||
| Utah Charter School Finance Authority, Charter School Revenue Bonds, Utah Charter Academies Project, Series 2018: | ||||||||||||
| $ | 1,000 | 5.000%, 10/15/38 | 10/27 at 100.00 | $ | 974,501 | |||||||
| 2,320 | 5.000%, 10/15/43 | 10/27 at 100.00 | 2,182,583 | |||||||||
| 2,040 | 5.000%, 10/15/48 | 10/27 at 100.00 | 1,868,786 | |||||||||
| Total Utah | 14,399,410 | |||||||||||
Vermont - 0.4% (0.2% of Total Investments) | ||||||||||||
| University of Vermont and State Agricultural College, General Obligation Bonds, Series 2015: | ||||||||||||
| 1,000 | 4.000%, 10/01/40 | 10/25 at 100.00 | 898,003 | |||||||||
| 10,000 | 5.000%, 10/01/45 | 10/25 at 100.00 | 9,760,742 | |||||||||
| 2,730 | Vermont Educational and Health Buildings Financing Agency, Revenue Bonds, Middlebury College Project, Series 2023, 5.000%, 11/01/52 | 11/33 at 100.00 | 2,726,107 | |||||||||
| Total Vermont | 13,384,852 | |||||||||||
Virgin Islands - 0.1% (0.1% of Total Investments) | ||||||||||||
| 2,645 | Matching Fund Special Purpose Securitization Corporation, Virgin Islands, Revenue Bonds, Series 2022A, 5.000%, 10/01/32 | No Opt. Call | 2,600,828 | |||||||||
| Total Virgin Islands | 2,600,828 | |||||||||||
Virginia - 0.4% (0.2% of Total Investments) | ||||||||||||
| 1,610 | Arlington County Industrial Development Authority, Virginia, Hospital Facility Revenue Bonds, Virginia Hospital Center, Series 2020, 4.000%, 7/01/40 | 7/30 at 100.00 | 1,416,325 | |||||||||
| 430 | Chesapeake, Virginia, Transportation System Senior Toll Road Revenue Bonds, Capital Appreciation Series 2012B, 4.875%, 7/15/40 | 7/28 at 100.00 | 413,423 | |||||||||
| 4,000 | (g) | Fairfax County Industrial Development Authority, Virginia, Healthcare Revenue Bonds, Inova Health System, Series 2018A, 4.000%, 5/15/48, (UB) | 5/28 at 100.00 | 3,307,998 | ||||||||
| 8,075 | Hampton Roads Transportation Accountability Commission, Virginia, Revenue Bonds, Hampton Roads Transportation Fund, Senior Lien Series 2022A, 4.000%, 7/01/52 | 7/32 at 100.00 | 6,811,563 | |||||||||
| Total Virginia | 11,949,309 | |||||||||||
Washington - 3.8% (2.2% of Total Investments) | ||||||||||||
| 7,000 | Central Puget Sound Regional Transit Authority, Washington, Sales Tax and Motor Vehicle Excise Tax Bonds, Green Series 2016S-1, 5.000%, 11/01/41 | 11/26 at 100.00 | 7,077,157 | |||||||||
| 12,235 | Chelan County Public Utility District 1, Washington, Columbia River-Rock Island Hydro-Electric System Revenue Refunding Bonds, Series 1997A, 0.000%, 6/01/26 - NPFG Insured | No Opt. Call | 11,013,828 | |||||||||
| 7,000 | Douglas County Public Utility District 1, Washington, Revenue Bonds, Wells Hydroelectric, Series 2022B, 5.000%, 9/01/47 | 3/32 at 100.00 | 7,041,126 | |||||||||
| 4,200 | King County Public Hospital District 1, Washington, Limited Tax General Obligation Bonds, Valley Medical Center, Refunding Series 2016, 5.000%, 12/01/36 | 12/26 at 100.00 | 4,211,437 | |||||||||
| 7,600 | King County Public Hospital District 1, Washington, Limited Tax General Obligation Bonds, Valley Medical Center, Refunding Series 2018, 5.000%, 12/01/43 | 12/28 at 100.00 | 7,278,887 | |||||||||
| 10,630 | King County Public Hospital District 2, Washington, General Obligation Bonds, EvergreenHealth, Limited Tax 2020A, 4.000%, 12/01/45 | 12/29 at 100.00 | 8,852,504 | |||||||||
| 3,000 | Port of Seattle, Washington, Revenue Bonds, Intermediate Lien Series 2015A, 5.000%, 4/01/40 | 10/24 at 100.00 | 2,983,001 | |||||||||
Principal Amount (000) | Description (a) | Optional Call Provisions (b) | Value | |||||||||
Washington | ||||||||||||
| $ | 1,250 | (c) | Seattle Housing Authority, Washington, Pooled Housing Revenue Bonds, Refunding Series 2014, 5.000%, 12/01/44, (Pre-refunded 12/01/23) | 12/23 at 100.00 | $ | 1,250,908 | ||||||
| 10,535 | Seattle, Washington, Drainage and Wastewater System Revenue Bonds, Improvement Series 2023, 5.000%, 2/01/49 | 2/33 at 100.00 | 10,662,684 | |||||||||
| 15,000 | Seattle, Washington, Municipal Light and Power Revenue Bonds, Refunding & Improvement Series 2021A, 4.000%, 7/01/47 | 7/31 at 100.00 | 12,682,976 | |||||||||
| 3,750 | Seattle, Washington, Municipal Light and Power Revenue Bonds, Refunding & Improvement Series 2022, 5.000%, 7/01/52 | 7/32 at 100.00 | 3,761,357 | |||||||||
| 10,000 | Seattle, Washington, Municipal Light and Power Revenue Bonds, Refunding & Improvement Series 2023, 5.000%, 3/01/53 | 3/33 at 100.00 | 10,026,372 | |||||||||
| 5,250 | Tacoma, Washington, Sewer Revenue Bonds, Series 2018, 4.000%, 12/01/48 | 12/28 at 100.00 | 4,367,795 | |||||||||
| 535 | Washington Health Care Facilities Authority, Revenue Bonds, CommonSpirit Health, Series 2019A-1, 4.000%, 8/01/44 | 8/29 at 100.00 | 431,235 | |||||||||
| 5,180 | Washington Health Care Facilities Authority, Revenue Bonds, CommonSpirit Health, Series 2019A-2, 5.000%, 8/01/44 | 8/29 at 100.00 | 4,897,792 | |||||||||
| Washington Health Care Facilities Authority, Revenue Bonds, Providence Health & Services, Refunding Series 2012A: | ||||||||||||
| 4,000 | 5.000%, 10/01/32 | 12/23 at 100.00 | 4,000,296 | |||||||||
| 10,000 | 4.250%, 10/01/40 | 12/23 at 100.00 | 8,533,067 | |||||||||
| 3,000 | Washington Health Care Facilities Authority, Revenue Bonds, Providence Health & Services, Series 2014D, 5.000%, 10/01/41 | 10/24 at 100.00 | 2,855,945 | |||||||||
| 5,160 | Washington Health Care Facilities Authority, Revenue Bonds, Seattle Children’s Hospital, Series 2015A, 4.000%, 10/01/45 | 4/30 at 100.00 | 4,256,644 | |||||||||
| 2,600 | Washington State Convention Center Public Facilities District, Lodging Tax Revenue Bonds, Refunding Subordinate Series 2021B. Exchange Purchase, 3.000%, 7/01/58 | 7/31 at 100.00 | 1,476,860 | |||||||||
| 2,525 | Washington State Higher Education Facilities Authority, Revenue Bonds, Seattle University, Series 2020, 4.000%, 5/01/45 | 5/30 at 100.00 | 2,050,709 | |||||||||
| 500 | Washington State Housing Finance Commission, Non-profit Housing Revenue Bonds, Presbyterian Retirement Communities Northwest Proejct, Refunding Series 2016A, 5.000%, 1/01/46, 144A | 1/25 at 102.00 | 364,598 | |||||||||
| 9,000 | Washington State, Motor Vehicle Fuel Tax General Obligation Bonds, Series 2003C, 0.000%, 6/01/28 - FGIC Insured | No Opt. Call | 7,546,419 | |||||||||
| Total Washington | 127,623,597 | |||||||||||
West Virginia - 0.6% (0.3% of Total Investments) | ||||||||||||
| 12,690 | West Virginia Hospital Finance Authority, Revenue Bonds, West Virginia University Health System Obligated Group, Improvement Series 2017A, 5.000%, 6/01/47 | 6/27 at 100.00 | 12,170,499 | |||||||||
| 2,065 | West Virginia Parkways Authority, Turnpike Toll Revenue Bonds, Senior Lien Series 2021, 5.000%, 6/01/47 | 6/31 at 100.00 | 2,088,813 | |||||||||
| 5,750 | West Virginia State, General Obligation Bonds, State Road Competitive Series 2018B, 4.000%, 6/01/42 | 6/28 at 100.00 | 4,989,224 | |||||||||
| Total West Virginia | 19,248,536 | |||||||||||
Wisconsin - 4.2% (2.5% of Total Investments) | ||||||||||||
| Public Finance Authority of Wisconsin, Conference Center and Hotel Revenue Bonds, Lombard Public Facilities Corporation, Second Tier Series 2018B: | ||||||||||||
| 43 | (d) | 0.000%, 1/01/46, 144A | No Opt. Call | 938 | ||||||||
| 42 | (d) | 0.000%, 1/01/47, 144A | No Opt. Call | 853 | ||||||||
| 42 | (d) | 0.000%, 1/01/48, 144A | No Opt. Call | 798 | ||||||||
Principal Amount (000) | Description (a) | Optional Call Provisions (b) | Value | |||||||||
Wisconsin | ||||||||||||
| $ | 42 | (d) | 0.000%, 1/01/49, 144A | No Opt. Call | $ | 743 | ||||||
| 41 | (d) | 0.000%, 1/01/50, 144A | No Opt. Call | 677 | ||||||||
| 45 | (d) | 0.000%, 1/01/51, 144A | No Opt. Call | 699 | ||||||||
| 1,163 | (d) | 1.000%, 7/01/51, 144A | 3/28 at 100.00 | 614,120 | ||||||||
| 45 | (d) | 0.000%, 1/01/52, 144A | No Opt. Call | 642 | ||||||||
| 44 | (d) | 0.000%, 1/01/53, 144A | No Opt. Call | 598 | ||||||||
| 44 | (d) | 0.000%, 1/01/54, 144A | No Opt. Call | 555 | ||||||||
| 43 | (d) | 0.000%, 1/01/55, 144A | No Opt. Call | 516 | ||||||||
| 43 | (d) | 0.000%, 1/01/56, 144A | No Opt. Call | 481 | ||||||||
| 42 | (d) | 0.000%, 1/01/57, 144A | No Opt. Call | 447 | ||||||||
| 42 | (d) | 0.000%, 1/01/58, 144A | No Opt. Call | 415 | ||||||||
| 42 | (d) | 0.000%, 1/01/59, 144A | No Opt. Call | 390 | ||||||||
| 41 | (d) | 0.000%, 1/01/60, 144A | No Opt. Call | 361 | ||||||||
| 41 | (d) | 0.000%, 1/01/61, 144A | No Opt. Call | 334 | ||||||||
| 40 | (d) | 0.000%, 1/01/62, 144A | No Opt. Call | 311 | ||||||||
| 40 | (d) | 0.000%, 1/01/63, 144A | No Opt. Call | 290 | ||||||||
| 39 | (d) | 0.000%, 1/01/64, 144A | No Opt. Call | 272 | ||||||||
| 39 | (d) | 0.000%, 1/01/65, 144A | No Opt. Call | 252 | ||||||||
| 39 | (d) | 0.000%, 1/01/66, 144A | No Opt. Call | 229 | ||||||||
| 501 | (d) | 0.000%, 1/01/67, 144A | No Opt. Call | 2,679 | ||||||||
| 1,950 | Public Finance Authority of Wisconsin, Health Care Facilities Revenue Bonds, Appalachian Regional Healthcare System Obligated Group, Series 2021A, 4.000%, 7/01/56 | 1/31 at 100.00 | 1,292,414 | |||||||||
| 8,335 | Public Finance Authority, Wisconsin, Educational Revenue Bonds, Lake Norman Charter School, Series 2018A, 5.000%, 6/15/48, 144A | 6/26 at 100.00 | 7,043,003 | |||||||||
| 10,000 | Wisconsin Health and Educational Facilities Authority, Revenue Bonds, Ascension Health Alliance Senior Credit Group, Series 2013B-1, 4.000%, 11/15/43 | 5/28 at 100.00 | 8,648,192 | |||||||||
| Wisconsin Health and Educational Facilities Authority, Revenue Bonds, Aspirus, Inc. Obligated Group, Inc. Project, Series 2021: | ||||||||||||
| 9,830 | 4.000%, 8/15/46 | 8/31 at 100.00 | 7,953,391 | |||||||||
| 8,000 | 4.000%, 8/15/51 | 8/31 at 100.00 | 6,276,829 | |||||||||
| 10,000 | Wisconsin Health and Educational Facilities Authority, Revenue Bonds, Marshfield Clinic Health System, Inc., Series 2017C, 5.000%, 2/15/47 | 2/27 at 100.00 | 8,894,994 | |||||||||
| 2,000 | Wisconsin Health and Educational Facilities Authority, Revenue Bonds, Marshfield Clinic, Series 2016B, 5.000%, 2/15/35 | 2/26 at 100.00 | 1,982,574 | |||||||||
| 7,625 | Wisconsin Health and Educational Facilities Authority, Revenue Bonds, Mercy Alliance, Inc., Series 2012, 5.000%, 6/01/39 | 12/23 at 100.00 | 7,259,967 | |||||||||
| Wisconsin Health and Educational Facilities Authority, Revenue Bonds, PHW Muskego, Inc. Project, Series 2021: | ||||||||||||
| 2,415 | 4.000%, 10/01/51 | 10/28 at 102.00 | 1,574,260 | |||||||||
| 2,470 | 4.000%, 10/01/61 | 10/28 at 102.00 | 1,500,094 | |||||||||
| 5,155 | Wisconsin Health and Educational Facilities Authority, Wisconsin, Revenue Bonds, Ascension Health Alliance Senior Credit Group, Series 2016A, 4.000%, 11/15/34 | 5/26 at 100.00 | 4,906,779 | |||||||||
| Wisconsin Health and Educational Facilities Authority, Wisconsin, Revenue Bonds, Benevolent Corporation Cedar Community, Series 2017: | ||||||||||||
| 1,110 | 5.000%, 6/01/37 | 6/25 at 103.00 | 946,908 | |||||||||
| 955 | 5.000%, 6/01/41 | 6/25 at 103.00 | 778,481 | |||||||||
| Wisconsin Health and Educational Facilities Authority, Wisconsin, Revenue Bonds, Franciscan Sisters of Christian Charity Sponsored Ministry, Series 2017A: | ||||||||||||
| 1,000 | (c) | 5.000%, 9/01/30, (Pre-refunded 9/01/27) | 9/27 at 100.00 | 1,040,029 | ||||||||
| 1,110 | (c) | 5.000%, 9/01/31, (Pre-refunded 9/01/27) | 9/27 at 100.00 | 1,154,433 | ||||||||
| 1,100 | (c) | 5.000%, 9/01/32, (Pre-refunded 9/01/27) | 9/27 at 100.00 | 1,144,032 | ||||||||
Principal Amount (000) | Description (a) | Optional Call Provisions (b) | Value | |||||||||
Wisconsin | ||||||||||||
| $ | 1,725 | (c) | 5.000%, 9/01/33, (Pre-refunded 9/01/27) | 9/27 at 100.00 | $ | 1,794,051 | ||||||
| 1,775 | (c) | 5.000%, 9/01/34, (Pre-refunded 9/01/27) | 9/27 at 100.00 | 1,846,052 | ||||||||
| 1,910 | (c) | 5.000%, 9/01/35, (Pre-refunded 9/01/27) | 9/27 at 100.00 | 1,986,456 | ||||||||
| 2,065 | (c) | 5.000%, 9/01/36, (Pre-refunded 9/01/27) | 9/27 at 100.00 | 2,147,660 | ||||||||
| 15,000 | Wisconsin Health and Educational Facilities Authority, Wisconsin, Revenue Bonds, Froedtert Health, Inc. Obligated Group, Series 2022A, 4.000%, 4/01/41 | 10/32 at 100.00 | 12,791,085 | |||||||||
| 18,595 | Wisconsin Health and Educational Facilities Authority, Wisconsin, Revenue Bonds, Marquette University, Series 2016, 5.000%, 10/01/46 | 10/26 at 100.00 | 17,886,469 | |||||||||
| 8,215 | Wisconsin Health and Educational Facilities Authority, Wisconsin, Revenue Bonds, Marshfield Clinic, Series 2016A, 5.000%, 2/15/42 | 2/26 at 100.00 | 7,573,030 | |||||||||
| 5,000 | Wisconsin Health and Educational Facilities Authority, Wisconsin, Revenue Bonds, Medical College of Wisconsin, Inc., Series 2016, 5.000%, 12/01/41 | 11/26 at 100.00 | 5,010,523 | |||||||||
| Wisconsin Health and Educational Facilities Authority, Wisconsin, Revenue Bonds, Medical College of Wisconsin, Inc., Series 2022: | ||||||||||||
| 10,000 | 4.000%, 12/01/46 | 12/31 at 100.00 | 8,062,323 | |||||||||
| 10,000 | 4.000%, 12/01/51 | 12/31 at 100.00 | 7,830,633 | |||||||||
| 2,000 | Wisconsin Health and Educational Facilities Authority, Wisconsin, Revenue Bonds, Oakwood Lutheran Senior Ministries, Series 2021, 4.000%, 1/01/47 | 1/27 at 103.00 | 1,153,929 | |||||||||
| 11,480 | Wisconsin Health and Educational Facilities Authority, Wisconsin, Revenue Bonds, ThedaCare Inc, Series 2015, 5.000%, 12/15/44 | 12/24 at 100.00 | 10,707,054 | |||||||||
| Total Wisconsin | 141,813,245 | |||||||||||
| Total Municipal Bonds (cost $6,018,040,876) | 5,648,275,135 | |||||||||||
Total Long-Term Investments (cost $6,018,040,876) | 5,648,275,135 | |||||||||||
Principal Amount (000) | Description (a) | Optional Call Provisions (b) | Value | |||||||||
SHORT-TERM INVESTMENTS - 1.7% (1.0% of Total Investments) | ||||||||||||
MUNICIPAL BONDS - 1.7% (1.0% of Total Investments) | ||||||||||||
Colorado - 0.4% (0.2% of Total Investments) | ||||||||||||
| $ | 12,555 | (h) | University of Colorado Hospital Authority, Colorado, Revenue Bonds, Variable Rate Series 2018B, 4.050%, 11/15/35, (Mandatory Put 11/7/2023) | 11/23 at 100.00 | $ | 12,555,000 | ||||||
| Total Colorado | 12,555,000 | |||||||||||
Missouri - 0.2% (0.2% of Total Investments) | ||||||||||||
| 6,000 | (h) | Missouri Health and Educational Facilities Authority, Revenue Bonds, BJC Health System, Variable Rate Demand Obligations, Series 2008C, 4.060%, 5/15/38, (Mandatory Put 11/7/2023) | 10/23 at 100.00 | 6,000,000 | ||||||||
| 2,400 | (h) | Missouri Health and Educational Facilities Authority, Revenue Bonds, Washington University, Variable Rate Demand Obligations, Series 2000B, 3.850%, 3/01/40, (Mandatory Put 10/31/2023) | 11/23 at 100.00 | 2,400,000 | ||||||||
| Total Missouri | 8,400,000 | |||||||||||
New York - 0.5% (0.3% of Total Investments) | ||||||||||||
| 16,715 | (h) | New York City Transitional Finance Authority, New York, Future Tax Secured Bonds, Subordinate Fiscal 2013 Variable Rate Obligation Series C-5, 4.090%, 11/01/41, (Mandatory Put 11/7/2023) | 10/23 at 100.00 | 16,715,000 | ||||||||
| Total New York | 16,715,000 | |||||||||||
Principal Amount (000) | Description (a) | Optional Call Provisions (b) | Value | |||||||||
Pennsylvania - 0.6% (0.3% of Total Investments) | ||||||||||||
| $ | 11,435 | (h) | Philadelphia Gas Works, Pennsylvania, Revenue Bonds, Eighth Series, Variable Rate Demand Obligations, Series 2009D, 4.070%, 8/01/31, (Mandatory Put 11/7/2023) | 11/23 at 100.00 | $ | 11,435,000 | ||||||
| 7,700 | (h) | Philadelphia Gas Works, Pennsylvania, Revenue Bonds, Eighth Series, Variable Rate Demand Obligations, Series 2009E, 4.070%, 8/01/31, (Mandatory Put 11/7/2023) | 11/23 at 100.00 | 7,700,000 | ||||||||
| Total Pennsylvania | 19,135,000 | |||||||||||
| Total Municipal Bonds (cost $56,805,000) | 56,805,000 | |||||||||||
Total Short-Term Investments (cost $56,805,000) | 56,805,000 | |||||||||||
Total Investments (cost $6,074,845,876) - 170.8% | 5,705,080,135 | |||||||||||
Floating Rate Obligations - (2.3)% | (78,320,000) | |||||||||||
AMTP Shares, Net- (5.2)%(i) | (172,921,697) | |||||||||||
MFP Shares, Net - (31.1)%(j) | (1,037,002,279) | |||||||||||
VRDP Shares, Net- (34.6)%(k) | (1,154,720,661) | |||||||||||
Other Assets & Liabilities, Net - 2.4% | 77,481,318 | |||||||||||
Net Assets Applicable to Common Shares - 100% | $ | 3,339,596,816 | ||||||||||
| (a) | All percentages shown in the Portfolio of Investments are based on net assets applicable to common shares unless otherwise noted. |
| (b) | Optional Call Provisions: Dates (month and year) and prices of the earliest optional call or redemption. There may be other call provisions at varying prices at later dates. Certain mortgage-backed securities may be subject to periodic principal paydowns. Optional Call Provisions are not covered by the report of independent registered public accounting firm. |
| (c) | Backed by an escrow or trust containing sufficient U.S. Government or U.S. Government agency securities, which ensure the timely payment of principal and interest. |
| (d) | Defaulted security. A security whose issuer has failed to fully pay principal and/or interest when due, or is under the protection of bankruptcy. |
| (e) | For fair value measurement disclosure purposes, investment classified as Level 3. |
| (f) | Step-up coupon bond, a bond with a coupon that increases (“steps up”), usually at regular intervals, while the bond is outstanding. The rate shown is the coupon as of the end of the reporting period. |
| (g) | Investment, or portion of investment, has been pledged to collateralize the net payment obligations for investments in inverse floating rate transactions. |
| (h) | Investment has a maturity of greater than one year, but has variable rate and/or demand features which qualify it as a short-term investment. The rate disclosed, as well as the reference rate and spread, where applicable, is that in effect as of the end of the reporting period. This rate changes periodically based on market conditions or a specified market index. |
| (i) | AMTP Shares, Net as a percentage of Total Investments is 3.0%. |
| (j) | MFP Shares, Net as a percentage of Total Investments is 18.2%. |
| (k) | VRDP Shares, Net as a percentage of Total Investments is 20.2%. |
| 144A | Investment is exempt from registration under Rule 144A of the Securities Act of 1933, as amended. These investments may only be resold in transactions exempt from registration, which are normally those transactions with qualified institutional buyers. |
| ETM | Escrowed to maturity |
| IF | Inverse floating rate security issued by a tender option bond (“TOB”) trust, the interest rate on which varies inversely with the Securities Industry Financial Markets Association (SIFMA) short-term rate, which resets weekly, or a similar short-term rate, and is reduced by the expenses related to the TOB trust. |
| PIK | Payment-in-kind |
| UB | Underlying bond of an inverse floating rate trust reflected as a financing transaction. |
| WI/DD | When-issued or delayed delivery security. |
October 31, 2023 | NAD | NEA | ||||||
ASSETS | ||||||||
Long-term investments, at value † | $ | 4,553,145,556 | $ | 5,648,275,135 | ||||
Short-term investments, at value à | 72,015,000 | 56,805,000 | ||||||
| Receivables: | ||||||||
| Dividends | 313 | - | ||||||
| Interest | 68,164,546 | 81,399,409 | ||||||
| Investments sold | 22,415,272 | 48,043,701 | ||||||
| Other | 1,487,254 | 2,449,104 | ||||||
Total assets | 4,717,227,941 | 5,836,972,349 | ||||||
LIABILITIES | ||||||||
| Cash overdraft | 3,044,099 | 3,361,479 | ||||||
| Floating rate obligations | 78,400,000 | 78,320,000 | ||||||
AMTP Shares, Net * | 727,262,648 | 172,921,697 | ||||||
MFP Shares, Net ** | 678,526,753 | 1,037,002,279 | ||||||
VRDP Shares, Net *** | 503,596,953 | 1,154,720,661 | ||||||
| Payables: | ||||||||
| Dividends | 8,400,258 | 10,016,533 | ||||||
| Interest | 955,864 | 857,154 | ||||||
| Investments purchased - regular settlement | 13,305,178 | 18,071,815 | ||||||
| Investments purchased - when-issued/delayed-delivery settlement | 2,435,050 | 17,216,209 | ||||||
| Accrued expenses: | ||||||||
| Custodian fees | 300,251 | 315,138 | ||||||
| Investor relations | 76,947 | 96,411 | ||||||
| Management fees | 2,228,854 | 2,733,324 | ||||||
| Trustees fees | 1,175,535 | 1,583,399 | ||||||
| Professional fees | 23,765 | 24,978 | ||||||
| Shareholder reporting expenses | 71,541 | 88,677 | ||||||
| Shareholder servicing agent fees | 16,833 | 17,130 | ||||||
| Other | 21,584 | 28,649 | ||||||
Total liabilities | 2,019,842,113 | 2,497,375,533 | ||||||
Commitments and contingencies (1) | ||||||||
Net assets applicable to common shares | $ | 2,697,385,828 | $ | 3,339,596,816 | ||||
| Common shares outstanding | 233,404,655 | 298,992,392 | ||||||
| Net asset value (“NAV”) per common share outstanding | $ | 11.56 | $ | 11.17 | ||||
NET ASSETS APPLICABLE TO COMMON SHARES CONSIST OF: | ||||||||
| Common shares, $0.01 par value per share | $ | 2,334,047 | $ | 2,989,924 | ||||
Paid-in capital | 3,239,460,830 | 4,011,880,077 | ||||||
| Total distributable earnings (loss) | (544,409,049 | ) | (675,273,185 | ) | ||||
| Net assets applicable to common shares | $ | 2,697,385,828 | $ | 3,339,596,816 | ||||
| Authorized shares: | ||||||||
| Common | Unlimited | Unlimited | ||||||
| Preferred | Unlimited | Unlimited | ||||||
† | $ | 4,849,244,440 | $ | 6,018,040,876 | ||||
à | $ | 72,015,000 | $ | 56,805,000 | ||||
| * AMTP Shares, liquidation preference | 727,500,000 | 173,000,000 | ||||||
** MFP Shares, liquidation preference | 679,000,000 | 1,038,900,000 | ||||||
*** VRDP Shares, liquidation preference | 504,300,000 | 1,159,400,000 | ||||||
| (1) | As disclosed in Notes to Financial Statements. |
Year Ended October 31, 2023 | NAD | NEA | ||||||
INVESTMENT INCOME | ||||||||
| Dividends | $ | 18,844 | $ | – | ||||
| Interest | 223,302,061 | 268,077,695 | ||||||
| Total investment income | 223,320,905 | 268,077,695 | ||||||
EXPENSES | ||||||||
| Management fees | 27,569,986 | 33,960,346 | ||||||
| Shareholder servicing agent fees | 103,571 | 108,373 | ||||||
| Interest expense and amortization of offering costs | 78,407,806 | 88,368,911 | ||||||
| Trustees fees | 168,265 | 209,328 | ||||||
| Custodian expenses, net | 218,954 | 215,965 | ||||||
| Investor relations expenses | 180,793 | 214,241 | ||||||
| Liquidity fees | 3,924,692 | 10,648,571 | ||||||
| Merger expenses | 675 | 3,596 | ||||||
| Professional fees | 343,227 | 418,230 | ||||||
| Remarketing fees | 513,787 | 2,246,383 | ||||||
| Shareholder reporting expenses | 148,406 | 185,826 | ||||||
| Stock exchange listing fees | 70,116 | 101,765 | ||||||
| Other | 176,128 | 245,979 | ||||||
| Total expenses | 111,826,406 | 136,927,514 | ||||||
Net investment income (loss) | 111,494,499 | 131,150,181 | ||||||
REALIZED AND UNREALIZED GAIN (LOSS) | ||||||||
| Realized gain (loss) from: | ||||||||
| Investments | (59,006,602 | ) | (78,469,770 | ) | ||||
| Net realized gain (loss) | (59,006,602 | ) | (78,469,770 | ) | ||||
| Change in unrealized appreciation (depreciation) on: | ||||||||
| Investments | (9,283,730 | ) | (18,105,892 | ) | ||||
| Net change in unrealized appreciation (depreciation) | (9,283,730 | ) | (18,105,892 | ) | ||||
| Net realized and unrealized gain (loss) | (68,290,332 | ) | (96,575,662 | ) | ||||
Net increase (decrease) in net assets applicable to common shares from operations | $ | 43,204,167 | $ | 34,574,519 | ||||
NAD | NEA | |||||||||||||||
Year Ended 10/31/23 | Year Ended 10/31/22 | Year Ended 10/31/23 | Year Ended 10/31/22 | |||||||||||||
OPERATIONS | ||||||||||||||||
| Net investment income (loss) | $ | 111,494,499 | $ | 148,191,328 | $ | 131,150,181 | $ | 179,487,588 | ||||||||
| Net realized gain (loss) | (59,006,602) | (127,718,956) | (78,469,770) | (178,698,633) | ||||||||||||
| Net change in unrealized appreciation (depreciation) | (9,283,730) | (854,448,481) | (18,105,892) | (1,066,387,164) | ||||||||||||
| Net increase (decrease) in net assets applicable to common shares from operations | 43,204,167 | (833,976,109) | 34,574,519 | (1,065,598,209) | ||||||||||||
DISTRIBUTIONS TO COMMON SHAREHOLDERS | ||||||||||||||||
| Dividends | (111,450,722) | (159,765,489) | (131,275,845) | (194,972,381) | ||||||||||||
| Total distributions | (111,450,722) | (159,765,489) | (131,275,845) | (194,972,381) | ||||||||||||
CAPITAL SHARE TRANSACTIONS | ||||||||||||||||
| Cost of shares repurchased and retired | - | - | (445,350) | - | ||||||||||||
| Net increase (decrease) applicable to common shares from capital share transactions | – | – | (445,350) | – | ||||||||||||
| Net increase (decrease) in net assets applicable to common shares | (68,246,555) | (993,741,598) | (97,146,676) | (1,260,570,590) | ||||||||||||
| Net assets applicable to common shares at the beginning of the period | 2,765,632,383 | 3,759,373,981 | 3,436,743,492 | 4,697,314,082 | ||||||||||||
Net assets applicable to common shares at the end of the period | $ | 2,697,385,828 | $ | 2,765,632,383 | $ | 3,339,596,816 | $ | 3,436,743,492 | ||||||||
Year Ended October 31, 2023 | NAD | NEA | ||||||
CASH FLOWS FROM OPERATING ACTIVITIES | ||||||||
Net Increase (Decrease) in Net Assets Applicable to Common Shares from Operations | $ | 43,204,167 | $ | 34,574,519 | ||||
| Adjustments to reconcile the net increase (decrease) in net assets applicable to common shares from operations to net cash provided by (used in) operating activities: | ||||||||
| Purchases of investments | (1,169,399,314 | ) | (1,400,657,477 | ) | ||||
| Proceeds from sale and maturities of investments | 1,269,107,818 | 1,550,684,595 | ||||||
| Proceeds from (Purchase of) short-term investments, net | (72,015,000) | (56,805,000) | ||||||
| Taxes paid | (14,217) | (8,183) | ||||||
| Amortization (Accretion) of premiums and discounts, net | (7,099,630) | (5,396,779) | ||||||
| Amortization of deferred offering costs | 598,921 | 924,660 | ||||||
| (Increase) Decrease in: | ||||||||
| Receivable for dividends | 106 | – | ||||||
| Receivable for interest | 1,085,671 | 364,998 | ||||||
| Receivable for investments sold | 41,449,729 | 1,331,744 | ||||||
| Other assets | (82,436) | (183,490) | ||||||
| Increase (Decrease) in: | ||||||||
| Payable for interest | 328,217 | (12,127) | ||||||
| Payable for investments purchased - regular settlement | 13,305,178 | 11,858,229 | ||||||
| Payable for investments purchased - when-issued/delayed-delivery settlement | (5,946,853) | 8,669,256 | ||||||
| Accrued custodian fees | (111,860) | (124,612) | ||||||
| Accrued investor relations fees | (47,850) | (70,076) | ||||||
| Accrued management fees | (109,931) | (164,919) | ||||||
| Accrued Trustees fees | 181,904 | 241,277 | ||||||
| Accrued professional fees | (56,756) | (65,713) | ||||||
| Accrued shareholder reporting expenses | (11,932) | (11,861) | ||||||
| Accrued shareholder servicing agent fees | (1,031) | (3,257) | ||||||
| Accrued other expenses | (46,852) | (8,996) | ||||||
| Net realized (gain) loss from investments | 59,006,602 | 78,469,770 | ||||||
| Net realized (gain) loss from paydowns | (79,577) | (21,097) | ||||||
| Net change in unrealized (appreciation) depreciation of investments | 9,283,730 | 18,105,892 | ||||||
| Net cash provided by (used in) operating activities | 182,528,804 | 241,691,353 | ||||||
CASH FLOWS FROM FINANCING ACTIVITIES | ||||||||
| Proceeds from borrowings | 27,771,121 | 40,692,539 | ||||||
| (Repayments) of borrowings | (80,171,121) | (70,192,539) | ||||||
| Proceeds from floating rate obligations | 10,095,000 | 8,875,000 | ||||||
| (Repayments of) floating rate obligations | (28,380,000) | (42,120,000) | ||||||
| Proceeds from MFP Shares issued, at liquidation preference | – | (50,000,000) | ||||||
| (Repayments for) MFP Shares redeemed, at liquidation preference | – | (143,500,000) | ||||||
| (Repayments for) VRDP Shares redeemed, at liquidation preference | (127,700,000) | – | ||||||
| Increase (Decrease) in: | ||||||||
| Cash overdraft | 1,435,368 | 3,361,479 | ||||||
| Cash distributions paid to common shareholders | (113,279,172) | (133,951,284) | ||||||
| Cost of common shares repurchased and retired | – | (445,350) | ||||||
| Net cash provided by (used in) financing activities | (310,228,804) | (387,280,155) | ||||||
Net increase (decrease) in Cash | (127,700,000) | (145,588,802) | ||||||
| Cash at the beginning of period | 127,700,000 | 145,588,802 | ||||||
| Cash at the end of period | $ | – | $ | – | ||||
SUPPLEMENTAL DISCLOSURE OF CASH FLOW INFORMATION | NAD | NEA | ||||||
| Cash paid for interest | $ | 77,461,118 | $ | 87,444,740 | ||||
Investment Operations | Less Distributions to Common Shareholders | Common Share | ||||||||||||||||||||||||||||||||||||||
Common Share Net Asset Value, Beginning of Period | Net Investment Income (NII) (Loss) | Net Realized/ Unrealized Gain (Loss) | Total | From NII | From Net Realized Gains | Total | Discount Per Share Repurchased and Retired | Net Asset Value, End of Period | Share Price, End of Period | |||||||||||||||||||||||||||||||
NAD | ||||||||||||||||||||||||||||||||||||||||
| 10/31/23 | $11.85 | $0.48 | $(0.29) | $0.19 | $(0.48) | $– | $(0.48) | $– | $11.56 | $9.81 | ||||||||||||||||||||||||||||||
| 10/31/22 | 16.11 | 0.63 | (4.21) | (3.58) | (0.68) | – | (0.68) | – | 11.85 | 10.63 | ||||||||||||||||||||||||||||||
| 10/31/21 | 15.75 | 0.72 | 0.35 | 1.07 | (0.71) | – | (0.71) | – | 16.11 | 15.63 | ||||||||||||||||||||||||||||||
| 10/31/20 | 15.91 | 0.70 | (0.19) | 0.51 | (0.67) | – | (0.67) | – | 15.75 | 14.44 | ||||||||||||||||||||||||||||||
| 10/31/19 | 14.42 | 0.67 | 1.46 | 2.13 | (0.64) | – | (0.64) | – | 15.91 | 14.42 | ||||||||||||||||||||||||||||||
NEA | ||||||||||||||||||||||||||||||||||||||||
| 10/31/23 | 11.49 | 0.44 | (0.32) | 0.12 | (0.44) | – | (0.44) | –(c) | 11.17 | 9.47 | ||||||||||||||||||||||||||||||
| 10/31/22 | 15.71 | 0.60 | (4.17) | (3.57) | (0.65) | – | (0.65) | – | 11.49 | 10.32 | ||||||||||||||||||||||||||||||
| 10/31/21 | 15.50 | 0.69 | 0.22 | 0.91 | (0.70) | – | (0.70) | – | 15.71 | 15.18 | ||||||||||||||||||||||||||||||
| 10/31/20 | 15.58 | 0.69 | (0.11) | 0.58 | (0.66) | – | (0.66) | – | 15.50 | 14.33 | ||||||||||||||||||||||||||||||
| 10/31/19 | 14.16 | 0.66 | 1.40 | 2.06 | (0.64) | – | (0.64) | – | 15.58 | 14.20 | ||||||||||||||||||||||||||||||
| (a) | Percentage is not annualized. |
Common Share Supplemental Data/ Ratios Applicable to Common Shares | ||||||||||||||||||||||||||||||||||||
Common Share Total Returns | Ratios to Average Net Assets | |||||||||||||||||||||||||||||||||||
Based on Net Asset Value(a) | Based on Share Price(a) | Net Assets, End of Period (000) | Expenses(b) | Net Investment Income (Loss)(b) | Portfolio Turnover Rate | |||||||||||||||||||||||||||||||
| 1.26% | (3.68)% | $2,697,386 | 3.73% | 3.72% | 24% | |||||||||||||||||||||||||||||||
| (22.79) | (28.38) | 2,765,632 | 2.02 | 4.44 | 37 | |||||||||||||||||||||||||||||||
| 6.85 | 13.31 | 3,759,374 | 1.44 | 4.43 | 10 | |||||||||||||||||||||||||||||||
| 3.27 | 4.89 | 3,334,252 | 1.87 | 4.47 | 15 | |||||||||||||||||||||||||||||||
| 15.03 | 21.78 | 3,211,273 | 2.45 | 4.35 | 8 | |||||||||||||||||||||||||||||||
| 0.72 | (4.42) | 3,339,597 | 3.68 | 3.53 | 23 | |||||||||||||||||||||||||||||||
| (23.31) | (28.47) | 3,436,743 | 2.01 | 4.31 | 36 | |||||||||||||||||||||||||||||||
| 5.91 | 10.92 | 4,697,314 | 1.44 | 4.31 | 12 | |||||||||||||||||||||||||||||||
| 3.84 | 5.74 | 4,318,384 | 1.85 | 4.46 | 16 | |||||||||||||||||||||||||||||||
| 14.81 | 22.78 | 4,093,389 | 2.40 | 4.41 | 8 | |||||||||||||||||||||||||||||||
| (b) | ● Net Investment Income (Loss) ratios reflect income earned and expenses incurred on assets attributable to preferred shares, borrowings and/or reverse repurchase agreements (as described in Notes to Financial Statements), where applicable. |
● The expense ratios reflect, among other things, all interest expense and other costs related to preferred shares, borrowings and/or reverse repurchase agreements (as described in Notes to Financial Statements) and/or the interest expense deemed to have been paid by the Fund on the floating rate certificates issued by the special purpose trusts for the self-deposited inverse floaters held by the Fund (as described in Notes to Financial Statements), where applicable, as follows: |
Ratios of Interest Expense to Average Net Assets Applicable to Common Shares | ||||||||||
NAD | NEA | |||||||||
| 10/31/23 | 2.77% | 2.72% | ||||||||
| 10/31/22 | 1.06 | 1.06 | ||||||||
| 10/31/21 | 0.53 | 0.53 | ||||||||
| 10/31/20 | 0.94 | 0.94 | ||||||||
| 10/31/19 | 1.50 | 1.47 | ||||||||
| (c) | Value rounded to zero. |
AMTP Shares | MFP Shares | VRDP Shares | ||||||||||||||||||||||||||
Aggregate Amount Outstanding (000)(a) | Asset Coverage Per $100,000 Share(b) | Aggregate Amount Outstanding (000)(a) | Asset Coverage Per $100,000 Share(b),(d) | Aggregate Amount Outstanding (000)(a) | Asset Coverage Per $100,000 Share(b) | Asset Coverage Per $1 Liquidation Preference(e) | ||||||||||||||||||||||
NAD | ||||||||||||||||||||||||||||
| 10/31/23 | $727,500 | $241,165 | $679,000 | $241,165 | $504,300 | $241,165 | $2.41 | |||||||||||||||||||||
| 10/31/22 | 727,500 | 240,874 | 679,000 | 240,874 | 504,300 | 240,874 | 2.41 | |||||||||||||||||||||
| 10/31/21 | 727,500 | 284,419 | 679,000 | 284,419 | 632,000 | 284,419 | 2.84 | |||||||||||||||||||||
| 10/31/20 | 545,500 | 279,599 | 679,000 | 279,599 | 632,000 | 279,599 | 2.80 | |||||||||||||||||||||
| 10/31/19 | 545,500 | 279,954 | 607,000 | 279,954 | 632,000 | 279,954 | 2.80 | |||||||||||||||||||||
NEA | ||||||||||||||||||||||||||||
| 10/31/23 | 173,000 | 240,834 | 1,038,900 | 240,834 | 1,159,400 | 240,834 | 2.41 | |||||||||||||||||||||
| 10/31/22 | 173,000 | 240,229 | 1,088,900 | 240,229 | 1,159,400 | 240,229 | 2.40 | |||||||||||||||||||||
| 10/31/21 | 316,500 | 283,145 | 1,088,900 | 283,145 | 1,159,400 | 283,145 | 2.83 | |||||||||||||||||||||
| 10/31/20 | 143,500 | 280,550 | 958,000 | 280,550 | 1,290,300 | 280,550 | 2.81 | |||||||||||||||||||||
| 10/31/19 | – | – | 958,000 | 282,066 | 1,290,300 | 282,066 | 2.82 | |||||||||||||||||||||
| (a) | Aggregate Amount Outstanding: Aggregate amount outstanding represents the liquidation preference as of the end of the relevant fiscal year. |
| (b) | Asset Coverage Per $100,000: Asset coverage per $100,000 is calculated by subtracting the Fund’s liabilities and indebtedness not represented by senior securities from the Fund’s total assets, dividing the result by the aggregate amount of the Fund’s senior securities representing indebtedness then outstanding (if applicable,) plus the aggregate of the involuntary liquidation preference of the outstanding preferred shares, if applicable, and multiplying the result by 100,000. |
| (c) | Asset Coverage Per $1,000: Asset coverage per $1,000 is calculated by subtracting the Fund’s liabilities and indebtedness not represented by senior securities from the Fund’s total assets, dividing the result by the aggregate amount of the Fund’s senior securities representing indebtedness then outstanding (if applicable,) plus the aggregate of the involuntary liquidation preference of the outstanding preferred shares, if applicable, and multiplying the result by 1,000. |
| (d) | NEA’s Series D MFP Shares have a $1,000 liquidation preference per share, while all other MFP Shares have a $100,000 liquidation preference per share. The asset coverage per $1,000 share for NEA’s Series D MFP Shares were as follows: |
Asset Coverage Per $1,000 Share(c) | ||||||
NEA | ||||||
| 10/31/23 | $ | 2,408 | ||||
| 10/31/22 | 2,402 | |||||
| 10/31/21 | 2,831 | |||||
| 10/31/20 | 2,805 | |||||
| 10/31/19 | 2,800 | |||||
| (e) | Includes all preferred shares presented for the Fund. |
1. | General Information |
2. | Significant Accounting Policies |
Fund | Gross Custodian Fee Credits | |||
NAD | $ | 182,196 | ||
NEA | 205,506 | |||
3. | Investment Valuation and Fair Value Measurements |
| Level 1 – | Inputs are unadjusted and prices are determined using quoted prices in active markets for identical securities. | |
| Level 2 – | Prices are determined using other significant observable inputs (including quoted prices for similar securities, interest rates, credit spreads, etc.). | |
| Level 3 – | Prices are determined using significant unobservable inputs (including management’s assumptions in determining the fair value of investments). | |
NAD | Level 1 | Level 2 | Level 3 | Total | ||||||||||||
| Long-Term Investments: | ||||||||||||||||
| Municipal Bonds | $ | – | $ | 4,552,682,475 | $ | 108,508* | $ | 4,552,790,983 | ||||||||
| Investment Companies | 354,573 | – | – | 354,573 | ||||||||||||
| Short-Term Investments: | ||||||||||||||||
| Municipal Bonds | – | 72,015,000 | – | 72,015,000 | ||||||||||||
| Total | $ | 354,573 | $ | 4,624,697,475 | $ | 108,508 | $ | 4,625,160,556 | ||||||||
NEA | Level 1 | Level 2 | Level 3 | Total | ||||||||||||
| Long-Term Investments: | ||||||||||||||||
| Municipal Bonds | $ | – | $ | 5,648,111,383 | $ | 163,752* | $ | 5,648,275,135 | ||||||||
| Short-Term Investments: | ||||||||||||||||
| Municipal Bonds | – | 56,805,000 | – | 56,805,000 | ||||||||||||
| Total | $ | – | $ | 5,704,916,383 | $ | 163,752 | $ | 5,705,080,135 | ||||||||
| * | Refer to the Fund’s Portfolio of Investments for securities classified as Level 3. |
4. | Portfolio Securities |
Fund | Floating Rate Obligations: Self- Deposited Inverse Floaters | Floating Rate Obligations: Externally-Deposited Inverse Floaters | Total | |||||||||
NAD | $ | 78,400,000 | $ | 11,075,000 | $ | 89,475,000 | ||||||
NEA | 78,320,000 | 26,425,000 | 104,745,000 | |||||||||
Fund | Average Floating Rate Obligations Outstanding | Average Annual Interest Rate And Fees | ||||||
NAD | $ | 89,160,863 | 3.67% | |||||
NEA | 93,796,151 | 3.62 | ||||||
Fund | Maximum Exposure to Recourse Trusts: Self-Deposited Inverse Floaters | Maximum Exposure to Recourse Trusts: Externally-Deposited Inverse Floaters | Total | |||||||||
NAD | $ | 78,400,000 | $ | 5,450,000 | $ | 83,850,000 | ||||||
NEA | 78,320,000 | 26,425,000 | 104,745,000 | |||||||||
Fund | Non-U.S. Government Purchases | Non-U.S. Government Sales and Maturities | ||||||
NAD | $ | 1,169,399,314 | $ | 1,269,107,818 | ||||
NEA | 1,400,657,477 | 1,550,684,595 | ||||||
5. | Derivative Investments |
6. | Fund Shares |
NEA | ||||||||
Year Ended 10/31/23 | Year Ended 10/31/22 | |||||||
| Common Shares: | ||||||||
| Repurchased and retired through tender offer | 45,000 | – | ||||||
| Total | 45,000 | – | ||||||
| Weighted average common share: | ||||||||
| Price per share repurchased and retired | 9.88 | - | ||||||
| Discount per share repurchased and retired | (17.23)% | -% | ||||||
Fund | Series | Shares Outstanding | Liquidation Preference | |||||||||
NAD | 2028 | 3,370 | $ | 337,000,000 | ||||||||
| 2028-1 | 2,085 | $ | 208,500,000 | |||||||||
| 2028-2 | 1,820 | $ | 182,000,000 | |||||||||
NEA | 2028-1 | 1,730 | $ | 173,000,000 | ||||||||
Fund | Notice Period | Series | Term Redemption Date | Premium Expiration Date | ||||||||
NAD | 360-day | 2028 | December 1, 2028* | November 30, 2019 | ||||||||
| 360-day | 2028-1 | December 1, 2028* | November 30, 2019 | |||||||||
| 360-day | 2028-2 | December 1, 2028* | November 30, 2019 | |||||||||
NEA | 360-day | 2028-1 | December 1, 2028* | December 13, 2019 | ||||||||
| * | Subject to early termination by either the Fund or the holder. |
Fund | Average Liquidation Preference of AMTP Shares Outstanding | Annualized Dividend Rate | ||||||
NAD | $ | 727,500,000 | 4.06% | |||||
NEA | 173,000,000 | 4.03 | ||||||
Fund | Series | Shares Outstanding | Liquidation Preference | Term Redemption Date | Mode | Mode Termination Date | ||||||||||||||||||
NAD | A | 6,070 | $607,000,000 | January 3, 2028 | VRM | January 3, 2028* | ||||||||||||||||||
| B | 720 | $72,000,000 | September 1, 2047 | VRM | April 1, 2024 | |||||||||||||||||||
NEA | A | 1,350 | $135,000,000 | February 3, 2048 | VRM | February 3, 2048* | ||||||||||||||||||
| B | 3,350 | $335,000,000 | March 2, 2028 | VRM | March 2, 2028* | |||||||||||||||||||
| C | 2,380 | $238,000,000 | March 2, 2028 | VRDM | March 2, 2028* | |||||||||||||||||||
| D | 330,900 | $330,900,000 | March 1, 2029 | VRRM | N/A | |||||||||||||||||||
| * | Subject to earlier termination by either the Fund or the holder. |
Fund | Average Liquidation Preference of MFP Shares Outstanding | Annualized Dividend Rate | ||||||
NAD | $ | 679,000,000 | 4.19% | |||||
NEA | 1,041,639,726 | 3.80 | ||||||
Fund | Series | Shares Outstanding | Remarketing Fees* | Liquidation Preference | Maturity | |||||||||||||||
NAD | 1 | 2,368 | 0.10% | $ | 236,800,000 | September 11, 2026 | ||||||||||||||
| 2 | 2,675 | 0.10% | $ | 267,500,000 | September 11, 2026 | |||||||||||||||
NEA | 1 | 2,190 | 0.10% | $ | 219,000,000 | June 1, 2040 | ||||||||||||||
| 3 | 3,509 | 0.05% | $ | 350,900,000 | March 1, 2040 | |||||||||||||||
| 4 | 4,895 | 0.10% | $ | 489,500,000 | September 11, 2026 | |||||||||||||||
| 5 | 1,000 | 0.10% | $ | 100,000,000 | October 1, 2046 | |||||||||||||||
| * | Remarketing fees as a percentage of the aggregate principal amount of all VRDP Shares outstanding for each series. |
Fund | Average Liquidation Preference of VRDP Shares Outstanding | Annualized Dividend Rate | ||||||
NAD | $ | 504,300,000 | 3.26% | |||||
| NEA | 1,159,400,000 | 3.23 | ||||||
Year Ended October 31, 2023 | ||||||||||||
NEA | Series | Shares | Amount | |||||||||
| AMTP Shares noticed for redemption | 2028 | (1,435 | ) | $ | (143,500,000) | |||||||
Year Ended October 31, 2023 | ||||||||||||
NEA | Series | Shares | Amount | |||||||||
| MFP Shares redeemed | A | (500 | ) | $ | (50,000,000) | |||||||
Year Ended October 31, 2023 | ||||||||||||
NAD | Series | Shares | Amount | |||||||||
| VRDP Shares noticed for redemption | 3 | (1,277 | ) | $ | (127,700,000) | |||||||
7. | Income Tax Information |
Fund | Tax Cost | Gross Unrealized Appreciation | Gross Unrealized (Depreciation) | Net Unrealized Appreciation (Depreciation) | ||||||||||||
NAD | $ | 4,838,186,453 | $ | 40,671,463 | $ | (332,097,407) | $ | (291,425,944) | ||||||||
NEA | 5,990,752,387 | 63,340,271 | (427,332,476) | (363,992,205) | ||||||||||||
Fund | Undistributed Tax-Exempt Income 1 | Undistributed Ordinary Income | Undistributed Long-Term Capital Gains | Unrealized Appreciation (Depreciation) | Capital Loss Carryforwards | Late-Year Loss Deferrals | Other Book-to-Tax Differences | Total | ||||||||||||||||||||||||
NAD | $ | 5,068,906 | $ | 103,948 | $ | – | $ | (291,425,944) | $ | (249,286,582) | $ | – | $ | (8,869,377) | $ | (544,409,049) | ||||||||||||||||
NEA | – | 4,217 | – | (363,992,205) | (300,820,463) | – | (10,464,734) | (675,273,185) | ||||||||||||||||||||||||
| 1 | Undistributed tax-exempt income (on a tax basis) has not been reduced for the dividend declared on October 2, 2023 and paid on November 1, 2023. |
10/31/23 | 10/31/22 | |||||||||||||||||||||||
Fund | Tax-Exempt Income 1 | Ordinary Income | Long-Term Capital Gains | Tax-Exempt Income | Ordinary Income | Long-Term Capital Gains | ||||||||||||||||||
NAD | $ | 111,085,011 | $ | 365,711 | $ | – | $ | 159,533,710 | $ | 231,779 | $ | – | ||||||||||||
NEA | 130,286,846 | 988,999 | – | 193,772,024 | 1,200,357 | – | ||||||||||||||||||
| 1 | Each Fund designates these amounts paid during the period as Exempt Interest Dividends. |
Fund | Short-Term | Long-Term | Total | |||||||||
NAD 1 | $ | 137,780,533 | $ | 111,506,049 | $ | 249,286,582 | ||||||
NEA 1 | 155,077,579 | 145,742,884 | 300,820,463 | |||||||||
| 1 | A portion of NAD’s and NEA’s capital loss carryforwards is subject to limitation under the Internal Revenue Code and related regulations. |
8. | Management Fees and Other Transactions with Affiliates |
Average Daily Managed Assets* | Fund-Level Fee Rate | |||
| For the first $125 million | 0.4500 | % | ||
| For the next $125 million | 0.4375 | |||
| For the next $250 million | 0.4250 | |||
| For the next $500 million | 0.4125 | |||
| For the next $1 billion | 0.4000 | |||
| For the next $3 billion | 0.3750 | |||
| For managed assets over $5 billion | 0.3625 | |||
Complex-Level Eligible Asset Breakpoint Level* | Effective Complex-Level Fee Rate at Breakpoint Level | |||
| $55 billion | 0.2000 | % | ||
| $56 billion | 0.1996 | |||
| $57 billion | 0.1989 | |||
| $60 billion | 0.1961 | |||
| $63 billion | 0.1931 | |||
| $66 billion | 0.1900 | |||
| $71 billion | 0.1851 | |||
| $76 billion | 0.1806 | |||
| $80 billion | 0.1773 | |||
| $91 billion | 0.1691 | |||
| $125 billion | 0.1599 | |||
| $200 billion | 0.1505 | |||
| $250 billion | 0.1469 | |||
| $300 billion | 0.1445 | |||
| * | For the complex-level fees, managed assets include closed-end fund assets managed by the Adviser that are attributable to certain types of leverage. For these purposes, leverage includes the funds’ use of preferred stock and borrowings and certain investments in the residual interest certificates (also called inverse floating rate securities) in tender option bond (TOB) trusts, including the portion of assets held by a TOB trust that has been effectively financed by the trust’s issuance of floating rate securities, subject to an agreement by the Adviser as to certain funds to limit the amount of such assets for determining managed assets in certain circumstances. The complex-level fee is calculated based upon the aggregate daily managed assets of all Nuveenopen-end andclosed-end funds that constitute ‘’eligible assets.” Eligible assets do not include assets attributable to investments in other Nuveen funds or assets in excess of a determined amount (originally $2 billion) added to the Nuveen fund complex in connection with the Adviser’s assumption of the management of the former First American Funds effective January 1, 2011, but do not include certain assets of certain Nuveen funds that were reorganized into funds advised by an affiliate of the Adviser during the 2019 calendar year. As of October 31, 2023, the complex-level fee for each Fund was as follows: |
Fund | Complex-Level Fee | |||
NAD | 0.1623% | |||
NEA | 0.1623% | |||
Fund | Purchases | Sales | Realized Gain (Loss) | |||||||||
NAD | $ | 192,067,978 | $ | 191,423,762 | $ | (13,218,843) | ||||||
NEA | 214,700,323 | 222,870,897 | (14,907,566) | |||||||||
9. | Commitments and Contingencies |
10. | Borrowing Arrangements |
Fund | Maximum Outstanding Balance | |||
NAD | $ 22,128,276 | |||
NEA | 19,934,204 | |||
Fund | Utilization Period (Days Outstanding) | Average Daily Balance Outstanding | Average Annual Interest Rate | |||||||||
NAD | 18 | $ | 7,674,535 | 5.43% | ||||||||
NEA | 32 | 10,044,119 | 5.33 | |||||||||
11. | Subsequent Events |
| ● | The Fund may invest up to 20% of its Managed Assets in municipal securities that pay interest that is taxable under the federal alternative minimum tax. |
| ● | The Fund may invest up to 35% of its Managed Assets in securities that, at the time of investment, are rated below the three highest grades (Baa or BBB or lower) by at least one nationally recognized statistical rating organization (“NRSRO”) or are unrated but judged to be of comparable quality by the Fund’s sub-adviser. |
| ● | The Fund may invest up to 15% of its Managed Assets in inverse floating rate securities. |
| ● | The Fund may not enter into a futures contract or related options or forward contracts if more than 30% of the Fund’s Managed Assets would be represented by futures contracts or more than 5% of the Fund’s Managed Assets would be committed to initial margin deposits and premiums on futures contracts or related options. |
| ● | The Fund will generally maintain an investment portfolio with an overall weighted average maturity of greater than 10 years. |
| ● | May invest up to 35% of its Managed Assets in securities rated, at the time of investment, below the three highest grades (Baa or BBB or lower) by at least one NRSRO which includes below-investment-grade securities, or unrated securities judged to be of comparable quality by the Fund’s sub-adviser. |
| ● | May invest in distressed securities but may not invest in the securities of an issuer which, at the time of investment, is in default on its obligations to pay principal or interest thereon when due or that is involved in a bankruptcy proceeding (i.e., rated below C-, at the time of investment); provided, however, that the Fund’ssub-adviser may determine that it is in the best interest of shareholders in pursuing a workout arrangement with issuers of defaulted securities to make loans to the defaulted issuer or another party, or purchase a debt, equity or other interest from the defaulted issuer or another party, or take other related or similar steps involving the investment of additional monies, but only if that issuer’s securities are already held by the Fund. |
| ● | May invest up to 15% of its Managed Assets in inverse floating rate securities. |
| ● | The Fund may not enter into a futures contract or related options or forward contracts if more than 30% of the Fund’s Managed Assets would be represented by futures contracts or more than 5% of the Fund’s Managed Assets would be committed to initial margin deposits and premiums on futures contracts or related options. |
| ● | The Fund will generally maintain an investment portfolio with an overall weighted average maturity of greater than 10 years. |
Risk | Nuveen Quality Municipal Income Fund (NAD) | Nuveen AMT-Free Quality Municipal Income Fund (NEA) | ||||||||
Portfolio Level Risks | ||||||||||
| Alternative Minimum Tax Risk | X | - | ||||||||
| Below Investment Grade Risk | X | X | ||||||||
| Call Risk | X | X | ||||||||
| Credit Risk | X | X | ||||||||
| Credit Spread Risk | X | X | ||||||||
| Deflation Risk | X | X | ||||||||
| Derivatives Risk | X | X | ||||||||
| Distressed or Defaulted Securities Risk | X | X | ||||||||
| Duration Risk | X | X | ||||||||
| Economic Sector Risk | X | X | ||||||||
| Financial Futures and Options Risk | X | X | ||||||||
| Hedging Risk | X | X | ||||||||
| Illiquid Investments Risk | X | X | ||||||||
| Income Risk | X | X | ||||||||
| Inflation Risk | X | X | ||||||||
| Insurance Risk | X | X | ||||||||
| Interest Rate Risk | X | X | ||||||||
| Inverse Floating Rate Securities Risk | X | X | ||||||||
| Municipal Securities Market Liquidity Risk | X | X | ||||||||
| Municipal Securities Market Risk | X | X | ||||||||
| Other Investment Companies Risk | X | X | ||||||||
| Puerto Rico Municipal Securities Market Risk | X | X | ||||||||
| Reinvestment Risk | X | X | ||||||||
| Special Risks Related to Certain Municipal Obligations | X | X | ||||||||
| Swap Transactions Risk | X | X | ||||||||
| Tax Risk | X | X | ||||||||
| Taxability Risk | X | X | ||||||||
| Tobacco Settlement Bond Risk | X | X | ||||||||
| Unrated Securities Risk | X | X | ||||||||
| Valuation Risk | X | X | ||||||||
| Zero Coupon Bonds Risk | X | X | ||||||||
Risk | Nuveen Quality Municipal Income Fund (NAD) | Nuveen AMT-Free Quality Municipal Income Fund (NEA) | ||||||||
Fund Level and Other Risks | ||||||||||
| Anti-Takeover Provisions | X | X | ||||||||
| Counterparty Risk | X | X | ||||||||
| Cybersecurity Risk | X | X | ||||||||
| Economic and Political Events Risk | X | X | ||||||||
| Fund Tax Risk | X | X | ||||||||
| Global Economic Risk | X | X | ||||||||
| Investment and Market Risk | X | X | ||||||||
| Legislation and Regulatory Risk | X | X | ||||||||
| Leverage Risk | X | X | ||||||||
| Market Discount from Net Asset Value | X | X | ||||||||
| Recent Market Conditions | X | X | ||||||||
| Reverse Repurchase Agreement Risk | X | X | ||||||||
| ● | If the Fund has a need for cash and the securities in a special purpose trust are not actively trading due to adverse market conditions; |
| ● | If special purpose trust sponsors (as a collective group or individually) experience financial hardship and consequently seek to terminate their respective outstanding special purpose trusts; and |
| ● | If the value of an underlying security declines significantly and if additional collateral has not been posted by the Fund. |
Nuveen Quality Municipal Income Fund (NAD) | Nuveen AMT-Free Quality Municipal Income Fund (NEA) | |||||||||
| Estimated Leverage as a Percentage of Managed Assets (Including Assets Attributable to Leverage) | 42.58% | 42.58% | ||||||||
| Estimated Annual Effective Leverage Expense Rate Payable by Fund on Leverage | 3.92% | 3.58% | ||||||||
| Annual Return Fund Portfolio Must Experience (net of expenses) to Cover Estimated Annual Effective Interest Expense Rate on Leverage | 1.67% | 1.52% | ||||||||
| Common Share Total Return for (10.00)% Assumed Portfolio Total Return | (20.32)% | (20.07)% | ||||||||
| Common Share Total Return for (5.00)% Assumed Portfolio Total Return | (11.61)% | (11.36)% | ||||||||
| Common Share Total Return for 0.00% Assumed Portfolio Total Return | (2.91)% | (2.65)% | ||||||||
| Common Share Total Return for 5.00% Assumed Portfolio Total Return | 5.80% | 6.05% | ||||||||
| Common Share Total Return for 10.00% Assumed Portfolio Total Return | 14.51% | 14.76% | ||||||||
Adjustable Rate MuniFund Term Preferred (AMTP) Shares at the End of Period | MuniFund Preferred (MFP) Shares at the End of Period | MuniFund Term Preferred (MTP)Shares at the End of Period | Variable Rate MuniFund Term Preferred (VMTP) Shares at the End of Period | Variable Rate Demand Preferred (VRDP) Shares at the End of Period | AMTP, MFP, MTP, VMTP and/or VRDP Shares at the End of Period | |||||||||||||||||||||||||||||||||||||||
Year Ended 10/31: | Aggregate Amount | Asset Coverage Per $100,000 Share(2) | Aggregate Amount Outstanding (000)(1) | Asset Coverage Per $100,000 Share(2),(3) | Aggregate Amount Outstanding (000)(1) | Asset Coverage Per $10 Share(4) | Aggregate Amount Outstanding (000)(1) | Asset Coverage | Aggregate Amount Outstanding (000)(1) | Asset Coverage Per $100,000 Share(2) | Asset Coverage Per $1 Liquidation Preference | |||||||||||||||||||||||||||||||||
2023 | $173,000 | $240,834 | $1,038,900 | $240,834 | $0 | $0 | $ 0 | $ 0 | $1,159,400 | $240,834 | $2.41 | |||||||||||||||||||||||||||||||||
2022 | $173,000 | $240,229 | $1,088,900 | $240,229 | $0 | $0 | $ 0 | $ 0 | $1,159,400 | $240,229 | $2.40 | |||||||||||||||||||||||||||||||||
2021 | $316,500 | $283,145 | $1,088,900 | $283,145 | $0 | $0 | $ 0 | $ 0 | $1,159,400 | $283,145 | $2.83 | |||||||||||||||||||||||||||||||||
2020 | $143,500 | $280,550 | $ 958,000 | $280,550 | $0 | $0 | $ 0 | $ 0 | $1,290,300 | $280,550 | $2.81 | |||||||||||||||||||||||||||||||||
2019 | $ 0 | $ 0 | $ 958,000 | $282,066 | $0 | $0 | $ 0 | $ 0 | $1,290,300 | $282,066 | $2.82 | |||||||||||||||||||||||||||||||||
2018 | $ 0 | $ 0 | $ 958,000 | $265,448 | $0 | $0 | $ 0 | $ 0 | $1,290,300 | $265,448 | $2.65 | |||||||||||||||||||||||||||||||||
2017 | $ 0 | $ 0 | $ 0 | $ 0 | $0 | $0 | $773,000 | $291,919 | $1,290,300 | $291,919 | $2.92 | |||||||||||||||||||||||||||||||||
2016 | $ 0 | $ 0 | $ 0 | $ 0 | $0 | $0 | $773,000 | $295,667 | $1,290,300 | $295,667 | $2.96 | |||||||||||||||||||||||||||||||||
2015 | $ 0 | $ 0 | $ 0 | $ 0 | $0 | $0 | $151,000 | $333,349 | $ 349,900 | $333,349 | $3.33 | |||||||||||||||||||||||||||||||||
2014 | $ 0 | $ 0 | $ 0 | $ 0 | $0 | $0 | $151,000 | $338,193 | $ 349,900 | $338,193 | $3.38 | |||||||||||||||||||||||||||||||||
| (1) | Aggregate Amount Outstanding: Aggregate amount outstanding represents the liquidation preference as of the end of the relevant fiscal year and does not include any preferred shares noticed for redemption as noted on the Statement of Assets and Liabilities, where applicable. |
| (2) | Asset Coverage Per $100,000: Asset coverage per $100,000 is calculated by subtracting the Fund’s liabilities and indebtedness not represented by senior securities from the Fund’s total assets, dividing the result by the aggregate amount of the Fund’s senior securities representing indebtedness then outstanding (if applicable), plus the aggregate of the involuntary liquidation preference of the outstanding preferred shares, if applicable, and multiplying the result by 100,000. |
| (3) | The Fund’s Series D MFP Shares have a $1,000 liquidation preference per share, while all other MFP Shares have a $100,000 liquidation preference per share. The asset coverage per $1,000 share for the Fund’s Series D MFP Shares were as follows: |
Fiscal Year Ended October 31 | ||||||||||||
Series D MFP Shares | 2023 | 2022 | 2021 | 2020 | 2019 | 2018 | ||||||
Asset Coverage Per $1,000 Share* | $2,408 | $2,402 | $2,831 | $2,805 | $2,800 | $0 | ||||||
| * | Asset Coverage Per $1,000: Asset coverage per $1,000 is calculated by subtracting the Fund’s liabilities and indebtedness not represented by senior securities from the Fund’s total assets, dividing the result by the aggregate amount of the Fund’s senior securities representing indebtedness then outstanding, and multiplying the result by 1,000. |
| (4) | Asset Coverage Per $10: Asset coverage per $10 is calculated by subtracting the Fund’s liabilities and indebtedness not represented by senior securities from the Fund’s total assets, dividing the result by the aggregate amount of the Fund’s senior securities representing indebtedness then outstanding, and multiplying the result by 10. The Ending and Average Market Value Per Share for each Series of the Fund’s MTP Shares outstanding were as follows: |
Fiscal Year Ended October 31 | ||||
Series 2015 (NEA PRCCL) | 2014 | |||
Ending Market Value per Share | $0 | |||
Average Market Value per Share | $10.05** |
| ** | For the period November 1, 2013 through December 20, 2013. |
Fund | Net Long-Term Capital Gains | |||
NAD | $– | |||
NEA | – | |||
| Jack B. Evans | William C. Hunter | Amy B.R. Lancellotta | Joanne T. Medero | Albin F. Moschner | John K. Nelson | |||||
| Matthew Thornton III | Terence J. Toth | Margaret L. Wolff | Robert L. Young | |||||||
Investment Adviser Nuveen Fund Advisors, LLC 333 West Wacker Drive Chicago, IL 60606 | Custodian State Street Bank & Trust Company One Lincoln Street Boston, MA 02111 | Legal Counsel Chapman and Cutler LLP Chicago, IL 60603 | Independent Registered Public Accounting Firm KPMG LLP 200 East Randolph Street Chicago, IL 60601 | Transfer Agent and Shareholder Services Computershare Trust Company, N.A. 150 Royall Street Canton, MA 02021 (800) 257-8787 |
NAD | NEA | |||||||
Common shares repurchased | 0 | 45,000 | ||||||
Name, Year of Birth & Address | Position(s) Held with the Funds | Year First Elected or Appointed and Term (1) | Principal Occupation(s) Including other Directorships During Past 5 Years | Number of Portfolios in Fund Complex Overseen By Board Member | ||||||||
Independent Trustees: | ||||||||||||
Terence J. Toth 1959 333 W. Wacker Drive Chicago, IL 60606 | Chair and Board Member | | 2008 Class II | | Formerly, a Co-Founding Partner, Promus Capital (investment advisory firm) (2008-2017); formerly, Director, Quality Control Corporation (manufacturing) (2012-2021); Chair of the Board of the Kehrein Center for the Arts (philanthropy) (since 2021); member: Catalyst Schools of Chicago Board (since 2008) and Mather Foundation Board (philanthropy) (since 2012), formerly, Chair of its Investment Committee (2017-2022); formerly, Member, Chicago Fellowship Board (philanthropy) (2005-2016); formerly, Director, Fulcrum IT Services LLC (information technology services firm to government entities) (2010-2019); formerly, Director, LogicMark LLC (health services) (2012-2016); formerly, Director, Legal & General Investment Management America, Inc. (asset management) (2008-2013); formerly, CEO and President, Northern Trust Global Investments (financial services) (2004-2007); Executive Vice President, Quantitative Management & Securities Lending (2000-2004); prior thereto, various positions with Northern Trust Company (financial services) (since 1994); formerly, Member, Northern Trust Mutual Funds Board (2005-2007), Northern Trust Global Investments Board (2004-2007), Northern Trust Japan Board (2004-2007), Northern Trust Securities Inc. Board (2003- 2007) and Northern Trust Hong Kong Board (1997-2004). | 132 | ||||||
Jack B. Evans 1948 333 W. Wacker Drive Chicago, IL 60606 | Board Member | | 1999 Class III | | Chairman (since 2019), formerly, President (1996-2019), The Hall-Perrine Foundation, (private philanthropic corporation); Life Trustee of Coe College and the Iowa College Foundation; formerly, Member and President Pro-Tem of the Board of Regents for the State of Iowa University System (2007- 2013); Director and Chairman (2009-2021), United Fire Group, a publicly held company; Director, Public Member, American Board of Orthopaedic Surgery (2015-2020); Director (2000-2004), Alliant Energy; Director (1996-2015), The Gazette Company (media and publishing); Director (1997- 2003), Federal Reserve Bank of Chicago; President and Chief Operating Officer (1972-1995), SCI Financial Group, Inc., (regional financial services firm). | 132 | ||||||
William C. Hunter 1948 333 W. Wacker Drive Chicago, IL 60606 | Board Member | | 2003 Class I | | Dean Emeritus, formerly, Dean, Tippie College of Business, University of Iowa (2006-2012); Director of Wellmark, Inc. (since 2009); past Director (2005-2015), and past President (2010- 2014) Beta Gamma Sigma, Inc., The International Business Honor Society; formerly, Director (2004-2018) of Xerox Corporation; formerly, Dean and Distinguished Professor of Finance, School of Business at the University of Connecticut (2003-2006); previously, Senior Vice President and Director of Research at the Federal Reserve Bank of Chicago (1995-2003); formerly, Director (1997-2007), Credit Research Center at Georgetown University. | 132 | ||||||
Name, Year of Birth & Address | Position(s) Held with the Funds | Year First Elected or Appointed and Term (1) | Principal Occupation(s) Including other Directorships During Past 5 Years | Number of Portfolios in Fund Complex Overseen By Board Member | ||||||
Amy B. R. Lancellotta 1959 333 W. Wacker Drive Chicago, IL 60606 | Board Member | | 2021 Class II | | Formerly, Managing Director, Independent Directors Council (IDC) (supports the fund independent director community and is part of the Investment Company Institute (ICI), which represents regulated investment companies) (2006-2019); formerly, various positions with ICI (1989-2006); President (since 2023) and Member (since 2020) of the Board of Directors, Jewish Coalition Against Domestic Abuse (JCADA). | 132 | ||||
Joanne T. Medero 1954 333 W. Wacker Drive Chicago, IL 60606 | Board Member | | 2021 Class III | | Formerly, Managing Director, Government Relations and Public Policy (2009-2020) and Senior Advisor to the Vice Chairman (2018-2020), BlackRock, Inc. (global investment management firm); formerly, Managing Director, Global Head of Government Relations and Public Policy, Barclays Group (IBIM) (investment banking, investment management and wealth management businesses) (2006-2009); formerly, Managing Director, Global General Counsel and Corporate Secretary, Barclays Global Investors (global investment management firm) (1996-2006); formerly, Partner, Orrick, Herrington & Sutcliffe LLP (law firm) (1993-1995); formerly, General Counsel, Commodity Futures Trading Commission (government agency overseeing U.S. derivatives markets) (1989-1993); formerly, Deputy Associate Director/Associate Director for Legal and Financial Affairs, Office of Presidential Personnel, The White House (1986-1989); Member of the Board of Directors, Baltic-American Freedom Foundation (seeks to provide opportunities for citizens of the Baltic states to gain education and professional development through exchanges in the U.S.) (since 2019). | 132 | ||||
Albin F. Moschner 1952 333 W. Wacker Drive Chicago, IL 60606 | Board Member | | 2016 Class III | | Founder and Chief Executive Officer, Northcroft Partners, LLC, (management consulting) (since 2012); formerly, Chairman (2019), and Director (2012-2019), USA Technologies, Inc., (provider of solutions and services to facilitate electronic payment transactions); formerly, Director, Wintrust Financial Corporation (1996-2016); previously, held positions at Leap Wireless International, Inc. (consumer wireless services), including Consultant (2011-2012), Chief Operating Officer (2008-2011), and Chief Marketing Officer (2004-2008); formerly, President, Verizon Card Services division of Verizon Communications, Inc. (2000-2003); formerly, President, One Point Services at One Point Communications (telecommunication services) (1999-2000); formerly, Vice Chairman of the Board, Diba, Incorporated (internet technology provider) (1996-1997); formerly, various executive positions (1991-1996) including Chief Executive Officer (1995-1996) of Zenith Electronics Corporation (consumer electronics). | 132 | ||||
John K. Nelson 1962 333 W. Wacker Drive Chicago, IL 60606 | Board Member | | 2013 Class II | | Member of Board of Directors of Core12 LLC. (private firm which develops branding, marketing and communications strategies for clients) (since 2008); served The President’s Council of Fordham University (2010-2019) and previously a Director of the Curran Center for Catholic American Studies (2009-2018); formerly, senior external advisor to the Financial Services practice of Deloitte Consulting LLP. (2012-2014); former Chair of the Board of Trustees of Marian University (2010-2014 as trustee, 2011-2014 as Chair); formerly Chief Executive Officer of ABN AMRO Bank N.V., North America, and Global Head of the Financial Markets Division (2007-2008), with various executive leadership roles in ABN AMRO Bank N.V. between 1996 and 2007. | 132 | ||||
Name, Year of Birth & Address | Position(s) Held with the Funds | Year First Elected or Appointed and Term (1) | Principal Occupation(s) Including other Directorships During Past 5 Years | Number of Portfolios in Fund Complex Overseen By Board Member | ||||||
Matthew Thornton III 1958 333 W. Wacker Drive Chicago, IL 60606 | Board Member | | 2020 Class III | | Formerly, Executive Vice President and Chief Operating Officer (2018-2019), FedEx Freight Corporation, a subsidiary of FedEx Corporation (FedEx) (provider of transportation, e-commerce and business services through its portfolio of companies); formerly, Senior Vice President, U.S. Operations (2006-2018), Federal Express Corporation, a subsidiary of FedEx; formerly Member of the Board of Directors (2012-2018), Safe Kids Worldwide® (anon-profit organization dedicated to preventing childhood injuries). Member of the Board of Directors (since 2014), The Sherwin-Williams Company (develops, manufactures, distributes and sells paints, coatings and related products); Director (since 2020), Crown Castle International (provider of communications infrastructure). | 132 | ||||
Margaret L. Wolff 1955 333 W. Wacker Drive Chicago, IL 60606 | Board Member | | 2016 Class I | | Formerly, member of the Board of Directors (2013-2017) of Travelers Insurance Company of Canada and The Dominion of Canada General Insurance Company (each, a part of Travelers Canada, the Canadian operation of The Travelers Companies, Inc.); formerly, Of Counsel, Skadden, Arps, Slate, Meagher & Flom LLP (Mergers & Acquisitions Group) (legal services) (2005- 2014); Member of the Board of Trustees of New York-Presbyterian Hospital (since 2005); Member (since 2004) formerly, Chair (2015- 2022) of the Board of Trustees of The John A. Hartford Foundation (a philanthropy dedicated to improving the care of older adults); formerly, Member (2005-2015) and Vice Chair (2011-2015) of the Board of Trustees of Mt. Holyoke College. | 132 | ||||
Robert L. Young 1963 333 W. Wacker Drive Chicago, IL 60606 | Board Member | | 2017 Class I | | Formerly, Chief Operating Officer and Director, J.P. Morgan Investment Management Inc. (financial services) (2010-2016); formerly, President and Principal Executive Officer (2013-2016), and Senior Vice President and Chief Operating Officer (2005-2010), of J.P. Morgan Funds; formerly, Director and various officer positions for J.P. Morgan Investment Management Inc. (formerly, JPMorgan Funds Management, Inc. and formerly, One Group Administrative Services) and JPMorgan Distribution Services, Inc. (financial services) (formerly, One Group Dealer Services, Inc.) (1999-2017). | 132 | ||||
Name, Year of Birth & Address | Position(s) Held with the Funds | Year First Elected or Appointed (2) | Principal Occupation(s) Including other Directorships During Past 5 Years | |||
Officers of the Funds: | ||||||
David J. Lamb 1963 333 W. Wacker Drive Chicago, IL 60606 | Chief Administrative Officer | 2015 | Managing Director of Nuveen Fund Advisors, LLC (since 2019); Senior Managing Director (since 2021), formerly, Managing Director (2020-2021) of Nuveen Securities, LLC; Senior Managing Director (since 2021), formerly, Managing Director (2017-2021), Senior Vice President of Nuveen (2006-2017). | |||
Brett E. Black 1972 333 W. Wacker Drive Chicago, IL 60606 | Vice President and Chief Compliance Officer | 2022 | Managing Director, Chief Compliance Officer of Nuveen (since 2022); formerly, Vice President (2014-2022), Chief Compliance Officer and Anti-Money Laundering Compliance Officer (2017-2022), Deputy Chief Compliance Officer (2014-2017) of BMO Funds, Inc. | |||
Name, Year of Birth & Address | Position(s) Held with the Funds | Year First Elected or Appointed (2) | Principal Occupation(s) Including other Directorships During Past 5 Years | |||
Mark J. Czarniecki 1979 901 Marquette Avenue Minneapolis, MN 55402 | Vice President and Assistant Secretary | 2013 | Managing Director (since 2022), formerly, Vice President (2016-2022), and Assistant Secretary (since 2016) of Nuveen Securities, LLC; Managing Director (since 2022), formerly, Vice President (2017-2022) and Assistant Secretary (since 2017) of Nuveen Fund Advisors, LLC; Managing Director and Associate General Counsel (since January 2022), formerly, Vice President and Associate General Counsel of Nuveen (2013-2021); Managing Director (since 2022), formerly, Vice President (2018-2022), Assistant Secretary and Associate General Counsel (since 2018) of Nuveen Asset Management, LLC; Managing Director, Associate General Counsel and Assistant Secretary of Teachers Advisors, LLC and TIAA-CREF Investment Management, LLC (since 2023). | |||
Diana R. Gonzalez 1978 8500 Andrew Carnegie Blvd. Charlotte, NC 28262 | Vice President and Assistant Secretary | 2017 | Vice President and Assistant Secretary of Nuveen Fund Advisors, LLC (since 2017); Vice President and Associate General Counsel and Assistant Secretary of Nuveen Asset Management, LLC (since 2022); Vice President, Associate General Counsel and Assistant Secretary of Teachers Advisors, LLC and TIAA-CREF Investment Management, LLC (since 2023); Vice President and Associate General Counsel of Nuveen (since 2017); formerly, Associate General Counsel of Jackson National Asset Management (2012-2017). | |||
Nathaniel T. Jones 1979 333 W. Wacker Drive Chicago, IL 60606 | Vice President and Treasurer | 2016 | Senior Managing Director (since 2021), formerly, Managing Director (2017-2021), Senior Vice President (2016-2017) of Nuveen; Managing Director (since 2015) of Nuveen Fund Advisors, LLC; Chartered Financial Analyst. | |||
Brian H. Lawrence 1982 8500 Andrew Carnegie Blvd. Charlotte, NC 28262 | Vice President and Assistant Secretary | 2023 | Vice President and Associate General Counsel of Nuveen (since 2023); Vice President, Associate General Counsel and Assistant Secretary (since 2023) of Teachers Advisors, LLC and TIAA-CREF Investment Management, LLC; formerly Corporate Counsel of Franklin Templeton (2018-2022). | |||
Tina M. Lazar 1961 333 W. Wacker Drive Chicago, IL 60606 | Vice President | 2002 | Managing Director (since 2017), formerly, Senior Vice President (2014-2017) of Nuveen Securities, LLC. | |||
Brian J. Lockhart 1974 333 W. Wacker Drive Chicago, IL 60606 | Vice President | 2019 | Managing Director (since 2019) of Nuveen Fund Advisors, LLC; Senior Managing Director (since 2021), formerly, Managing Director (2017-2021), Vice President (2010-2017) of Nuveen; Head of Investment Oversight (since 2017), formerly, Team Leader of Manager Oversight (2015-2017); Chartered Financial Analyst and Certified Financial Risk Manager. | |||
John M. McCann 1975 8500 Andrew Carnegie Blvd. Charlotte, NC 28262 | Vice President and Assistant Secretary | 2022 | Managing Director (since 2021), General Counsel and Secretary (since 2023), formerly, Assistant Secretary (2021-2023), of Nuveen Fund Advisors, LLC; Managing Director, Associate General Counsel and Assistant Secretary of Nuveen Asset Management, LLC (since 2021); Managing Director (since 2021) and Assistant Secretary (since 2016) of TIAA SMA Strategies LLC; Managing Director (since 2019, formerly, Vice President and Director), Associate General Counsel and Assistant Secretary of College Retirement Equities Fund, TIAA Separate Account VA-1, TIAA- CREF Funds and TIAA-CREF Life Funds; Managing Director (since 2018), formerly, Vice President and Director, Associate General Counsel and Assistant Secretary of Teachers Insurance and Annuity Association of America, Teacher Advisors LLC and TIAA-CREF Investment Management, LLC; Managing Director (since 2022), formerly, Vice President (2017-2022), Associate General Counsel and Assistant Secretary (since 2011) of Nuveen Alternative Advisors LLC; General Counsel and Assistant Secretary of Covariance Capital Management, Inc. (2014-2017). | |||
Name, Year of Birth & Address | Position(s) Held with the Funds | Year First Elected or Appointed (2) | Principal Occupation(s) Including other Directorships During Past 5 Years | |||
Kevin J. McCarthy 1966 333 W. Wacker Drive Chicago, IL 60606 | Vice President and Assistant Secretary | 2007 | Executive Vice President (since 2022) and Secretary and General Counsel (since 2016) of Nuveen Investments, Inc., formerly, Senior Managing Director (2017- 2022); Executive Vice President (since 2023) and Assistant Secretary (since 2008) of Nuveen Securities, LLC, formerly Senior Managing Director (2017-2023); Executive Vice President and Assistant Secretary (since 2023) of Nuveen Fund Advisors, LLC, formerly, Senior Managing Director (2017-2023), Secretary (2016-2023) and Co- General Counsel (2011-2020); Executive Vice President (since 2023) and Secretary (since 2016) of Nuveen Asset Management, LLC, formerly, Senior Managing Director (2017-2023) and Associate General Counsel (2011-2020); Executive Vice President (since 2021) and Secretary (since 2023) of Teachers Advisors, LLC, formerly, General Counsel and Assistant Secretary (2021-2023); Executive Vice President (since 2017) and Secretary (since 2023) of TIAA-CREF Investment Management, LLC, formerly General Counsel and Assistant Secretary (2017- 2023); formerly, Vice President (2007-2021) and Secretary (2016-2021), of NWQ Investment Management Company, LLC and Santa Barbara Asset Management, LLC; Vice President and Secretary of Winslow Capital Management, LLC (since 2010); Executive Vice President (since 2023) and Secretary (since 2016) of Nuveen Alternative Investments, LLC, formerly Senior Managing Director (2017-2023). | |||
Jon Scott Meissner 1973 8500 Andrew Carnegie Blvd. Charlotte, NC 28262 | Vice President and Assistant Secretary | 2019 | Managing Director, Mutual Fund Tax and Expense Administration (since 2022), formerly, Managing Director of Mutual Fund Tax and Financial Reporting groups (2017-2022), at Nuveen; Managing Director of Nuveen Fund Advisors, LLC (since 2019); Managing Director (since 2021), formerly, Senior Director (2016-2021), of Teachers Advisors, LLC and TIAA-CREF Investment Management, LLC; Managing Director, Mutual Fund Tax and Expense Administration (since 2022), formerly, Senior Director Mutual Fund Taxation (2015-2022), to the TIAA-CREF Funds, the TIAA-CREF Life Funds, the TIAA Separate Account VA-1 and the CREF Accounts; has held various positions with TIAA since 2004. | |||
William A. Siffermann 1975 333 W. Wacker Drive Chicago, IL 60606 | Vice President | 2017 | Managing Director (since 2017), formerly Senior Vice President (2016-2017) of Nuveen. | |||
E. Scott Wickerham 1973 8500 Andrew Carnegie Blvd. Charlotte, NC 28262 | Vice President and Controller | 2019 | Senior Managing Director, Head of Public Investment Finance at Nuveen (since 2019), formerly, Managing Director; Senior Managing Director (since 2019) of Nuveen Fund Advisors, LLC; Senior Managing Director (since 2022) of Nuveen Asset Management, LLC; Senior Managing Director of Teachers Advisors, LLC (since 2021) and TIAA-CREF Investment Management, LLC (since 2016); Principal Financial Officer, Principal Accounting Officer and Treasurer (since 2017) of the TIAA-CREF Funds, the TIAA-CREF Life Funds, the TIAA Separate Account VA-1 and Principal Financial Officer, Principal Accounting Officer (since 2020) and Treasurer (since 2017) of the CREF Accounts; has held various positions with TIAA since 2006. | |||
Mark L. Winget 1968 333 W. Wacker Drive Chicago, IL 60606 | Vice President and Secretary | 2008 | Vice President and Assistant Secretary of Nuveen Securities, LLC (since 2008), and Nuveen Fund Advisors, LLC (since 2019); Vice President, Associate General Counsel and Assistant Secretary of Teachers Advisors, LLC and TIAA-CREF Investment Management, LLC (since 2023) and Nuveen Asset Management, LLC (since 2020); Vice President (since 2010) and Associate General Counsel (since 2019) of Nuveen. | |||
Rachael Zufall 1973 8500 Andrew Carnegie Blvd. Charlotte, NC 28262 | Vice President and Assistant Secretary | 2022 | Managing Director and Assistant Secretary (since 2023) of Nuveen Fund Advisors, LLC; Managing Director (since 2017), Associate General Counsel and Assistant Secretary (since 2014) of the CREF Accounts, TIAA Separate Account VA-1, TIAA-CREF Funds and TIAA-CREF Life Funds; Managing Director (since 2017), Associate General Counsel and Assistant Secretary (since 2011) of Teachers Advisors, LLC and TIAA-CREF Investment Management, LLC; Managing Director of Nuveen, LLC and of TIAA (since 2017). | |||
| (1) | The Board of Trustees is divided into three classes, Class I, Class II, and Class III, with each being elected to serve until the third succeeding annual shareholders’ meeting subsequent to its election or thereafter in each case when its respective successors are duly elected or appointed, except two board members are elected by the holders of Preferred Shares, when applicable, to serve until the next annual shareholders’ meeting subsequent to its election or thereafter in each case when its respective successors are duly elected or appointed. The year first elected or appointed represents the year in which the board member was first elected or appointed to any fund in the Nuveen complex. |
| (2) | Officers serve indefinite terms until their successor has been duly elected and qualified, their death or their resignation or removal. The year first elected or appointed represents the year in which the Officer was first elected or appointed to any fund in the Nuveen Complex. |

Nuveen: Serving Investors for Generations Since 1898, financial advisors and their clients have relied on Nuveen to provide dependable investment solutions through continued adherence to proven, long-term investing principles. Today, we offer a range of high quality solutions designed to be integral components of a well-diversified core portfolio. Focused on meeting investor needs. Nuveen is the investment manager of TIAA. We have grown into one of the world’s premier global asset managers, with specialist knowledge across all major asset classes and particular strength in solutions that provide income for investors and that draw on our expertise in alternatives and responsible investing. Nuveen is driven not only by the independent investment processes across the firm, but also the insights, risk management, analytics and other tools and resources that a truly world-class platform provides. As a global asset manager, our mission is to work in partnership with our clients to create solutions which help them secure their financial future. Find out how we can help you. To learn more about how the products and services of Nuveen may be able to help you meet your financial goals, talk to your financial advisor, or call us at (800) 257-8787. Please read the information provided carefully before you invest. Investors should consider the investment objective and policies, risk considerations, charges and expenses of any investment carefully. Where applicable, be sure to obtain a prospectus, which contains this and other relevant information. To obtain a prospectus, please contact your securities representative or Nuveen, 333 W. Wacker Dr., Chicago, IL 60606.Please read the prospectus carefully before you invest or send money. Learn more about Nuveen Funds at: www.nuveen.com/closed-end-funds NOT FDIC INSURED MAY LOSE VALUE NO BANK GUARANTEE |
Nuveen Securities, LLC, member FINRA and SIPC | 333 West Wacker Drive | Chicago, IL 60606 | www.nuveen.com EAN-B-1023P 3241318-INV-Y-12/24 |
| ITEM 2. | CODE OF ETHICS. |
As of the end of the period covered by this report, the registrant has adopted a code of ethics that applies to the registrant’s principal executive officer, principal financial officer, principal accounting officer or controller, or persons performing similar functions. There were no amendments to or waivers from the Code during the period covered by this report. The registrant has posted the code of ethics on its website at www.nuveen.com/fund-governance. (To view the code, click on Code of Conduct.)
| ITEM 3. | AUDIT COMMITTEE FINANCIAL EXPERT. |
As of the end of the period covered by this report, the registrant’s Board of Directors or Trustees (“Board”) determined that the registrant has at least one “audit committee financial expert” (as defined in Item 3 of Form N-CSR) serving on its Audit Committee. The registrant’s audit committee financial experts are Jack B. Evans, Albin F. Moschner, John K. Nelson and Robert L. Young, who are “independent” for purposes of Item 3 of Form N-CSR.
Mr. Evans was formerly President and Chief Operating Officer of SCI Financial Group, Inc., a full service registered broker-dealer and registered investment adviser (“SCI”). As part of his role as President and Chief Operating Officer, Mr. Evans actively supervised the Chief Financial Officer (the “CFO”) and actively supervised the CFO’s preparation of financial statements and other filings with various regulatory authorities. In such capacity, Mr. Evans was actively involved in the preparation of SCI’s financial statements and the resolution of issues raised in connection therewith. Mr. Evans has also served on the audit committee of various reporting companies. At such companies, Mr. Evans was involved in the oversight of audits, audit plans, and the preparation of financial statements. Mr. Evans also formerly chaired the audit committee of the Federal Reserve Bank of Chicago.
Mr. Moschner is a consultant in the wireless industry and, in July 2012, founded Northcroft Partners, LLC, a management consulting firm that provides operational, management and governance solutions. Prior to founding Northcroft Partners, LLC, Mr. Moschner held various positions at Leap Wireless International, Inc., a provider of wireless services, where he was as a consultant from February 2011 to July 2012, Chief Operating Officer from July 2008 to February 2011, and Chief Marketing Officer from August 2004 to June 2008. Before he joined Leap Wireless International, Inc., Mr. Moschner was President of the Verizon Card Services division of Verizon Communications, Inc. from 2000 to 2003, and President of One Point Services at One Point Communications from 1999 to 2000. Mr. Moschner also served at Zenith Electronics Corporation as Director, President and Chief Executive Officer from 1995 to 1996, and as Director, President and Chief Operating Officer from 1994 to 1995.
Mr. Nelson is on the Board of Directors of Core12, LLC. (since 2008), a private firm which develops branding, marketing, and communications strategies for clients. Mr. Nelson has extensive experience in global banking and markets, having served in several senior executive positions with ABN AMRO Holdings N.V. and its affiliated entities and predecessors, including LaSalle Bank Corporation from 1996 to 2008, ultimately serving as Chief Executive Officer of ABN AMRO N.V. North America. During his tenure at the bank, he also served as Global Head of its Financial Markets Division, which encompassed the bank’s Currency, Commodity, Fixed Income, Emerging Markets, and Derivatives businesses. He was a member of the Foreign Exchange Committee of the Federal Reserve Bank of the United States and during his tenure with ABN AMRO served as the bank’s representative on various committees of The Bank of Canada, European Central Bank, and The Bank of England. Mr. Nelson previously served as a senior, external advisor to the financial services practice of Deloitte Consulting LLP. (2012-2014).
Mr. Young has more than 30 years of experience in the investment management industry. From 1997 to 2017, he held various positions with J.P. Morgan Investment Management Inc. (“J.P. Morgan Investment”) and its affiliates (collectively, “J.P. Morgan”). Most recently, he served as Chief Operating Officer and Director of J.P. Morgan Investment (from 2010 to 2016) and as President and Principal Executive Officer of the J.P. Morgan Funds (from 2013 to 2016). As Chief Operating Officer of J.P. Morgan Investment, Mr. Young led service, administration and business platform support activities for J.P. Morgan’s domestic retail mutual fund and institutional commingled and separate account businesses, and co-led these activities for J.P. Morgan’s global retail and institutional investment management businesses. As President of the J.P. Morgan Funds, Mr. Young interacted with various service providers to these funds, facilitated the relationship between such funds and their boards, and was directly involved in establishing board agendas, addressing regulatory matters, and establishing policies and procedures. Before joining J.P. Morgan, Mr. Young, a former Certified Public Accountant (CPA), was a Senior Manager (Audit) with Deloitte & Touche LLP (formerly, Touche Ross LLP), where he was employed from 1985 to 1996. During his tenure there, he actively participated in creating, and ultimately led, the firm’s midwestern mutual fund practice.
| ITEM 4. | PRINCIPAL ACCOUNTANT FEES AND SERVICES. |
Nuveen AMT-Free Quality Municipal Income Fund
The following tables show the amount of fees that KPMG LLP, the Fund’s auditor, billed to the Fund during the Fund’s last two full fiscal years. For engagements with KPMG LLP the Audit Committee approved in advance all audit services and non-audit services that KPMG LLP provided to the Fund, except for those non-audit services that were subject to the pre-approval exception under Rule 2-01 of Regulation S-X (the “pre-approval exception”). The pre-approval exception for services provided directly to the Fund waives the pre-approval requirement for services other than audit, review or attest services if: (A) the aggregate amount of all such services provided constitutes no more than 5% of the total amount of revenues paid by the Fund to its accountant during the fiscal year in which the services are provided; (B) the Fund did not recognize the services as non-audit services at the time of the engagement; and (C) the services are promptly brought to the Audit Committee’s attention, and the Committee (or its delegate) approves the services before the audit is completed.
The Audit Committee has delegated certain pre-approval responsibilities to its Chair (or, in his absence, any other member of the Audit Committee).
SERVICES THAT THE FUND’S AUDITOR BILLED TO THE FUND
Fiscal Year Ended | Audit Fees Billed to Fund 1 | Audit-Related Fees Billed to Fund 2 | Tax Fees Billed to Fund 3 | All Other Fees Billed to Fund 4 | ||||||||||||
October 31, 2023 | $ | 40,000 | $ | 2,600 | $ | 0 | $ | 0 | ||||||||
|
|
|
|
|
|
|
| |||||||||
Percentage approved pursuant to pre-approval exception | 0 | % | 0 | % | 0 | % | 0 | % | ||||||||
|
|
|
|
|
|
|
| |||||||||
October 31, 2022 | $ | 37,620 | $ | 2,500 | $ | 0 | $ | 0 | ||||||||
|
|
|
|
|
|
|
| |||||||||
Percentage approved pursuant to pre-approval exception | 0 | % | 0 | % | 0 | % | 0 | % | ||||||||
|
|
|
|
|
|
|
| |||||||||
1 “Audit Fees” are the aggregate fees billed for professional services for the audit of the Fund’s annual financial statements and services provided in connection with statutory and regulatory filings or engagements.
2 “Audit Related Fees” are the aggregate fees billed for assurance and related services reasonably related to the performance of the audit or review of financial statements that are not reported under “Audit Fees”. These fees include offerings related to the Fund’s common shares and leverage.
3 “Tax Fees” are the aggregate fees billed for professional services for tax advice, tax compliance, and tax planning. These fees include: all global withholding tax services; excise and state tax reviews; capital gain, tax equalization and taxable basis calculation performed by the principal accountant.
4 “All Other Fees” are the aggregate fees billed for products and services other than “Audit Fees”, “Audit-Related Fees” and “Tax Fees”. These fees represent all “Agreed-Upon Procedures” engagements pertaining to the Fund’s use of leverage.
SERVICES THAT THE FUND’S AUDITOR BILLED TO THE
ADVISER AND AFFILIATED FUND SERVICE PROVIDERS
The following tables show the amount of fees billed by KPMG LLP to Nuveen Fund Advisors, LLC (formerly Nuveen Fund Advisors, Inc.) (the “Adviser”), and any entity controlling, controlled by or under common control with the Adviser that provides ongoing services to the Fund (“Affiliated Fund Service Provider”), for engagements directly related to the Fund’s operations and financial reporting, during the Fund’s last two full fiscal years.
The tables also show the percentage of fees subject to the pre-approval exception. The pre-approval exception for services provided to the Adviser and any Affiliated Fund Service Provider (other than audit, review or attest services) waives the pre-approval requirement if: (A) the aggregate amount of all such services provided constitutes no more than 5% of the total amount of revenues paid to KPMG LLP by the Fund, the Adviser and Affiliated Fund Service Providers during the fiscal year in which the services are provided that would have to be pre-approved by the Audit Committee; (B) the Fund did not recognize the services as non-audit services at the time of the engagement; and (C) the services are promptly brought to the Audit Committee’s attention, and the Committee (or its delegate) approves the services before the Fund’s audit is completed.
Fiscal Year Ended | Audit-Related Fees Billed to Adviser and Affiliated Fund Service Providers | Tax Fees Billed to Adviser and Affiliated Fund Service Providers | All Other Fees Billed to Adviser and Affiliated Fund Service Providers | |||||||||
October 31, 2023 | $ | 0 | $ | 0 | $ | 0 | ||||||
|
|
|
|
|
| |||||||
Percentage approved pursuant to pre-approval exception | 0 | % | 0 | % | 0 | % | ||||||
|
|
|
|
|
| |||||||
October 31, 2022 | $ | 0 | $ | 0 | $ | 0 | ||||||
|
|
|
|
|
| |||||||
Percentage approved pursuant to pre-approval exception | 0 | % | 0 | % | 0 | % | ||||||
|
|
|
|
|
| |||||||
NON-AUDIT SERVICES
The following table shows the amount of fees that KPMG LLP billed during the Fund’s last two full fiscal years for non-audit services. The Audit Committee is required to pre-approve non-audit services that KPMG LLP provides to the Adviser and any Affiliated Fund Services Provider, if the engagement related directly to the Fund’s operations and financial reporting (except for those subject to the pre-approval exception described above). The Audit Committee requested and received information from KPMG LLP about any non-audit services that KPMG LLP rendered during the Fund’s last fiscal year to the Adviser and any Affiliated Fund Service Provider. The Committee considered this information in evaluating KPMG LLP’s independence.
Fiscal Year Ended | Total Non-Audit Fees Billed to Fund | Total Non-Audit Fees billed to Adviser and Affiliated Fund Service Providers (engagements related directly to the operations and financial reporting of the Fund) | Total Non-Audit Fees billed to Adviser and Affiliated Fund Service Providers (all other engagements) | Total | ||||||||||||
October 31, 2023 | $ | 0 | $ | 0 | $ | 0 | $ | 0 | ||||||||
October 31, 2022 | $ | 0 | $ | 0 | $ | 0 | $ | 0 | ||||||||
“Non-Audit Fees billed to Fund” for both fiscal year ends represent “Tax Fees” and “All Other Fees” billed to Fund in their respective
amounts from the previous table.
Less than 50 percent of the hours expended on the principal accountant’s engagement to audit the registrant’s financial statements for the most recent fiscal year were attributed to work performed by persons other than the principal accountant’s full-time, permanent employees.
Audit Committee Pre-Approval Policies and Procedures. Generally, the Audit Committee must approve (i) all non-audit services to be performed for the Fund by the Fund’s independent accountants and (ii) all audit and non-audit services to be performed by the Fund’s independent accountants for the Affiliated Fund Service Providers with respect to operations and financial reporting of the Fund. Regarding tax and research projects conducted by the independent accountants for the Fund and Affiliated Fund Service Providers (with respect to operations and financial reports of the Fund) such engagements will be (i) pre-approved by the Audit Committee if they are expected to be for amounts greater than $10,000; (ii) reported to the Audit Committee chair for his verbal approval prior to engagement if they are expected to be for amounts under $10,000 but greater than $5,000; and (iii) reported to the Audit Committee at the next Audit Committee meeting if they are expected to be for an amount under $5,000.
| ITEM 5. | AUDIT COMMITTEE OF LISTED REGISTRANTS. |
The registrant’s Board has a separately designated Audit Committee established in accordance with Section 3(a)(58)(A) of the Securities Exchange Act of 1934, as amended (15 U.S.C. 78c(a) (58)(A)). As of the end of the period covered by this report the members of the audit committee are Jack B. Evans, Albin F. Moschner, John K. Nelson, Chair, Margaret L. Wolff, and Robert L. Young.
| ITEM 6. | SCHEDULE OF INVESTMENTS. |
| a) | See Portfolio of Investments in Item 1. |
| b) | Not applicable. |
| ITEM 7. | DISCLOSURE OF PROXY VOTING POLICIES AND PROCEDURES FOR CLOSED-END MANAGEMENT INVESTMENT COMPANIES. |
| ITEM 8. | PORTFOLIO MANAGERS OF CLOSED-END MANAGEMENT INVESTMENT COMPANIES. |
Nuveen Fund Advisors, LLC is the registrant’s investment adviser (also referred to as the “Adviser”). The Adviser is responsible for the selection and on-going monitoring of the Fund’s investment portfolio, managing the Fund’s business affairs and providing certain clerical, bookkeeping and administrative services. The Adviser has engaged Nuveen Asset Management, LLC (“Nuveen Asset Management” or “Sub-Adviser”) as Sub-Adviser to provide discretionary investment advisory services. The following section provides information on the portfolio managers at the Sub-Adviser:
| ITEM 8(a)(1). | PORTFOLIO MANAGER BIOGRAPHIES |
As of the date of filing this report, the following individuals at the Sub-Adviser (the “Portfolio Managers”) have primary responsibility for the day-to-day implementation of the registrant’s investment strategies:
Christopher L. Drahn, CFA, Managing Director at Nuveen Asset Management, manages tax-exempt fixed income portfolios as well as mutual funds and closed-end funds. He began working in the investment industry when he joined the firm in 1980. Chris became a portfolio manager in 1988. He received a B.A. from Wartburg College and an M.B.A. in finance from the University of Minnesota. Chris holds the Chartered Financial Analyst designation and is a member of the CFA Institute, the Minnesota Society of Municipal Analysts and the CFA Society of Minnesota.
Stephen J. Candido, CFA, Managing Director at Nuveen Asset Management, is a portfolio manager for high yield municipal strategies at Nuveen, managing high yield funds and institutional accounts. He also has responsibility for tax-exempt open-end funds and closed-end funds that allocate to both investment grade and high yield municipals. Stephen started working in the investment industry in 1996 when he joined Nuveen in the Unit Trust Division. Prior to his current role, he was a vice president and senior research analyst specializing in high yield sectors including land secured credits, project finance and housing. Stephen was also an assistant vice president for Nuveen’s Global Structured Products team beginning in 2005. He also served as the manager of the Fixed Income Unit Trust Product Management and Pricing Group starting in 2001 and prior to that held positions as an equity research analyst and fixed income pricing analyst. Stephen graduated with a B.S. in Finance from Miami University and an M.B.A. in Finance from the University of Illinois at Chicago. He holds the Chartered Financial Analyst designation and is a member of the CFA Institute and the CFA Society of Chicago.
Michael S. Hamilton, Managing Director, manages tax-exempt fixed income portfolios for Nuveen. He began working in the investment industry when he joined the firm in 1989, as a fixed-income fund manager and trader. He became a portfolio manager in 1992. He received a B.A. from the College of Idaho and an M.B.A. from Western Washington University. He is a member of the CFA Institute and the Portland Society of Financial Analysts.
| ITEM 8(a)(2). | OTHER ACCOUNTS MANAGED BY PORTFOLIO MANAGERS |
Other Accounts Managed. In addition to managing the registrant, the Portfolio Managers are also primarily responsible for the day-to-day portfolio management of the following accounts:
Portfolio Manager | Type of Account Managed | Number of Accounts | Assets* | |||||
Christopher L. Drahn | Registered Investment Company | 10 | $12.57 billion | |||||
| Other Pooled Investment Vehicles | 0 | $0 | ||||||
| Other Accounts | 1 | $152 million | ||||||
Stephen J. Candido | Registered Investment Company | 29 | $43.63 billion | |||||
| Other Pooled Investment Vehicles | 2 | $482 million | ||||||
| Other Accounts | 3 | $268 million | ||||||
Michael S. Hamilton | Registered Investment Company | 18 | $9.37 billion | |||||
| Other Pooled Investment Vehicles | 0 | $0 | ||||||
| Other Accounts | 3 | $189 million | ||||||
| * | Assets are as of October 31, 2023. None of the assets in these accounts are subject to an advisory fee based on performance. |
POTENTIAL MATERIAL CONFLICTS OF INTEREST
Actual or apparent conflicts of interest may arise when a portfolio manager has day-to-day management responsibilities with respect to more than one account. More specifically, portfolio managers who manage multiple accounts are presented a number of potential conflicts, including, among others, those discussed below.
The management of multiple accounts may result in a portfolio manager devoting unequal time and attention to the management of each account. Nuveen Asset Management seeks to manage such competing interests for the time and attention of portfolio managers by having portfolio managers focus on a particular investment discipline. Most accounts managed by a portfolio manager in a particular investment strategy are managed using the same investment models.
If a portfolio manager identifies a limited investment opportunity which may be suitable for more than one account, an account may not be able to take full advantage of that opportunity due to an allocation of filled purchase or sale orders across all eligible accounts. To deal with these situations, Nuveen Asset Management has adopted procedures for allocating limited opportunities across multiple accounts.
With respect to many of its clients’ accounts, Nuveen Asset Management determines which broker to use to execute transaction orders, consistent with its duty to seek best execution of the transaction. However, with respect to certain other accounts, Nuveen Asset Management may be limited by the client with respect to the selection of brokers or may be instructed to direct trades through a particular broker. In these cases, Nuveen Asset Management may place separate, non-simultaneous, transactions for a Fund and other accounts which may temporarily affect the market price of the security or the execution of the transaction, or both, to the detriment of the Fund or the other accounts.
Some clients are subject to different regulations. As a consequence of this difference in regulatory requirements, some clients may not be permitted to engage in all the investment techniques or transactions or to engage in these transactions to the same extent as the other accounts managed by a portfolio manager. Finally, the appearance of a conflict of interest may arise where Nuveen Asset Management has an incentive, such as a performance-based management fee, which relates to the management of some accounts, with respect to which a portfolio manager has day-to-day management responsibilities.
Conflicts of interest may also arise when the Sub-Adviser invests one or more of its client accounts in different or multiple parts of the same issuer’s capital structure, including investments in public versus private securities, debt versus equity, or senior versus junior/subordinated debt, or otherwise where there are different or inconsistent rights or benefits. Decisions or actions such as investing, trading, proxy voting, exercising, waiving or amending rights or covenants, workout activity, or serving on a board, committee or other involvement in governance may result in conflicts of interest between clients holding different securities or investments. Generally, individual portfolio managers will seek to act in a manner that they believe serves the best interest of the accounts they manage. In cases where a portfolio manager or team faces a conflict among its client accounts, it will seek to act in a manner that it believes best reflects its overall fiduciary duty, which may result in relative advantages or disadvantages for particular accounts.
Nuveen Asset Management has adopted certain compliance procedures which are designed to address these types of conflicts common among investment managers. However, there is no guarantee that such procedures will detect each and every situation in which a conflict arises.
Nuveen Asset Management or its affiliates, including TIAA, sponsor an array of financial products for retirement and other investment goals, and provide services worldwide to a diverse customer base. Accordingly, from time to time, a Fund may be restricted from purchasing or selling securities, or from engaging in other investment activities because of regulatory, legal or contractual restrictions that arise due to another client account’s investments and/or the internal policies of Nuveen Asset Management, TIAA or its affiliates designed to comply with such restrictions. As a result, there may be periods, for example, when Nuveen Asset Management will not initiate or recommend certain types of transactions in certain securities or instruments with respect to which investment limits have been reached.
The investment activities of Nuveen Asset Management or its affiliates may also limit the investment strategies and rights of the Funds. For example, in certain circumstances where the Funds invest in securities issued by companies that operate in certain regulated industries, in certain emerging or international markets, or are subject to corporate or regulatory ownership definitions, or invest in certain futures and derivative transactions, there may be limits on the aggregate amount invested by Nuveen Asset Management or its affiliates for the Funds and other client accounts that may not be exceeded without the grant of a license or other regulatory or corporate consent. If certain aggregate ownership thresholds are reached or certain transactions undertaken, the ability of Nuveen Asset Management, on behalf of the Funds or other client accounts, to purchase or dispose of investments or exercise rights or undertake business transactions may be restricted by regulation or otherwise impaired. As a result, Nuveen Asset Management, on behalf of the Funds or other client accounts, may limit purchases, sell existing investments, or otherwise restrict or limit the exercise of rights (including voting rights) when Nuveen Asset Management, in its sole discretion, deems it appropriate in light of potential regulatory or other restrictions on ownership or other consequences resulting from reaching investment thresholds.
| ITEM 8(a)(3). | FUND MANAGER COMPENSATION |
As of the most recently completed fiscal year end, the primary Portfolio Managers’ compensation is as follows:
Portfolio manager compensation consists primarily of base salary and variable components consisting of (i) a cash bonus; (ii) a long-term performance award; and (iii) participation in a profits interest plan.
Base salary. A portfolio manager’s base salary is determined based upon an analysis of the portfolio manager’s general performance, experience and market levels of base pay for such position.
Cash bonus. A portfolio manager is eligible to receive an annual cash bonus that is based on three variables: risk-adjusted investment performance relative to benchmark generally measured over the most recent one, three and five year periods (unless the portfolio manager’s tenure is shorter), ranking versus Morningstar peer funds generally measured over the most recent one, three and five year periods (unless the portfolio manager’s tenure is shorter), and management and peer reviews.
Long-term performance award. A portfolio manager is eligible to receive a long-term performance award that vests after three years. The amount of the award when granted is based on the same factors used in determining the cash bonus. The value of the award at the completion of the three-year vesting period is adjusted based on the risk-adjusted investment performance of Fund(s) managed by the portfolio manager during the vesting period and the performance of the TIAA organization as a whole.
Profits interest plan. Portfolio managers are eligible to receive profits interests in Nuveen Asset Management and its affiliate, Teachers Advisors, LLC, which vest over time and entitle their holders to a percentage of the firms’ annual profits. Profits interests are allocated to each portfolio manager based on such person’s overall contribution to the firms.
There are generally no differences between the methods used to determine compensation with respect to the Fund and the Other Accounts shown in the table above.
| ITEM 8(a)(4). | OWNERSHIP OF NEA SECURITIES AS OF OCTOBER 31, 2023 |
Name of Portfolio Manager | None | $1- $10,000 | $10,001- $50,000 | $50,001- $100,000 | $100,001- $500,000 | $500,001- $1,000,000 | Over $1,000,000 | |||||||
Christopher L. Drahn | X | |||||||||||||
Stephen J. Candido | X | |||||||||||||
Michael S. Hamilton | X |
| ITEM 9. | PURCHASES OF EQUITY SECURITIES BY CLOSED-END MANAGEMENT INVESTMENT COMPANY AND AFFILIATED PURCHASERS. |
Period* | (a) TOTAL NUMBER OF SHARES (OR UNITS) PURCHASED | (b) AVERAGE PRICE PAID PER SHARE (OR UNIT) | (c) TOTAL NUMBER OF SHARES (OR UNITS) PURCHASED AS PART OF PUBLICLY ANNOUNCED PLANS OR PROGRAMS | (d)* MAXIMUM NUMBER (OR APPROXIMATE DOLLAR VALUE) OF SHARES (OR UNITS) THAT MAY YET BE PURCHASED UNDER THE PLANS OR PROGRAMS | ||||||||||||
NOVEMBER 1-30, 2022 | 0 | 0.0000 | 0 | 29,900,000 | ||||||||||||
DECEMBER 1-31, 2022 | 0 | 0.0000 | 0 | 29,900,000 | ||||||||||||
JANUARY 1-31, 2023 | 0 | 0.0000 | 0 | 29,900,000 | ||||||||||||
FEBRUARY 1-28, 2023 | 0 | 0.0000 | 0 | 29,900,000 | ||||||||||||
MARCH 1-31, 2023 | 0 | 0.0000 | 0 | 29,900,000 | ||||||||||||
APRIL 1-30, 2023 | 0 | 0.0000 | 0 | 29,900,000 | ||||||||||||
MAY 1-31, 2023 | 0 | 0.0000 | 0 | 29,900,000 | ||||||||||||
JUNE 1-30, 2023 | 0 | 0.0000 | 0 | 29,900,000 | ||||||||||||
JULY 1-31, 2023 | 0 | 0.0000 | 0 | 29,900,000 | ||||||||||||
AUGUST 1-31, 2023 | 0 | 0.0000 | 0 | 29,900,000 | ||||||||||||
SEPTEMBER 1-30, 2023 | 45,000 | 9.8767 | 45,000 | 29,855,000 | ||||||||||||
OCTOBER 1-31, 2023 | 0 | 0.0000 | 0 | 29,855,000 | ||||||||||||
TOTAL | 45,000 | |||||||||||||||
| * | The registrant’s repurchase program, for the repurchase of 29,900,000 shares, was authorized on August 3rd, 2022. The program was reauthorized for a maximum repurchase amount of 29,900,000 shares on February 14th, 2023. Any repurchases made by the registrant pursuant to the program were made through open-market transactions. |
| ITEM 10. | SUBMISSION OF MATTERS TO A VOTE OF SECURITY HOLDERS. |
There have been no material changes to the procedures by which shareholders may recommend nominees to the registrant’s Board implemented after the registrant last provided disclosure in response to this Item.
| ITEM 11. | CONTROLS AND PROCEDURES. |
| (a) | The registrant’s principal executive and principal financial officers, or persons performing similar functions, have concluded that the registrant’s disclosure controls and procedures (as defined in Rule 30a-3(c) under the Investment Company Act of 1940, as amended (the “1940 Act”) (17 CFR 270.30a-3(c))) are effective, as of a date within 90 days of the filing date of this report that includes the disclosure required by this paragraph, based on their evaluation of the controls and procedures required by Rule 30a-3(b) under the 1940 Act (17 CFR 270.30a-3(b)) and Rules 13a-15(b) or 15d-15(b) under the Securities Exchange Act of 1934, as amended (the “Exchange Act”) (17 CFR 240.13a-15(b) or 240.15d-15(b)). |
| (b) | There were no changes in the registrant’s internal control over financial reporting (as defined in Rule 30a-3(d) under the 1940 Act (17 CFR 270.30a-3(d)) that occurred during the period covered by this report that has materially affected, or is reasonably likely to materially affect, the registrant’s internal control over financial reporting. |
| ITEM 12. | DISCLOSURE OF SECURITIES LENDING ACTIVITIES FOR CLOSED-END MANAGEMENT INVESTMENT COMPANIES. |
Not applicable.
| ITEM 13. | EXHIBITS. |
File the exhibits listed below as part of this Form.
(a)(1) Any code of ethics, or amendment thereto, that is the subject of the disclosure required by Item 2, to the extent that the registrant intends to satisfy the Item 2 requirements through filing of an exhibit: Not applicable because the code is posted on registrant’s website at www.nuveen.com/fund-governance and there were no amendments during the period covered by this report. (To view the code, click on Code of Conduct.)
(a)(3) Any written solicitation to purchase securities under Rule 23c-1 under the 1940 Act (17 CFR 270.23c-1) sent or given during the period covered by the report by or on behalf of the registrant to 10 or more persons. Not applicable.
(a)(4) Change in the registrant’s independent public accountant. Not applicable.
(c)(4) Consent of Independent Registered Public Accounting Firm. EX99.IND PUB ACCT attached hereto.
SIGNATURES
Pursuant to the requirements of the Securities Exchange Act of 1934 and the Investment Company Act of 1940, the registrant has duly caused this report to be signed on its behalf by the undersigned, thereunto duly authorized.
(Registrant) Nuveen AMT-Free Quality Municipal Income Fund
| By (Signature and Title) | /s/ David J. Lamb | |
| David J. Lamb | ||
| Chief Administrative Officer |
Date: January 5, 2024
Pursuant to the requirements of the Securities Exchange Act of 1934 and the Investment Company Act of 1940, this report has been signed below by the following persons on behalf of the registrant and in the capacities and on the dates indicated.
| By (Signature and Title) | /s/ David J. Lamb | |
| David J. Lamb | ||
| Chief Administrative Officer | ||
| (principal executive officer) |
Date: January 5, 2024
| By (Signature and Title) | /s/ E. Scott Wickerham | |
| E. Scott Wickerham | ||
| Vice President and Funds Controller | ||
| (principal financial officer) |
Date: January 5, 2024