Washington, D.C. 20549
Kevin J. McCarthy
Form N-CSR is to be used by management investment companies to file reports with the Commission not later than 10 days after the transmission to stockholders of any report that is required to be transmitted to stockholders under Rule 30e-1 under the Investment Company Act of 1940 (17 CFR 270.30e-1). The Commission may use the information provided on Form N-CSR in its regulatory, disclosure review, inspection, and policymaking roles.
A registrant is required to disclose the information specified by Form N-CSR, and the Commission will make this information public. A registrant is not required to respond to the collection of information contained in Form N-CSR unless the Form displays a currently valid Office of Management and Budget (“OMB”) control number. Please direct comments concerning the accuracy of the information collection burden estimate and any suggestions for reducing the burden to Secretary, Securities and Exchange Commission, 450 Fifth Street, NW, Washington, DC 20549-0609. The OMB has reviewed this collection of information under the clearance requirements of 44 U.S.C. ss. 3507.
ITEM 1. REPORTS TO STOCKHOLDERS.
LIFE IS COMPLEX.
Nuveen makes things e-simple.
It only takes a minute to sign up for e-Reports. Once enrolled, you’ll receive an e-mail as soon as your Nuveen Fund information is ready. No more waiting for delivery by regular mail. Just click on the link within the e-mail to see the report and save it on your computer if you wish.
Free e-Reports right to your e-mail!
www.investordelivery.com
If you receive your Nuveen Fund distributions and statements from your financial advisor or brokerage account.
OR
www.nuveen.com/accountaccess
If you receive your Nuveen Fund distributions and statements directly from Nuveen.
Table of Contents
| Chairman’s Letter to Shareholders | 4 |
| | |
| Portfolio Manager’s Comments | 5 |
| | |
| Fund Leverage and Other Information | 12 |
| | |
| Common Share Dividend and Price Information | 15 |
| | |
| Performance Overviews | 17 |
| | |
| Shareholder Meeting Report | 25 |
| | |
| Report of Independent Registered Public Accounting Firm | 31 |
| | |
| Portfolios of Investments | 32 |
| | |
| Statement of Assets and Liabilities | 76 |
| | |
| Statement of Operations | 78 |
| | |
| Statement of Changes in Net Assets | 80 |
| | |
| Statement of Cash Flows | 83 |
| | |
| Financial Highlights | 86 |
| | |
| Notes to Financial Statements | 98 |
| | |
| Board Members and Officers | 117 |
| | |
| Reinvest Automatically, Easily and Conveniently | 122 |
| | |
| Glossary of Terms Used in this Report | 124 |
| | |
| Additional Fund Information | 127 |
Chairman’s
Letter to Shareholders
Dear Shareholders,
In recent months the positive atmosphere in financial markets has reflected efforts by central banks in the US and Europe to provide liquidity to the financial system and keep interest rates low. At the same time, future economic growth in these countries still faces serious headwinds in the form of high energy prices, uncertainties about potential political leadership changes and increasing pressure to reduce government spending regardless of its impact on the economy. Together with the continuing political tensions in the Middle East, investors have many reasons to remain cautious.
Though progress has been painfully slow, officials in Europe have taken important steps to address critical issues. The European Central Bank has provided vital liquidity to the banking system. Similarly, officials in the Euro area finally agreed to an enhanced “firewall” of funding to deal with financial crises in member countries. These steps, in addition to the completion of another round of financing for Greece, have eased credit conditions across the Continent. Several very significant challenges remain with the potential to derail the recent progress but European leaders have demonstrated political will and persistence in dealing with their problems.
In the US, strong corporate earnings and continued progress on job creation have contributed to a rebound in the equity market and many of the major stock market indexes are approaching their levels before the financial crisis. The Fed’s commitment to an extended period of low interest rates is promoting economic growth, which remains moderate but steady and raises concerns about the future course of long term rates once the program ends. Pre-election maneuvering has added to the highly partisan atmosphere in the Congress. The end of the Bush-era tax cuts and implementation of the spending restrictions of the Budget Control act of 2011, both scheduled to take place at year-end loom closer with little progress being made to deal with them.
During the last year investors have experienced a sharp decline and a strong recovery in the equity markets. Experienced investment teams keep their eye on a longer time horizon and use their practiced investment disciplines to negotiate through market peaks and valleys to achieve long term goals for investors. Monitoring this process is an important consideration for the Fund Board as it oversees your Nuveen funds on your behalf.
As always, I encourage you to contact your financial consultant if you have any questions about your investment in a Nuveen Fund. On behalf of the other members of your Fund Board, we look forward to continuing to earn your trust in the months and years ahead.
Sincerely,
Robert P. Bremner
Chairman of the Board
April 20, 2012
Portfolio Manager’s Comments
Nuveen Insured California Premium Income Municipal Fund, Inc. (NPC)
Nuveen Insured California Premium Income Municipal Fund 2, Inc. (NCL)
Nuveen California Premium Income Municipal Fund (NCU)
Nuveen California Dividend Advantage Municipal Fund (NAC)
Nuveen California Dividend Advantage Municipal Fund 2 (NVX)
Nuveen California Dividend Advantage Municipal Fund 3 (NZH)
Nuveen Insured California Dividend Advantage Municipal Fund (NKL)
Nuveen Insured California Tax-Free Advantage Municipal Fund (NKX)
Portfolio manager Scott Romans reviews economic and municipal market conditions at both the national and state levels, key investment strategies and the twelve-month performance of the Nuveen California Funds listed above. Scott, who joined Nuveen in 2000, has managed NCU, NAC, NVX, NZH, NKL and NKX since 2003 and NPC and NCL since 2005.
What factors affected the U.S. economic and municipal market environments during the twelve-month reporting period ended February 29, 2012?
During this period, the U.S. economy’s progress toward recovery from recession remained modest. The Federal Reserve (Fed) maintained its efforts to improve the overall economic environment by continuing to hold the benchmark fed funds rate at the record low level of zero to 0.25% that it had established in December 2008. At its March 2012 meeting (shortly after the end of this reporting period), the central bank reaffirmed its opinion that economic conditions would likely warrant keeping this rate at “exceptionally low levels” at least through late 2014. The Fed also stated that it would continue its program to extend the average maturity of its holdings of U.S. Treasury securities by purchasing $400 billion of these securities with maturities of six to thirty years and selling an equal amount of U.S. Treasury securities with maturities of three years or less. The goals of this program, which the Fed expects to complete by the end of June 2012, are to lower longer-term interest rates, support a stronger economic recovery, and help ensure that inflation remains at levels consistent with the Fed’s mandates of maximum employment and price stability.
In the fourth quarter of 2011, the U.S. economy, as measured by the U.S. gross domestic product (GDP), grew at an annualized rate of 3.0%, the best growth number since the end of second quarter 2010 and the tenth consecutive quarter of positive growth. The Consumer Price Index (CPI) rose 2.9% year-over-year as of February 2012, while the core CPI (which excludes food and energy) increased 2.2% during the same period, edging above the Fed’s unofficial objective of 2.0% or lower for this inflation measure. Labor market conditions have shown some signs of improvement, as national unemployment stood at 8.3% in February 2012, the lowest level in three years, down from 9.0% in February 2011. The housing market continued to be the major weak spot in the economy. For the twelve months ended January 2012 (most recent data available at the time this report was prepared), the average home price in the Standard & Poor’s (S&P)/Case-Shiller Index of 20 major metropolitan areas lost 3.8%, as housing prices hit their lowest levels since early 2003. In addition, the U.S. economic picture continued to be clouded by concerns about the European debt crisis and efforts to reduce the federal deficit.
Certain statements in this report are forward-looking statements. Discussions of specific investments are for illustration only and are not intended as recommendations of individual investments. The forward-looking statements and other views expressed herein are those of the portfolio manager as of the date of this report. Actual future results or occurrences may differ significantly from those anticipated in any forward-looking statements, and the views expressed herein are subject to change at any time, due to numerous market and other factors. The Funds disclaim any obligation to update publicly or revise any forward-looking statements or views expressed herein.
Ratings shown are the highest rating given by one of the following national rating agencies: Standard & Poor’s Group, Moody’s Investors Service, Inc. or Fitch, Inc. Credit ratings are subject to change. AAA, AA, A and BBB are investment grade ratings; BB, B, CCC, CC, C and D are below investment grade ratings. Certain bonds backed by U.S. Government or agency securities are regarded as having an implied rating equal to the rating of such securities. Holdings designated N/R are not rated by a national rating agency.
Municipal bond prices generally rallied over this period. Historically light issuance of new tax-exempt bonds served as a key driver of performance, as tight supply and strong demand combined to create favorable market conditions for municipal bonds. Concurrent with rising prices, yields declined across most maturities. The depressed level of municipal bond issuance was due in part to the continued impact of the taxable Build America Bonds (BAB) program. Even though the BAB program expired at the end of 2010, issuers had made extensive use of its favorable terms to issue almost $190 billion in taxable BAB bonds during 2009 and 2010, representing approximately 25% of all municipal issuance during that period. Some borrowers accelerated issuance in order to take advantage of the program before its termination, fulfilling their capital program borrowing needs well into 2011 and 2012. This reduced the need for many borrowers to come to market with new tax-exempt issues during this period. The low level of municipal issuance during this period also reflected the current political distaste for additional borrowing by state and local governments and the prevalent atmosphere of municipal budget austerity.
Over the twelve months ended February 29, 2012, municipal bond issuance nationwide totaled $307.4 billion, a decrease of 24% compared with issuance during the twelvemonth period ended February 28, 2011. During this period, demand for municipal bonds remained very strong, especially from individual investors.
How were the economic and market environments in California during this period?
The California economy has shown signs of gaining momentum, with job growth rebounding as increased demand for internet-based services and mobile device applications led to strengthening of the technology and other service sectors. This, in turn, produced improvement in the state’s unemployment rate. As of February 2012, California’s unemployment rate was 10.9%, its lowest level since April 2009, down from 12.0% in February 2011. However, housing, the primary driver of the state’s most recent economic decline, remains a drag on the California economy, with foreclosures continuing to put downward pressure on prices. According to the S&P/Case-Shiller Index, home prices in San Diego, Los Angeles and San Francisco fell 5.3%, 5.4% and 5.9%, respectively, over the twelve months ended January 2012 (the most recent data available at the time this report was prepared). These rates compared with an average decline of 3.8% nationally for the same period. Statewide, home prices in California have lost almost 60% of their value since the peak in 2006. Overall, budget problems posed the largest threat to the state’s economic outlook over the near term, as California continued to be burdened by persistent deficits and spending that outweighed the state’s ability to generate revenues. However, the $120.1 billion act remained structurally unbalanced, relying on revenue assumptions that, if not met, would trigger additional expenditure cuts. When those revenue assumptions were not realized, the state implemented almost $1 billion in trigger cuts effective January 1, 2012, mainly affecting state universities, community colleges and human services. The $137.3 billion budget proposal for fiscal 2013 closes an estimated $9.2 billion gap and assumes additional revenues generated by a voter-approved, five-year temporary tax increase. The budget also calls for spending reductions mainly in the areas of welfare and child care for the poor. As of February 2012, California maintained credit ratings on its general obligation (GO) debt of A1, A-, and A-from Moody’s Investors Service, S&P and Fitch, respectively. For the twelve months ended February 29, 2012, municipal issuance in California totaled $38.5 billion, a
decrease of 33% from the previous twelve months. For this period, California was the second largest state issuer in the nation (behind New York), representing approximately 12.5% of total issuance nationwide.
What key strategies were used to manage the California Funds during this reporting period?
As previously discussed, municipal bond prices generally rallied nationally during this period, as the supply of tax-exempt bonds remained tight and yields continued to be relatively low. In this environment, we continued to take a bottom-up approach to discovering sectors that appeared undervalued as well as individual credits that had the potential to perform well over the long term and helped us keep our Funds fully invested.
Much of our investment activity during this period was opportunistic, with purchases driven by the timing of cash flows from called or maturing bonds. The Funds took advantage of attractive opportunities to add to their holdings in health care as well as California state GO bonds when they came to market in the fall of 2011. In addition, based on recent tobacco consumption data, NCU, NAC, NVX and NZH swapped some of their convertible zero-coupon tobacco holdings for tobacco bonds with better downside profiles in terms of credit outlook. These relative value swaps also benefited the Funds by maintaining yields and recognizing losses for tax purposes. (The insured Funds did not participate in the tobacco swaps because these four Funds cannot purchase sub-investment grade bonds.)
We also continued to actively add exposure to redevelopment agency (RDA) bonds, used to fund programs to improve deteriorated, blighted and economically depressed areas in California. In June 2011, two state bills amending the law that created RDAs were approved as part of cost-saving measures to close gaps in the California state budget. Assembly Bill (AB) 26 provided for the dissolution of all RDAs, while AB 27 would allow municipalities to keep their RDAs by committing to substantial community payments to the state. A lawsuit challenging the constitutionality of both bills was filed by an RDA lobbying group in July 2011. In late December 2011, the California Supreme Court ruled that AB 26 was constitutional and ordered the dissolution of all 400 RDAs in the state by February 1, 2012, creating successor agencies and oversight boards to manage obligations (e.g., contracts, bonds, leases) that were in place prior to the dissolution and take title to the RDAs’ housing and other assets. However, the court struck down AB 27, concluding that the provisions that required community payments were not voluntary, and violated the state constitution. During this period, the uncertainty surrounding the fate of the state’s RDAs caused spreads on RDA bonds to widen substantially and prompted RDAs to issue their remaining capacity of bonds. This resulted in heavy issuance of RDA bonds that came to market at attractive prices with higher coupons and very attractive structures, including 10-year call provisions. Consequently, we were able to add some exceptional bonds to our portfolios, purchasing new RDA bonds in the primary market during the first part of this period and buying additional RDA bonds, some of which were insured credits issued prior to 2008, in the secondary market during the last part of this period.
For the Funds with an insured mandate (NPC, NCL, NKL and NKX), finding appropriate insured municipal bonds, especially new insured issues, remained a challenge due to the continued severe decline in insured issuance. Over the past few years, most municipal bond insurers had their credit ratings downgraded, and only one insurer currently insures new municipal bonds. As a result, the supply of insured municipal securities has decreased dramatically. In 2011, issuance of new insured paper accounted for just over 5% of total municipal issuance (compared with a historical levels of 50%), down 43.5% from 2010. Even though NPC, NCL, NKL and NKX may now invest up to 20% of their net assets in uninsured investment-grade credits rated BBB- or higher, the combination of tight municipal supply, little insured issuance and relatively lower yields meant few attractive opportunities for these Funds during this period.
Cash for new purchases during this period was generated primarily by the proceeds from called and maturing bonds. An elevated number of bond calls provided a meaningful source of liquidity, which drove much of our activity as we worked to redeploy the proceeds to keep the Funds fully invested. In addition, we sold selected bonds with very short effective maturities on the occasions when we needed additional cash to take advantage of attractive opportunities.
As of February 29, 2012, all of these Funds continued to use inverse floating rate securities. We employ inverse floaters for a variety of reasons, including duration management, income enhancement and total return enhancement. As part of our duration management strategies, NCL also used forward interest rate swaps to reduce price volatility risk to movements in U.S. interest rates relative to the Fund’s benchmarks. The forward interest rate swaps were removed from NCL during the first half of this period as the Fund’s duration approached our targeted range. Prior to their removal, these derivatives functioned as intended.
How did the Funds perform during the twelve-month period ended February 29, 2012?
Individual results for these Nuveen California Funds, as well as relevant index and peer group information, are presented in the accompanying table.
Average Annual Total Returns on Common Share Net Asset Value
For periods ended 2/29/12
| | 1-Year | 5-Year | 10-Year |
| Uninsured Funds | | | |
| NCU | 25.65% | 6.45% | 6.66% |
| NAC | 25.30% | 5.66% | 6.53% |
| NVX | 22.90% | 6.25% | 6.69% |
| NZH | 22.89% | 4.66% | 6.06% |
| | | | |
| Standard & Poor’s (S&P) California Municipal Bond Index* | 14.84% | 5.17% | 5.38% |
| Standard & Poor’s (S&P) National Municipal Bond Index* | 12.87% | 5.19% | 5.36% |
| Lipper California Municipal Debt Funds Classification Average* | 25.87% | 4.71% | 6.17% |
| | Past performance is not predictive of future results. Current performance may be higher or lower than the data shown. Returns do not reflect the deduction of taxes that shareholders may have to pay on Fund distributions or upon the sale of Fund shares. |
| | |
| | For additional information, see the Performance Overview page for your Fund in this report. |
| | |
| * | Refer to Glossary of Terms Used in This Report for definitions. |
| | 1-Year | 5-Year | 10-Year |
| Insured Funds | | | |
| NPC | 24.47% | 6.31% | 6.22% |
| NCL | 25.33% | 6.30% | 6.24% |
| NKL | 24.87% | 6.59% | N/A |
| NKX | 21.95% | 5.18% | N/A |
| | | | |
| Standard & Poor’s (S&P) California Municipal Bond Index* | 14.84% | 5.17% | 5.38% |
| Standard & Poor’s (S&P) Insured National Municipal Bond Index* | 13.78% | 5.24% | 5.41% |
| Lipper Single-State Insured Municipal Debt Funds Classification Average* | 21.81% | 5.94% | 6.06% |
For the twelve months ended February 29, 2012, the total returns on common share net asset value (NAV) for all of these Funds exceeded the return for the Standard & Poor’s (S&P) California Municipal Bond Index. The uninsured Funds also outperformed the S&P National Municipal Bond Index, while the insured Funds outperformed the Standard & Poor’s (S&P) Insured National Municipal Bond Index. For this same period, NCU and NAC trailed the return for the Lipper California Municipal Debt Funds Classification Average by a narrow margin, while NVX and NZH also lagged the Lipper group. All four of the insured Funds exceeded the Lipper Single-State Insured Municipal Debt Funds Classification Average return.
Key management factors that influenced the Funds’ returns during this period included duration and yield curve positioning, credit exposure and sector allocation. The use of leverage also was an important positive factor affecting the Funds’ performance. Leverage is discussed in more detail later in this report.
During this period, municipal bonds with longer maturities generally outperformed those with shorter maturities. Overall, credits at the longest end of the municipal yield curve posted the strongest returns, while bonds at the shortest end produced the weakest results. The Funds’ duration and yield curve positionings were the most important determinants of performance during this period. On the whole, NAC and NCL, which had the longest durations among the uninsured and insured Funds, respectively, were the most advantageously positioned in terms of duration and yield curve exposure. The performance of the remaining six Funds benefited in proportion to their allocations along the longer end of the yield curve.
Credit exposure also played a role in performance during these twelve months, as lower-rated bonds, especially those rated BBB, generally outperformed higher-quality bonds rated AAA and AA. This outperformance was due in part to the greater demand for lower-rated bonds as investors looked for investments offering higher yields. All four of the uninsured Funds benefited from their credit exposure during this period. However, in accordance with their investment policies, the insured Funds have not had the same opportunities to invest in lower-rated credits until recently, and they tended to be underweighted in bonds rated BBB and overweighted in bonds rated AAA and AA. This combination detracted from their performance for the period.
Holdings that generally made positive contributions to the Funds’ returns during this period included zero coupon bonds, health care, industrial development revenue (IDR), transportation and special tax credits. Leasing and education bonds also outpaced the general municipal market for the period, while water and sewer credits just edged past the municipal market average. All of the uninsured Funds were overweighted in health care, which boosted their performance, as did their overall sector allocations.
In contrast, pre-refunded bonds, which are often backed by U.S. Treasury securities, were the poorest performing market segment during this period. The underperformance of these bonds can be attributed primarily to their shorter effective maturities and higher credit quality. As of February 29, 2012, NPC had the heaviest weighting in pre-refunded bonds among all eight of these Funds, which hampered its performance, while NCL had the smallest allocation to these bonds. Among the uninsured Funds, NVX and NZH had heavier weightings in pre-refunded bonds than NCU and NAC. The electric utilities, housing and resource recovery sectors and California state GOs also lagged the performance of the general municipal market for this period. All of these Funds were underweighted to varying degrees in the tax-supported sector, especially California state GOs, relative to the California market, which lessened the negative impact of these holdings. This underweighting was due to the fact that California state GOs comprise such a large portion of the tax-supported sector in California that it is impossible to match the market weighting in our portfolios.
In addition, NCU and NKX each held individual credits that impacted their performance during this period. In NCU, the Fund’s holdings of Downey Regional Medical Center began the period as a distressed credit. Following an acquisition near the end of the period, the hospital bonds were refunded at par. NCU held a significant position in these credits, and their recovery benefited its performance. In NKX, the Fund’s holdings of lease revenue bonds issued by the Stockton Public Finance Authority had a negative impact on the Fund’s performance after news of the city of Stockton’s financial problems became public and the city’s credit ratings were cut. Stockton has now entered a new state-mandated mediation program where municipalities work with creditors to address fiscal challenges rather than declaring bankruptcy. It is also important to note that the Stockton lease revenue bonds are insured by National Public Finance Guarantee, which has stated that it will make payments on the bonds if there is any interruption in payments from the issuer.
APPROVED FUND MERGERS
After the close of this reporting period, the Funds’ shareholders approved a series of reorganizations and changes to certain investment policies for the four Nuveen California insured closed-end Funds.
The approved changes to each Fund’s investment policies were intend to increase the Funds’ flexibility regarding the types of securities available for investment.
The investment policy changes are summarized as follows:
| • | Each Fund eliminated the investment policy requiring it, under normal circumstances, to invest at least 80 percent of its managed assets in municipal securities that are covered by insurance which currently guarantees the timely payment of principal and interest. |
| | |
| • | Each Fund adopted a new investment policy requiring it, under normal circumstances, to invest at least 80 percent of its managed assets in municipal securities that pay interest exempt from federal and California income tax. |
| • | Each Fund eliminated the old fundamental loan policy and adopted a new fundamental loan policy, which states that each Fund may not make loans, except as permitted by the Investment Company Act of 1940, as amended, and exemptive orders granted under the Investment Company Act of 1940, as amended. |
| | |
| • | Each Fund will continue to invest substantially all (at least 80 percent) of its managed assets in investment grade quality municipal securities. |
| | |
| • | Nuveen Insured California Tax-Free Advantage Municipal Fund (NKX) will continue its policy of investing, under normal circumstances, at least 80% of its assets in AMT-free municipal securities. |
In addition shareholders approved the reorganization of the Funds as follows:
| | Acquired Funds | Acquiring Fund |
| | | |
| • | Nuveen Insured California Premium | |
| | Income Municipal Fund, Inc. (NPC) | |
| • | Nuveen Insured California Premium | Nuveen California AMT Free |
| | Income Municipal Fund 2, Inc. (NCL) | Municipal Income Fund (NKX) |
| • | Nuveen Insured California Dividend | |
| | Advantage Municipal Fund (NKL) | |
The reorganizations will be consummated before the opening of business on May 7, 2012. Upon the closing of the reorganizations, the Acquired Funds will transfer substantially all of their assets to the Acquiring Fund in exchange for common and preferred shares of the Acquiring Fund, and the assumption by the Acquiring Fund of the liabilities of the Acquired Funds. The Acquired Funds will then be liquidated, dissolved and terminated in accordance with their Declaration of Trust. The Acquiring Fund will change its name to Nuveen California AMT Free Municipal Income Fund (NKX).
Shareholders of the Acquired Funds will become shareholders of the Acquiring Fund. Holders of common shares will receive newly issued common shares of the Acquiring Fund, the aggregate net asset value of which will be equal to the aggregate net asset value of the common shares of the Acquired Funds held immediately prior to the reorganizations (including for this purpose fractional Acquiring Fund shares to which shareholders would be entitled). Fractional shares will be sold on the open market and shareholders will receive cash in lieu of such fractional shares. Holders of VRDP Shares of each Acquired Fund will receive on a one-for-one basis newly issued VRDP Shares of the Acquiring Fund, in exchange for VRDP Shares of the Acquired Fund held immediately prior to the reorganization, with such new Acquiring Fund VRDP Shares having substantially the same terms as the exchanged VRDP Shares of the Acquired Funds.
Fund Leverage and
Other Information
IMPACT OF THE FUNDS’ LEVERAGE STRATEGIES ON PERFORMANCE
One important factor impacting the return of the Funds relative to their benchmarks was the Funds’ use of leverage. The Funds use leverage because their managers believe that, over time, leveraging provides opportunities for additional income and total return for common shareholders. However, use of leverage also can expose common shareholders to additional volatility. For example, as the prices of securities held by a Fund decline, the negative impact of these valuation changes on common share net asset value and common shareholder total return is magnified by the use of leverage. Conversely, leverage may enhance common share returns during periods when the prices of securities held by a Fund generally are rising. Leverage had a positive impact on the performance of the Funds over this reporting period.
THE FUNDS’ REGULATORY LEVERAGE
As of February 29, 2012, each of the Funds has redeemed all of their outstanding auction rate preferred shares (ARPS) at liquidation value.
As of February 29, 2012, the Funds have issued and outstanding MuniFund Term Preferred (MTP) Shares and Variable Rate Demand Preferred (VRDP) Shares as shown in the accompanying tables.
MTP Shares
| | | | | | MTP Shares Issued | | | Annual | | NYSE | |
| Fund | | | Series | | at Liquidation Value | | | Interest Rate | | Ticker | |
| NCU | | | 2015 | | $ | 35,250,000 | | | 2.00 | % | | NCU PrC | |
| NVX | | | 2014 | | $ | 42,846,300 | | | 2.35 | % | | NVX PrA | |
| NVX | | | 2015 | | $ | 55,000,000 | | | 2.05 | % | | NVX PrC | |
| NZH | | | 2014 | | $ | 27,000,000 | | | 2.35 | % | | NZH PrA | |
| NZH | | | 2014-1 | | $ | 46,294,500 | | | 2.25 | % | | NZH PrB | |
| NZH | | | 2015 | | $ | 86,250,000 | | | 2.95 | % | | NZH PrC | |
VRDP Shares
| | VRDP Shares Issued |
| Fund | at Liquidation Value |
| NPC | | $ | 42,700,000 |
| NCL | | $ | 74,000,000 |
| NAC | | $ | 136,200,000 |
| NKL | | $ | 104,400,000 |
| NKX | | $ | 35,500,000 |
(Refer to Notes to Financial Statements, Footnote 1 – General Information and Significant Accounting Policies and Footnote 4 – Fund Shares for further details on MTP and VRDP Shares.)
As of October 5, 2011, all 84 of the Nuveen closed-end municipal funds that had issued ARPS, approximately $11.0 billion, have redeemed at liquidation value all of these shares.
For up-to-date information, please visit the Nuveen CEF Auction Rate Preferred Resource Center at: http://www.nuveen.com/arps.
UPDATE ON LITIGATION REGARDING THE FUNDS’ REDEMPTION OF AUCTION RATE PREFERRED SHARES
During 2011, certain funds (including NKX) were named in a consolidated complaint as nominal defendants in a putative shareholder derivative action captioned Martin Safier, et al. v. Nuveen Asset Management, et al. that was filed in the Circuit Court of Cook County, Illinois, Chancery Division (the “Cook County Chancery Court”) on February 18, 2011 (the “Complaint”). The Complaint, filed on behalf of purported holders of each fund’s common shares, also named Nuveen Fund Advisors, Inc. as a defendant, together with current and former Officers and interested Directors/Trustees of each of the funds (together with the nominal defendants, collectively, the “Defendants”). The Complaint contained allegations regarding breaches of fiduciary duties in connection with the redemption of auction rate preferred shares issued by the funds. The Defendants filed a motion to dismiss the suit and on December 16, 2011, the court granted that motion dismissing the Complaint. The plaintiffs failed to file an appeal of the court’s decision within the required time period, resulting in the final disposition of the suit.
RISK CONSIDERATIONS
Fund shares are not guaranteed or endorsed by any bank or other insured depository institution, and are not federally insured by the Federal Deposit Insurance Corporation. Past performance is no guarantee of future results. Fund common shares are subject to a variety of risks, including:
Investment and Market Risk. An investment in common shares is subject to investment risk, including the possible loss of the entire principal amount that you invest. Your investment in common shares represents an indirect investment in the municipal securities owned by the Fund, which generally trade in the over-the-counter markets. Your common shares at any point in time may be worth less than your original investment, even after taking into account the reinvestment of Fund dividends and distributions.
Price Risk. Shares of closed-end investment companies like these Funds frequently trade at a discount to their NAV. Your common shares at any point in time may be worth less than your original investment, even after taking into account the reinvestment of Fund dividends and distributions.
Leverage Risk. Each Fund’s use of leverage creates the possibility of higher volatility for the Fund’s per share NAV, market price, distributions and returns. There is no assurance that a Fund’s leveraging strategy will be successful.
Tax Risk. The tax treatment of Fund distributions may be affected by new IRS interpretations of the Internal Revenue Code and future changes in tax laws and regulations.
Issuer Credit Risk. This is the risk that a security in a Fund’s portfolio will fail to make dividend or interest payments when due.
Interest Rate Risk. Fixed-income securities such as bonds, preferred, convertible and other debt securities will decline in value if market interest rates rise.
Reinvestment Risk. If market interest rates decline, income earned from a Fund’s portfolio may be reinvested at rates below that of the original bond that generated the income.
Call Risk or Prepayment Risk. Issuers may exercise their option to prepay principal earlier than scheduled, forcing a Fund to reinvest in lower-yielding securities.
Inverse Floater Risk. The Funds invest in inverse floaters. Due to their leveraged nature, these investments can greatly increase a Fund’s exposure to interest rate risk and credit risk. In addition, investments in inverse floaters involve the risk that the Fund could lose more than its original principal investment.
Common Share Dividend
and Price Information
DISTRIBUTION INFORMATION
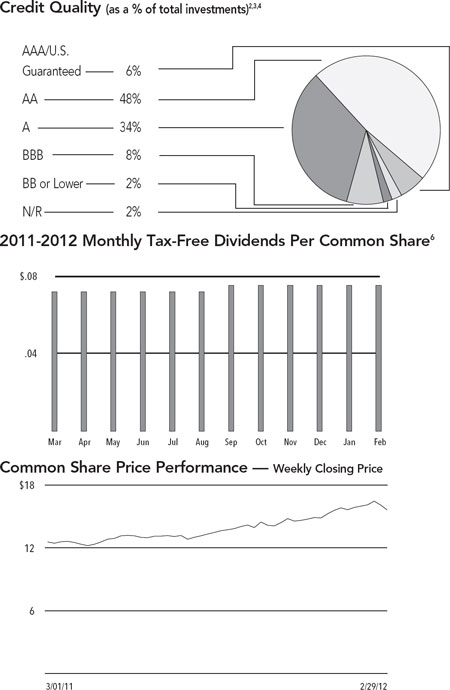
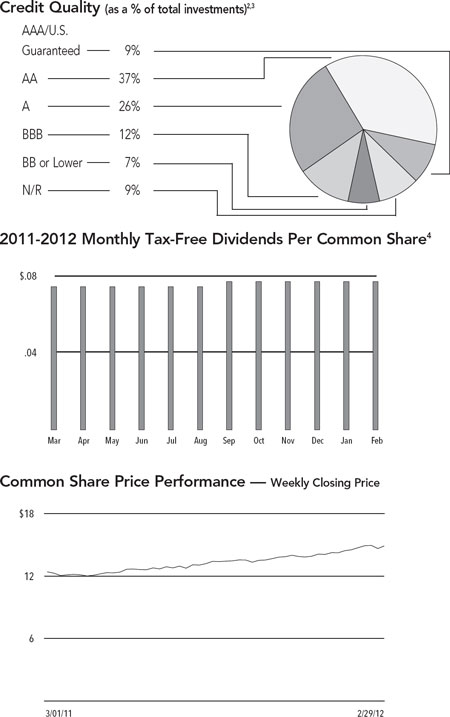
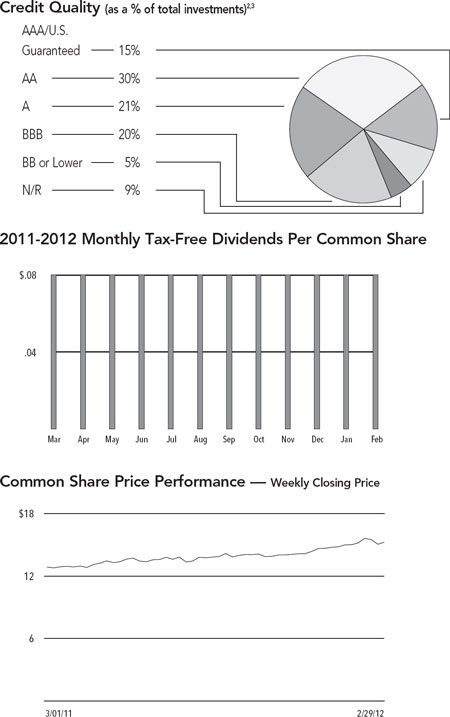
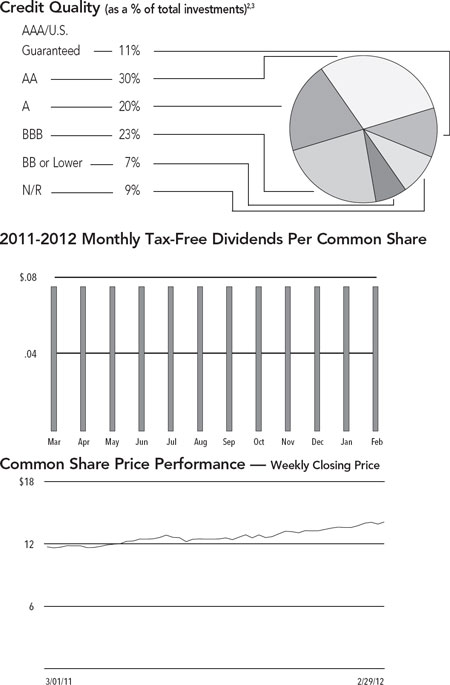
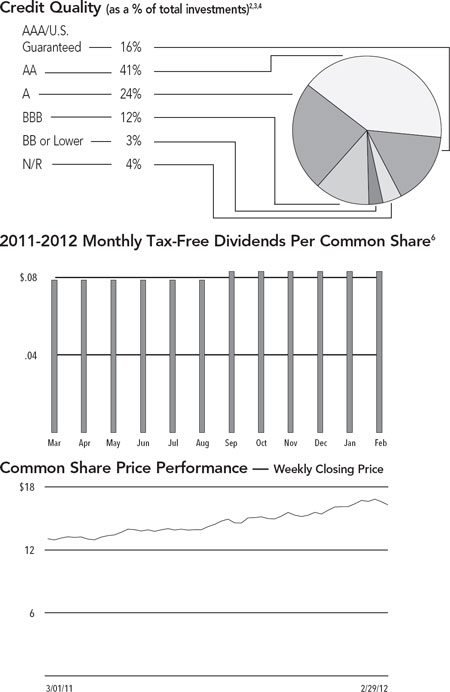
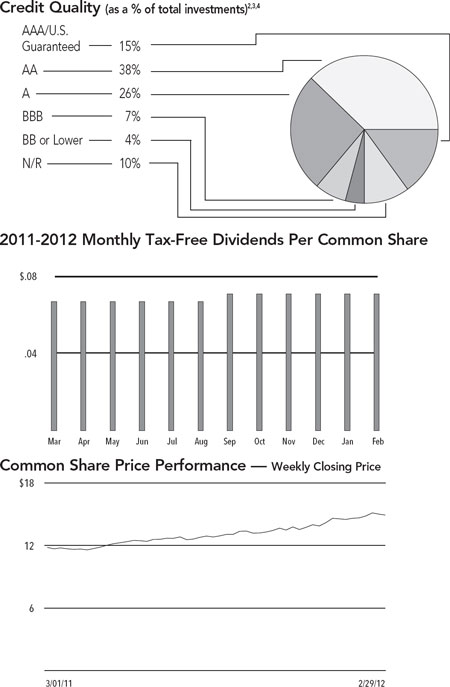
During the twelve-month reporting period ended February 29, 2012, NCL, NAC, NKL and NKX each had one monthly dividend increase, while the dividends of NPC, NCU, NVX and NZH remained stable throughout the reporting period.
Due to normal portfolio activity, common shareholders of the following Funds received capital gains and/or net ordinary income distributions in December 2011 as follows:
| Short-Term Capital Gains | |
| Long-Term Capital Gains | and/or Ordinary Income | |
| Fund | (per share) | | (per share) | |
| NPC | | $ | 0.0780 | | $ | 0.0240 | |
| NCL | | | — | | $ | 0.0118 | |
| NAC | | | — | | $ | 0.0045 | |
| NKL | | | — | | $ | 0.0053 | |
All of the Funds in this report seek to pay stable dividends at rates that reflect each Fund’s past results and projected future performance. During certain periods, each Fund may pay dividends at a rate that may be more or less than the amount of net investment income actually earned by the Fund during the period. If a Fund has cumulatively earned more than it has paid in dividends, it holds the excess in reserve as undistributed net investment income (UNII) as part of the Fund’s NAV. Conversely, if a Fund has cumulatively paid dividends in excess of its earnings, the excess constitutes negative UNII that is likewise reflected in the Fund’s NAV. Each Fund will, over time, pay all of its net investment income as dividends to shareholders. As of February 29, 2012, all of the Funds in this report had positive UNII balances for both tax and financial reporting purposes.
COMMON SHARE REPURCHASES AND PRICE INFORMATION
As of February 29, 2012, and since the inception of the Funds’ repurchase program, the following Funds have cumulatively repurchased and retired common shares as shown in the accompanying table. Since the inception of the Fund’s repurchase programs, NAC and NKX have not redeemed any of their outstanding common shares.
| | Common Shares | % of Outstanding |
| Fund | Repurchased and Retired | Common Shares |
| NPC | 17,700 | 0.3% |
| NCL | 55,700 | 0.4% |
| NCU | 44,500 | 0.8% |
| NAC | — | — |
| NVX | 50,700 | 0.3% |
| NZH | 12,900 | 0.1% |
| NKL | 32,700 | 0.2% |
| NKX | — | — |
During the twelve-month reporting period, the Funds did not repurchase any of their outstanding common shares.
As of February 29, 2012, the Funds’ common share prices were trading at (+) premiums or (-) discounts to their common share NAVs as shown in the accompanying table.
| | 2/29/12 | Twelve-Month Average |
| Fund | (+)Premium/(-)Discount | (-)Discount |
| NPC | (+)1.07% | (-)2.41% |
| NCL | (+)2.54% | (-)2.14% |
| NCU | (-)1.05% | (-)5.57% |
| NAC | (+)1.82% | (-)3.08% |
| NVX | (+)0.58% | (-)3.20% |
| NZH | (+)3.16% | (-)2.08% |
| NKL | (+)2.50% | (-)1.01% |
| NKX | (+)2.24% | (-)5.56% |
| NPC | | Nuveen Insured California |
| Performance | | Premium Income |
| OVERVIEW | | Municipal Fund, Inc. |
| | | as of February 29, 2012 |
| Fund Snapshot | | | | |
| Common Share Price | | $ | 16.06 | |
| Common Share Net Asset Value (NAV) | | $ | 15.89 | |
| Premium/(Discount) to NAV | | | 1.07 | % |
| Market Yield | | | 5.42 | % |
Taxable-Equivalent Yield1 | | | 8.30 | % |
| Net Assets Applicable to Common Shares ($000) | | $ | 102,481 | |
| | | | | |
| Leverage | | | | |
| Regulatory Leverage | | | 29.41 | % |
| Effective Leverage | | | 35.25 | % |
| Average Annual Total Returns | | | | | | | |
| (Inception 11/19/92) | | | | | | | |
| | | On Share Price | | On NAV |
| 1-Year | | | 29.53 | % | | 24.47 | % |
| 5-Year | | | 7.72 | % | | 6.31 | % |
| 10-Year | | | 6.59 | % | | 6.22 | % |
Portfolio Composition4 | | | | |
| (as a % of total investments) | | | | |
| Tax Obligation/Limited | | | 36.2 | % |
| Tax Obligation/General | | | 21.1 | % |
| U.S. Guaranteed | | | 18.4 | % |
| Water and Sewer | | | 14.6 | % |
| Other | | | 9.7 | % |
| | | | | |
Insurers4 | | | | |
| (as a % of total Insured investments) | | | | |
NPFG5 | | | 28.5 | % |
| AMBAC | | | 25.5 | % |
| FGIC | | | 18.8 | % |
| AGM | | | 17.3 | % |
| AGC | | | 7.7 | % |
| SYNCORA GTY | | | 2.2 | % |
| | Refer to the Glossary of Terms Used in this Report for further definition of the terms used within this Fund’s Performance Overview page. |
| 1 | Taxable-Equivalent Yield represents the yield that must be earned on a fully taxable investment in order to equal the yield of the Fund on an after-tax basis. It is based on a combined federal and state income tax rate of 34.7%. When comparing this Fund to investments that generate qualified dividend income, the Taxable-Equivalent Yield is lower. |
| 2 | The Fund intends to invest at least 80% of its managed assets in municipal securities that are covered by insurance guaranteeing the timely payment of principal and interest. See Notes to Financial Statements, Footnote 1 – General Information and Significant Accounting Policies, Insurance for more information. At the end of the reporting period, 82% of the Fund’s total investments are invested in Insured securities. |
| 3 | Ratings shown are the highest rating given by one of the following national rating agencies: Standard & Poor’s Group, Moody’s Investors Service, Inc. or Fitch, Inc. Credit ratings are subject to change. AAA, AA, A, and BBB are investment grade ratings; BB, B, CCC, CC, C and D are below-investment grade ratings. Certain bonds backed by U.S. Government or agency securities are regarded as having an implied rating equal to the rating of such securities. Holdings designated N/R are not rated by a national rating agency. |
| 4 | Holdings are subject to change. |
| 5 | MBIA’s public finance subsidiary. |
| 6 | The Fund paid shareholders a net ordinary income distribution and a capital gains distribution in December 2011 of $0.024 and $0.078 per share. |
| NCL | | Nuveen Insured California |
| Performance | | Premium Income |
| OVERVIEW | | Municipal Fund 2, Inc. |
| | | as of February 29, 2012 |
| Fund Snapshot | | | | |
| Common Share Price | | $ | 15.76 | |
| Common Share Net Asset Value (NAV) | | $ | 15.37 | |
| Premium/(Discount) to NAV | | | 2.54 | % |
| Market Yield | | | 5.75 | % |
Taxable-Equivalent Yield1 | | | 8.81 | % |
| Net Assets Applicable to Common Shares ($000) | | $ | 194,712 | |
| | | | | |
| Leverage | | | | |
| Regulatory Leverage | | | 27.54 | % |
| Effective Leverage | | | 36.48 | % |
| Average Annual Total Returns | | | | | | | |
| (Inception 3/18/93) | | | | | | | |
| | | On Share Price | | On NAV |
| 1-Year | | | 35.03 | % | | 25.33 | % |
| 5-Year | | | 8.41 | % | | 6.30 | % |
| 10-Year | | | 6.78 | % | | 6.24 | % |
Portfolio Composition4 | | | | |
| (as a % of total investments) | | | | |
| Tax Obligation/Limited | | | 44.3 | % |
| Tax Obligation/General | | | 21.4 | % |
| Water and Sewer | | | 14.0 | % |
| Utilities | | | 5.5 | % |
| Other | | | 14.8 | % |
| | | | | |
Insurers4 | | | | |
| (as a % of total Insured investments) | | | | |
| AMBAC | | | 29.6 | % |
| AGM | | | 20.6 | % |
| FGIC | | | 19.0 | % |
NPFG5 | | | 17.9 | % |
| AGC | | | 12.3 | % |
| SYNCORA GTY | | | 0.6 | % |
| | Refer to the Glossary of Terms Used in this Report for further definition of the terms used within this Fund’s Performance Overview page. |
| 1 | Taxable-Equivalent Yield represents the yield that must be earned on a fully taxable investment in order to equal the yield of the Fund on an after-tax basis. It is based on a combined federal and state income tax rate of 34.7%. When comparing this Fund to investments that generate qualified dividend income, the Taxable-Equivalent Yield is lower. |
| 2 | The Fund intends to invest at least 80% of its managed assets in municipal securities that are covered by insurance guaranteeing the timely payment of principal and interest. See Notes to Financial Statements, Footnote 1 – General Information and Significant Accounting Policies, Insurance for more information. At the end of the reporting period, 90% of the Fund’s total investments are invested in Insured securities. |
| 3 | Ratings shown are the highest rating given by one of the following national rating agencies: Standard & Poor’s Group, Moody’s Investors Service, Inc. or Fitch, Inc. Credit ratings are subject to change. AAA, AA, A, and BBB are investment grade ratings; BB, B, CCC, CC, C and D are below-investment grade ratings. Certain bonds backed by U.S. Government or agency securities are regarded as having an implied rating equal to the rating of such securities. Holdings designated N/R are not rated by a national rating agency. |
| 4 | Holdings are subject to change. |
| 5 | MBIA’s public finance subsidiary. |
| 6 | The Fund paid shareholders a net ordinary income distribution in December 2011 of $0.0118 per share. |
| NCU | | Nuveen California |
| Performance | | Premium Income |
| OVERVIEW | | Municipal Fund |
| | | as of February 29, 2012 |
| Fund Snapshot | | | | |
| Common Share Price | | $ | 15.15 | |
| Common Share Net Asset Value (NAV) | | $ | 15.31 | |
| Premium/(Discount) to NAV | | | -1.05 | % |
| Market Yield | | | 5.74 | % |
Taxable-Equivalent Yield1 | | | 8.79 | % |
| Net Assets Applicable to Common Shares ($000) | | $ | 87,755 | |
| | | | | |
| Leverage | | | | |
| Regulatory Leverage | | | 28.66 | % |
| Effective Leverage | | | 36.79 | % |
| Average Annual Total Returns | | | | | | | |
| (Inception 6/18/93) | | | | | | | |
| | | On Share Price | | On NAV |
| 1-Year | | | 31.68 | % | | 25.65 | % |
| 5-Year | | | 7.64 | % | | 6.45 | % |
| 10-Year | | | 7.12 | % | | 6.66 | % |
Portfolio Composition3 | | | | |
| (as a % of total investments) | | | | |
| Tax Obligation/Limited | | | 28.8 | % |
| Health Care | | | 21.9 | % |
| Tax Obligation/General | | | 19.5 | % |
| U.S. Guaranteed | | | 7.0 | % |
| Water and Sewer | | | 5.0 | % |
| Consumer Staples | | | 4.3 | % |
| Other | | | 13.5 | % |
| | Refer to the Glossary of Terms Used in this Report for further definition of the terms used within this Fund’s Performance Overview page. |
| 1 | Taxable-Equivalent Yield represents the yield that must be earned on a fully taxable investment in order to equal the yield of the Fund on an after-tax basis. It is based on a combined federal and state income tax rate of 34.7%. When comparing this Fund to investments that generate qualified dividend income, the Taxable-Equivalent Yield is lower. |
| 2 | Ratings shown are the highest rating given by one of the following national rating agencies: Standard & Poor’s Group, Moody’s Investors Service, Inc. or Fitch, Inc. Credit ratings are subject to change. AAA, AA, A, and BBB are investment grade ratings; BB, B, CCC, CC, C and D are below-investment grade ratings. Certain bonds backed by U.S. Government or agency securities are regarded as having an implied rating equal to the rating of such securities. Holdings designated N/R are not rated by a national rating agency. |
| 3 | Holdings are subject to change. |
| NAC | | Nuveen California |
| Performance | | Dividend Advantage |
| OVERVIEW | | Municipal Fund |
| | | as of February 29, 2012 |
| Fund Snapshot | | | | |
| Common Share Price | | $ | 15.14 | |
| Common Share Net Asset Value (NAV) | | $ | 14.87 | |
| Premium/(Discount) to NAV | | | 1.82 | % |
| Market Yield | | | 6.10 | % |
Taxable-Equivalent Yield1 | | | 9.34 | % |
| Net Assets Applicable to Common Shares ($000) | | $ | 349,203 | |
| | | | | |
| Leverage | | | | |
| Regulatory Leverage | | | 28.06 | % |
| Effective Leverage | | | 33.74 | % |
| Average Annual Total Returns | | | | | | | |
| (Inception 5/26/99) | | | | | | | |
| | | On Share Price | | On NAV |
| 1-Year | | | 32.82 | % | | 25.30 | % |
| 5-Year | | | 6.16 | % | | 5.66 | % |
| 10-Year | | | 7.43 | % | | 6.53 | % |
Portfolio Composition3 | | | | |
| (as a % of total investments) | | | | |
| Tax Obligation/Limited | | | 26.8 | % |
| Health Care | | | 20.6 | % |
| Tax Obligation/General | | | 17.5 | % |
| U.S. Guaranteed | | | 8.9 | % |
| Water and Sewer | | | 6.6 | % |
| Education and Civic Organizations | | | 5.4 | % |
| Other | | | 14.2 | % |
| | Refer to the Glossary of Terms Used in this Report for further definition of the terms used within this Fund’s Performance Overview page. |
| 1 | Taxable-Equivalent Yield represents the yield that must be earned on a fully taxable investment in order to equal the yield of the Fund on an after-tax basis. It is based on a combined federal and state income tax rate of 34.7%. When comparing this Fund to investments that generate qualified dividend income, the Taxable-Equivalent Yield is lower. |
| 2 | Ratings shown are the highest rating given by one of the following national rating agencies: Standard & Poor’s Group, Moody’s Investors Service, Inc. or Fitch, Inc. Credit ratings are subject to change. AAA, AA, A, and BBB are investment grade ratings; BB, B, CCC, CC, C and D are below-investment grade ratings. Certain bonds backed by U.S. Government or agency securities are regarded as having an implied rating equal to the rating of such securities. Holdings designated N/R are not rated by a national rating agency. |
| 3 | Holdings are subject to change. |
| 4 | The Fund paid shareholders a net ordinary income distribution in December 2011 of $0.0045 per share. |
| NVX | | Nuveen California |
| Performance | | Dividend Advantage |
| OVERVIEW | | Municipal Fund 2 |
| | | as of February 29, 2012 |
| Fund Snapshot | | | | |
| Common Share Price | | $ | 15.58 | |
| Common Share Net Asset Value (NAV) | | $ | 15.49 | |
| Premium/(Discount) to NAV | | | 0.58 | % |
| Market Yield | | | 6.16 | % |
Taxable-Equivalent Yield1 | | | 9.43 | % |
| Net Assets Applicable to Common Shares ($000) | | $ | 228,474 | |
| | | | | |
| Leverage | | | | |
| Regulatory Leverage | | | 29.98 | % |
| Effective Leverage | | | 37.66 | % |
| Average Annual Total Returns | | | | | | | |
| (Inception 3/27/01) | | | | | | | |
| | | On Share Price | | On NAV |
| 1-Year | | | 30.01 | % | | 22.90 | % |
| 5-Year | | | 7.11 | % | | 6.25 | % |
| 10-Year | | | 7.36 | % | | 6.69 | % |
Portfolio Composition3 | | | | |
| (as a % of total investments) | | | | |
| Health Care | | | 17.4 | % |
| Tax Obligation/General | | | 16.9 | % |
| Tax Obligation/Limited | | | 14.3 | % |
| U.S. Guaranteed | | | 13.7 | % |
| Water and Sewer | | | 7.2 | % |
| Education and Civic Organizations | | | 6.4 | % |
| Transportation | | | 6.0 | % |
| Utilities | | | 5.9 | % |
| Consumer Staples | | | 5.1 | % |
| Other | | | 7.1 | % |
| | Refer to the Glossary of Terms Used in this Report for further definition of the terms used within this Fund’s Performance Overview page. |
| 1 | Taxable-Equivalent Yield represents the yield that must be earned on a fully taxable investment in order to equal the yield of the Fund on an after-tax basis. It is based on a combined federal and state income tax rate of 34.7%. When comparing this Fund to investments that generate qualified dividend income, the Taxable-Equivalent Yield is lower. |
| 2 | Ratings shown are the highest rating given by one of the following national rating agencies: Standard & Poor’s Group, Moody’s Investors Service, Inc. or Fitch, Inc. Credit ratings are subject to change. AAA, AA, A, and BBB are investment grade ratings; BB, B, CCC, CC, C and D are below-investment grade ratings. Certain bonds backed by U.S. Government or agency securities are regarded as having an implied rating equal to the rating of such securities. Holdings designated N/R are not rated by a national rating agency. |
| 3 | Holdings are subject to change. |
| NZH | | Nuveen California |
| Performance | | Dividend Advantage |
| OVERVIEW | | Municipal Fund 3 |
| | | as of February 29, 2012 |
| Fund Snapshot | | | | |
| Common Share Price | | $ | 14.35 | |
| Common Share Net Asset Value (NAV) | | $ | 13.91 | |
| Premium/(Discount) to NAV | | | 3.16 | % |
| Market Yield | | | 6.27 | % |
Taxable-Equivalent Yield1 | | | 9.60 | % |
| Net Assets Applicable to Common Shares ($000) | | $ | 335,830 | |
| | | | | |
| Leverage | | | | |
| Regulatory Leverage | | | 32.21 | % |
| Effective Leverage | | | 39.27 | % |
| Average Annual Total Returns | | | | | | | |
| (Inception 9/25/01) | | | | | | | |
| | | On Share Price | | On NAV |
| 1-Year | | | 31.93 | % | | 22.89 | % |
| 5-Year | | | 5.63 | % | | 4.66 | % |
| 10-Year | | | 6.93 | % | | 6.06 | % |
Portfolio Composition3 | | | | |
| (as a % of total investments) | | | | |
| Tax Obligation/Limited | | | 29.9 | % |
| Health Care | | | 22.1 | % |
| U.S. Guaranteed | | | 11.3 | % |
| Tax Obligation/General | | | 9.2 | % |
| Consumer Staples | | | 5.7 | % |
| Education and Civic Organizations | | | 4.4 | % |
| Water and Sewer | | | 4.3 | % |
| Other | | | 13.1 | % |
| | Refer to the Glossary of Terms Used in this Report for further definition of the terms used within this Fund’s Performance Overview page. |
| 1 | Taxable-Equivalent Yield represents the yield that must be earned on a fully taxable investment in order to equal the yield of the Fund on an after-tax basis. It is based on a combined federal and state income tax rate of 34.7%. When comparing this Fund to investments that generate qualified dividend income, the Taxable-Equivalent Yield is lower. |
| 2 | Ratings shown are the highest rating given by one of the following national rating agencies: Standard & Poor’s Group, Moody’s Investors Service, Inc. or Fitch, Inc. Credit ratings are subject to change. AAA, AA, A, and BBB are investment grade ratings; BB, B, CCC, CC, C and D are below-investment grade ratings. Certain bonds backed by U.S. Government or agency securities are regarded as having an implied rating equal to the rating of such securities. Holdings designated N/R are not rated by a national rating agency. |
| 3 | Holdings are subject to change. |
| NKL | | Nuveen Insured California |
| Performance | | Dividend Advantage |
| OVERVIEW | | Municipal Fund |
| | | as of February 29, 2012 |
| Fund Snapshot | | | | |
| Common Share Price | | $ | 16.42 | |
| Common Share Net Asset Value (NAV) | | $ | 16.02 | |
| Premium/(Discount) to NAV | | | 2.50 | % |
| Market Yield | | | 6.07 | % |
Taxable-Equivalent Yield1 | | | 9.30 | % |
| Net Assets Applicable to Common Shares ($000) | | $ | 244,521 | |
| | | | | |
| Leverage | | | | |
| Regulatory Leverage | | | 29.92 | % |
| Effective Leverage | | | 35.05 | % |
| Average Annual Total Returns | | | | | | | |
| (Inception 3/25/02) | | | | | | | |
| | | On Share Price | | On NAV |
| 1-Year | | | 34.78 | % | | 24.87 | % |
| 5-Year | | | 7.74 | % | | 6.59 | % |
| Since Inception | | | 7.35 | % | | 7.29 | % |
Portfolio Composition4 | | | | |
| (as a % of total investments) | | | | |
| Tax Obligation/Limited | | | 32.1 | % |
| Tax Obligation/General | | | 27.3 | % |
| Water and Sewer | | | 11.8 | % |
| U.S. Guaranteed | | | 11.3 | % |
| Health Care | | | 5.3 | % |
| Utilities | | | 5.2 | % |
| Other | | | 7.0 | % |
| | | | | |
Insurers4 | | | | |
| (as a % of total Insured investments) | | | | |
| AGM | | | 31.2 | % |
| AMBAC | | | 24.7 | % |
| FGIC | | | 15.8 | % |
NPFG5 | | | 14.8 | % |
| SYNCORA GTY | | | 6.6 | % |
| AGC | | | 6.6 | % |
| ACA | | | 0.3 | % |
| | Refer to the Glossary of Terms Used in this Report for further definition of the terms used within this Fund’s Performance Overview page. |
| 1 | Taxable-Equivalent Yield represents the yield that must be earned on a fully taxable investment in order to equal the yield of the Fund on an after-tax basis. It is based on a combined federal and state income tax rate of 34.7%. When comparing this Fund to investments that generate qualified dividend income, the Taxable-Equivalent Yield is lower. |
| 2 | The Fund intends to invest at least 80% of its managed assets in municipal securities that are covered by insurance guaranteeing the timely payment of principal and interest. See Notes to Financial Statements, Footnote 1 – General Information and Significant Accounting Policies, Insurance for more information. At the end of the reporting period, 83% of the Fund’s total investments are invested in Insured securities. |
| 3 | Ratings shown are the highest rating given by one of the following national rating agencies: Standard & Poor’s Group, Moody’s Investors Service, Inc. or Fitch, Inc. Credit ratings are subject to change. AAA, AA, A, and BBB are investment grade ratings; BB, B, CCC, CC, C and D are below-investment grade ratings. Certain bonds backed by U.S. Government or agency securities are regarded as having an implied rating equal to the rating of such securities. Holdings designated N/R are not rated by a national rating agency. |
| 4 | Holdings are subject to change. |
| 5 | MBIA’s public finance subsidiary. |
| 6 | The Fund paid shareholders a net ordinary income distribution in December 2011 of $0.0053 per share. |
| NKX | | Nuveen Insured California |
| Performance | | Tax-Free Advantage |
| OVERVIEW | | Municipal Fund |
| | | as of February 29, 2012 |
| Fund Snapshot | | | | |
| Common Share Price | | $ | 15.06 | |
| Common Share Net Asset Value (NAV) | | $ | 14.73 | |
| Premium/(Discount) to NAV | | | 2.24 | % |
| Market Yield | | | 5.66 | % |
Taxable-Equivalent Yield1 | | | 8.67 | % |
| Net Assets Applicable to Common Shares ($000) | | $ | 86,731 | |
| | | | | |
| Leverage | | | | |
| Regulatory Leverage | | | 29.04 | % |
| Effective Leverage | | | 34.05 | % |
| Average Annual Total Returns | | | | | | | |
| (Inception 11/21/02) | | | | | | | |
| | | On Share Price | | On NAV |
| 1-Year | | | 36.10 | % | | 21.95 | % |
| 5-Year | | | 6.54 | % | | 5.18 | % |
| Since Inception | | | 5.98 | % | | 6.01 | % |
Portfolio Composition4 | | | | |
| (as a % of total investments) | | | | |
| Tax Obligation/Limited | | | 34.1 | % |
| Health Care | | | 17.4 | % |
| U.S. Guaranteed | | | 14.5 | % |
| Tax Obligation/General | | | 8.8 | % |
| Water and Sewer | | | 7.7 | % |
| Transportation | | | 5.9 | % |
| Long-Term Care | | | 5.0 | % |
| Other | | | 6.6 | % |
| | | | | |
Insurers4 | | | | |
| (as a % of total Insured investments) | | | | |
| AMBAC | | | 42.7 | % |
NPFG5 | | | 18.9 | % |
| AGM | | | 14.7 | % |
| AGC | | | 9.2 | % |
| FGIC | | | 8.1 | % |
| BHAC | | | 5.4 | % |
| SYNCORA GTY | | | 1.0 | % |
| | Refer to the Glossary of Terms Used in this Report for further definition of the terms used within this Fund’s Performance Overview page. |
| 1 | Taxable-Equivalent Yield represents the yield that must be earned on a fully taxable investment in order to equal the yield of the Fund on an after-tax basis. It is based on a combined federal and state income tax rate of 34.7%. When comparing this Fund to investments that generate qualified dividend income, the Taxable-Equivalent Yield is lower. |
| 2 | The Fund intends to invest at least 80% of its managed assets in municipal securities that are covered by insurance guaranteeing the timely payment of principal and interest. See Notes to Financial Statements, Footnote 1 – General Information and Significant Accounting Policies, Insurance for more information. At the end of the reporting period, 78% of the Fund’s total investments are invested in Insured securities. |
| 3 | Ratings shown are the highest rating given by one of the following national rating agencies: Standard & Poor’s Group, Moody’s Investors Service, Inc. or Fitch, Inc. Credit ratings are subject to change. AAA, AA, A, and BBB are investment grade ratings; BB, B, CCC, CC, C and D are below-investment grade ratings. Certain bonds backed by U.S. Government or agency securities are regarded as having an implied rating equal to the rating of such securities. Holdings designated N/R are not rated by a national rating agency. |
| 4 | Holdings are subject to change. |
| 5 | MBIA’s public finance subsidiary. |
| NPC | | Shareholder Meeting Report |
| NCL | | |
| NCU | | The annual meeting of shareholders for NCU, NAC, NVX and NZH was held in the offices of Nuveen Investments on November 15, 2011; at this meeting the shareholders were asked to vote on the election of Board Members, the elimination of Fundamental Investment Policies and the approval of new Fundamental Investment Policies. The meeting was subsequently adjourned to December 16, 2011. The meeting for NVX was additionally adjourned to January 31, 2012. |
| | | The annual meeting of shareholders for NPC, NCL, NKL and NKX was held in the offices of Nuveen Investments on February 24, 2012; at this meeting the shareholders were asked to vote on the election of Board Members, the elimination of Fundamental Investment Policies, the approval of new Fundamental Investment Policies and the approval of an Agreement and Plan of Reorganization. The meeting was subsequently adjourned to March 30, 2012. |
| | | NPC | | NCL | | NCU | |
| | | Common and Preferred shares voting together as a class | | Preferred shares voting together as a class | | Common and Preferred shares voting together as a class | | Preferred shares voting together as a class | | Common and Preferred shares voting together as a class | | Preferred shares voting together as a class | |
| To approve the Agreement and Plan of Reorganization. | | | | | | | | | | | | | | | | | | | |
| For | | | 3,291,576 | | | 427 | | | 6,573,781 | | | 740 | | | — | | | — | |
| Against | | | 130,991 | | | — | | | 420,457 | | | — | | | — | | | — | |
| Abstain | | | 125,488 | | | — | | | 269,671 | | | — | | | — | | | — | |
| Broker Non-Votes | | | 1,029,943 | | | — | | | 2,208,503 | | | — | | | — | | | — | |
| Total | | | 4,577,998 | | | 427 | | | 9,472,412 | | | 740 | | | — | | | — | |
| | | | | | | | | | | | | | | | | | | | |
| To approve the issuance of additional common shares. | | | | | | | | | | | | | | | | | | | |
| For | | | — | | | — | | | — | | | — | | | — | | | — | |
| Against | | | — | | | — | | | — | | | — | | | — | | | — | |
| Abstain | | | — | | | — | | | — | | | — | | | — | | | — | |
| Broker Non-Votes | | | — | | | — | | | — | | | — | | | — | | | — | |
| Total | | | — | | | — | | | — | | | — | | | — | | | — | |
| | | | | | | | | | | | | | | | | | | | |
| To approve the elimination of the existing fundamental investment policy related to the Fund’s investment of at least 80% of its assets in insured municipal securities. | | | | | | | | | | | | | | | | | | | |
| For | | | 3,140,564 | | | 427 | | | 6,453,010 | | | 740 | | | — | | | — | |
| Against | | | 286,637 | | | — | | | 536,813 | | | — | | | — | | | — | |
| Abstain | | | 120,854 | | | — | | | 274,086 | | | — | | | — | | | — | |
| Broker Non-Votes | | | 1,029,943 | | | — | | | 2,208,503 | | | — | | | — | | | — | |
| Total | | | 4,577,998 | | | 427 | | | 9,472,412 | | | 740 | | | — | | | — | |
| | | | | | | | | | | | | | | | | | | | |
| To approve a new fundamental investment policy related to the Fund’s investment of at least 80%of its assets in municipal securities. | | | | | | | | | | | | | | | | | | | |
| For | | | 3,240,899 | | | 427 | | | 6,506,979 | | | 740 | | | — | | | — | |
| Against | | | 182,188 | | | — | | | 505,824 | | | — | | | — | | | — | |
| Abstain | | | 124,968 | | | — | | | 251,106 | | | — | | | — | | | — | |
| Broker Non-Votes | | | 1,029,943 | | | — | | | 2,208,503 | | | — | | | — | | | — | |
| Total | | | 4,577,998 | | | 427 | | | 9,472,412 | | | 740 | | | — | | | — | |
| | | | | | | | | | | �� | | | | | | | | | |
| To approve the elimination of the fundamental policies relating to the Fund’s ability to make loans. | | | | | | | | | | | | | | | | | | | |
| For | | | 3,143,173 | | | 427 | | | 6,382,348 | | | 740 | | | 3,845,643 | | | 1,277,924 | |
| Against | | | 279,180 | | | — | | | 563,518 | | | — | | | 241,976 | | | 78,621 | |
| Abstain | | | 125,702 | | | — | | | 318,043 | | | — | | | 102,597 | | | 14,000 | |
| Broker Non-Votes | | | 1,029,943 | | | — | | | 2,208,503 | | | — | | | 1,453,355 | | | 527,864 | |
| Total | | | 4,577,998 | | | 427 | | | 9,472,412 | | | 740 | | | 5,643,571 | | | 1,898,409 | |
| | | | | | | | | | | | | | | | | | | | |
| To approve the new fundamental policy relating to the Fund’s ability to make loans. | | | | | | | | | | | | | | | | | | | |
| For | | | 3,209,392 | | | 427 | | | 6,404,965 | | | 740 | | | 3,851,482 | | | 1,277,424 | |
| Against | | | 206,961 | | | — | | | 561,762 | | | — | | | 238,765 | | | 79,121 | |
| Abstain | | | 131,702 | | | — | | | 297,182 | | | — | | | 99,969 | | | 14,000 | |
| Broker Non-Votes | | | 1,029,943 | | | — | | | 2,208,503 | | | — | | | 1,453,355 | | | 527,864 | |
| Total | | | 4,577,998 | | | 427 | | | 9,472,412 | | | 740 | | | 5,643,571 | | | 1,898,409 | |
| NPC | | Shareholder Meeting Report (continued) |
| NCL | | |
| NCU | | |
| | | NPC | | NCL | | NCU | |
| | | Common and Preferred shares voting together as a class | | Preferred shares voting together as a class | | Common and Preferred shares voting together as a class | | Preferred shares voting together as a class | | Common and Preferred shares voting together as a class | | Preferred shares voting together as a class | |
| Approval of the Board Members was reached as follows: | | | | | | | | | | | | | | | | | | | |
| John P. Amboian | | | | | | | | | | | | | | | | | | | |
| For | | | 5,048,146 | | | — | | | 10,001,959 | | | — | | | 5,390,182 | | | — | |
| Withhold | | | 141,859 | | | — | | | 368,152 | | | — | | | 253,389 | | | — | |
| Total | | | 5,190,005 | | | — | | | 10,370,111 | | | — | | | 5,643,571 | | | — | |
| Robert P. Bremner | | | | | | | | | | | | | | | | | | | |
| For | | | 5,049,646 | | | — | | | 10,002,112 | | | — | | | — | | | — | |
| Withhold | | | 140,359 | | | — | | | 367,999 | | | — | | | — | | | — | |
| Total | | | 5,190,005 | | | — | | | 10,370,111 | | | — | | | — | | | — | |
| Jack B. Evans | | | | | | | | | | | | | | | | | | | |
| For | | | 5,048,046 | | | — | | | 10,007,232 | | | — | | | — | | | — | |
| Withhold | | | 141,959 | | | — | | | 362,879 | | | — | | | — | | | — | |
| Total | | | 5,190,005 | | | — | | | 10,370,111 | | | — | | | — | | | — | |
| William C. Hunter | | | | | | | | | | | | | | | | | | | |
| For | | | — | | | 427 | | | — | | | 740 | | | — | | | 1,804,800 | |
| Withhold | | | — | | | — | | | — | | | — | | | — | | | 93,609 | |
| Total | | | — | | | 427 | | | — | | | 740 | | | — | | | 1,898,409 | |
| David J. Kundert | | | | | | | | | | | | | | | | | | | |
| For | | | 5,048,246 | | | — | | | 10,004,559 | | | — | | | 5,380,869 | | | — | |
| Withhold | | | 141,759 | | | — | | | 365,552 | | | — | | | 262,702 | | | — | |
| Total | | | 5,190,005 | | | — | | | 10,370,111 | | | — | | | 5,643,571 | | | — | |
| William J. Schneider | | | | | | | | | | | | | | | | | | | |
| For | | | — | | | 427 | | | — | | | 740 | | | — | | | 1,804,800 | |
| Withhold | | | — | | | — | | | — | | | — | | | — | | | 93,609 | |
| Total | | | — | | | 427 | | | — | | | 740 | | | — | | | 1,898,409 | |
| Judith M. Stockdale | | | | | | | | | | | | | | | | | | | |
| For | | | 5,041,846 | | | — | | | 9,999,412 | | | — | | | — | | | — | |
| Withhold | | | 148,159 | | | — | | | 370,699 | | | — | | | — | | | — | |
| Total | | | 5,190,005 | | | — | | | 10,370,111 | | | — | | | — | | | — | |
| Carole E. Stone | | | | | | | | | | | | | | | | | | | |
| For | | | 5,044,646 | | | — | | | 10,000,512 | | | — | | | — | | | — | |
| Withhold | | | 145,359 | | | — | | | 369,599 | | | — | | | — | | | — | |
| Total | | | 5,190,005 | | | — | | | 10,370,111 | | | — | | | — | | | — | |
| Virginia L. Stringer | | | | | | | | | | | | | | | | | | | |
| For | | | 5,048,946 | | | — | | | 10,002,685 | | | — | | | — | | | — | |
| Withhold | | | 141,059 | | | — | | | 367,426 | | | — | | | — | | | — | |
| Total | | | 5,190,005 | | | — | | | 10,370,111 | | | — | | | — | | | — | |
| Terence J. Toth | | | | | | | | | | | | | | | | | | | |
| For | | | 5,049,146 | | | — | | | 10,001,812 | | | — | | | 5,397,583 | | | — | |
| Withhold | | | 140,859 | | | — | | | 368,299 | | | — | | | 245,988 | | | — | |
| Total | | | 5,190,005 | | | — | | | 10,370,111 | | | — | | | 5,643,571 | | | — | |
| | | NAC | | NVX | | NZH | |
| | | Common and Preferred shares voting together as a class | | Preferred shares voting together as a class | | Common and Preferred shares voting together as a class | | Preferred shares voting together as a class | | Common and Preferred shares voting together as a class | | Preferred shares voting together as a class | |
| To approve the Agreement and Plan of Reorganization. | | | | | | | | | | | | | | | | | | | |
| For | | | — | | | — | | | — | | | — | | | — | | | — | |
| Against | | | — | | | — | | | — | | | — | | | — | | | — | |
| Abstain | | | — | | | — | | | — | | | — | | | — | | | — | |
| Broker Non-Votes | | | — | | | — | | | — | | | — | | | — | | | — | |
| Total | | | — | | | — | | | — | | | — | | | — | | | — | |
| | | | | | | | | | | | | | | | | | | | |
| To approve the issuance of additional common shares. | | | | | | | | | | | | | | | | | | | |
| For | | | — | | | — | | | — | | | — | | | — | | | — | |
| Against | | | — | | | — | | | — | | | — | | | — | | | — | |
| Abstain | | | — | | | — | | | — | | | — | | | — | | | — | |
| Broker Non-Votes | | | — | | | — | | | — | | | — | | | — | | | — | |
| Total | | | — | | | — | | | — | | | — | | | — | | | — | |
| | | | | | | | | | | | | | | | | | | | |
| To approve the elimination of the existing fundamental investment policy related to the Fund’s investment of at least 80% of its assets in insured municipal securities. | | | | | | | | | | | | | | | | | | | |
| For | | | — | | | — | | | — | | | — | | | — | | | — | |
| Against | | | — | | | — | | | — | | | — | | | — | | | — | |
| Abstain | | | — | | | — | | | — | | | — | | | — | | | — | |
| Broker Non-Votes | | | — | | | — | | | — | | | — | | | — | | | — | |
| Total | | | — | | | — | | | — | | | — | | | — | | | — | |
| | | | | | | | | | | | | | | | | | | | |
| To approve a new fundamental investment policy related to the Fund’s investment of at least 80% of its assets in municipal securities. | | | | | | | | | | | | | | | | | | | |
| For | | | — | | | — | | | — | | | — | | | — | | | — | |
| Against | | | — | | | — | | | — | | | — | | | — | | | — | |
| Abstain | | | — | | | — | | | — | | | — | | | — | | | — | |
| Broker Non-Votes | | | — | | | — | | | — | | | — | | | — | | | — | |
| Total | | | — | | | — | | | — | | | — | | | — | | | — | |
| | | | | | | | | | | | | | | | | | | | |
| To approve the elimination of the fundamental policies relating to the Fund’s ability to make loans. | | | | | | | | | | | | | | | | | | | |
| For | | | 10,093,682 | | | 1,352 | | | 11,206,563 | | | 4,025,588 | | | 16,567,423 | | | 6,365,782 | |
| Against | | | 361,206 | | | — | | | 725,943 | | | 251,156 | | | 875,986 | | | 282,007 | |
| Abstain | | | 371,053 | | | — | | | 359,582 | | | 67,330 | | | 418,253 | | | 66,400 | |
| Broker Non-Votes | | | 3,352,320 | | | — | | | 3,789,801 | | | 2,328,989 | | | 5,570,472 | | | 2,545,059 | |
| Total | | | 14,178,261 | | | 1,352 | | | 16,081,889 | | | 6,673,063 | | | 23,432,134 | | | 9,259,248 | |
| | | | | | | | | | | | | | | | | | | | |
| To approve the new fundamental policy relating to the Fund’s ability to make loans. | | | | | | | | | | | | | | | | | | | |
| For | | | 10,132,522 | | | 1,352 | | | 11,157,230 | | | 4,003,088 | | | 16,418,824 | | | 6,223,102 | |
| Against | | | 380,292 | | | — | | | 753,423 | | | 273,656 | | | 1,025,811 | | | 420,187 | |
| Abstain | | | 313,127 | | | — | | | 381,434 | | | 67,330 | | | 417,025 | | | 70,900 | |
| Broker Non-Votes | | | 3,352,320 | | | — | | | 3,789,802 | | | 2,328,989 | | | 5,570,474 | | | 2,545,059 | |
| Total | | | 14,178,261 | | | 1,352 | | | 16,081,889 | | | 6,673,063 | | | 23,432,134 | | | 9,259,248 | |
| NAC | | Shareholder Meeting Report (continued) |
| NVX | | |
| NZH | | |
| | | NAC | | NVX | | NZH | |
| | | Common and Preferred shares voting together as a class | | Preferred shares voting together as a class | | Common and Preferred shares voting together as a class | | Preferred shares voting together as a class | | Common and Preferred shares voting together as a class | | Preferred shares voting together as a class | |
| Approval of the Board Members was reached as follows: | | | | | | | | | | | | | | | | | | | |
| John P. Amboian | | | | | | | | | | | | | | | | | | | |
| For | | | 13,822,072 | | | — | | | 13,983,321 | | | — | | | 22,358,217 | | | — | |
| Withhold | | | 356,189 | | | — | | | 1,555,024 | | | — | | | 1,073,917 | | | — | |
| Total | | | 14,178,261 | | | — | | | 15,538,345 | | | — | | | 23,432,134 | | | — | |
| Robert P. Bremner | | | | | | | | | | | | | | | | | | | |
| For | | | — | | | — | | | — | | | — | | | — | | | — | |
| Withhold | | | — | | | — | | | — | | | — | | | — | | | — | |
| Total | | | — | | | — | | | — | | | — | | | — | | | — | |
| Jack B. Evans | | | | | | | | | | | | | | | | | | | |
| For | | | — | | | — | | | — | | | — | | | — | | | — | |
| Withhold | | | — | | | — | | | — | | | — | | | — | | | — | |
| Total | | | — | | | — | | | — | | | — | | | — | | | — | |
| William C. Hunter | | | | | | | | | | | | | | | | | | | |
| For | | | — | | | 1,352 | | | — | | | 4,911,619 | | | — | | | 8,740,600 | |
| Withhold | | | — | | | — | | | — | | | 1,174,989 | | | — | | | 518,648 | |
| Total | | | — | | | 1,352 | | | — | | | 6,086,608 | | | — | | | 9,259,248 | |
| David J. Kundert | | | | | | | | | | | | | | | | | | | |
| For | | | 13,837,489 | | | — | | | 13,988,375 | | | — | | | 22,367,250 | | | — | |
| Withhold | | | 340,772 | | | — | | | 1,549,970 | | | — | | | 1,064,884 | | | — | |
| Total | | | 14,178,261 | | | — | | | 15,538,345 | | | — | | | 23,432,134 | | | — | |
| William J. Schneider | | | | | | | | | | | | | | | | | | | |
| For | | | — | | | 1,352 | | | — | | | 4,917,319 | | | — | | | 8,740,600 | |
| Withhold | | | — | | | — | | | — | | | 1,169,289 | | | — | | | 518,648 | |
| Total | | | — | | | 1,352 | | | — | | | 6,086,608 | | | — | | | 9,259,248 | |
| Judith M. Stockdale | | | | | | | | | | | | | | | | | | | |
| For | | | — | | | — | | | — | | | — | | | — | | | — | |
| Withhold | | | — | | | — | | | — | | | — | | | — | | | — | |
| Total | | | — | | | — | | | — | | | — | | | — | | | — | |
| Carole E. Stone | | | | | | | | | | | | | | | | | | | |
| For | | | — | | | — | | | — | | | — | | | — | | | — | |
| Withhold | | | — | | | — | | | — | | | — | | | — | | | — | |
| Total | | | — | | | — | | | — | | | — | | | — | | | — | |
| Virginia L. Stringer | | | | | | | | | | | | | | | | | | | |
| For | | | — | | | — | | | — | | | — | | | — | | | — | |
| Withhold | | | — | | | — | | | — | | | — | | | — | | | — | |
| Total | | | — | | | — | | | — | | | — | | | — | | | — | |
| Terence J. Toth | | | | | | | | | | | | | | | | | | | |
| For | | | 13,842,839 | | | — | | | 13,996,504 | | | — | | | 22,368,715 | | | — | |
| Withhold | | | 335,422 | | | — | | | 1,541,841 | | | — | | | 1,063,419 | | | — | |
| Total | | | 14,178,261 | | | — | | | 15,538,345 | | | — | | | 23,432,134 | | | — | |
| | | NKL | | NKX | |
| | | Common and Preferred shares voting together as a class | | Preferred shares voting together as a class | | Common and Preferred shares voting together as a class | | Preferred shares voting together as a class | |
To approve the Agreement and Plan of Reorganization. | | | | | | | | | | | | | |
| For | | | 7,654,266 | | | 903 | | | — | | | 355 | |
| Against | | | 386,245 | | | — | | | — | | | — | |
| Abstain | | | 425,376 | | | — | | | — | | | — | |
| Broker Non-Votes | | | 2,732,545 | | | — | | | — | | | — | |
| Total | | | 11,198,432 | | | 903 | | | — | | | 355 | |
| | | | | | | | | | | | | | |
To approve the issuance of additional common shares. | | | | | | | | | | | | | |
| For | | | — | | | — | | | 2,617,715 | | | — | |
| Against | | | — | | | — | | | 183,929 | | | — | |
| Abstain | | | — | | | — | | | 105,422 | | | — | |
| Broker Non-Votes | | | — | | | — | | | 888,385 | | | — | |
| Total | | | — | | | — | | | 3,795,451 | | | — | |
| | | | | | | | | | | | | | |
To approve the elimination of the existing fundamental investment policy related to | | | | | | | | | | | | | |
| For | | | 7,589,720 | | | 903 | | | 2,668,761 | | | 355 | |
| Against | | | 472,008 | | | — | | | 163,686 | | | — | |
| Abstain | | | 404,159 | | | — | | | 74,619 | | | — | |
| Broker Non-Votes | | | 2,732,545 | | | — | | | 888,385 | | | — | |
| Total | | | 11,198,432 | | | 903 | | | 3,795,451 | | | 355 | |
| | | | | | | | | | | | | | |
To approve a new fundamental investment policy related to the | | | | | | | | | | | | | |
| For | | | 7,625,923 | | | 903 | | | 2,677,823 | | | 355 | |
| Against | | | 452,754 | | | — | | | 139,902 | | | — | |
| Abstain | | | 387,210 | | | — | | | 89,341 | | | — | |
| Broker Non-Votes | | | 2,732,545 | | | — | | | 888,385 | | | — | |
| Total | | | 11,198,432 | | | 903 | | | 3,795,451 | | | 355 | |
| | | | | | | | | | | | | | |
To approve the elimination of the fundamental policies relating to the | | | | | | | | | | | | | |
| For | | | 7,555,239 | | | 903 | | | 2,616,012 | | | 355 | |
| Against | | | 475,339 | | | — | | | 203,575 | | | — | |
| Abstain | | | 435,309 | | | — | | | 87,479 | | | — | |
| Broker Non-Votes | | | 2,732,545 | | | — | | | 888,385 | | | — | |
| Total | | | 11,198,432 | | | 903 | | | 3,795,451 | | | 355 | |
| | | | | | | | | | | | | | |
To approve the new fundamental policy relating to the Fund’s ability | | | | | | | | | | | | | |
| For | | | 7,554,772 | | | 903 | | | 2,615,750 | | | 355 | |
| Against | | | 470,657 | | | — | | | 206,626 | | | — | |
| Abstain | | | 440,458 | | | — | | | 84,690 | | | — | |
| Broker Non-Votes | | | 2,732,545 | | | — | | | 888,385 | | | — | |
| Total | | | 11,198,432 | | | 903 | | | 3,795,451 | | | 355 | |
| | | Shareholder Meeting Report (continued) |
| NKL | | |
| NKX | | |
| | | |
| | | NKL | | NKX | |
| | | Common and Preferred shares voting together as a class | | Preferred shares voting together as a class | | Common and Preferred shares voting together as a class | | Preferred shares voting together as a class | |
Approval of the Board Members was reached as follows: | | | | | | | | | | | | | |
| John P. Amboian | | | | | | | | | | | | | |
| For | | | 12,468,112 | | | — | | | 4,566,281 | | | — | |
| Withhold | | | 188,664 | | | — | | | 65,693 | | | — | |
| Total | | | 12,656,776 | | | — | | | 4,631,974 | | | — | |
| Robert P. Bremner | | | | | | | | | | | | | |
| For | | | — | | | — | | | — | | | — | |
| Withhold | | | — | | | — | | | — | | | — | |
| Total | | | — | | | — | | | — | | | — | |
| Jack B. Evans | | | | | | | | | | | | | |
| For | | | — | | | — | | | — | | | — | |
| Withhold | | | — | | | — | | | — | | | — | |
| Total | | | — | | | — | | | — | | | — | |
| William C. Hunter | | | | | | | | | | | | | |
| For | | | — | | | 903 | | | — | | | 177 | |
| Withhold | | | — | | | — | | | — | | | 178 | |
| Total | | | — | �� | | 903 | | | — | | | 355 | |
| David J. Kundert | | | | | | | | | | | | | |
| For | | | 12,471,795 | | | — | | | 4,567,081 | | | — | |
| Withhold | | | 184,981 | | | — | | | 64,893 | | | — | |
| Total | | | 12,656,776 | | | — | | | 4,631,974 | | | — | |
| William J. Schneider | | | | | | | | | | | | | |
| For | | | — | | | 903 | | | — | | | 177 | |
| Withhold | | | — | | | — | | | — | | | 178 | |
| Total | | | — | | | 903 | | | — | | | 355 | |
| Judith M. Stockdale | | | | | | | | | | | | | |
| For | | | — | | | — | | | — | | | — | |
| Withhold | | | — | | | — | | | — | | | — | |
| Total | | | — | | | — | | | — | | | — | |
| Carole E. Stone | | | | | | | | | | | | | |
| For | | | — | | | — | | | — | | | — | |
| Withhold | | | — | | | — | | | — | | | — | |
| Total | | | — | | | — | | | — | | | — | |
| Virginia L. Stringer | | | | | | | | | | | | | |
| For | | | — | | | — | | | — | | | — | |
| Withhold | | | — | | | — | | | — | | | — | |
| Total | | | — | | | — | | | — | | | — | |
| Terence J. Toth | | | | | | | | | | | | | |
| For | | | 12,474,211 | | | — | | | 4,566,281 | | | — | |
| Withhold | | | 182,565 | | | — | | | 65,693 | | | — | |
| Total | | | 12,656,776 | | | — | | | 4,631,974 | | | — | |
Report of Independent
Registered Public Accounting Firm
The Board of Directors/Trustees and Shareholders
Nuveen Insured California Premium Income Municipal Fund, Inc.
Nuveen Insured California Premium Income Municipal Fund 2, Inc.
Nuveen California Premium Income Municipal Fund
Nuveen California Dividend Advantage Municipal Fund
Nuveen California Dividend Advantage Municipal Fund 2
Nuveen California Dividend Advantage Municipal Fund 3
Nuveen Insured California Dividend Advantage Municipal Fund
Nuveen Insured California Tax-Free Advantage Municipal Fund
We have audited the accompanying statements of assets and liabilities, including the portfolios of investments, of Nuveen Insured California Premium Income Municipal Fund, Inc., Nuveen Insured California Premium Income Municipal Fund 2, Inc., Nuveen California Premium Income Municipal Fund, Nuveen California Dividend Advantage Municipal Fund, Nuveen California Dividend Advantage Municipal Fund 2, Nuveen California Dividend Advantage Municipal Fund 3, Nuveen Insured California Dividend Advantage Municipal Fund, and Nuveen Insured California Tax-Free Advantage Municipal Fund (the “Funds”) as of February 29, 2012, and the related statements of operations and cash flows for the year then ended, the statements of changes in net assets for each of the two years in the period then ended, and the financial highlights for each of the periods indicated therein. These financial statements and financial highlights are the responsibility of the Funds’ management. Our responsibility is to express an opinion on these financial statements and financial highlights based on our audits.
We conducted our audits in accordance with the standards of the Public Company Accounting Oversight Board (United States). Those standards require that we plan and perform the audits to obtain reasonable assurance about whether the financial statements and financial highlights are free of material misstatement. We were not engaged to perform an audit of the Funds’ internal control over financial reporting. Our audits included consideration of internal control over financial reporting as a basis for designing audit procedures that are appropriate in the circumstances, but not for the purpose of expressing an opinion on the effectiveness of the Funds’ internal control over financial reporting. Accordingly, we express no such opinion. An audit also includes examining, on a test basis, evidence supporting the amounts and disclosures in the financial statements and financial highlights, assessing the accounting principles used and significant estimates made by management, and evaluating the overall financial statement presentation. Our procedures included confirmation of securities owned as of February 29, 2012, by correspondence with the custodian and brokers or by other appropriate auditing procedures where replies from brokers were not received. We believe that our audits provide a reasonable basis for our opinion.
In our opinion, the financial statements and financial highlights referred to above present fairly, in all material respects, the financial positions of Nuveen Insured California Premium Income Municipal Fund, Inc., Nuveen Insured California Premium Income Municipal Fund 2, Inc., Nuveen California Premium Income Municipal Fund, Nuveen California Dividend Advantage Municipal Fund, Nuveen California Dividend Advantage Municipal Fund 2, Nuveen California Dividend Advantage Municipal Fund 3, Nuveen Insured California Dividend Advantage Municipal Fund, and Nuveen Insured California Tax-Free Advantage Municipal Fund at February 29, 2012, and the results of their operations and their cash flows for the year then ended, the changes in their net assets for each of the two years in the period then ended, and the financial highlights for each of the periods indicated therein, in conformity with U.S. generally accepted accounting principles.
Chicago, Illinois
April 25, 2012
| | | Nuveen Insured California Premium Income Municipal Fund, Inc. |
| NPC | | Portfolio of Investments |
| | Principal | | | | Optional Call | | | | |
| | Amount (000) | | Description (1) | | Provisions (2) | Ratings (3) | | Value | |
| | | | Education and Civic Organizations – 3.4% (2.5% of Total Investments) | | | | | | |
| $ | 750 | | California Educational Facilities Authority, Student Loan Revenue Bonds, Cal Loan Program, Series 2001A, 5.400%, 3/01/21 – NPFG Insured (Alternative Minimum Tax) | | 9/12 at 100.00 | Baa2 | $ | 750,870 | |
| | 1,500 | | California State University, Systemwide Revenue Bonds, Series 2005A, 5.000%, 11/01/25 – AMBAC Insured | | 5/15 at 100.00 | Aa2 | | 1,671,855 | |
| | 1,000 | | California State University, Systemwide Revenue Bonds, Series 2005C, 5.000%, 11/01/27 – NPFG Insured | | 11/15 at 100.00 | Aa2 | | 1,067,500 | |
| | 3,250 | | Total Education and Civic Organizations | | | | | 3,490,225 | |
| | | | Health Care – 5.3% (4.0% of Total Investments) | | | | | | |
| | 2,800 | | California Statewide Community Development Authority, Revenue Bonds, St. Joseph Health System, Series 2007A, 5.750%, 7/01/47 – FGIC Insured | | 7/18 at 100.00 | AA– | | 3,006,612 | |
| | 724 | | California Statewide Communities Development Authority, Revenue Bonds, St. Joseph Health System, Trust 2554, 18.382%, 7/01/47 – AGM Insured (IF) | | 7/18 at 100.00 | AA– | | 886,234 | |
| | 1,480 | | Santa Clara County Financing Authority, California, Insured Revenue Bonds, El Camino Hospital, Series 2007A, 5.750%, 2/01/41 – AMBAC Insured | | 8/17 at 100.00 | A+ | | 1,579,441 | |
| | 5,004 | | Total Health Care | | | | | 5,472,287 | |
| | | | Housing/Single Family – 0.1% (0.1% of Total Investments) | | | | | | |
| | 95 | | California Housing Finance Agency, Home Mortgage Revenue Bonds, Series 2006H, 5.750%, 8/01/30 – FGIC Insured (Alternative Minimum Tax) | | 2/16 at 100.00 | BBB | | 95,065 | |
| | | | Long-Term Care – 1.4% (1.1% of Total Investments) | | | | | | |
| | 1,250 | | California Health Facilities Financing Authority, Insured Revenue Bonds, Community Program for Persons with Developmental Disabilities, Series 2011A, 6.250%, 2/01/26 | | No Opt. Call | A– | | 1,459,563 | |
| | | | Tax Obligation/General – 28.4% (21.1% of Total Investments) | | | | | | |
| | | | Bonita Unified School District, San Diego County, California, General Obligation Bonds, Series 2004A: | | | | | | |
| | 1,890 | | 5.250%, 8/01/23 – NPFG Insured | | 8/14 at 100.00 | AA– | | 2,087,978 | |
| | 1,250 | | 5.250%, 8/01/25 – NPFG Insured | | 8/14 at 100.00 | AA– | | 1,369,388 | |
| | | | El Segundo Unified School District, Los Angeles County, California, General Obligation Bonds, Series 2004: | | | | | | |
| | 2,580 | | 5.250%, 9/01/21 – FGIC Insured | | 9/14 at 100.00 | AA– | | 2,846,927 | |
| | 1,775 | | 5.250%, 9/01/22 – FGIC Insured | | 9/14 at 100.00 | AA– | | 1,958,642 | |
| | 1,130 | | Fontana Unified School District, San Bernardino County, California, General Obligation Bonds, Trust 2668, 9.515%, 2/01/16 – AGM Insured (IF) | | No Opt. Call | AA– | | 1,415,845 | |
| | 1,225 | | Fresno Unified School District, Fresno County, California, General Obligation Refunding Bonds, Series 1998A, 6.550%, 8/01/20 – NPFG Insured | | 2/13 at 103.00 | Aa3 | | 1,320,881 | |
| | 5,000 | | Grossmont Healthcare District, California, General Obligation Bonds, Series 2007A, 5.000%, 7/15/37 – AMBAC Insured | | 7/17 at 100.00 | Aa2 | | 5,270,500 | |
| | 1,180 | | Jurupa Unified School District, Riverside County, California, General Obligation Bonds, Series 2004, 5.000%, 8/01/21 – FGIC Insured | | 8/13 at 100.00 | A+ | | 1,242,139 | |
| | 3,000 | | Pomona Unified School District, Los Angeles County, California, General Obligation Refunding Bonds, Series 1997A, 6.500%, 8/01/19 – NPFG Insured | | 8/12 at 102.00 | A | | 3,124,560 | |
| | 160 | | Roseville Joint Union High School District, Placer County, California, General Obligation Bonds, Series 2006B, 5.000%, 8/01/27 – FGIC Insured | | 8/15 at 100.00 | AA– | | 176,867 | |
| | 3,000 | | Sacramento City Unified School District, Sacramento County, California, General Obligation Bonds, Series 2005, 5.000%, 7/01/27 – NPFG Insured | | 7/15 at 100.00 | Aa3 | | 3,300,450 | |
| | 3,000 | | San Jacinto Unified School District, Riverside County, California, General Obligation Bonds, Series 2007, 5.250%, 8/01/32 – AGM Insured | | No Opt. Call | AA– | | 3,259,470 | |
| | 3,770 | | Stockton Unified School District, San Joaquin County, California, General Obligation Bonds, Election 2008 Series 2011D, 0.000%, 8/01/50 – AGM Insured | | 8/37 at 100.00 | AA– | | 1,748,451 | |
| | 28,960 | | Total Tax Obligation/General | | | | | 29,122,098 | |
| | Principal | | | | Optional Call | | | | |
| | Amount (000) | | Description (1) | | Provisions (2) | Ratings (3) | | Value | |
| | | | Tax Obligation/Limited – 48.8% (36.2% of Total Investments) | | | | | | |
| $ | 1,000 | | Brea and Olinda Unified School District, Orange County, California, Certificates of Participation Refunding, Series 2002A, 5.125%, 8/01/26 – AGM Insured | | 8/12 at 100.00 | AA– | $ | 1,013,180 | |
| | | | California Infrastructure and Economic Development Bank, Revenue Bonds, North County Center for Self-Sufficiency Corporation, Series 2004: | | | | | | |
| | 1,215 | | 5.000%, 12/01/19 – AMBAC Insured | | 12/13 at 100.00 | AA | | 1,307,146 | |
| | 1,615 | | 5.000%, 12/01/21 – AMBAC Insured | | 12/13 at 100.00 | AA | | 1,735,996 | |
| | 195 | | Capistrano Unified School District, Orange County, California, Special Tax Bonds, Community Facilities District, Series 2005, 5.000%, 9/01/24 – FGIC Insured | | 9/15 at 100.00 | BBB | | 200,164 | |
| | 595 | | Chino Redevelopment Agency, California, Merged Chino Redevelopment Project Area Tax Allocation Bonds, Series 2006, 5.000%, 9/01/38 – AMBAC Insured | | 9/16 at 101.00 | A– | | 575,079 | |
| | 3,190 | | Chula Vista Public Financing Authority, California, Pooled Community Facility District Assessment Revenue Bonds, Series 2005A, 4.500%, 9/01/27 – NPFG Insured | | 9/15 at 100.00 | BBB | | 3,039,177 | |
| | 1,900 | | Corona-Norco Unified School District, Riverside County, California, Special Tax Bonds, Community Facilities District 98-1, Series 2002, 5.100%, 9/01/25 – AMBAC Insured | | 9/12 at 100.00 | N/R | | 1,902,147 | |
| | 315 | | Dinuba Redevelopment Agency, California, Tax Allocation Bonds, Merged City of Dinuba Redevelopment Project and Dinuba Redevelopment Project 2, As Amended, Refunding Series 2001, 5.000%, 9/01/31 – NPFG Insured | | 9/12 at 101.00 | A– | | 316,288 | |
| | 5,000 | | El Monte, California, Senior Lien Certificates of Participation, Department of Public Services Facility Phase II, Series 2001, 5.250%, 1/01/34 – AMBAC Insured | | 7/12 at 100.00 | A2 | | 5,001,300 | |
| | 3,180 | | Golden State Tobacco Securitization Corporation, California, Enhanced Tobacco Settlement Asset-Backed Revenue Bonds, Tender Option Bonds Trust 4686, 8.957%, 6/01/45 – AGC Insured (IF) (4) | | 6/15 at 100.00 | AA– | | 3,224,138 | |
| | 700 | | Hesperia Public Financing Authority, California, Redevelopment and Housing Projects Tax Allocation Bonds, Series 2007A, 5.000%, 9/01/37 – SYNCORA GTY Insured | | 9/17 at 100.00 | Ba1 | | 527,226 | |
| | 435 | | Indian Wells Redevelopment Agency, California, Tax Allocation Bonds, Consolidated Whitewater Project Area, Series 2003A, 5.000%, 9/01/20 – AMBAC Insured | | 9/13 at 100.00 | A3 | | 441,534 | |
| | 385 | | Inglewood Redevelopment Agency, California, Tax Allocation Bonds, Merged Redevelopment Project, Subordinate Lien Series 2007A-1, 5.000%, 5/01/24 – AMBAC Insured | | 5/17 at 100.00 | BBB+ | | 383,583 | |
| | 345 | | Los Angeles Community Redevelopment Agency, California, Lease Revenue Bonds, Manchester Social Services Project, Series 2005, 5.000%, 9/01/37 – AMBAC Insured | | 9/15 at 100.00 | A1 | | 349,140 | |
| | 895 | | Los Angeles Community Redevelopment Agency, California, Tax Allocation Bonds, Bunker Hill Project, Series 2004A, 5.000%, 12/01/20 – AGM Insured | | 12/14 at 100.00 | AA– | | 983,820 | |
| | 1,500 | | Los Angeles, California, Municipal Improvement Corporation, Lease Revenue Bonds, Police Headquarters, Series 2006A, 4.750%, 1/01/31 – FGIC Insured | | 1/17 at 100.00 | A+ | | 1,553,310 | |
| | 3,150 | | Moreno Valley Community Redevelopment Agency, California, Tax Allocation Bonds, Series 2007A, 5.000%, 8/01/38 – AMBAC Insured | | 8/17 at 100.00 | A– | | 3,079,850 | |
| | 7,000 | | Rancho Cucamonga Redevelopment Agency, California, Housing Set-Aside Tax Allocation Bonds, Series 2007A, 5.000%, 9/01/34 – NPFG Insured | | 9/17 at 100.00 | A+ | | 6,999,999 | |
| | 165 | | Rialto Redevelopment Agency, California, Tax Allocation Bonds, Merged Project Area, Series 2005A, 5.000%, 9/01/35 – SYNCORA GTY Insured | | 9/15 at 100.00 | A– | | 162,867 | |
| | 205 | | Roseville, California, Certificates of Participation, Public Facilities, Series 2003A, 5.000%, 8/01/25 – AMBAC Insured | | 8/13 at 100.00 | AA– | | 209,348 | |
| | 5,150 | | San Jacinto Unified School District, Riverside County, California, Certificates of Participation, Series 2010, 5.375%, 9/01/40 – AGC Insured | | 9/20 at 100.00 | AA– | | 5,489,899 | |
| | 1,500 | | San Jose Redevelopment Agency, California, Tax Allocation Bonds, Merged Project Area, Series 2005A, 5.000%, 8/01/28 – NPFG Insured | | 8/15 at 100.00 | BBB | | 1,459,005 | |
| | 3,565 | | Sweetwater Union High School District Public Financing Authority, California, Special Tax Revenue Bonds, Series 2005A, 5.000%, 9/01/25 – AGM Insured | | 9/15 at 100.00 | AA– | | 3,745,033 | |
| | 3,250 | | Tustin Community Redevelopment Agency, California, Tax Allocation Housing Bonds Series 2010, 5.250%, 9/01/39 – AGM Insured | | 9/20 at 100.00 | AA– | | 3,527,030 | |
| | 2,805 | | Yucaipa-Calimesa Joint Unified School District, San Bernardino County, California, General Obligation Refunding Bonds, Series 2001A, 5.000%, 10/01/31 – NPFG Insured | | 4/12 at 100.00 | A2 | | 2,805,673 | |
| | 49,255 | | Total Tax Obligation/Limited | | | | | 50,031,932 | |
| | | Nuveen Insured California Premium Income Municipal Fund, Inc. (continued) |
| NPC | | Portfolio of Investments |
February 29, 2012
| | Principal | | | | Optional Call | | | | |
| | Amount (000) | | Description (1) | | Provisions (2) | Ratings (3) | | Value | |
| | | | Transportation – 2.5% (1.8% of Total Investments) | | | | | | |
| $ | 2,400 | | San Diego Unified Port District, California, Revenue Bonds, Series 2004B, 5.000%, 9/01/29 – NPFG Insured | | 9/14 at 100.00 | A+ | $ | 2,502,336 | |
| | | | U.S. Guaranteed – 24.8% (18.4% of Total Investments) (5) | | | | | | |
| | 6,000 | | Huntington Park Redevelopment Agency, California, Single Family Residential Mortgage Revenue Refunding Bonds, Series 1986A, 8.000%, 12/01/19 (ETM) | | No Opt. Call | Aaa | | 9,048,959 | |
| | 4,135 | | Palmdale Community Redevelopment Agency, California, Single Family Restructured Mortgage Revenue Bonds, Series 1986A, 8.000%, 3/01/16 (ETM) | | No Opt. Call | Aaa | | 5,328,650 | |
| | 6,220 | | Riverside County, California, GNMA Mortgage-Backed Securities Program Single Family Mortgage Revenue Bonds, Series 1987A, 9.000%, 5/01/21 (Alternative Minimum Tax) (ETM) | | No Opt. Call | Aaa | | 9,580,727 | |
| | 1,345 | | West Basin Municipal Water District, California, Revenue Certificates of Participation, Series 2003A, 5.000%, 8/01/20 (Pre-refunded 8/01/13) – NPFG Insured | | 8/13 at 100.00 | Aa2 (5) | | 1,435,747 | |
| | 17,700 | | Total U.S. Guaranteed | | | | | 25,394,083 | |
| | | | Utilities – 0.3% (0.2% of Total Investments) | | | | | | |
| | 345 | | Merced Irrigation District, California, Electric System Revenue Bonds, Series 2005, 5.125%, 9/01/31 – SYNCORA GTY Insured | | 9/15 at 100.00 | N/R | | 343,106 | |
| | | | Water and Sewer – 19.7% (14.6% of Total Investments) | | | | | | |
| | 2,200 | | Atwater Public Financing Authority, California, Wastewater Revenue Bonds, Tender Option Bond Trust 3145, 18.131%, 5/01/40 – AGM Insured (IF) | | 5/19 at 100.00 | AA– | | 2,854,104 | |
| | 5,255 | | El Dorado Irrigation District, California, Water and Sewer Certificates of Participation, Series 2003A, 5.000%, 3/01/20 – FGIC Insured | | 3/13 at 100.00 | A1 | | 5,413,385 | |
| | 1,230 | | El Dorado Irrigation District, California, Water and Sewer Certificates of Participation, Series 2004A, 5.000%, 3/01/21 – FGIC Insured | | 3/14 at 100.00 | A1 | | 1,300,061 | |
| | 235 | | Healdsburg Public Financing Authority, California, Wastewater Revenue Bonds, Series 2006, 5.000%, 4/01/36 – NPFG Insured | | 4/16 at 100.00 | AA– | | 244,449 | |
| | 5,000 | | Indio Water Authority, California, Water Revenue Bonds, Series 2006, 5.000%, 4/01/31 – AMBAC Insured | | 4/16 at 100.00 | A+ | | 5,245,350 | |
| | 3,230 | | Los Angeles County Sanitation Districts Financing Authority, California, Capital Projects Revenue Bonds, District 14, Series 2005, 5.000%, 10/01/34 – FGIC Insured | | 10/15 at 100.00 | A+ | | 3,427,127 | |
| | 220 | | Marina Coast Water District, California, Enterprise Certificate of Participation, Series 2006, 5.000%, 6/01/31 – NPFG Insured | | 6/16 at 100.00 | AA– | | 230,580 | |
| | 1,500 | | Placerville Public Financing Authority, California, Wastewater System Refinancing and Improvement Project Revenue Bonds, Series 2006, 5.000%, 9/01/34 – SYNCORA GTY Insured | | 9/16 at 100.00 | N/R | | 1,422,375 | |
| | 18,870 | | Total Water and Sewer | | | | | 20,137,431 | |
| $ | 127,129 | | Total Investments (cost $126,573,381) – 134.7% | | | | | 138,048,126 | |
| | | | Variable Rate Demand Preferred Shares, at Liquidation Value – (41.7)% (6) | | | | | (42,700,000 | ) |
| | | | Other Assets Less Liabilities – 7.0% | | | | | 7,132,797 | |
| | | | Net Assets Applicable to Common Shares – 100% | | | | $ | 102,480,923 | |
| | | The Fund intends to invest at least 80% of its net assets in municipal securities that are covered by insurance guaranteeing the timely payment of principal and interest. See Notes to Financial Statements, Footnote 1 – General Information and Significant Accounting Policies, Insurance for more information. |
| (1) | | All percentages shown in the Portfolio of Investments are based on net assets applicable to Common shares unless otherwise noted. |
| (2) | | Optional Call Provisions (not covered by the report of independent registered public accounting firm): Dates (month and year) and prices of the earliest optional call or redemption. There may be other call provisions at varying prices at later dates. Certain mortgage-backed securities may be subject to periodic principal paydowns. |
| (3) | | Ratings (not covered by the report of independent registered public accounting firm): Using the highest of Standard & Poor’s Group (“Standard & Poor’s”), Moody’s Investors Service, Inc. (“Moody’s”) or Fitch, Inc. (“Fitch”) rating. Ratings below BBB by Standard & Poor’s, Baa by Moody’s or BBB by Fitch are considered to be below investment grade. Holdings designated N/R are not rated by any of these national rating agencies. |
| (4) | | Investment, or portion of investment, has been pledged to collaterize the net payment obligations for investments in inverse floating rate transactions. |
| (5) | | Backed by an escrow or trust containing sufficient U.S. Government or U.S. Government agency securities, which ensure the timely payment of principal and interest. Certain bonds backed by U.S. Government or agency securities are regarded as having an implied rating equal to the rating of such securities. |
| (6) | | Variable Rate Demand Preferred Shares, at Liquidation Value as a percentage of Total Investments is 30.9%. |
| N/R | | Not rated. |
| (ETM) | | Escrowed to maturity. |
| (IF) | | Inverse floating rate investment. |
See accompanying notes to financial statements.
| | | Nuveen Insured California Premium Income Municipal Fund 2, Inc. |
| NCL | | Portfolio of Investments |
| | Principal | | | | Optional Call | | | | |
| | Amount (000) | | Description (1) | | Provisions (2) | Ratings (3) | | Value | |
| | | | Consumer Staples – 2.7% (1.9% of Total Investments) | | | | | | |
| $ | 7,500 | | Golden State Tobacco Securitization Corporation, California, Tobacco Settlement Asset-Backed Bonds, Series 2007A-1, 5.125%, 6/01/47 | | 6/17 at 100.00 | B– | $ | 5,192,400 | |
| | | | Education and Civic Organizations – 4.5% (3.1% of Total Investments) | | | | | | |
| | 750 | | California Educational Facilities Authority, Student Loan Revenue Bonds, Cal Loan Program, Series 2001A, 5.400%, 3/01/21 – NPFG Insured (Alternative Minimum Tax) | | 9/12 at 100.00 | Baa2 | | 750,870 | |
| | 1,500 | | California State University, Systemwide Revenue Bonds, Series 2005A, 5.000%, 11/01/25 – AMBAC Insured | | 5/15 at 100.00 | Aa2 | | 1,671,855 | |
| | 6,000 | | University of California, Revenue Bonds, Multi-Purpose Project Series 2003A, 5.000%, 5/15/27 – AMBAC Insured (UB) | | 5/13 at 100.00 | Aa1 | | 6,294,480 | |
| | 8,250 | | Total Education and Civic Organizations | | | | | 8,717,205 | |
| | | | Health Care – 4.8% (3.4% of Total Investments) | | | | | | |
| | 1,410 | | California Statewide Communities Development Authority, Revenue Bonds, St. Joseph Health System, Trust 2554, 18.382%, 7/01/47 – AGM Insured (IF) | | 7/18 at 100.00 | AA– | | 1,725,953 | |
| | 4,690 | | Santa Clara County Financing Authority, California, Insured Revenue Bonds, El Camino Hospital, Series 2007A, 5.750%, 2/01/41 – AMBAC Insured | | 8/17 at 100.00 | A+ | | 5,005,121 | |
| | 2,000 | | The Regents of the University of California, Medical Center Pooled Revenue Bonds, Series 2007A, 4.500%, 5/15/37 – NPFG Insured | | 5/15 at 101.00 | Aa2 | | 2,017,060 | |
| | 650 | | University of California, Hospital Revenue Bonds, UCLA Medical Center, Series 2004A, 5.500%, 5/15/18 – AMBAC Insured | | 5/12 at 101.00 | N/R | | 660,485 | |
| | 8,750 | | Total Health Care | | | | | 9,408,619 | |
| | | | Housing/Single Family – 0.6% (0.4% of Total Investments) | | | | | | |
| | 190 | | California Housing Finance Agency, Home Mortgage Revenue Bonds, Series 2006H, 5.750%, 8/01/30 – FGIC Insured (Alternative Minimum Tax) | | 2/16 at 100.00 | BBB | | 190,129 | |
| | 1,060 | | California Housing Finance Agency, Home Mortgage Revenue Bonds, Series 2006K, 5.500%, 2/01/42 – AMBAC Insured (Alternative Minimum Tax) | | 2/16 at 100.00 | N/R | | 1,070,240 | |
| | 1,250 | | Total Housing/Single Family | | | | | 1,260,369 | |
| | | | Long-Term Care – 1.4% (1.0% of Total Investments) | | | | | | |
| | 1,575 | | California Health Facilities Financing Authority, Insured Revenue Bonds, California-Nevada Methodist Homes, Series 2006, 5.000%, 7/01/36 | | 7/16 at 100.00 | A– | | 1,596,641 | |
| | 1,000 | | California Health Facilities Financing Authority, Insured Revenue Bonds, Community Program for Persons with Developmental Disabilities, Series 2011A, 6.250%, 2/01/26 | | No Opt. Call | A– | | 1,167,650 | |
| | 2,575 | | Total Long-Term Care | | | | | 2,764,291 | |
| | | | Tax Obligation/General – 30.8% (21.4% of Total Investments) | | | | | | |
| | 1,425 | | Bassett Unified School District, Los Angeles County, California, General Obligation Bonds, Series 2006B, 5.250%, 8/01/30 – FGIC Insured | | 8/16 at 100.00 | A– | | 1,511,013 | |
| | 6,000 | | California State, General Obligation Bonds, Various Purpose Series 2010, 6.000%, 3/01/33 | | 3/20 at 100.00 | A1 | | 7,194,599 | |
| | 1,000 | | California State, General Obligation Bonds, Various Purpose Series 2011, 5.250%, 9/01/25 | �� | No Opt. Call | A1 | | 1,191,080 | |
| | 4,200 | | Coast Community College District, Orange County, California, General Obligation Bonds, Series 2006C, 0.000%, 8/01/31 – AGM Insured | | 8/18 at 100.00 | Aa1 | | 4,001,508 | |
| | 2,500 | | Corona-Norco Unified School District, Riverside County, California, General Obligation Bonds, Election 2006 Series 2009B, 5.375%, 2/01/34 – AGC Insured | | 8/18 at 100.00 | Aa2 | | 2,792,575 | |
| | | | East Side Union High School District, Santa Clara County, California, General Obligation Bonds, 2008 Election Series 2010B: | | | | | | |
| | 3,490 | | 5.000%, 8/01/27 – AGC Insured | | 8/19 at 100.00 | AA– | | 3,849,400 | |
| | 3,545 | | 5.000%, 8/01/28 – AGC Insured | | 8/19 at 100.00 | AA– | | 3,891,063 | |
| | 3,110 | | 5.000%, 8/01/29 – AGC Insured | | 8/19 at 100.00 | AA– | | 3,394,472 | |
| | 2,210 | | Fontana Unified School District, San Bernardino County, California, General Obligation Bonds, Trust 2668, 9.515%, 2/01/16 – AGM Insured (IF) | | No Opt. Call | AA– | | 2,769,042 | |
| | | Nuveen Insured California Premium Income Municipal Fund 2, Inc. (continued) |
| NCL | | Portfolio of Investments |
February 29, 2012
| | Principal | | | | Optional Call | | | | |
| | Amount (000) | | Description (1) | | Provisions (2) | Ratings (3) | | Value | |
| | | | Tax Obligation/General (continued) | | | | | | |
| $ | 1,255 | | Los Angeles Community College District, Los Angeles County, California, General Obligation Bonds, Series 2005A, 5.000%, 8/01/24 – AGM Insured | | 8/15 at 100.00 | Aa1 | $ | 1,397,468 | |
| | 4,000 | | Los Angeles Unified School District, Los Angeles County, California, General Obligation Bonds, Series 2007A, 4.500%, 7/01/24 – AGM Insured | | 7/17 at 100.00 | Aa2 | | 4,441,320 | |
| | | | Los Rios Community College District, Sacramento, El Dorado and Yolo Counties, California, General Obligation Bonds, Series 2002C: | | | | | | |
| | 2,110 | | 5.000%, 8/01/21 – AGM Insured (UB) | | 8/14 at 102.00 | Aa2 | | 2,346,700 | |
| | 3,250 | | 5.000%, 8/01/22 – AGM Insured (UB) | | 8/14 at 102.00 | Aa2 | | 3,627,098 | |
| | 3,395 | | 5.000%, 8/01/23 – AGM Insured (UB) | | 8/14 at 102.00 | Aa2 | | 3,782,811 | |
| | 1,270 | | Merced City School District, Merced County, California, General Obligation Bonds, Series 2004, 5.000%, 8/01/22 – FGIC Insured | | 8/13 at 100.00 | A | | 1,336,878 | |
| | 305 | | Roseville Joint Union High School District, Placer County, California, General Obligation Bonds, Series 2006B, 5.000%, 8/01/27 – FGIC Insured | | 8/15 at 100.00 | AA– | | 337,153 | |
| | 2,500 | | Sacramento City Unified School District, Sacramento County, California, General Obligation Bonds, Series 2005, 5.000%, 7/01/27 – NPFG Insured | | 7/15 at 100.00 | Aa3 | | 2,750,375 | |
| | 1,125 | | San Diego Unified School District, San Diego County, California, General Obligation Bonds, Election of 1998, Series 1999A, 0.000%, 7/01/21 – FGIC Insured | | No Opt. Call | Aa2 | | 805,084 | |
| | 2,000 | | San Francisco Community College District, California, General Obligation Bonds, Series 2002A, 5.000%, 6/15/26 – FGIC Insured | | 6/12 at 100.00 | Aa2 | | 2,020,840 | |
| | 2,000 | | San Jacinto Unified School District, Riverside County, California, General Obligation Bonds, Series 2007, 5.250%, 8/01/32 – AGM Insured | | No Opt. Call | AA– | | 2,172,980 | |
| | 3,770 | | Stockton Unified School District, San Joaquin County, California, General Obligation Bonds, Election 2008 Series 2011D, 0.000%, 8/01/50 – AGM Insured | | 8/37 at 100.00 | AA– | | 1,748,451 | |
| | 2,445 | | Washington Unified School District, Yolo County, California, General Obligation Bonds, Series 2004A, 5.000%, 8/01/21 – FGIC Insured | | 8/13 at 100.00 | A+ | | 2,566,101 | |
| | 56,905 | | Total Tax Obligation/General | | | | | 59,928,011 | |
| | | | Tax Obligation/Limited – 63.7% (44.3% of Total Investments) | | | | | | |
| | | | Anaheim Public Finance Authority, California, Subordinate Lease Revenue Bonds, Public Improvement Project, Series 1997C: | | | | | | |
| | 5,130 | | 0.000%, 9/01/18 – AGM Insured | | No Opt. Call | AA– | | 4,111,233 | |
| | 8,000 | | 0.000%, 9/01/21 – AGM Insured | | No Opt. Call | AA– | | 5,313,200 | |
| | 2,235 | | Antioch Public Financing Authority, California, Lease Revenue Refunding Bonds, Municipal Facilities Project, Refunding Series 2002A, 5.500%, 1/01/32 – NPFG Insured | | 7/12 at 100.00 | A | | 2,236,721 | |
| | | | California Infrastructure and Economic Development Bank, Revenue Bonds, North County Center for Self-Sufficiency Corporation, Series 2004: | | | | | | |
| | 1,535 | | 5.000%, 12/01/20 – AMBAC Insured | | 12/13 at 100.00 | AA | | 1,650,002 | |
| | 1,780 | | 5.000%, 12/01/23 – AMBAC Insured | | 12/13 at 100.00 | AA | | 1,911,738 | |
| | 3,725 | | California State Public Works Board, Lease Revenue Bonds, Department of Corrections & Rehabilitation, Series 2005J, 5.000%, 1/01/17 – AMBAC Insured | | 1/16 at 100.00 | A2 | | 4,174,719 | |
| | 4,000 | | California State Public Works Board, Lease Revenue Bonds, Various Capital Projects, Series 2009G-1, 5.750%, 10/01/30 | | 10/19 at 100.00 | A2 | | 4,542,360 | |
| | 380 | | Capistrano Unified School District, Orange County, California, Special Tax Bonds, Community Facilities District, Series 2005, 5.000%, 9/01/24 – FGIC Insured | | 9/15 at 100.00 | BBB | | 390,062 | |
| | 7,000 | | Chula Vista Public Financing Authority, California, Pooled Community Facility District Assessment Revenue Bonds, Series 2005A, 4.500%, 9/01/27 – NPFG Insured | | 9/15 at 100.00 | BBB | | 6,669,040 | |
| | 1,430 | | Cloverdale Community Development Agency, California, Tax Allocation Refunding Bonds, Cloverdale Redevelopment Project Series 2006, 5.000%, 8/01/36 – AMBAC Insured | | No Opt. Call | A– | | 1,407,149 | |
| | 575 | | Dinuba Redevelopment Agency, California, Tax Allocation Bonds, Merged City of Dinuba Redevelopment Project and Dinuba Redevelopment Project 2, As Amended, Refunding Series 2001, 5.000%, 9/01/31 – NPFG Insured | | 9/12 at 101.00 | A– | | 577,352 | |
| | 4,810 | | El Monte, California, Senior Lien Certificates of Participation, Department of Public Services Facility Phase II, Series 2001, 5.000%, 1/01/21 – AMBAC Insured | | 7/12 at 100.00 | A2 | | 4,816,638 | |
| | Principal | | | | Optional Call | | | | |
| | Amount (000) | | Description (1) | | Provisions (2) | Ratings (3) | | Value | |
| | | | Tax Obligation/Limited (continued) | | | | | | |
| $ | 8,280 | | Fontana Public Financing Authority, California, Tax Allocation Revenue Bonds, North Fontana Redevelopment Project, Series 2005A, 5.000%, 10/01/32 – AMBAC Insured | | 10/15 at 100.00 | A | $ | 8,425,062 | |
| | | | Golden State Tobacco Securitization Corporation, California, Enhanced Tobacco Settlement Asset-Backed Revenue Bonds, Series 2005A: | | | | | | |
| | 7,250 | | 5.000%, 6/01/35 – FGIC Insured | | 6/15 at 100.00 | AA– | | 7,310,103 | |
| | 7,500 | | 5.000%, 6/01/45 – AGC Insured | | 6/15 at 100.00 | AA– | | 7,552,050 | |
| | 6,215 | | Golden State Tobacco Securitization Corporation, California, Enhanced Tobacco Settlement Asset-Backed Revenue Bonds, Tender Option Bonds Trust 4686, 8.957%, 6/01/45 – AGC Insured (IF) (4) | | 6/15 at 100.00 | AA– | | 6,301,264 | |
| | 2,000 | | Golden State Tobacco Securitization Corporation, California, Enhanced Tobacco Settlement Revenue Bonds, Tender Option Bonds Trust 2040, 10.375%, 6/01/45 – FGIC Insured (IF) | | 6/15 at 100.00 | A2 | | 2,020,100 | |
| | 875 | | Hesperia Public Financing Authority, California, Redevelopment and Housing Projects Tax Allocation Bonds, Series 2007A, 5.000%, 9/01/37 – SYNCORA GTY Insured | | 9/17 at 100.00 | Ba1 | | 659,033 | |
| | 1,700 | | Hesperia Unified School District, San Bernardino County, California, Certificates of Participation, Capital Improvement, Series 2007, 5.000%, 2/01/41 – AMBAC Insured | | 2/17 at 100.00 | A– | | 1,683,000 | |
| | 710 | | Inglewood Redevelopment Agency, California, Tax Allocation Bonds, Merged Redevelopment Project, Subordinate Lien Series 2007A-1, 5.000%, 5/01/25 – AMBAC Insured | | 5/17 at 100.00 | BBB+ | | 701,856 | |
| | 5,000 | | La Quinta Redevelopment Agency, California, Tax Allocation Refunding Bonds, Redevelopment Project Area 1, Series 1998, 5.200%, 9/01/28 – AMBAC Insured | | 9/12 at 100.00 | A+ | | 5,030,600 | |
| | 2,185 | | Los Angeles Community Redevelopment Agency, California, Lease Revenue Bonds, Manchester Social Services Project, Series 2005, 5.000%, 9/01/37 – AMBAC Insured | | 9/15 at 100.00 | A1 | | 2,211,220 | |
| | 1,000 | | Los Angeles Community Redevelopment Agency, California, Tax Allocation Bonds, Bunker Hill Project, Series 2004A, 5.000%, 12/01/20 – AGM Insured | | 12/14 at 100.00 | AA– | | 1,099,240 | |
| | 4,000 | | Los Angeles, California, Certificates of Participation, Municipal Improvement Corporation, Series 2003AW, 5.000%, 6/01/33 – AMBAC Insured | | 6/13 at 100.00 | A+ | | 4,072,600 | |
| | 3,000 | | Los Angeles, California, Municipal Improvement Corporation, Lease Revenue Bonds, Police Headquarters, Series 2006A, 4.750%, 1/01/31 – FGIC Insured | | 1/17 at 100.00 | A+ | | 3,106,620 | |
| | 6,120 | | Moreno Valley Community Redevelopment Agency, California, Tax Allocation Bonds, Series 2007A, 5.000%, 8/01/38 – AMBAC Insured | | 8/17 at 100.00 | A– | | 5,983,708 | |
| | 2,810 | | Oakland Joint Powers Financing Authority, California, Lease Revenue Bonds, Administration Building Projects, Series 2008B, 5.000%, 8/01/21 – AGC Insured | | 8/18 at 100.00 | AA– | | 3,098,728 | |
| | 1,000 | | Palm Springs Financing Authority, California, Lease Revenue Bonds, Convention Center Project, Refunding Series 2004A, 5.500%, 11/01/35 – NPFG Insured | | 11/14 at 102.00 | A | | 1,047,390 | |
| | 4,140 | | Plumas County, California, Certificates of Participation, Capital Improvement Program, Series 2003A, 5.000%, 6/01/28 – AMBAC Insured | | 6/13 at 101.00 | A | | 4,216,093 | |
| | 390 | | Poway Redevelopment Agency, California, Tax Allocation Refunding Bonds, Paguay Redevelopment Project, Series 2000, 5.750%, 6/15/33 – NPFG Insured | | 12/12 at 100.00 | BBB | | 392,172 | |
| | 325 | | Rialto Redevelopment Agency, California, Tax Allocation Bonds, Merged Project Area, Series 2005A, 5.000%, 9/01/35 – SYNCORA GTY Insured | | 9/15 at 100.00 | A– | | 320,798 | |
| | 1,000 | | Rocklin Unified School District, Placer County, California, Special Tax Bonds, Community Facilities District 1, Series 2004, 5.000%, 9/01/25 – NPFG Insured | | 9/13 at 100.00 | A– | | 1,009,260 | |
| | 2,500 | | Roseville Financing Authority, California, Special Tax Revenue Bonds, Series 2007A, 5.000%, 9/01/33 – AMBAC Insured | | 9/17 at 100.00 | N/R | | 2,388,975 | |
| | 405 | | Roseville, California, Certificates of Participation, Public Facilities, Series 2003A, 5.000%, 8/01/25 – AMBAC Insured | | 8/13 at 100.00 | AA– | | 413,590 | |
| | 4,295 | | San Bernardino Joint Powers Financing Authority, California, Certificates of Participation Refunding, Police Station Financing Project, Series 1999, 5.500%, 9/01/20 – NPFG Insured | | 9/12 at 100.00 | BBB | | 4,300,025 | |
| | | | San Jose Redevelopment Agency, California, Tax Allocation Bonds, Merged Project Area, Series 2005A: | | | | | | |
| | 3,310 | | 5.000%, 8/01/20 – NPFG Insured | | No Opt. Call | BBB | | 3,377,623 | |
| | 1,500 | | 5.000%, 8/01/28 – NPFG Insured | | 8/15 at 100.00 | BBB | | 1,459,005 | |
| | 5,510 | | Sweetwater Union High School District Public Financing Authority, California, Special Tax Revenue Bonds, Series 2005A, 5.000%, 9/01/28 – AGM Insured | | 9/15 at 100.00 | AA– | | 5,727,865 | |
| | | Nuveen Insured California Premium Income Municipal Fund 2, Inc. (continued) |
| NCL | | Portfolio of Investments |
February 29, 2012
| | Principal | | | | Optional Call | | | | |
| | Amount (000) | | Description (1) | | Provisions (2) | Ratings (3) | | Value | |
| | | | Tax Obligation/Limited (continued) | | | | | | |
| $ | 1,205 | | Tustin Community Redevelopment Agency, California, Tax Allocation Housing Bonds Series 2010, 5.000%, 9/01/30 – AGM Insured | | No Opt. Call | AA– | $ | 1,307,883 | |
| | 1,020 | | Washington Unified School District, Yolo County, California, Certificates of Participation, Series 2007, 5.125%, 8/01/37 – AMBAC Insured | | 8/17 at 100.00 | A | | 1,060,025 | |
| | 125,845 | | Total Tax Obligation/Limited | | | | | 124,076,102 | |
| | | | Transportation – 4.6% (3.2% of Total Investments) | | | | | | |
| | 6,500 | | Foothill/Eastern Transportation Corridor Agency, California, Toll Road Revenue Refunding Bonds, Series 1999, 0.000%, 1/15/18 – NPFG Insured | | 4/12 at 72.76 | BBB | | 4,685,070 | |
| | 4,000 | | Orange County Transportation Authority, California, Toll Road Revenue Bonds, 91 Express Lanes Project, Series 2003A, 5.000%, 8/15/18 – AMBAC Insured | | 8/13 at 100.00 | A1 | | 4,203,280 | |
| | 10,500 | | Total Transportation | | | | | 8,888,350 | |
| | | | U.S. Guaranteed – 2.6% (1.8% of Total Investments) (5) | | | | | | |
| | 1,495 | | Central Unified School District, Fresno County, California, General Obligation Bonds, Series 1993, 5.625%, 3/01/18 – AMBAC Insured (ETM) | | 9/12 at 100.00 | N/R (5) | | 1,534,961 | |
| | 2,750 | | Riverside County, California, GNMA Mortgage-Backed Securities Program Single Family Mortgage Revenue Bonds, Series 1987B, 8.625%, 5/01/16 (Alternative Minimum Tax) (ETM) | | No Opt. Call | Aaa | | 3,572,305 | |
| | 4,245 | | Total U.S. Guaranteed | | | | | 5,107,266 | |
| | | | Utilities – 7.9% (5.5% of Total Investments) | | | | | | |
| | 670 | | Merced Irrigation District, California, Electric System Revenue Bonds, Series 2005, 5.125%, 9/01/31 – SYNCORA GTY Insured | | 9/15 at 100.00 | N/R | | 666,322 | |
| | 100 | | Sacramento City Financing Authority, California, Capital Improvement Revenue Bonds, Solid Waste and Redevelopment Projects, Series 1999, 5.800%, 12/01/19 – AMBAC Insured | | 6/12 at 100.00 | N/R | | 100,130 | |
| | 1,950 | | Salinas Valley Solid Waste Authority, California, Revenue Bonds, Series 2002, 5.250%, 8/01/27 – AMBAC Insured (Alternative Minimum Tax) | | 8/12 at 100.00 | A+ | | 1,955,733 | |
| | | | Santa Clara, California, Subordinate Electric Revenue Bonds, Series 2003A: | | | | | | |
| | 2,800 | | 5.000%, 7/01/24 – NPFG Insured | | 7/13 at 100.00 | A1 | | 2,910,936 | |
| | 5,000 | | 5.000%, 7/01/28 – NPFG Insured | | 7/13 at 100.00 | A1 | | 5,121,150 | |
| | 4,000 | | Southern California Public Power Authority, California, Milford Wind Corridor Phase I Revenue Bonds, Series 2010-1, 5.000%, 7/01/28 | | No Opt. Call | AA– | | 4,598,680 | |
| | 14,520 | | Total Utilities | | | | | 15,352,951 | |
| | | | Water and Sewer – 20.2% (14.0% of Total Investments) | | | | | | |
| | 1,100 | | Atwater Public Financing Authority, California, Wastewater Revenue Bonds, Tender Option Bond Trust 3145, 18.131%, 5/01/40 – AGM Insured (IF) | | 5/19 at 100.00 | AA– | | 1,427,052 | |
| | 2,000 | | El Dorado Irrigation District, California, Water and Sewer Certificates of Participation, Series 2004A, 5.000%, 3/01/21 – FGIC Insured | | 3/14 at 100.00 | A1 | | 2,113,920 | |
| | 750 | | Fortuna Public Finance Authority, California, Water Revenue Bonds, Series 2006, 5.000%, 10/01/36 – AGM Insured | | 10/16 at 100.00 | AA– | | 785,775 | |
| | 460 | | Healdsburg Public Financing Authority, California, Wastewater Revenue Bonds, Series 2006, 5.000%, 4/01/36 – NPFG Insured | | 4/16 at 100.00 | AA– | | 478,497 | |
| | 2,700 | | Los Angeles County Sanitation Districts Financing Authority, California, Senior Revenue Bonds, Capital Projects, Series 2003A, 5.000%, 10/01/21 – AGM Insured | | 10/13 at 100.00 | AA+ | | 2,883,789 | |
| | 2,000 | | Los Angeles, California, Wastewater System Revenue Bonds, Series 2005A, 4.500%, 6/01/29 – NPFG Insured | | 6/15 at 100.00 | AA | | 2,093,900 | |
| | 430 | | Marina Coast Water District, California, Enterprise Certificate of Participation, Series 2006, 5.000%, 6/01/31 – NPFG Insured | | 6/16 at 100.00 | AA– | | 450,679 | |
| | 12,000 | | Orange County Sanitation District, California, Certificates of Participation, Series 2003, 5.000%, 2/01/33 – FGIC Insured (UB) | | 8/13 at 100.00 | AAA | | 12,555,720 | |
| | 1,520 | | San Buenaventura, California, Water Revenue Certificates of Participation, Series 2004, 5.000%, 10/01/25 – AMBAC Insured | | 10/14 at 100.00 | AA | | 1,589,342 | |
| | Principal | | | | Optional Call | | | | |
| | Amount (000) | | Description (1) | | Provisions (2) | Ratings (3) | | Value | |
| | | | Water and Sewer (continued) | | | | | | |
| $ | 1,000 | | San Diego County Water Authority, California, Water Revenue Certificates of Participation, Series 2008A, 5.000%, 5/01/38 – AGM Insured | | 5/18 at 100.00 | AA+ | $ | 1,077,100 | |
| | 3,675 | | San Dieguito Water District, California, Water Revenue Bonds, Refunding Series 2004, 5.000%, 10/01/23 – FGIC Insured | | 10/14 at 100.00 | AA+ | | 4,019,054 | |
| | | | Santa Clara Valley Water District, California, Certificates of Participation, Series 2004A: | | | | | | |
| | 1,400 | | 5.000%, 2/01/19 – FGIC Insured | | 2/14 at 100.00 | AA+ | | 1,514,450 | |
| | 445 | | 5.000%, 2/01/20 – FGIC Insured | | 2/14 at 100.00 | AA+ | | 480,400 | |
| | 465 | | 5.000%, 2/01/21 – FGIC Insured | | 2/14 at 100.00 | AA+ | | 501,991 | |
| | 2,500 | | West Basin Municipal Water District, California, Revenue Certificates of Participation, Series 2003A, 5.000%, 8/01/30 – NPFG Insured | | 8/13 at 100.00 | Aa2 | | 2,558,675 | |
| | | | Yorba Linda Water District, California, Certificates of Participation, Highland Reservoir Renovation, Series 2003: | | | | | | |
| | 2,010 | | 5.000%, 10/01/28 – FGIC Insured | | 10/13 at 100.00 | AA+ | | 2,124,912 | |
| | 2,530 | | 5.000%, 10/01/33 – FGIC Insured | | 10/13 at 100.00 | AA+ | | 2,674,640 | |
| | 36,985 | | Total Water and Sewer | | | | | 39,329,896 | |
| $ | 277,325 | | Total Investments (cost $263,273,073) – 143.8% | | | | | 280,025,460 | |
| | | | Floating Rate Obligations – (9.2)% | | | | | (17,880,000 | ) |
| | | | Variable Rate Demand Preferred Shares, at Liquidation Value – (38.0)% (6) | | | | | (74,000,000 | ) |
| | | | Other Assets Less Liabilities – 3.4% | | | | | 6,566,572 | |
| | | | Net Assets Applicable to Common Shares – 100% | | | | $ | 194,712,032 | |
| | | The Fund intends to invest at least 80% of its net assets in municipal securities that are covered by insurance guaranteeing the timely payment of principal and interest. See Notes to Financial Statements, Footnote 1 – General Information and Significant Accounting Policies, Insurance for more information. |
| (1) | | All percentages shown in the Portfolio of Investments are based on net assets applicable to Common shares unless otherwise noted. |
| (2) | | Optional Call Provisions (not covered by the report of independent registered public accounting firm): Dates (month and year) and prices of the earliest optional call or redemption. There may be other call provisions at varying prices at later dates. Certain mortgage-backed securities may be subject to periodic principal paydowns. |
| (3) | | Ratings (not covered by the report of independent registered public accounting firm): Using the highest of Standard & Poor’s Group (“Standard & Poor’s”), Moody’s Investors Service, Inc. (“Moody’s”) or Fitch, Inc. (“Fitch”) rating. Ratings below BBB by Standard & Poor��s, Baa by Moody’s or BBB by Fitch are considered to be below investment grade. Holdings designated N/R are not rated by any of these national rating agencies. |
| (4) | | Investment, or portion of investment, has been pledged to collaterize the net payment obligations for investments in inverse floating rate transactions. |
| (5) | | Backed by an escrow or trust containing sufficient U.S. Government or U.S. Government agency securities, which ensure the timely payment of principal and interest. Certain bonds backed by U.S. Government or agency securities are regarded as having an implied rating equal to the rating of such securities. |
| (6) | | Variable Rate Demand Preferred Shares, at Liquidation Value as a percentage of Total Investments is 26.4%. |
| N/R | | Not rated. |
| (ETM) | | Escrowed to maturity. |
| (IF) | | Inverse floating rate investment. |
| (UB) | | Underlying bond of an inverse floating rate trust reflected as a financing transaction. See Notes to Financial Statements, Footnote 1 – General Information and Significant Accounting Policies, Inverse Floating Rate Securities for more information. |
See accompanying notes to financial statements.
| | | Nuveen California Premium Income Municipal Fund |
| NCU | | Portfolio of Investments |
| | Principal | | | | Optional Call | | | | |
| | Amount (000) | | Description (1) | | Provisions (2) | Ratings (3) | | Value | |
| | | | Consumer Staples – 6.2% (4.3% of Total Investments) | | | | | | |
| $ | 1,500 | | California County Tobacco Securitization Agency, Tobacco Settlement Asset-Backed Bonds, Alameda County Tobacco Asset Securitization Corporation, Series 2002, 5.750%, 6/01/29 | | 6/12 at 100.00 | Baa1 | $ | 1,480,485 | |
| | 205 | | California County Tobacco Securitization Agency, Tobacco Settlement Asset-Backed Bonds, Sonoma County Tobacco Securitization Corporation, Series 2005, 4.250%, 6/01/21 | | 6/15 at 100.00 | BB+ | | 197,679 | |
| | 2,860 | | California Statewide Financing Authority, Tobacco Settlement Asset-Backed Bonds, Pooled Tobacco Securitization Program, Series 2002A, 5.625%, 5/01/29 | | 5/12 at 100.00 | B2 | | 2,775,544 | |
| | 485 | | Golden State Tobacco Securitization Corporation, California, Tobacco Settlement Asset-Backed Bonds, Series 2007A-1, 5.750%, 6/01/47 | | 6/17 at 100.00 | B– | | 372,543 | |
| | 865 | | Golden State Tobacco Securitization Corporation, California, Tobacco Settlement Asset-Backed Bonds, Series 2007A-2, 0.000%, 6/01/37 | | 6/22 at 100.00 | BB– | | 603,969 | |
| | 5,915 | | Total Consumer Staples | | | | | 5,430,220 | |
| | | | Education and Civic Organizations – 6.2% (4.3% of Total Investments) | | | | | | |
| | 70 | | California Educational Facilities Authority, Revenue Bonds, University of Redlands, Series 2005A, 5.000%, 10/01/35 | | 10/15 at 100.00 | A3 | | 71,483 | |
| | | | California Educational Facilities Authority, Revenue Bonds, University of the Pacific, Series 2006: | | | | | | |
| | 45 | | 5.000%, 11/01/21 | | 11/15 at 100.00 | A2 | | 48,394 | |
| | 60 | | 5.000%, 11/01/25 | | 11/15 at 100.00 | A2 | | 63,686 | |
| | 1,112 | | California State Public Works Board, Lease Revenue Bonds, University of California Regents, Tender Option Bond Trust 1065, 9.214%, 3/01/33 (IF) | | 3/18 at 100.00 | Aa2 | | 1,279,423 | |
| | 2,000 | | California State University, Systemwide Revenue Bonds, Series 2005C, 5.000%, 11/01/27 – NPFG Insured | | 11/15 at 100.00 | Aa2 | | 2,135,000 | |
| | 185 | | California Statewide Communities Development Authority, Charter School Revenue Bonds, Rocketship 4 – Mosaic Elementary Charter School, Series 2011A, 8.500%, 12/01/41 | | 12/21 at 100.00 | N/R | | 194,209 | |
| | 300 | | California Statewide Communities Development Authority, School Facility Revenue Bonds, Alliance College-Ready Public Schools, Series 2011A, 7.000%, 7/01/46 | | 7/21 at 100.00 | N/R | | 317,442 | |
| | 1,245 | | University of California, General Revenue Bonds, Series 2003A, 5.125%, 5/15/17 – AMBAC Insured (UB) | | 5/13 at 100.00 | Aa1 | | 1,316,712 | |
| | 5,017 | | Total Education and Civic Organizations | | | | | 5,426,349 | |
| | | | Health Care – 31.3% (21.9% of Total Investments) | | | | | | |
| | 2,745 | | California Health Facilities Financing Authority, Hospital Revenue Bonds, Downey Community Hospital, Series 1993, 5.750%, 5/15/15 | | 5/12 at 100.00 | N/R | | 2,747,827 | |
| | 335 | | California Health Facilities Financing Authority, Revenue Bonds, Rady Children’s Hospital – San Diego, Series 2011, 5.250%, 8/15/41 | | 8/21 at 100.00 | A2 | | 349,586 | |
| | 3,525 | | California Health Facilities Financing Authority, Revenue Bonds, Sutter Health, Series 2007A, 5.250%, 11/15/46 (UB) | | 11/16 at 100.00 | AA– | | 3,697,302 | |
| | 685 | | California Municipal Financing Authority, Certificates of Participation, Community Hospitals of Central California, Series 2007, 5.250%, 2/01/46 | | 2/17 at 100.00 | BBB | | 680,561 | |
| | 815 | | California Statewide Communities Development Authority, Revenue Bonds, ValleyCare Health System, Series 2007A, 5.125%, 7/15/31 | | 7/17 at 100.00 | N/R | | 749,197 | |
| | 1,740 | | California Statewide Community Development Authority, Revenue Bonds, Daughters of Charity Health System, Series 2005A, 5.250%, 7/01/30 | | 7/15 at 100.00 | BBB | | 1,745,150 | |
| | 730 | | California Statewide Community Development Authority, Revenue Bonds, Kaiser Permanente System, Series 2001C, 5.250%, 8/01/31 | | 8/16 at 100.00 | A+ | | 783,597 | |
| | 3,000 | | California Statewide Community Development Authority, Revenue Bonds, Methodist Hospital Project, Series 2009, 6.750%, 2/01/38 | | 8/19 at 100.00 | Aa2 | | 3,594,390 | |
| | 2,100 | | California Statewide Community Development Authority, Revenue Bonds, Sherman Oaks Health System, Series 1998A, 5.000%, 8/01/22 – AMBAC Insured | | No Opt. Call | A1 | | 2,327,745 | |
| | Principal | | | | Optional Call | | | | |
| | Amount (000) | | Description (1) | | Provisions (2) | Ratings (3) | | Value | |
| | | | Health Care (continued) | | | | | | |
| $ | 377 | | California Statewide Community Development Authority, Revenue Bonds, St. Joseph Health System, Trust 2554, 18.382%, 7/01/47 – AGM Insured (IF) | | 7/18 at 100.00 | AA– | $ | 460,866 | |
| | 1,690 | | California Statewide Community Development Authority, Revenue Bonds, Sutter Health, Series 2005A, 5.000%, 11/15/43 | | 11/15 at 100.00 | AA– | | 1,733,281 | |
| | 760 | | Loma Linda, California, Hospital Revenue Bonds, Loma Linda University Medical Center, Series 2008A, 8.250%, 12/01/38 | | 12/17 at 100.00 | BBB | | 865,838 | |
| | 2,600 | | Marysville, California, Revenue Bonds, The Fremont-Rideout Health Group, Series 2011, 5.250%, 1/01/42 | | 1/21 at 100.00 | A | | 2,730,104 | |
| | 1,450 | | Palomar Pomerado Health Care District, California, Certificates of Participation, Series 2010, 6.000%, 11/01/41 | | 11/20 at 100.00 | Baa3 | | 1,491,282 | |
| | 850 | | San Buenaventura, California, Revenue Bonds, Community Memorial Health System, Series 2011, 7.500%, 12/01/41 | | 12/21 at 100.00 | BB | | 958,426 | |
| | 1,415 | | Santa Clara County Financing Authority, California, Insured Revenue Bonds, El Camino Hospital, Series 2007A, 5.750%, 2/01/41 – AMBAC Insured | | 8/17 at 100.00 | A+ | | 1,510,074 | |
| | 1,000 | | The Regents of the University of California, Medical Center Pooled Revenue Bonds, Series 2009E, 5.000%, 5/15/38 | | 5/17 at 101.00 | Aa2 | | 1,048,570 | |
| | 25,817 | | Total Health Care | | | | | 27,473,796 | |
| | | | Housing/Multifamily – 1.2% (0.8% of Total Investments) | | | | | | |
| | 495 | | California Municipal Finance Authority, Mobile Home Park Revenue Bonds, Caritas Projects Series 2010A, 6.400%, 8/15/45 | | 8/20 at 100.00 | BBB | | 511,553 | |
| | 155 | | California Municipal Finance Authority, Mobile Home Park Revenue Bonds, Caritas Projects Series 2012A, 5.500%, 8/15/47 (WI/DD, Settling 3/13/12) | | 8/22 at 100.00 | BBB | | 153,450 | |
| | 350 | | California Municipal Finance Authority, Mobile Home Park Revenue Bonds, Caritas Projects Series 2012B, 7.250%, 8/15/47 (WI/DD, Settling 3/13/12) | | 8/22 at 100.00 | N/R | | 350,000 | |
| | 1,000 | | Total Housing/Multifamily | | | | | 1,015,003 | |
| | | | Housing/Single Family – 2.8% (2.0% of Total Investments) | | | | | | |
| | 2,360 | | California Housing Finance Agency, California, Home Mortgage Revenue Bonds, Series 2008L, 5.500%, 8/01/38 | | 2/18 at 100.00 | BBB | | 2,380,036 | |
| | 90 | | California Housing Finance Agency, Home Mortgage Revenue Bonds, Series 2006H, 5.750%, 8/01/30 – FGIC Insured (Alternative Minimum Tax) | | 2/16 at 100.00 | BBB | | 90,061 | |
| | 2,450 | | Total Housing/Single Family | | | | | 2,470,097 | |
| | | | Tax Obligation/General – 27.8% (19.5% of Total Investments) | | | | | | |
| | | | California State, General Obligation Bonds, Various Purpose Series 2009: | | | | | | |
| | 1,300 | | 5.500%, 11/01/39 | | 11/19 at 100.00 | A1 | | 1,447,186 | |
| | 2,350 | | 6.000%, 11/01/39 | | 11/19 at 100.00 | A1 | | 2,746,469 | |
| | 1,500 | | California, General Obligation Bonds, Series 2003, 5.000%, 2/01/31 – NPFG Insured | | 2/13 at 100.00 | A1 | | 1,529,880 | |
| | 4,475 | | Coast Community College District, Orange County, California, General Obligation Bonds, Series 2006C, 0.000%, 8/01/31 – AGM Insured | | 8/18 at 100.00 | Aa1 | | 4,263,512 | |
| | 6,000 | | Hartnell Community College District, California, General Obligation Bonds, Series 2006B, 5.000%, 6/01/29 – AGM Insured (UB) | | 6/16 at 100.00 | Aa2 | | 6,484,500 | |
| | 2,240 | | Pomona Unified School District, Los Angeles County, California, General Obligation Refunding Bonds, Series 1997A, 6.150%, 8/01/15 – NPFG Insured | | 8/12 at 102.00 | A | | 2,334,752 | |
| | 15 | | Riverside Community College District, California, General Obligation Bonds, Series 2004A, 5.250%, 8/01/22 – NPFG Insured | | 8/14 at 100.00 | AA | | 16,613 | |
| | 135 | | Roseville Joint Union High School District, Placer County, California, General Obligation Bonds, Series 2006B, 5.000%, 8/01/27 – FGIC Insured | | 8/15 at 100.00 | AA– | | 149,232 | |
| | 1,355 | | San Jose-Evergreen Community College District, Santa Clara County, California, General Obligation Bonds, Series 2005A, 5.000%, 9/01/25 – NPFG Insured | | 9/15 at 100.00 | Aa1 | | 1,528,345 | |
| | 8,345 | | Yosemite Community College District, California, General Obligation Bonds, Capital Appreciation, Election 2004, Series 2010D, 0.000%, 8/01/42 | | No Opt. Call | Aa2 | | 2,788,231 | |
| | 1,000 | | Yuba Community College District, California, General Obligation Bonds, Election 2006 Series 2011C, 5.250%, 8/01/47 | | 8/21 at 100.00 | Aa2 | | 1,098,200 | |
| | 28,715 | | Total Tax Obligation/General | | | | | 24,386,920 | |
| | | Nuveen California Premium Income Municipal Fund (continued) |
| NCU | | Portfolio of Investments |
February 29, 2012
| | Principal | | | | Optional Call | | | | |
| | Amount (000) | | Description (1) | | Provisions (2) | Ratings (3) | | Value | |
| | | | Tax Obligation/Limited – 41.2% (28.8% of Total Investments) | | | | | | |
| $ | 1,000 | | Bell Community Redevelopment Agency, California, Tax Allocation Bonds, Bell Project Area, Series 2003, 5.625%, 10/01/33 – RAAI Insured | | 10/13 at 100.00 | N/R | $ | 870,470 | |
| | | | California Infrastructure and Economic Development Bank, Revenue Bonds, North County Center for Self-Sufficiency Corporation, Series 2004: | | | | | | |
| | 1,695 | | 5.000%, 12/01/22 – AMBAC Insured | | 12/13 at 100.00 | AA | | 1,820,447 | |
| | 1,865 | | 5.000%, 12/01/24 – AMBAC Insured | | 12/13 at 100.00 | AA | | 2,003,029 | |
| | 5,920 | | California State Public Works Board, Lease Revenue Bonds, Department of Veterans Affairs, Southern California Veterans Home – Chula Vista Facility, Series 1999A, 5.600%, 11/01/19 – AMBAC Insured | | 5/12 at 100.00 | A2 | | 5,937,817 | |
| | 1,000 | | California State Public Works Board, Lease Revenue Bonds, Various Capital Projects, Series 2009G-1, 5.750%, 10/01/30 | | 10/19 at 100.00 | A2 | | 1,135,590 | |
| | 2,000 | | California State Public Works Board, Lease Revenue Bonds, Various Capital Projects, Series 2009-I, 6.375%, 11/01/34 | | 11/19 at 100.00 | A2 | | 2,350,000 | |
| | 535 | | California, Economic Recovery Revenue Bonds, Series 2004A, 5.000%, 7/01/15 | | 7/14 at 100.00 | Aa3 | | 588,072 | |
| | 165 | | Capistrano Unified School District, Orange County, California, Special Tax Bonds, Community Facilities District, Series 2005, 5.000%, 9/01/24 – FGIC Insured | | 9/15 at 100.00 | BBB | | 169,369 | |
| | 500 | | Chino Redevelopment Agency, California, Merged Chino Redevelopment Project Area Tax Allocation Bonds, Series 2006, 5.000%, 9/01/38 – AMBAC Insured | | 9/16 at 101.00 | A– | | 483,260 | |
| | 260 | | Dinuba Redevelopment Agency, California, Tax Allocation Bonds, Merged City of Dinuba Redevelopment Project and Dinuba Redevelopment Project 2, As Amended, Refunding Series 2001, 5.000%, 9/01/31 – NPFG Insured | | 9/12 at 101.00 | A– | | 261,063 | |
| | 350 | | Fontana, California, Redevelopment Agency, Jurupa Hills Redevelopment Project, Tax Allocation Refunding Bonds, 1997 Series A, 5.500%, 10/01/27 | | 4/12 at 100.00 | A– | | 350,245 | |
| | 320 | | Inglewood Redevelopment Agency, California, Tax Allocation Bonds, Merged Redevelopment Project, Subordinate Lien Series 2007A-1, 5.000%, 5/01/24 – AMBAC Insured | | 5/17 at 100.00 | BBB+ | | 318,822 | |
| | | | Irvine, California, Unified School District, Community Facilities District Special Tax Bonds, Series 2006A: | | | | | | |
| | 75 | | 5.000%, 9/01/26 | | 9/16 at 100.00 | N/R | | 76,361 | |
| | 175 | | 5.125%, 9/01/36 | | 9/16 at 100.00 | N/R | | 175,243 | |
| | 3,500 | | Livermore Redevelopment Agency, California, Tax Allocation Revenue Bonds, Livermore Redevelopment Project Area, Series 2001A, 5.000%, 8/01/26 – NPFG Insured | | 8/12 at 100.00 | BBB+ | | 3,446,870 | |
| | 310 | | Los Angeles Community Redevelopment Agency, California, Lease Revenue Bonds, Manchester Social Services Project, Series 2005, 5.000%, 9/01/37 – AMBAC Insured | | 9/15 at 100.00 | A1 | | 313,720 | |
| | 2,000 | | Los Angeles, California, Municipal Improvement Corporation, Lease Revenue Bonds, Police Headquarters, Series 2006A, 4.750%, 1/01/31 – FGIC Insured | | 1/17 at 100.00 | A+ | | 2,071,080 | |
| | 475 | | Lynwood Redevelopment Agency, California, Project A Revenue Bonds, Subordinate Lien Series 2011A, 7.250%, 9/01/38 | | 9/21 at 100.00 | A– | | 558,619 | |
| | 3,230 | | Murrieta Redevelopment Agency, California, Tax Allocation Bonds, Series 2005, 5.000%, 8/01/35 – NPFG Insured | | 8/15 at 100.00 | A– | | 3,205,646 | |
| | 170 | | National City Community Redevelopment Agency, California, Tax Allocation Revenue Bonds, National City Redevelopment Project Area, Series 2011, 6.500%, 8/01/24 | | 8/21 at 100.00 | A– | | 196,903 | |
| | 65 | | Novato Redevelopment Agency, California, Tax Allocation Bonds, Hamilton Field Redevelopment Project, Series 2011, 6.750%, 9/01/40 | | 9/21 at 100.00 | A– | | 73,786 | |
| | | | Perris Union High School District Financing Authority, Riverside County, California, Revenue Bonds, Series 2011: | | | | | | |
| | 60 | | 6.000%, 9/01/33 | | No Opt. Call | N/R | | 61,923 | |
| | 135 | | 6.125%, 9/01/41 | | No Opt. Call | N/R | | 139,266 | |
| | 540 | | Pittsburg Redevelopment Agency, California, Tax Allocation Bonds, Los Medanos Community Development Project, Refunding Series 2008A, 6.500%, 9/01/28 | | 9/18 at 100.00 | BBB | | 560,239 | |
| | 210 | | Rancho Santa Fe CSD Financing Authority, California, Revenue Bonds, Superior Lien Series 2011A, 5.750%, 9/01/30 | | 9/21 at 100.00 | BBB+ | | 226,580 | |
| | 155 | | Rialto Redevelopment Agency, California, Tax Allocation Bonds, Merged Project Area, Series 2005A, 5.000%, 9/01/35 – SYNCORA GTY Insured | | 9/15 at 100.00 | A– | | 152,996 | |
| | Principal | | | | Optional Call | | | | |
| | Amount (000) | | Description (1) | | Provisions (2) | Ratings (3) | | Value | |
| | | | Tax Obligation/Limited (continued) | | | | | | |
| $ | 40 | | Riverside County Redevelopment Agency, California, Tax Allocation Bonds, Jurupa Valley Project Area, Series 2011-B, 6.500%, 10/01/25 | | 10/21 at 100.00 | A– | $ | 44,299 | |
| | 190 | | Roseville, California, Certificates of Participation, Public Facilities, Series 2003A, 5.000%, 8/01/25 – AMBAC Insured | | 8/13 at 100.00 | AA– | | 194,030 | |
| | 1,500 | | Sacramento City Financing Authority, California, Lease Revenue Refunding Bonds, Series 1993A, 5.400%, 11/01/20 – NPFG Insured | | No Opt. Call | A1 | | 1,734,345 | |
| | 3,000 | | Sacramento City Financing Authority, California, Lease Revenue Refunding Bonds, Series 1993B, 5.400%, 11/01/20 | | No Opt. Call | A1 | | 3,468,690 | |
| | 2,000 | | San Francisco City and County, California, Certificates of Participation, Multiple Capital Improvement Projects, Series 2009A, 5.200%, 4/01/26 | | 4/19 at 100.00 | AA– | | 2,227,020 | |
| | 30 | | San Francisco Redevelopment Finance Authority, California, Tax Allocation Revenue Bonds, Mission Bay North Redevelopment Project, Series 2011C, 6.750%, 8/01/41 | | 2/21 at 100.00 | A– | | 33,853 | |
| | | | San Francisco Redevelopment Financing Authority, California, Tax Allocation Revenue Bonds, Mission Bay South Redevelopment Project, Series 2011D: | | | | | | |
| | 30 | | 7.000%, 8/01/33 | | 2/21 at 100.00 | BBB | | 34,159 | |
| | 40 | | 7.000%, 8/01/41 | | 2/21 at 100.00 | BBB | | 45,025 | |
| | 275 | | San Jose Redevelopment Agency, California, Tax Allocation Bonds, Merged Area Redevelopment Project, Series 2006C, 5.000%, 8/01/25 – NPFG Insured | | 8/17 at 100.00 | BBB | | 276,026 | |
| | 360 | | San Jose Redevelopment Agency, California, Tax Allocation Bonds, Merged Area Redevelopment Project, Series 2006D, 5.000%, 8/01/23 – AMBAC Insured | | 8/17 at 100.00 | BBB | | 364,072 | |
| | 50 | | Signal Hill Redevelopment Agency, California, Project 1 Tax Allocation Bonds, Series 2011, 7.000%, 10/01/26 | | 4/21 at 100.00 | N/R | | 53,244 | |
| | 95 | | Yorba Linda Redevelopment Agency, Orange County, California, Tax Allocation Revenue Bonds, Yorba Linda Redevelopment Project, Subordinate Lien Series 2011A, 6.000%, 9/01/26 | | 9/21 at 100.00 | A– | | 105,395 | |
| | 34,320 | | Total Tax Obligation/Limited | | | | | 36,127,574 | |
| | | | Transportation – 3.4% (2.4% of Total Investments) | | | | | | |
| | 780 | | Bay Area Toll Authority, California, Revenue Bonds, San Francisco Bay Area Toll Bridge, Series 2006F, 5.000%, 4/01/31 (UB) | | 4/16 at 100.00 | AA | | 877,133 | |
| | 220 | | Bay Area Toll Authority, California, Revenue Bonds, San Francisco Bay Area Toll Bridge, Series 2008, Trust 3211, 13.491%, 10/01/32 (IF) | | 4/18 at 100.00 | AA | | 286,431 | |
| | 2,000 | | Foothill/Eastern Transportation Corridor Agency, California, Toll Road Revenue Bonds, Series 1995A, 5.000%, 1/01/35 | | 7/12 at 100.00 | BBB– | | 1,810,440 | |
| | 3,000 | | Total Transportation | | | | | 2,974,004 | |
| | | | U.S. Guaranteed – 9.9% (7.0% of Total Investments) (4) | | | | | | |
| | 3,000 | | California Infrastructure Economic Development Bank, First Lien Revenue Bonds, San Francisco Bay Area Toll Bridge, Series 2003A, 5.000%, 7/01/22 – AGM Insured (ETM) | | No Opt. Call | Aaa | | 3,895,320 | |
| | 370 | | California, Economic Recovery Revenue Bonds, Series 2004A, 5.000%, 7/01/15 (Pre-refunded 7/01/14) | | 7/14 at 100.00 | Aaa | | 411,007 | |
| | 3,495 | | Orange County Sanitation District, California, Certificates of Participation, Series 2003, 5.250%, 2/01/21 (Pre-refunded 8/01/13) – FGIC Insured | | 8/13 at 100.00 | AAA | | 3,745,801 | |
| | 325 | | San Mateo Union High School District, San Mateo County, California, Certificates of Participation, Phase 1, Series 2007A, 5.000%, 12/15/30 (Pre-refunded 12/15/17) – AMBAC Insured | | 12/17 at 100.00 | AA– (4) | | 400,270 | |
| | 255 | | University of California, General Revenue Bonds, Series 2003A, 5.125%, 5/15/17 (Pre-refunded 5/15/13) – AMBAC Insured (UB) | | 5/13 at 100.00 | Aa1 (4) | | 269,991 | |
| | 7,445 | | Total U.S. Guaranteed | | | | | 8,722,389 | |
| | | | Utilities – 5.6% (4.0% of Total Investments) | | | | | | |
| | 890 | | Long Beach Bond Finance Authority, California, Natural Gas Purchase Revenue Bonds, Series 2007A, 5.500%, 11/15/37 | | No Opt. Call | A– | | 975,805 | |
| | 275 | | Los Angeles Department of Water and Power, California, Power System Revenue Bonds, Series 2003A-2, 5.000%, 7/01/21 – NPFG Insured | | 7/13 at 100.00 | AA– | | 291,242 | |
| | | Nuveen California Premium Income Municipal Fund (continued) |
| NCU | | Portfolio of Investments |
February 29, 2012
| | Principal | | | | Optional Call | | | | |
| | Amount (000) | | Description (1) | | Provisions (2) | Ratings (3) | | Value | |
| | | | Utilities (continued) | | | | | | |
| $ | 295 | | Merced Irrigation District, California, Electric System Revenue Bonds, Series 2005, 5.125%, 9/01/31 – SYNCORA GTY Insured | | 9/15 at 100.00 | N/R | $ | 293,380 | |
| | 3,320 | | Sacramento Municipal Utility District, California, Electric Revenue Refunding Bonds, Series 2002Q, 5.250%, 8/15/20 – AGM Insured | | No Opt. Call | AA– | | 3,385,836 | |
| | 4,780 | | Total Utilities | | | | | 4,946,263 | |
| | | | Water and Sewer – 7.2% (5.0% of Total Investments) | | | | | | |
| | 1,125 | | Burbank, California, Wastewater System Revenue Bonds, Series 2004A, 5.000%, 6/01/23 – AMBAC Insured | | 6/14 at 100.00 | AA+ | | 1,190,340 | |
| | 205 | | Healdsburg Public Financing Authority, California, Wastewater Revenue Bonds, Series 2006, 5.000%, 4/01/36 – NPFG Insured | | 4/16 at 100.00 | AA– | | 213,243 | |
| | 670 | | Metropolitan Water District of Southern California, Waterworks Revenue Bonds, Tender Option Bond Trust 09-8B, 18.162%, 7/01/35 (IF) (5) | | 7/19 at 100.00 | AAA | | 1,010,280 | |
| | 1,500 | | Orange County Water District, California, Revenue Certificates of Participation, Tender Option Bond Trust 11782-1, 17.835%, 2/15/35 (IF) | | 8/19 at 100.00 | AAA | | 2,092,620 | |
| | 1,795 | | Woodbridge Irrigation District, California, Certificates of Participation, Water Systems Project, Series 2003, 5.500%, 7/01/33 | | 7/13 at 100.00 | A+ | | 1,814,458 | |
| | 5,295 | | Total Water and Sewer | | | | | 6,320,941 | |
| $ | 123,754 | | Total Investments (cost $115,646,263) – 142.8% | | | | | 125,293,556 | |
| | | | Floating Rate Obligations – (7.6)% | | | | | (6,650,000 | ) |
| | | | MuniFund Term Preferred Shares, at Liquidation Value – (40.2)% (6) | | | | | (35,250,000 | ) |
| | | | Other Assets Less Liabilities – 5.0% | | | | | 4,361,582 | |
| | | | Net Assets Applicable to Common Shares – 100% | | | | $ | 87,755,138 | |
| (1) | | All percentages shown in the Portfolio of Investments are based on net assets applicable to Common shares unless otherwise noted. |
| (2) | | Optional Call Provisions (not covered by the report of independent registered public accounting firm): Dates (month and year) and prices of the earliest optional call or redemption. There may be other call provisions at varying prices at later dates. Certain mortgage-backed securities may be subject to periodic principal paydowns. |
| (3) | | Ratings (not covered by the report of independent registered public accounting firm): Using the highest of Standard & Poor’s Group (“Standard & Poor’s”), Moody’s Investors Service, Inc. (“Moody’s”) or Fitch, Inc. (“Fitch”) rating. Ratings below BBB by Standard & Poor’s, Baa by Moody’s or BBB by Fitch are considered to be below investment grade. Holdings designated N/R are not rated by any of these national rating agencies. |
| (4) | | Backed by an escrow or trust containing sufficient U.S. Government or U.S. Government agency securities, which ensure the timely payment of principal and interest. Certain bonds backed by U.S. Government or agency securities are regarded as having an implied rating equal to the rating of such securities. |
| (5) | | Investment, or portion of investment, has been pledged to collaterize the net payment obligations for investments in inverse floating rate transactions. |
| (6) | | MuniFund Term Preferred Shares, at Liquidation Value as a percentage of Total Investments is 28.1%. |
| N/R | | Not rated. |
| WI/DD | | Purchased on a when-issued or delayed delivery basis. |
| (ETM) | | Escrowed to maturity. |
| (IF) | | Inverse floating rate investment. |
| (UB) | | Underlying bond of an inverse floating rate trust reflected as a financing transaction. See Notes to Financial Statements, Footnote 1 – General Information and Significant Accounting Policies, Inverse Floating Rate Securities for more information. |
See accompanying notes to financial statements.
| | | Nuveen California Dividend Advantage Municipal Fund |
| NAC | | Portfolio of Investments |
| | Principal | | | | Optional Call | | | | |
| | Amount (000) | | Description (1) | | Provisions (2) | Ratings (3) | | Value | |
| | | | Consumer Staples – 7.0% (4.8% of Total Investments) | | | | | | |
| $ | 865 | | California County Tobacco Securitization Agency, Tobacco Settlement Asset-Backed Bonds, Sonoma County Tobacco Securitization Corporation, Series 2005, 4.250%, 6/01/21 | | 6/15 at 100.00 | BB+ | $ | 834,111 | |
| | | | Golden State Tobacco Securitization Corporation, California, Tobacco Settlement Asset-Backed Bonds, Series 2007A-1: | | | | | | |
| | 17,805 | | 5.750%, 6/01/47 | | 6/17 at 100.00 | B– | | 13,676,555 | |
| | 2,000 | | 5.125%, 6/01/47 | | 6/17 at 100.00 | B– | | 1,384,640 | |
| | 11,960 | | Golden State Tobacco Securitization Corporation, California, Tobacco Settlement Asset-Backed Bonds, Series 2007A-2, 0.000%, 6/01/37 | | 6/22 at 100.00 | BB– | | 8,350,831 | |
| | 32,630 | | Total Consumer Staples | | | | | 24,246,137 | |
| | | | Education and Civic Organizations – 7.9% (5.4% of Total Investments) | | | | | | |
| | 2,500 | | California Educational Facilities Authority, Revenue Bonds, Santa Clara University, Series 2010, 5.000%, 2/01/40 | | 2/20 at 100.00 | Aa3 | | 2,734,800 | |
| | 290 | | California Educational Facilities Authority, Revenue Bonds, University of Redlands, Series 2005A, 5.000%, 10/01/35 | | 10/15 at 100.00 | A3 | | 296,142 | |
| | 10,000 | | California Educational Facilities Authority, Revenue Bonds, University of Southern California, Series 2007A, 4.500%, 10/01/33 (UB) | | 10/17 at 100.00 | Aa1 | | 10,721,100 | |
| | | | California Educational Facilities Authority, Revenue Bonds, University of the Pacific, Series 2006: | | | | | | |
| | 200 | | 5.000%, 11/01/21 | | 11/15 at 100.00 | A2 | | 215,086 | |
| | 265 | | 5.000%, 11/01/25 | | 11/15 at 100.00 | A2 | | 281,279 | |
| | 4,685 | | California State Public Works Board, Lease Revenue Bonds, University of California Regents, Tender Option Bond Trust 1065, 9.214%, 3/01/33 (IF) | | 3/18 at 100.00 | Aa2 | | 5,390,374 | |
| | 1,250 | | California Statewide Communities Development Authority, School Facility Revenue Bonds, Alliance College-Ready Public Schools, Series 2011A, 7.000%, 7/01/46 | | 7/21 at 100.00 | N/R | | 1,322,675 | |
| | 605 | | California Statewide Community Development Authority, Revenue Bonds, Notre Dame de Namur University, Series 2003, 6.500%, 10/01/23 | | 10/13 at 100.00 | N/R | | 605,762 | |
| | 3,000 | | Long Beach Bond Financing Authority, California, Lease Revenue Refunding Bonds, Long Beach Aquarium of the South Pacific, Series 2001, 5.500%, 11/01/17 – AMBAC Insured | | 5/12 at 100.00 | BBB | | 3,009,240 | |
| | 2,900 | | University of California, General Revenue Bonds, Series 2003A, 5.125%, 5/15/17 – AMBAC Insured (UB) | | 5/13 at 100.00 | Aa1 | | 3,067,040 | |
| | 25,695 | | Total Education and Civic Organizations | | | | | 27,643,498 | |
| | | | Health Care – 30.2% (20.6% of Total Investments) | | | | | | |
| | 2,160 | | California Health Facilities Financing Authority, Health Facility Revenue Bonds, Adventist Health System/West, Series 2003A, 5.000%, 3/01/15 | | 3/13 at 100.00 | A | | 2,234,390 | |
| | 1,420 | | California Health Facilities Financing Authority, Revenue Bonds, Rady Children’s Hospital – San Diego, Series 2011, 5.250%, 8/15/41 | | 8/21 at 100.00 | A2 | | 1,481,827 | |
| | 14,895 | | California Health Facilities Financing Authority, Revenue Bonds, Sutter Health, Series 2007A, 5.250%, 11/15/46 (UB) | | 11/16 at 100.00 | AA– | | 15,623,068 | |
| | 6,530 | | California Health Facilities Financing Authority, Revenue Bonds, Sutter Health, Series 2011B, 6.000%, 8/15/42 | | 8/20 at 100.00 | AA– | | 7,558,475 | |
| | 1,120 | | California Statewide Communities Development Authority, Revenue Bonds, Adventist Health System West, Series 2005A, 5.000%, 3/01/35 | | 3/15 at 100.00 | A | | 1,136,990 | |
| | 5,500 | | California Statewide Communities Development Authority, Revenue Bonds, Sutter Health, Series 2011A, 6.000%, 8/15/42 | | 8/20 at 100.00 | AA– | | 6,366,250 | |
| | 3,325 | | California Statewide Communities Development Authority, Revenue Bonds, ValleyCare Health System, Series 2007A, 5.125%, 7/15/31 | | 7/17 at 100.00 | N/R | | 3,056,540 | |
| | | | California Statewide Community Development Authority, Revenue Bonds, Daughters of Charity Health System, Series 2005A: | | | | | | |
| | 1,760 | | 5.250%, 7/01/24 | | 7/15 at 100.00 | BBB | | 1,797,101 | |
| | 3,870 | | 5.250%, 7/01/30 | | 7/15 at 100.00 | BBB | | 3,881,455 | |
| | | Nuveen California Dividend Advantage Municipal Fund (continued) |
| NAC | | Portfolio of Investments |
February 29, 2012
| | Principal | | | | Optional Call | | | | |
| | Amount (000) | | Description (1) | | Provisions (2) | Ratings (3) | | Value | |
| | | | Health Care (continued) | | | | | | |
| $ | 10,140 | | California Statewide Community Development Authority, Revenue Bonds, Kaiser Permanante System, Series 2006, 5.000%, 3/01/41 | | 3/16 at 100.00 | A+ | $ | 10,494,799 | |
| | 3,095 | | California Statewide Community Development Authority, Revenue Bonds, Kaiser Permanente System, Series 2001C, 5.250%, 8/01/31 | | 8/16 at 100.00 | A+ | | 3,322,235 | |
| | 9,980 | | California Statewide Community Development Authority, Revenue Bonds, Kaiser Permanente System, Series 2006, 5.000%, 3/01/41 – BHAC Insured (UB) | | 3/16 at 100.00 | AA+ | | 10,291,975 | |
| | 2,250 | | California Statewide Community Development Authority, Revenue Bonds, Methodist Hospital Project, Series 2009, 6.750%, 2/01/38 | | 8/19 at 100.00 | Aa2 | | 2,695,793 | |
| | 1,586 | | California Statewide Community Development Authority, Revenue Bonds, St. Joseph Health System, Trust 2554, 18.382%, 7/01/47 – AGM Insured (IF) | | 7/18 at 100.00 | AA– | | 1,941,391 | |
| | 10,500 | | Duarte, California, Certificates of Participation, City of Hope National Medical Center, Series 1999A, 5.250%, 4/01/31 | | 4/12 at 100.00 | A+ | | 10,508,715 | |
| | 1,000 | | Loma Linda, California, Hospital Revenue Bonds, Loma Linda University Medical Center, Series 2005A, 5.000%, 12/01/23 | | 12/15 at 100.00 | BBB | | 1,006,380 | |
| | 2,860 | | Loma Linda, California, Hospital Revenue Bonds, Loma Linda University Medical Center, Series 2008A, 8.250%, 12/01/38 | | 12/17 at 100.00 | BBB | | 3,258,284 | |
| | 1,000 | | Madera County, California, Certificates of Participation, Children’s Hospital Central California, Series 2010, 5.375%, 3/15/36 | | 3/20 at 100.00 | A+ | | 1,038,310 | |
| | 1,725 | | Newport Beach, California, Revenue Bonds, Hoag Memorial Hospital Presbyterian, Series 2011A, 6.000%, 12/01/40 | | 12/21 at 100.00 | AA | | 2,059,012 | |
| | 675 | | Oak Valley Hospital District, Stanislaus County, California, Revenue Bonds, Series 2010A, 6.500%, 11/01/29 | | 11/20 at 100.00 | BB+ | | 677,936 | |
| | 5,450 | | Palomar Pomerado Health Care District, California, Certificates of Participation, Series 2010, 6.000%, 11/01/41 | | 11/20 at 100.00 | Baa3 | | 5,605,162 | |
| | 2,570 | | Rancho Mirage Joint Powers Financing Authority, California, Revenue Bonds, Eisenhower Medical Center, Series 2007A, 5.000%, 7/01/38 | | 7/17 at 100.00 | Baa2 | | 2,441,808 | |
| | 3,300 | | San Buenaventura, California, Revenue Bonds, Community Memorial Health System, Series 2011, 7.500%, 12/01/41 | | 12/21 at 100.00 | BB | | 3,720,948 | |
| | 3,000 | | Santa Clara County Financing Authority, California, Insured Revenue Bonds, El Camino Hospital, Series 2007A, 5.750%, 2/01/41 – AMBAC Insured | | 8/17 at 100.00 | A+ | | 3,201,570 | |
| | 99,711 | | Total Health Care | | | | | 105,400,414 | |
| | | | Housing/Multifamily – 4.1% (2.8% of Total Investments) | | | | | | |
| | 2,000 | | California Municipal Finance Authority, Mobile Home Park Revenue Bonds, Caritas Projects Series 2010A, 6.400%, 8/15/45 | | 8/20 at 100.00 | BBB | | 2,066,880 | |
| | 4,600 | | California Municipal Finance Authority, Mobile Home Park Revenue Bonds, Caritas Projects Series 2012A, 5.125%, 8/15/32 (WI/DD, Settling 3/13/12) | | 8/22 at 100.00 | BBB | | 4,554,000 | |
| | 4,665 | | Contra Costa County, California, Multifamily Housing Revenue Bonds, Delta View Apartments Project, Series 1999C, 6.750%, 12/01/30 (Alternative Minimum Tax) | | 6/12 at 100.00 | N/R | | 4,522,298 | |
| | 320 | | Independent Cities Lease Finance Authority, California, Mobile Home Park Revenue Bonds, San Juan Mobile Estates, Series 2006B, 5.850%, 5/15/41 | | 5/16 at 100.00 | N/R | | 315,558 | |
| | 1,725 | | Rohnert Park Finance Authority, California, Senior Lien Revenue Bonds, Rancho Feliz Mobile Home Park, Series 2003A, 5.750%, 9/15/38 | | 9/13 at 100.00 | A+ | | 1,740,629 | |
| | 1,120 | | Rohnert Park Finance Authority, California, Subordinate Lien Revenue Bonds, Rancho Feliz Mobile Home Park, Series 2003B, 6.625%, 9/15/38 | | 9/13 at 100.00 | N/R | | 1,132,802 | |
| | 14,430 | | Total Housing/Multifamily | | | | | 14,332,167 | |
| | | | Housing/Single Family – 0.6% (0.4% of Total Investments) | | | | | | |
| | 360 | | California Housing Finance Agency, Home Mortgage Revenue Bonds, Series 2006H, 5.750%, 8/01/30 – FGIC Insured (Alternative Minimum Tax) | | 2/16 at 100.00 | BBB | | 360,245 | |
| | 2,395 | | California Housing Finance Agency, Home Mortgage Revenue Bonds, Tender Option Bond Trust 3206, 8.286%, 2/01/29 (Alternative Minimum Tax) (IF) | | 2/17 at 100.00 | BBB | | 1,843,551 | |
| | 2,755 | | Total Housing/Single Family | | | | | 2,203,796 | |
| | Principal | | | | Optional Call | | | | |
| | Amount (000) | | Description (1) | | Provisions (2) | Ratings (3) | | Value | |
| | | | Industrials – 0.3% (0.2% of Total Investments) | | | | | | |
| $ | 5,120 | | California Statewide Communities Development Authority, Revenue Bonds, EnerTech Regional Biosolids Project, Series 2007A, 5.500%, 12/01/33 (Alternative Minimum Tax) (4) | | No Opt. Call | D | $ | 1,118,515 | |
| | | | Long-Term Care – 1.9% (1.3% of Total Investments) | | | | | | |
| | 1,000 | | California Municipal Finance Authority, Revenue Bonds, Harbor Regional Center Project, Series 2009, 8.000%, 11/01/29 | | 11/19 at 100.00 | Baa1 | | 1,144,550 | |
| | 8,500 | | Riverside County Public Financing Authority, California, Certificates of Participation, Air Force Village West, Series 1999, 5.800%, 5/15/29 | | 5/12 at 100.00 | B | | 5,614,675 | |
| | 9,500 | | Total Long-Term Care | | | | | 6,759,225 | |
| | | | Tax Obligation/General – 25.6% (17.5% of Total Investments) | | | | | | |
| | | | Alvord Unified School District, Riverside County, California, General Obligation Bonds, 2007 Election Series 2011B: | | | | | | |
| | 21,000 | | 0.000%, 8/01/41 – AGM Insured | | No Opt. Call | AA– | | 4,169,550 | |
| | 16,840 | | 0.000%, 8/01/43 – AGM Insured | | No Opt. Call | AA– | | 2,986,574 | |
| | 10,000 | | California State, General Obligation Bonds, Various Purpose Series 2009, 6.000%, 11/01/39 | | 11/19 at 100.00 | A1 | | 11,687,100 | |
| | | | California State, General Obligation Bonds, Various Purpose Series 2010: | | | | | | |
| | 5,000 | | 6.000%, 3/01/33 | | 3/20 at 100.00 | A1 | | 5,995,500 | |
| | 8,000 | | 5.500%, 3/01/40 | | 3/20 at 100.00 | A1 | | 8,881,600 | |
| | 1,000 | | 5.250%, 11/01/40 | | 11/20 at 100.00 | A1 | | 1,091,170 | |
| | 7,000 | | California State, General Obligation Bonds, Various Purpose Series 2011, 5.000%, 10/01/41 | | 10/21 at 100.00 | A1 | | 7,486,500 | |
| | 4,435 | | California, General Obligation Refunding Bonds, Series 2002, 6.000%, 4/01/16 – AMBAC Insured | | No Opt. Call | A1 | | 5,341,603 | |
| | 3,425 | | Coast Community College District, Orange County, California, General Obligation Bonds, Series 2006C, 0.000%, 8/01/31 – AGM Insured | | 8/18 at 100.00 | AA– | | 3,263,135 | |
| | 5,150 | | Hacienda La Puente Unified School District Facilities Financing Authority, California, General Obligation Revenue Bonds, Series 2007, 5.000%, 8/01/26 – AGM Insured | | No Opt. Call | AA– | | 6,026,530 | |
| | 5,210 | | Oak Valley Hospital District, Stanislaus County, California, General Obligation Bonds, Series 2005, 5.000%, 7/01/35 – FGIC Insured | | 7/14 at 101.00 | A1 | | 5,269,498 | |
| | 575 | | Roseville Joint Union High School District, Placer County, California, General Obligation Bonds, Series 2006B, 5.000%, 8/01/27 – FGIC Insured | | 8/15 at 100.00 | AA– | | 635,617 | |
| | 4,000 | | San Diego Community College District, California, General Obligation Bonds, Refunding Series 2011, 5.000%, 8/01/41 | | 8/21 at 100.00 | AA+ | | 4,493,320 | |
| | 5,000 | | San Diego Unified School District, San Diego County, California, General Obligation Bonds, Series 2003E, 5.250%, 7/01/20 – AGM Insured | | 7/13 at 101.00 | Aa2 | | 5,353,200 | |
| | 50,070 | | Yosemite Community College District, California, General Obligation Bonds, Capital Appreciation, Election 2004, Series 2010D, 0.000%, 8/01/42 | | No Opt. Call | Aa2 | | 16,729,388 | |
| | 146,705 | | Total Tax Obligation/General | | | | | 89,410,285 | |
| | | | Tax Obligation/Limited – 39.2% (26.8% of Total Investments) | | | | | | |
| | | | Beaumont Financing Authority, California, Local Agency Revenue Bonds, Series 2004D: | | | | | | |
| | 1,000 | | 5.500%, 9/01/24 | | 9/14 at 102.00 | N/R | | 1,017,530 | |
| | 615 | | 5.800%, 9/01/35 | | 9/14 at 102.00 | N/R | | 619,594 | |
| | 1,910 | | Borrego Water District, California, Community Facilities District 2007-1 Montesoro, Special Tax Bonds, Series 2007, 5.750%, 8/01/25 (4) | | 8/17 at 102.00 | N/R | | 611,257 | |
| | 1,990 | | Brentwood Infrastructure Financing Authority, California, Infrastructure Revenue Bonds, Refunding Series 2002A, 5.125%, 9/02/24 – AGM Insured | | 9/12 at 100.00 | AA– | | 2,029,203 | |
| | 1,000 | | California State Public Works Board, Lease Revenue Bonds, Various Capital Projects, Series 2009G-1, 5.750%, 10/01/30 | | 10/19 at 100.00 | A2 | | 1,135,590 | |
| | 2,000 | | California State Public Works Board, Lease Revenue Bonds, Various Capital Projects, Series 2009-I, 6.375%, 11/01/34 | | 11/19 at 100.00 | A2 | | 2,350,000 | |
| | 2,000 | | Capistrano Unified School District, Orange County, California, Special Tax Bonds, Community Facilities District 90-2 – Talega, Series 2003, 6.000%, 9/01/33 | | 9/13 at 100.00 | N/R | | 2,026,620 | |
| | | Nuveen California Dividend Advantage Municipal Fund (continued) |
| NAC | | Portfolio of Investments |
February 29, 2012
| | Principal | | | | Optional Call | | | | |
| | Amount (000) | | Description (1) | | Provisions (2) | Ratings (3) | | Value | |
| | | | Tax Obligation/Limited (continued) | | | | | | |
| $ | 710 | | Capistrano Unified School District, Orange County, California, Special Tax Bonds, Community Facilities District, Series 2005, 5.000%, 9/01/24 – FGIC Insured | | 9/15 at 100.00 | BBB | $ | 728,801 | |
| | 1,225 | | Chino Redevelopment Agency, California, Merged Chino Redevelopment Project Area Tax Allocation Bonds, Series 2006, 5.000%, 9/01/38 – AMBAC Insured | | 9/16 at 101.00 | A– | | 1,183,987 | |
| | 1,040 | | Dinuba Redevelopment Agency, California, Tax Allocation Bonds, Merged City of Dinuba Redevelopment Project and Dinuba Redevelopment Project 2, As Amended, Refunding Series 2001, 5.000%, 9/01/31 – NPFG Insured | | 9/12 at 101.00 | A– | | 1,044,254 | |
| | 1,430 | | Fontana, California, Redevelopment Agency, Jurupa Hills Redevelopment Project, Tax Allocation Refunding Bonds, 1997 Series A, 5.500%, 10/01/27 | | 4/12 at 100.00 | A– | | 1,431,001 | |
| | 3,490 | | Fontana, California, Senior Special Tax Refunding Bonds, Heritage Village Community Facilities District 2, Series 1998A, 5.250%, 9/01/17 – NPFG Insured | | 9/12 at 100.00 | BBB | | 3,527,169 | |
| | 1,125 | | Fontana, California, Special Tax Bonds, Sierra Community Facilities District 22, Series 2004, 6.000%, 9/01/34 | | 9/14 at 100.00 | N/R | | 1,135,901 | |
| | 3,980 | | Garden Grove, California, Certificates of Participation, Financing Project, Series 2002A, 5.500%, 3/01/22 – AMBAC Insured | | 3/13 at 100.50 | A | | 4,034,606 | |
| | 31,090 | | Golden State Tobacco Securitization Corporation, California, Enhanced Tobacco Settlement Asset-Backed Revenue Bonds, Series 2005A, 5.000%, 6/01/35 – FGIC Insured | | 6/15 at 100.00 | AA– | | 31,347,730 | |
| | 2,850 | | Hesperia Community Redevelopment Agency, California, Tax Allocation Bonds, Series 2005A, 5.000%, 9/01/35 – SYNCORA GTY Insured | | 9/15 at 100.00 | Baa3 | | 2,183,870 | |
| | 4,500 | | Inglewood Redevelopment Agency, California, Tax Allocation Bonds, Merged Redevelopment Project, Refunding Series 1998A, 5.250%, 5/01/23 – AMBAC Insured | | No Opt. Call | N/R | | 4,777,245 | |
| | 1,285 | | Inglewood Redevelopment Agency, California, Tax Allocation Bonds, Merged Redevelopment Project, Subordinate Lien Series 2007A-1, 5.000%, 5/01/25 – AMBAC Insured | | 5/17 at 100.00 | BBB+ | | 1,270,261 | |
| | | | Irvine, California, Unified School District, Community Facilities District Special Tax Bonds, Series 2006A: | | | | | | |
| | 325 | | 5.000%, 9/01/26 | | 9/16 at 100.00 | N/R | | 330,896 | |
| | 755 | | 5.125%, 9/01/36 | | 9/16 at 100.00 | N/R | | 756,049 | |
| | 675 | | Lammersville School District, San Joaquin County, California, Community Facilities District 2002, Mountain House Special Tax Bonds, Series 2006, 5.125%, 9/01/35 | | 9/16 at 100.00 | N/R | | 630,038 | |
| | 2,000 | | Lee Lake Water District, Riverside County, California, Special Tax Bonds, Community Facilities District 1 of Sycamore Creek, Series 2003, 6.500%, 9/01/24 | | 9/13 at 102.00 | N/R | | 2,088,140 | |
| | 1,000 | | Lindsay Redevelopment Agency, California, Project 1 Tax Allocation Bonds, Series 2007, 5.000%, 8/01/37 – RAAI Insured | | 8/17 at 100.00 | BBB+ | | 948,300 | |
| | 1,290 | | Los Angeles Community Redevelopment Agency, California, Lease Revenue Bonds, Manchester Social Services Project, Series 2005, 5.000%, 9/01/37 – AMBAC Insured | | 9/15 at 100.00 | A1 | | 1,305,480 | |
| | 1,530 | | Moreno Valley Unified School District, Riverside County, California, Certificates of Participation, Series 2005, 5.000%, 3/01/24 – AGM Insured | | 3/14 at 100.00 | AA– | | 1,639,349 | |
| | 3,500 | | Murrieta Redevelopment Agency, California, Tax Allocation Bonds, Series 2007A, 5.000%, 8/01/37 – NPFG Insured | | 8/17 at 100.00 | A– | | 3,428,320 | |
| | 695 | | National City Community Redevelopment Agency, California, Tax Allocation Revenue Bonds, National City Redevelopment Project Area, Series 2011, 6.500%, 8/01/24 | | 8/21 at 100.00 | A– | | 804,984 | |
| | 9,200 | | Norco Redevelopment Agency, California, Tax Allocation Refunding Bonds, Project Area 1, Series 2001, 5.000%, 3/01/19 – NPFG Insured | | 3/13 at 100.00 | A | | 9,304,788 | |
| | | | North Natomas Community Facilities District 4, Sacramento, California, Special Tax Bonds, Series 2006D: | | | | | | |
| | 535 | | 5.000%, 9/01/26 | | 9/14 at 102.00 | N/R | | 529,559 | |
| | 245 | | 5.000%, 9/01/33 | | 9/14 at 102.00 | N/R | | 229,369 | |
| | 260 | | Novato Redevelopment Agency, California, Tax Allocation Bonds, Hamilton Field Redevelopment Project, Series 2011, 6.750%, 9/01/40 | | 9/21 at 100.00 | A– | | 295,144 | |
| | 3,290 | | Oakland Redevelopment Agency, California, Subordinate Lien Tax Allocation Bonds, Central District Redevelopment Project, Series 2003, 5.500%, | | 3/13 at 100.00 | A– | | 3,431,733 | |
| | | | 9/01/16 – FGIC Insured | | | | | | |
| | Principal | | | | Optional Call | | | | |
| | Amount (000) | | Description (1) | | Provisions (2) | Ratings (3) | | Value | |
| | | | Tax Obligation/Limited (continued) | | | | | | |
| $ | 5,600 | | Palm Springs Financing Authority, California, Lease Revenue Refunding Bonds, Convention Center Project, Series 2001A, 5.000%, 11/01/22 – NPFG Insured | | 5/12 at 101.00 | BBB | $ | 5,658,856 | |
| | 1,000 | | Palmdale Community Redevelopment Agency, California, Tax Allocation Bonds, Merged Redevelopment Project Areas, Series 2004, 5.000%, 12/01/24 – AMBAC Insured | | 12/14 at 100.00 | A– | | 1,008,960 | |
| | | | Perris Union High School District Financing Authority, Riverside County, California, Revenue Bonds, Series 2011: | | | | | | |
| | 245 | | 6.000%, 9/01/33 | | No Opt. Call | N/R | | 252,852 | |
| | 530 | | 6.125%, 9/01/41 | | No Opt. Call | N/R | | 546,748 | |
| | 8,250 | | Pico Rivera Water Authority, California, Revenue Bonds, Series 2001A, 6.250%, 12/01/32 | | 6/12 at 102.00 | N/R | | 8,338,935 | |
| | 2,130 | | Pittsburg Redevelopment Agency, California, Tax Allocation Bonds, Los Medanos Community Development Project, Refunding Series 2008A, 6.500%, 9/01/28 | | 9/18 at 100.00 | BBB | | 2,209,832 | |
| | 1,570 | | Poway Redevelopment Agency, California, Tax Allocation Refunding Bonds, Paguay Redevelopment Project, Series 2000, 5.750%, 6/15/33 – NPFG Insured | | 12/12 at 100.00 | BBB | | 1,578,745 | |
| | 845 | | Rancho Santa Fe CSD Financing Authority, California, Revenue Bonds, Superior Lien Series 2011A, 5.750%, 9/01/30 | | 9/21 at 100.00 | BBB+ | | 911,713 | |
| | 620 | | Rialto Redevelopment Agency, California, Tax Allocation Bonds, Merged Project Area, Series 2005A, 5.000%, 9/01/35 – SYNCORA GTY Insured | | 9/15 at 100.00 | A– | | 611,983 | |
| | 150 | | Riverside County Redevelopment Agency, California, Tax Allocation Bonds, Jurupa Valley Project Area, Series 2011-B, 6.500%, 10/01/25 | | 10/21 at 100.00 | A– | | 166,122 | |
| | 1,860 | | Riverside Redevelopment Agency, California, Tax Allocation Refunding Bonds, Merged Project Areas, Series 2003, 5.250%, 8/01/22 – NPFG Insured | | 8/13 at 100.00 | A– | | 1,882,283 | |
| | 770 | | Roseville, California, Certificates of Participation, Public Facilities, Series 2003A, 5.000%, 8/01/25 – AMBAC Insured | | 8/13 at 100.00 | AA– | | 786,332 | |
| | 2,500 | | Sacramento City Financing Authority, California, Lease Revenue Refunding Bonds, Series 1993A, 5.400%, 11/01/20 – AMBAC Insured | | No Opt. Call | A1 | | 2,903,250 | |
| | 1,150 | | Sacramento, California, Special Tax Bonds, North Natomas Community Facilities District 4, Series 2003C, 6.000%, 9/01/33 | | 9/14 at 100.00 | N/R | | 1,174,863 | |
| | 120 | | San Francisco Redevelopment Finance Authority, California, Tax Allocation Revenue Bonds, Mission Bay North Redevelopment Project, Series 2011C, 6.750%, 8/01/41 | | 2/21 at 100.00 | A– | | 135,413 | |
| | | | San Francisco Redevelopment Financing Authority, California, Tax Allocation Revenue Bonds, Mission Bay South Redevelopment Project, Series 2011D: | | | | | | |
| | 125 | | 7.000%, 8/01/33 | | 2/21 at 100.00 | BBB | | 142,329 | |
| | 155 | | 7.000%, 8/01/41 | | 2/21 at 100.00 | BBB | | 174,471 | |
| | 2,695 | | San Jose Financing Authority, California, Lease Revenue Refunding Bonds, Civic Center Project, Series 2002B, 5.250%, 6/01/19 – AMBAC Insured | | 6/12 at 100.00 | AA+ | | 2,721,707 | |
| | 1,000 | | San Jose Redevelopment Agency, California, Housing Set-Aside Tax Allocation Bonds, Merged Area Redevelopment Project, Series 2010A-1, 5.500%, 8/01/35 | | 8/20 at 100.00 | A | | 1,023,970 | |
| | 1,135 | | San Jose Redevelopment Agency, California, Tax Allocation Bonds, Merged Area Redevelopment Project, Series 2006C, 5.000%, 8/01/25 – NPFG Insured | | 8/17 at 100.00 | BBB | | 1,139,234 | |
| | 5,000 | | Santa Ana Community Redevelopment Agency, California, Tax Allocation Bonds, Merged Project Area, Series 2011A, 6.750%, 9/01/28 | | 3/21 at 100.00 | A | | 5,773,350 | |
| | 205 | | Signal Hill Redevelopment Agency, California, Project 1 Tax Allocation Bonds, Series 2011, 7.000%, 10/01/26 | | 4/21 at 100.00 | N/R | | 218,300 | |
| | 1,200 | | Turlock Public Financing Authority, California, Tax Allocation Revenue Bonds, Series 2011, 7.500%, 9/01/39 | | 3/21 at 100.00 | BBB+ | | 1,332,912 | |
| | 1,000 | | Washington Unified School District, Yolo County, California, Certificates of Participation, Series 2007, 5.125%, 8/01/37 – AMBAC Insured | | 8/17 at 100.00 | A | | 1,039,240 | |
| | 600 | | West Patterson Financing Authority, California, Special Tax Bonds, Community Facilities District 01-1, Refunding Series 2009A, 8.625%, 9/01/39 | | 9/14 at 105.00 | N/R | | 649,044 | |
| | 2,810 | | West Patterson Financing Authority, California, Special Tax Bonds, Community Facilities District 01-1, Series 2003B, 7.000%, 9/01/38 | | 9/13 at 103.00 | N/R | | 2,828,125 | |
| | | Nuveen California Dividend Advantage Municipal Fund (continued) |
| NAC | | Portfolio of Investments |
February 29, 2012
| | Principal | | | | Optional Call | | | | |
| | Amount (000) | | Description (1) | | Provisions (2) | Ratings (3) | | Value | |
| | | | Tax Obligation/Limited (continued) | | | | | | |
| $ | 2,000 | | West Patterson Financing Authority, California, Special Tax Bonds, Community Facilities District 01-1, Series 2004B, 6.000%, 9/01/39 | | 9/13 at 102.00 | N/R | $ | 1,802,100 | |
| | 1,350 | | West Patterson Financing Authority, California, Special Tax Bonds, Community Facilities District 2001-1, Series 2004A, 6.125%, 9/01/39 | | 9/13 at 103.00 | N/R | | 1,237,289 | |
| | | | Yorba Linda Redevelopment Agency, Orange County, California, Tax Allocation Revenue Bonds, Yorba Linda Redevelopment Project, Subordinate Lien Series 2011A: | | | | | | |
| | 150 | | 6.000%, 9/01/26 | | 9/21 at 100.00 | A– | | 166,413 | |
| | 210 | | 6.500%, 9/01/32 | | 9/21 at 100.00 | A– | | 234,190 | |
| | 135,515 | | Total Tax Obligation/Limited | | | | | 136,826,329 | |
| | | | Transportation – 3.6% (2.5% of Total Investments) | | | | | | |
| | 1,430 | | Bay Area Toll Authority, California, Revenue Bonds, San Francisco Bay Area Toll Bridge, Series 2006F, 5.000%, 4/01/31 (UB) | | 4/16 at 100.00 | AA | | 1,608,078 | |
| | 11,150 | | Foothill/Eastern Transportation Corridor Agency, California, Toll Road Revenue Refunding Bonds, Series 1999, 5.750%, 1/15/40 | | 7/12 at 100.00 | BBB– | | 10,959,112 | |
| | 120 | | Palm Springs Financing Authority, California, Palm Springs International Airport Revenue Bonds, Series 2006, 5.450%, 7/01/20 (Alternative Minimum Tax) | | 7/14 at 102.00 | N/R | | 112,636 | |
| | 12,700 | | Total Transportation | | | | | 12,679,826 | |
| | | | U.S. Guaranteed – 13.0% (8.9% of Total Investments) (5) | | | | | | |
| | 4,500 | | California Department of Water Resources, Power Supply Revenue Bonds, Series 2002A, 5.125%, 5/01/18 (Pre-refunded 5/01/12) | | 5/12 at 101.00 | Aaa | | 4,583,835 | |
| | 675 | | California Statewide Community Development Authority, Revenue Bonds, Thomas Jefferson School of Law, Series 2005A, 4.875%, 10/01/31 (Pre-refunded 10/01/15) | | 10/15 at 100.00 | N/R (5) | | 753,395 | |
| | 3,250 | | Golden State Tobacco Securitization Corporation, California, Tobacco Settlement Asset-Backed Bonds, Series 2003A-1, 6.250%, 6/01/33 (Pre-refunded 6/01/13) | | 6/13 at 100.00 | Aaa | | 3,450,005 | |
| | 3,630 | | Imperial Irrigation District, California, Certificates of Participation, Electric System Revenue Bonds, Series 2003, 5.250%, 11/01/23 (Pre-refunded 11/01/13) – AGM Insured | | 11/13 at 100.00 | AA– (5) | | 3,930,237 | |
| | 1,940 | | Lincoln, California, Special Tax Bonds, Lincoln Crossing Community Facilities District 03-1, Series 2003A, 6.500%, 9/01/25 (Pre-refunded 9/01/13) | | 9/13 at 102.00 | N/R (5) | | 2,153,982 | |
| | 1,335 | | Lincoln, California, Special Tax Bonds, Lincoln Crossing Community Facilities District 03-1, Series 2004, 6.000%, 9/01/34 (Pre-refunded 9/01/13) | | 9/13 at 102.00 | N/R (5) | | 1,472,251 | |
| | 10,845 | | Los Angeles Unified School District, California, General Obligation Bonds, Series 2002E, 5.000%, 7/01/19 (Pre-refunded 7/01/12) – NPFG Insured | | 7/12 at 100.00 | AA– (5) | | 11,024,051 | |
| | 5,840 | | Orange County Water District, California, Revenue Certificates of Participation, Series 1999A, 5.375%, 8/15/29 (ETM) | | 8/12 at 100.00 | N/R (5) | | 6,509,206 | |
| | 5,115 | | San Francisco City and County Public Utilities Commission, California, Water Revenue Bonds, Series 2002A, 5.000%, 11/01/18 (Pre-refunded 11/01/12) – NPFG Insured | | 11/12 at 100.00 | AA– (5) | | 5,281,902 | |
| | 2,860 | | Tobacco Securitization Authority of Southern California, Tobacco Settlement Asset-Backed Bonds, San Diego County Tobacco Asset Securitization Corporation, Senior Series 2001A, 5.250%, 6/01/27 (Pre-refunded 6/01/12) | | 6/12 at 100.00 | Aaa | | 2,897,466 | |
| | 600 | | University of California, General Revenue Bonds, Series 2003A, 5.125%, 5/15/17 (Pre-refunded 5/15/13) – AMBAC Insured (UB) | | 5/13 at 100.00 | Aa1 (5) | | 635,274 | |
| | 2,500 | | Whittier, California, Health Facility Revenue Bonds, Presbyterian Intercommunity Hospital, Series 2002, 5.600%, 6/01/22 (Pre-refunded 6/01/12) | | 6/12 at 101.00 | N/R (5) | | 2,560,025 | |
| | 43,090 | | Total U.S. Guaranteed | | | | | 45,251,629 | |
| | | | Utilities – 3.2% (2.2% of Total Investments) | | | | | | |
| | 3,775 | | Long Beach Bond Finance Authority, California, Natural Gas Purchase Revenue Bonds, Series 2007A, 5.000%, 11/15/35 | | No Opt. Call | A– | | 3,870,470 | |
| | 5,500 | | Los Angeles Department of Water and Power, California, Power System Revenue Bonds, Series 2005A-1, 5.000%, 7/01/31 – AGM Insured (UB) | | 7/15 at 100.00 | AA– | | 5,867,565 | |
| | 1,270 | | Merced Irrigation District, California, Electric System Revenue Bonds, Series 2005, 5.125%, 9/01/31 – SYNCORA GTY Insured | | 9/15 at 100.00 | N/R | | 1,263,028 | |
| | 10,545 | | Total Utilities | | | | | 11,001,063 | |
| | Principal | | | | Optional Call | | | | |
| | Amount (000) | | Description (1) | | Provisions (2) | Ratings (3) | | Value | |
| | | | Water and Sewer – 9.6% (6.6% of Total Investments) | | | | | | |
| $ | 875 | | Healdsburg Public Financing Authority, California, Wastewater Revenue Bonds, Series 2006, 5.000%, 4/01/36 – NPFG Insured | | 4/16 at 100.00 | AA– | $ | 910,184 | |
| | 2,500 | | Indio Water Authority, California, Water Revenue Bonds, Series 2006, 5.000%, 4/01/31 – AMBAC Insured | | 4/16 at 100.00 | A+ | | 2,622,675 | |
| | 9,955 | | Los Angeles Department of Water and Power, California, Waterworks Revenue Bonds, Series 2011A, 5.250%, 7/01/39 | | 1/21 at 100.00 | AA | | 11,387,126 | |
| | 835 | | Marina Coast Water District, California, Enterprise Certificate of Participation, Series 2006, 5.000%, 6/01/31 – NPFG Insured | | 6/16 at 100.00 | AA– | | 875,155 | |
| | 2,250 | | Sacramento County Sanitation District Financing Authority, California, Revenue Bonds, Series 2006, 5.000%, 12/01/31 – FGIC Insured | | 6/16 at 100.00 | AA | | 2,447,663 | |
| | 11,000 | | San Diego Public Facilities Financing Authority, California, Sewerage Revenue Bonds, Refunding Series 2010A, 5.250%, 5/15/26 | | 5/20 at 100.00 | Aa3 | | 13,232,560 | |
| | 2,000 | | West Basin Municipal Water District, California, Certificates of Participation, Refunding Series 2008B, 5.000%, 8/01/28 – AGC Insured | | 8/18 at 100.00 | AA– | | 2,171,760 | |
| | 29,415 | | Total Water and Sewer | | | | | 33,647,123 | |
| $ | 567,811 | | Total Investments (cost $484,363,905) – 146.2% | | | | | 510,520,007 | |
| | | | Floating Rate Obligations – (8.2)% | | | | | (28,545,000 | ) |
| | | | Variable Rate Demand Preferred Shares, at Liquidation Value – (39.0)% (6) | | | | | (136,200,000 | ) |
| | | | Other Assets Less Liabilities – 1.0% | | | | | 3,427,835 | |
| | | | Net Assets Applicable to Common Shares – 100% | | | | $ | 349,202,842 | |
| (1) | | All percentages shown in the Portfolio of Investments are based on net assets applicable to Common shares unless otherwise noted. |
| (2) | | Optional Call Provisions (not covered by the report of independent registered public accounting firm): Dates (month and year) and prices of the earliest optional call or redemption. There may be other call provisions at varying prices at later dates. Certain mortgage-backed securities may be subject to periodic principal paydowns. |
| (3) | | Ratings (not covered by the report of independent registered public accounting firm): Using the highest of Standard & Poor’s Group (“Standard & Poor’s”), Moody’s Investors Service, Inc. (“Moody’s”) or Fitch, Inc. (“Fitch”) rating. Ratings below BBB by Standard & Poor’s, Baa by Moody’s or BBB by Fitch are considered to be below investment grade. Holdings designated N/R are not rated by any of these national rating agencies. |
| (4) | | At or subsequent to the end of the reporting period, this security is non-income producing. Non-income producing security, in the case of a bond, generally denotes that the issuer has (1) defaulted on the payment of principal or interest, (2) is under the protection of the Federal Bankruptcy Court or (3) the Fund’s Adviser has concluded that the issue is not likely to meet its future interest payment obligations and has directed the Fund’s custodian to cease accruing additional income on the Fund’s records. |
| (5) | | Backed by an escrow or trust containing sufficient U.S. Government or U.S. Government agency securities, which ensure the timely payment of principal and interest. Certain bonds backed by U.S. Government or agency securities are regarded as having an implied rating equal to the rating of such securities. |
| (6) | | Variable Rate Demand Preferred Shares, at Liquidation Value as a percentage of Total Investments is 26.7%. |
| N/R | | Not rated. |
| WI/DD | | Purchased on a when-issued or delayed delivery basis. |
| (ETM) | | Escrowed to maturity. |
| (IF) | | Inverse floating rate investment. |
| (UB) | | Underlying bond of an inverse floating rate trust reflected as a financing transaction. See Notes to Financial Statements, Footnote 1 – General Information and Significant Accounting Policies, Inverse Floating Rate Securities for more information. |
See accompanying notes to financial statements.
| | | Nuveen California Dividend Advantage Municipal Fund 2 |
| NVX | | Portfolio of Investments |
| | Principal | | | | Optional Call | | | | |
| | Amount (000) | | Description (1) | | Provisions (2) | Ratings (3) | | Value | |
| | | | Consumer Staples – 7.4% (5.1% of Total Investments) | | | | | | |
| $ | 535 | | California County Tobacco Securitization Agency, Tobacco Settlement Asset-Backed Bonds, Sonoma County Tobacco Securitization Corporation, Series 2005, 4.250%, 6/01/21 | | 6/15 at 100.00 | BB+ | $ | 515,895 | |
| | 3,940 | | California County Tobacco Securitization Agency, Tobacco Settlement Asset-Backed Bonds, Stanislaus County Tobacco Funding Corporation, Series 2002A, 5.500%, 6/01/33 | | 6/12 at 100.00 | Baa1 | | 3,713,726 | |
| | | | Golden State Tobacco Securitization Corporation, California, Tobacco Settlement Asset-Backed Bonds, Series 2007A-1: | | | | | | |
| | 7,540 | | 5.750%, 6/01/47 | | 6/17 at 100.00 | B– | | 5,791,700 | |
| | 1,270 | | 5.125%, 6/01/47 | | 6/17 at 100.00 | B– | | 879,246 | |
| | 8,660 | | Golden State Tobacco Securitization Corporation, California, Tobacco Settlement Asset-Backed Bonds, Series 2007A-2, 0.000%, 6/01/37 | | 6/22 at 100.00 | BB– | | 6,046,672 | |
| | 21,945 | | Total Consumer Staples | | | | | 16,947,239 | |
| | | | Education and Civic Organizations – 9.3% (6.4% of Total Investments) | | | | | | |
| | 2,745 | | California Educational Facilities Authority, Revenue Bonds, University of Southern California, Tender Option Bond Trust 09-11B, 18.293%, 10/01/38 (IF) (4) | | 10/18 at 100.00 | Aa1 | | 3,927,354 | |
| | | | California Educational Facilities Authority, Revenue Bonds, University of the Pacific, Series 2006: | | | | | | |
| | 125 | | 5.000%, 11/01/21 | | 11/15 at 100.00 | A2 | | 134,429 | |
| | 165 | | 5.000%, 11/01/25 | | 11/15 at 100.00 | A2 | | 175,136 | |
| | 2,250 | | California Educational Facilities Authority, Student Loan Revenue Bonds, Cal Loan Program, Series 2001A, 5.400%, 3/01/21 – NPFG Insured (Alternative Minimum Tax) | | 9/12 at 100.00 | Baa2 | | 2,252,610 | |
| | 2,500 | | California Municipal Finance Authority, Revenue Bonds, University of La Verne, Series 2010A, 6.250%, 6/01/40 | | 6/20 at 100.00 | Baa2 | | 2,717,825 | |
| | 2,945 | | California State Public Works Board, Lease Revenue Bonds, University of California Regents, Tender Option Bond Trust 1065, 9.214%, 3/01/33 (IF) | | 3/18 at 100.00 | Aa2 | | 3,388,399 | |
| | 850 | | California Statewide Communities Development Authority, School Facility Revenue Bonds, Alliance College-Ready Public Schools, Series 2011A, 7.000%, 7/01/46 | | 7/21 at 100.00 | N/R | | 899,419 | |
| | 605 | | California Statewide Community Development Authority, Revenue Bonds, Notre Dame de Namur University, Series 2003, 6.500%, 10/01/23 | | 10/13 at 100.00 | N/R | | 605,762 | |
| | 3,000 | | Long Beach Bond Financing Authority, California, Lease Revenue Refunding Bonds, Long Beach Aquarium of the South Pacific, Series 2001, 5.250%, 11/01/30 – AMBAC Insured | | 5/12 at 101.00 | BBB | | 3,011,280 | |
| | 2,680 | | University of California, General Revenue Bonds, Series 2003A, 5.000%, 5/15/33 – AMBAC Insured (UB) | | 5/13 at 100.00 | Aa1 | | 2,791,220 | |
| | 1,315 | | University of California, Limited Project Revenue Bonds, Series 2007D, 5.000%, 5/15/41 – FGIC Insured | | 5/16 at 101.00 | Aa2 | | 1,398,384 | |
| | 19,180 | | Total Education and Civic Organizations | | | | | 21,301,818 | |
| | | | Health Care – 25.1% (17.4% of Total Investments) | | | | | | |
| | 2,000 | | California Health Facilities Financing Authority, Revenue Bonds, Casa Colina Inc., Series 2001, 6.000%, 4/01/22 | | 4/12 at 100.00 | BBB | | 2,003,680 | |
| | 895 | | California Health Facilities Financing Authority, Revenue Bonds, Rady Children’s Hospital – San Diego, Series 2011, 5.250%, 8/15/41 | | 8/21 at 100.00 | A2 | | 933,968 | |
| | 9,260 | | California Health Facilities Financing Authority, Revenue Bonds, Sutter Health, Series 2007A, 5.250%, 11/15/46 (UB) | | 11/16 at 100.00 | AA– | | 9,712,629 | |
| | 4,215 | | California Municipal Financing Authority, Certificates of Participation, Community Hospitals of Central California, Series 2007, 5.250%, 2/01/27 | | 2/17 at 100.00 | BBB | | 4,310,090 | |
| | 2,520 | | California Statewide Communities Development Authority, Revenue Bonds, Adventist Health System West, Series 2005A, 5.000%, 3/01/35 | | 3/15 at 100.00 | A | | 2,558,228 | |
| | 2,225 | | California Statewide Communities Development Authority, Revenue Bonds, ValleyCare Health System, Series 2007A, 5.125%, 7/15/31 | | 7/17 at 100.00 | N/R | | 2,045,354 | |
| | Principal | | | | Optional Call | | | | |
| | Amount (000) | | Description (1) | | Provisions (2) | Ratings (3) | | Value | |
| | | | Health Care (continued) | | | | | | |
| $ | 2,500 | | California Statewide Community Development Authority, Hospital Revenue Bonds, Monterey Peninsula Hospital, Series 2003B, 5.250%, 6/01/18 – AGM Insured | | 6/13 at 100.00 | AA– | $ | 2,620,350 | |
| | 5,250 | | California Statewide Community Development Authority, Revenue Bonds, Daughters of Charity Health System, Series 2005A, 5.250%, 7/01/35 | | 7/15 at 100.00 | BBB | | 5,166,368 | |
| | 425 | | California Statewide Community Development Authority, Revenue Bonds, Kaiser Permanente System, Series 2001C, 5.250%, 8/01/31 | | 8/16 at 100.00 | A+ | | 456,204 | |
| | | | California Statewide Community Development Authority, Revenue Bonds, St. Joseph Health System, Trust 2554: | | | | | | |
| | 1,325 | | 18.349%, 7/01/47 – AGM Insured (IF) | | 7/18 at 100.00 | AA– | | 1,621,336 | |
| | 998 | | 18.382%, 7/01/47 – AGM Insured (IF) | | 7/18 at 100.00 | AA– | | 1,221,020 | |
| | 1,000 | | California Statewide Community Development Authority, Revenue Bonds, Sutter Health, Series 2004D, 5.050%, 8/15/38 – AGM Insured | | 8/18 at 100.00 | AA– | | 1,050,240 | |
| | | | California Statewide Community Development Authority, Revenue Bonds, Sutter Health, Series 2005A: | | | | | | |
| | 2,705 | | 5.000%, 11/15/43 | | 11/15 at 100.00 | AA– | | 2,774,275 | |
| | 3,315 | | 5.000%, 11/15/43 (UB) | | 11/15 at 100.00 | AA– | | 3,399,897 | |
| | 2,000 | | Loma Linda, California, Hospital Revenue Bonds, Loma Linda University Medical Center, Series 2008A, 8.250%, 12/01/38 | | 12/17 at 100.00 | BBB | | 2,278,520 | |
| | 1,610 | | Madera County, California, Certificates of Participation, Children’s Hospital Central California, Series 2010, 5.375%, 3/15/36 | | 3/20 at 100.00 | A+ | | 1,671,679 | |
| | 455 | | Oak Valley Hospital District, Stanislaus County, California, Revenue Bonds, Series 2010A, 6.500%, 11/01/29 | | 11/20 at 100.00 | BB+ | | 456,979 | |
| | 4,800 | | Palomar Pomerado Health Care District, California, Certificates of Participation, Series 2010, 6.000%, 11/01/41 | | 11/20 at 100.00 | Baa3 | | 4,936,656 | |
| | 5,785 | | Rancho Mirage Joint Powers Financing Authority, California, Revenue Bonds, Eisenhower Medical Center, Series 2007A, 5.000%, 7/01/38 | | 7/17 at 100.00 | Baa2 | | 5,496,436 | |
| | 2,250 | | San Buenaventura, California, Revenue Bonds, Community Memorial Health System, Series 2011, 7.500%, 12/01/41 | | 12/21 at 100.00 | BB | | 2,537,010 | |
| | 55,533 | | Total Health Care | | | | | 57,250,919 | |
| | | | Housing/Multifamily – 6.1% (4.2% of Total Investments) | | | | | | |
| | 1,325 | | California Municipal Finance Authority, Mobile Home Park Revenue Bonds, Caritas Projects Series 2010A, 6.400%, 8/15/45 | | 8/20 at 100.00 | BBB | | 1,369,308 | |
| | 410 | | California Municipal Finance Authority, Mobile Home Park Revenue Bonds, Caritas Projects Series 2012A, 5.500%, 8/15/47 (WI/DD, Settling 3/13/12) | | 8/22 at 100.00 | BBB | | 405,900 | |
| | 940 | | California Municipal Finance Authority, Mobile Home Park Revenue Bonds, Caritas Projects Series 2012B, 7.250%, 8/15/47 (WI/DD, Settling 3/13/12) | | 8/22 at 100.00 | N/R | | 940,000 | |
| | 5,962 | | California Statewide Community Development Authority, Multifamily Housing Revenue Refunding Bonds, Claremont Village Apartments, Series 2001D, 5.500%, 6/01/31 (Mandatory put 6/01/16) (Alternative Minimum Tax) | | 6/13 at 100.00 | AA+ | | 6,093,641 | |
| | 205 | | Independent Cities Lease Finance Authority, California, Mobile Home Park Revenue Bonds, San Juan Mobile Estates, Series 2006B, 5.850%, 5/15/41 | | 5/16 at 100.00 | N/R | | 202,155 | |
| | 1,055 | | Rohnert Park Finance Authority, California, Senior Lien Revenue Bonds, Rancho Feliz Mobile Home Park, Series 2003A, 5.750%, 9/15/38 | | 9/13 at 100.00 | A+ | | 1,064,558 | |
| | 700 | | Rohnert Park Finance Authority, California, Subordinate Lien Revenue Bonds, Rancho Feliz Mobile Home Park, Series 2003B, 6.625%, 9/15/38 | | 9/13 at 100.00 | N/R | | 708,001 | |
| | 3,045 | | Yucaipa Redevelopment Agency, California, Mobile Home Park Revenue Bonds, Rancho del Sol and Grandview, Series 2001A, 6.750%, 5/15/36 | | 5/12 at 101.00 | N/R | | 3,081,388 | |
| | 13,642 | | Total Housing/Multifamily | | | | | 13,864,951 | |
| | | | Housing/Single Family – 3.2% (2.2% of Total Investments) | | | | | | |
| | 1,490 | | California Housing Finance Agency, California, Home Mortgage Revenue Bonds, Series 2007G, 5.050%, 2/01/29 (Alternative Minimum Tax) | | 2/17 at 100.00 | BBB | | 1,434,959 | |
| | 220 | | California Housing Finance Agency, Home Mortgage Revenue Bonds, Series 2006H, 5.750%, 8/01/30 –FGIC Insured (Alternative Minimum Tax) | | 2/16 at 100.00 | BBB | | 220,150 | |
| | | Nuveen California Dividend Advantage Municipal Fund 2 (continued) |
| NVX | | Portfolio of Investments |
February 29, 2012
| | Principal | | | | Optional Call | | | | |
| | Amount (000) | | Description (1) | | Provisions (2) | Ratings (3) | | Value | |
| | | | Housing/Single Family (continued) | | | | | | |
| $ | 5,775 | | California Housing Finance Agency, Home Mortgage Revenue Bonds, Series 2006M, 4.650%, 8/01/31 (Alternative Minimum Tax) | | 2/16 at 100.00 | BBB | $ | 5,293,423 | |
| | 375 | | California Rural Home Mortgage Finance Authority, Mortgage-Backed Securities Program Single Family Mortgage Revenue Bonds, Series 2001A, 5.650%, 12/01/31 (Alternative Minimum Tax) | | 6/12 at 101.00 | A– | | 388,530 | |
| | 7,860 | | Total Housing/Single Family | | | | | 7,337,062 | |
| | | | Industrials – 0.3% (0.2% of Total Investments) | | | | | | |
| | 3,175 | | California Statewide Communities Development Authority, Revenue Bonds, EnerTech Regional Biosolids Project, Series 2007A, 5.500%, 12/01/33 (Alternative Minimum Tax) (5) | | No Opt. Call | D | | 693,611 | |
| | | | Long-Term Care – 0.7% (0.5% of Total Investments) | | | | | | |
| | 1,550 | | California Health Facilities Financing Authority, Cal-Mortgage Insured Revenue Bonds, Northern California Retired Officers Community Corporation – Paradise Valley Estates, Series 2002, 5.125%, 1/01/22 | | 1/13 at 100.00 | A– | | 1,576,443 | |
| | | | Tax Obligation/General – 24.3% (16.9% of Total Investments) | | | | | | |
| | 10,000 | | California State, General Obligation Bonds, Series 2006CD, 4.600%, 12/01/32 (Alternative Minimum Tax) | | 12/15 at 100.00 | AA | | 10,104,800 | |
| | 13,850 | | California State, General Obligation Bonds, Various Purpose Series 2009, 6.000%, 4/01/38 | | No Opt. Call | A1 | | 16,067,939 | |
| | | | California State, General Obligation Bonds, Various Purpose Series 2010: | | | | | | |
| | 2,000 | | 6.000%, 3/01/33 | | 3/20 at 100.00 | A1 | | 2,398,200 | |
| | 1,000 | | 5.250%, 11/01/40 | | 11/20 at 100.00 | A1 | | 1,091,170 | |
| | | | California State, General Obligation Bonds, Various Purpose Series 2011: | | | | | | |
| | 2,300 | | 5.000%, 9/01/41 | | No Opt. Call | A1 | | 2,458,792 | |
| | 4,000 | | 5.000%, 10/01/41 | | 10/21 at 100.00 | A1 | | 4,278,000 | |
| | 3,615 | | Colton Joint Unified School District, San Bernardino County, California, General Obligation Bonds, Series 2002A, 5.500%, 8/01/22 – FGIC Insured | | 8/12 at 102.00 | Aa3 | | 3,761,986 | |
| | 1,285 | | Los Angeles Unified School District, Los Angeles County, California, General Obligation Bonds, Series 2009D, 5.000%, 7/01/27 | | 7/19 at 100.00 | Aa2 | | 1,477,300 | |
| | 2,000 | | Puerto Rico, General Obligation and Public Improvement Bonds, Series 2002A, 5.500%, 7/01/20 – NPFG Insured | | No Opt. Call | Baa1 | | 2,275,400 | |
| | 355 | | Roseville Joint Union High School District, Placer County, California, General Obligation Bonds, Series 2006B, 5.000%, 8/01/27 – FGIC Insured | | 8/15 at 100.00 | AA– | | 392,424 | |
| | 1,000 | | Southwestern Community College District, San Diego County, California, General Obligation Bonds, Election of 2008, Series 2011C, 5.250%, 8/01/36 | | 8/21 at 100.00 | Aa2 | | 1,136,390 | |
| | | | Yosemite Community College District, California, General Obligation Bonds, Capital Appreciation, Election 2004, Series 2010D: | | | | | | |
| | 6,480 | | 0.000%, 8/01/31 | | No Opt. Call | Aa2 | | 2,552,407 | |
| | 17,510 | | 0.000%, 8/01/42 | | No Opt. Call | Aa2 | | 5,850,441 | |
| | 1,600 | | Yuba Community College District, California, General Obligation Bonds, Election 2006 Series 2011C, 5.250%, 8/01/47 | | 8/21 at 100.00 | Aa2 | | 1,757,120 | |
| | 66,995 | | Total Tax Obligation/General | | | | | 55,602,369 | |
| | | | Tax Obligation/Limited – 20.6% (14.3% of Total Investments) | | | | | | |
| | | | Beaumont Financing Authority, California, Local Agency Revenue Bonds, Series 2004D: | | | | | | |
| | 650 | | 5.500%, 9/01/24 | | 9/14 at 102.00 | N/R | | 661,395 | |
| | 385 | | 5.800%, 9/01/35 | | 9/14 at 102.00 | N/R | | 387,876 | |
| | 1,190 | | Borrego Water District, California, Community Facilities District 2007-1 Montesoro, Special Tax Bonds, Series 2007, 5.750%, 8/01/25 (5) | | 8/17 at 102.00 | N/R | | 380,836 | |
| | 4,900 | | California State Public Works Board, Lease Revenue Bonds, Department of Corrections, Series 2003C, 5.500%, 6/01/16 | | 12/13 at 100.00 | A2 | | 5,177,830 | |
| | 1,245 | | California, Economic Recovery Revenue Bonds, Series 2004A, 5.000%, 7/01/15 | | 7/14 at 100.00 | Aa3 | | 1,368,504 | |
| | 1,200 | | Capistrano Unified School District, Orange County, California, Special Tax Bonds, Community Facilities District 90-2 – Talega, Series 2003, 6.000%, 9/01/33 | | 9/13 at 100.00 | N/R | | 1,215,972 | |
| | Principal | | | | Optional Call | | | | |
| | Amount (000) | | Description (1) | | Provisions (2) | Ratings (3) | | Value | |
| | | | Tax Obligation/Limited (continued) | | | | | | |
| $ | 435 | | Capistrano Unified School District, Orange County, California, Special Tax Bonds, Community Facilities District, Series 2005, 5.000%, 9/01/24 – FGIC Insured | | 9/15 at 100.00 | BBB | $ | 446,519 | |
| | 700 | | Dinuba Redevelopment Agency, California, Tax Allocation Bonds, Merged City of Dinuba Redevelopment Project and Dinuba Redevelopment Project 2, As Amended, Series 2003, 5.000%, 9/01/33 – NPFG Insured | | 9/13 at 102.00 | A– | | 704,802 | |
| | 960 | | Fontana, California, Redevelopment Agency, Jurupa Hills Redevelopment Project, Tax Allocation Refunding Bonds, 1997 Series A, 5.500%, 10/01/27 | | 4/12 at 100.00 | A– | | 960,672 | |
| | 750 | | Fontana, California, Special Tax Bonds, Sierra Community Facilities District 22, Series 2004, 6.000%, 9/01/34 | | 9/14 at 100.00 | N/R | | 757,268 | |
| | 1,785 | | Hawthorne Community Redevelopment Agency, California, Project Area 2 Tax Allocation Bonds, Series 2006, 5.250%, 9/01/36 – SYNCORA GTY Insured | | 9/16 at 100.00 | A– | | 1,815,381 | |
| | 1,800 | | Hesperia Unified School District, San Bernardino County, California, Certificates of Participation, Capital Improvement, Series 2007, 5.000%, 2/01/41 – AMBAC Insured | | 2/17 at 100.00 | A– | | 1,782,000 | |
| | 870 | | Inglewood Redevelopment Agency, California, Tax Allocation Bonds, Merged Redevelopment Project, Subordinate Lien Series 2007A-1, 5.000%, 5/01/23 – AMBAC Insured | | 5/17 at 100.00 | BBB+ | | 873,480 | |
| | | | Irvine, California, Unified School District, Community Facilities District Special Tax Bonds, Series 2006A: | | | | | | |
| | 205 | | 5.000%, 9/01/26 | | 9/16 at 100.00 | N/R | | 208,719 | |
| | 470 | | 5.125%, 9/01/36 | | 9/16 at 100.00 | N/R | | 470,653 | |
| | 2,000 | | Lake Elsinore Public Finance Authority, California, Local Agency Revenue Refunding Bonds, Series 2003H, 6.000%, 10/01/20 | | 10/13 at 102.00 | N/R | | 2,080,180 | |
| | 415 | | Lammersville School District, San Joaquin County, California, Community Facilities District 2002, Mountain House Special Tax Bonds, Series 2006, 5.125%, 9/01/35 | | 9/16 at 100.00 | N/R | | 387,357 | |
| | 1,265 | | Lee Lake Water District, Riverside County, California, Special Tax Bonds, Community Facilities District 1 of Sycamore Creek, Series 2003, 6.500%, 9/01/24 | | 9/13 at 102.00 | N/R | | 1,320,749 | |
| | 800 | | Los Angeles Community Redevelopment Agency, California, Lease Revenue Bonds, Manchester Social Services Project, Series 2005, 5.000%, 9/01/37 – AMBAC Insured | | 9/15 at 100.00 | A1 | | 809,600 | |
| | 750 | | Lynwood Redevelopment Agency, California, Project A Revenue Bonds, Subordinate Lien Series 2011A, 7.000%, 9/01/31 | | 9/21 at 100.00 | A– | | 869,160 | |
| | 475 | | National City Community Redevelopment Agency, California, Tax Allocation Revenue Bonds, National City Redevelopment Project Area, Series 2011, 6.500%, 8/01/24 | | 8/21 at 100.00 | A– | | 550,169 | |
| | 485 | | North Natomas Community Facilities District 4, Sacramento, California, Special Tax Bonds, Series 2006D, 5.000%, 9/01/33 | | 9/14 at 102.00 | N/R | | 454,057 | |
| | 175 | | Novato Redevelopment Agency, California, Tax Allocation Bonds, Hamilton Field Redevelopment Project, Series 2011, 6.750%, 9/01/40 | | 9/21 at 100.00 | A– | | 198,655 | |
| | 2,000 | | Orange County, California, Special Tax Bonds, Community Facilities District 02-1 of Ladera Ranch, Series 2003A, 5.550%, 8/15/33 | | 8/12 at 100.00 | N/R | | 2,005,540 | |
| | | | Perris Union High School District Financing Authority, Riverside County, California, Revenue Bonds, Series 2011: | | | | | | |
| | 165 | | 6.000%, 9/01/33 | | No Opt. Call | N/R | | 170,288 | |
| | 360 | | 6.125%, 9/01/41 | | No Opt. Call | N/R | | 371,376 | |
| | 3,085 | | Pittsburg Redevelopment Agency, California, Tax Allocation Bonds, Los Medanos Community Development Project, Refunding Series 2008A, 6.500%, 9/01/28 | | 9/18 at 100.00 | BBB | | 3,200,626 | |
| | 550 | | Rancho Santa Fe CSD Financing Authority, California, Revenue Bonds, Superior Lien Series 2011A, 5.750%, 9/01/30 | | 9/21 at 100.00 | BBB+ | | 593,423 | |
| | 385 | | Rialto Redevelopment Agency, California, Tax Allocation Bonds, Merged Project Area, Series 2005A, 5.000%, 9/01/35 – SYNCORA GTY Insured | | 9/15 at 100.00 | A– | | 380,022 | |
| | 100 | | Riverside County Redevelopment Agency, California, Tax Allocation Revenue Bonds, Jurupa Valley Project Area Series 2011-B, 6.500%, 10/01/25 | | 10/21 at 100.00 | A– | | 110,748 | |
| | 475 | | Roseville, California, Certificates of Participation, Public Facilities, Series 2003A, 5.000%, 8/01/25 – AMBAC Insured | | 8/13 at 100.00 | AA– | | 485,075 | |
| | | Nuveen California Dividend Advantage Municipal Fund 2 (continued) |
| NVX | | Portfolio of Investments |
February 29, 2012
| | Principal | | | | Optional Call | | | | |
| | Amount (000) | | Description (1) | | Provisions (2) | Ratings (3) | | Value | |
| | | | Tax Obligation/Limited (continued) | | | | | | |
| $ | 700 | | Sacramento, California, Special Tax Bonds, North Natomas Community Facilities District 4, Series 2003C, 6.000%, 9/01/33 | | 9/14 at 100.00 | N/R | $ | 715,134 | |
| | | | San Buenaventura Redevelopment Agency, California, Merged Project Areas Tax Allocation Bonds, Series 2008: | | | | | | |
| | 1,000 | | 7.750%, 8/01/28 | | 8/16 at 102.00 | A | | 1,139,540 | |
| | 1,325 | | 8.000%, 8/01/38 | | 8/16 at 102.00 | A | | 1,505,863 | |
| | 990 | | San Diego, California, Special Tax Community Facilities District 4 Black Mountain Ranch Villages Bonds, Series 2008A, 6.000%, 9/01/37 | | 3/12 at 103.00 | N/R | | 1,022,789 | |
| | 80 | | San Francisco Redevelopment Finance Authority, California, Tax Allocation Revenue Bonds, Mission Bay North Redevelopment Project, Series 2011C, 6.750%, 8/01/41 | | 3/12 at 103.00 | A– | | 90,275 | |
| | | | San Francisco Redevelopment Financing Authority, California, Tax Allocation Revenue Bonds, Mission Bay South Redevelopment Project, Series 2011D: | | | | | | |
| | 85 | | 7.000%, 8/01/33 | | 2/21 at 100.00 | BBB | | 96,784 | |
| | 105 | | 7.000%, 8/01/41 | | 2/21 at 100.00 | BBB | | 118,190 | |
| | 765 | | San Jose Redevelopment Agency, California, Tax Allocation Bonds, Merged Area Redevelopment Project, Series 2006C, 5.000%, 8/01/25 – NPFG Insured | | 8/17 at 100.00 | BBB | | 767,853 | |
| | 995 | | San Jose Redevelopment Agency, California, Tax Allocation Bonds, Merged Area Redevelopment Project, Series 2006D, 5.000%, 8/01/23 – AMBAC Insured | | 8/17 at 100.00 | BBB | | 1,006,253 | |
| | 1,530 | | San Marcos Public Facilities Authority, California, Tax Allocation Bonds, Project Areas 2 and 3, Series 2005C, 5.000%, 8/01/35 – AMBAC Insured | | 8/15 at 100.00 | A– | | 1,510,187 | |
| | 140 | | Signal Hill Redevelopment Agency, California, Project 1 Tax Allocation Bonds, Series 2011, 7.000%, 10/01/26 | | 4/21 at 100.00 | N/R | | 149,083 | |
| | 415 | | West Patterson Financing Authority, California, Special Tax Bonds, Community Facilities District 01-1, Refunding Series 2009A, 8.625%, 9/01/39 | | 9/14 at 105.00 | N/R | | 448,922 | |
| | 1,930 | | West Patterson Financing Authority, California, Special Tax Bonds, Community Facilities District 01-1, Series 2003B, 6.750%, 9/01/30 | | 9/13 at 103.00 | N/R | | 1,947,293 | |
| | 500 | | West Patterson Financing Authority, California, Special Tax Bonds, Community Facilities District 01-1, Series 2004B, 6.000%, 9/01/39 | | 9/13 at 102.00 | N/R | | 450,525 | |
| | 850 | | West Patterson Financing Authority, California, Special Tax Bonds, Community Facilities District 2001-1, Series 2004A, 6.125%, 9/01/39 | | 9/13 at 103.00 | N/R | | 779,034 | |
| | 3,715 | | Western Placer Unified School District, Placer County, California, Certificates of Participation, Series 2008, 5.000%, 8/01/47 – AGC Insured | | 8/18 at 100.00 | AA– | | 3,822,698 | |
| | 240 | | Yorba Linda Redevelopment Agency, Orange County, California, Tax Allocation Revenue Bonds, Yorba Linda Redevelopment Project, Subordinate Lien Series 2011A, 6.500%, 9/01/32 | | 9/21 at 100.00 | A– | | 267,646 | |
| | 46,395 | | Total Tax Obligation/Limited | | | | | 47,037,001 | |
| | | | Transportation – 8.6% (6.0% of Total Investments) | | | | | | |
| | 3,000 | | Bay Area Governments Association, California, BART SFO Extension, Airport Premium Fare Revenue Bonds, Series 2002A, 5.000%, 8/01/32 – AMBAC Insured | | 8/12 at 100.00 | N/R | | 2,848,950 | |
| | 1,930 | | Bay Area Toll Authority, California, Revenue Bonds, San Francisco Bay Area Toll Bridge, Series 2006F, 5.000%, 4/01/31 (UB) | | 4/16 at 100.00 | AA | | 2,170,343 | |
| | 1,430 | | Bay Area Toll Authority, California, Revenue Bonds, San Francisco Bay Area Toll Bridge, Series 2008, Trust 3211, 13.491%, 10/01/32 (IF) | | 4/18 at 100.00 | AA | | 1,861,803 | |
| | 7,000 | | Foothill/Eastern Transportation Corridor Agency, California, Toll Road Revenue Refunding Bonds, Series 1999, 5.875%, 1/15/27 | | 1/14 at 101.00 | BBB– | | 7,079,100 | |
| | 5,585 | | Port of Oakland, California, Revenue Bonds, Series 2002N, 5.000%, 11/01/16 – NPFG Insured (Alternative Minimum Tax) | | 11/12 at 100.00 | A | | 5,706,139 | |
| | 18,945 | | Total Transportation | | | | | 19,666,335 | |
| | Principal | | | | Optional Call | | | | |
| | Amount (000) | | Description (1) | | Provisions (2) | Ratings (3) | | Value | |
| | | | U.S. Guaranteed – 19.7% (13.7% of Total Investments) (6) | | | | | | |
| $ | 2,000 | | California Department of Water Resources, Power Supply Revenue Bonds, Series 2002A, 5.125%, 5/01/18 (Pre-refunded 5/01/12) | | 5/12 at 101.00 | Aaa | $ | 2,037,260 | |
| | 425 | | California Statewide Community Development Authority, Revenue Bonds, Thomas Jefferson School of Law, Series 2005A, 4.875%, 10/01/31 (Pre-refunded 10/01/15) | | 10/15 at 100.00 | N/R (6) | | 474,360 | |
| | 860 | | California, Economic Recovery Revenue Bonds, Series 2004A, 5.000%, 7/01/15 (Pre-refunded 7/01/14) | | 7/14 at 100.00 | Aaa | | 955,314 | |
| | | | Contra Costa County Community College District, California, General Obligation Bonds, Series 2002: | | | | | | |
| | 3,005 | | 5.000%, 8/01/21 (Pre-refunded 8/01/12) – FGIC Insured | | 8/12 at 100.00 | Aa1 (6) | | 3,066,723 | |
| | 3,300 | | 5.000%, 8/01/22 (Pre-refunded 8/01/12) – FGIC Insured | | 8/12 at 100.00 | Aa1 (6) | | 3,367,782 | |
| | 4,000 | | Daly City Housing Development Finance Agency, California, Mobile Home Park Revenue Bonds, Franciscan Mobile Home Park Project, Series 2002A, 5.850%, 12/15/32 (Pre-refunded 12/15/13) | | 12/13 at 102.00 | N/R (6) | | 4,469,360 | |
| | 2,005 | | Golden State Tobacco Securitization Corporation, California, Tobacco Settlement Asset-Backed Bonds, Series 2003A-1, 6.250%, 6/01/33 (Pre-refunded 6/01/13) | | 6/13 at 100.00 | Aaa | | 2,128,388 | |
| | 1,170 | | Lincoln, California, Special Tax Bonds, Lincoln Crossing Community Facilities District 03-1, Series 2003A, 6.500%, 9/01/25 (Pre-refunded 9/01/13) | | 9/13 at 102.00 | N/R (6) | | 1,299,051 | |
| | 885 | | Lincoln, California, Special Tax Bonds, Lincoln Crossing Community Facilities District 03-1, Series 2004, 6.000%, 9/01/34 (Pre-refunded 9/01/13) | | 9/13 at 102.00 | N/R (6) | | 975,987 | |
| | 9,510 | | Los Angeles Unified School District, California, General Obligation Bonds, Series 2002E, 5.000%, 7/01/19 (Pre-refunded 7/01/12) – NPFG Insured | | 7/12 at 100.00 | AA– (6) | | 9,667,010 | |
| | 2,000 | | Puerto Rico Public Finance Corporation, Commonwealth Appropriation Bonds, Series 2002E, 6.000%, 8/01/26 (ETM) | | No Opt. Call | AA+ (6) | | 2,884,280 | |
| | | | San Francisco Airports Commission, California, Revenue Bonds, San Francisco International Airport, Second Series 2003, Issue 29A: | | | | | | |
| | 2,430 | | 5.250%, 5/01/18 (Pre-refunded 5/01/13) – FGIC Insured (Alternative Minimum Tax) | | 5/13 at 100.00 | A+ (6) | | 2,573,443 | |
| | 2,555 | | 5.250%, 5/01/19 (Pre-refunded 5/01/13) – FGIC Insured (Alternative Minimum Tax) | | 5/13 at 100.00 | A+ (6) | | 2,705,822 | |
| | 1,000 | | San Francisco Airports Commission, California, Revenue Bonds, San Francisco International Airport, Second Series 2003, Issue 29B, 5.125%, 5/01/17 (Pre-refunded 5/01/13) – FGIC Insured | | 5/13 at 100.00 | A+ (6) | | 1,057,570 | |
| | 2,000 | | San Francisco Airports Commission, California, Revenue Refunding Bonds, San Francisco International Airport, Second Series 2002, Issue 28A, 5.250%, 5/01/17 (Pre-refunded 5/01/12) – NPFG Insured (Alternative Minimum Tax) | | 5/12 at 100.00 | A+ (6) | | 2,015,720 | |
| | 825 | | San Mateo Union High School District, San Mateo County, California, Certificates of Participation, Phase 1, Series 2007A, 5.000%, 12/15/30 (Pre-refunded 12/15/17) – AMBAC Insured | | 12/17 at 100.00 | AA– (6) | | 1,016,070 | |
| | 2,800 | | Tobacco Securitization Authority of Southern California, Tobacco Settlement Asset-Backed Bonds, San Diego County Tobacco Asset Securitization Corporation, Senior Series 2001A, 5.500%, 6/01/36 (Pre-refunded 6/01/12) | | 6/12 at 100.00 | Aaa | | 2,838,472 | |
| | 1,500 | | Whittier, California, Health Facility Revenue Bonds, Presbyterian Intercommunity Hospital, Series 2002, 5.600%, 6/01/22 (Pre-refunded 6/01/12) | | 6/12 at 101.00 | N/R (6) | | 1,536,015 | |
| | 42,270 | | Total U.S. Guaranteed | | | | | 45,068,627 | |
| | | | Utilities – 8.6% (5.9% of Total Investments) | | | | | | |
| | 5,000 | | Anaheim Public Finance Authority, California, Second Lien Electric Distribution Revenue Bonds, Series 2004, 5.250%, 10/01/21 – NPFG Insured | | 10/14 at 100.00 | A+ | | 5,332,400 | |
| | 2,355 | | Long Beach Bond Finance Authority, California, Natural Gas Purchase Revenue Bonds, Series 2007A, 5.000%, 11/15/35 | | No Opt. Call | A– | | 2,414,558 | |
| | 1,000 | | Los Angeles Department of Water and Power, California, Power System Revenue Bonds, Series 2003A-2, 5.000%, 7/01/23 – NPFG Insured | | 7/13 at 100.00 | AA– | | 1,059,060 | |
| | 500 | | Los Angeles Department of Water and Power, California, Power System Revenue Bonds, Series 2005A-1, 5.000%, 7/01/31 – AGM Insured (UB) | | 7/15 at 100.00 | AA– | | 533,415 | |
| | | | Merced Irrigation District, California, Electric System Revenue Bonds, Series 2005: | | | | | | |
| | 790 | | 5.125%, 9/01/31 – SYNCORA GTY Insured | | 9/15 at 100.00 | N/R | | 785,663 | |
| | 1,500 | | 5.250%, 9/01/36 – SYNCORA GTY Insured | | 9/15 at 100.00 | N/R | | 1,485,705 | |
| | 2,000 | | Santa Clara, California, Subordinate Electric Revenue Bonds, Series 2003A, 5.250%, 7/01/20 – NPFG Insured | | 7/13 at 100.00 | A1 | | 2,113,420 | |
| | | Nuveen California Dividend Advantage Municipal Fund 2 (continued) |
| NVX | | Portfolio of Investments |
February 29, 2012
| | Principal | | | | Optional Call | | | | |
| | Amount (000) | | Description (1) | | Provisions (2) | Ratings (3) | | Value | |
| | | | Utilities (continued) | | | | | | |
| $ | 1,500 | | Southern California Public Power Authority, California, Milford Wind Corridor Phase I Revenue Bonds, Series 2010-1, 5.000%, 7/01/28 | | No Opt. Call | AA– | $ | 1,724,505 | |
| | 4,000 | | Southern California Public Power Authority, Natural Gas Project 1 Revenue Bonds, Series 2007A, 5.000%, 11/01/33 | | No Opt. Call | Baa1 | | 4,140,680 | |
| | 18,645 | | Total Utilities | | | | | 19,589,406 | |
| | | | Water and Sewer – 10.4% (7.2% of Total Investments) | | | | | | |
| | 1,400 | | Castaic Lake Water Agency, California, Certificates of Participation, Series 2006C, 5.000%, 8/01/36 – NPFG Insured | | 8/16 at 100.00 | AA– | | 1,450,162 | |
| | 545 | | Healdsburg Public Financing Authority, California, Wastewater Revenue Bonds, Series 2006, 5.000%, 4/01/36 – NPFG Insured | | 4/16 at 100.00 | AA– | | 566,914 | |
| | 1,160 | | Metropolitan Water District of Southern California, Waterworks Revenue Bonds, Tender Option Bond Trust 09-8B, 18.162%, 7/01/35 (IF) (4) | | 7/19 at 100.00 | AAA | | 1,749,141 | |
| | 1,500 | | Orange County Water District, California, Revenue Certificates of Participation, Tender Option Bond Trust 11782-1, 17.835%, 2/15/35 (IF) | | 8/19 at 100.00 | AAA | | 2,092,620 | |
| | 750 | | Sacramento County Sanitation District Financing Authority, California, Revenue Bonds, Series 2006, 5.000%, 12/01/31 – FGIC Insured | | 6/16 at 100.00 | AA | | 815,888 | |
| | 1,700 | | San Buenaventura, California, Wastewater Revenue Certificates of Participation, Series 2004, 5.000%, 3/01/24 – NPFG Insured | | 3/14 at 100.00 | AA | | 1,784,575 | |
| | 4,785 | | San Diego Public Facilities Financing Authority, California, Subordinate Lien Water Revenue Bonds, Series 2002, 5.000%, 8/01/21 – NPFG Insured | | 8/12 at 100.00 | Aa3 | | 4,865,197 | |
| | 10,000 | | San Francisco City and County Public Utilities Commission, California, Clean Water Revenue Refunding Bonds, Series 2003A, 5.250%, 10/01/20 – NPFG Insured | | 4/13 at 100.00 | AA– | | 10,464,100 | |
| | 21,840 | | Total Water and Sewer | | | | | 23,788,597 | |
| $ | 337,975 | | Total Investments (cost $311,649,957) – 144.3% | | | | | 329,724,378 | |
| | | | Floating Rate Obligations – (5.0)% | | | | | (11,390,000 | ) |
| | | | MuniFund Term Preferred Shares, at Liquidation Value – (42.8)% (7) | | | | | (97,846,300 | ) |
| | | | Other Assets Less Liabilities – 3.5% | | | | | 7,985,919 | |
| | | | Net Assets Applicable to Common Shares – 100% | | | | $ | 228,473,997 | |
| (1) | | All percentages shown in the Portfolio of Investments are based on net assets applicable to Common shares unless otherwise noted. |
| (2) | | Optional Call Provisions (not covered by the report of independent registered public accounting firm): Dates (month and year) and prices of the earliest optional call or redemption. There may be other call provisions at varying prices at later dates. Certain mortgage-backed securities may be subject to periodic principal paydowns. |
| (3) | | Ratings (not covered by the report of independent registered public accounting firm): Using the highest of Standard & Poor’s Group (“Standard & Poor’s”), Moody’s Investors Service, Inc. (“Moody’s”) or Fitch, Inc. (“Fitch”) rating. Ratings below BBB by Standard & Poor’s, Baa by Moody’s or BBB by Fitch are considered to be below investment grade. Holdings designated N/R are not rated by any of these national rating agencies. |
| (4) | | Investment, or portion of investment, has been pledged to collaterize the net payment obligations for investments in inverse floating rate transactions. |
| (5) | | At or subsequent to the end of the reporting period, this security is non-income producing. Non-income producing security, in the case of a bond, generally denotes that the issuer has (1) defaulted on the payment of principal or interest, (2) is under the protection of the Federal Bankruptcy Court or (3) the Fund’s Adviser has concluded that the issue is not likely to meet its future interest payment obligations and has directed the Fund’s custodian to cease accruing additional income on the Fund’s records. |
| (6) | | Backed by an escrow or trust containing sufficient U.S. Government or U.S. Government agency securities, which ensure the timely payment of principal and interest. Certain bonds backed by U.S. Government or agency securities are regarded as having an implied rating equal to the rating of such securities. |
| (7) | | MuniFund Term Preferred Shares, at Liquidation Value as a percentage of Total Investments is 29.7%. |
| N/R | | Not rated. |
| (ETM) | | Escrowed to maturity. |
| WI/DD | | Purchased on a when-issued or delayed delivery basis. |
| (IF) | | Inverse floating rate investment. |
| (UB) | | Underlying bond of an inverse floating rate trust reflected as a financing transaction. See Notes to Financial Statements, Footnote 1 – General Information and Significant Accounting Policies, Inverse Floating Rate Securities for more information. |
See accompanying notes to financial statements.
| | | Nuveen California Dividend Advantage Municipal Fund 3 |
| NZH | | Portfolio of Investments |
| | | February 29, 2012 |
| | Principal | | | | Optional Call | | | | |
| | Amount (000) | | Description (1) | | Provisions (2) | Ratings (3) | | Value | |
| | | | Consumer Staples – 8.4% (5.7% of Total Investments) | | | | | | |
| $ | 870 | | California County Tobacco Securitization Agency, Tobacco Settlement Asset-Backed Bonds, Sonoma County Tobacco Securitization Corporation, Series 2005, 4.250%, 6/01/21 | | 6/15 at 100.00 | BB+ | $ | 838,932 | |
| | | | Golden State Tobacco Securitization Corporation, California, Tobacco Settlement Asset-Backed Bonds, Series 2007A-1: | | | | | | |
| | 19,485 | | 5.750%, 6/01/47 | | 6/17 at 100.00 | B– | | 14,967,013 | |
| | 6,325 | | 5.125%, 6/01/47 | | 6/17 at 100.00 | B– | | 4,378,924 | |
| | 11,265 | | Golden State Tobacco Securitization Corporation, California, Tobacco Settlement Asset-Backed Bonds, Series 2007A-2, 0.000%, 6/01/37 | | 6/22 at 100.00 | B– | | 7,865,561 | |
| | 37,945 | | Total Consumer Staples | | | | | 28,050,430 | |
| | | | Education and Civic Organizations – 6.4% (4.4% of Total Investments) | | | | | | |
| | 290 | | California Educational Facilities Authority, Revenue Bonds, University of Redlands, Series 2005A, 5.000%, 10/01/35 | | 10/15 at 100.00 | A3 | | 296,142 | |
| | 2,160 | | California Educational Facilities Authority, Revenue Bonds, University of San Francisco, Series 2011, 6.125%, 10/01/36 | | 10/21 at 100.00 | A3 | | 2,567,030 | |
| | | | California Educational Facilities Authority, Revenue Bonds, University of the Pacific, Series 2006: | | | | | | |
| | 200 | | 5.000%, 11/01/21 | | 11/15 at 100.00 | A2 | | 215,086 | |
| | 270 | | 5.000%, 11/01/25 | | 11/15 at 100.00 | A2 | | 286,586 | |
| | 1,000 | | 5.000%, 11/01/30 | | 11/15 at 100.00 | A2 | | 1,043,680 | |
| | 1,500 | | California Educational Facilities Authority, Student Loan Revenue Bonds, Cal Loan Program, Series 2001A, 5.400%, 3/01/21 – NPFG Insured (Alternative Minimum Tax) | | 9/12 at 100.00 | Baa2 | | 1,501,740 | |
| | 6,000 | | California State University, Systemwide Revenue Bonds, Series 2005C, 5.000%, 11/01/27 – NPFG Insured | | 11/15 at 100.00 | Aa2 | | 6,405,000 | |
| | 1,300 | | California Statewide Communities Development Authority, School Facility Revenue Bonds, Alliance College-Ready Public Schools, Series 2011A, 7.000%, 7/01/46 | | 7/21 at 100.00 | N/R | | 1,375,582 | |
| | 605 | | California Statewide Community Development Authority, Revenue Bonds, Notre Dame de Namur University, Series 2003, 6.500%, 10/01/23 | | 10/13 at 100.00 | N/R | | 605,762 | |
| | 3,100 | | San Diego County, California, Certificates of Participation, Burnham Institute, Series 2006, 5.000%, 9/01/34 | | 9/15 at 102.00 | Baa3 | | 3,114,787 | |
| | 4,000 | | University of California, General Revenue Bonds, Series 2003A, 5.000%, | | 5/13 at 100.00 | Aa1 | | 4,211,840 | |
| | | | 5/15/23 – AMBAC Insured (UB) | | | | | | |
| | 20,425 | | Total Education and Civic Organizations | | | | | 21,623,235 | |
| | | | Health Care – 32.1% (22.1% of Total Investments) | | | | | | |
| | | | California Health Facilities Financing Authority, Revenue Bonds, Casa Colina Inc., Series 2001: | | | | | | |
| | 4,000 | | 6.000%, 4/01/22 | | 4/12 at 100.00 | BBB | | 4,007,360 | |
| | 2,000 | | 6.125%, 4/01/32 | | 4/12 at 100.00 | BBB | | 2,002,440 | |
| | 1,445 | | California Health Facilities Financing Authority, Revenue Bonds, Rady Children’s Hospital – San Diego, Series 2011, 5.250%, 8/15/41 | | 8/21 at 100.00 | A2 | | 1,507,915 | |
| | 1,765 | | California Health Facilities Financing Authority, Revenue Bonds, St. Joseph Health System, Series 2009A, 5.750%, 7/01/39 | | 7/19 at 100.00 | AA– | | 1,956,697 | |
| | 3,530 | | California Health Facilities Financing Authority, Revenue Bonds, Sutter Health, Series 2011B, 6.000%, 8/15/42 | | 8/20 at 100.00 | AA– | | 4,085,975 | |
| | 3,735 | | California Health Facilities Financing Authority, Revenue Bonds, Sutter Health, Tender Option Bonds Trust 3765, 18.979%, 5/15/39 (IF) (4) | | 11/16 at 100.00 | AA– | | 4,464,744 | |
| | 2,520 | | California Statewide Communities Development Authority, Revenue Bonds, Adventist Health System West, Series 2005A, 5.000%, 3/01/35 | | 3/15 at 100.00 | A | | 2,558,228 | |
| | 1,650 | | California Statewide Communities Development Authority, Revenue Bonds, Adventist Health System West, Series 2007B, 5.000%, 3/01/37 – AGC Insured | | 3/18 at 100.00 | AA– | | 1,728,540 | |
| | 8,875 | | California Statewide Communities Development Authority, Revenue Bonds, Sutter Health, Series 2011A, 6.000%, 8/15/42 | | 8/20 at 100.00 | AA– | | 10,272,813 | |
| | | Nuveen California Dividend Advantage Municipal Fund 3 (continued) |
| NZH | | Portfolio of Investments |
February 29, 2012
| | Principal | | | | Optional Call | | | | |
| | Amount (000) | | Description (1) | | Provisions (2) | Ratings (3) | | Value | |
| | | | Health Care (continued) | | | | | | |
| $ | 3,435 | | California Statewide Communities Development Authority, Revenue Bonds, ValleyCare Health System, Series 2007A, 5.125%, 7/15/31 | | 7/17 at 100.00 | N/R | $ | 3,157,658 | |
| | 6,525 | | California Statewide Community Development Authority, Health Facility Revenue Refunding Bonds, Memorial Health Services, Series 2003A, 6.000%, 10/01/12 | | No Opt. Call | AA– | | 6,736,345 | |
| | 6,450 | | California Statewide Community Development Authority, Hospital Revenue Bonds, Monterey Peninsula Hospital, Series 2003B, 5.250%, 6/01/18 – AGM Insured | | 6/13 at 100.00 | AA– | | 6,760,503 | |
| | 4,500 | | California Statewide Community Development Authority, Insured Health Facility Revenue Bonds, Catholic Healthcare West, Series 2008K, 5.500%, 7/01/41 – AGC Insured | | 7/17 at 100.00 | AA– | | 4,775,805 | |
| | 7,665 | | California Statewide Community Development Authority, Insured Mortgage Hospital Revenue Bonds, Mission Community Hospital, Series 2001, 5.375%, 11/01/21 | | 5/12 at 100.00 | A– | | 7,676,421 | |
| | 2,000 | | California Statewide Community Development Authority, Revenue Bonds, Daughters of Charity Health System, Series 2005A, 5.250%, 7/01/35 | | 7/15 at 100.00 | BBB | | 1,968,140 | |
| | 645 | | California Statewide Community Development Authority, Revenue Bonds, Kaiser Permanente System, Series 2001C, 5.250%, 8/01/31 | | 8/16 at 100.00 | A+ | | 692,356 | |
| | 3,860 | | California Statewide Community Development Authority, Revenue Bonds, St. Joseph Health System, Series 2007A, 5.750%, 7/01/47 – FGIC Insured | | 7/18 at 100.00 | AA– | | 4,144,829 | |
| | 1,594 | | California Statewide Community Development Authority, Revenue Bonds, St. Joseph Health System, Trust 2554, 18.382%, 7/01/47 – AGM Insured (IF) | | 7/18 at 100.00 | AA– | | 1,950,571 | |
| | 5,600 | | California Statewide Community Development Authority, Revenue Bonds, Sutter Health, Tender Option Bond Trust 3102, 18.374%, 11/15/46 (IF) | | 11/16 at 100.00 | AA– | | 6,694,464 | |
| | 2,950 | | Loma Linda, California, Hospital Revenue Bonds, Loma Linda University Medical Center, Series 2008A, 8.250%, 12/01/38 | | 12/17 at 100.00 | BBB | | 3,360,817 | |
| | 4,000 | | Marysville, California, Revenue Bonds, The Fremont-Rideout Health Group, Series 2011, 5.250%, 1/01/42 | | 1/21 at 100.00 | A | | 4,200,160 | |
| | 2,330 | | Newport Beach, California, Revenue Bonds, Hoag Memorial Hospital Presbyterian, Series 2011A, 6.000%, 12/01/40 | | 12/21 at 100.00 | AA | | 2,781,158 | |
| | 695 | | Oak Valley Hospital District, Stanislaus County, California, Revenue Bonds, Series 2010A, 6.500%, 11/01/29 | | 11/20 at 100.00 | BB+ | | 698,023 | |
| | 7,650 | | Palomar Pomerado Health Care District, California, Certificates of Participation, Series 2010, 6.000%, 11/01/41 | | 11/20 at 100.00 | Baa3 | | 7,867,796 | |
| | | | Rancho Mirage Joint Powers Financing Authority, California, Revenue Bonds, Eisenhower Medical Center, Series 2007A: | | | | | | |
| | 5,790 | | 5.000%, 7/01/38 | | 7/17 at 100.00 | Baa2 | | 5,501,195 | |
| | 2,500 | | 5.000%, 7/01/47 | | 7/17 at 100.00 | Baa2 | | 2,361,950 | |
| | 3,400 | | San Buenaventura, California, Revenue Bonds, Community Memorial Health System, Series 2011, 7.500%, 12/01/41 | | 12/21 at 100.00 | BB | | 3,833,704 | |
| | 101,109 | | Total Health Care | | | | | 107,746,607 | |
| | | | Housing/Multifamily – 3.4% (2.4% of Total Investments) | | | | | | |
| | 2,030 | | California Municipal Finance Authority, Mobile Home Park Revenue Bonds, Caritas Projects Series 2010A, 6.400%, 8/15/45 | | 8/20 at 100.00 | BBB | | 2,097,883 | |
| | 2,020 | | California Municipal Finance Authority, Mobile Home Park Revenue Bonds, Caritas Projects Series 2012A, 5.500%, 8/15/47 (WI/DD, Settling 3/13/12) | | 8/22 at 100.00 | BBB | | 1,999,800 | |
| | 325 | | Independent Cities Lease Finance Authority, California, Mobile Home Park Revenue Bonds, San Juan Mobile Estates, Series 2006B, 5.850%, 5/15/41 | | 5/16 at 100.00 | N/R | | 320,489 | |
| | 1,735 | | Rohnert Park Finance Authority, California, Senior Lien Revenue Bonds, Rancho Feliz Mobile Home Park, Series 2003A, 5.750%, 9/15/38 | | 9/13 at 100.00 | A+ | | 1,750,719 | |
| | 1,125 | | Rohnert Park Finance Authority, California, Subordinate Lien Revenue Bonds, Rancho Feliz Mobile Home Park, Series 2003B, 6.625%, 9/15/38 | | 9/13 at 100.00 | N/R | | 1,137,859 | |
| | | | San Jose, California, Multifamily Housing Revenue Bonds, GNMA Mortgage-Backed Securities Program, Lenzen Housing, Series 2001B: | | | | | | |
| | 1,250 | | 5.350%, 2/20/26 (Alternative Minimum Tax) | | 8/12 at 101.00 | AA+ | | 1,258,513 | |
| | 2,880 | | 5.450%, 2/20/43 (Alternative Minimum Tax) | | 8/12 at 101.00 | AA+ | | 2,912,227 | |
| | 11,365 | | Total Housing/Multifamily | | | | | 11,477,490 | |
| | Principal | | | | Optional Call | | | | |
| | Amount (000) | | Description (1) | | Provisions (2) | Ratings (3) | | Value | |
| | | | Housing/Single Family – 3.4% (2.3% of Total Investments) | | | | | | |
| $ | 370 | | California Housing Finance Agency, Home Mortgage Revenue Bonds, Series 2006H, 5.750%, 8/01/30 – FGIC Insured (Alternative Minimum Tax) | | 2/16 at 100.00 | BBB | $ | 370,252 | |
| | | | California Housing Finance Agency, Home Mortgage Revenue Bonds, Tender Option Bond Trust 3206: | | | | | | |
| | 10,180 | | 7.909%, 8/01/25 (Alternative Minimum Tax) (IF) | | 2/16 at 100.00 | BBB | | 8,058,081 | |
| | 3,805 | | 8.286%, 8/01/29 (Alternative Minimum Tax) (IF) | | 2/17 at 100.00 | BBB | | 2,928,899 | |
| | 14,355 | | Total Housing/Single Family | | | | | 11,357,232 | |
| | | | Industrials – 1.9% (1.3% of Total Investments) | | | | | | |
| | 5,000 | | California Pollution Control Financing Authority, Solid Waste Disposal Revenue Bonds, Waste Management Inc., Series 2005C, 5.125%, 11/01/23 (Alternative Minimum Tax) | | 11/15 at 101.00 | BBB | | 5,214,100 | |
| | 5,205 | | California Statewide Communities Development Authority, Revenue Bonds, EnerTech Regional Biosolids Project, Series 2007A, 5.500%, 12/01/33 (Alternative Minimum Tax) (5) | | No Opt. Call | D | | 1,137,084 | |
| | 10,205 | | Total Industrials | | | | | 6,351,184 | |
| | | | Long-Term Care – 1.9% (1.3% of Total Investments) | | | | | | |
| | 2,450 | | California Health Facilities Financing Authority, Cal-Mortgage Insured Revenue Bonds, Northern California Retired Officers Community Corporation – Paradise Valley Estates, Series 2002, 5.125%, 1/01/22 | | 1/13 at 100.00 | A– | | 2,491,797 | |
| | | | California Health Facilities Financing Authority, Insured Senior Living Revenue Bonds, Aldersly Project, Series 2002A: | | | | | | |
| | 1,500 | | 5.125%, 3/01/22 | | 3/13 at 100.00 | A– | | 1,516,800 | |
| | 1,315 | | 5.250%, 3/01/32 | | 3/13 at 100.00 | A– | | 1,325,546 | |
| | 1,000 | | California Municipal Finance Authority, Revenue Bonds, Harbor Regional Center Project, Series 2009, 8.000%, 11/01/29 | | 11/19 at 100.00 | Baa1 | | 1,144,550 | |
| | 6,265 | | Total Long-Term Care | | | | | 6,478,693 | |
| | | | Tax Obligation/General – 13.3% (9.2% of Total Investments) | | | | | | |
| | | | California State, General Obligation Bonds, Various Purpose Series 2009: | | | | | | |
| | 3,500 | | 5.500%, 11/01/39 | | 11/19 at 100.00 | A1 | | 3,896,270 | |
| | 3,040 | | 6.000%, 11/01/39 | | 11/19 at 100.00 | A1 | | 3,552,878 | |
| | | | California State, General Obligation Bonds, Various Purpose Series 2010: | | | | | | |
| | 1,960 | | 5.500%, 3/01/40 | | 3/20 at 100.00 | A1 | | 2,175,992 | |
| | 1,000 | | 5.250%, 11/01/40 | | 11/20 at 100.00 | A1 | | 1,091,170 | |
| | 7,000 | | California State, General Obligation Bonds, Various Purpose Series 2011, 5.000%, 10/01/41 | | 10/21 at 100.00 | A1 | | 7,486,500 | |
| | 15 | | California, General Obligation Veterans Welfare Bonds, Series 2001BZ, 5.350%, 12/01/21 – NPFG Insured (Alternative Minimum Tax) | | 6/12 at 100.00 | AA | | 15,024 | |
| | 18,500 | | Poway Unified School District, San Diego County, California, School Facilities Improvement District 2007-1 General Obligation Bonds, Series 2011B, 0.000%, 8/01/46 | | No Opt. Call | Aa2 | | 2,923,925 | |
| | 870 | | Puerto Rico, General Obligation and Public Improvement Bonds, Series 2001, 5.000%, 7/01/24 – AGM Insured | | 7/12 at 100.00 | AA– | | 871,105 | |
| | 575 | | Roseville Joint Union High School District, Placer County, California, General Obligation Bonds, Series 2006B, 5.000%, 8/01/27 – FGIC Insured | | 8/15 at 100.00 | AA– | | 635,617 | |
| | 4,000 | | San Diego Unified School District, San Diego County, California, General Obligation Bonds, Election of 1998, Series 2002D, 5.250%, 7/01/21 – FGIC Insured | | 7/12 at 101.00 | Aa2 | | 4,104,240 | |
| | 2,715 | | San Jose-Evergreen Community College District, Santa Clara County, California, General Obligation Bonds, Series 2005A, 5.000%, 9/01/25 – NPFG Insured | | 9/15 at 100.00 | Aa1 | | 3,062,330 | |
| | 2,115 | | San Mateo Union High School District, San Mateo County, California, General Obligation Bonds, Election 2010 Series 2011A, 5.000%, 9/01/42 | | 9/21 at 100.00 | Aa1 | | 2,345,281 | |
| | 5,530 | | Stockton Unified School District, San Joaquin County, California, General Obligation Bonds, Election 2008 Series 2011D, 0.000%, 8/01/50 – AGM Insured | | 8/37 at 100.00 | AA– | | 2,564,703 | |
| | | | Yosemite Community College District, California, General Obligation Bonds, Capital Appreciation, Election 2004, Series 2010D: | | | | | | |
| | 15,000 | | 0.000%, 8/01/31 | | No Opt. Call | Aa2 | | 5,908,350 | |
| | 12,520 | | 0.000%, 8/01/42 | | No Opt. Call | Aa2 | | 4,183,182 | |
| | 78,340 | | Total Tax Obligation/General | | | | | 44,816,567 | |
| | | Nuveen California Dividend Advantage Municipal Fund 3 (continued) |
| NZH | | Portfolio of Investments |
February 29, 2012
| | Principal | | | | Optional Call | | | | |
| | Amount (000) | | Description (1) | | Provisions (2) | Ratings (3) | | Value | |
| | | | Tax Obligation/Limited – 43.4% (29.9% of Total Investments) | | | | | | |
| $ | 1,960 | | Borrego Water District, California, Community Facilities District 2007-1 Montesoro, Special Tax Bonds, Series 2007, 5.750%, 8/01/25 (5) | | 8/17 at 102.00 | N/R | $ | 627,259 | |
| | 8,210 | | California State Public Works Board, Lease Revenue Bonds, Department of Corrections, Series 2003C, 5.500%, 6/01/16 | | 12/13 at 100.00 | A2 | | 8,675,507 | |
| | 4,000 | | California State Public Works Board, Lease Revenue Bonds, Department of General Services, Series 2002B, 5.000%, 3/01/27 – AMBAC Insured | | 3/12 at 100.00 | A2 | | 4,003,920 | |
| | 4,510 | | California State Public Works Board, Lease Revenue Bonds, Department of Mental Health, Hospital Addition, Series 2001A, 5.000%, 12/01/26 – AMBAC Insured | | 12/12 at 101.00 | A2 | | 4,604,845 | |
| | 1,000 | | California State Public Works Board, Lease Revenue Bonds, Various Capital Projects, Series 2009G-1, 5.750%, 10/01/30 | | 10/19 at 100.00 | A2 | | 1,135,590 | |
| | 2,260 | | California State Public Works Board, Lease Revenue Bonds, Various Capital Projects, Series 2010A-1, 5.750%, 3/01/30 | | 3/20 at 100.00 | A2 | | 2,536,059 | |
| | | | Capistrano Unified School District, Orange County, California, Special Tax Bonds, Community Facilities District 90-2 – Talega, Series 2003: | | | | | | |
| | 1,750 | | 5.875%, 9/01/23 | | 9/13 at 100.00 | N/R | | 1,788,483 | |
| | 550 | | 6.000%, 9/01/33 | | 9/13 at 100.00 | N/R | | 557,321 | |
| | 715 | | Capistrano Unified School District, Orange County, California, Special Tax Bonds, Community Facilities District, Series 2005, 5.000%, 9/01/24 – FGIC Insured | | 9/15 at 100.00 | BBB | | 733,933 | |
| | 2,160 | | Chino Redevelopment Agency, California, Merged Chino Redevelopment Project Area Tax Allocation Bonds, Series 2006, 5.000%, 9/01/38 – AMBAC Insured | | 9/16 at 101.00 | A– | | 2,087,683 | |
| | 1,050 | | Dinuba Redevelopment Agency, California, Tax Allocation Bonds, Merged City of Dinuba Redevelopment Project and Dinuba Redevelopment Project 2, As Amended, Series 2003, 5.000%, 9/01/33 – NPFG Insured | | 9/13 at 102.00 | A– | | 1,057,203 | |
| | 1,445 | | Fontana, California, Redevelopment Agency, Jurupa Hills Redevelopment Project, Tax Allocation Refunding Bonds, 1997 Series A, 5.500%, 10/01/27 | | 4/12 at 100.00 | A– | | 1,446,012 | |
| | 1,125 | | Fontana, California, Special Tax Bonds, Sierra Community Facilities District 22, Series 2004, 6.000%, 9/01/34 | | 9/14 at 100.00 | N/R | | 1,135,901 | |
| | 3,500 | | Fremont, California, Special Tax Bonds, Community Facilities District 1, Pacific Commons, Series 2005, 6.300%, 9/01/31 | | 3/12 at 100.00 | N/R | | 3,514,105 | |
| | 1,000 | | Fullerton Community Facilities District 1, California, Special Tax Bonds, Amerige Heights, Series 2002, 6.100%, 9/01/22 | | 9/12 at 100.00 | N/R | | 1,011,710 | |
| | 1,310 | | Inglewood Redevelopment Agency, California, Tax Allocation Bonds, Merged Redevelopment Project, Subordinate Lien Series 2007A-1, 5.000%, 5/01/23 – AMBAC Insured | | 5/17 at 100.00 | BBB+ | | 1,315,240 | |
| | | | Irvine, California, Unified School District, Community Facilities District Special Tax Bonds, Series 2006A: | | | | | | |
| | 330 | | 5.000%, 9/01/26 | | 9/16 at 100.00 | N/R | | 335,986 | |
| | 760 | | 5.125%, 9/01/36 | | 9/16 at 100.00 | N/R | | 761,056 | |
| | 3,000 | | Lake Elsinore Public Finance Authority, California, Local Agency Revenue Refunding Bonds, Series 2003H, 6.000%, 10/01/20 | | 10/13 at 102.00 | N/R | | 3,120,270 | |
| | 685 | | Lammersville School District, San Joaquin County, California, Community Facilities District 2002, Mountain House Special Tax Bonds, Series 2006, 5.125%, 9/01/35 | | 9/16 at 100.00 | N/R | | 639,372 | |
| | 5,250 | | Lammersville School District, San Joaquin County, California, Special Tax Bonds, Community Facilities District of Mountain House, Series 2002, 6.300%, 9/01/24 | | 9/12 at 101.00 | N/R | | 5,336,678 | |
| | 2,000 | | Lee Lake Water District, Riverside County, California, Special Tax Bonds, Community Facilities District 1 of Sycamore Creek, Series 2003, 6.500%, 9/01/24 | | 9/13 at 102.00 | N/R | | 2,088,140 | |
| | 1,000 | | Lindsay Redevelopment Agency, California, Project 1 Tax Allocation Bonds, Series 2007, 5.000%, 8/01/37 – RAAI Insured | | 8/17 at 100.00 | BBB+ | | 948,300 | |
| | 5,425 | | Lodi, California, Certificates of Participation, Public Improvement Financing Project, Series 2002, 5.000%, 10/01/26 – NPFG Insured | | 10/12 at 100.00 | A | | 5,475,887 | |
| | 1,310 | | Los Angeles Community Redevelopment Agency, California, Lease Revenue Bonds, Manchester Social Services Project, Series 2005, 5.000%, 9/01/37 – AMBAC Insured | | 9/15 at 100.00 | A1 | | 1,325,720 | |
| | Principal | | | | Optional Call | | | | |
| | Amount (000) | | Description (1) | | Provisions (2) | Ratings (3) | | Value | |
| | | | Tax Obligation/Limited (continued) | | | | | | |
| $ | 1,675 | | Moreno Valley Unified School District, Riverside County, California, Certificates of Participation, Series 2005, 5.000%, 3/01/26 – AGM Insured | | 3/14 at 100.00 | AA– | $ | 1,783,775 | |
| | 725 | | National City Community Redevelopment Agency, California, Tax Allocation Revenue Bonds, National City Redevelopment Project Area, Series 2011, 6.500%, 8/01/24 | | 8/21 at 100.00 | A– | | 839,731 | |
| | | | North Natomas Community Facilities District 4, Sacramento, California, Special Tax Bonds, Series 2006D: | | | | | | |
| | 535 | | 5.000%, 9/01/26 | | 9/14 at 102.00 | N/R | | 529,559 | |
| | 245 | | 5.000%, 9/01/33 | | 9/14 at 102.00 | N/R | | 229,369 | |
| | 270 | | Novato Redevelopment Agency, California, Tax Allocation Bonds, Hamilton Field Redevelopment Project, Series 2011, 6.750%, 9/01/40 | | 9/21 at 100.00 | A– | | 306,496 | |
| | 3,000 | | Oakland Redevelopment Agency, California, Subordinate Lien Tax Allocation Bonds, Central District Redevelopment Project, Series 2003, 5.500%, | | 3/13 at 100.00 | A– | | 3,105,000 | |
| | | | 9/01/19 – FGIC Insured | | | | | | |
| | 4,520 | | Ontario Redevelopment Financing Authority, California, Lease Revenue Bonds, Capital Projects, Series 2001, 5.000%, 8/01/24 – AMBAC Insured | | 8/12 at 100.50 | AA– | | 4,571,844 | |
| | 2,000 | | Orange County, California, Special Tax Bonds, Community Facilities District 02-1 of Ladera Ranch, Series 2003A, 5.550%, 8/15/33 | | 8/12 at 100.00 | N/R | | 2,005,540 | |
| | 11,165 | | Palm Desert Financing Authority, California, Tax Allocation Revenue Refunding Bonds, Project Area 1, Series 2002, 5.100%, 4/01/30 – NPFG Insured | | 4/12 at 102.00 | BBB | | 10,957,666 | |
| | | | Perris Union High School District Financing Authority, Riverside County, California, Revenue Bonds, Series 2011: | | | | | | |
| | 245 | | 6.000%, 9/01/33 | | No Opt. Call | N/R | | 252,852 | |
| | 540 | | 6.125%, 9/01/41 | | No Opt. Call | N/R | | 557,064 | |
| | 3,000 | | Pico Rivera Water Authority, California, Revenue Bonds, Series 2001A, 6.250%, 12/01/32 | | 6/12 at 102.00 | N/R | | 3,032,340 | |
| | 2,185 | | Pittsburg Redevelopment Agency, California, Tax Allocation Bonds, Los Medanos Community Development Project, Refunding Series 2008A, 6.500%, 9/01/28 | | 9/18 at 100.00 | BBB | | 2,266,894 | |
| | 3,250 | | Pomona Public Financing Authority, California, Revenue Refunding Bonds, Merged Redevelopment Projects, Series 2001AD, 5.000%, 2/01/27 – NPFG Insured | | 8/12 at 100.00 | BBB | | 3,206,190 | |
| | 1,000 | | Poway Unified School District, San Diego County, California, Special Tax Bonds, Community Facilities District 14 Del Sur, Series 2006, 5.125%, 9/01/26 | | 9/16 at 100.00 | N/R | | 997,460 | |
| | 6,000 | | Puerto Rico Highway and Transportation Authority, Highway Revenue Bonds, Series 2007N, 5.250%, 7/01/39 – FGIC Insured | | No Opt. Call | Baa1 | | 6,346,800 | |
| | 865 | | Rancho Santa Fe CSD Financing Authority, California, Revenue Bonds, Superior Lien Series 2011A, 5.750%, 9/01/30 | | 9/21 at 100.00 | BBB+ | | 933,292 | |
| | 625 | | Rialto Redevelopment Agency, California, Tax Allocation Bonds, Merged Project Area, Series 2005A, 5.000%, 9/01/35 – SYNCORA GTY Insured | | 9/15 at 100.00 | A– | | 616,919 | |
| | 155 | | Riverside County Redevelopment Agency, California, Tax Allocation Bonds, Jurupa Valley Project Area, Series 2011-B, 6.500%, 10/01/25 | | 10/21 at 100.00 | A– | | 171,659 | |
| | 3,375 | | Riverside County Redevelopment Agency, California, Interstate 215 Corridor Redevelopment Project Area Tax Allocation Bonds, Series 2010E, 6.500%, 10/01/40 | | 10/20 at 100.00 | A– | | 3,687,863 | |
| | 780 | | Roseville, California, Certificates of Participation, Public Facilities, Series 2003A, 5.000%, 8/01/25 – AMBAC Insured | | 8/13 at 100.00 | AA– | | 796,544 | |
| | 1,145 | | Sacramento, California, Special Tax Bonds, North Natomas Community Facilities District 4, Series 2003C, 6.000%, 9/01/33 | | 9/14 at 100.00 | N/R | | 1,169,755 | |
| | 14,505 | | San Diego Redevelopment Agency, California, Subordinate Lien Tax Allocation Bonds, Centre City Project, Series 2001A, 5.000%, 9/01/26 – AGM Insured | | 9/12 at 100.50 | AA– | | 14,679,349 | |
| | 2,300 | | San Francisco Bay Area Rapid Transit District, California, Sales Tax Revenue Bonds, Series 2001, 5.000%, 7/01/26 – AMBAC Insured | | 7/12 at 100.00 | AA+ | | 2,307,406 | |
| | 125 | | San Francisco Redevelopment Finance Authority, California, Tax Allocation Revenue Bonds, Mission Bay North Redevelopment Project, Series 2011C, 6.750%, 8/01/41 | | 2/21 at 100.00 | A– | | 141,055 | |
| | | Nuveen California Dividend Advantage Municipal Fund 3 (continued) |
| NZH | | Portfolio of Investments |
February 29, 2012
| | Principal | | | | Optional Call | | | | |
| | Amount (000) | | Description (1) | | Provisions (2) | Ratings (3) | | Value | |
| | | | Tax Obligation/Limited (continued) | | | | | | |
| | | | San Francisco Redevelopment Financing Authority, California, Tax Allocation Revenue Bonds, Mission Bay South Redevelopment Project, Series 2011D: | | | | | | |
| $ | 125 | | 7.000%, 8/01/33 | | 2/21 at 100.00 | BBB | $ | 142,329 | |
| | 160 | | 7.000%, 8/01/41 | | 2/21 at 100.00 | BBB | | 180,099 | |
| | 1,160 | | San Jose Redevelopment Agency, California, Tax Allocation Bonds, Merged Area Redevelopment Project, Series 2006C, 5.000%, 8/01/25 – NPFG Insured | | 8/17 at 100.00 | BBB | | 1,164,327 | |
| | 1,500 | | San Jose Redevelopment Agency, California, Tax Allocation Bonds, Merged Area Redevelopment Project, Series 2006D, 5.000%, 8/01/23 – AMBAC Insured | | 8/17 at 100.00 | BBB | | 1,516,965 | |
| | 215 | | Signal Hill Redevelopment Agency, California, Project 1 Tax Allocation Bonds, Series 2011, 7.000%, 10/01/26 | | 4/21 at 100.00 | N/R | | 228,949 | |
| | 8,710 | | South Orange County Public Financing Authority, California, Special Tax Revenue Bonds, Ladera Ranch, Series 2005A, 5.000%, 8/15/32 – AMBAC Insured | | 8/15 at 100.00 | BBB+ | | 8,784,122 | |
| | 1,500 | | Stockton Public Financing Authority, California, Lease Revenue Bonds, Series 2004, 5.250%, 9/01/34 – FGIC Insured | | 9/14 at 100.00 | BBB | | 1,206,000 | |
| | 1,165 | | Temecula Redevelopment Agency, California, Redevelopment Project 1 Tax Allocation Housing Bonds Series 2011A, 7.000%, 8/01/39 | | 8/21 at 100.00 | A | | 1,358,821 | |
| | 600 | | West Patterson Financing Authority, California, Special Tax Bonds, Community Facilities District 01-1, Refunding Series 2009A, 8.625%, 9/01/39 | | 9/14 at 105.00 | N/R | | 649,044 | |
| | 2,810 | | West Patterson Financing Authority, California, Special Tax Bonds, Community Facilities District 01-1, Series 2003B, 7.000%, 9/01/38 | | 9/13 at 103.00 | N/R | | 2,828,125 | |
| | 2,000 | | West Patterson Financing Authority, California, Special Tax Bonds, Community Facilities District 01-1, Series 2004B, 6.000%, 9/01/39 | | 9/13 at 102.00 | N/R | | 1,802,100 | |
| | 1,375 | | West Patterson Financing Authority, California, Special Tax Bonds, Community Facilities District 2001-1, Series 2004A, 6.125%, 9/01/39 | | 9/13 at 103.00 | N/R | | 1,260,201 | |
| | 370 | | Yorba Linda Redevelopment Agency, Orange County, California, Tax Allocation Revenue Bonds, Yorba Linda Redevelopment Project, Subordinate Lien Series 2011A, 6.500%, 9/01/32 | | 9/21 at 100.00 | A– | | 412,620 | |
| | 2,500 | | Yucaipa-Calimesa Joint Unified School District, San Bernardino County, California, General Obligation Refunding Bonds, Series 2001A, 5.000%, 10/01/26 – NPFG Insured | | 4/12 at 100.00 | A2 | | 2,501,975 | |
| | 144,725 | | Total Tax Obligation/Limited | | | | | 145,790,279 | |
| | | | Transportation – 4.1% (2.8% of Total Investments) | | | | | | |
| | 1,690 | | Bay Area Toll Authority, California, Revenue Bonds, San Francisco Bay Area Toll Bridge, Series 2006F, 5.000%, 4/01/31 (UB) | | 4/16 at 100.00 | AA | | 1,900,456 | |
| | 11,750 | | Foothill/Eastern Transportation Corridor Agency, California, Toll Road Revenue Refunding Bonds, Series 1999, 5.875%, 1/15/28 | | 1/14 at 101.00 | BBB– | | 11,964,673 | |
| | 13,440 | | Total Transportation | | | | | 13,865,129 | |
| | | | U.S. Guaranteed – 16.4% (11.3% of Total Investments) (6) | | | | | | |
| | 4,000 | | Beaumont Financing Authority, California, Local Agency Revenue Bonds, Series 2002A, 6.750%, 9/01/25 (Pre-refunded 9/01/12) | | 9/12 at 102.00 | N/R (6) | | 4,212,080 | |
| | 7,510 | | California County Tobacco Securitization Agency, Tobacco Settlement Asset-Backed Bonds, Merced County Tobacco Funding Corporation, Series 2002A, 5.500%, 6/01/33 (Pre-refunded 6/01/12) | | 6/12 at 100.00 | Baa3 (6) | | 7,613,187 | |
| | | | California Department of Water Resources, Power Supply Revenue Bonds, Series 2002A: | | | | | | |
| | 3,500 | | 5.375%, 5/01/17 (Pre-refunded 5/01/12) – SYNCORA GTY Insured | | 5/12 at 101.00 | Aaa | | 3,566,710 | |
| | 2,000 | | 5.125%, 5/01/18 (Pre-refunded 5/01/12) | | 5/12 at 101.00 | Aaa | | 2,037,260 | |
| | 680 | | California Statewide Community Development Authority, Revenue Bonds, Thomas Jefferson School of Law, Series 2005A, 4.875%, 10/01/31 (Pre-refunded 10/01/15) | | 10/15 at 100.00 | N/R (6) | | 758,975 | |
| | 3,000 | | Contra Costa County Community College District, California, General Obligation Bonds, Series 2002, 5.000%, 8/01/23 (Pre-refunded 8/01/12) – FGIC Insured | | 8/12 at 100.00 | Aa1 (6) | | 3,061,620 | |
| | 2,000 | | Daly City Housing Development Finance Agency, California, Mobile Home Park Revenue Bonds, Franciscan Mobile Home Park Project, Series 2002A, 5.800%, 12/15/25 (Pre-refunded 12/15/13) | | 12/13 at 102.00 | N/R (6) | | 2,232,880 | |
| | Principal | | | | Optional Call | | | | |
| | Amount (000) | | Description (1) | | Provisions (2) | Ratings (3) | | Value | |
| | | | U.S. Guaranteed (6) (continued) | | | | | | |
| $ | 3,815 | | Golden State Tobacco Securitization Corporation, California, Tobacco Settlement Asset-Backed Bonds, Series 2003A-1, 6.250%, 6/01/33 (Pre-refunded 6/01/13) | | 6/13 at 100.00 | Aaa | $ | 4,049,775 | |
| | 1,940 | | Lincoln, California, Special Tax Bonds, Lincoln Crossing Community Facilities District 03-1, Series 2003A, 6.500%, 9/01/25 (Pre-refunded 9/01/13) | | 9/13 at 102.00 | N/R (6) | | 2,153,982 | |
| | 1,335 | | Lincoln, California, Special Tax Bonds, Lincoln Crossing Community Facilities District 03-1, Series 2004, 6.000%, 9/01/34 (Pre-refunded 9/01/13) | | 9/13 at 102.00 | N/R (6) | | 1,472,251 | |
| | 5,500 | | Puerto Rico Highway and Transportation Authority, Highway Revenue Bonds, Series 2002D, 5.375%, 7/01/36 (Pre-refunded 7/01/12) | | 7/12 at 100.00 | AA+ (6) | | 5,597,020 | |
| | | | San Francisco Airports Commission, California, Revenue Bonds, San Francisco International Airport, Second Series 2003, Issue 29B: | | | | | | |
| | 4,110 | | 5.125%, 5/01/17 (Pre-refunded 5/01/13) – FGIC Insured | | 5/13 at 100.00 | A+ (6) | | 4,346,613 | |
| | 5,140 | | 5.125%, 5/01/19 (Pre-refunded 5/01/13) – FGIC Insured | | 5/13 at 100.00 | A+ (6) | | 5,435,910 | |
| | 1,345 | | San Mateo Union High School District, San Mateo County, California, Certificates of Participation, Phase 1, Series 2007A, 5.000%, 12/15/30 (Pre-refunded 12/15/17) – AMBAC Insured | | 12/17 at 100.00 | AA– (6) | | 1,656,502 | |
| | 4,200 | | Tobacco Securitization Authority of Southern California, Tobacco Settlement Asset-Backed Bonds, San Diego County Tobacco Asset Securitization Corporation, Senior Series 2001A, 5.500%, 6/01/36 (Pre-refunded 6/01/12) | | 6/12 at 100.00 | Aaa | | 4,257,708 | |
| | 2,500 | | Whittier, California, Health Facility Revenue Bonds, Presbyterian Intercommunity Hospital, Series 2002, 5.600%, 6/01/22 (Pre-refunded 6/01/12) | | 6/12 at 101.00 | N/R (6) | | 2,560,025 | |
| | 52,575 | | Total U.S. Guaranteed | | | | | 55,012,498 | |
| | | | Utilities – 4.4% (3.0% of Total Investments) | | | | | | |
| | 3,815 | | Long Beach Bond Finance Authority, California, Natural Gas Purchase Revenue Bonds, Series 2007A, 5.000%, 11/15/35 | | No Opt. Call | A– | | 3,911,481 | |
| | | | Merced Irrigation District, California, Electric System Revenue Bonds, Series 2005: | | | | | | |
| | 2,000 | | 5.000%, 9/01/26 – SYNCORA GTY Insured | | 9/15 at 100.00 | N/R | | 2,029,500 | |
| | 1,285 | | 5.125%, 9/01/31 – SYNCORA GTY Insured | | 9/15 at 100.00 | N/R | | 1,277,945 | |
| | 5,000 | | Merced Irrigation District, California, Revenue Certificates of Participation, Electric System Project, Series 2003, 5.700%, 9/01/36 | | 9/13 at 102.00 | Baa3 | | 5,023,600 | |
| | 2,500 | | Salinas Valley Solid Waste Authority, California, Revenue Bonds, Series 2002, 5.125%, 8/01/22 – AMBAC Insured (Alternative Minimum Tax) | | 8/12 at 100.00 | A+ | | 2,509,575 | |
| | 14,600 | | Total Utilities | | | | | 14,752,101 | |
| | | | Water and Sewer – 6.2% (4.3% of Total Investments) | | | | | | |
| | 1,070 | | Burbank, California, Wastewater System Revenue Bonds, Series 2004A, 5.000%, 6/01/22 – AMBAC Insured | | 6/14 at 100.00 | AA+ | | 1,134,714 | |
| | 3,000 | | East Valley Water District Financing Authority, California, Refunding Revenue Bonds, Series 2010, 5.000%, 10/01/40 | | 10/20 at 100.00 | AA– | | 3,239,910 | |
| | 1,125 | | Fortuna Public Finance Authority, California, Water Revenue Bonds, Series 2006, 5.000%, 10/01/36 – AGM Insured | | 10/16 at 100.00 | AA– | | 1,178,663 | |
| | 890 | | Healdsburg Public Financing Authority, California, Wastewater Revenue Bonds, Series 2006, 5.000%, 4/01/36 – NPFG Insured | | 4/16 at 100.00 | AA– | | 925,787 | |
| | 850 | | Marina Coast Water District, California, Enterprise Certificate of Participation, Series 2006, 5.000%, 6/01/31 – NPFG Insured | | 6/16 at 100.00 | AA– | | 890,877 | |
| | 1,000 | | San Buenaventura, California, Wastewater Revenue Certificates of Participation, Series 2004, 5.000%, 3/01/24 – NPFG Insured | | 3/14 at 100.00 | AA | | 1,049,750 | |
| | | Nuveen California Dividend Advantage Municipal Fund 3 (continued) |
| NZH | | Portfolio of Investments |
February 29, 2012
| | Principal | | | | Optional Call | | | | |
| | Amount (000) | | Description (1) | | Provisions (2) | Ratings (3) | | Value | |
| | | | Water and Sewer (continued) | | | | | | |
| | | | San Diego Public Facilities Financing Authority, California, Subordinate Lien Water Revenue Bonds, Series 2002: | | | | | | |
| $ | 2,500 | | 5.000%, 8/01/23 – NPFG Insured | | 8/12 at 100.00 | Aa3 | $ | 2,540,725 | |
| | 6,260 | | 5.000%, 8/01/24 – NPFG Insured | | 8/12 at 100.00 | Aa3 | | 6,355,402 | |
| | 3,315 | | San Francisco City and County Public Utilities Commission, California, Clean Water Revenue Refunding Bonds, Series 2003A, 5.250%, 10/01/18 – NPFG Insured | | 4/13 at 100.00 | AA– | | 3,468,849 | |
| | 20,010 | | Total Water and Sewer | | | | | 20,784,677 | |
| $ | 525,359 | | Total Investments (cost $467,719,489) – 145.3% | | | | | 488,106,122 | |
| | | | Floating Rate Obligations – (1.1)% | | | | | (3,845,000 | ) |
| | | | MuniFund Term Preferred Shares, at Liquidation Value – (47.5)% (7) | | | | | (159,544,500 | ) |
| | | | Other Assets Less Liabilities – 3.3% | | | | | 11,113,734 | |
| | | | Net Assets Applicable to Common Shares – 100% | | | | $ | 335,830,356 | |
| (1) | | All percentages shown in the Portfolio of Investments are based on net assets applicable to Common shares unless otherwise noted. |
| (2) | | Optional Call Provisions (not covered by the report of independent registered public accounting firm): Dates (month and year) and prices of the earliest optional call or redemption. There may be other call provisions at varying prices at later dates. Certain mortgage-backed securities may be subject to periodic principal paydowns. |
| (3) | | Ratings (not covered by the report of independent registered public accounting firm): Using the highest of Standard & Poor’s Group (“Standard & Poor’s”), Moody’s Investors Service, Inc. (“Moody’s”) or Fitch, Inc. (“Fitch”) rating. Ratings below BBB by Standard & Poor’s, Baa by Moody’s or BBB by Fitch are considered to be below investment grade. Holdings designated N/R are not rated by any of these national rating agencies. |
| (4) | | Investment, or portion of investment, has been pledged to collaterize the net payment obligations for investments in inverse floating rate transactions. |
| (5) | | At or subsequent to the end of the reporting period, this security is non-income producing. Non-income producing security, in the case of a bond, generally denotes that the issuer has (1) defaulted on the payment of principal or interest, (2) is under the protection of the Federal Bankruptcy Court or (3) the Fund’s Adviser has concluded that the issue is not likely to meet its future interest payment obligations and has directed the Fund’s custodian to cease accruing additional income on the Fund’s records. |
| (6) | | Backed by an escrow or trust containing sufficient U.S. Government or U.S. Government agency securities, which ensure the timely payment of principal and interest. Certain bonds backed by U.S. Government or agency securities are regarded as having an implied rating equal to the rating of such securities. |
| (7) | | MuniFund Term Preferred Shares, at Liquidation Value as a percentage of Total Investments is 32.7%. |
| N/R | | Not rated. |
| WI/DD | | Purchased on a when-issued or delayed delivery basis. |
| (IF) | | Inverse floating rate investment. |
| (UB) | | Underlying bond of an inverse floating rate trust reflected as a financing transaction. See Notes to Financial Statements, Footnote 1 – General Information and Significant Accounting Policies, Inverse Floating Rate Securities for more information. |
See accompanying notes to financial statements.
| | | Nuveen Insured California Dividend Advantage Municipal Fund |
| NKL | | Portfolio of Investments |
| | Principal | | | | Optional Call | | | | |
| | Amount (000) | | Description (1) | | Provisions (2) | Ratings (3) | | Value | |
| | | | Consumer Staples – 4.0% (2.8% of Total Investments) | | | | | | |
| $ | 14,155 | | Golden State Tobacco Securitization Corporation, California, Tobacco Settlement Asset-Backed Bonds, Series 2007A-2, 0.000%, 6/01/37 | | 6/22 at 100.00 | BB– | $ | 9,883,446 | |
| | | | Education and Civic Organizations – 0.7% (0.5% of Total Investments) | | | | | | |
| | 1,675 | | California Educational Facilities Authority, Revenue Bonds, University of San Diego, Series 2002A, 5.250%, 10/01/30 | | 10/12 at 100.00 | A2 | | 1,693,107 | |
| | | | Health Care – 7.7% (5.3% of Total Investments) | | | | | | |
| | 5,000 | | ABAG Finance Authority for Non-Profit Corporations, California, Cal-Mortgage Insured Revenue Bonds, Sansum-Santa Barbara Medical Foundation Clinic, Series 2002A, 5.600%, 4/01/26 | | 4/12 at 100.00 | A– | | 5,007,300 | |
| | 2,815 | | California Health Facilities Financing Authority, Revenue Bonds, Lucile Salter Packard Children’s Hospital, Series 2003C, 5.000%, 8/15/20 – AMBAC Insured | | 8/13 at 100.00 | AA | | 2,932,920 | |
| | 5,000 | | California Statewide Community Development Authority, Revenue Bonds, Kaiser Permanante System, Series 2006, 5.000%, 3/01/41 | | 3/16 at 100.00 | A+ | | 5,174,950 | |
| | 3,200 | | California Statewide Community Development Authority, Revenue Bonds, St. Joseph Health System, Series 2007A, 5.750%, 7/01/47 – FGIC Insured | | 7/18 at 100.00 | AA– | | 3,436,128 | |
| | 1,748 | | California Statewide Community Development Authority, Revenue Bonds, St. Joseph Health System, Trust 2554, 18.382%, 7/01/47 – AGM Insured (IF) | | 7/18 at 100.00 | AA– | | 2,139,080 | |
| | 17,763 | | Total Health Care | | | | | 18,690,378 | |
| | | | Housing/Multifamily – 0.8% (0.5% of Total Investments) | | | | | | |
| | 1,905 | | Los Angeles, California, GNMA Mortgage-Backed Securities Program Multifamily Housing Revenue Bonds, Park Plaza West Senior Apartments, Series 2001B, 5.300%, 1/20/21 (Alternative Minimum Tax) | | 7/12 at 101.00 | AA+ | | 1,943,424 | |
| | | | Housing/Single Family – 0.1% (0.1% of Total Investments) | | | | | | |
| | 235 | | California Housing Finance Agency, Home Mortgage Revenue Bonds, Series 2006H, 5.750%, 8/01/30 – FGIC Insured (Alternative Minimum Tax) | | 2/16 at 100.00 | BBB | | 235,160 | |
| | | | Long-Term Care – 1.2% (0.9% of Total Investments) | | | | | | |
| | 3,000 | | ABAG Finance Authority for Non-Profit Corporations, California, Insured Senior Living Revenue Bonds, Odd Fellows Home of California, Series 2003A, 5.200%, 11/15/22 | | 11/12 at 100.00 | A– | | 3,030,930 | |
| | | | Tax Obligation/General – 39.2% (27.3% of Total Investments) | | | | | | |
| | 900 | | California State, General Obligation Bonds, Series 2003, 5.000%, 2/01/21 | | 8/13 at 100.00 | A1 | | 948,708 | |
| | 8,250 | | California, General Obligation Refunding Bonds, Series 2002, 5.000%, 2/01/22 – NPFG Insured | | 8/12 at 100.00 | A1 | | 8,276,648 | |
| | 20,750 | | Coachella Valley Unified School District, Riverside County, California, General Obligation Bonds, Capital Appreciation, Election 2005 Series 2010C, 0.000%, 8/01/43 – AGM Insured | | No Opt. Call | AA– | | 3,293,648 | |
| | 3,375 | | Coast Community College District, Orange County, California, General Obligation Bonds, Series 2006C, 0.000%, 8/01/31 – AGM Insured | | 8/18 at 100.00 | Aa1 | | 3,215,498 | |
| | 10,000 | | East Side Union High School District, Santa Clara County, California, General Obligation Bonds, Series 2005E, 0.000%, 8/01/28 – SYNCORA GTY Insured | | 8/13 at 47.75 | A | | 4,151,800 | |
| | 230 | | El Monte Union High School District, Los Angeles County, California, General Obligation Bonds, Series 2003A, 5.000%, 6/01/28 – AGM Insured | | 6/13 at 100.00 | AA– | | 239,442 | |
| | 2,730 | | Fontana Unified School District, San Bernardino County, California, General Obligation Bonds, Trust 2668, 9.515%, 2/01/16 – AGM Insured (IF) | | No Opt. Call | AA– | | 3,420,581 | |
| | 1,000 | | Los Rios Community College District, Sacramento, El Dorado and Yolo Counties, California, General Obligation Bonds, Series 2006C, 5.000%, 8/01/25 – AGM Insured (UB) | | 8/14 at 102.00 | Aa2 | | 1,118,480 | |
| | 1,500 | | Madera Unified School District, Madera County, California, General Obligation Bonds, Series 2002, 5.000%, 8/01/28 – AGM Insured | | 8/12 at 100.00 | AA– | | 1,522,245 | |
| | 3,325 | | Mount Diablo Unified School District, Contra Costa County, California, General Obligation Bonds, Series 2010A, 0.000%, 8/01/30 – AGM Insured | | 8/25 at 100.00 | AA– | | 2,191,740 | |
| | | Nuveen Insured California Dividend Advantage Municipal Fund (continued) |
| NKL | | Portfolio of Investments |
February 29, 2012
| | Principal | | | | Optional Call | | | | |
| | Amount (000) | | Description (1) | | Provisions (2) | Ratings (3) | | Value | |
| | | | Tax Obligation/General (continued) | | | | | | |
| $ | 2,000 | | Murrieta Valley Unified School District, Riverside County, California, General Obligation Bonds, Series 2007, 4.500%, 9/01/30 – AGM Insured | | 9/17 at 100.00 | AA– | $ | 2,138,100 | |
| | 2,500 | | Oakland Unified School District, Alameda County, California, General Obligation Bonds, Series 2002, 5.250%, 8/01/21 – FGIC Insured | | 8/12 at 100.00 | BBB | | 2,536,325 | |
| | 16,000 | | Poway Unified School District, San Diego County, California, School Facilities Improvement District 2007-1 General Obligation Bonds, Series 2011B, 0.000%, 8/01/46 | | No Opt. Call | Aa2 | | 2,528,800 | |
| | 375 | | Roseville Joint Union High School District, Placer County, California, General Obligation Bonds, Series 2006B, 5.000%, 8/01/27 – FGIC Insured | | 8/15 at 100.00 | AA– | | 414,533 | |
| | 1,500 | | San Juan Capistrano, California, General Obligation Bonds, Open Space Program, Tender Option Bond Trust 3646, 17.890%, 8/01/17 (IF) | | No Opt. Call | AAA | | 2,106,300 | |
| | 3,500 | | San Mateo County Community College District, California, General Obligation Bonds, Series 2002A, 5.000%, 9/01/26 – FGIC Insured | | 9/12 at 100.00 | Aaa | | 3,568,985 | |
| | | | San Ysidro School District, San Diego County, California, General Obligation Bonds, 1997 Election Series 2011F: | | | | | | |
| | 7,230 | | 0.000%, 8/01/42 – AGM Insured | | 8/21 at 21.00 | AA– | | 908,377 | |
| | 10,450 | | 0.000%, 8/01/43 – AGM Insured | | 8/21 at 19.43 | AA– | | 1,214,081 | |
| | 21,225 | | 0.000%, 8/01/44 – AGM Insured | | 8/21 at 17.98 | AA– | | 2,279,990 | |
| | 12,550 | | 0.000%, 8/01/45 – AGM Insured | | 8/21 at 16.64 | AA– | | 1,246,090 | |
| | 23,425 | | 0.000%, 8/01/46 – AGM Insured | | 8/21 at 15.39 | AA– | | 2,149,478 | |
| | 14,915 | | Southwestern Community College District, San Diego County, California, General Obligation Bonds, Election of 2008, Series 2011C, 0.000%, 8/01/41 | | No Opt. Call | Aa2 | | 3,036,992 | |
| | | | Stockton Unified School District, San Joaquin County, California, General Obligation Bonds, Election 2008 Series 2011D: | | | | | | |
| | 24,280 | | 0.000%, 8/01/47 – AGC Insured | | 8/37 at 100.00 | AA– | | 11,285,101 | |
| | 26,280 | | 0.000%, 8/01/50 – AGM Insured | | 8/37 at 100.00 | AA– | | 12,188,138 | |
| | 15,780 | | Sylvan Union School District, Stanislaus County, California, General Obligation Bonds, Election of 2006, Series 2010, 0.000%, 8/01/49 – AGM Insured | | No Opt. Call | AA– | | 5,453,884 | |
| | 10,000 | | Vista Unified School District, San Diego County, California, General Obligation Bonds, Series 2002A, 5.000%, 8/01/23 – AGM Insured | | 8/12 at 100.00 | Aa2 | | 10,171,900 | |
| | 3,905 | | West Kern Community College District, California, General Obligation Bonds, Election 2004, Series 2007C, 5.000%, 10/01/32 – SYNCORA GTY Insured | | 11/17 at 100.00 | A+ | | 4,151,093 | |
| | 247,975 | | Total Tax Obligation/General | | | | | 95,756,957 | |
| | | | Tax Obligation/Limited – 46.1% (32.1% of Total Investments) | | | | | | |
| | 1,450 | | Baldwin Park Public Financing Authority, California, Sales Tax and Tax Allocation Bonds, Puente Merced Redevelopment Project, Series 2003, 5.250%, 8/01/21 | | 8/13 at 102.00 | BBB | | 1,507,275 | |
| | 6,895 | | Brea and Olinda Unified School District, Orange County, California, Certificates of Participation Refunding, Series 2002A, 5.125%, 8/01/26 – AGM Insured | | 8/12 at 100.00 | AA– | | 6,985,876 | |
| | 2,200 | | California Infrastructure and Economic Development Bank, Los Angeles County, Revenue Bonds, Department of Public Social Services, Series 2003, 5.000%, 9/01/28 – AMBAC Insured | | 9/13 at 101.00 | A+ | | 2,256,298 | |
| | 3,100 | | California State Public Works Board, Lease Revenue Bonds, Department of Health Services, Richmond Lab, Series 2005B, 5.000%, 11/01/30 – SYNCORA GTY Insured | | 11/15 at 100.00 | A2 | | 3,199,913 | |
| | 465 | | Capistrano Unified School District, Orange County, California, Special Tax Bonds, Community Facilities District, Series 2005, 5.000%, 9/01/24 – FGIC Insured | | 9/15 at 100.00 | BBB | | 477,313 | |
| | 1,400 | | Chino Redevelopment Agency, California, Merged Chino Redevelopment Project Area Tax Allocation Bonds, Series 2006, 5.000%, 9/01/38 – AMBAC Insured | | 9/16 at 101.00 | A– | | 1,353,128 | |
| | 7,035 | | Corona-Norco Unified School District, Riverside County, California, Special Tax Bonds, Community Facilities District 98-1, Series 2003, 5.000%, 9/01/28 – NPFG Insured | | 9/13 at 100.00 | BBB | | 7,038,025 | |
| | 3,145 | | Culver City Redevelopment Agency, California, Tax Allocation Revenue Bonds, Redevelopment Project, Series 2002A, 5.125%, 11/01/25 – NPFG Insured | | 5/12 at 100.00 | BBB | | 3,145,660 | |
| | Principal | | | | Optional Call | | | | |
| | Amount (000) | | Description (1) | | Provisions (2) | Ratings (3) | | Value | |
| | | | Tax Obligation/Limited (continued) | | | | | | |
| $ | 750 | | Dinuba Redevelopment Agency, California, Tax Allocation Bonds, Merged City of Dinuba Redevelopment Project and Dinuba Redevelopment Project 2, As Amended, Refunding Series 2001, 5.000%, 9/01/31 – NPFG Insured | | 9/12 at 101.00 | A– | $ | 753,068 | |
| | 6,990 | | El Monte, California, Senior Lien Certificates of Participation, Department of Public Services Facility Phase II, Series 2001, 5.000%, 1/01/21 – AMBAC Insured | | 7/12 at 100.00 | A2 | | 6,999,646 | |
| | 4,000 | | Folsom Public Financing Authority, California, Special Tax Revenue Bonds, Series 2004A, 5.000%, 9/01/21 – AMBAC Insured | | 9/12 at 102.00 | N/R | | 4,039,320 | |
| | 7,780 | | Golden State Tobacco Securitization Corporation, California, Enhanced Tobacco Settlement Asset-Backed Revenue Bonds, Series 2005A, 5.000%, 6/01/45 – AMBAC Insured | | 6/15 at 100.00 | A2 | | 7,806,063 | |
| | 7,700 | | Golden State Tobacco Securitization Corporation, California, Enhanced Tobacco Settlement Asset-Backed Revenue Bonds, Tender Option Bonds Trust 4686, 8.957%, 6/01/45 – AGC Insured (IF) (4) | | 6/15 at 100.00 | AA– | | 7,806,876 | |
| | 910 | | Hesperia Public Financing Authority, California, Redevelopment and Housing Projects Tax Allocation Bonds, Series 2007A, 5.000%, 9/01/37 – SYNCORA GTY Insured | | 9/17 at 100.00 | Ba1 | | 685,394 | |
| | 2,115 | | Inglewood Redevelopment Agency, California, Tax Allocation Bonds, Merged Redevelopment Project, Refunding Series 1998A, 5.250%, 5/01/23 – AMBAC Insured | | No Opt. Call | N/R | | 2,245,305 | |
| | 950 | | Inglewood Redevelopment Agency, California, Tax Allocation Bonds, Merged Redevelopment Project, Subordinate Lien Series 2007A-1, 5.000%, 5/01/24 – AMBAC Insured | | 5/17 at 100.00 | BBB+ | | 946,504 | |
| | 3,500 | | La Quinta Redevelopment Agency, California, Tax Allocation Bonds, Redevelopment Project Area 1, Series 2001, 5.100%, 9/01/31 – AMBAC Insured | | 9/12 at 101.00 | A+ | | 3,543,190 | |
| | 3,400 | | La Quinta Redevelopment Agency, California, Tax Allocation Bonds, Redevelopment Project Area 1, Series 2002, 5.000%, 9/01/22 – AMBAC Insured | | 9/12 at 102.00 | A+ | | 3,503,258 | |
| | 845 | | Los Angeles Community Redevelopment Agency, California, Lease Revenue Bonds, Manchester Social Services Project, Series 2005, 5.000%, 9/01/37 – AMBAC Insured | | 9/15 at 100.00 | A1 | | 855,140 | |
| | 1,460 | | Los Angeles, California, Certificates of Participation, Municipal Improvement Corporation, Series 2003AW, 5.000%, 6/01/33 – AMBAC Insured | | 6/13 at 100.00 | A+ | | 1,486,499 | |
| | 7,000 | | Los Angeles, California, Certificates of Participation, Series 2002, 5.200%, 4/01/27 – AMBAC Insured | | 4/12 at 100.00 | A+ | | 7,012,950 | |
| | 8,470 | | Ontario Redevelopment Financing Authority, California, Lease Revenue Bonds, Capital Projects, Series 2001, 5.200%, 8/01/29 – AMBAC Insured | | 8/12 at 100.50 | AA– | | 8,563,927 | |
| | 5,000 | | Palm Desert Financing Authority, California, Tax Allocation Revenue Refunding Bonds, Project Area 1, Series 2002, 5.000%, 4/01/25 – NPFG Insured | | 4/12 at 102.00 | BBB | | 5,017,450 | |
| | 405 | | Rialto Redevelopment Agency, California, Tax Allocation Bonds, Merged Project Area, Series 2005A, 5.000%, 9/01/35 – SYNCORA GTY Insured | | 9/15 at 100.00 | A– | | 399,763 | |
| | 3,000 | | Riverside County Public Financing Authority, California, Tax Allocation Bonds, Multiple Projects, Series 2005A, 5.000%, 10/01/35 – SYNCORA GTY Insured | | 10/15 at 100.00 | BBB | | 2,765,760 | |
| | 4,475 | | Riverside County, California, Asset Leasing Corporate Leasehold Revenue Bonds, Riverside County Hospital Project, Series 1997B, 5.000%, 6/01/19 – NPFG Insured | | 6/12 at 101.00 | BBB | | 4,550,986 | |
| | 2,500 | | Roseville Financing Authority, California, Special Tax Revenue Bonds, Series 2007A, 5.000%, 9/01/33 – AMBAC Insured | | 9/17 at 100.00 | N/R | | 2,388,975 | |
| | 505 | | Roseville, California, Certificates of Participation, Public Facilities, Series 2003A, 5.000%, 8/01/25 – AMBAC Insured | | 8/13 at 100.00 | AA– | | 515,711 | |
| | 3,175 | | San Buenaventura, California, Certificates of Participation, Series 2001C, 5.250%, 2/01/31 - AMBAC Insured | | 2/13 at 100.00 | N/R | | 3,192,463 | |
| | 3,730 | | San Diego Redevelopment Agency, California, Subordinate Lien Tax Increment and Parking Revenue Bonds, Centre City Project, Series 2003B, 5.250%, 9/01/26 | | 3/12 at 100.00 | Baa3 | | 3,732,499 | |
| | 4,000 | | San Jose Financing Authority, California, Lease Revenue Refunding Bonds, Convention Center Project, Series 2001F, 5.000%, 9/01/19 – NPFG Insured | | 3/12 at 100.00 | AA+ | | 4,014,360 | |
| | 815 | | San Jose Redevelopment Agency, California, Tax Allocation Bonds, Merged Area Redevelopment Project, Series 2006C, 5.000%, 8/01/25 – NPFG Insured | | 8/17 at 100.00 | BBB | | 818,040 | |
| | | Nuveen Insured California Dividend Advantage Municipal Fund (continued) |
| NKL | | Portfolio of Investments |
February 29, 2012
| | Principal | | | | Optional Call | | | | |
| | Amount (000) | | Description (1) | | Provisions (2) | Ratings (3) | | Value | |
| | | | Tax Obligation/Limited (continued) | | | | | | |
| $ | 1,000 | | San Jose Redevelopment Agency, California, Tax Allocation Bonds, Merged Project Area, Series 2005A, 5.000%, 8/01/28 – NPFG Insured | | 8/15 at 100.00 | BBB | $ | 972,670 | |
| | 2,160 | | Temecula Redevelopment Agency, California, Tax Allocation Revenue Bonds, Redevelopment Project 1, Series 2002, 5.125%, 8/01/27 – NPFG Insured | | 8/12 at 100.00 | A– | | 2,161,037 | |
| | 112,325 | | Total Tax Obligation/Limited | | | | | 112,740,342 | |
| | | | Transportation – 3.1% (2.2% of Total Investments) | | | | | | |
| | 7,500 | | Foothill/Eastern Transportation Corridor Agency, California, Toll Road Revenue Refunding Bonds, Series 1999, 5.875%, 1/15/29 | | 1/14 at 101.00 | BBB– | | 7,610,850 | |
| | | | U.S. Guaranteed – 16.2% (11.3% of Total Investments) (5) | | | | | | |
| | 2,250 | | California Infrastructure and Economic Development Bank, First Lien Revenue Bonds, San Francisco Bay Area Toll Bridge, Series 2003A, 5.000%, 7/01/36 (Pre-refunded 1/01/28) – AMBAC Insured | | 1/28 at 100.00 | Aaa | | 3,018,735 | |
| | 9,000 | | California State University, Systemwide Revenue Bonds, Series 2002A, 5.125%, 11/01/26 (Pre-refunded 11/01/12) – AMBAC Insured | | 11/12 at 100.00 | Aa2 (5) | | 9,301,230 | |
| | 1,000 | | California Statewide Communities Development Authority, Student Housing Revenue Bonds, EAH-East Campus Apartments, LLC-UC Irvine Project, Series 2002A, 5.500%, 8/01/22 (Pre-refunded 8/01/12) – ACA Insured | | 8/12 at 100.00 | Baa1 (5) | | 1,022,690 | |
| | 10,000 | | Fremont Unified School District, Alameda County, California, General Obligation Bonds, Series 2002A, 5.000%, 8/01/25 (Pre-refunded 8/01/12) – FGIC Insured | | 8/12 at 101.00 | Aa2 (5) | | 10,305,800 | |
| | 4,500 | | Golden State Tobacco Securitization Corporation, California, Tobacco Settlement Asset-Backed Revenue Bonds, Series 2003A-2, 7.900%, 6/01/42 (Pre-refunded 6/01/13) | | 6/13 at 100.00 | Aaa | | 4,922,145 | |
| | 3,500 | | Los Angeles Unified School District, California, General Obligation Bonds, Series 2002E, 5.125%, 1/01/27 (Pre-refunded 7/01/12) – NPFG Insured | | 7/12 at 100.00 | AA– (5) | | 3,559,255 | |
| | 3,380 | | Rancho Mirage Joint Powers Financing Authority, California, Revenue Bonds, Eisenhower Medical Center, Series 2004, 5.875%, 7/01/26 (Pre-refunded 7/01/14) | | 7/14 at 100.00 | Baa2 (5) | | 3,823,524 | |
| | | | San Francisco Airports Commission, California, Revenue Bonds, San Francisco International Airport, Second Series 2003, Issue 29A: | | | | | | |
| | 1,185 | | 5.250%, 5/01/16 (Pre-refunded 5/01/13) – FGIC Insured (Alternative Minimum Tax) | | 5/13 at 100.00 | A+ (5) | | 1,254,951 | |
| | 2,300 | | 5.250%, 5/01/17 (Pre-refunded 5/01/13) – FGIC Insured (Alternative Minimum Tax) | | 5/13 at 100.00 | A+ (5) | | 2,435,769 | |
| | 37,115 | | Total U.S. Guaranteed | | | | | 39,644,099 | |
| | | | Utilities – 7.5% (5.2% of Total Investments) | | | | | | |
| | 9,000 | | Anaheim Public Finance Authority, California, Revenue Bonds, Electric System Distribution Facilities, Series 2002A, 5.000%, 10/01/27 – AGM Insured | | 10/12 at 100.00 | AA– | | 9,189,360 | |
| | 2,490 | | Long Beach Bond Finance Authority, California, Natural Gas Purchase Revenue Bonds, Series 2007A, 5.000%, 11/15/35 | | No Opt. Call | A– | | 2,552,972 | |
| | 830 | | Merced Irrigation District, California, Electric System Revenue Bonds, Series 2005, 5.125%, 9/01/31 – SYNCORA GTY Insured | | 9/15 at 100.00 | N/R | | 825,443 | |
| | 5,630 | | Southern California Public Power Authority, Subordinate Revenue Refunding Bonds, Transmission Project, Series 2002A, 4.750%, 7/01/19 – AGM Insured | | 7/12 at 100.00 | AA– | | 5,704,035 | |
| | 17,950 | | Total Utilities | | | | | 18,271,810 | |
| | | | Water and Sewer – 16.9% (11.8% of Total Investments) | | | | | | |
| | 2,185 | | California Department of Water Resources, Water System Revenue Bonds, Central Valley Project, Series 2002X, 5.150%, 12/01/23 – FGIC Insured | | 12/12 at 100.00 | AAA | | 2,261,344 | |
| | 750 | | Fortuna Public Finance Authority, California, Water Revenue Bonds, Series 2006, 5.000%, 10/01/36 – AGM Insured | | 10/16 at 100.00 | AA– | | 785,775 | |
| | 570 | | Healdsburg Public Financing Authority, California, Wastewater Revenue Bonds, Series 2006, 5.000%, 4/01/36 – NPFG Insured | | 4/16 at 100.00 | AA– | | 592,920 | |
| | 9,000 | | Los Angeles County Sanitation Districts Financing Authority, California, Capital Projects Revenue Bonds, District 14, Series 2005, 5.000%, 10/01/34 – FGIC Insured | | 10/15 at 100.00 | A+ | | 9,549,270 | |
| | Principal | | | | Optional Call | | | | |
| | Amount (000) | | Description (1) | | Provisions (2) | Ratings (3) | | Value | |
| | | | Water and Sewer (continued) | | | | | | |
| $ | 4,500 | | Los Angeles County Sanitation Districts Financing Authority, California, Senior Revenue Bonds, Capital Projects, Series 2003A, 5.000%, 10/01/23 – AGM Insured | | 10/13 at 100.00 | AA+ | $ | 4,810,005 | |
| | 1,560 | | Manteca Financing Authority, California, Sewerage Revenue Bonds, Series 2003B, 5.000%, 12/01/33 – NPFG Insured | | 12/13 at 100.00 | Aa3 | | 1,590,592 | |
| | 500 | | Marina Coast Water District, California, Enterprise Certificate of Participation, Series 2006, 5.000%, 6/01/31 – NPFG Insured | | 6/16 at 100.00 | AA– | | 524,045 | |
| | 9,185 | | Orange County Sanitation District, California, Certificates of Participation, Series 2003, 5.000%, 2/01/33 – FGIC Insured (UB) | | 8/13 at 100.00 | AAA | | 9,610,357 | |
| | 8,000 | | San Diego County Water Authority, California, Water Revenue Certificates of Participation, Series 2008A, 5.000%, 5/01/38 – AGM Insured | | 5/18 at 100.00 | AA+ | | 8,616,800 | |
| | | | Semitropic Water Storage District, Kern County, California, Water Banking Revenue Bonds, Series 2004A: | | | | | | |
| | 1,315 | | 5.500%, 12/01/20 – SYNCORA GTY Insured | | 12/14 at 100.00 | AA | | 1,475,417 | |
| | 1,415 | | 5.500%, 12/01/21 – SYNCORA GTY Insured | | 12/14 at 100.00 | AA | | 1,584,729 | |
| | 38,980 | | Total Water and Sewer | | | | | 41,401,254 | |
| $ | 500,578 | | Total Investments (cost $328,368,423) – 143.5% | | | | | 350,901,757 | |
| | | | Floating Rate Obligations – (3.0)% | | | | | (7,385,000 | ) |
| | | | Variable Rate Demand Preferred Shares, at Liquidation Value – (42.7)% (6) | | | | | (104,400,000 | ) |
| | | | Other Assets Less Liabilities – 2.2% | | | | | 5,403,877 | |
| | | | Net Assets Applicable to Common Shares – 100% | | | | $ | 244,520,634 | |
| | | The Fund intends to invest at least 80% of its net assets in municipal securities that are covered by insurance guaranteeing the timely payment of principal and interest. See Notes to Financial Statements, Footnote 1 – General Information and Significant Accounting Policies, Insurance for more information. |
| (1) | | All percentages shown in the Portfolio of Investments are based on net assets applicable to Common shares unless otherwise noted. |
| (2) | | Optional Call Provisions (not covered by the report of independent registered public accounting firm): Dates (month and year) and prices of the earliest optional call or redemption. There may be other call provisions at varying prices at later dates. Certain mortgage-backed securities may be subject to periodic principal paydowns. |
| (3) | | Ratings (not covered by the report of independent registered public accounting firm): Using the highest of Standard & Poor’s Group (“Standard & Poor’s”), Moody’s Investors Service, Inc. (“Moody’s”) or Fitch, Inc. (“Fitch”) rating. Ratings below BBB by Standard & Poor’s, Baa by Moody’s or BBB by Fitch are considered to be below investment grade. Holdings designated N/R are not rated by any of these national rating agencies. |
| (4) | | Investment, or portion of investment, has been pledged to collaterize the net payment obligations for investments in inverse floating rate transactions. |
| (5) | | Backed by an escrow or trust containing sufficient U.S. Government or U.S. Government agency securities, which ensure the timely payment of principal and interest. Certain bonds backed by U.S. Government or agency securities are regarded as having an implied rating equal to the rating of such securities. |
| (6) | | Variable Rate Demand Preferred Shares, at Liquidation Value as a percentage of Total Investments is 29.8%. |
| N/R | | Not rated. |
| (IF) | | Inverse floating rate investment. |
| (UB) | | Underlying bond of an inverse floating rate trust reflected as a financing transaction. See Notes to Financial Statements, Footnote 1 – General Information and Significant Accounting Policies, Inverse Floating Rate Securities for more information. |
See accompanying notes to financial statements.
| | | Nuveen Insured California Tax-Free Advantage Municipal Fund |
| NKX | | Portfolio of Investments |
| | Principal | | | | Optional Call | | | | |
| | Amount (000) | | Description (1) | | Provisions (2) | Ratings (3) | | Value | |
| | | | Consumer Staples – 4.9% (3.4% of Total Investments) | | | | | | |
| $ | 6,070 | | Golden State Tobacco Securitization Corporation, California, Tobacco Settlement Asset-Backed Bonds, Series 2007A-2, 0.000%, 6/01/37 | | 6/22 at 100.00 | BB– | $ | 4,238,256 | |
| | | | Health Care – 24.8% (17.4% of Total Investments) | | | | | | |
| | 1,630 | | California Health Facilities Financing Authority, Revenue Bonds, Childrens Hospital Los Angeles, Series 2010A, 5.250%, 7/01/38 – AGC Insured | | 7/20 at 100.00 | AA– | | 1,705,469 | |
| | 662 | | California Statewide Community Development Authority, Revenue Bonds, St. Joseph Health System, Trust 2554, 18.382%, 7/01/47 – AGM Insured (IF) | | 7/18 at 100.00 | AA– | | 809,729 | |
| | 4,000 | | California Statewide Community Development Authority, Insured Health Facility Revenue Bonds, Catholic Healthcare West, Series 2008K, 5.500%, 7/01/41 – AGC Insured | | 7/17 at 100.00 | AA– | | 4,245,160 | |
| | 1,815 | | California Statewide Community Development Authority, Revenue Bonds, Kaiser Permanante System, Series 2006, 5.000%, 3/01/41 | | 3/16 at 100.00 | A+ | | 1,878,507 | |
| | 5,020 | | California Statewide Community Development Authority, Revenue Bonds, Kaiser Permanente System, Series 2006, 5.000%, 3/01/41 – BHAC Insured (UB) | | 3/16 at 100.00 | AA+ | | 5,176,925 | |
| | 4,060 | | California Statewide Community Development Authority, Revenue Bonds, Sherman Oaks Health System, Series 1998A, 5.000%, 8/01/22 – AMBAC Insured | | No Opt. Call | A1 | | 4,500,307 | |
| | 1,500 | | California Statewide Community Development Authority, Revenue Bonds, St. Joseph Health System, Series 2007A, 5.750%, 7/01/47 – FGIC Insured | | 7/18 at 100.00 | AA– | | 1,610,685 | |
| | 1,500 | | Santa Clara County Financing Authority, California, Insured Revenue Bonds, El Camino Hospital, Series 2007A, 5.750%, 2/01/41 – AMBAC Insured | | 8/17 at 100.00 | A+ | | 1,600,785 | |
| | 20,187 | | Total Health Care | | | | | 21,527,567 | |
| | | | Housing/Multifamily – 1.4% (1.0% of Total Investments) | | | | | | |
| | 1,165 | | Poway, California, Housing Revenue Bonds, Revenue Bonds, Poinsettia Mobile Home Park, Series 2003, 5.000%, 5/01/23 | | 5/13 at 102.00 | AA– | | 1,208,385 | |
| | | | Long-Term Care – 7.2% (5.0% of Total Investments) | | | | | | |
| | 3,000 | | ABAG Finance Authority for Non-Profit Corporations, California, Cal-Mortgage Insured Revenue Bonds, Channing House, Series 2010, 6.125%, 5/15/40 | | 5/20 at 100.00 | A– | | 3,229,980 | |
| | 1,000 | | ABAG Finance Authority for Non-Profit Corporations, California, Insured Senior Living Revenue Bonds, Odd Fellows Home of California, Series 2003A, 5.200%, 11/15/22 | | 11/12 at 100.00 | A– | | 1,010,310 | |
| | 2,000 | | California Health Facilities Financing Authority, Cal-Mortgage Insured Revenue Bonds, Northern California Retired Officers Community Corporation – Paradise Valley Estates, Series 2002, 5.250%, 1/01/26 | | 1/13 at 100.00 | A– | | 2,029,160 | |
| | 6,000 | | Total Long-Term Care | | | | | 6,269,450 | |
| | | | Tax Obligation/General – 12.5% (8.8% of Total Investments) | | | | | | |
| | 1,030 | | Fontana Unified School District, San Bernardino County, California, General Obligation Bonds, Trust 2668, 9.515%, 2/01/16 – AGM Insured (IF) | | No Opt. Call | AA– | | 1,290,549 | |
| | 1,175 | | Mount Diablo Unified School District, Contra Costa County, California, General Obligation Bonds, Series 2010A, 0.000%, 8/01/30 – AGM Insured | | 8/25 at 100.00 | AA– | | 774,525 | |
| | 1,000 | | Murrieta Valley Unified School District, Riverside County, California, General Obligation Bonds, Series 2003A, 5.000%, 9/01/26 – FGIC Insured | | 9/13 at 100.00 | A+ | | 1,051,220 | |
| | 1,000 | | Murrieta Valley Unified School District, Riverside County, California, General Obligation Bonds, Series 2007, 4.500%, 9/01/30 – AGM Insured | | 9/17 at 100.00 | AA– | | 1,069,050 | |
| | 140 | | Roseville Joint Union High School District, Placer County, California, General Obligation Bonds, Series 2006B, 5.000%, 8/01/27 – FGIC Insured | | 8/15 at 100.00 | AA– | | 154,759 | |
| | 5,025 | | Stockton Unified School District, San Joaquin County, California, General Obligation Bonds, Election 2008 Series 2011D, 0.000%, 8/01/50 – AGM Insured | | 8/37 at 100.00 | AA– | | 2,330,495 | |
| | 12,520 | | Yosemite Community College District, California, General Obligation Bonds, Capital Appreciation, Election 2004, Series 2010D, 0.000%, 8/01/42 | | No Opt. Call | Aa2 | | 4,183,182 | |
| | 21,890 | | Total Tax Obligation/General | | | | | 10,853,780 | |
| | Principal | | | | Optional Call | | | | |
| | Amount (000) | | Description (1) | | Provisions (2) | Ratings (3) | | Value | |
| | | | Tax Obligation/Limited – 48.7% (34.1% of Total Investments) | | | | | | |
| $ | 550 | | Baldwin Park Public Financing Authority, California, Sales Tax and Tax Allocation Bonds, Puente Merced Redevelopment Project, Series 2003, 5.250%, 8/01/21 | | 8/13 at 102.00 | BBB | $ | 571,725 | |
| | 1,165 | | Burbank Public Financing Authority, California, Revenue Refunding Bonds, Golden State Redevelopment Project, Series 2003A, 5.250%, 12/01/22 – AMBAC Insured | | 12/13 at 100.00 | A | | 1,189,197 | |
| | 4,000 | | California State Public Works Board, Lease Revenue Bonds, Department of General Services, Capital East End Project, Series 2002A, 5.000%, 12/01/27 – AMBAC Insured | | 12/12 at 100.00 | A2 | | 4,105,760 | |
| | 170 | | Capistrano Unified School District, Orange County, California, Special Tax Bonds, Community Facilities District, Series 2005, 5.000%, 9/01/24 – FGIC Insured | | 9/15 at 100.00 | BBB | | 174,502 | |
| | 525 | | Chino Redevelopment Agency, California, Merged Chino Redevelopment Project Area Tax Allocation Bonds, Series 2006, 5.000%, 9/01/38 – AMBAC Insured | | 9/16 at 101.00 | A– | | 507,423 | |
| | 265 | | Dinuba Redevelopment Agency, California, Tax Allocation Bonds, Merged City of Dinuba Redevelopment Project and Dinuba Redevelopment Project 2, As Amended, Refunding Series 2001, 5.000%, 9/01/31 – NPFG Insured | | 9/12 at 101.00 | A– | | 266,084 | |
| | 1,610 | | Folsom Public Financing Authority, California, Special Tax Revenue Bonds, Series 2004A, 5.000%, 9/01/21 – AMBAC Insured | | 9/12 at 102.00 | N/R | | 1,625,826 | |
| | 3,285 | | Golden State Tobacco Securitization Corporation, California, Enhanced Tobacco Settlement Asset-Backed Revenue Bonds, Series 2005A, 5.000%, 6/01/45 – AMBAC Insured | | 6/15 at 100.00 | A2 | | 3,296,005 | |
| | 2,905 | | Golden State Tobacco Securitization Corporation, California, Enhanced Tobacco Settlement Asset-Backed Revenue Bonds, Tender Option Bonds Trust 4686, 8.957%, 6/01/45 – AGC Insured (IF) (4) | | 6/15 at 100.00 | AA– | | 2,945,321 | |
| | 700 | | Hesperia Public Financing Authority, California, Redevelopment and Housing Projects Tax Allocation Bonds, Series 2007A, 5.000%, 9/01/37 – SYNCORA GTY Insured | | 9/17 at 100.00 | Ba1 | | 527,226 | |
| | 330 | | Inglewood Redevelopment Agency, California, Tax Allocation Bonds, Merged Redevelopment Project, Subordinate Lien Series 2007A-1, 5.000%, 5/01/24 – AMBAC Insured | | 5/17 at 100.00 | BBB+ | | 328,786 | |
| | 5,125 | | Irvine Public Facilities and Infrastructure Authority, California, Assessment Revenue Bonds, Series 2003C, 5.000%, 9/02/21 – AMBAC Insured | | 9/13 at 100.00 | N/R | | 5,214,021 | |
| | 315 | | Los Angeles Community Redevelopment Agency, California, Lease Revenue Bonds, Manchester Social Services Project, Series 2005, 5.000%, 9/01/37 – AMBAC Insured | | 9/15 at 100.00 | A1 | | 318,780 | |
| | 1,770 | | Los Angeles Unified School District, California, Certificates of Participation, Administration Building Project II, Series 2002C, 5.000%, 10/01/27 – AMBAC Insured | | 10/12 at 100.00 | Aa3 | | 1,781,399 | |
| | 2,000 | | Los Angeles, California, Certificates of Participation, Municipal Improvement Corporation, Series 2003AW, 5.000%, 6/01/33 – AMBAC Insured | | 6/13 at 100.00 | A+ | | 2,036,300 | |
| | 1,500 | | Los Angeles, California, Municipal Improvement Corporation, Lease Revenue Bonds, Police Headquarters, Series 2006A, 4.750%, 1/01/31 – FGIC Insured | | 1/17 at 100.00 | A+ | | 1,553,310 | |
| | 1,500 | | Los Osos, California, Improvement Bonds, Community Services Wastewater Assessment District 1, Series 2002, 5.000%, 9/02/33 – NPFG Insured | | 3/13 at 100.00 | BBB | | 1,413,285 | |
| | 150 | | Rialto Redevelopment Agency, California, Tax Allocation Bonds, Merged Project Area, Series 2005A, 5.000%, 9/01/35 – SYNCORA GTY Insured | | 9/15 at 100.00 | A– | | 148,061 | |
| | 190 | | Roseville, California, Certificates of Participation, Public Facilities, Series 2003A, 5.000%, 8/01/25 – AMBAC Insured | | 8/13 at 100.00 | AA– | | 194,030 | |
| | | | San Buenaventura, California, Certificates of Participation, Golf Course Financing Project, Series 2002D: | | | | | | |
| | 3,000 | | 5.000%, 2/01/27 – AMBAC Insured | | 8/12 at 100.00 | AA– | | 3,002,730 | |
| | 3,300 | | 5.000%, 2/01/32 – AMBAC Insured | | 8/12 at 100.00 | AA– | | 3,301,650 | |
| | 1,200 | | San Diego Redevelopment Agency, California, Subordinate Lien Tax Increment and Parking Revenue Bonds, Centre City Project, Series 2003B, 5.250%, 9/01/26 | | 3/12 at 100.00 | Baa3 | | 1,200,804 | |
| | 2,770 | | San Jose Financing Authority, California, Lease Revenue Refunding Bonds, Civic Center Project, Series 2002B, 5.000%, 6/01/32 – AMBAC Insured | | 6/12 at 100.00 | AA+ | | 2,780,831 | |
| | 1,000 | | San Jose Redevelopment Agency, California, Tax Allocation Bonds, Merged Project Area, Series 2005A, 5.000%, 8/01/28 – NPFG Insured | | 8/15 at 100.00 | BBB | | 972,670 | |
| | 3,500 | | Stockton Public Financing Authority, California, Lease Revenue Bonds, Series 2004, 5.250%, 9/01/34 – FGIC Insured | | 9/14 at 100.00 | BBB | | 2,814,000 | |
| | 42,825 | | Total Tax Obligation/Limited | | | | | 42,269,726 | |
| | | Nuveen Insured California Tax-Free Advantage Municipal Fund (continued) |
| NKX | | Portfolio of Investments |
February 29, 2012
| | Principal | | | | Optional Call | | | | |
| | Amount (000) | | Description (1) | | Provisions (2) | Ratings (3) | | Value | |
| | | | Transportation – 8.4% (5.9% of Total Investments) | | | | | | |
| $ | 5,480 | | Bay Area Governments Association, California, BART SFO Extension, Airport Premium Fare Revenue Bonds, Series 2002A, 5.000%, 8/01/26 – AMBAC Insured | | 8/12 at 100.00 | N/R | $ | 5,451,940 | |
| | 2,000 | | Foothill/Eastern Transportation Corridor Agency, California, Toll Road Revenue Bonds, Series 1995A, 5.000%, 1/01/35 | | 7/12 at 100.00 | BBB– | | 1,810,440 | |
| | 7,480 | | Total Transportation | | | | | 7,262,380 | |
| | | | U.S. Guaranteed – 20.7% (14.5% of Total Investments) (5) | | | | | | |
| | 1,000 | | Berryessa Union School District, Santa Clara County, California, General Obligation Bonds, Series 2003C, 5.000%, 8/01/21 (Pre-refunded 8/01/12) – AGM Insured | | 8/12 at 100.00 | AA– (5) | | 1,020,580 | |
| | 2,000 | | Butte-Glenn Community College District, Butte and Glenn Counties, California, General Obligation Bonds, Series 2002A, 5.000%, 8/01/26 (Pre-refunded 8/01/12) – NPFG Insured | | 8/12 at 101.00 | Aa2 (5) | | 2,061,060 | |
| | 500 | | California State, General Obligation Bonds, Series 2004, 5.250%, 4/01/34 (Pre-refunded 4/01/14) | | 4/14 at 100.00 | Aaa | | 552,220 | |
| | 450 | | Fremont Unified School District, Alameda County, California, General Obligation Bonds, Series 2002A, 5.000%, 8/01/25 (Pre-refunded 8/01/12) – FGIC Insured | | 8/12 at 101.00 | Aa2 (5) | | 463,761 | |
| | 1,625 | | Golden State Tobacco Securitization Corporation, California, Tobacco Settlement Asset-Backed Revenue Bonds, Series 2003A-2, 7.900%, 6/01/42 (Pre-refunded 6/01/13) | | 6/13 at 100.00 | Aaa | | 1,777,441 | |
| | 2,030 | | Hacienda La Puente Unified School District, Los Angeles County, California, General Obligation Bonds, Series 2003B, 5.000%, 8/01/27 (Pre-refunded 8/01/13) – AGM Insured | | 8/13 at 100.00 | AA– (5) | | 2,168,466 | |
| | 2,000 | | Los Angeles, California, General Obligation Bonds, Series 2002A, 5.000%, 9/01/22 (Pre-refunded 9/01/12) – NPFG Insured | | 9/12 at 100.00 | AA– (5) | | 2,049,220 | |
| | 1,260 | | Rancho Mirage Joint Powers Financing Authority, California, Revenue Bonds, Eisenhower Medical Center, Series 2004, 5.875%, 7/01/26 (Pre-refunded 7/01/14) | | 7/14 at 100.00 | Baa2 (5) | | 1,425,337 | |
| | 3,855 | | San Rafael City High School District, Marin County, California, General Obligation Bonds, Series 2003A, 5.000%, 8/01/28 (Pre-refunded 8/01/12) – AGM Insured | | 8/12 at 100.00 | AA (5) | | 3,934,336 | |
| | 2,390 | | Solano County, California, Certificates of Participation, Series 2002, 5.250%, 11/01/24 (Pre-refunded 11/01/12) – NPFG Insured | | 11/12 at 100.00 | AA– (5) | | 2,472,001 | |
| | 17,110 | | Total U.S. Guaranteed | | | | | 17,924,422 | |
| | | | Utilities – 3.1% (2.2% of Total Investments) | | | | | | |
| | 1,000 | | Anaheim Public Finance Authority, California, Second Lien Electric Distribution Revenue Bonds, Series 2004, 5.250%, 10/01/21 – NPFG Insured | | 10/14 at 100.00 | A+ | | 1,066,480 | |
| | 945 | | Long Beach Bond Finance Authority, California, Natural Gas Purchase Revenue Bonds, Series 2007A, 5.500%, 11/15/37 | | No Opt. Call | A– | | 1,036,107 | |
| | 275 | | Los Angeles Department of Water and Power, California, Power System Revenue Bonds, Series 2003A-2, 5.000%, 7/01/21 – NPFG Insured | | 7/13 at 100.00 | AA– | | 291,242 | |
| | 310 | | Merced Irrigation District, California, Electric System Revenue Bonds, Series 2005, 5.125%, 9/01/31 – SYNCORA GTY Insured | | 9/15 at 100.00 | N/R | | 308,298 | |
| | 2,530 | | Total Utilities | | | | | 2,702,127 | |
| | | | Water and Sewer – 11.1% (7.7% of Total Investments) | | | | | | |
| | 1,000 | | Castaic Lake Water Agency, California, Certificates of Participation, Series 2006C, 5.000%, 8/01/36 – NPFG Insured | | 8/16 at 100.00 | AA– | | 1,035,830 | |
| | 750 | | Fortuna Public Finance Authority, California, Water Revenue Bonds, Series 2006, 5.000%, 10/01/36 – AGM Insured | | 10/16 at 100.00 | AA– | | 785,775 | |
| | 215 | | Healdsburg Public Financing Authority, California, Wastewater Revenue Bonds, Series 2006, 5.000%, 4/01/36 – NPFG Insured | | 4/16 at 100.00 | AA– | | 223,645 | |
| | 575 | | Manteca Financing Authority, California, Sewerage Revenue Bonds, Series 2003B, 5.000%, 12/01/33 – NPFG Insured | | 12/13 at 100.00 | Aa3 | | 586,276 | |
| | 170 | | Marina Coast Water District, California, Enterprise Certificate of Participation, Series 2006, 5.000%, 6/01/31 – NPFG Insured | | 6/16 at 100.00 | AA– | | 178,175 | |
| | Principal | | | | Optional Call | | | | |
| | Amount (000) | | Description (1) | | Provisions (2) | Ratings (3) | | Value | |
| | | | Water and Sewer (continued) | | | | | | |
| | | | San Diego Public Facilities Financing Authority, California, Subordinate Lien Water Revenue Bonds, Series 2002: | | | | | | |
| $ | 3,000 | | 5.000%, 8/01/22 – NPFG Insured | | 8/12 at 100.00 | Aa3 | $ | 3,056,070 | |
| | 2,500 | | 5.000%, 8/01/23 – NPFG Insured | | 8/12 at 100.00 | Aa3 | | 2,540,725 | |
| | 1,180 | | South Feather Water and Power Agency, California, Water Revenue Certificates of Participation, Solar Photovoltaic Project, Series 2003, 5.375%, 4/01/24 | | 4/13 at 100.00 | A | | 1,197,582 | |
| | 9,390 | | Total Water and Sewer | | | | | 9,604,078 | |
| $ | 134,647 | | Total Investments (cost $120,163,365) – 142.8% | | | | | 123,860,171 | |
| | | | Floating Rate Obligations – (3.9)% | | | | | (3,360,000 | ) |
| | | | Variable Rate Demand Preferred Shares, at Liquidation Value – (40.9)% (6) | | | | | (35,500,000 | ) |
| | | | Other Assets Less Liabilities – 2.0% | | | | | 1,730,702 | |
| | | | Net Assets Applicable to Common Shares – 100% | | | | $ | 86,730,873 | |
| | | The Fund intends to invest at least 80% of its net assets in municipal securities that are covered by insurance guaranteeing the timely payment of principal and interest. See Notes to Financial Statements, Footnote 1 – General Information and Significant Accounting Policies, Insurance for more information. |
| (1) | | All percentages shown in the Portfolio of Investments are based on net assets applicable to Common shares unless otherwise noted. |
| (2) | | Optional Call Provisions (not covered by the report of independent registered public accounting firm): Dates (month and year) and prices of the earliest optional call or redemption. There may be other call provisions at varying prices at later dates. Certain mortgage-backed securities may be subject to periodic principal paydowns. |
| (3) | | Ratings (not covered by the report of independent registered public accounting firm): Using the highest of Standard & Poor’s Group (“Standard & Poor’s”), Moody’s Investors Service, Inc. (“Moody’s”) or Fitch, Inc. (“Fitch”) rating. Ratings below BBB by Standard & Poor’s, Baa by Moody’s or BBB by Fitch are considered to be below investment grade. Holdings designated N/R are not rated by any of these national rating agencies. |
| (4) | | Investment, or portion of investment, has been pledged to collaterize the net payment obligations for investments in inverse floating rate transactions. |
| (5) | | Backed by an escrow or trust containing sufficient U.S. Government or U.S. Government agency securities, which ensure the timely payment of principal and interest. Certain bonds backed by U.S. Government or agency securities are regarded as having an implied rating equal to the rating of such securities. |
| (6) | | Variable Rate Demand Preferred Shares, at Liquidation Value as a percentage of Total Investments is 28.7%. |
| N/R | | Not rated. |
| (IF) | | Inverse floating rate investment. |
| (UB) | | Underlying bond of an inverse floating rate trust reflected as a financing transaction. See Notes to Financial Statements, Footnote 1 – General Information and Significant Accounting Policies, Inverse Floating Rate Securities for more information. |
| | | |
| | | See accompanying notes to financial statements. |
| | | Statement of |
| | | Assets & Liabilities |
| | | February 29, 2012 |
| | | Insured California Premium Income (NPC | ) | Insured California Premium Income 2 (NCL | ) | California Premium Income (NCU | ) | California Dividend Advantage (NAC | ) |
| Assets | | | | | | | | | | | | | |
| Investments, at value (cost $126,573,381, $263,273,073, $115,646,263 and $484,363,905, respectively) | | $ | 138,048,126 | | $ | 280,025,460 | | $ | 125,293,556 | | $ | 510,520,007 | |
| Cash | | | 5,040,057 | | | 1,721,865 | | | 1,031,216 | | | 1,740,120 | |
| Receivables: | | | | | | | | | | | | | |
| Interest | | | 2,358,079 | | | 3,315,739 | | | 1,486,133 | | | 7,650,415 | |
| Investments sold | | | — | | | 2,409,626 | | | 2,350,000 | | | — | |
| Deferred offering costs | | | 802,028 | | | 602,503 | | | 619,858 | | | 635,430 | |
| Other assets | | | 38,431 | | | 85,157 | | | 3,474 | | | 182,657 | |
| Total assets | | | 146,286,721 | | | 288,160,350 | | | 130,784,237 | | | 520,728,629 | |
| | | | | | | | | | | | | | |
| Liabilities | | | | | | | | | | | | | |
| Floating rate obligations | | | — | | | 17,880,000 | | | 6,650,000 | | | 28,545,000 | |
| Payables: | | | | | | | | | | | | | |
| Common share dividends | | | 429,090 | | | 899,997 | | | 394,913 | | | 1,760,133 | |
| Interest | | | — | | | — | | | 60,701 | | | — | |
| Investments purchased | | | — | | | — | | | 503,450 | | | 4,554,000 | |
| Offering costs | | | 186,672 | | | 121,533 | | | 54,715 | | | 38,004 | |
| MuniFund Term Preferred (MTP) Shares, at liquidation value | | | — | | | — | | | 35,250,000 | | | — | |
| Variable Rate Demand Preferred (VRDP) Shares, at liquidation value | | | 42,700,000 | | | 74,000,000 | | | — | | | 136,200,000 | |
| Accrued expenses: | | | | | | | | | | | | | |
| Management fees | | | 73,062 | | | 141,188 | | | 63,815 | | | 251,791 | |
| Other | | | 416,974 | | | 405,600 | | | 51,505 | | | 176,859 | |
| Total liabilities | | | 43,805,798 | | | 93,448,318 | | | 43,029,099 | | | 171,525,787 | |
| Net assets applicable to Common shares | | $ | 102,480,923 | | $ | 194,712,032 | | $ | 87,755,138 | | $ | 349,202,842 | |
| Common shares outstanding | | | 6,449,565 | | | 12,671,099 | | | 5,730,688 | | | 23,483,222 | |
| Net asset value per Common share outstanding (net assets applicable to Common shares, divided by Common shares outstanding) | | $ | 15.89 | | $ | 15.37 | | $ | 15.31 | | $ | 14.87 | |
| Net assets applicable to Common shares consist of: | | | | | | | | | | | | | |
| Common shares, $.01 par value per share | | $ | 64,496 | | $ | 126,711 | | $ | 57,307 | | $ | 234,832 | |
| Paid-in surplus | | | 88,909,756 | | | 175,580,095 | | | 77,627,379 | | | 334,377,186 | |
| Undistributed (Over-distribution of) net investment income | | | 1,541,439 | | | 3,188,005 | | | 1,458,906 | | | 6,736,623 | |
| Accumulated net realized gain (loss) | | | 490,487 | | | (935,166 | ) | | (1,035,747 | ) | | (18,301,901 | ) |
| Net unrealized appreciation (depreciation) | | | 11,474,745 | | | 16,752,387 | | | 9,647,293 | | | 26,156,102 | |
| Net assets applicable to Common shares | | $ | 102,480,923 | | $ | 194,712,032 | | $ | 87,755,138 | | $ | 349,202,842 | |
| Authorized shares: | | | | | | | | | | | | | |
| Common | | | 200,000,000 | | | 200,000,000 | | | Unlimited | | | Unlimited | |
| Auction Rate Preferred Shares (ARPS) | | | 1,000,000 | | | 1,000,000 | | | Unlimited | | | Unlimited | |
| MTP | | | — | | | — | | | Unlimited | | | — | |
| VRDP | | | 50,000 | | | 50,000 | | | — | | | Unlimited | |
See accompanying notes to financial statements.
| | | California Dividend Advantage 2 (NVX | ) | California Dividend Advantage 3 (NZH | ) | Insured California Dividend Advantage (NKL | ) | Insured California Tax-Free Advantage (NKX | ) |
| Assets | | | | | | | | | | | | | |
| Investments, at value (cost $311,649,957, $467,719,489, $328,368,423 and $120,163,365, respectively) | | $ | 329,724,378 | | $ | 488,106,122 | | $ | 350,901,757 | | $ | 123,860,171 | |
| Cash | | | 4,687,040 | | | 5,820,018 | | | 498,690 | | | 368,231 | |
| Receivables: | | | | | | | | | | | | | |
| Interest | | | 4,923,825 | | | 7,983,472 | | | 3,980,798 | | | 1,486,095 | |
| Investments sold | | | 10,300 | | | 1,390,980 | | | 1,792,434 | | | — | |
| Deferred offering costs | | | 1,480,243 | | | 2,126,839 | | | 567,000 | | | 472,840 | |
| Other assets | | | 40,509 | | | 65,133 | | | 134,502 | | | 35,665 | |
| Total assets | | | 340,866,295 | | | 505,492,564 | | | 357,875,181 | | | 126,223,002 | |
| Liabilities | | | | | | | | | | | | | |
| Floating rate obligations | | | 11,390,000 | | | 3,845,000 | | | 7,385,000 | | | 3,360,000 | |
| Payables: | | | | | | | | | | | | | |
| Common share dividends | | | 1,153,849 | | | 1,755,752 | | | 1,232,542 | | | 401,243 | |
| Interest | | | 183,813 | | | 363,454 | | | — | | | — | |
| Investments purchased | | | 1,345,900 | | | 3,383,534 | | | — | | | — | |
| Offering costs | | | 197,948 | | | 372,133 | | | 33,247 | | | — | |
| MuniFund Term Preferred (MTP) Shares, at liquidation value | | | 97,846,300 | | | 159,544,500 | | | — | | | — | |
| Variable Rate Demand Preferred (VRDP) Shares, at liquidation value | | | — | | | — | | | 104,400,000 | | | 35,500,000 | |
| Accrued expenses: | | | | | | | | | | | | | |
| Management fees | | | 165,690 | | | 250,563 | | | 161,285 | | | 62,578 | |
| Other | | | 108,798 | | | 147,272 | | | 142,473 | | | 168,308 | |
| Total liabilities | | | 112,392,298 | | | 169,662,208 | | | 113,354,547 | | | 39,492,129 | |
| Net assets applicable to Common shares | | $ | 228,473,997 | | $ | 335,830,356 | | $ | 244,520,634 | | $ | 86,730,873 | |
| Common shares outstanding | | | 14,746,722 | | | 24,139,232 | | | 15,265,697 | | | 5,888,875 | |
| Net asset value per Common share outstanding (net assets applicable to Common shares, divided by Common shares outstanding) | | $ | 15.49 | | $ | 13.91 | | $ | 16.02 | | $ | 14.73 | |
| Net assets applicable to Common shares consist of: | | | | | | | | | | | | | |
| Common shares, $.01 par value per share | | $ | 147,467 | | $ | 241,392 | | $ | 152,657 | | $ | 58,889 | |
| Paid-in surplus | | | 209,062,269 | | | 338,696,024 | | | 216,833,807 | | | 82,740,430 | |
| Undistributed (Over-distribution of) net investment income | | | 3,684,167 | | | 2,623,057 | | | 4,728,415 | | | 1,216,642 | |
| Accumulated net realized gain (loss) | | | (2,494,327 | ) | | (26,116,750 | ) | | 272,421 | | | (981,894 | ) |
| Net unrealized appreciation (depreciation) | | | 18,074,421 | | | 20,386,633 | | | 22,533,334 | | | 3,696,806 | |
| Net assets applicable to Common shares | | $ | 228,473,997 | | $ | 335,830,356 | | $ | 244,520,634 | | $ | 86,730,873 | |
| Authorized shares: | | | | | | | | | | | | | |
| Common | | | Unlimited | | | Unlimited | | | Unlimited | | | Unlimited | |
| Auction Rate Preferred Shares (ARPS) | | | Unlimited | | | Unlimited | | | Unlimited | | | Unlimited | |
| MTP | | | Unlimited | | | Unlimited | | | — | | | — | |
| VRDP | | | — | | | — | | | Unlimited | | | Unlimited | |
See accompanying notes to financial statements.
| | | Statement of |
| | | Operations |
| | | Year Ended February 29, 2012 |
| | | Insured California Premium Income (NPC | ) | Insured California Premium Income 2 (NCL | ) | California Premium Income (NCU | ) | California Dividend Advantage (NAC | ) |
| Investment Income | | $ | 7,384,524 | | $ | 14,109,847 | | $ | 6,676,429 | | $ | 26,810,378 | |
| Expenses | | | | | | | | | | | | | |
| Management fees | | | 881,605 | | | 1,702,059 | | | 765,538 | | | 3,038,856 | |
| Auction fees | | | — | | | — | | | — | | | 56,375 | |
| Dividend disbursing agent fees | | | — | | | — | | | — | | | 8,353 | |
| Shareholders’ servicing agent fees and expenses | | | 6,435 | | | 10,095 | | | 20,617 | | | 3,190 | |
| Interest expense and amortization of offering costs | | | 163,551 | | | 363,073 | | | 914,462 | | | 446,722 | |
| Fees on VRDP Shares | | | 485,559 | | | 649,922 | | | — | | | 1,036,757 | |
| Custodian’s fees and expenses | | | 25,022 | | | 45,582 | | | 23,875 | | | 81,688 | |
| Directors’/Trustees’ fees and expenses | | | 4,191 | | | 7,573 | | | 3,543 | | | 13,008 | |
| Professional fees | | | 25,108 | | | 24,031 | | | 27,359 | | | — | |
| Shareholders’ reports – printing and mailing expenses | | | 18,785 | | | 29,252 | | | 23,714 | | | 43,113 | |
| Stock exchange listing fees | | | 8,911 | | | 8,911 | | | 21,451 | | | 26,370 | |
| Investor relations expense | | | 9,404 | | | 16,708 | | | 9,211 | | | 27,887 | |
| Reorganization expense | | | 365,000 | | | 290,000 | | | — | | | — | |
| Other expenses | | | 31,638 | | | 39,238 | | | 31,901 | | | 34,332 | |
| Total expenses before custodian fee credit and expense reimbursement | | | 2,025,209 | | | 3,186,444 | | | 1,841,671 | | | 4,816,651 | |
| Custodian fee credit | | | (588 | ) | | (782 | ) | | (433 | ) | | (1,970 | ) |
| Expense reimbursement | | | — | | | — | | | — | | | — | |
| Net expenses | | | 2,024,621 | | | 3,185,662 | | | 1,841,238 | | | 4,814,681 | |
| Net investment income (loss) | | | 5,359,903 | | | 10,924,185 | | | 4,835,191 | | | 21,995,697 | |
| Realized and Unrealized Gain (Loss) | | | | | | | | | | | | | |
| Net realized gain (loss) from: | | | | | | | | | | | | | |
| Investments | | | 872,050 | | | 750,538 | | | (69,508 | ) | | (4,191,786 | ) |
| Forward swaps | | | — | | | (346,971 | ) | | — | | | — | |
| Change in net unrealized appreciation (depreciation) of: | | | | | | | | | | | | | |
| Investments | | | 14,571,360 | | | 29,265,714 | | | 13,699,675 | | | 55,341,444 | |
| Forward swaps | | | — | | | 15,872 | | | — | | | — | |
| Net realized and unrealized gain (loss) | | | 15,443,410 | | | 29,685,153 | | | 13,630,167 | | | 51,149,658 | |
| Distributions to Auction Rate Preferred Shareholders | | | | | | | | | | | | | |
| From net investment income | | | — | | | — | | | — | | | (164,318 | ) |
| Decrease in net assets applicable to Common shares from distributions to Auction Rate Preferred shareholders | | | — | | | — | | | — | | | (164,318 | ) |
| Net increase (decrease) in net assets applicable to Common shares from operations | | $ | 20,803,313 | | $ | 40,609,338 | | $ | 18,465,358 | | $ | 72,981,037 | |
See accompanying notes to financial statements.
| | | California Dividend Advantage 2 (NVX | ) | California Dividend Advantage 3 (NZH | ) | Insured California Dividend Advantage (NKL | ) | Insured California Tax-Free Advantage (NKX | ) |
| Investment Income | | $ | 18,196,091 | | $ | 27,559,307 | | $ | 18,469,354 | | $ | 6,453,342 | |
| Expenses | | | | | | | | | | | | | |
| Management fees | | | 2,006,917 | | | 3,042,367 | | | 2,113,341 | | | 759,435 | |
| Auction fees | | | — | | | 7,192 | | | 28,892 | | | — | |
| Dividend disbursing agent fees | | | 3,342 | | | 13,425 | | | 23,342 | | | — | |
| Shareholders’ servicing agent fees and expenses | | | 21,836 | | | 23,741 | | | 1,508 | | | 769 | |
| Interest expense and amortization of offering costs | | | 2,643,277 | | | 4,656,322 | | | 257,870 | | | 140,179 | |
| Fees on VRDP Shares | | | — | | | — | | | 794,694 | | | 403,684 | |
| Custodian’s fees and expenses | | | 49,740 | | | 75,912 | | | 55,515 | | | 22,146 | |
| Directors’/Trustees’ fees and expenses | | | 9,418 | | | 14,163 | | | 9,522 | | | 3,542 | |
| Professional fees | | | 23,828 | | | — | | | 22,119 | | | — | |
| Shareholders’ reports – printing and mailing expenses | | | 43,144 | | | 54,210 | | | 30,804 | | | 16,628 | |
| Stock exchange listing fees | | | 33,918 | | | 29,816 | | | 2,002 | | | 773 | |
| Investor relations expense | | | 21,009 | | | 28,370 | | | 20,129 | | | 7,846 | |
| Reorganization expense | | | — | | | — | | | 20,000 | | | 160,000 | |
| Other expenses | | | 19,338 | | | 40,249 | | | 36,447 | | | 30,590 | |
| Total expenses before custodian fee credit and expense reimbursement | | | 4,875,767 | | | 7,985,767 | | | 3,416,185 | | | 1,545,592 | |
| Custodian fee credit | | | (1,583 | ) | | (2,283 | ) | | (922 | ) | | (827 | ) |
| Expense reimbursement | | | (13,080 | ) | | (142,842 | ) | | (185,280 | ) | | — | |
| Net expenses | | | 4,861,104 | | | 7,840,642 | | | 3,229,983 | | | 1,544,765 | |
| Net investment income (loss) | | | 13,334,987 | | | 19,718,665 | | | 15,239,371 | | | 4,908,577 | |
| Realized and Unrealized Gain (Loss) | | | | | | | | | | | | | |
| Net realized gain (loss) from: | | | | | | | | | | | | | |
| Investments | | | (1,141,813 | ) | | (5,120,796 | ) | | 1,662,629 | | | 29,958 | |
| Forward swaps | | | — | | | — | | | — | | | — | |
| Change in net unrealized appreciation (depreciation) of: | | | | | | | | | | | | | |
| Investments | | | 31,781,569 | | | 50,296,977 | | | 33,515,295 | | | 11,150,968 | |
| Forward swaps | | | — | | | — | | | — | | | — | |
| Net realized and unrealized gain (loss) | | | 30,639,756 | | | 45,176,181 | | | 35,177,924 | | | 11,180,926 | |
| Distributions to Auction Rate Preferred Shareholders | | | | | | | | | | | | | |
| From net investment income | | | (18,547 | ) | | (62,212 | ) | | (125,654 | ) | | — | |
| Decrease in net assets applicable to Common shares from distributions to Auction Rate Preferred shareholders | | | (18,547 | ) | | (62,212 | ) | | (125,654 | ) | | — | |
| Net increase (decrease) in net assets applicable to Common shares from operations | | $ | 43,956,196 | | $ | 64,832,634 | | $ | 50,291,641 | | $ | 16,089,503 | |
See accompanying notes to financial statements.
| | | Statement of |
| | | Changes in Net Assets |
| | | Insured California Premium Income (NPC) | | Insured California Premium Income 2 (NCL) | | California Premium Income (NCU) | |
| | | Year Ended 2/29/12 | | Year Ended 2/28/11 | | Year Ended 2/29/12 | | Year Ended 2/28/11 | | Year Ended 2/29/12 | | Year Ended 2/28/11 | |
| Operations | | | | | | | | | | | | | | | | | | | |
| Net investment income (loss) | | $ | 5,359,903 | | $ | 5,688,214 | | $ | 10,924,185 | | $ | 11,578,448 | | $ | 4,835,191 | | $ | 5,256,437 | |
| Net realized gain (loss) from: | | | | | | | | | | | | | | | | | | | |
| Investments | | | 872,050 | | | 171,851 | | | 750,538 | | | 3,862,920 | | | (69,508 | ) | | 17,475 | |
| Forward swaps | | | — | | | — | | | (346,971 | ) | | — | | | — | | | — | |
| Change in net unrealized appreciation (depreciation) of: | | | | | | | | | | | | | | | | | | | |
| Investments | | | 14,571,360 | | | (7,233,345 | ) | | 29,265,714 | | | (16,035,141 | ) | | 13,699,675 | | | (4,515,299 | ) |
| Forward swaps | | | — | | | — | | | 15,872 | | | (15,872 | ) | | — | | | — | |
| Distributions to Auction Rate Preferred Shareholders from net investment income | | | — | | | (25,864 | ) | | — | | | (280,073 | ) | | — | | | (91,616 | ) |
| Net increase (decrease) in net assets applicable to Common shares from operations | | | 20,803,313 | | | (1,399,144 | ) | | 40,609,338 | | | (889,718 | ) | | 18,465,358 | | | 666,997 | |
| Distributions to Common Shareholders | | | | | | | | | | | | | | | | | | | |
| From net investment income | | | (5,638,153 | ) | | (5,537,014 | ) | | (11,358,398 | ) | | (10,941,930 | ) | | (4,985,699 | ) | | (4,944,267 | ) |
| From accumulated net realized gains | | | (624,887 | ) | | (180,380 | ) | | — | | | — | | | — | | | — | |
| Decrease in net assets applicable to Common shares from distributions to Common shareholders | | | (6,263,040 | ) | | (5,717,394 | ) | | (11,358,398 | ) | | (10,941,930 | ) | | (4,985,699 | ) | | (4,944,267 | ) |
| Capital Share Transactions | | | | | | | | | | | | | | | | | | | |
| Common shares: | | | | | | | | | | | | | | | | | | | |
| Net proceeds issued to shareholders due to reinvestment of distributions | | | 113,629 | | | — | | | 101,875 | | | 36,242 | | | — | | | — | |
| Repurchased and retired | | | — | | | — | | | — | | | (14,592 | ) | | — | | | (28,416 | ) |
| Net increase (decrease) in net assets applicable to Common shares from capital share transactions | | | 113,629 | | | — | | | 101,875 | | | 21,650 | | | — | | | (28,416 | ) |
| Net increase (decrease) in net assets applicable to Common shares | | | 14,653,902 | | | (7,116,538 | ) | | 29,352,815 | | | (11,809,998 | ) | | 13,479,659 | | | (4,305,686 | ) |
| Net assets applicable to Common shares at the beginning of period | | | 87,827,021 | | | 94,943,559 | | | 165,359,217 | | | 177,169,215 | | | 74,275,479 | | | 78,581,165 | |
| Net assets applicable to Common shares at the end of period | | $ | 102,480,923 | | $ | 87,827,021 | | $ | 194,712,032 | | $ | 165,359,217 | | $ | 87,755,138 | | $ | 74,275,479 | |
| Undistributed (Over-distribution of) net investment income at the end of period | | $ | 1,541,439 | | $ | 1,493,036 | | $ | 3,188,005 | | $ | 3,319,135 | | $ | 1,458,906 | | $ | 1,445,417 | |
See accompanying notes to financial statements.
| | | California Dividend Advantage (NAC) | | California Dividend Advantage 2 (NVX) | | California Dividend Advantage 3 (NZH) | |
| | | Year Ended 2/29/12 | | Year Ended 2/28/11 | | Year Ended 2/29/12 | | Year Ended 2/28/11 | | Year Ended 2/29/12 | | Year Ended 2/28/11 | |
| Operations | | | | | | | | | | | | | | | | | | | |
| Net investment income (loss) | | $ | 21,995,697 | | $ | 23,199,120 | | $ | 13,334,987 | | $ | 15,204,018 | | $ | 19,718,665 | | $ | 21,221,264 | |
| Net realized gain (loss) from: | | | | | | | | | | | | | | | | | | | |
| Investments | | | (4,191,786 | ) | | 504,735 | | | (1,141,813 | ) | | 1,606,851 | | | (5,120,796 | ) | | (1,730,418 | ) |
| Forward swaps | | | — | | | — | | | — | | | — | | | — | | | — | |
| Change in net unrealized appreciation (depreciation) of: | | | | | | | | | | | | | | | | | | | |
| Investments | | | 55,341,444 | | | (30,484,773 | ) | | 31,781,569 | | | (17,378,595 | ) | | 50,296,977 | | | (22,899,118 | ) |
| Forward swaps | | | — | | | — | | | — | | | — | | | — | | | — | |
| Distributions to Auction Rate Preferred Shareholders from net investment income | | | (164,318 | ) | | (565,279 | ) | | (18,547 | ) | | (331,826 | ) | | (62,212 | ) | | (290,939 | ) |
| Net increase (decrease) in net assets applicable to Common shares from operations | | | 72,981,037 | | | (7,346,197 | ) | | 43,956,196 | | | (899,552 | ) | | 64,832,634 | | | (3,699,211 | ) |
| Distributions to Common Shareholders | | | | | | | | | | | | | | | | | | | |
| From net investment income | | | (21,449,669 | ) | | (20,815,246 | ) | | (14,156,853 | ) | | (14,112,614 | ) | | (21,716,912 | ) | | (21,711,954 | ) |
| From accumulated net realized gains | | | — | | | — | | | — | | | — | | | — | | | — | |
| Decrease in net assets applicable to Common shares from distributions to Common shareholders | | | (21,449,669 | ) | | (20,815,246 | ) | | (14,156,853 | ) | | (14,112,614 | ) | | (21,716,912 | ) | | (21,711,954 | ) |
| Capital Share Transactions | | | | | | | | | | | | | | | | | | | |
| Common shares: | | | | | | | | | | | | | | | | | | | |
| Net proceeds issued to shareholders due to reinvestment of distributions | | | 42,394 | | | — | | | — | | | — | | | 151,583 | | | 114,072 | |
| Repurchased and retired | | | — | | | — | | | — | | | — | | | — | | | — | |
| Net increase (decrease) in net assets applicable to Common shares from capital share transactions | | | 42,394 | | | — | | | — | | | — | | | 151,583 | | | 114,072 | |
| Net increase (decrease) in net assets applicable to Common shares | | | 51,573,762 | | | (28,161,443 | ) | | 29,799,343 | | | (15,012,166 | ) | | 43,267,305 | | | (25,297,093 | ) |
| Net assets applicable to Common shares at the beginning of period | | | 297,629,080 | | | 325,790,523 | | | 198,674,654 | | | 213,686,820 | | | 292,563,051 | | | 317,860,144 | |
| Net assets applicable to Common shares at the end of period | | $ | 349,202,842 | | $ | 297,629,080 | | $ | 228,473,997 | | $ | 198,674,654 | | $ | 335,830,356 | | $ | 292,563,051 | |
| Undistributed (Over-distribution of) net investment income at the end of period | | $ | 6,736,623 | | $ | 6,424,912 | | $ | 3,684,167 | | $ | 4,037,577 | | $ | 2,623,057 | | $ | 3,952,914 | |
See accompanying notes to financial statements.
| | | Statement of |
| | | Changes in Net Assets (continued) |
| | | Insured California Dividend Advantage (NKL) | | Insured California Tax-Free Advantage (NKX) | |
| | | Year Ended 2/29/12 | | Year Ended 2/28/11 | | Year Ended 2/29/12 | | Year Ended 2/28/11 | |
| Operations | | | | | | | | | | | | | |
| Net investment income (loss) | | $ | 15,239,371 | | $ | 15,829,293 | | $ | 4,908,577 | | $ | 4,750,929 | |
| Net realized gain (loss) from: | | | | | | | | | | | | | |
| Investments | | | 1,662,629 | | | 93,837 | | | 29,958 | | | 105,651 | |
| Forward swaps | | | — | | | — | | | — | | | — | |
| Change in net unrealized appreciation (depreciation) of: | | | | | | | | | | | | | |
| Investments | | | 33,515,295 | | | (16,671,070 | ) | | 11,150,968 | | | (7,235,385 | ) |
| Forward swaps | | | — | | | — | | | — | | | — | |
| Distributions to Auction Rate Preferred Shareholders from net investment income | | | (125,654 | ) | | (435,387 | ) | | — | | | — | |
| Net increase (decrease) in net assets applicable to Common shares from operations | | | 50,291,641 | | | (1,183,327 | ) | | 16,089,503 | | | (2,378,805 | ) |
| Distributions to Common Shareholders | | | | | | | | | | | | | |
| From net investment income | | | (14,866,235 | ) | | (14,210,033 | ) | | (4,874,826 | ) | | (4,715,499 | ) |
| From accumulated net realized gains | | | — | | | — | | | — | | | — | |
| Decrease in net assets applicable to Common shares from distributions to Common shareholders | | | (14,866,235 | ) | | (14,210,033 | ) | | (4,874,826 | ) | | (4,715,499 | ) |
| Capital Share Transactions | | | | | | | | | | | | | |
| Common shares: | | | | | | | | | | | | | |
| Net proceeds issued to shareholders due to reinvestment of distributions | | | 145,163 | | | 42,871 | | | 23,555 | | | 8,413 | |
| Repurchased and retired | | | — | | | — | | | — | | | — | |
| Net increase (decrease) in net assets applicable to Common shares from capital share transactions | | | 145,163 | | | 42,871 | | | 23,555 | | | 8,413 | |
| Net increase (decrease) in net assets applicable to Common shares | | | 35,570,569 | | | (15,350,489 | ) | | 11,238,232 | | | (7,085,891 | ) |
| Net assets applicable to Common shares at the beginning of period | | | 208,950,065 | | | 224,300,554 | | | 75,492,641 | | | 82,578,532 | |
| Net assets applicable to Common shares at the end of period | | $ | 244,520,634 | | $ | 208,950,065 | | $ | 86,730,873 | | $ | 75,492,641 | |
| Undistributed (Over-distribution of)net investment income at the end of period | | $ | 4,728,415 | | $ | 4,534,074 | | $ | 1,216,642 | | $ | 1,034,878 | |
See accompanying notes to financial statements.
Year Ended February 29, 2012
| | | Insured California Premium Income (NPC | ) | Insured California Premium Income 2 (NCL | ) | California Premium Income (NCU | ) |
| Cash Flows from Operating Activities: | | | | | | | | | | |
| Net Increase (Decrease) In Net Assets Applicable to Common Shares from Operations | | $ | 20,803,313 | | $ | 40,609,338 | | $ | 18,465,358 | |
| Adjustments to reconcile the net increase (decrease) in net assets applicable to Common shares from operations to net cash provided by (used in) operating activities: | | | | | | | | | | |
| Purchases of investments | | | (12,983,889 | ) | | (12,024,117 | ) | | (16,847,836 | ) |
| Proceeds from sales and maturities of investments | | | 18,528,716 | | | 16,165,459 | | | 19,281,830 | |
| Proceeds from (Payments for) forward swap contracts, net | | | — | | | (346,971 | ) | | — | |
| Amortization (Accretion) of premiums and discounts, net | | | 391,594 | | | (490,055 | ) | | (224,862 | ) |
| (Increase) Decrease in: | | | | | | | | | | |
| Receivable for interest | | | 63,056 | | | 99,017 | | | 31,830 | |
| Receivable for investments sold | | | — | | | (2,214,626 | ) | | (2,350,000 | ) |
| Other assets | | | 608 | | | (8,162 | ) | | 10,994 | |
| Increase (Decrease) in: | | | | | | | | | | |
| Payable for Auction Rate Preferred Share dividends | | | — | | | — | | | — | |
| Payable for interest | | | — | | | — | | | 1,951 | |
| Payable for investments purchased | | | — | | | — | | | 503,450 | |
| Accrued management fees | | | 9,228 | | | 18,194 | | | 8,474 | |
| Accrued other expenses | | | 379,611 | | | 312,186 | | | 17,693 | |
| Net realized (gain) loss from: | | | | | | | | | | |
| Investments | | | (872,050 | ) | | (750,538 | ) | | 69,508 | |
| Forward swaps | | | — | | | 346,971 | | | — | |
| Change in net unrealized (appreciation) depreciation of: | | | | | | | | | | |
| Investments | | | (14,571,360 | ) | | (29,265,714 | ) | | (13,699,675 | ) |
| Forward swaps | | | — | | | (15,872 | ) | | — | |
| Taxes paid on undistributed capital gains | | | (10,023 | ) | | (6,394 | ) | | (528 | ) |
| Net cash provided by (used in) operating activities | | | 11,738,804 | | | 12,428,716 | | | 5,268,187 | |
| Cash Flows from Financing Activities: | | | | | | | | | | |
| (Increase) Decrease in deferred offering costs | | | 28,701 | | | 20,997 | | | 171,163 | |
| Increase (Decrease) in: | | | | | | | | | | |
| Cash overdraft balance | | | (400,154 | ) | | — | | | — | |
| Payable for offering costs | | | (185,071 | ) | | (209,163 | ) | | (109,428 | ) |
| MTP Shares, at liquidation value | | | — | | | — | | | — | |
| VRDP Shares, at liquidation value | | | — | | | — | | | — | |
| ARPS, at liquidation value | | | — | | | — | | | — | |
| Cash distributions paid to Common shareholders | | | (6,142,223 | ) | | (11,207,831 | ) | | (4,980,304 | ) |
| Net cash provided by (used in) financing activities | | | (6,698,747 | ) | | (11,395,997 | ) | | (4,918,569 | ) |
| Net Increase (Decrease) in Cash | | | 5,040,057 | | | 1,032,719 | | | 349,618 | |
| Cash at the beginning of period | | | — | | | 689,146 | | | 681,598 | |
| Cash at the End of Period | | $ | 5,040,057 | | $ | 1,721,865 | | $ | 1,031,216 | |
Supplemental Disclosure of Cash Flow Information
Non-cash financing activities not included herein consist of reinvestments of Common share distributions as follows:
| | | | | | | | | | | |
| | | Insured California | | Insured California | | California | |
| | | Premium Income | | Premium Income 2 | | Premium Income | |
| | | | (NPC | ) | | (NCL | ) | | (NCU | ) |
| | | $ | 113,629 | | $ | 101,875 | | $ | — | |
Cash paid for interest (excluding amortization of offering costs) was as follows:
| | | | | | | | | | | |
| | | Insured California | | Insured California | | California | |
| | | Premium Income | | Premium Income 2 | | Premium Income | |
| | | | (NPC | ) | | (NCL | ) | | (NCU | ) |
| | | $ | 134,849 | | $ | 342,076 | | $ | 741,348 | |
See accompanying notes to financial statements.
| | | Statement of |
| | | Cash Flows (continued) |
| | | California Dividend | | California Dividend | | California Dividend | |
| | | Advantage | | Advantage 2 | | Advantage 3 | |
| | | | (NAC | ) | | (NVX | ) | | (NZH | ) |
| Cash Flows from Operating Activities: | | | | | | | | | | |
| Net Increase (Decrease) In Net Assets Applicable to Common Shares from Operations | | $ | 72,981,037 | | $ | 43,956,196 | | $ | 64,832,634 | |
| Adjustments to reconcile the net increase (decrease) in net assets applicable to Common shares from operations to net cash provided by (used in) operating activities: | | | | | | | | | | |
| Purchases of investments | | | (62,499,012 | ) | | (36,098,754 | ) | | (81,633,691 | ) |
| Proceeds from sales and maturities of investments | | | 64,252,705 | | | 38,147,419 | | | 83,209,836 | |
| Proceeds from (Payments for) forward swap contracts, net | | | — | | | — | | | — | |
| Amortization (Accretion) of premiums and discounts, net | | | (1,986,095 | ) | | (727,019 | ) | | (1,192,373 | ) |
| (Increase) Decrease in: | | | | | | | | | | |
| Receivable for interest | | | (31,486 | ) | | (138,619 | ) | | (310,631 | ) |
| Receivable for investments sold | | | 5,439,776 | | | — | | | 3,393,955 | |
| Other assets | | | (38,623 | ) | | 28,930 | | | 80,600 | |
| Increase (Decrease) in: | | | | | | | | | | |
| Payable for Auction Rate Preferred Share dividends | | | (3,082 | ) | | (4,536 | ) | | (8,496 | ) |
| Payable for interest | | | — | | | 89,855 | | | 151,423 | |
| Payable for investments purchased | | | (1,955,060 | ) | | 1,345,900 | | | 19,356 | |
| Accrued management fees | | | 30,942 | | | 31,514 | | | 45,953 | |
| Accrued other expenses | | | 19,279 | | | (526 | ) | | (11,311 | ) |
| Net realized (gain) loss from: | | | | | | | | | | |
| Investments | | | 4,191,786 | | | 1,141,813 | | | 5,120,796 | |
| Forward swaps | | | — | | | — | | | — | |
| Change in net unrealized (appreciation) depreciation of: | | | | | | | | | | |
| Investments | | | (55,341,444 | ) | | (31,781,569 | ) | | (50,296,977 | ) |
| Forward swaps | | | — | | | — | | | — | |
| Taxes paid on undistributed capital gains | | | (742 | ) | | (1,782 | ) | | (1,609 | ) |
| Net cash provided by (used in) operating activities | | | 25,059,981 | | | 15,988,822 | | | 23,399,465 | |
| Cash Flows from Financing Activities: | | | | | | | | | | |
| (Increase) Decrease in deferred offering costs | | | (635,430 | ) | | (392,849 | ) | | (859,977 | ) |
| Increase (Decrease) in: | | | | | | | | | | |
| Cash overdraft balance | | | (2,056,012 | ) | | — | | | — | |
| Payable for offering costs | | | 38,004 | | | (32,967 | ) | | 111,504 | |
| MTP Shares, at liquidation value | | | — | | | 42,846,300 | | | 73,294,500 | |
| VRDP Shares, at liquidation value | | | 136,200,000 | | | — | | | — | |
| ARPS, at liquidation value | | | (135,525,000 | ) | | (39,950,000 | ) | | (69,500,000 | ) |
| Cash distributions paid to Common shareholders | | | (21,341,423 | ) | | (14,154,605 | ) | | (21,546,243 | ) |
| Net cash provided by (used in) financing activities | | | (23,319,861 | ) | | (11,684,121 | ) | | (18,500,216 | ) |
| Net Increase (Decrease) in Cash | | | 1,740,120 | | | 4,304,701 | | | 4,899,249 | |
| Cash at the beginning of period | | | — | | | 382,339 | | | 920,769 | |
| Cash at the End of Period | | $ | 1,740,120 | | $ | 4,687,040 | | $ | 5,820,018 | |
Supplemental Disclosure of Cash Flow Information
Non-cash financing activities not included herein consist of reinvestments of Common share distributions as follows:
| | | California Dividend | | California Dividend | | California Dividend | |
| | | Advantage | | Advantage 2 | | Advantage 3 | |
| | | | (NAC | ) | | (NVX | ) | | (NZH | ) |
| | | $ | 42,394 | | $ | — | | $ | 151,583 | |
Cash paid for interest (excluding amortization of offering costs) was as follows:
| | | California Dividend | | California Dividend | | California Dividend | |
| | | Advantage | | Advantage 2 | | Advantage 3 | |
| | | | (NAC | ) | | (NVX | ) | | (NZH | ) |
| | | $ | 432,152 | | $ | 2,053,192 | | $ | 3,755,590 | |
See accompanying notes to financial statements.
| | | | Insured California | | | Insured California | |
| | | | Dividend Advantage | | | Tax-Free Advantage | |
| | | | (NKL | ) | | (NKX | ) |
| Cash Flows from Operating Activities: | | | | | | | |
| Net Increase (Decrease) In Net Assets Applicable to Common Shares from Operations | | $ | 50,291,641 | | $ | 16,089,503 | |
| Adjustments to reconcile the net increase (decrease) in net assets applicable to Common shares from operations to net cash provided by (used in) operating activities: | | | | | | | |
| Purchases of investments | | | (43,559,316 | ) | | (7,965,183 | ) |
| Proceeds from sales and maturities of investments | | | 46,057,683 | | | 7,893,115 | |
| Proceeds from (Payments for) forward swap contracts, net | | | — | | | — | |
| Amortization (Accretion) of premiums and discounts, net | | | (2,565,685 | ) | | (483,911 | ) |
| (Increase) Decrease in: | | | | | | | |
| Receivable for interest | | | 205,983 | | | 17,920 | |
| Receivable for investments sold | | | (1,792,434 | ) | | — | |
| Other assets | | | (56,175 | ) | | (582 | ) |
| Increase (Decrease) in: | | | | | | | |
| Payable for Auction Rate Preferred Share dividends | | | (4,345 | ) | | — | |
| Payable for interest | | | — | | | — | |
| Payable for investments purchased | | | — | | | — | |
| Accrued management fees | | | 32,161 | | | 7,656 | |
| Accrued other expenses | | | 23,851 | | | 143,037 | |
| Net realized (gain) loss from: | | | | | | | |
| Investments | | | (1,662,629 | ) | | (29,958 | ) |
| Forward swaps | | | — | | | — | |
| Change in net unrealized (appreciation) depreciation of: | | | | | | | |
| Investments | | | (33,515,295 | ) | | (11,150,968 | ) |
| Forward swaps | | | — | | | — | |
| Taxes paid on undistributed capital gains | | | (575 | ) | | (4,340 | ) |
| Net cash provided by (used in) operating activities | | | 13,454,865 | | | 4,516,289 | |
| Cash Flows from Financing Activities: | | | | | | | |
| (Increase) Decrease in deferred offering costs | | | (567,000 | ) | | 16,944 | |
| Increase (Decrease) in: | | | | | | | |
| Cash overdraft balance | | | — | | | — | |
| Payable for offering costs | | | 33,247 | | | (71,729 | ) |
| MTP Shares, at liquidation value | | | — | | | — | |
| VRDP Shares, at liquidation value | | | 104,400,000 | | | — | |
| ARPS, at liquidation value | | | (103,750,000 | ) | | — | |
| Cash distributions paid to Common shareholders | | | (14,644,799 | ) | | (4,830,297 | ) |
| Net cash provided by (used in) financing activities | | | (14,528,552 | ) | | (4,885,082 | ) |
| Net Increase (Decrease) in Cash | | | (1,073,687 | ) | | (368,793 | ) |
| Cash at the beginning of period | | | 1,572,377 | | | 737,024 | |
| Cash at the End of Period | | $ | 498,690 | | $ | 368,231 | |
Supplemental Disclosure of Cash Flow Information
Non-cash financing activities not included herein consist of reinvestments of Common share distributions as follows:
| | | | | | | | |
| | | Insured California | | Insured California | |
| | | Dividend Advantage | | Tax-Free Advantage | |
| | | | (NKL | ) | | (NKX | ) |
| | | $ | 145,163 | | $ | 23,555 | |
Cash paid for interest (excluding amortization of offering costs) was as follows:
| | | Insured California | | Insured California | |
| | | Dividend Advantage | | Tax-Free Advantage | |
| | | | (NKL | ) | | (NKX | ) |
| | | $ | 244,870 | | $ | 123,235 | |
See accompanying notes to financial statements.
| | | Financial |
| | | Highlights |
| | | |
| | Selected data for a Common share outstanding throughout each period: |
| | | | | Investment Operations | | Less Distributions | | | | | | | |
| | | Beginning Common Share Net Asset Value | | Net Investment Income (Loss) | | Net Realized/ Unrealized Gain (Loss) | | Distributions from Net Investment Income to Auction Rate Preferred Shareholders | (a) | Distributions from Capital Gains to Auction Rate Preferred Shareholders | (a) | Total | | Net Investment Income to Common Share- holders | | Capital Gains to Common Share- holders | | Total | | Discount from Common Shares Repurchased and Retired | | Ending Common Share Net Asset Value | | Ending Market Value | |
| Insured California Premium Income (NPC) | | | | | | | | | | | | | | | | | |
| Year Ended 2/28-2/29: | | | | | | | | | | | | | | | | | | | | | | | | | | | | |
| 2012 | | $ | 13.63 | | $ | .83 | | $ | 2.41 | | $ | — | | $ | — | | $ | 3.24 | | $ | (.88 | ) | $ | (.10 | ) | $ | (.98 | ) | $ | — | | $ | 15.89 | | $ | 16.06 | |
| 2011 | | | 14.74 | | | .88 | | | (1.10 | ) | | — | ** | | — | | | (.22 | ) | | (.86 | ) | | (.03 | ) | | (.89 | ) | | — | | | 13.63 | | | 13.26 | |
| 2010 | | | 14.03 | | | .96 | | | .55 | | | (.03 | ) | | (.02 | ) | | 1.46 | | | (.75 | ) | | — | | | (.75 | ) | | — | ** | | 14.74 | | | 13.30 | |
| 2009(f) | | | 14.93 | | | .47 | | | (.74 | ) | | (.11 | ) | | (.02 | ) | | (.40 | ) | | (.36 | ) | | (.14 | ) | | (.50 | ) | | — | ** | | 14.03 | | | 12.04 | |
| Year Ended 8/31: | | | | | | | | | | | | | | | | | | | | | | | | | | | | | | | | | | |
| 2008 | | | 15.04 | | | .95 | | | (.10 | ) | | (.22 | ) | | — | ** | | .63 | | | (.73 | ) | | (.01 | ) | | (.74 | ) | | — | | | 14.93 | | | 13.89 | |
| 2007 | | | 15.58 | | | .90 | | | (.40 | ) | | (.21 | ) | | (.02 | ) | | .27 | | | (.73 | ) | | (.08 | ) | | (.81 | ) | | — | | | 15.04 | | | 14.96 | |
| | | | | | | | | | | | | | | | | | | | | | | | | | | | | | | | | | | | | | |
| Insured California Premium Income 2 (NCL) | | | | | | | | | | | | | | | | | | | | | | | | | | | |
| Year Ended 2/28-2/29: | | | | | | | | | | | | | | | | | | | | | | | | | | | | | | | |
| 2012 | | | 13.06 | | | .86 | | | 2.35 | | | — | | | — | | | 3.21 | | | (.90 | ) | | — | | | (.90 | ) | | — | | | 15.37 | | | 15.76 | |
| 2011 | | | 13.99 | | | .91 | | | (.96 | ) | | (.02 | ) | | — | | | (.07 | ) | | (.86 | ) | | — | | | (.86 | ) | | — | ** | | 13.06 | | | 12.45 | |
| 2010 | | | 12.85 | | | .98 | | | .99 | | | (.03 | ) | | (.02 | ) | | 1.92 | | | (.78 | ) | | — | | | (.78 | ) | | — | ** | | 13.99 | | | 12.72 | |
| 2009(f) | | | 14.13 | | | .44 | | | (1.12 | ) | | (.10 | ) | | (.02 | ) | | (.80 | ) | | (.34 | ) | | (.14 | ) | | (.48 | ) | | — | ** | | 12.85 | | | 10.89 | |
| Year Ended 8/31: | | | | | | | | | | | | | | | | | | | | | | | | | | | | | | | | | | |
| 2008 | | | 14.50 | | | .95 | | | (.44 | ) | | (.24 | ) | | — | | | .27 | | | (.64 | ) | | — | | | (.64 | ) | | — | | | 14.13 | | | 12.66 | |
| 2007 | | | 14.99 | | | .89 | | | (.46 | ) | | (.25 | ) | | — | | | .18 | | | (.67 | ) | | — | | | (.67 | ) | | — | | | 14.50 | | | 13.71 | |
| (a) | The amounts shown are based on Common share equivalents. |
| (b) | Total Return Based on Market Value is the combination of changes in the market price per share and the effect of reinvested dividend income and reinvested capital gains distributions, if any, at the average price paid per share at the time of reinvestment. The last dividend declared in the period, which is typically paid on the first business day of the following month, is assumed to be reinvested at the ending market price. The actual reinvestment for the last dividend declared in the period may take place over several days, and in some instances may not be based on the market price, so the actual reinvestment price may be different from the price used in the calculation. Total returns are not annualized. |
| | Total Return Based on Common Share Net Asset Value is the combination of changes in Common share net asset value, reinvested dividend income at net asset value and reinvested capital gains distributions at net asset value, if any. The last dividend declared in the period, which is typically paid on the first business day of the following month, is assumed to be reinvested at the ending net asset value. The actual reinvest price for the last dividend declared in the period may often be based on the Fund’s market price (and not its net asset value), and therefore may be different from the price used in the calculation. Total returns are not annualized. |
| | | | Ratios/Supplemental Data | |
| | Total Returns | | | | Ratios to Average Net Assets Applicable to Common Shares(c)(d) | | | |
| | | | | | | | | | | | | |
| | Based on Market Value | (b) | Based on Common Share Net Asset Value | (b) | Ending Net Assets Applicable to Common Shares (000 | ) | Expenses | (e) | Net Investment Income (Loss | ) | Portfolio Turnover Rate | |
| | | | | | | | | | | | | | | | | | |
| | | | | | | | | | | | | | | | | | |
| | 29.53 | % | | 24.47 | % | $ | 102,481 | | | 2.13 | % | | 5.65 | % | | 10 | % |
| | 6.29 | | | (1.75 | ) | | 87,827 | | | 1.77 | | | 6.03 | | | 6 | |
| | 17.13 | | | 10.66 | | | 94,944 | | | 1.19 | | | 6.68 | | | 10 | |
| | (9.25 | ) | | (2.43 | ) | | 90,531 | | | 1.27 | * | | 6.88 | * | | 1 | |
| | | | | | | | | | | | | | | | | | |
| | (2.21 | ) | | 4.23 | | | 96,462 | | | 1.19 | | | 6.24 | | | 17 | |
| | 4.61 | | | 1.70 | | | 97,176 | | | 1.22 | | | 5.84 | | | 9 | |
| | | | | | | | | | | | | | | | | | |
| | | | | | | | | | | | | | | | | | |
| | 35.03 | | | 25.33 | | | 194,712 | | | 1.78 | | | 6.10 | | | 5 | |
| | 4.38 | | | (.72 | ) | | 165,359 | | | 1.29 | | | 6.53 | | | 26 | |
| | 24.41 | | | 15.35 | | | 177,169 | | | 1.27 | | | 7.25 | | | 7 | |
| | (9.95 | ) | | (5.40 | ) | | 162,831 | | | 1.53 | * | | 7.15 | * | | 9 | |
| | | | | | | | | | | | | | | | | | |
| | (3.06 | ) | | 1.86 | | | 179,734 | | | 1.23 | | | 6.56 | | | 12 | |
| | 1.26 | | | 1.18 | | | 184,343 | | | 1.24 | | | 6.00 | | | 19 | |
| (c) | Ratios do not reflect the effect of dividend payments to Auction Rate Preferred shareholders, where applicable; Net Investment Income (Loss) ratios reflect income earned and expenses incurred on assets attributable to ARPS and/or VRDP Shares, where applicable. |
| (d) | Ratios do not reflect the effect of custodian fee credits earned on the Fund’s net cash on deposit with the custodian bank, where applicable. |
| (e) | The expense ratios reflect, among other things, all interest expense and other costs related to VRDP Shares and/or the interest expense deemed to have been paid by the Fund on the floating rate certificates issued by the special purpose trusts for the self-deposited inverse floaters held by the Fund, where applicable, both as described in Footnote 1 – General Information and Significant Accounting Policies, Variable Rate Demand Preferred Shares and Inverse Floating Rate Securities, respectively, as follows: |
| Insured California Premium Income (NPC) | | | | |
| Year Ended 2/28-2/29: | | | | |
| 2012 | | | .68 | % |
| 2011 | | | .60 | |
| 2010 | | | — | |
| 2009(f) | | | — | * |
| Year Ended 8/31: | | | | |
| 2008 | | | — | |
| 2007 | | | .06 | |
| | | | | |
| Insured California Premium Income 2 (NCL) | | | | |
| Year Ended 2/28-2/29: | | | | |
| 2012 | | | .57 | |
| 2011 | | | .17 | |
| 2010 | | | .09 | |
| 2009(f) | | | .29 | * |
| Year Ended 8/31: | | | | |
| 2008 | | | .02 | |
| 2007 | | | .06 | |
| (f) | For the six months ended February 28, 2009. |
| * | Annualized. |
| ** | Rounds to less than $.01 per share. |
| See accompanying notes to financial statements. |
| | | |
| Nuveen Investments | | 87 |
| | | Financial |
| | | Highlights (continued) |
| | | |
| | Selected data for a Common share outstanding throughout each period: |
| | | | | | Investment Operations | | Less Distributions | | | | | | | | | | |
| | | Beginning Common Share Net Asset Value | | Net Investment Income (Loss) | | Net Realized/ Unrealized Gain (Loss) | | Distributions from Net Investment Income to Auction Rate Preferred Shareholders | (a) | Distributions from Capital Gains to Auction Rate Preferred Shareholders | (a) | Total | | Net Investment Income to Common Share- holders | | Capital Gains to Common Share- holders | | Total | | Discount from Common Shares Repurchased and Retired | | Ending Common Share Net Asset Value | | Ending Market Value | |
| California Premium Income (NCU) | | | | | | | | | | | | | | | | | | | | | | | | | |
| Year Ended 2/28-2/29: | | | | | | | | | | | | | | | | | | | | | | | | | | | | |
| 2012 | | $ | 12.96 | | $ | .84 | | $ | 2.38 | | $ | — | | $ | — | | $ | 3.22 | | $ | (.87 | ) | $ | — | | $ | (.87 | ) | $ | — | | $ | 15.31 | | $ | 15.15 | |
| 2011 | | | 13.71 | | | .92 | | | (.79 | ) | | (.02 | ) | | — | | | .11 | | | (.86 | ) | | — | | | (.86 | ) | | — | ** | | 12.96 | | | 12.28 | |
| 2010 | | | 12.37 | | | .95 | | | 1.13 | | | (.03 | ) | | — | | | 2.05 | | | (.72 | ) | | — | | | (.72 | ) | | .01 | | | 13.71 | | | 12.11 | |
| 2009(f) | | | 13.67 | | | .43 | | | (1.29 | ) | | (.10 | ) | | — | ** | | (.96 | ) | | (.33 | ) | | (.01 | ) | | (.34 | ) | | — | ** | | 12.37 | | | 10.06 | |
| Year Ended 8/31: | | | | | | | | | | | | | | | | | | | | | | | | | | | | | | | | | |
| 2008 | | | 14.06 | | | .92 | | | (.43 | ) | | (.24 | ) | | — | | | .25 | | | (.64 | ) | | — | | | (.64 | ) | | — | | | 13.67 | | | 12.58 | |
| 2007 | | | 14.63 | | | .90 | | | (.52 | ) | | (.24 | ) | | (.01 | ) | | .13 | | | (.67 | ) | | (.03 | ) | | (.70 | ) | | — | | | 14.06 | | | 13.03 | |
| | | | | | | | | | | | | | | | | | | | | | | | | | | | | | | | | | | | | | |
| California Dividend Advantage (NAC) | | | | | | | | | | | | | | | | | | | | | | | | | |
| Year Ended 2/28-2/29: | | | | | | | | | | | | | | | | | | | | | | | | | | | | |
| 2012 | | | 12.68 | | | .94 | | | 2.17 | | | (.01 | ) | | — | | | 3.10 | | | (.91 | ) | | — | | | (.91 | ) | | — | | | 14.87 | | | 15.14 | |
| 2011 | | | 13.88 | | | .98 | | | (1.27 | ) | | (.02 | ) | | — | | | (.31 | ) | | (.89 | ) | | — | | | (.89 | ) | | — | | | 12.68 | | | 12.20 | |
| 2010 | | | 12.10 | | | 1.01 | | | 1.63 | | | (.03 | ) | | (.02 | ) | | 2.59 | | | (.81 | ) | | — | | | (.81 | ) | | — | | | 13.88 | | | 12.60 | |
| 2009(f) | | | 14.43 | | | .49 | | | (2.07 | ) | | (.09 | ) | | (.02 | ) | | (1.69 | ) | | (.38 | ) | | (.26 | ) | | (.64 | ) | | — | | | 12.10 | | | 10.82 | |
| Year Ended 8/31: | | | | | | | | | | | | | | | | | | | | | | | | | | | | | | | | | |
| 2008 | | | 14.93 | | | 1.02 | | | (.50 | ) | | (.23 | ) | | (.01 | ) | | .28 | | | (.74 | ) | | (.04 | ) | | (.78 | ) | | — | | | 14.43 | | | 13.44 | |
| 2007 | | | 15.59 | | | 1.00 | | | (.56 | ) | | (.24 | ) | | (.01 | ) | | .19 | | | (.80 | ) | | (.05 | ) | | (.85 | ) | | — | | | 14.93 | | | 14.34 | |
| (a) | The amounts shown are based on Common share equivalents. |
| (b) | Total Return Based on Market Value is the combination of changes in the market price per share and the effect of reinvested dividend income and reinvested capital gains distributions, if any, at the average price paid per share at the time of reinvestment. The last dividend declared in the period, which is typically paid on the first business day of the following month, is assumed to be reinvested at the ending market price. The actual reinvestment for the last dividend declared in the period may take place over several days, and in some instances may not be based on the market price, so the actual reinvestment price may be different from the price used in the calculation. Total returns are not annualized. |
| | Total Return Based on Common Share Net Asset Value is the combination of changes in Common share net asset value, reinvested dividend income at net asset value and reinvested capital gains distributions at net asset value, if any. The last dividend declared in the period, which is typically paid on the first business day of the following month, is assumed to be reinvested at the ending net asset value. The actual reinvest price for the last dividend declared in the period may often be based on the Fund’s market price (and not its net asset value), and therefore may be different from the price used in the calculation. Total returns are not annualized. |
| | | | | | Ratios/Supplemental Data | |
| | Total Returns | | | | Ratios to Average Net Assets Applicable to Common Shares Before Reimbursement(c) | | Ratios to Average Net Assets Applicable to Common Shares After Reimbursement(c)(d) | | | |
| | | | | | | | | | | | | | | | | |
| | Based on Market Value | (b) | Based on Common Share Net Asset Value | (b) | Ending Net Assets Applicable to Common Shares (000 | ) | Expenses | (e) | Net Investment Income (Loss | ) | Expenses | (e) | Net Investment Income (Loss | ) | Portfolio Turnover Rate | |
| | | | | | | | | | | | | | | | | | | | | | | | |
| | | | | | | | | | | | | | | | | | | | | | | | |
| | 31.68 | % | | 25.65 | % | $ | 87,755 | | | 2.29 | % | | 6.02 | % | | N/A | | | N/A | | | 14 | % |
| | 8.34 | | | .63 | | | 74,275 | | | 1.69 | | | 6.66 | | | N/A | | | N/A | | | 5 | |
| | 28.13 | | | 17.06 | | | 78,581 | | | 1.30 | | | 7.18 | | | N/A | | | N/A | | | 10 | |
| | (17.22 | ) | | (6.92 | ) | | 71,260 | | | 1.57 | * | | 7.06 | * | | N/A | | | N/A | | | 14 | |
| | | | | | | | | | | | | | | | | | | | | | | | |
| | 1.51 | | | 1.81 | | | 78,966 | | | 1.34 | | | 6.56 | | | N/A | | | N/A | | | 5 | |
| | (2.21 | ) | | .82 | | | 81,200 | | | 1.29 | | | 6.14 | | | N/A | | | N/A | | | 11 | |
| | | | | | | | | | | | | | | | | | | | | | | | |
| | | | | | | | | | | | | | | | | | | | | | | | |
| | 32.82 | | | 25.30 | | | 349,203 | | | 1.50 | | | 6.84 | | | N/A | | | N/A | | | 13 | |
| | 3.54 | | | (2.57 | ) | | 297,629 | | | 1.18 | | | 7.18 | | | N/A | | | N/A | | | 20 | |
| | 24.62 | | | 21.97 | | | 325,791 | | | 1.21 | | | 7.63 | | | 1.18 | % | | 7.66 | % | | 4 | |
| | (14.14 | ) | | (11.45 | ) | | 284,221 | | | 1.31 | * | | 7.92 | * | | 1.24 | * | | 7.99 | * | | 14 | |
| | | | | | | | | | | | | | | | | | | | | | | | |
| | (.84 | ) | | 1.85 | | | 338,732 | | | 1.26 | | | 6.77 | | | 1.11 | | | 6.92 | | | 19 | |
| | (5.19 | ) | | 1.16 | | | 350,523 | | | 1.17 | | | 6.24 | | | .95 | | | 6.46 | | | 20 | |
| (c) | Ratios do not reflect the effect of dividend payments to Auction Rate Preferred shareholders, where applicable; Net Investment Income (Loss) ratios reflect income earned and expenses incurred on assets attributable to ARPS, MTP Shares and/or VRDP Shares, where applicable. |
| (d) | After expense reimbursement from the Adviser, where applicable. Ratios do not reflect the effect of custodian fee credits earned on the Fund’s net cash on deposit with the custodian bank, where applicable. As of July 31, 2009, the Adviser is no longer reimbursing California Dividend Advantage (NAC) for any fees or expenses. |
| (e) | The expense ratios reflect, among other things, all interest expense and other costs related to MTP Shares, VRDP Shares and/or the interest expense deemed to have been paid by the Fund on the floating rate certificates issued by the special purpose trusts for the self-deposited inverse floaters held by the Fund, where applicable, each as described in Footnote 1 – General Information and Significant Accounting Policies, MuniFund Term Preferred Shares, Variable Rate Demand Preferred Shares and Inverse Floating Rate Securities, respectively, as follows: |
| California Premium Income (NCU) | | | | |
| Year Ended 2/28-2/29: | | | | |
| 2012 | | | 1.14 | % |
| 2011 | | | .55 | |
| 2010 | | | .06 | |
| 2009(f) | | | .20 | * |
| Year Ended 8/31: | | | | |
| 2008 | | | .11 | |
| 2007 | | | .08 | |
| | | | | |
| California Dividend Advantage (NAC) | | | | |
| Year Ended 2/28-2/29: | | | | |
| 2012 | | | .46 | |
| 2011 | | | .06 | |
| 2010 | | | .08 | |
| 2009(f) | | | .14 | * |
| Year Ended 8/31: | | | | |
| 2008 | | | .11 | |
| 2007 | | | .05 | |
| (f) | For the six months ended February 28, 2009. |
| * | Annualized. |
| ** | Rounds to less than $.01 per share. |
| N/A | Fund did not have, or no longer has, a contractual reimbursement agreement with the Adviser. |
| See accompanying notes to financial statements. |
| | | |
| Nuveen Investments | | 89 |
| | | Financial |
| | | Highlights (continued) |
| | | |
| | Selected data for a Common share outstanding throughout each period: |
| | | | | Investment Operations | | Less Distributions | | | | | | | |
| | | Beginning Common Share Net Asset Value | | Net Investment Income (Loss | ) | Net Realized/ Unrealized Gain (Loss | ) | Distributions from Net Investment Income to Auction Rate Preferred Shareholders | (a) | Distributions from Capital Gains to Auction Rate Preferred Shareholders | (a) | Total | | Net Investment Income to Common Share- holders | | Capital Gains to Common Share- holders | | Total | | Discount from Common Shares Repurchased and Retired | | Ending Common Share Net Asset Value | | Ending Market Value | |
| California Dividend Advantage 2 (NVX) | | | | | | | | | | | | | | | | | | | | | | | | | |
| Year Ended 2/28-2/29: | | | | | | | | | | | | | | | | | | | | | | | | | |
| 2012 | | $ | 13.47 | | $ | .90 | | $ | 2.08 | | $ | — | ** | $ | — | | $ | 2.98 | | $ | (.96 | ) | $ | — | | $ | (.96 | ) | $ | — | | $ | 15.49 | | $ | 15.58 | |
| 2011 | | | 14.49 | | | 1.03 | | | (1.07 | ) | | (.02 | ) | | — | | | (.06 | ) | | (.96 | ) | | — | | | (.96 | ) | | — | | | 13.47 | | | 12.83 | |
| 2010 | | | 12.91 | | | 1.07 | | | 1.43 | | | (.04 | ) | | — | | | 2.46 | | | (.88 | ) | | — | | | (.88 | ) | | — | ** | | 14.49 | | | 13.56 | |
| 2009(f) | | | 14.39 | | | .51 | | | (1.47 | ) | | (.11 | ) | | (.01 | ) | | (1.08 | ) | | (.36 | ) | | (.04 | ) | | (.40 | ) | | — | ** | | 12.91 | | | 10.51 | |
| Year Ended 8/31: | | | | | | | | | | | | | | | | | | | | | | | | | | | | | | | | | | |
| 2008 | | | 14.69 | | | 1.01 | | | (.37 | ) | | (.25 | ) | | — | | | .39 | | | (.69 | ) | | — | | | (.69 | ) | | — | | | 14.39 | | | 12.67 | |
| 2007 | | | 15.36 | | | .96 | | | (.62 | ) | | (.25 | ) | | — | | | .09 | | | (.76 | ) | | — | | | (.76 | ) | | — | | | 14.69 | | | 13.73 | |
| | | | | | | | | | | | | | | | | | | | | | | | | | | | | | | | | | | | | | |
| California Dividend Advantage 3 (NZH) | | | | | | | | | | | | | | | | | | | | | | | | | |
| Year Ended 2/28-2/29: | | | | | | | | | | | | | | | | | | | | | | | | | |
| 2012 | | | 12.13 | | | .82 | | | 1.86 | | | — | ** | | — | | | 2.68 | | | (.90 | ) | | — | | | (.90 | ) | | — | | | 13.91 | | | 14.35 | |
| 2011 | | | 13.18 | | | .88 | | | (1.02 | ) | | (.01 | ) | | — | | | (.15 | ) | | (.90 | ) | | — | | | (.90 | ) | | — | | | 12.13 | | | 11.67 | |
| 2010 | | | 11.53 | | | .98 | | | 1.53 | | | (.03 | ) | | — | | | 2.48 | | | (.83 | ) | | — | | | (.83 | ) | | — | | | 13.18 | | | 12.67 | |
| 2009(f) | | | 13.62 | | | .50 | | | (2.13 | ) | | (.09 | ) | | — | | | (1.72 | ) | | (.37 | ) | | — | | | (.37 | ) | | — | ** | | 11.53 | | | 10.23 | |
| Year Ended 8/31: | | | | | | | | | | | | | | | | | | | | | | | | | | | | | | | | | | |
| 2008 | | | 14.25 | | | 1.03 | | | (.70 | ) | | (.25 | ) | | — | | | .08 | | | (.71 | ) | | — | | | (.71 | ) | | — | | | 13.62 | | | 12.87 | |
| 2007 | | | 15.03 | | | .98 | | | (.73 | ) | | (.27 | ) | | — | | | (.02 | ) | | (.76 | ) | | — | | | (.76 | ) | | — | | | 14.25 | | | 13.52 | |
| (a) | The amounts shown are based on Common share equivalents. |
| (b) | Total Return Based on Market Value is the combination of changes in the market price per share and the effect of reinvested dividend income and reinvested capital gains distributions, if any, at the average price paid per share at the time of reinvestment. The last dividend declared in the period, which is typically paid on the first business day of the following month, is assumed to be reinvested at the ending market price. The actual reinvestment for the last dividend declared in the period may take place over several days, and in some instances may not be based on the market price, so the actual reinvestment price may be different from the price used in the calculation. Total returns are not annualized. |
| | Total Return Based on Common Share Net Asset Value is the combination of changes in Common share net asset value, reinvested dividend income at net asset value and reinvested capital gains distributions at net asset value, if any. The last dividend declared in the period, which is typically paid on the first business day of the following month, is assumed to be reinvested at the ending net asset value. The actual reinvest price for the last dividend declared in the period may often be based on the Fund’s market price (and not its net asset value), and therefore may be different from the price used in the calculation. Total returns are not annualized. |
| | | | | | Ratios/Supplemental Data | |
| | Total Returns | | | | Ratios to Average Net Assets Applicable to Common Shares Before Reimbursement(c) | | Ratios to Average Net Assets Applicable to Common Shares After Reimbursement(c)(d) | | | |
| | | | | | | | | | | | | | | | | |
| | Based on Market Value | (b) | Based on Common Share Net Asset Value | (b) | Ending Net Assets Applicable to Common Shares (000 | ) | Expenses | (e) | Net Investment Income (Loss | ) | Expenses | (e) | Net Investment Income (Loss | ) | Portfolio Turnover Rate | |
| | | | | | | | | | | | | | | | | |
| | | | | | | | | | | | | | | | | | | | | | | | |
| | 30.01 | % | | 22.90 | % | $ | 228,474 | | | 2.30 | % | | 6.29 | % | | 2.30 | % | | 6.30 | % | | 12 | % |
| | 1.37 | | | (.64 | ) | | 198,675 | | | 1.36 | | | 7.10 | | | 1.28 | | | 7.19 | | | 13 | |
| | 38.29 | | | 19.52 | | | 213,687 | | | 1.20 | | | 7.58 | | | 1.04 | | | 7.74 | | | 4 | |
| | (13.83 | ) | | (7.40 | ) | | 190,824 | | | 1.37 | * | | 7.85 | * | | 1.14 | * | | 8.08 | * | | 7 | |
| | | | | | | | | | | | | | | | | | | | | | | | |
| | (2.80 | ) | | 2.76 | | | 212,890 | | | 1.25 | | | 6.56 | | | .99 | | | 6.83 | | | 20 | |
| | (3.39 | ) | | .46 | | | 217,332 | | | 1.25 | | | 5.97 | | | .91 | | | 6.31 | | | 21 | |
| | | | | | | | | | | | | | | | | | | | | | | | |
| | | | | | | | | | | | | | | | | | | | | | | | |
| | 31.93 | | | 22.89 | | | 335,830 | | | 2.56 | | | 6.28 | | | 2.52 | | | 6.33 | | | 18 | |
| | (1.21 | ) | | (1.40 | ) | | 292,563 | | | 2.07 | | | 6.61 | | | 1.94 | | | 6.74 | | | 16 | |
| | 32.93 | | | 22.17 | | | 317,860 | | | 1.36 | | | 7.68 | | | 1.16 | | | 7.88 | | | 6 | |
| | (17.58 | ) | | (12.54 | ) | | 278,056 | | | 1.39 | * | | 8.50 | * | | 1.13 | * | | 8.75 | * | | 9 | |
| | | | | | | | | | | | | | | | | | | | | | | | |
| | .46 | | | .60 | | | 328,659 | | | 1.21 | | | 6.96 | | | .90 | | | 7.27 | | | 23 | |
| | (4.12 | ) | | (.32 | ) | | 343,806 | | | 1.22 | | | 6.16 | | | .83 | | | 6.54 | | | 23 | |
| (c) | Ratios do not reflect the effect of dividend payments to Auction Rate Preferred shareholders, where applicable; Net Investment Income (Loss) ratios reflect income earned and expenses incurred on assets attributable to ARPS and/or MTP Shares, where applicable. |
| (d) | After expense reimbursement from the Adviser, where applicable. Ratios do not reflect the effect of custodian fee credits earned on the Fund’s net cash on deposit with the custodian bank, where applicable. As of March 31, 2011 and September 30, 2011, the Adviser is no longer reimbursing California Dividend Advantage 2 (NVX) and California Dividend Advantage 3 (NZH), respectively, for any fees or expenses. |
| (e) | The expense ratios reflect, among other things, all interest expense and other costs related to MTP Shares and/or the interest expense deemed to have been paid by the Fund on the floating rate certificates issued by the special purpose trusts for the self-deposited inverse floaters held by the Fund, where applicable, both as described in Footnote 1 – General Information and Significant Accounting Polices, MuniFund Term Preferred Shares and Inverse Floating Rate Securities, respectively, as follows: |
| California Dividend Advantage 2 (NVX) | | | | |
| Year Ended 2/28-2/29: | | | | |
| 2012 | | | 1.25 | % |
| 2011 | | | .26 | |
| 2010 | | | .04 | |
| 2009(f) | | | .05 | * |
| Year Ended 8/31: | | | | |
| 2008 | | | .09 | |
| 2007 | | | .08 | |
| | | | | |
| California Dividend Advantage 3 (NZH) | | | | |
| Year Ended 2/28-2/29: | | | | |
| 2012 | | | 1.49 | |
| 2011 | | | .94 | |
| 2010 | | | .19 | |
| 2009(f) | | | .12 | * |
| Year Ended 8/31: | | | | |
| 2008 | | | .02 | |
| 2007 | | | .06 | |
| (f) | For the six months ended February 28, 2009. |
| * | Annualized. |
| ** | Rounds to less than $.01 per share. |
| See accompanying notes to financial statements. |
| | | |
| Nuveen Investments | | 91 |
| | | Financial |
| | | Highlights (continued) |
| | | |
| | Selected data for a Common share outstanding throughout each period: |
| | | | | Investment Operations | | Less Distributions | | | | | | | |
| | | Beginning Common Share Net Asset Value | | Net Investment Income (Loss | ) | Net Realized/ Unrealized Gain (Loss | ) | Distributions from Net Investment Income to Auction Rate Preferred Shareholders | (a) | Distributions from Capital Gains to Auction Rate Preferred Shareholders | (a) | Total | | Net Investment Income to Common Share- holders | | Capital Gains to Common Share- holders | | Total | | Discount from Common Shares Repurchased and Retired | | Ending Common Share Net Asset Value | | Ending Market Value | |
| Insured California Dividend Advantage (NKL) | | | | | | | | | | | | | | | | | | | | | | |
| Year Ended 2/28-2/29: | | | | | | | | | | | | | | | | | | | | | | | | | | | | |
| 2012 | | $ | 13.70 | | $ | 1.00 | | $ | 2.30 | | $ | (.01 | ) | $ | — | | $ | 3.29 | | $ | (.97 | ) | $ | — | | $ | (.97 | ) | $ | — | | $ | 16.02 | | $ | 16.42 | |
| 2011 | | | 14.71 | | | 1.04 | | | (1.09 | ) | | (.03 | ) | | — | | | (.08 | ) | | (.93 | ) | | — | | | (.93 | ) | | — | | | 13.70 | | | 13.02 | |
| 2010 | | | 13.52 | | | 1.06 | | | 1.01 | | | (.04 | ) | | — | | | 2.03 | | | (.84 | ) | | — | | | (.84 | ) | | — | ** | | 14.71 | | | 13.66 | |
| 2009(f) | | | 14.61 | | | .50 | | | (1.07 | ) | | (.10 | ) | | (.01 | ) | | (.68 | ) | | (.37 | ) | | (.04 | ) | | (.41 | ) | | — | ** | | 13.52 | | | 11.16 | |
| Year Ended 8/31: | | | | | | | | | | | | | | | | | | | | | | | | | | | | | | | |
| 2008 | | | 14.91 | | | 1.03 | | | (.33 | ) | | (.25 | ) | | (.01 | ) | | .44 | | | (.72 | ) | | (.02 | ) | | (.74 | ) | | — | | | 14.61 | | | 13.50 | |
| 2007 | | | 15.50 | | | 1.01 | | | (.57 | ) | | (.26 | ) | | — | ** | | .18 | | | (.77 | ) | | — | ** | | (.77 | ) | | — | | | 14.91 | | | 14.24 | |
| | | | | | | | | | | | | | | | | | | | | | | | | | | | | | | | | | | | | | |
| Insured California Tax-Free Advantage (NKX) | | | | | | | | | | | | | | | | | | | | | | | | |
| Year Ended 2/28-2/29: | | | | | | | | | | | | | | | | | | | | | | | | | |
| 2012 | | | 12.82 | | | .83 | | | 1.91 | | | — | | | — | | | 2.74 | | | (.83 | ) | | — | | | (.83 | ) | | — | | | 14.73 | | | 15.06 | |
| 2011 | | | 14.03 | | | .81 | | | (1.22 | ) | | — | | | — | | | (.41 | ) | | (.80 | ) | | — | | | (.80 | ) | | — | | | 12.82 | | | 11.78 | |
| 2010 | | | 12.85 | | | .85 | | | 1.09 | | | — | | | — | | | 1.94 | | | (.76 | ) | | — | | | (.76 | ) | | — | | | 14.03 | | | 12.87 | |
| 2009(f) | | | 14.19 | | | .39 | | | (1.32 | ) | | — | ** | | (.01 | ) | | (.94 | ) | | (.35 | ) | | (.05 | ) | | (.40 | ) | | — | | | 12.85 | | | 11.75 | |
| Year Ended 8/31: | | | | | | | | | | | | | | | | | | | | | | | | | | | | | | | |
| 2008 | | | 14.47 | | | .97 | | | (.30 | ) | | (.24 | ) | | — | | | .43 | | | (.71 | ) | | — | | | (.71 | ) | | — | | | 14.19 | | | 13.78 | |
| 2007 | | | 14.92 | | | .96 | | | (.46 | ) | | (.24 | ) | | — | | | .26 | | | (.71 | ) | | — | | | (.71 | ) | | — | | | 14.47 | | | 14.47 | |
| (a) | The amounts shown are based on Common share equivalents. |
| (b) | Total Return Based on Market Value is the combination of changes in the market price per share and the effect of reinvested dividend income and reinvested capital gains distributions, if any, at the average price paid per share at the time of reinvestment. The last dividend declared in the period, which is typically paid on the first business day of the following month, is assumed to be reinvested at the ending market price. The actual reinvestment for the last dividend declared in the period may take place over several days, and in some instances may not be based on the market price, so the actual reinvestment price may be different from the price used in the calculation. Total returns are not annualized. |
| | Total Return Based on Common Share Net Asset Value is the combination of changes in Common share net asset value, reinvested dividend income at net asset value and reinvested capital gains distributions at net asset value, if any. The last dividend declared in the period, which is typically paid on the first business day of the following month, is assumed to be reinvested at the ending net asset value. The actual reinvest price for the last dividend declared in the period may often be based on the Fund’s market price (and not its net asset value), and therefore may be different from the price used in the calculation. Total returns are not annualized. |
| | | | | | Ratios/Supplemental Data | |
| | Total Returns | | | | Ratios to Average Net Assets Applicable to Common Shares Before Reimbursement(c) | | Ratios to Average Net Assets Applicable to Common Shares After Reimbursement(c)(d) | | | |
| | | | | | | | | | | | | | | | | |
| | Based on Market Value | | Based on Common Share Net Asset Value | (b) | Ending Net Assets Applicable to Common Shares (000 | ) | Expenses | (e) | Net Investment Income (Loss | ) | Expenses | (e) | Net Investment Income (Loss | ) | Portfolio Turnover Rate | |
| | | | | | | | | | | | | | | | | |
| | | | | | | | | | | | | | | | | | | | | | | | |
| | 34.78 | % | | 24.87 | % | $ | 244,521 | | | 1.52 | % | | 6.70 | % | | 1.44 | % | | 6.78 | % | | 13 | % |
| | 1.81 | | | (.75 | ) | | 208,950 | | | 1.13 | | | 6.94 | | | .97 | | | 7.10 | | | 7 | |
| | 30.55 | | | 15.42 | | | 224,301 | | | 1.19 | | | 7.21 | | | .95 | | | 7.45 | | | 1 | |
| | (14.22 | ) | | (4.50 | ) | | 206,467 | | | 1.32 | * | | 7.36 | * | | 1.01 | * | | 7.67 | * | | 3 | |
| | | | | | | | | | | | | | | | | | | | | | | | |
| | (.03 | ) | | 2.98 | | | 223,356 | | | 1.19 | | | 6.52 | | | .84 | | | 6.87 | | | 6 | |
| | (4.64 | ) | | 1.13 | | | 227,923 | | | 1.21 | | | 6.12 | | | .79 | | | 6.54 | | | 12 | |
| | | | | | | | | | | | | | | | | | | | | | | | |
| | | | | | | | | | | | | | | | | | | | | | | | |
| | 36.10 | | | 21.95 | | | 86,731 | | | 1.90 | | | 6.03 | | | N/A | | | N/A | | | 7 | |
| | (2.71 | ) | | (3.18 | ) | | 75,493 | | | 2.06 | | | 5.74 | | | 1.97 | | | 5.83 | | | 8 | |
| | 16.39 | | | 15.49 | | | 82,579 | | | 1.68 | | | 6.11 | | | 1.47 | | | 6.32 | | | — | *** |
| | (11.55 | ) | | (6.42 | ) | | 75,661 | | | 2.57 | * | | 5.89 | * | | 2.27 | * | | 6.19 | * | | 3 | |
| | | | | | | | | | | | | | | | | | | | | | | | |
| | .12 | | | 2.97 | | | 83,531 | | | 1.33 | | | 6.28 | | | .94 | | | 6.67 | | | 28 | |
| | 6.35 | | | 1.69 | | | 85,144 | | | 1.27 | | | 5.95 | | | .79 | | | 6.43 | | | 15 | |
| (c) | Ratios do not reflect the effect of dividend payments to Auction Rate Preferred shareholders, where applicable; Net Investment Income (Loss) ratios reflect income earned and expenses incurred on assets attributable to ARPS and/or VRDP Shares, where applicable. |
| (d) | After expense reimbursement from the Adviser, where applicable. Ratios do not reflect the effect of custodian fee credits earned on the Fund’s net cash on deposit with the custodian bank, where applicable. As of November 30, 2010, the Adviser is no longer reimbursing Insured California Tax-Free Advantage (NKX) for any fees or expenses. |
| (e) | The expense ratios reflect, among other things, all interest expense and other costs related to VRDP Shares and/or the interest expense deemed to have been paid by the Fund on the floating rate certificates issued by the special purpose trusts for the self-deposited inverse floaters held by the Fund, where applicable, both as described in Footnote 1 – General Information and Significant Accounting Policies, Variable Rate Demand Preferred Shares and Inverse Floating Rate Securities, respectively, as follows: |
| Insured California Dividend Advantage (NKL) | | | | |
| Year Ended 2/28-2/29: | | | | |
| 2012 | | | .47 | % |
| 2011 | | | .02 | |
| 2010 | | | .03 | |
| 2009(f) | | | .09 | * |
| Year Ended 8/31: | | | | |
| 2008 | | | — | |
| 2007 | | | .05 | |
| | | | | |
| Insured California Tax-Free Advantage (NKX) | | | | |
| Year Ended 2/28-2/29: | | | | |
| 2012 | | | .67 | |
| 2011 | | | .92 | |
| 2010 | | | .57 | |
| 2009(f) | | | 1.03 | * |
| Year Ended 8/31: | | | | |
| 2008 | | | .08 | |
| 2007 | | | .06 | |
| (f) | For the six months ended February 28, 2009. |
| * | Annualized. |
| ** | Rounds to less than $.01 per share. |
| *** | Calculates to less than 1%. |
| N/A | Fund did not have, or no longer has, a contractual reimbursement agreement with the Adviser. |
| See accompanying notes to financial statements. |
| | | |
| Nuveen Investments | | 93 |
| | | Financial |
| | | Highlights (continued) |
| | | ARPS at the End of Period | | VRDP Shares at the End of Period | |
| | | Aggregate Amount Outstanding (000 | ) | Liquidation Value Per Share | | Asset Coverage Per Share | | Aggregate Amount Outstanding (000 | ) | Liquidation Value Per Share | | Asset Coverage Per Share | |
| Insured California Premium Income (NPC) | | | | | | | | | | |
| Year Ended 2/28-2/29: | | | | | | | | | | | | | | | | | | | |
| 2012 | | $ | — | | $ | — | | $ | — | | $ | 42,700 | | $ | 100,000 | | $ | 340,002 | |
| 2011 | | | — | | | — | | | — | | | 42,700 | | | 100,000 | | | 305,684 | |
| 2010 | | | 45,000 | | | 25,000 | | | 77,746 | | | — | | | — | | | — | |
| 2009(f) | | | 45,000 | | | 25,000 | | | 75,295 | | | — | | | — | | | — | |
| Year Ended 8/31: | | | | | | | | | | | | | | | | | | | |
| 2008 | | | 45,000 | | | 25,000 | | | 78,590 | | | — | | | — | | | — | |
| 2007 | | | 45,000 | | | 25,000 | | | 78,987 | | | — | | | — | | | — | |
| | | | | | | | | | | | | | | | | | | | |
| Insured California Premium Income 2 (NCL) | | | | | | | | | | |
| Year Ended 2/28-2/29: | | | | | | | | | | | | | | | | | | | |
| 2012 | | | — | | | — | | | — | | | 74,000 | | | 100,000 | | | 363,124 | |
| 2011 | | | — | | | — | | | — | | | 74,000 | | | 100,000 | | | 323,458 | |
| 2010 | | | 79,825 | | | 25,000 | | | 80,487 | | | — | | | — | | | — | |
| 2009(f) | | | 79,825 | | | 25,000 | | | 75,996 | | | — | | | — | | | — | |
| Year Ended 8/31: | | | | | | | | | | | | | | | | | | | |
| 2008 | | | 87,400 | | | 25,000 | | | 76,411 | | | — | | | — | | | — | |
| 2007 | | | 95,000 | | | 25,000 | | | 73,511 | | | — | | | — | | | — | |
| | | ARPS at the End of Period | | VRDP Shares at the End of Period | | MTP Shares at the End of Period (g) | |
| | | Aggregate Amount Outstanding (000 | ) | Liquidation Value Per Share | | Asset Coverage Per Share | | Aggregate Amount Outstanding (000 | ) | Liquidation Value Per Share | | Asset Coverage Per Share | | Aggregate Amount Outstanding (000 | ) | Liquidation Value Per Share | | Asset Coverage Per Share | |
| California Premium Income (NCU) | | | | | | | | | | | | | | | | | | | | | | | |
| Year Ended 2/28-2/29: | | | | | | | | | | | | | | | | | | | | | | | | | | | | |
| 2012 | | $ | — | | $ | — | | $ | — | | $ | — | | $ | — | | $ | — | | $ | 35,250 | | $ | 10.00 | | $ | 34.90 | |
| 2011 | | | — | | | — | | | — | | | — | | | — | | | — | | | 35,250 | | | 10.00 | | | 31.07 | |
| 2010 | | | 34,375 | | | 25,000 | | | 82,150 | | | — | | | — | | | — | | | — | | | — | | | — | |
| 2009(f) | | | 40,875 | | | 25,000 | | | 68,584 | | | — | | | — | | | — | | | — | | | — | | | — | |
| Year Ended 8/31: | | | | | | | | | | | | | | | | | | | | | | | | | | | | |
| 2008 | | | 43,000 | | | 25,000 | | | 70,910 | | | — | | | — | | | — | | | — | | | — | | | — | |
| 2007 | | | 43,000 | | | 25,000 | | | 72,209 | | | — | | | — | | | — | | | — | | | — | | | — | |
| | | | | | | | | | | | | | | | | | | | | | | | | | | | | |
| California Dividend Advantage (NAC) | | | | | | | | | | | | | | | | | | | | | | | |
| Year Ended 2/28-2/29: | | | | | | | | | | | | | | | | | | | | | | | | | | | | |
| 2012 | | | — | | | — | | | — | | | 136,200 | | | 100,000 | | | 356,390 | | | — | | | — | | | — | |
| 2011 | | | 135,525 | | | 25,000 | | | 79,903 | | | — | | | — | | | — | | | — | | | — | | | — | |
| 2010 | | | 135,525 | | | 25,000 | | | 85,098 | | | — | | | — | | | — | | | — | | | — | | | — | |
| 2009(f) | | | 135,525 | | | 25,000 | | | 77,430 | | | — | | | — | | | — | | | — | | | — | | | — | |
| Year Ended 8/31: | | | | | | | | | | | | | | | | | | | | | | | | | |
| 2008 | | | 135,525 | | | 25,000 | | | 87,485 | | | — | | | — | | | — | | | — | | | — | | | — | |
| 2007 | | | 175,000 | | | 25,000 | | | 75,075 | | | — | | | — | | | — | | | — | | | — | | | — | |
| (f) | For the six months ended February 28, 2009. |
| (g) | The Ending and Average Market Value Per Share for each Series of the Fund’s MTP Shares were as follows: |
| | | Series | | Ending Market Value Per Share | | Average Market Value Per Share | |
| California Premium Income (NCU) | | | | | | | |
| Year Ended 2/28-2/29: | | | | | | | | | | |
| 2012 | | | 2015 | | $ | 10.06 | | $ | 9.84 | |
| 2011 | | | 2015 | | | 9.63 | | | 9.74 | ^ |
| 2010 | | | — | | | — | | | — | |
| 2009(f) | | | — | | | — | | | — | |
| Year Ended 8/31: | | | | | | | | | | |
| 2008 | | | — | | | — | | | — | |
| 2007 | | | — | | | — | | | — | |
| | | | | | | | | | | |
| California Dividend Advantage (NAC) | | | | | | | | | | |
| Year Ended 2/28-2/29: | | | | | | | | | | |
| 2012 | | | — | | | — | | | — | |
| 2011 | | | — | | | — | | | — | |
| 2010 | | | — | | | — | | | — | |
| 2009(f) | | | — | | | — | | | — | |
| Year Ended 8/31: | | | | | | | | | | |
| 2008 | | | — | | | — | | | — | |
| 2007 | | | — | | | — | | | — | |
| ^ | For the period September 22, 2010 (first issuance date of shares) through February 28, 2011. |
| See accompanying notes to financial statements. |
| | | |
| Nuveen Investments | | 95 |
| | | Financial |
| | | Highlights (continued) |
| | | ARPS at the End of Period | | MTP Shares at the End of Period (g) | | ARPS and MTP Shares at the End of Period | |
| | | Aggregate Amount Outstanding (000 | ) | Liquidation Value Per Share | | Asset Coverage Per Share | | Aggregate Amount Outstanding (000 | ) | Liquidation Value Per Share | | Asset Coverage Per Share | | Asset Coverage Per $1 Liquidation Preference | |
| California Dividend Advantage 2 (NVX) | | | | | | | | | | | | | | | |
| Year Ended 2/28-2/29: | | | | | | | | | | | | | | | | | | | | | | |
| 2012 | | $ | — | | $ | — | | $ | — | | $ | 97,846 | | $ | 10.00 | | $ | 33.35 | | $ | — | |
| 2011 | | | 39,950 | | | 25,000 | | | 77,310 | | | 55,000 | | | 10.00 | | | 30.92 | | | 3.09 | |
| 2010 | | | 93,775 | | | 25,000 | | | 81,968 | | | — | | | — | | | — | | | — | |
| 2009(f) | | | 110,000 | | | 25,000 | | | 68,369 | | | — | | | — | | | — | | | — | |
| Year Ended 8/31: | | | | | | | | | | | | | | | | | | | | | | |
| 2008 | | | 110,000 | | | 25,000 | | | 73,384 | | | — | | | — | | | — | | | — | |
| 2007 | | | 110,000 | | | 25,000 | | | 74,394 | | | — | | | — | | | — | | | — | |
| | | | | | | | | | | | | | | | | | | | | | | |
| California Dividend Advantage 3 (NZH) | | | | | | | | | | | | | | | |
| Year Ended 2/28-2/29: | | | | | | | | | | | | | | | | | | | | | | |
| 2012 | | | — | | | — | | | — | | | 159,545 | | | 10.00 | | | 31.05 | | | — | |
| 2011 | | | 69,500 | | | 25,000 | | | 71,960 | | | 86,250 | | | 10.00 | | | 28.78 | | | 2.88 | |
| 2010 | | | 69,500 | | | 25,000 | | | 76,021 | | | 86,250 | | | 10.00 | | | 30.41 | | | 3.04 | |
| 2009(f) | | | 154,075 | | | 25,000 | | | 70,117 | | | — | | | — | | | — | | | — | |
| Year Ended 8/31: | | | | | | | | | | | | | | | | | | | | | | |
| 2008 | | | 159,925 | | | 25,000 | | | 76,377 | | | — | | | — | | | — | | | — | |
| 2007 | | | 187,000 | | | 25,000 | | | 70,963 | | | — | | | — | | | — | | | — | |
| (f) | For the six months ended February 28, 2009. |
| (g) | The Ending and Average Market Value Per Share for each Series of the Fund’s MTP Shares were as follows: |
| | | Series | | Ending Market Value Per Share | | Average Market Value Per Share | | Series | | Ending Market Value Per Share | | Average Market Value Per Share | | Series | | Ending Market Value Per Share | | Average Market Value Per Share | |
| California Dividend Advantage 2 (NVX) | | | | | | | | | | | | | | | | | | | | | |
| Year Ended 2/28-2/29: | | | | | | | | | | | | | | | | | | | | | | | | | | | | |
| 2012 | | | — | | $ | — | | $ | — | | | 2014 | | $ | 10.11 | | $ | 10.09 | Ω | | 2015 | | $ | 10.01 | | $ | 9.89 | |
| 2011 | | | — | | | — | | | — | | | — | | | — | | | — | | | 2015 | | | 9.82 | | | 9.72 | ^^ |
| 2010 | | | — | | | — | | | — | | | — | | | — | | | — | | | — | | | — | | | — | |
| 2009(f) | | | — | | | — | | | — | | | — | | | — | | | — | | | — | | | — | | | — | |
| Year Ended 8/31: | | | | | | | | | | | | | | | | | | | | | | | | | | | | |
| 2008 | | | — | | | — | | | — | | | — | | | — | | | — | | | — | | | — | | | — | |
| 2007 | | | — | | | — | | | — | | | — | | | — | | | — | | | — | | | — | | | — | |
| | | | | | | | | | | | | | | | | | | | | | | | | | | | | |
| California Dividend Advantage 3 (NZH) | | | | | | | | | | | | | | | | | | | | | |
| Year Ended 2/28-2/29: | | | | | | | | | | | | | | | | | | | | | | |
| 2012 | | | 2014 | | | 10.17 | | | 10.11 | ΩΩ | | 2014-1 | | | 10.15 | | | 10.12 | ΩΩΩ | | 2015 | | | 10.18 | | | 10.11 | |
| 2011 | | | — | | | — | | | — | | | — | | | — | | | — | | | 2015 | | | 10.06 | | | 10.14 | |
| 2010 | | | — | | | — | | | — | | | — | | | — | | | — | | | 2015 | | | 10.11 | | | 10.09 | ^ |
| 2009(f) | | | — | | | — | | | — | | | — | | | — | | | — | | | — | | | — | | | — | |
| Year Ended 8/31: | | | | | | | | | | | | | | | | | | | | | | | | | |
| 2008 | | | — | | | — | | | — | | | — | | | — | | | — | | | — | | | — | | | — | |
| 2007 | | | — | | | — | | | — | | | — | | | — | | | — | | | — | | | — | | | — | |
| ^ | For the period December 21, 2009 (first issuance date of shares) through February 28, 2010. |
| ^^ | For the period October 22, 2010 (first issuance date of shares) through February 28, 2011. |
| Ω | For the period March 29, 2011 (first issuance date of shares) through February 29, 2012. |
| ΩΩ | For the period April 11, 2011 (first issuance date of shares) through February 29, 2012. |
| ΩΩΩ | For the period June 6, 2011 (first issuance date of shares) through February 29, 2012. |
| | | ARPS at the End of Period | | VRDP Shares at the End of Period | |
| | | Aggregate Amount Outstanding (000 | ) | Liquidation Value Per Share | | Asset Coverage Per Share | | Aggregate Amount Outstanding (000 | ) | Liquidation Value Per Share | | Asset Coverage Per Share | |
| Insured California Dividend Advantage (NKL) | | | | | | | | | | | | | |
| Year Ended 2/28-2/29: | | | | | | | | | | | | | | | | | | | |
| 2012 | | $ | — | | $ | — | | $ | — | | $ | 104,400 | | $ | 100,000 | | $ | 334,215 | |
| 2011 | | | 103,750 | | | 25,000 | | | 75,349 | | | — | | | — | | | — | |
| 2010 | | | 108,250 | | | 25,000 | | | 76,802 | | | — | | | — | | | — | |
| 2009(f) | | | 108,250 | | | 25,000 | | | 72,683 | | | — | | | — | | | — | |
| Year Ended 8/31: | | | | | | | | | | | | | | | | | | | |
| 2008 | | | 118,000 | | | 25,000 | | | 72,321 | | | — | | | — | | | — | |
| 2007 | | | 118,000 | | | 25,000 | | | 73,289 | | | — | | | — | | | — | |
| | | | | | | | | | | | | | | | | | | | |
| Insured California Tax-Free Advantage (NKX) | | | | | | | | | | | | | |
| Year Ended 2/28-2/29: | | | | | | | | | | | | | | | | | | | |
| 2012 | | | — | | | — | | | — | | | 35,500 | | | 100,000 | | | 344,312 | |
| 2011 | | | — | | | — | | | — | | | 35,500 | | | 100,000 | | | 312,655 | |
| 2010 | | | — | | | — | | | — | | | 35,500 | | | 100,000 | | | 332,616 | |
| 2009(f) | | | — | | | — | | | — | | | 35,500 | | | 100,000 | | | 313,131 | |
| Year Ended 8/31: | | | | | | | | | | | | | | | | | | | |
| 2008 | | | — | | | — | | | — | | | 35,500 | | | 100,000 | | | 335,299 | |
| 2007 | | | 45,000 | | | 25,000 | | | 72,302 | | | — | | | — | | | — | |
| See accompanying notes to financial statements. |
| | | |
| Nuveen Investments | | 97 |
| | | Notes to |
| | | Financial Statements |
1. General Information and Significant Accounting Policies
General Information
The funds covered in this report and their corresponding Common share stock exchange symbols are Nuveen Insured California Premium Income Municipal Fund, Inc. (NPC), Nuveen Insured California Premium Income Municipal Fund 2, Inc. (NCL), Nuveen California Premium Income Municipal Fund (NCU), Nuveen California Dividend Advantage Municipal Fund (NAC), Nuveen California Dividend Advantage Municipal Fund 2 (NVX), Nuveen California Dividend Advantage Municipal Fund 3 (NZH), Nuveen Insured California Dividend Advantage Municipal Fund (NKL) and Nuveen Insured California Tax-Free Advantage Municipal Fund (NKX) (each a “Fund” and collectively, the “Funds”). Common shares of Insured California Premium Income (NPC), Insured California Premium Income 2 (NCL) and California Dividend Advantage (NAC) are traded on the New York Stock Exchange (“NYSE”) while Common shares of California Premium Income (NCU), California Dividend Advantage 2 (NVX), California Dividend Advantage 3 (NZH), Insured California Dividend Advantage (NKL) and Insured California Tax-Free Advantage (NKX) are traded on the NYSE Amex. The Funds are registered under the Investment Company Act of 1940, as amended, as closed-end registered investment companies.
Each Fund seeks to provide current income exempt from both regular federal and California state income taxes, and in the case of Insured California Tax-Free Advantage (NKX) the alternative minimum tax applicable to individuals, by investing primarily in a portfolio of municipal obligations issued by state and local government authorities within the state of California or certain U.S. territories.
Approved Fund Mergers
After the close of this reporting period, the Funds’ shareholders approved a series of reorganizations and changes to certain investment policies for Insured California Premium Income (NPC), Insured California Premium Income 2 (NCL), Insured California Dividend Advantage (NKL) and Insured California Tax-Free Advantage (NKX). The approved changes to each Fund’s investment policies were intended to increase the Funds’ flexibility regarding the types of securities available for investment.
The investment policy changes are as follows:
| | |
| ● | Each Fund eliminated the investment policy requiring it, under normal circumstances, to invest at least 80 percent of its managed assets in municipal securities that are covered by insurance which currently guarantees the timely payment of principal and interest. |
| | |
| ● | Each Fund adopted a new investment policy requiring it, under normal circumstances, to invest at least 80 percent of its managed assets in municipal securities that pay interest exempt from federal and California income tax. |
| | |
| Each Fund eliminated the old fundamental loan policy and adopted a new fundamental loan policy, which states that each Fund may not make loans, except as permitted by the Investment Company Act of 1940, as amended, and exemptive orders granted under the Investment Company Act of 1940, as amended. |
| | |
| Each Fund will continue to invest substantially all (at least 80 percent) of its managed assets in investment grade quality municipal securities. |
| | |
| Nuveen Insured California Tax-Free Advantage Municipal Fund (NKX) will continue its policy of investing, under normal circumstances, at least 80% of its assets in AMT-free municipal securities. |
In addition the shareholders approved the reorganization of the Funds as follows:
| Acquired Funds | | | Acquiring Fund |
| Insured California Premium Income (NPC) | | | Nuveen California AMT Free Municipal Income Fund (NKX) |
| Insured California Premium Income 2 (NCL) | | | |
| Insured California Dividend Advantage (NKL) | | | |
The reorganizations will be consummated before the opening of business on May 7, 2012. Upon the closing of the reorganizations, the Acquired Funds will transfer substantially all of their assets to the Acquiring Fund in exchange for common and preferred shares of the Acquiring Fund, and the assumption by the Acquiring Fund of the liabilities of the Acquired Funds. The Acquired Funds will then be liquidated, dissolved and terminated in accordance with their Declaration of Trust. The Acquiring Fund will change its name to Nuveen California AMT Free Municipal Income Fund (NKX).
Shareholders of the Acquired Funds will become shareholders of the Acquiring Fund. Holders of common shares will receive newly issued common shares of the Acquiring Fund, the aggregate net asset value of which will be equal to the aggregate net asset value of the common shares of the Acquired Funds held immediately prior to the reorganizations (including for this purpose fractional Acquiring Fund shares to which shareholders would be entitled). Fractional shares will be sold on the open market and shareholders will receive cash in lieu of such fractional shares. Holders of Variable Rate Demand Preferred (“VRDP”) Shares of each Acquired Fund will receive on a one-for-one basis newly issued VRDP Shares of the Acquiring Fund, in exchange for VRDP Shares of the Acquired Fund held immediately prior to the reorganization, with such new Acquiring Fund VRDP Shares having substantially the same terms as the exchanged VRDP Shares of the Acquired Funds.
Significant Accounting Policies
The following is a summary of significant accounting policies followed by the Funds in the preparation of their financial statements in accordance with U.S. generally accepted accounting principles (“U.S. GAAP”).
Investment Valuation
Prices of municipal bonds and forward interest rate swap contracts are provided by a pricing service approved by the Funds’ Board of Directors/Trustees. These securities are generally classified as Level 2 for fair value measurement purposes. When price quotes are not readily available (which is usually the case for municipal bonds) the pricing service establishes a security’s fair value using methods that may include consideration of the following: yields or prices of investments of comparable quality, type of issue, coupon, maturity and rating, market quotes or indications of value from security dealers, evaluations of anticipated cash flows or collateral, general market conditions and other information and analysis, including the obligor’s credit characteristics considered relevant. In pricing certain securities, particularly less liquid and lower quality securities, the pricing service may consider information about a security, its issuer, or market activity, provided by Nuveen Funds Advisors, Inc. (the “Adviser”), a wholly-owned subsidiary of Nuveen Investments, Inc. (“Nuveen”). These securities are generally classified as Level 2 or Level 3 depending on the priority of the significant inputs.
Certain securities may not be able to be priced by the pre-established pricing methods as described above. Such securities may be valued by the Funds’ Board of Directors/Trustees or its designee at fair value. These securities generally include, but are not limited to, restricted securities (securities which may not be publicly sold without registration under the Securities Act of 1933, as amended) for which a pricing service is unable to provide a market price; securities whose trading has been formally suspended; debt securities that have gone into default and for which there is no current market quotation; a security whose market price is not available from a pre-established pricing source; a security with respect to which an event has occurred that is likely to materially affect the value of the security after the market has closed but before the calculation of a Fund’s net asset value (as may be the case in non-U.S. markets on which the security is primarily traded) or make it difficult or impossible to obtain a reliable market quotation; and a security whose price, as provided by the pricing service, is not deemed to reflect the security’s fair value. As a general principle, the fair value of a security would appear to be the amount that the owner might reasonably expect to receive for it in a current sale. A variety of factors may be considered in determining the fair value of such securities, which may include consideration of the following: yields or prices of investments of comparable quality, type of issue, coupon, maturity and rating, market quotes or indications of value from security dealers, evaluations of anticipated cash flows or collateral, general market conditions and other information and analysis, including the obligor’s credit characteristics considered relevant. These securities are generally classified as Level 2 or Level 3 depending on the priority of the significant inputs. Regardless of the method employed to value a particular security, all valuations are subject to review by the Funds’ Board of Directors/Trustees or its designee.
Refer to Footnote 2 – Fair Value Measurements for further details on the leveling of securities held by the Funds as of the end of the reporting period.
Investment Transactions
Investment transactions are recorded on a trade date basis. Realized gains and losses from transactions are determined on the specific identification method, which is the same basis used for federal income tax purposes. Investments purchased on a when-issued/delayed delivery basis may have extended settlement periods. Any investments so purchased are subject to market fluctuation during this period. The Funds have instructed the custodian to segregate assets with a current value at least equal to the amount of the when-issued/delayed delivery purchase commitments. At February 29, 2012, California Premium Income (NCU), California Dividend Advantage (NAC), California Dividend Advantage 2 (NVX) and California Dividend Advantage 3 (NZH) had outstanding when-issued/delayed delivery purchase commitments of $503,450, $4,554,000, $1,345,900 and $1,999,800, respectively. There were no such outstanding purchase commitments in any of the other Funds.
Investment Income
Investment income, which reflects the amortization of premiums and includes accretion of discounts for financial reporting purposes, is recorded on an accrual basis. Investment income also reflects paydown gains and losses, if any.
Professional Fees
Professional fees presented on the Statement of Operations consist of legal fees incurred in the normal course of operations, audit fees, tax consulting fees and, in some cases, workout expenditures. Workout expenditures are incurred in an attempt to protect or enhance an investment, or to pursue other claims or legal actions on behalf of Fund shareholders.
| | | Notes to |
| | | Financial Statements (continued) |
Income Taxes
Each Fund is a separate taxpayer for federal income tax purposes. Each Fund intends to distribute substantially all of its net investment income and net capital gains to shareholders and to otherwise comply with the requirements of Subchapter M of the Internal Revenue Code applicable to regulated investment companies (“RICs”). Therefore, no federal income tax provision is required. Furthermore, each Fund intends to satisfy conditions that will enable interest from municipal securities, which is exempt from regular federal and California state income taxes, and in the case of Insured California Tax-Free Advantage (NKX) the alternative minimum tax applicable to individuals, to retain such tax-exempt status when distributed to shareholders of the Funds. Net realized capital gains and ordinary income distributions paid by the Funds are subject to federal taxation.
For all open tax years and all major taxing jurisdictions, management of the Funds has concluded that there are no significant uncertain tax positions that would require recognition in the financial statements. Open tax years are those that are open for examination by taxing authorities (i.e., generally the last four tax year ends and the interim tax period since then). Furthermore, management of the Funds is also not aware of any tax positions for which it is reasonably possible that the total amounts of unrecognized tax benefits will significantly change in the next twelve months.
Dividends and Distributions to Common Shareholders
Dividends from net investment income are declared monthly. Net realized capital gains and/or market discount from investment transactions, if any, are distributed to shareholders at least annually. Furthermore, capital gains are distributed only to the extent they exceed available capital loss carryforwards.
Distributions to Common shareholders of net investment income, net realized capital gains and/or market discount, if any, are recorded on the ex-dividend date. The amount and timing of distributions are determined in accordance with federal income tax regulations, which may differ from U.S. GAAP.
Auction Rate Preferred Shares
Each Fund is authorized to issue Auction Rate Preferred Shares (“ARPS”). As of February 28, 2011, Insured California Premium Income (NPC), Insured California Premium Income 2 (NCL) and California Premium Income (NCU) redeemed all of their outstanding ARPS at liquidation value. As of August 31, 2008, Insured California Tax-Free Advantage (NKX) redeemed all of its outstanding ARPS at liquidation value. During the fiscal year ended February 29, 2012, California Dividend Advantage (NAC), California Dividend Advantage 2 (NVX), California Dividend Advantage 3 (NZH) and Insured California Dividend Advantage (NKL) had issued and outstanding ARPS, $25,000 stated value per share, which approximates market value, as a means of effecting financial leverage. Each Fund’s ARPS were issued in one or more Series. The dividend rate paid by the Funds on each Series was determined every seven days, pursuant to a dutch auction process overseen by the auction agent, and was payable at the end of each rate period.
Beginning in February 2008, more shares for sale were submitted in the regularly scheduled auctions for the ARPS issued by the Funds than there were offers to buy. This meant that these auctions “failed to clear,’’ and that many ARPS shareholders who wanted to sell their shares in these auctions were unable to do so. ARPS shareholders unable to sell their shares received distributions at the “maximum rate’’ applicable to failed auctions as calculated in accordance with the pre-established terms of the ARPS. As of February 29, 2012, each Fund redeemed all of their outstanding ARPS, at liquidation value, as follows:
| | | Insured California Premium Income (NPC | ) | Insured California Premium Income 2 (NCL | ) | California Premium Income (NCU | ) | California Dividend Advantage (NAC | ) |
| ARPS redeemed, at liquidation value | | $ | 45,000,000 | | $ | 95,000,000 | | $ | 43,000,000 | | $ | 175,000,000 | |
| | | California Dividend Advantage 2 (NVX | ) | California Dividend Advantage 3 (NZH | ) | Insured California Dividend Advantage (NKL | ) | Insured California Tax-Free Advantage (NKX | ) |
| ARPS redeemed, at liquidation value | | $ | 110,000,000 | | $ | 187,000,000 | | $ | 118,000,000 | | $ | 45,000,000 | |
During the fiscal year ended February 28, 2011, lawsuits pursuing claims made in a demand letter alleging that Insured California Tax-Free Advantage’s (NKX) Board of Trustees breached its fiduciary duties related to the redemption at par of the Fund’s ARPS, had been filed on behalf of shareholders of the Fund, against the Adviser, the Nuveen holding company, the majority owner of the holding company, the lone interested trustee, and current and former officers of the Fund. Nuveen and the other named defendants have filed a motion to dismiss the lawsuits, and on December 16, 2011, the court granted that motion dismissing the lawsuits. The plaintiffs failed to file an appeal of the court’s decision within the required time period, resulting in the final disposition of the suit.
MuniFund Term Preferred Shares
The following Funds have issued and outstanding MuniFund Term Preferred (“MTP”) Shares, with a $10 stated (“par”) value per share. Proceeds from the issuance of MTP Shares, net of offering expenses, were used to redeem all, or a portion of, each Fund’s outstanding ARPS. Each Fund’s MTP Shares may be issued in one or more Series. Dividends on MTP Shares, which are recognized as interest expense for financial reporting purposes, are paid monthly at a fixed annual rate, subject to adjustments in certain circumstances. The MTP Shares trade on the NYSE. As of February 29, 2012, the number of MTP Shares outstanding, annual interest rate and NYSE “ticker” symbol for each Fund’s series of MTP Shares are as follows:
| | | California Premium Income (NCU) | |
| | | Shares Outstanding | | Annual Interest Rate | | NYSE Ticker | |
| Series 2015 | | | 35,250,000 | | | 2.00 | % | | NCU Pr C | |
| | | California Dividend Advantage 2 (NVX) | | California Dividend Advantage 3 (NZH) | |
| | | Shares Outstanding | | Annual Interest Rate | | NYSE Ticker | | Shares Outstanding | | Annual Interest Rate | | NYSE Ticker | |
| Series: | | | | | | | | | | | | | | | | | | | |
| 2014 | | | 42,846,300 | | | 2.35 | % | | NVX Pr A | | | 27,000,000 | | | 2.35 | % | | NZH Pr A | |
| 2014-1 | | | — | | | — | | | — | | | 46,294,500 | | | 2.25 | | | NZH Pr B | |
| 2015 | | | 55,000,000 | | | 2.05 | | | NVX Pr C | | | 86,250,000 | | | 2.95 | | | NZH Pr C | |
Each Fund is obligated to redeem its MTP Shares by the date as specified in its offering document (“Term Redemption Date”), unless earlier redeemed or repurchased by the Fund. MTP Shares are subject to optional and mandatory redemption in certain circumstances. MTP Shares will be subject to redemption at the option of each Fund (“Optional Redemption Date”), subject to a payment of premium for one year following the Optional Redemption Date (“Premium Expiration Date”), and at par thereafter. MTP Shares also will be subject to redemption, at the option of each Fund, at par in the event of certain changes in the credit rating of the MTP Shares. Each Fund may be obligated to redeem certain of the MTP Shares if the Fund fails to maintain certain asset coverage and leverage ratio requirements and such failures are not cured by the applicable cure date. The redemption price per share is equal to the sum of the liquidation value per share plus any accumulated but unpaid dividends. The Term Redemption Date, Optional Redemption Date and Premium Expiration Date for each Fund’s series of MTP Shares are as follows:
| | | California Premium Income (NCU Series 2015 | ) | California Dividend Advantage 2 (NVX Series 2014 | ) | California Dividend Advantage 2 (NVX Series 2015 | ) | California Dividend Advantage 3 (NZH Series 2014 | ) | California Dividend Advantage 3 (NZH Series 2014-1 | ) | California Dividend Advantage 3 (NZH Series 2015 | ) |
| Term Redemption Date | | | October 1, 2015 | | | April 1, 2014 | | | November 1, 2015 | | | May 1, 2014 | | | July 1, 2014 | | | January 1, 2015 | |
| Optional Redemption Date | | | October 1, 2011 | | | April 1, 2012 | | | November 1, 2011 | | | May 1, 2012 | | | July 1, 2012 | | | January 1, 2011 | |
| Premium Expiration Date | | | September 30, 2012 | | | March 31, 2013 | | | October 31, 2012 | | | April 30, 2013 | | | June 30, 2013 | | | December 31, 2011 | |
The average liquidation value of all MTP Shares outstanding for each Fund during the fiscal year ended February 29, 2012, was as follows:
| | | | | | | | | | | |
| | | California | | California | | California | |
| | | Premium | | Dividend | | Dividend | |
| | | Income | | Advantage 2 | | Advantage 3 | |
| | | (NCU | ) | (NVX | ) | (NZH | ) |
| Average liquidation value of MTP Shares outstanding | | $ | 35,250,000 | | $ | 94,479,248 | | $ | 144,226,510 | |
For financial reporting purposes only, the liquidation value of MTP Shares is recorded as a liability on the Statement of Assets and Liabilities. Unpaid dividends on MTP Shares are recognized as a component of “Interest payable” on the Statement of Assets and Liabilities. Dividends paid on MTP Shares are recognized as a component of “Interest expense and amortization of offering costs” on the Statement of Operations.
Nuveen has agreed that net amounts earned by Nuveen as underwriter of each Fund’s MTP Share offering would be credited to the Funds, and would be recorded as reductions of offering costs recognized by the Funds. During the fiscal year ended February 29, 2012, the net amounts earned by Nuveen for each fund were as follows:
| | | | | | | | | | | |
| | | California | | California | | California | |
| | | Premium | | Dividend | | Dividend | |
| | | Income | | Advantage 2 | | Advantage 3 | |
| | | (NCU | ) | (NVX | ) | | (NZH | ) |
| Net amounts earned by Nuveen | | $ | 2,021 | | $ | 4,454 | | $ | 1,895 | |
| | | Notes to |
| | | Financial Statements (continued) |
Variable Rate Demand Preferred Shares
The following Funds have issued and outstanding VRDP Shares, with a $100,000 liquidation value per share. Insured California Premium Income (NPC), Insured California Premium Income 2 (NCL), California Dividend Advantage (NAC), Insured California Dividend Advantage (NKL) and Insured California Tax-Free Advantage (NKX) issued their VRDP Shares in a privately negotiated offering during March 2010, December 2010, June 2011, June 2011 and August 2008, respectively. Concurrent with renewing agreements with the liquidity provider for its VRDP Shares in June 2010, Insured Premium Income 2 (NPX) exchanged all its 2,190 Series 1 VRDP Shares for 2,190 Series 2 VRDP Shares. The principal difference in terms between Series 1 and Series 2 VRDP Shares is the requirement that the Fund redeem VRDP Shares owned by the liquidity provider if the VRDP Shares have been owned by the liquidity provider through six months of continuous, unsuccessful remarketing. Proceeds of each Fund’s offering were used to redeem all, or a portion of, each Fund’s outstanding ARPS. The VRDP Shares were offered to qualified institutional buyers pursuant to Rule 144A under the Securities Act of 1933. As of February 29, 2012, the number of VRDP Shares outstanding and maturity date for each Fund are as follows:
| | | | | | | | | | | | | | | | | |
| | | Insured | | Insured | | | | Insured | | | Insured | |
| | | California | | California | | California | | California | | California | |
| | | Premium | | Premium | | Dividend | | Dividend | | Tax-Free | |
| | | Income | | Income 2 | | Advantage | | Advantage | | Advantage | |
| | | (NPC | ) | (NCL | ) | (NAC | ) | (NKL | ) | (NKX | ) |
| Series | | | 1 | | | 1 | | | 1 | | | 1 | | | 2 | |
| Shares outstanding | | | 427 | | | 740 | | | 1,362 | | | 1,044 | | | 355 | |
| Maturity | | | March 1, 2040 | | | December 1, 2040 | | | June 1, 2041 | | | June 1, 2041 | | | June 1, 2040 | |
VRDP Shares include a liquidity feature that allows VRDP shareholders to have their shares purchased by a liquidity provider with whom each Fund has contracted in the event that purchase orders for VRDP Shares in a remarketing are not sufficient in number to be matched with the sale orders in that remarketing. Each Fund is required to redeem any VRDP Shares that are still owned by the liquidity provider after six months of continuous, unsuccessful remarketing.
Dividends on the VRDP Shares (which are treated as interest payments for financial reporting purposes) are set weekly at a rate established by a remarketing agent; therefore, the market value of the VRDP Shares is expected to approximate its liquidation value. If remarketings for VRDP Shares are continuously unsuccessful for six months, the maximum rate is designed to escalate according to a specified schedule in order to enhance the remarketing agent’s ability to successfully remarket the VRDP Shares.
Subject to certain conditions, VRDP Shares may be redeemed, in whole or in part, at any time at the option of each Fund. Each Fund may also redeem certain of the VRDP Shares if the Fund fails to maintain certain asset coverage requirements and such failures are not cured by the applicable cure date. The redemption price per share is equal to the sum of the liquidation value per share plus any accumulated but unpaid dividends.
The average liquidation value outstanding and annualized dividend rate of VRDP Shares for each Fund during the fiscal year ended February 29, 2012, were as follows:
| | | | | | | | | | | | | | | | | |
| | | Insured | | Insured | | | | Insured | | Insured | |
| | | California | | California | | California | | California | | California | |
| | | Premium | | Premium | | Dividend | | Dividend | | Tax-Free | |
| | | Income | | Income 2 | | Advantage | | Advantage | | Advantage | |
| | | (NPC | ) | (NCL | ) | (NAC | )* | (NKL | )* | (NKX | ) |
| Average liquidation value outstanding | | $ | 42,700,000 | | $ | 74,000,000 | | $ | 136,200,000 | | $ | 104,400,000 | | $ | 35,500,000 | |
| Annualized dividend rate | | | 0.32 | % | | 0.32 | % | | 0.28 | % | | 0.28 | % | | 0.27 | % |
| * | For the period June 28, 2011 (issuance date of shares) through February 29, 2012. |
For financial reporting purposes only, the liquidation value of VRDP Shares is recognized as a liability on the Statement of Assets and Liabilities. Unpaid dividends on VRDP Shares are recognized as a component of “Interest payable” on the Statement of Assets and Liabilities. Dividends paid on the VRDP Shares are recognized as a component of “Interest expense and amortization of offering costs” on the Statement of Operations. In addition to interest expense, each Fund also pays a per annum liquidity fee to the liquidity provider, as well as a remarketing fee, which are recognized as “Fees on VRDP Shares” on the Statement of Operations.
Insurance
Since 2007, the financial status of most major municipal bond insurers has deteriorated substantially, and some insurers have gone out of business, rendering worthless the insurance policies they had written. Under normal circumstances, Insured California Premium Income (NPC), Insured California Premium Income 2 (NCL), Insured California Dividend Advantage (NKL) and Insured California Tax-Free Advantage (NKX) invest at least 80% of their managed assets (as defined in Footnote 7 – Management Fees and Other Transactions with Affiliates) in municipal securities that are covered by insurance guaranteeing the timely payment of principal and interest. In addition, the municipal securities in which each Fund invests will be investment
grade at the time of purchase (including (i) bonds insured by investment grade insurers or are rated investment grade; (ii) unrated bonds that are judged to be investment grade by the Adviser; and (iii) escrowed bonds). Ratings below BBB by one or more national rating agencies are considered to be below investment grade.
Each insured municipal security is covered by Original Issue Insurance, Secondary Market Insurance or Portfolio Insurance. Assuming that the insurer remains creditworthy, the insurance feature of a municipal security guarantees the full payment of principal and interest when due through the life of an insured obligation. Such insurance does not guarantee the market value of the insured obligation or the value of the Fund’s Common shares. Original Issue Insurance and Secondary Market Insurance remain in effect as long as the municipal securities covered thereby remain outstanding and the insurer remains in business, regardless of whether the Funds ultimately dispose of such municipal securities. Consequently, the market value of the municipal securities covered by Original Issue Insurance or Secondary Market Insurance may reflect value attributable to the insurance. Portfolio Insurance, in contrast, is effective only while the municipal securities are held by the Funds and is reflected as an expense over the term of the policy, when applicable. Accordingly, neither the prices used in determining the market value of the underlying municipal securities nor the Common share net asset value of the Funds include value, if any, attributable to the Portfolio Insurance. Each policy of the Portfolio Insurance does, however, give the Funds the right to obtain permanent insurance with respect to the municipal security covered by the Portfolio Insurance policy at the time of its sale.
Inverse Floating Rate Securities
Each Fund is authorized to invest in inverse floating rate securities. An inverse floating rate security is created by depositing a municipal bond, typically with a fixed interest rate, into a special purpose trust created by a broker-dealer. In turn, this trust (a) issues floating rate certificates, in face amounts equal to some fraction of the deposited bond’s par amount or market value, that typically pay short-term tax-exempt interest rates to third parties, and (b) issues to a long-term investor (such as one of the Funds) an inverse floating rate certificate (sometimes referred to as an “inverse floater”) that represents all remaining or residual interest in the trust. The income received by the inverse floater holder varies inversely with the short-term rate paid to the floating rate certificates’ holders, and in most circumstances the inverse floater holder bears substantially all of the underlying bond’s downside investment risk and also benefits disproportionately from any potential appreciation of the underlying bond’s value. The price of an inverse floating rate security will be more volatile than that of the underlying bond because the interest rate is dependent on not only the fixed coupon rate of the underlying bond but also on the short-term interest paid on the floating rate certificates, and because the inverse floating rate security essentially bears the risk of loss of the greater face value of the underlying bond.
A Fund may purchase an inverse floating rate security in a secondary market transaction without first owning the underlying bond (referred to as an “externally-deposited inverse floater”), or instead by first selling a fixed-rate bond to a broker-dealer for deposit into the special purpose trust and receiving in turn the residual interest in the trust (referred to as a “self-deposited inverse floater”). The inverse floater held by a Fund gives the Fund the right (a) to cause the holders of the floating rate certificates to tender their notes at par, and (b) to have the broker transfer the fixed-rate bond held by the trust to the Fund, thereby collapsing the trust. An investment in an externally-deposited inverse floater is identified in the Portfolio of Investments as “(IF) – Inverse floating rate investment.” An investment in a self-deposited inverse floater is accounted for as a financing transaction. In such instances, a fixed-rate bond deposited into a special purpose trust is identified in the Portfolio of Investments as “(UB) – Underlying bond of an inverse floating rate trust reflected as a financing transaction,” with the Fund accounting for the short-term floating rate certificates issued by the trust as “Floating rate obligations” on the Statement of Assets and Liabilities. In addition, the Fund reflects in “Investment Income” the entire earnings of the underlying bond and the related interest paid to the holders of the short-term floating rate certificates as a component of “Interest expense and amortization of offering costs” on the Statement of Operations.
During the fiscal year ended February 29, 2012, each Fund invested in externally-deposited inverse floaters and/or self-deposited inverse floaters.
Each Fund may also enter into shortfall and forbearance agreements (sometimes referred to as a “recourse trust” or “credit recovery swap”) (such agreements referred to herein as “Recourse Trusts”) with a broker-dealer by which a Fund agrees to reimburse the broker-dealer, in certain circumstances, for the difference between the liquidation value of the fixed-rate bond held by the trust and the liquidation value of the floating rate certificates issued by the trust plus any shortfalls in interest cash flows. Under these agreements, a Fund’s potential exposure to losses related to or on inverse floaters may increase beyond the value of a Fund’s inverse floater investments as a Fund may potentially be liable to fulfill all amounts owed to holders of the floating rate certificates. At period end, any such shortfall is recognized as “Unrealized depreciation on Recourse Trusts” on the Statement of Assets and Liabilities. At February 29, 2012, each Fund’s maximum exposure to externally-deposited Recourse Trusts, was as follows:
| | | | | | | | | | | | | | | | | | | | | | | | | | |
| | | Insured | | Insured | | | | | | | | | | | | | | Insured | | Insured | |
| | | California | | California | | California | | California | | California | | California | | California | | California | |
| | | Premium | | Premium | | Premium | | Dividend | | Dividend | | Dividend | | Dividend | | Tax-Free | |
| | | Income | | Income 2 | | Income | | Advantage | | Advantage 2 | | Advantage 3 | | Advantage | | Advantage | |
| | | | (NPC | ) | | (NCL | ) | | (NCU | ) | | (NAC | ) | | (NVX | ) | | (NZH | ) | (NKL | ) | (NKX | ) |
Maximum exposure to Recourse Trusts | | $ | 9,780,000 | | $ | 9,515,000 | | $ | 6,510,000 | | $ | 3,590,000 | | $ | 16,210,000 | | $ | 48,960,000 | | $ | 7,700,000 | | $ | 2,905,000 | |
| | | Notes to |
| | | Financial Statements (continued) |
The average floating rate obligations outstanding and average annual interest rate and fees related to self-deposited inverse floaters for the following Funds during the fiscal year ended February 29, 2012, were as follows:
| | | | | | | | | | | |
| | | Insured | | | | | |
| | | California | | California | | California | |
| | | Premium | | Premium | | Dividend | |
| | | Income 2 | | Income | | Advantage | |
| | | (NCL | ) | (NCU | ) | (NAC | ) |
| Average floating rate obligations outstanding | | $ | 17,880,000 | | $ | 6,650,000 | | $ | 28,545,000 | |
| Average annual interest rate and fees | | | 0.59 | % | | 0.55 | % | | 0.60 | % |
| | | | | | | | | | | | | | |
| | | | | | | | | Insured | | Insured | |
| | | California | | California | | California | | California | |
| | | Dividend | | Dividend | | Dividend | | Tax-Free | |
| | | Advantage 2 | | Advantage 3 | | Advantage | | Advantage | |
| | | (NVX | ) | (NZH | ) | (NKL | ) | (NKX | ) |
| Average floating rate obligations outstanding | | $ | 11,390,000 | | $ | 3,845,000 | | $ | 7,385,000 | | $ | 3,360,000 | |
| Average annual interest rate and fees | | | 0.61 | % | | 0.54 | % | | 0.61 | % | | 0.77 | % |
Forward Swap Contracts
Each Fund is authorized to enter into forward interest rate swap contracts consistent with their investment objectives and policies to reduce, increase or otherwise alter its risk profile or to alter its portfolio characteristics (i.e. duration, yield curve positioning and credit quality).
Each Fund is subject to interest rate risk in the normal course of pursuing its investment objectives. Each Fund’s use of forward interest rate swap transactions is intended to help the Fund manage its overall interest rate sensitivity, either shorter or longer, generally to more closely align the Fund’s interest rate sensitivity with that of the broader market. Forward interest rate swap transactions involve each Fund’s agreement with a counterparty to pay, in the future, a fixed or variable rate payment in exchange for the counterparty paying the Fund a variable or fixed rate payment, the accruals for which would begin at a specified date in the future (the “effective date”). The amount of the payment obligation is based on the notional amount of the swap contract and the termination date of the swap (which is akin to a bond’s maturity). The value of the Fund’s swap commitment would increase or decrease based primarily on the extent to which long-term interest rates for bonds having a maturity of the swap’s termination date increase or decrease. Forward interest rate swap contracts are valued daily. The net amount recorded on these transactions for each counterparty is recognized on the Statement of Assets and Liabilities as a component of “Unrealized appreciation or depreciation on forward swaps” with the change during the fiscal period recognized on the Statement of Operations as a component of “Change in net unrealized appreciation (depreciation) of forward swaps.”
Each Fund may terminate a swap contract prior to the effective date, at which point a realized gain or loss is recognized. When a forward swap is terminated, it ordinarily does not involve the delivery of securities or other underlying assets or principal, but rather is settled in cash on a net basis. Net realized gains and losses during the fiscal period are recognized on the Statement of Operations as a component of “Net realized gain (loss) from forward swaps.” Each Fund intends, but is not obligated, to terminate its forward swaps before the effective date. Accordingly, the risk of loss with respect to the swap counterparty on such transactions is limited to the credit risk associated with a counterparty failing to honor its commitment to pay any realized gain to the Fund upon termination.
During the fiscal year ended February 29, 2012, Insured California Premium Income 2 (NCL) entered into forward interest rate swap contracts to broadly reduce the sensitivity of the Fund to movements in U.S. interest rates. The average notional amount of forward interest rate swap contracts outstanding during the fiscal year ended February 29, 2012 was as follows:
| | | | | |
| | | Insured | |
| | | California | |
| | | Premium | |
| | | Income 2 | |
| | | (NCL | ) |
| Average notional amount of forward interest rate swap contracts outstanding* | | $ | 2,300,000 | |
| * | The average notional amount is calculated based on the outstanding notional at the beginning of the fiscal year and at the end of each fiscal quarter within the current fiscal year. |
Refer to Footnote 3 – Derivative Instruments and Hedging Activities for further details on forward swap contract activity.
Market and Counterparty Credit Risk
In the normal course of business each Fund may invest in financial instruments and enter into financial transactions where risk of potential loss exists due to changes in the market (market risk) or failure of the other party to the transaction to perform (counterparty credit risk). The potential loss could exceed the value of the financial assets recorded on the financial statements. Financial assets, which potentially expose each Fund to counterparty credit risk, consist principally of cash due from counterparties on forward, option and swap transactions, when applicable. The extent of each Fund’s exposure to counterparty credit risk in respect to these financial assets approximates their carrying value as recorded on the Statement of Assets and
Liabilities. Futures contracts, when applicable, expose a Fund to minimal counterparty credit risk as they are exchange traded and the exchange’s clearinghouse, which is counterparty to all exchange traded futures, guarantees the futures contracts against default.
Each Fund helps manage counterparty credit risk by entering into agreements only with counterparties the Adviser believes have the financial resources to honor their obligations and by having the Adviser monitor the financial stability of the counterparties. Additionally, counterparties may be required to pledge collateral daily (based on the daily valuation of the financial asset) on behalf of each Fund with a value approximately equal to the amount of any unrealized gain above a pre-determined threshold. Reciprocally, when each Fund has an unrealized loss, the Funds have instructed the custodian to pledge assets of the Funds as collateral with a value approximately equal to the amount of the unrealized loss above a pre-determined threshold. Collateral pledges are monitored and subsequently adjusted if and when the valuations fluctuate, either up or down, by at least the pre-determined threshold amount.
Zero Coupon Securities
Each Fund is authorized to invest in zero coupon securities. A zero coupon security does not pay a regular interest coupon to its holders during the life of the security. Tax-exempt income to the holder of the security comes from accretion of the difference between the original purchase price of the security at issuance and the par value of the security at maturity and is effectively paid at maturity. The market prices of zero coupon securities generally are more volatile than the market prices of securities that pay interest periodically.
Offering Costs
Costs incurred by the Funds in connection with their offerings of MTP Shares or VRDP Shares were recorded as a deferred charge, which are being amortized over the life of the shares. Each Fund’s amortized deferred charges are recognized as a component of “Interest expense and amortization of offering costs” on the Statement of Operations. Each Fund’s offering costs incurred were as follows:
| | | | | | | | | | | |
| | | California | | California | | California | |
| | | Premium | | Dividend | | Dividend | |
| | | Income | | Advantage 2 | | Advantage 3 | |
| | | (NCU | ) | (NVX | ) | (NZH | ) |
| MTP Shares offering costs | | $ | 868,750 | | $ | 2,055,579 | | $ | 3,269,931 | |
| | | | | | | | | | | | | | | | | |
| | | | Insured | | | Insured | | | | | | Insured | | | Insured | |
| | | | California | | | California | | | California | | | California | | | California | |
| | | | Premium | | | Premium | | | Dividend | | | Dividend | | | Tax-Free | |
| | | | Income | | | Income 2 | | | Advantage | | | Advantage | | | Advantage | |
| | | | (NPC | ) | | (NCL | ) | | (NAC | ) | | (NKL | ) | | (NKX | ) |
| VRDP Shares offering costs | | $ | 857,000 | | $ | 627,000 | | $ | 650,000 | | $ | 580,000 | | $ | 530,000 | |
Custodian Fee Credit
Each Fund has an arrangement with the custodian bank whereby certain custodian fees and expenses are reduced by net credits earned on each Fund’s cash on deposit with the bank. Such deposit arrangements are an alternative to overnight investments. Credits for cash balances may be offset by charges for any days on which a Fund overdraws its account at the custodian bank.
Indemnifications
Under the Funds’ organizational documents, their officers and directors/trustees are indemnified against certain liabilities arising out of the performance of their duties to the Funds. In addition, in the normal course of business, the Funds enter into contracts that provide general indemnifications to other parties. The Funds’ maximum exposure under these arrangements is unknown as this would involve future claims that may be made against the Funds that have not yet occurred. However, the Funds have not had prior claims or losses pursuant to these contracts and expect the risk of loss to be remote.
Use of Estimates
The preparation of financial statements in conformity with U.S. GAAP requires management to make estimates and assumptions that affect the reported amounts of assets and liabilities at the date of the financial statements and the reported amounts of increases and decreases in net assets applicable to Common shares from operations during the reporting period. Actual results may differ from those estimates.
2. Fair Value Measurements
Fair value is defined as the price that the Funds would receive upon selling an investment or transferring a liability in an orderly transaction to an independent buyer in the principal or most advantageous market for the investment. A three-tier hierarchy is used to maximize the use of observable market data and minimize the use of unobservable inputs and to establish classification of fair value measurements for disclosure purposes. Observable inputs reflect the assumptions market participants would use in pricing the asset or liability. Observable inputs are based on market data obtained from sources independent of the reporting entity. Unobservable inputs reflect the reporting entity’s own assumptions about the assumptions
| | | Notes to |
| | | Financial Statements (continued) |
market participants would use in pricing the asset or liability. Unobservable inputs are based on the best information available in the circumstances. The three-tier hierarchy of inputs is summarized in the three broad levels listed below:
| | Level 1 – | Quoted prices in active markets for identical securities. |
| | Level 2 – | Other significant observable inputs (including quoted prices for similar securities, interest rates, prepayment speeds, credit risk, etc.). |
| | Level 3 – | Significant unobservable inputs (including management’s assumptions in determining the fair value of investments). |
The inputs or methodologies used for valuing securities are not an indication of the risk associated with investing in those securities. The following is a summary of each Fund’s fair value measurements as of February 29, 2012:
| | | | | | | | | | | | | | |
| Insured California Premium Income (NPC) | | | Level 1 | | | Level 2 | | | Level 3 | | | Total | |
| Investments: | | | | | | | | | | | | | |
| Municipal Bonds | | $ | — | | $ | 138,048,126 | | $ | — | | $ | 138,048,126 | |
| | | | | | | | | | | | | | |
| Insured California Premium Income 2 (NCL) | | | Level 1 | | | Level 2 | | | Level 3 | | | Total | |
| Investments: | | | | | | | | | | | | | |
| Municipal Bonds | | $ | — | | $ | 280,025,460 | | $ | — | | $ | 280,025,460 | |
| | | | | | | | | | | | | | |
| California Premium Income (NCU) | | | Level 1 | | | Level 2 | | | Level 3 | | | Total | |
| Investments: | | | | | | | | | | | | | |
| Municipal Bonds | | $ | — | | $ | 125,293,556 | | $ | — | | $ | 125,293,556 | |
| | | | | | | | | | | | | | |
| California Dividend Advantage (NAC) | | | Level 1 | | | Level 2 | | | Level 3 | | | Total | |
| Investments: | | | | | | | | | | | | | |
| Municipal Bonds | | $ | — | | $ | 510,520,007 | | $ | — | | $ | 510,520,007 | |
| | | | | | | | | | | | | | |
| California Dividend Advantage 2 (NVX) | | | Level 1 | | | Level 2 | | | Level 3 | | | Total | |
| Investments: | | | | | | | | | | | | | |
| Municipal Bonds | | $ | — | | $ | 329,724,378 | | $ | — | | $ | 329,724,378 | |
| | | | | | | | | | | | | | |
| California Dividend Advantage 3 (NZH) | | | Level 1 | | | Level 2 | | | Level 3 | | | Total | |
| Investments: | | | | | | | | | | | | | |
| Municipal Bonds | | $ | — | | $ | 488,106,122 | | $ | — | | $ | 488,106,122 | |
| | | | | | | | | | | | | | |
| Insured California Dividend Advantage (NKL) | | | Level 1 | | | Level 2 | | | Level 3 | | | Total | |
| Investments: | | | | | | | | | | | | | |
| Municipal Bonds | | $ | — | | $ | 350,901,757 | | $ | — | | $ | 350,901,757 | |
| | | | | | | | | | | | | | |
| Insured California Tax-Free Advantage (NKX) | | | Level 1 | | | Level 2 | | | Level 3 | | | Total | |
| Investments: | | | | | | | | | | | | | |
| Municipal Bonds | | $ | — | | $ | 123,860,171 | | $ | — | | $ | 123,860,171 | |
The following is a reconciliation of the following Fund’s Level 3 investments held at the beginning and end of the measurement period:
| | | | | | | | | | | | | | |
| | | California | | California | | California | | California | |
| | | Premium | | Dividend | | Dividend | | Dividend | |
| | | Income | | Advantage | | Advantage 2 | | Advantage 3 | |
| | | (NCU | ) | (NAC | ) | (NVX | ) | (NZH | ) |
| | | Level 3 | | Level 3 | | Level 3 | | Level 3 | |
| | | Municipal | | Municipal | | Municipal | | Municipal | |
| | | Bonds | | Bonds | | Bonds | | Bonds | |
| Balance at the beginning of period | | $ | 2,746,970 | | $ | 1,229,601 | | $ | 766,086 | | $ | 1,261,789 | |
| Gains (losses): | | | | | | | | | | | | | |
| Net realized gains (losses) | | | — | | | — | | | — | | | — | |
| Net change in unrealized appreciation (depreciation) | | | 690,857 | | | (610,913 | ) | | (380,621 | ) | | (626,905 | ) |
| Purchases at cost | | | — | | | — | | | — | | | — | |
| Sales at proceeds | | | (690,000 | ) | | (7,431 | ) | | (4,629 | ) | | (7,625 | ) |
| Net discounts (premiums) | | | — | | | — | | | — | | | — | |
| Transfers in to | | | — | | | — | | | — | | | — | |
| Transfers out of | | | (2,747,827 | ) | | (611,257 | ) | | (380,836 | ) | | (627,259 | ) |
| Balance at the end of period | | $ | — | | $ | — | | $ | — | | $ | — | |
| Change in net unrealized appreciation (depreciation) during the period of Level 3 securities held as of February 29, 2012 | | $ | — | | $ | — | | $ | — | | $ | — | |
During the fiscal year ended February 29, 2012, the Funds recognized no significant transfers to or from Level 1 or Level 2. Transfers in and/or out of Level 3 are shown using end of period values.
3. Derivative Instruments and Hedging Activities
The Funds record derivative instruments at fair value, with changes in fair value recognized on the Statement of Operations, when applicable. Even though the Funds’ investments in derivatives may represent economic hedges, they are not considered to be hedge transactions for financial reporting purposes. For additional information on the derivative instruments in which each Fund was invested during and at the end of the reporting period, refer to the Portfolios of Investments, Financial Statements and Footnote 1 - General Information and Significant Accounting Policies.
The following tables present the amount of net realized gain (loss) and change in net unrealized appreciation (depreciation) recognized for the fiscal year ended February 29, 2012, on derivative instruments, as well as the primary risk exposure associated with each.
| | | | | |
| | | Insured | |
| | | California | |
| | | Premium | |
| | | Income 2 | |
| Net Realized Gain (Loss) from Forward Swaps | | (NCL | ) |
| Risk Exposure | | | | |
| Interest Rate | | $ | (346,971 | ) |
| | | | | |
| | | Insured | |
| | | California | |
| | | Premium | |
| | | Income 2 | |
| Change in Net Unrealized Appreciation (Depreciation) of Forward Swaps | | (NCL | ) |
| Risk Exposure | | | | |
| Interest Rate | | $ | 15,872 | |
4. Fund Shares
Common Shares
Transactions in Common shares were as follows:
| | | | | | | | | | | | | | |
| | | | Insured California Premium Income (NPC) | | Insured California Premium Income 2 (NCL) | |
| | | | Year Ended | | | Year Ended | | | Year Ended | | | Year Ended | |
| | | | 2/29/12 | | | 2/28/11 | | | 2/29/12 | | | 2/28/11 | |
| Common shares: | | | | | | | | | | | | | |
| Issued to shareholders due | | | | | | | | | | | | | |
| to reinvestment of distributions | | | 7,433 | | | — | | | 6,877 | | | 2,552 | |
| Repurchased and retired | | | — | | | — | | | — | | | (1,200 | ) |
| Weighted average Common share: | | | | | | | | | | | | | |
| Price per share repurchased and retired | | | — | | | — | | | — | | $ | 12.14 | |
| Discount per share repurchased and retired | | | — | | | — | | | — | | | 13.47 | % |
| | | | | | | | | | | | | | |
| | | California Premium Income (NCU) | | California Dividend Advantage (NAC) | |
| | | | Year Ended | | | Year Ended | | | Year Ended | | | Year Ended | |
| | | | 2/29/12 | | | 2/28/11 | | | 2/29/12 | | | 2/28/11 | |
| Common shares: | | | | | | | | | | | | | |
| Issued to shareholders due | | | | | | | | | | | | | |
| to reinvestment of distributions | | | — | | | — | | | 2,968 | | | — | |
| Repurchased and retired | | | — | | | (2,400 | ) | | — | | | — | |
| Weighted average Common share: | | | | | | | | | | | | | |
| Price per share repurchased and retired | | | — | | $ | 11.82 | | | — | | | — | |
| Discount per share repurchased and retired | | | — | | | 14.53 | % | | — | | | — | |
| | | Notes to |
| | | Financial Statements (continued) |
| | | California Dividend Advantage 2 (NVX) | | California Dividend Advantage 3 (NZH) | |
| | | | Year Ended | | | Year Ended | | | Year Ended | | | Year Ended | |
| | | | 2/29/12 | | | 2/28/11 | | | 2/29/12 | | | 2/28/11 | |
| Common shares: | | | | | | | | | | | | | |
| Issued to shareholders due | | | | | | | | | | | | | |
| to reinvestment of distributions | | | — | | | — | | | 11,313 | | | 8,485 | |
| Repurchased and retired | | | — | | | — | | | — | | | — | |
| Weighted average Common share: | | | | | | | | | | | | | |
| Price per share repurchased and retired | | | — | | | — | | | — | | | — | |
| Discount per share repurchased and retired | | | — | | | — | | | — | | | — | |
| | | Insured California Dividend Advantage (NKL) | | Insured California Tax-Free Advantage (NKX) | |
| | | | Year Ended | | | Year Ended | | | Year Ended | | | Year Ended | |
| | | | 2/29/12 | | | 2/28/11 | | | 2/29/12 | | | 2/28/11 | |
| Common shares: | | | | | | | | | | | | | |
| Issued to shareholders due | | | | | | | | | | | | | |
| to reinvestment of distributions | | | 9,519 | | | 2,873 | | | 1,612 | | | 596 | |
| Repurchased and retired | | | — | | | — | | | — | | | — | |
| Weighted average Common share: | | | | | | | | | | | | | |
| Price per share repurchased and retired | | | — | | | — | | | — | | | — | |
| Discount per share repurchased and retired | | | — | | | — | | | — | | | — | |
Preferred Shares
Insured California Tax-Free Advantage (NKX) redeemed all of its outstanding ARPS during the fiscal year ended August 31, 2008.
Transactions in ARPS were as follows:
| | | | | | | | | | | | | | | | | | | | | | | | | | |
| | | Insured California Premium Income (NPC) | | Insured California Premium Income 2 (NCL) | |
| | | Year Ended 2/29/12 | | Year Ended 2/28/11 | | Year Ended 2/29/12 | | Year Ended 2/28/11 | |
| | | | Shares | | | Amount | | | Shares | | | Amount | | | Shares | | | Amount | | | Shares | | | Amount | |
| ARPS redeemed: | | | | | | | | | | | | | | | | | | | | | | | | | |
| Series T | | | N/A | | | N/A | | | 1,800 | | $ | 45,000,000 | | | N/A | | | N/A | | | 1,597 | | $ | 39,925,000 | |
| Series TH | | | N/A | | | N/A | | | — | | | — | | | N/A | | | N/A | | | 1,596 | | | 39,900,000 | |
| Total | | | N/A | | | N/A | | | 1,800 | | $ | 45,000,000 | | | N/A | | | N/A | | | 3,193 | | $ | 79,825,000 | |
| | | California Premium Income (NCU) | | California Dividend Advantage (NAC) | |
| | | Year Ended 2/29/12 | | Year Ended 2/28/11 | | Year Ended 2/29/12 | | Year Ended 2/28/11 | |
| | | Shares | | Amount | | Shares | | Amount | | Shares | | Amount | | Shares | | Amount | |
| ARPS redeemed: | | | | | | | | | | | | | | | | | | | | | | | | | |
| Series M | | | N/A | | | N/A | | | 1,375 | | $ | 34,375,000 | | | — | | $ | — | | | — | | $ | — | |
| Series TH | | | N/A | | | N/A | | | — | | | — | | | 2,710 | | | 67,750,000 | | | — | | | — | |
| Series F | | | N/A | | | N/A | | | — | | | — | | | 2,711 | | | 67,775,000 | | | — | | | — | |
| Total | | | N/A | | | N/A | | | 1,375 | | $ | 34,375,000 | | | 5,421 | | $ | 135,525,000 | | | — | | $ | — | |
N/A - As of February 28, 2011, the Fund redeemed all of its outstanding ARPS at liquidation value.
| | | California Dividend Advantage 2 (NVX) | | California Dividend Advantage 3 (NZH) | |
| | | Year Ended 2/29/12 | | Year Ended 2/29/12 | | Year Ended 2/28/11 | | Year Ended 2/28/11 | |
| | | | Shares | | | Amount | | | Shares | | | Amount | | | Shares | | | Amount | | | Shares | | | Amount | |
| ARPS redeemed: | | | | | | | | | | | | | | | | | | | | | | | | | |
| Series M | | | 799 | | $ | 19,975,000 | | | 1,076 | | $ | 26,900,000 | | | 1,389 | | $ | 34,725,000 | | | — | | $ | — | |
| Series TH | | | — | | | — | | | — | | | — | | | 1,391 | | | 34,775,000 | | | — | | | — | |
| Series F | | | 799 | | | 19,975,000 | | | 1,077 | | | 26,925,000 | | | — | | | — | | | — | | | — | |
| Total | | | 1,598 | | $ | 39,950,000 | | | 2,153 | | $ | 53,825,000 | | | 2,780 | | $ | 69,500,000 | | | — | | $ | — | |
| | | Insured California Dividend Advantage (NKL) | |
| | | Year Ended 2/29/12 | | Year Ended 2/28/11 | |
| | | | Shares | | | Amount | | | Shares | | | Amount | |
| ARPS redeemed: | | | | | | | | | | | | | |
| Series T | | | 2,075 | | $ | 51,875,000 | | | 90 | | $ | 2,250,000 | |
| Series F | | | 2,075 | | | 51,875,000 | | | 90 | | | 2,250,000 | |
| Total | | | 4,150 | | $ | 103,750,000 | | | 180 | | $ | 4,500,000 | |
Transactions in MTP Shares were as follows:
| | | | | | | | | | | | | | | | | | | | | | | | | | |
| | | California Premium Income (NCU) | | California Dividend Advantage 2 (NVX) | |
| | | Year Ended 2/29/12 | | Year Ended 2/28/11 | | Year Ended 2/29/12 | | Year Ended 2/28/11 | |
| | | | Shares | | | Amount | | | Shares | | | Amount | | | Shares | | | Amount | | | Shares | | | Amount | |
| MTP Shares issued: | | | | | | | | | | | | | | | | | | | | | | | | | |
| Series 2014 | | | — | | $ | — | | | — | | $ | — | | | 4,284,630 | | $ | 42,846,300 | | | — | | $ | — | |
| Series 2015 | | | — | | | — | | | 3,525,000 | | | 35,250,000 | | | — | | | — | | | 5,500,000 | | | 55,000,000 | |
| Total | | | — | | $ | — | | | 3,525,000 | | $ | 35,250,000 | | | 4,284,630 | | $ | 42,846,300 | | | 5,500,000 | | $ | 55,000,000 | |
| | | California Dividend Advantage 3 (NZH) | |
| | | Year Ended 2/29/12 | | Year Ended 2/28/11 | |
| | | | Shares | | | Amount | | | Shares | | | Amount | |
| MTP Shares issued: | | | | | | | | | | | | | |
| Series 2014 | | | 2,700,000 | | $ | 27,000,000 | | | — | | $ | — | |
| Series 2014-1 | | | 4,629,450 | | | 46,294,500 | | | — | | | — | |
| Total | | | 7,329,450 | | $ | 73,294,500 | | | — | | $ | — | |
Transactions in VRDP Shares were as follows:
| | | | | | | | | | | | | | | | | | | | | | | | | | |
| | | Insured California Premium Income (NPC) | | Insured California Premium Income 2 (NCL) | |
| | | Year Ended 2/29/12 | | Year Ended 2/28/11 | | Year Ended 2/29/12 | | Year Ended 2/28/11 | |
| | | | Shares | | | Amount | | | Shares | | | Amount | | | Shares | | | Amount | | | Shares | | | Amount | |
| VRDP Shares issued: | | | | | | | | | | | | | | | | | | | | | | | | | |
| Series 1 | | | — | | $ | — | | | 427 | | $ | 42,700,000 | | | — | | $ | — | | | 740 | | $ | 74,000,000 | |
| | | Notes to |
| | | Financial Statements (continued) |
| | | California Dividend Advantage (NAC) | | Insured California Dividend Advantage (NKL) | |
| | | Year Ended 2/29/12 | | Year Ended 2/28/11 | | Year Ended 2/29/12 | | Year Ended 2/28/11 | |
| | | | Shares | | | Amount | | | Shares | | | Amount | | | Shares | | | Amount | | | Shares | | | Amount | |
| VRDP Shares issued: | | | | | | | | | | | | | | | | | | | | | | | | | |
| Series 1 | | | 1,362 | | $ | 136,200,000 | | | — | | $ | — | | | 1,044 | | $ | 104,400,000 | | | — | | $ | — | |
5. Investment Transactions
Purchases and sales (including maturities but excluding short-term investments and derivative transactions, where applicable) during the fiscal year ended February 29, 2012, were as follows:
| | | | | | | | | | | | | | |
| | | | Insured | | | Insured | | | | | | | |
| | | | California | | | California | | | California | | | California | |
| | | | Premium | | | Premium | | | Premium | | | Dividend | |
| | | | Income | | | Income 2 | | | Income | | | Advantage | |
| | | | (NPC | ) | | (NCL | ) | | (NCU | ) | | (NAC | ) |
| Purchases | | $ | 12,983,889 | | $ | 12,024,117 | | $ | 16,847,836 | | $ | 62,499,012 | |
| Sales and maturities | | | 18,528,716 | | | 16,165,459 | | | 19,281,830 | | | 64,252,705 | |
| | | | | | | | | | Insured | | | Insured | |
| | | | California | | | California | | | California | | | California | |
| | | | Dividend | | | Dividend | | | Dividend | | | Tax-Free | |
| | | | Advantage 2 | | | Advantage 3 | | | Advantage | | | Advantage | |
| | | | (NVX | ) | | (NZH | ) | | (NKL | ) | | (NKX | ) |
| Purchases | | $ | 36,098,754 | | $ | 81,633,691 | | $ | 43,559,316 | | $ | 7,965,183 | |
| Sales and maturities | | | 38,147,419 | | | 83,209,836 | | | 46,057,683 | | | 7,893,115 | |
6. Income Tax Information
The following information is presented on an income tax basis. Differences between amounts for financial statement and federal income tax purposes are primarily due to timing differences in recognizing taxable market discount, timing differences in recognizing certain gains and losses on investment transactions and the treatment of investments in inverse floating rate securities reflected as financing transactions, if any. To the extent that differences arise that are permanent in nature, such amounts are reclassified within the capital accounts as detailed below. Temporary differences do not require reclassification. Temporary and permanent differences do not impact the net asset values of the Funds.
At February 29, 2012, the cost and unrealized appreciation (depreciation) of investments (excluding investments in derivatives), as determined on a federal income tax basis, were as follows:
| | | | | | | | | | | | | | |
| | | | Insured | | | Insured | | | | | | | |
| | | | California | | | California | | | California | | | California | |
| | | | Premium | | | Premium | | | Premium | | | Dividend | |
| | | | Income | | | Income 2 | | | Income | | | Advantage | |
| | | | (NPC | ) | | (NCL | ) | | (NCU | ) | | (NAC | ) |
| Cost of investments | | $ | 126,528,290 | | $ | 245,024,969 | | $ | 108,875,141 | | $ | 455,349,270 | |
| Gross unrealized: | | | | | | | | | | | | | |
| Appreciation | | $ | 11,907,834 | | $ | 17,458,674 | | $ | 10,350,251 | | $ | 39,816,855 | |
| Depreciation | | | (387,998 | ) | | (338,616 | ) | | (586,753 | ) | | (13,189,771 | ) |
| Net unrealized appreciation (depreciation) of investments | | $ | 11,519,836 | | $ | 17,120,058 | | $ | 9,763,498 | | $ | 26,627,084 | |
| | | | | | | | | | Insured | | | Insured | |
| | | | California | | | California | | | California | | | California | |
| | | | Dividend | | | Dividend | | | Dividend | | | Tax-Free | |
| | | | Advantage 2 | | | Advantage 3 | | | Advantage | | | Advantage | |
| | | | (NVX | ) | | (NZH | ) | | (NKL | ) | | (NKX | ) |
| Cost of investments | | $ | 300,581,480 | | $ | 463,612,399 | | $ | 320,549,062 | | $ | 116,755,749 | |
| Gross unrealized: | | | | | | | | | | | | | |
| Appreciation | | $ | 24,871,158 | | $ | 30,783,299 | | $ | 27,128,588 | | $ | 6,269,924 | |
| Depreciation | | | (7,115,399 | ) | | (10,134,576 | ) | | (4,160,520 | ) | | (2,523,009 | ) |
| Net unrealized appreciation (depreciation) of investments | | $ | 17,755,759 | | $ | 20,648,723 | | $ | 22,968,068 | | $ | 3,746,915 | |
Permanent differences, primarily due to expiration of capital loss carryforwards, federal taxes paid, taxable market discount, nondeductible offering costs and nondeductible reorganization expenses, resulted in reclassifications among the Funds’ components of Common share net assets at February 29, 2012, the Funds’ tax year end, as follows:
| | | | | | | | | | | | | | |
| | | | Insured | | | Insured | | | | | | | |
| | | | California | | | California | | | California | | | California | |
| | | | Premium | | | Premium | | | Premium | | | Dividend | |
| | | | Income | | | Income 2 | | | Income | | | Advantage | |
| | | | (NPC | ) | | (NCL | ) | | (NCU | ) | | (NAC | ) |
| Paid-in-surplus | | $ | (394,792 | ) | $ | (313,044 | ) | $ | (168,169 | ) | $ | (12,769 | ) |
| Undistributed (Over-distribution of) net investment income | | | 326,653 | | | 303,083 | | | 163,997 | | | (69,999 | ) |
| Accumulated net realized gain (loss) | | | 68,139 | | | 9,961 | | | 4,172 | | | 82,768 | |
| | | | | | | | | | Insured | | | Insured | |
| | | | California | | | California | | | California | | | California | |
| | | | Dividend | | | Dividend | | | Dividend | | | Tax-Free | |
| | | | Advantage 2 | | | Advantage 3 | | | Advantage | | | Advantage | |
| | | | (NVX | ) | | (NZH | ) | | (NKL | ) | | (NKX | ) |
| Paid-in-surplus | | $ | (490,135 | ) | $ | (1,066,267 | ) | $ | (29,745 | ) | $ | (152,353 | ) |
| Undistributed (Over-distribution of) net investment income | | | 487,003 | | | 730,602 | | | (53,141 | ) | | 148,013 | |
| Accumulated net realized gain (loss) | | | 3,132 | | | 335,665 | | | 82,886 | | | 4,340 | |
The tax components of undistributed net tax-exempt income, net ordinary income and net long-term capital gains at February 29, 2012, the Funds’ tax year end, were as follows:
| | | | | | | | | | | | | | |
| | | | Insured | | | Insured | | | | | | | |
| | | | California | | | California | | | California | | | California | |
| | | | Premium | | | Premium | | | Premium | | | Dividend | |
| | | | Income | | | Income 2 | | | Income | | | Advantage | |
| | | | (NPC | ) | | (NCL | ) | | (NCU | ) | | (NAC | ) |
| Undistributed net tax-exempt income * | | $ | 1,963,940 | | $ | 3,870,061 | | $ | 1,798,508 | | $ | 8,081,307 | |
| Undistributed net ordinary income ** | | | — | | | 7,581 | | | — | | | 49,220 | |
| Undistributed net long-term capital gains | | | 490,487 | | | — | | | — | | | — | |
| | | | | | | | | | Insured | | | Insured | |
| | | | California | | | California | | | California | | | California | |
| | | | Dividend | | | Dividend | | | Dividend | | | Tax-Free | |
| | | | Advantage 2 | | | Advantage 3 | | | Advantage | | | Advantage | |
| | | | (NVX | ) | | (NZH | ) | | (NKL | ) | | (NKX | ) |
| Undistributed net tax-exempt income * | | $ | 4,680,509 | | $ | 4,535,787 | | $ | 5,438,634 | | $ | 1,584,639 | |
| Undistributed net ordinary income ** | | | 50,953 | | | 50,691 | | | — | | | — | |
| Undistributed net long-term capital gains | | | — | | | — | | | 394,520 | | | — | |
| * | Undistributed net tax-exempt income (on a tax basis) has not been reduced for the dividend declared on February 1, 2012, paid on March 1, 2012. |
| ** | Net ordinary income consists of taxable market discount income and net short-term capital gains, if any. |
| | | Notes to |
| | | Financial Statements (continued) |
The tax character of distributions paid during the Funds’ tax years ended February 29, 2012 and February 28, 2011, was designated for purposes of the dividends paid deduction as follows:
| | | | | | | | | | | | | | |
| | | | Insured | | | Insured | | | | | | | |
| | | | California | | | California | | | California | | | California | |
| | | | Premium | | | Premium | | | Premium | | | Dividend | |
| | | | Income | | | Income 2 | | | Income | | | Advantage | |
| 2012 | | | (NPC | ) | | (NCL | ) | | (NCU | ) | | (NAC | ) |
| Distributions from net tax-exempt income*** | | $ | 5,740,015 | | $ | 11,401,551 | | $ | 5,690,713 | | $ | 21,712,743 | |
| Distributions from net ordinary income ** | | | 154,979 | | | 149,438 | | | — | | | 105,661 | |
| Distributions from net long-term capital gains**** | | | 502,357 | | | — | | | — | | | — | |
| | | | | | | | | | Insured | | | Insured | |
| | | | California | | | California | | | California | | | California | |
| | | | Dividend | | | Dividend | | | Dividend | | | Tax-Free | |
| | | | Advantage 2 | | | Advantage 3 | | | Advantage | | | Advantage | |
| 2012 | | | (NVX | ) | | (NZH | ) | | (NKL | ) | | (NKX | ) |
| Distributions from net tax-exempt income*** | | $ | 16,164,056 | | $ | 25,521,629 | | $ | 15,045,390 | | $ | 4,948,448 | |
| Distributions from net ordinary income ** | | | — | | | — | | | 80,899 | | | — | |
| Distributions from net long-term capital gains**** | | | — | | | — | | | — | | | — | |
| | | | Insured | | | Insured | | | | | | | |
| | | | California | | | California | | | California | | | California | |
| | | | Premium | | | Premium | | | Premium | | | Dividend | |
| | | | Income | | | Income 2 | | | Income | | | Advantage | |
| 2011 | | | (NPC | ) | | (NCL | ) | | (NCU | ) | | (NAC | ) |
| Distributions from net tax-exempt income | | $ | 5,686,773 | | $ | 11,251,372 | | $ | 5,256,853 | | $ | 21,325,264 | |
| Distributions from net ordinary income ** | | | — | | | — | | | — | | | — | |
| Distributions from net long-term capital gains | | | 180,380 | | | — | | | — | | | — | |
| | | | | | | | | | Insured | | | Insured | |
| | | | California | | | California | | | California | | | California | |
| | | | Dividend | | | Dividend | | | Dividend | | | Tax-Free | |
| | | | Advantage 2 | | | Advantage 3 | | | Advantage | | | Advantage | |
| 2011 | | | (NVX | ) | | (NZH | ) | | (NKL | ) | | (NKX | ) |
| Distributions from net tax-exempt income | | $ | 14,738,103 | | $ | 24,545,542 | | $ | 14,593,850 | | $ | 4,850,289 | |
| Distributions from net ordinary income ** | | | — | | | — | | | — | | | — | |
| Distributions from net long-term capital gains | | | — | | | — | | | — | | | — | |
| ** | Net ordinary income consists of taxable market discount income and net short-term capital gains, if any. |
| *** | The Funds hereby designate these amounts paid during the fiscal year ended February 29, 2012, as Exempt Interest Dividends. |
| **** | The Funds designated as a long-term capital gain dividend, pursuant to the Internal Revenue Code Section 852(b)(3), the amount necessary to reduce earnings and profits of the Funds related to net capital gain to zero for the tax year ended February 29, 2012. |
At February 29, 2012, the Funds’ tax year end, the following Funds had unused capital loss carryforwards available for federal income tax purposes to be applied against future capital gains, if any. If not applied, the carryforwards will expire as follows:
| | | | | | | | | | | | | | | | | | | | |
| | | | Insured | | | | | | | | | | | | | | | Insured | |
| | | | California | | | California | | | California | | | California | | | California | | | California | |
| | | | Premium | | | Premium | | | Dividend | | | Dividend | | | Dividend | | | Tax-Free | |
| | | | Income 2 | | | Income | | | Advantage | | | Advantage 2 | | | Advantage 3 | | | Advantage | |
| | | | (NCL | ) | | (NCU | ) | | (NAC | ) | | (NVX | ) | | (NZH | ) | | (NKX | ) |
| Expiration: | | | | | | | | | | | | | | | | | | | |
| February 29, 2016 | | $ | — | | $ | — | | $ | — | | $ | — | | $ | 3,869,938 | | $ | — | |
| February 28, 2017 | | | — | | | 59,969 | | | 10,106,897 | | | — | | | 4,536,999 | | | 451,000 | |
| February 28, 2018 | | | 1,035,810 | | | 881,108 | | | 731,149 | | | 705,843 | | | 10,646,251 | | | 530,894 | |
| February 28, 2019 | | | — | | | — | | | — | | | — | | | 1,340,157 | | | — | |
| Total | | $ | 1,035,810 | | $ | 941,077 | | $ | 10,838,046 | | $ | 705,843 | | $ | 20,393,345 | | $ | 981,894 | |
During the Funds’ tax year ended February 29, 2012, the following Funds utilized capital loss carryforwards as follows:
| | | Insured California Premium Income 2 (NCL | ) | Insured California Dividend Advantage (NKL | ) | Insured California Tax-Free Advantage (NKX | ) |
| Utilized capital loss carryforwards | | $ | 408,471 | | $ | 1,350,995 | | $ | 34,298 | |
At February 29, 2012, the Funds’ tax year end, $323,840 of California Dividend Advantage 3’s (NZH) capital loss carryforward expired.
On December 22, 2010, the Regulated Investment Company Modernization Act of 2010 (the “Act”) was enacted, which changed various technical rules governing the tax treatment of RICs. The changes are generally effective for taxable years beginning after the date of enactment. One of the more prominent changes addresses capital loss carryforwards. Under the Act, each Fund will be permitted to carry forward capital losses incurred in taxable years beginning after the date of enactment for an unlimited period. However, any losses incurred during those future taxable years will be required to be utilized prior to the losses incurred in pre-enactment taxable years, which carry an expiration date. As a result of this ordering rule, pre-enactment capital loss carryforwards may be more likely to expire unused. Additionally, post-enactment capital loss carryforwards will retain their character as either short-term or long-term capital losses rather than being considered all short-term as permitted under previous regulation.
The Act also contains several provisions aimed at preserving the character of distributions made by a fiscal year RIC during the portion of its taxable year ending after October 31 or December 31, reducing the circumstances under which a RIC might be required to file amended Forms 1099 to restate previously reported distributions. Capital losses incurred that will be carried forward under the provisions of the Act are as follows:
| | | California Premium Income (NCU | ) | California Dividend Advantage (NAC | ) | California Dividend Advantage 2 (NVX | ) | California Dividend Advantage 3 (NZH | ) |
| Post-enactment losses | | | | | | | | | | | | | |
| Short-term | | $ | — | | $ | — | | $ | — | | $ | — | |
| Long-term | | | 1,569 | | | 5,081,879 | | | 345,491 | | | 1,853,006 | |
The Funds have elected to defer losses incurred from November 1, 2011 through February 29, 2012, the Funds’ tax year end, in accordance with federal income tax rules. These losses are treated as having arisen on the first day of the following fiscal year. The following Funds have elected to defer losses as follows:
| | | California Premium Income (NCU | ) | California Dividend Advantage (NAC | ) | California Dividend Advantage 2 (NVX | ) | California Dividend Advantage 3 (NZH | ) |
| Post-October capital losses | | $ | 72,731 | | $ | 2,438,655 | | $ | 808,072 | | $ | 3,922,013 | |
| Late-year ordinary losses | | | — | | | — | | | — | | | — | |
7. Management Fees and Other Transactions with Affiliates
Each Fund’s management fee consists of two components – a fund-level fee, based only on the amount of assets within the Fund, and a complex-level fee, based on the aggregate amount of all eligible fund assets managed by the Adviser. This pricing structure enables Fund shareholders to benefit from growth in the assets within their respective Fund as well as from growth in the amount of complex-wide assets managed by the Adviser.
| | | Notes to |
| | | Financial Statements (continued) |
The annual fund-level fee for each Fund, payable monthly, is calculated according to the following schedules:
| | | Insured California Premium Income (NPC | ) |
| | | Insured California Premium Income 2 (NCL | ) |
| | | California Premium Income (NCU | ) |
| Average Daily Managed Assets* | | Fund-Level Fee Rate | |
| For the first $125 million | | | .4500 | % |
| For the next $125 million | | | .4375 | |
| For the next $250 million | | | .4250 | |
| For the next $500 million | | | .4125 | |
| For the next $1 billion | | | .4000 | |
| For the next $3 billion | | | .3875 | |
| For managed assets over $5 billion | | | .3750 | |
| | | California Dividend Advantage (NAC | ) |
| | | California Dividend Advantage 2 (NVX | ) |
| | | California Dividend Advantage 3 (NZH | ) |
| | | Insured California Dividend Advantage (NKL | ) |
| | | Insured California Tax-Free Advantage (NKX | ) |
| Average Daily Managed Assets* | | Fund-Level Fee Rate | |
| For the first $125 million | | | .4500 | % |
| For the next $125 million | | | .4375 | |
| For the next $250 million | | | .4250 | |
| For the next $500 million | | | .4125 | |
| For the next $1 billion | | | .4000 | |
| For managed assets over $2 billion | | | .3750 | |
The annual complex-level fee for each Fund, payable monthly, is calculated according to the following schedule:
| Complex-Level Managed Asset Breakpoint Level* | | Effective Rate at Breakpoint Level | |
| $55 billion | | | .2000 | % |
| $56 billion | | | .1996 | |
| $57 billion | | | .1989 | |
| $60 billion | | | .1961 | |
| $63 billion | | | .1931 | |
| $66 billion | | | .1900 | |
| $71 billion | | | .1851 | |
| $76 billion | | | .1806 | |
| $80 billion | | | .1773 | |
| $91 billion | | | .1691 | |
| $125 billion | | | .1599 | |
| $200 billion | | | .1505 | |
| $250 billion | | | .1469 | |
| $300 billion | | | .1445 | |
| * | For the fund-level and complex-level fees, managed assets include closed-end fund assets managed by the Adviser that are attributable to financial leverage. For these purposes, financial leverage includes the funds’ use of preferred stock and borrowings and certain investments in the residual interest certificates (also called inverse floating rate securities) in tender option bond (TOB) trusts, including the portion of assets held by a TOB trust that has been effectively financed by the trust’s issuance of floating rate securities, subject to an agreement by the Adviser as to certain funds to limit the amount of such assets for determining managed assets in certain circumstances. The complex-level fee is calculated based upon the aggregate daily managed assets of all Nuveen Funds that constitute “eligible assets.” Eligible assets do not include assets attributable to investments in other Nuveen Funds and assets in excess of $2 billion added to the Nuveen Fund complex in connection with the Adviser’s assumption of the management of the former First American Funds effective January 1, 2011. As of February 29, 2012, the complex-level fee rate for these Funds was .1724%. |
The management fee compensates the Adviser for overall investment advisory and administrative services and general office facilities. The Adviser is responsible for each Fund’s overall investment strategy and asset allocation decisions. The Adviser has entered into sub-advisory agreements with Nuveen Asset Management, LLC (the “Sub-Adviser”), a wholly-owned subsidiary of the Adviser, under which the Sub-Adviser manages the investment portfolios of the Funds. The Sub-Adviser is compensated for its services to the Funds from the management fees paid to the Adviser.
The Funds pay no compensation directly to those of its directors/trustees who are affiliated with the Adviser or to its officers, all of whom receive remuneration for their services to the Funds from the Adviser or its affiliates. The Board of Directors/Trustees has adopted a deferred compensation plan for independent directors/trustees that enables directors/trustees to elect to defer receipt of all or a portion of the annual compensation they are entitled to receive from certain Nuveen-advised funds. Under the plan, deferred amounts are treated as though equal dollar amounts had been invested in shares of select Nuveen-advised funds.
For the first ten years of California Dividend Advantage 2’s (NVX) operations, the Adviser has agreed to reimburse the Fund, as a percentage of average daily managed assets, for fees and expenses in the amounts and for the time periods set forth below:
Year Ending March 31, | | | Year Ending March 31, | | |
| 2001* | .30 | % | 2007 | .25 | % |
| 2002 | .30 | | 2008 | .20 | |
| 2003 | .30 | | 2009 | .15 | |
| 2004 | .30 | | 2010 | .10 | |
| 2005 | .30 | | 2011 | .05 | |
| 2006 | .30 | | | | |
* From the commencement of operations.
The Adviser has not agreed to reimburse California Dividend Advantage 2 (NVX) for any portion of its fees and expenses beyond March 31, 2011. For the first ten years of California Dividend Advantage 3’s (NZH) operations, the Adviser has agreed to reimburse the Fund, as a percentage of average daily managed assets, for fees and expenses in the amounts and for the time periods set forth below:
Year Ending September 30, | | | Year Ending September 30, | | |
| 2001* | .30 | % | 2007 | .25 | % |
| 2002 | .30 | | 2008 | .20 | |
| 2003 | .30 | | 2009 | .15 | |
| 2004 | .30 | | 2010 | .10 | |
| 2005 | .30 | | 2011 | .05 | |
| 2006 | .30 | | | | |
* From the commencement of operations.
The Adviser has not agreed to reimburse California Dividend Advantage 3 (NZH) for any portion of its fees and expenses beyond September 30, 2011.
For the first ten years of Insured California Dividend Advantage’s (NKL) operations, the Adviser has agreed to reimburse the Fund, as a percentage of average daily managed assets, for fees and expenses in the amounts and for the time periods set forth below:
Year Ending March 31, | | | Year Ending March 31, | | |
| 2002* | .30 | % | 2008 | .25 | % |
| 2003 | .30 | | 2009 | .20 | |
| 2004 | .30 | | 2010 | .15 | |
| 2005 | .30 | | 2011 | .10 | |
| 2006 | .30 | | 2012 | .05 | |
| 2007 | .30 | | | | |
* From the commencement of operations.
The Adviser has not agreed to reimburse Insured California Dividend Advantage (NKL) for any portion of its fees and expenses beyond March 31, 2012.
| | | |
| | Notes to |
| | Financial Statements (continued) |
8. New Accounting Pronouncements
Fair Value Measurements and Disclosures
On May 12, 2011, the Financial Accounting Standards Board (“FASB”) issued an Accounting Standards Update (“ASU”) No. 2011-04 (“ASU No. 2011-04”) modifying Topic 820, Fair Value Measurements and Disclosures. At the same time, the International Accounting Standards Board (“IASB”) issued International Financial Reporting Standard (“IFRS”) 13, Fair Value Measurement. The objective of the FASB and IASB is convergence of their guidance on fair value measurements and disclosures. Specifically, ASU No. 2011-04 requires reporting entities to disclose i) the amounts of any transfers between Level 1 and Level 2 and the reasons for the transfers and ii) for Level 3 fair value measurements, a) quantitative information about significant unobservable inputs used, b) a description of the valuation processes used by the reporting entity and c) a narrative description of the sensitivity of the fair value measurement to changes in unobservable inputs if a change in those inputs might result in a significantly higher or lower fair value measurement. The effective date of ASU No. 2011-04 is for interim and annual periods beginning after December 15, 2011. At this time, management is evaluating the implications of this guidance and the impact it will have to the financial statement amounts and footnote disclosures, if any.
Board Members & Officers (Unaudited)
| | | The management of the Funds, including general supervision of the duties performed for the Funds by the Adviser, is the responsibility of the board members of the Funds. The number of board members of the Funds is currently set at ten. None of the board members who are not “interested” persons of the Funds (referred to herein as “independent board members”) has ever been a director or employee of, or consultant to, Nuveen or its affiliates. The names and business addresses of the board members and officers of the Funds, their principal occupations and other affiliations during the past five years, the number of portfolios each oversees and other directorships they hold are set forth below. |
| | Name, Birthdate & Address | | Position(s) Held with the Funds | | Year First Elected or Appointed and Term(1) | | Principal Occupation(s) including other Directorships During Past 5 Years | | Number of Portfolios in Fund Complex Overseen by Board Member |
| | | | | | | | | | |
| Independent Board Members: | | | | | | |
| | | | | | | | | | |
| ■ | ROBERT P. BREMNER 8/22/40 333 W. Wacker Drive Chicago, IL 60606 | | Chairman of the Board and Board Member | | 1996 Class III | | Private Investor and Management Consultant; Treasurer and Director, Humanities Council of Washington, D.C.; Board Member, Independent Directors Council affiliated with the Investment Company Institute. | | 235 |
| | | | | | | | | | |
| ■ | JACK B. EVANS 10/22/48 333 W. Wacker Drive Chicago, IL 60606 | | Board Member | | 1999 Class III | | President, The Hall-Perrine Foundation, a private philanthropic corporation (since 1996); Director and Chairman, United Fire Group, a publicly held company; member of the Board of Regents for the State of Iowa University System; Director, Source Media Group; Life Trustee of Coe College and the Iowa College Foundation; formerly, Director, Alliant Energy; formerly, Director, Federal Reserve Bank of Chicago; formerly, President and Chief Operating Officer, SCI Financial Group, Inc., a regional financial services firm. | | 235 |
| | | | | | | | | | |
| ■ | WILLIAM C. HUNTER 3/6/48 333 W. Wacker Drive Chicago, IL 60606 | | Board Member | | 2004 Class I | | Dean, Tippie College of Business, University of Iowa (since 2006); Director (since 2004) of Xerox Corporation; Director (since 2005), Beta Gamma Sigma International Honor Society; Director of Wellmark, Inc. (since 2009); formerly, Dean and Distinguished Professor of Finance, School of Business at the University of Connecticut (2003-2006); previously, Senior Vice President and Director of Research at the Federal Reserve Bank of Chicago (1995-2003); formerly, Director (1997-2007), Credit Research Center at Georgetown University. | | 235 |
| | | | | | | | | | |
| ■ | DAVID J. KUNDERT 10/28/42 333 W. Wacker Drive Chicago, IL 60606 | | Board Member | | 2005 Class II | | Director, Northwestern Mutual Wealth Management Company; retired (since 2004) as Chairman, JPMorgan Fleming Asset Management, President and CEO, Banc One Investment Advisors Corporation, and President, One Group Mutual Funds; prior thereto, Executive Vice President, Banc One Corporation and Chairman and CEO, Banc One Investment Management Group; Member, Board of Regents, Luther College; member of the Wisconsin Bar Association; member of Board of Directors, Friends of Boerner Botanical Gardens; member of Board of Directors and Chair of Investment Committee, Greater Milwaukee Foundation. | | 235 |
| | | | | | | | | | |
| ■ | WILLIAM J. SCHNEIDER 9/24/44 333 W. Wacker Drive Chicago, IL 60606 | | Board Member | | 1996 Class III | | Chairman of Miller-Valentine Partners Ltd., a real estate investment company; formerly, Senior Partner and Chief Operating Officer(retired 2004) of Miller-Valentine Group; member, University of Dayton Business School Advisory Council; member, Mid-America Health System Board; formerly, member and chair, Dayton Philharmonic Orchestra Association; formerly, member, Business Advisory Council, Cleveland Federal Reserve Bank. | | 235 |
Board Members & Officers (Unaudited) (continued)
| | | | | | | | | | |
| | Name, Birthdate & Address | | Position(s) Held with the Funds | | Year First Elected or Appointed and Term(1) | | Principal Occupation(s) Including other Directorships During Past 5 Years | | Number of Portfolios in Fund Complex Overseen by Board Member |
| | | | | | | | | | |
| Independent Board Members: | | | | | | |
| | | | | | | |
| ■ | JUDITH M. STOCKDALE 12/29/47 333 W. Wacker Drive Chicago, IL 60606 | | Board Member | | 1997 Class I | | Executive Director, Gaylord and Dorothy Donnelley Foundation (since 1994); prior thereto, Executive Director, Great Lakes Protection Fund (1990-1994). | | 235 |
| | | | | | | | | | |
| ■ | CAROLE E. STONE 6/28/47 333 W. Wacker Drive Chicago, IL 60606 | | Board Member | | 2007 Class I | | Director, Chicago Board Options Exchange (since 2006); Director, C2 Options Exchange, Incorporated (since 2009); formerly, Commissioner, New York State Commission on Public Authority Reform (2005-2010); formerly, Chair, New York Racing Association Oversight Board (2005-2007). | | 235 |
| | | | | | | | | | |
| ■ | VIRGINIA L. STRINGER 8/16/44 333 W. Wacker Drive Chicago, IL 60606 | | Board Member | | 2011 | | Board Member, Mutual Fund Directors Forum; Member, Governing Board, Investment Company Institute’s Independent Directors Council; governance consultant and non-profit board member; former Owner and President, Strategic Management Resources, Inc. a management consulting firm; previously, held several executive positions in general management, marketing and human resources at IBM and The Pillsbury Company; Independent Director, First American Fund Complex (1987-2010) and Chair (1997-2010). | | 235 |
| | | | | | | | | | |
| ■ | TERENCE J. TOTH 9/29/59 333 W. Wacker Drive Chicago, IL 60606 | | Board Member | | 2008 Class II | | Director, Legal & General Investment Management America, Inc. (since 2008); Managing Partner, Promus Capital (since 2008);formerly, CEO and President, Northern Trust Global Investments (2004-2007); Executive Vice President, Quantitative Management & Securities Lending (2000-2004); prior thereto, various positions with Northern Trust Company (since 1994); member: Goodman Theatre Board (since 2004), Chicago Fellowship Board (since 2005) and Catalyst Schools of Chicago Board (since 2008); formerly, member: Northern Trust Mutual Funds Board (2005-2007),Northern Trust Global Investments Board (2004-2007), Northern Trust Japan Board (2004-2007), Northern Trust Securities Inc. Board (2003-2007) and Northern Trust Hong Kong Board (1997-2004). | | 235 |
| | | | | | | | | | |
| Interested Board Member: | | | | | | |
| | | | | | | | | | |
| ■ | JOHN P. AMBOIAN(2) 6/14/61 333 W. Wacker Drive Chicago, IL 60606 | | Board Member | | 2008 Class II | | Chief Executive Officer and Chairman (since 2007) and Director (since 1999) of Nuveen Investments, Inc., formerly, President (1999-2007);Chief Executive Officer (since 2007) of Nuveen Investments Advisers, Inc.; Director (since 1998) formerly, Chief Executive Officer (2007-2010) of Nuveen Fund Advisors, Inc. | | 235 |
| | Name, Birthdate and Address | | Position(s) Held with the Funds | | Year First Elected or Appointed(3) | | Principal Occupation(s) During Past 5 Years | | Number of Portfolios in Fund Complex Overseen by Officer |
| | | | | | | | | | |
| Officers of the Funds: | | | | | | | | |
| | | | | | | | | |
| ■ | GIFFORD R. ZIMMERMAN 9/9/56 333 W. Wacker Drive Chicago, IL 60606 | | Chief Administrative Officer | | 1988 | | Managing Director (since 2002), Assistant Secretary and Associate General Counsel of Nuveen Securities, LLC; Managing Director (since 2004) and Assistant Secretary (since 1994) of Nuveen Investments, Inc.; Managing Director (since 2002), Assistant Secretary (since 1997) and Co-General Counsel (since 2011) of Nuveen Fund Advisors, Inc.; Managing Director, Assistant Secretary and Associate General Counsel of Nuveen Asset Management, LLC (since 2011);Managing Director, Associate General Counsel and Assistant Secretary, of Symphony Asset Management LLC (since 2003); Vice President and Assistant Secretary of NWQ Investment Management Company, LLC (since 2002), Nuveen Investments Advisers Inc. (since 2002),Santa Barbara Asset Management, LLC (since 2006), and of Winslow Capital Management Inc. (since 2010) Chief Administrative Officer and Chief Compliance Officer (since 2010) of Nuveen Commodities Asset Management, LLC; Chartered Financial Analyst. | | 235 |
| | | | | | | | | | |
| ■ | WILLIAM ADAMS IV 6/9/55 333 W. Wacker Drive Chicago, IL 60606 | | Vice President | | 2007 | | Senior Executive Vice President, Global Structured Products (since 2010), formerly, Executive Vice President (1999-2010) of Nuveen Securities, LLC; Co-President of Nuveen Fund Advisors, Inc. (since 2011); formerly, Managing Director (2010-2011) of Nuveen Commodities Asset Management, LLC. | | 133 |
| | | | | | | | | | |
| ■ | CEDRIC H. ANTOSIEWICZ 1/11/62 333 W. Wacker Drive Chicago, IL 60606 | | Vice President | | 2007 | | Managing Director of Nuveen Securities, LLC. | | 133 |
| | | | | | | | | | |
| ■ | MARGO L. COOK 4/11/64 333 W. Wacker Drive Chicago, IL 60606 | | Vice President | | 2009 | | Executive Vice President (since 2008) of Nuveen Investments, Inc. and of Nuveen Fund Advisors, Inc. (since 2011); Managing Director-Investment Services of Nuveen Commodities Asset Management, LLC (since August 2011), previously, Head of Institutional Asset Management (2007-2008) of Bear Stearns Asset Management; Head of Institutional Asset Management (1986-2007)of Bank of NY Mellon; Chartered Financial Analyst. | | 235 |
| | | | | | | | | | |
| ■ | LORNA C. FERGUSON 10/24/45 333 W. Wacker Drive Chicago, IL 60606 | | Vice President | | 1998 | | Managing Director (since 2005) of Nuveen Fund Advisors, Inc. and Nuveen Securities, LLC (since 2004). | | 235 |
| | | | | | | | | | |
| ■ | STEPHEN D. FOY 5/31/54 333 W. Wacker Drive Chicago, IL 60606 | | Vice President and Controller | | 1998 | | Senior Vice President (since 2010), formerly, Vice President (2005-2010) and Funds Controller of Nuveen Securities, LLC; Vice President of Nuveen Fund Advisors, Inc.; Chief Financial Officer of Nuveen Commodities Asset Management, LLC; (since 2010) Certified Public Accountant. | | 235 |
Board Members & Officers (Unaudited) (continued)
| | | | | | | | | | |
| | Name, Birthdate and Address | | Position(s) Held with the Funds | | Year First Elected or Appointed(3) | | Principal Occupation(s) During Past 5 Years | | Number of Portfolios in Fund Complex Overseen by Officer |
| | | | | | | | | | |
| Officers of the Funds: | | | | | | |
| | | | | | | |
| ■ | SCOTT S. GRACE 8/20/70 333 W. Wacker Drive Chicago, IL 60606 | | Vice President and Treasurer | | 2009 | | Managing Director, Corporate Finance & Development, Treasurer (since 2009) of Nuveen Securities, LLC; Managing Director and Treasurer (since 2009) of Nuveen Fund Advisors, Inc., Nuveen Investment Solutions, Inc., Nuveen Investments Advisers, Inc., Nuveen Investments Holdings Inc. and (since 2011) Nuveen Asset Management, LLC; Vice President and Treasurer of NWQ Investment Management Company, LLC, Tradewinds Global Investors, LLC, Symphony Asset Management LLC and Winslow Capital Management, Inc.; Vice President of Santa Barbara Asset Management, LLC; formerly, Treasurer (2006-2009), Senior Vice President (2008-2009), previously, Vice President (2006-2008) of Janus Capital Group, Inc.; formerly, Senior Associate in Morgan Stanley’s Global Financial Services Group (2000-2003); Chartered Accountant Designation. | | 235 |
| | | | | | | | | | |
| ■ | WALTER M. KELLY 2/24/70 333 W. Wacker Drive Chicago, IL 60606 | | Chief Compliance Officer and Vice President | | 2003 | | Senior Vice President (since 2008) and Assistant Secretary (since 2003) of Nuveen Fund Advisors, Inc. | | 235 |
| | | | | | | | | | |
| ■ | TINA M. LAZAR 8/27/61 333 W. Wacker Drive Chicago, IL 60606 | | Vice President | | 2002 | | Senior Vice President (since 2010), formerly, Vice President (2005-2010) of Nuveen Fund Advisors, Inc. | | 235 |
| | | | | | | | | | |
| ■ | KEVIN J. MCCARTHY 3/26/66 333 W. Wacker Drive Chicago, IL 60606 | | Vice President and Secretary | | 2007 | | Managing Director (since 2008), formerly, Vice President (2007-2008), Nuveen Securities, LLC; Managing Director (since 2008), Assistant Secretary (since 2007) and Co-General Counsel (since 2011)of Nuveen Fund Advisors, Inc.; Managing Director, Assistant Secretary and Associate General Counsel (since 2011) of Nuveen Asset Management, LLC; Managing Director (since 2008), and Assistant Secretary, Nuveen Investment Holdings, Inc.; Vice President (since 2007) and Assistant Secretary of Nuveen Investments Advisers Inc., NWQ Investment Management Company, LLC, NWQ Holdings, LLC, Symphony Asset Management LLC, Santa Barbara Asset Management, LLC, and of Winslow Capital Management, Inc. (since 2010); Vice President and Secretary (since 2010) of Nuveen Commodities Asset Management, LLC; prior thereto, Partner, Bell, Boyd & Lloyd LLP (1997-2007). | | 235 |
| | Name, Birthdate and Address | | Position(s) Held with the Funds | | Year First Elected or Appointed(3) | | Principal Occupation(s) During Past 5 Years | | Number of Portfolios in Fund Complex Overseen by Officer |
| | | | | | | | | | |
| Officers of the Funds: | | | | | | |
| | | | | | | |
| ■ | KATHLEEN L. PRUDHOMME 3/30/53 901 Marquette Avenue Minneapolis, MN 55402 | | Vice President and Assistant Secretary | | 2011 | | Managing Director, Assistant Secretary and Co-General Counsel (since 2011) of Nuveen Fund Advisors, Inc.; Managing Director, Assistant Secretary and Associate General Counsel (since 2011) of Nuveen Asset Management, LLC; Managing Director and Assistant Secretary (since 2011) of Nuveen Securities, LLC; formerly, Deputy General Counsel, FAF Advisors, Inc. (2004-2010). | | 235 |
| (1) | For California Premium Income (NCU), California Dividend Advantage (NAC), California Dividend Advantage 2 (NVX), California Dividend Advantage 3 (NZH), Insured California Dividend Advantage (NKL) and Insured California Tax-Free Advantage (NKX), the Board of Trustees is divided into three classes, Class I, Class II, and Class III, with each being elected to serve until the third succeeding annual shareholders’ meeting subsequent to its election or thereafter in each case when its respective successors are duly elected or appointed, except two board members are elected by the holders of Preferred Shares to serve until the next annual shareholders’ meeting subsequent to its election or thereafter in each case when its respective successors are duly elected or appointed. For Insured California Premium Income (NPC) and Insured California Premium Income 2 (NCL), the Board Members serve a one year term to serve until the next annual meeting or until their successors shall have been duly elected and qualified. The year first elected or appointed represents the year in which the board member was first elected or appointed to any fund in the Nuveen Complex. |
| (2) | Mr. Amboian is an interested trustee because of his position with Nuveen Investments, Inc. and certain of its subsidiaries, which are affiliates of the Nuveen Funds. |
| (3) | Officers serve one year terms through August of each year. The year first elected or appointed represents the year in which the Officer was first elected or appointed to any fund in the Nuveen Complex. |
Reinvest Automatically,
Easily and Conveniently
Nuveen makes reinvesting easy. A phone call is all it takes to set up your reinvestment account.
Nuveen Closed-End Funds Automatic Reinvestment Plan
Your Nuveen Closed-End Fund allows you to conveniently reinvest distributions in additional Fund shares.
By choosing to reinvest, you’ll be able to invest money regularly and automatically, and watch your investment grow through the power of compounding. Just like distributions in cash, there may be times when income or capital gains taxes may be payable on distributions that are reinvested.
It is important to note that an automatic reinvestment plan does not ensure a profit, nor does it protect you against loss in a declining market.
Easy and convenient
To make recordkeeping easy and convenient, each month you’ll receive a statement showing your total distributions, the date of investment, the shares acquired and the price per share, and the total number of shares you own.
How shares are purchased
The shares you acquire by reinvesting will either be purchased on the open market or newly issued by the Fund. If the shares are trading at or above net asset value at the time of valuation, the Fund will issue new shares at the greater of the net asset value or 95% of the then-current market price. If the shares are trading at less than net asset value, shares for your account will be purchased on the open market. If the Plan Agent begins purchasing Fund shares on the open market while shares are trading below net asset value, but the Fund’s shares subsequently trade at or above their net asset value before the Plan Agent is able to complete its purchases, the Plan Agent may cease open-market purchases and may invest the uninvested portion of the distribution in newly-issued Fund shares at a price equal to the greater of the shares’ net asset value or 95% of the shares’ market value on the last business day immediately prior to the purchase date. Distributions received to purchase shares in the open market will normally be invested shortly after the distribution payment date. No interest will be paid on distributions awaiting reinvestment. Because the market price of the shares may increase before purchases are completed, the average purchase price per share may
exceed the market price at the time of valuation, resulting in the acquisition of fewer shares than if the distribution had been paid in shares issued by the Fund. A pro rata portion of any applicable brokerage commissions on open market purchases will be paid by Plan participants. These commissions usually will be lower than those charged on individual transactions.
Flexible
You may change your distribution option or withdraw from the Plan at any time, should your needs or situation change.
You can reinvest whether your shares are registered in your name, or in the name of a brokerage firm, bank, or other nominee. Ask your investment advisor if his or her firm will participate on your behalf. Participants whose shares are registered in the name of one firm may not be able to transfer the shares to another firm and continue to participate in the Plan.
The Fund reserves the right to amend or terminate the Plan at any time. Although the Fund reserves the right to amend the Plan to include a service charge payable by the participants, there is no direct service charge to participants in the Plan at this time.
Call today to start reinvesting distributions
For more information on the Nuveen Automatic Reinvestment Plan or to enroll in or withdraw from the Plan, speak with your financial advisor or call us at (800) 257-8787.
Glossary of Terms
Used in this Report
| | |
| ■ | Auction Rate Bond: An auction rate bond is a security whose interest payments are adjusted periodically through an auction process, which process typically also serves as a means for buying and selling the bond. Auctions that fail to attract enough buyers for all the shares offered for sale are deemed to have “failed,” with current holders receiving a formula-based interest rate until the next scheduled auction. |
| | |
| ■ | Average Annual Total Return: This is a commonly used method to express an investment’s performance over a particular, usually multi-year time period. It expresses the return that would have been necessary each year to equal the investment’s actual cumulative performance (including change in NAV or market price and reinvested dividends and capital gains distributions, if any) over the time period being considered. |
| | |
| ■ | Average Effective Maturity: The market-value-weighted average of the effective maturity dates of the individual securities including cash. In the case of a bond that has been advance-refunded to a call date, the effective maturity is the date on which the bond is scheduled to be redeemed using the proceeds of an escrow account. In most other cases the effective maturity is the stated maturity date of the security. |
| | |
| ■ | Effective Leverage: Effective leverage is a Fund’s effective economic leverage, and includes both regulatory leverage (see below) and the leverage effects of certain derivative investments in the Fund’s portfolio. Currently, the leverage effects of Tender Option Bond (TOB) inverse floater holdings are included in effective leverage values, in addition to any regulatory leverage. |
| | |
| ■ | Inverse Floating Rate Securities: Inverse floating rate securities, also known as inverse floaters or tender option bonds (TOBs), are created by depositing a municipal bond, typically with a fixed interest rate, into a special purpose trust created by a broker-dealer. This trust, in turn, (a) issues floating rate certificates typically paying short-term tax-exempt interest rates to third parties in amounts equal to some fraction of the deposited bond’s par amount or market value, and (b) issues an inverse floating rate certificate (sometimes referred to as an “inverse floater”) to an investor (such as a Fund) interested in gaining investment exposure to a long-term municipal bond. The income received by the holder of the inverse floater varies inversely with the short-term rate paid to the floating rate certificates’ holders, and in most circumstances the holder of the inverse floater bears substantially all of the underlying bond’s downside investment risk. The holder of the inverse floater typically also benefits disproportionately from any potential appreciation of the underlying bond’s value. Hence, an inverse floater essentially represents an investment in the underlying bond on a leveraged basis. |
| | |
| ■ | Leverage: Using borrowed money to invest in securities or other assets, seeking to increase the return of an investment or portfolio. |
| ■ | Leverage-Adjusted Duration: Duration is a measure of the expected period over which a bond’s principal and interest will be paid, and consequently is a measure of the sensitivity of a bond’s or bond Fund’s value to changes when market interest rates change. Generally, the longer a bond’s or Fund’s duration, the more the price of the bond or Fund will change as interest rates change. Leverage-adjusted duration takes into account the leveraging process for a Fund and therefore is longer than the duration of the Fund’s portfolio of bonds. |
| | |
| ■ | Lipper California Municipal Debt Funds Classification Average: Calculated using the returns of all closed-end funds in this category for each period as follows: 1-year,7 funds; 5-year, 7 funds; and 10-year, 4 funds. Lipper returns account for the effects of management fees and assume reinvestment of distributions, but do not reflect any applicable sales charges. The Lipper average is not available for direct investment. |
| | |
| ■ | Lipper Single-State Insured Municipal Debt Funds Classification Average: Calculated using the returns of all closed-end funds in this category for each period as follows: 1-year, 44 funds; 5-year, 44 funds; and 10-year, 24 funds. Lipper returns account for the effects of management fees and assume reinvestment of dividends, but do not reflect any applicable sales charges. The Lipper average is not available for direct investment. |
| | |
| ■ | Market Yield (also known as Dividend Yield or Current Yield): An investment’s current annualized dividend divided by its current market price. |
| | |
| ■ | Net Asset Value (NAV): The net market value of all securities held in a portfolio. |
| | |
| ■ | Net Asset Value (NAV) Per Share: The market value of one share of a mutual fund or closed-end fund. For a Fund, the NAV is calculated daily by taking the Fund’s total assets (securities, cash, and accrued earnings), subtracting the Fund’s liabilities, and dividing by the number of shares outstanding. |
| | |
| ■ | Pre-Refunding: Pre-Refunding, also known as advanced refundings or refinancings, is a procedure used by state and local governments to refinance municipal bonds to lower interest expenses. The issuer sells new bonds with a lower yield and uses the proceeds to buy U.S. Treasury securities, the interest from which is used to make payments on the higher-yielding bonds. Because of this collateral, pre-refunding generally raises a bond’s credit rating and thus its value. |
| | |
| ■ | Regulatory Leverage: Regulatory leverage consists of preferred shares issued by or borrowings of a fund. Both of these are part of a Fund’s capital structure. Regulatory leverage is sometimes referred to as “‘40 Act Leverage” and is subject to asset coverage limits set in the Investment Company Act of 1940. |
| | |
| ■ | Standard & Poor’s (S&P) California Municipal Bond Index: An unleveraged, market value-weighted index designed to measure the performance of the tax-exempt, investment California municipal bond market, respectively. Index returns assume reinvestment of distributions, but do not reflect any applicable sales charges or management fees. It is not possible to invest directly in an index. |
Glossary of Terms
Used in this Report (continued)
| ■ | Standard & Poor’s (S&P) Insured National Municipal Bond Index: An unleveraged, market value-weighted index designed to measure the performance of the insured segment of the U.S. municipal bond market. Index returns assume reinvestment of distributions, but do not reflect any applicable sales charges or management fees. It is not possible to invest directly in an index. |
| | |
| ■ | Standard & Poor’s (S&P) National Municipal Bond Index: An unleveraged, market value-weighted index designed to measure the performance of the tax-exempt, investment-grade U.S. municipal bond market. Index returns assume reinvestment of distributions, but do not reflect any applicable sales charges or management fees. It is not possible to invest directly in an index. |
| | |
| ■ | Taxable-Equivalent Yield: The yield necessary from a fully taxable investment to equal, on an after-tax basis, the yield of a municipal bond investment. |
| | |
| ■ | Zero Coupon Bond: Zero Coupon Bond: A zero coupon bond does not pay a regular interest coupon to its holders during the life of the bond. Tax-exempt income to the holder of the bond comes from accretion of the difference between the original purchase price of the bond at issuance and the par value of the bond at maturity and is effectively paid at maturity. The market prices of zero coupon bonds generally are more volatile than the market prices of bonds that pay interest periodically. |
Additional Fund Information
Board of
Directors/Trustees
John P. Amboian
Robert P. Bremner
Jack B. Evans
William C. Hunter
David J. Kundert
William J. Schneider
Judith M. Stockdale
Carole E. Stone
Virginia L. Stringer
Terence J. Toth
Fund Manager
Nuveen Fund Advisors, Inc.
333 West Wacker Drive
Chicago, IL 60606
Custodian
State Street Bank
& Trust Company
Boston, MA
Transfer Agent and
Shareholder Services
State Street Bank &
Trust Company
Nuveen Funds
P.O. Box 43071
Providence, RI 02940-3071
(800) 257-8787
Legal Counsel
Chapman and Cutler LLP
Chicago, IL
Independent Registered
Public Accounting Firm
Ernst & Young LLP
Chicago, IL
Quarterly Portfolio of Investments and Proxy Voting Information
You may obtain (i) each Fund’s quarterly portfolio of investments, (ii) information regarding how each Fund voted proxies relating to portfolio securities held during the most recent twelve-month period ended June 30, and (iii) a description of the policies and procedures that each Fund used to determine how to vote proxies relating to portfolio securities without charge, upon request, by calling Nuveen Investments toll-free at (800) 257-8787 or on Nuveen’s website at www.nuveen.com.
You may also obtain this and other Fund information directly from the Securities and Exchange Commission (SEC). The SEC may charge a copying fee for this information. Visit the SEC on-line at http://www.sec.gov or in person at the SEC’s Public Reference Room in Washington, D.C. Call the SEC at (202) 942-8090 for room hours and operation. You may also request Fund information by sending an e-mail request to publicinfo@sec.gov or by writing to the SEC’s Public References Section at 100 F Street NE, Washington, D.C. 20549.
CEO Certification Disclosure
Each Fund’s Chief Executive Officer (CEO) has submitted to the New York Stock Exchange (NYSE) the annual CEO certification as required by Section 303A.12(a) of the NYSE Listed Company Manual.
Each Fund has filed with the SEC the certification of its Chief Executive Officer and Chief Financial Officer required by Section 302 of the Sarbanes-Oxley Act.
Common and Preferred Share Information
Each Fund intends to repurchase and/or redeem shares of its own common and/or auction rate preferred stock in the future at such times and in such amounts as is deemed advisable. During the period covered by this report, the Funds repurchased and/or redeemed shares of their common and/or auction rate preferred stock as shown in the accompanying table.
| Fund | | Common Shares Repurchased | | Preferred Shares Redeemed | |
| NPC | | | — | | | — | |
| NCL | | | — | | | — | |
| NCU | | | — | | | — | |
| NAC | | | — | | | 5,421 | |
| NVX | | | — | | | 1,598 | |
| NZH | | | — | | | 2,780 | |
| NKL | | | — | | | 4,150 | |
| NKX | | | — | | | — | |
Any future repurchases will be reported to shareholders in the next annual or semi-annual report.
Nuveen Investments:
Serving Investors for Generations
Since 1898, financial advisors and their clients have relied on Nuveen Investments to provide dependable investment solutions through continued adherence to proven, long-term investing principles. Today, we offer a range of high quality equity and fixed-income solutions designed to be integral components of a well-diversified core portfolio.
Focused on meeting investor needs.
Nuveen Investments provides high-quality investment services designed to help secure the long-term goals of institutional and individual investors as well as the consultants and financial advisors who serve them. Nuveen Investments markets a wide range of specialized investment solutions which provide investors access to capabilities of its high-quality boutique investment affiliates-Nuveen Asset Management, Symphony Asset Management, NWQ Investment Management Company, Santa Barbara Asset Management, Tradewinds Global Investors, Winslow Capital Management and Gresham Investment Management. In total, Nuveen Investments managed $220 billion as of December 31, 2011.
Find out how we can help you.
To learn more about how the products and services of Nuveen Investments may be able to help you meet your financial goals, talk to your financial advisor, or call us at (800) 257-8787. Please read the information provided carefully before you invest. Investors should consider the investment objective and policies, risk considerations, charges and expenses of any investment carefully. Where applicable, be sure to obtain a prospectus, which contains this and other relevant information. To obtain a prospectus, please contact your securities representative or Nuveen Investments, 333 W. Wacker Dr., Chicago, IL 60606. Please read the prospectus carefully before you invest or send money. Learn more about Nuveen Funds at: www.nuveen.com/cef
Distributed by
Nuveen Securities, LLC
333 West Wacker Drive
Chicago, IL 60606
www.nuveen.com
EAN-B-0212D
ITEM 2. CODE OF ETHICS.
As of the end of the period covered by this report, the registrant has adopted a code of ethics that applies to the registrant's principal executive officer, principal financial officer, principal accounting officer or controller, or persons performing similar functions. There were no amendments to or waivers from the Code during the period covered by this report. The registrant has posted the code of ethics on its website at www.nuveen.com/CEF/Shareholder. (To view the code, click on Fund Governance and then click on Code of Conduct.)
ITEM 3. AUDIT COMMITTEE FINANCIAL EXPERT.
The registrant's Board of Directors or Trustees (“Board”) determined that the registrant has at least one “audit committee financial expert” (as defined in Item 3 of Form N-CSR) serving on its Audit Committee. The registrant's audit committee financial expert is Carole E. Stone, who is “independent” for purposes of Item 3 of Form N-CSR.
Ms. Stone served for five years as Director of the New York State Division of the Budget. As part of her role as Director, Ms. Stone was actively involved in overseeing the development of the State's operating, local assistance and capital budgets, its financial plan and related documents; overseeing the development of the State's bond-related disclosure documents and certifying that they fairly presented the State's financial position; reviewing audits of various State and local agencies and programs; and coordinating the State's system of internal audit and control. Prior to serving as Director, Ms. Stone worked as a budget analyst/examiner with increasing levels of responsibility over a 30 year period, including approximately five years as Deputy Budget Director. Ms. Stone has also served as Chair of the New York State Racing Association Oversight Board, as Chair of the Public Authorities Control Board, as a Commissioner on the New York State Commission on Public Authority Reform and as a member of the Boards of Directors of several New York State public authorities. These positions have involved overseeing operations and finances of certain entities and assessing the adequacy of project/entity financing and financial reporting. Currently, Ms. Stone is on the Board of Directors of CBOE Holdings, Inc., of the Chicago Board Options Exchange, and of C2 Options Exchange. Ms. Stone's position on the boards of these entities and as a member of both CBOE Holdings' Audit Committee and its Finance Committee has involved, among other things, the oversight of audits, audit plans and preparation of financial statements.
ITEM 4. PRINCIPAL ACCOUNTANT FEES AND SERVICES.
The following tables show the amount of fees that Ernst & Young LLP, the Fund's auditor, billed to the Fund during the Fund's last two full fiscal years. For engagements with Ernst & Young LLP the Audit Committee approved in advance all audit services and non-audit services that Ernst & Young LLP provided to the Fund, except for those non-audit services that were subject to the pre-approval exception under Rule 2-01 of Regulation S-X (the “pre-approval exception”). The pre-approval exception for services provided directly to the Fund waives the pre-approval requirement for services other than audit, review or attest services if: (A) the aggregate amount of all such services provided constitutes no more than 5% of the total amount of revenues paid by the Fund to its accountant during the fiscal year in which the services are provided; (B) the Fund did not recognize the services as non-audit services at the time of the engagement; and (C) the services are promptly brought to the Audit Committee's attention, and the Committee (or its delegate) approves the services before the audit is completed.
The Audit Committee has delegated certain pre-approval responsibilities to its Chairman (or, in his absence, any other member of the Audit Committee).
SERVICES THAT THE FUND'S AUDITOR BILLED TO THE ADVISER AND AFFILIATED FUND SERVICE PROVIDERS
The tables also show the percentage of fees subject to the pre-approval exception. The pre-approval exception for services provided to the Adviser and any Affiliated Fund Service Provider (other than audit, review or attest services) waives the pre-approval requirement if: (A) the aggregate amount of all such services provided constitutes no more than 5% of the total amount of revenues paid to Ernst & Young LLP by the Fund, the Adviser and Affiliated Fund Service Providers during the fiscal year in which the services are provided that would have to be pre-approved by the Audit Committee; (B) the Fund did not recognize the services as non-audit services at the time of the engagement; and (C) the services are promptly brought to the Audit Committee's attention, and the Committee (or its delegate) approves the services before the Fund's audit is completed.
The following table shows the amount of fees that Ernst & Young LLP billed during the Fund's last two full fiscal years for non-audit services. The Audit Committee is required to pre-approve non-audit services that Ernst & Young LLP provides to the Adviser and any Affiliated Fund Services Provider, if the engagement related directly to the Fund's operations and financial reporting (except for those subject to the pre-approval exception described above). The Audit Committee requested and received information from Ernst & Young LLP about any non-audit services that Ernst & Young LLP rendered during the Fund's last fiscal year to the Adviser and any Affiliated Fund Service Provider. The Committee considered this information in evaluating Ernst & Young LLP's independence.
Audit Committee Pre-Approval Policies and Procedures. Generally, the Audit Committee must approve (i) all non-audit services to be performed for the Fund by the Fund's independent accountants and (ii) all audit and non-audit services to be performed by the Fund's independent accountants for the Affiliated Fund Service Providers with respect to operations and financial reporting of the Fund. Regarding tax and research projects conducted by the independent accountants for the Fund and Affiliated Fund Service Providers (with respect to operations and financial reports of the Fund) such engagements will be (i) pre-approved by the Audit Committee if they are expected to be for amounts greater than $10,000; (ii) reported to the Audit Committee chairman for his verbal approval prior to engagement if they are expected to be for amounts under $10,000 but greater than $5,000; and (iii) reported to the Audit Committee at the next Audit Committee meeting if they are expected to be for an amount under $5,000.
ITEM 5. AUDIT COMMITTEE OF LISTED REGISTRANTS.
ITEM 6. SCHEDULE OF INVESTMENTS.
a) See Portfolio of Investments in Item 1.
b) Not applicable.
ITEM 7. DISCLOSURE OF PROXY VOTING POLICIES AND PROCEDURES FOR CLOSED-END MANAGEMENT INVESTMENT COMPANIES.
ITEM 9. PURCHASES OF EQUITY SECURITIES BY CLOSED-END MANAGEMENT INVESTMENT COMPANY AND AFFILIATED PURCHASERS.
Not applicable.
ITEM 10. SUBMISSION OF MATTERS TO A VOTE OF SECURITY HOLDERS.
There have been no material changes to the procedures by which shareholders may recommend nominees to the registrant's Board implemented after the registrant last provided disclosure in response to this item.
ITEM 11. CONTROLS AND PROCEDURES.
ITEM 12. EXHIBITS.
File the exhibits listed below as part of this Form. Letter or number the exhibits in the sequence indicated.
Pursuant to the requirements of the Securities Exchange Act of 1934 and the Investment Company Act of 1940, the registrant has duly caused this report to be signed on its behalf by the undersigned, thereunto duly authorized.
Kevin J. McCarthy
Pursuant to the requirements of the Securities Exchange Act of 1934 and the Investment Company Act of 1940, this report has been signed below by the following persons on behalf of the registrant and in the capacities and on the dates indicated.
Gifford R. Zimmerman
Stephen D. Foy