UNITED STATES
SECURITIES AND EXCHANGE COMMISSION
Washington, D.C. 20549
FORM N-CSR
CERTIFIED SHAREHOLDER REPORT OF REGISTERED
MANAGEMENT INVESTMENT COMPANIES
Investment Company Act file number 811-21212
Nuveen California AMT-Free Quality Municipal Income Fund
(Exact name of registrant as specified in charter)
Nuveen Investments
333 West Wacker Drive
Chicago, IL 60606
(Address of principal executive offices) (Zip code)
Mark L. Winget
Nuveen Investments
333 West Wacker Drive
Chicago, IL 60606
(Name and address of agent for service)
Registrant’s telephone number, including area code: (312) 917-7700
Date of fiscal year end: February 28
Date of reporting period: August 31, 2022
Form N-CSR is to be used by management investment companies to file reports with the Commission not later than 10 days after the transmission to stockholders of any report that is required to be transmitted to stockholders under Rule 30e-1 under the Investment Company Act of 1940 (17 CFR 270.30e-1). The Commission may use the information provided on Form N-CSR in its regulatory, disclosure review, inspection, and policymaking roles.
A registrant is required to disclose the information specified by Form N-CSR, and the Commission will make this information public. A registrant is not required to respond to the collection of information contained in Form N-CSR unless the Form displays a currently valid Office of Management and Budget (“OMB”) control number. Please direct comments concerning the accuracy of the information collection burden estimate and any suggestions for reducing the burden to Secretary, Securities and Exchange Commission, 450 Fifth Street, NW, Washington, DC 20549-0609. The OMB has reviewed this collection of information under the clearance requirements of 44 U.S.C. ss. 3507.
ITEM 1. REPORTS TO STOCKHOLDERS.
Life is Complex.
Nuveen makes things e-simple.
It only takes a minute to sign up for e-Reports. Once enrolled, you’ll receive an e-mail as soon as your Nuveen Fund information is ready—no more waiting for delivery by regular mail. Just click on the link within the e-mail to see the report and save it on your computer if you wish.
Free e-Reports
right to your e-mail!
www.investordelivery.com
If you receive your Nuveen Fund
dividends and statements from your
financial professional or brokerage account.
or
www.nuveen.com/client-access
If you receive your Nuveen Fund
dividends and statements directly from
Nuveen.
NOT FDIC INSURED MAY LOSE
VALUE NO BANK GUARANTEE

Table of Contents
3
Table of Contents
Chair’s Letter
to Shareholders

Dear Shareholders,
The question of whether economies are moving toward normalization or recession has dominated financial markets in 2022. High inflation has made the outcome more unpredictable, as it has dampened consumer sentiment, pushed central banks into raising interest rates more aggressively and contributed to considerable turbulence in the markets this year.
Inflation has surged partially due to COVID supply chain bottlenecks and exacerbated by Russia’s war in Ukraine and recent lockdowns across China to contain a large-scale COVID-19 outbreak. This has necessitated increasingly forceful responses from the U.S. Federal Reserve (Fed) and other central banks, who have signaled their intentions to slow inflation while tolerating materially slower economic growth and some softening in the labor market. As anticipated, the Fed began the rate hiking cycle in March 2022, raising its short-term rate by 0.25% from near zero for the first time since the pandemic was declared more than two years ago. Larger increases of 0.50% in May and 0.75% in June, July and September 2022 followed, bringing the target fed funds rate to a range of 3.00% to 3.25%. Additional rate hikes are expected in the remainder of this year, although Fed officials will closely monitor inflation data along with other economic measures and modify their rate setting policy based upon these factors. U.S. gross domestic product growth has now contracted for two consecutive quarters, according to government estimates, as consumer and business activity has slowed in part due to higher prices and borrowing costs. The sharp increase in the U.S. dollar’s value relative to other currencies in 2022 has added further uncertainty to the economic outlook. However, the still strong labor market suggests not all areas of the economy are weakening in unison.
While markets will likely continue fluctuating with the daily headlines, we encourage investors to keep a long-term perspective. To learn more about how well your portfolio is aligned to your time horizon, risk tolerance and investment goals, consider reviewing it with your financial professional.
On behalf of the other members of the Nuveen Fund Board, we look forward to continuing to earn your trust in the months and years ahead.
Sincerely,

Terence J. Toth
Chair of the Board
October 21, 2022
4
Important Notices
For Shareholders of
Nuveen California Quality Municipal Income Fund (NAC)
Nuveen California ATM-Free Quality Municipal Income Fund (NKX)
Nuveen California Municipal Value Fund (NCA)
Nuveen California Select Tax-Free Income Portfolio (NXC)
Portfolio Manager Commentaries in Semiannual Shareholder Reports
The Funds’ include portfolio manager commentary in their annual shareholder reports. For the Funds’ most recent annual portfolio manager discussion, please refer to the Portfolio Managers’ Comments section of each Fund’s February 28, 2022 annual shareholder report.
For current information on your Fund’s investment objectives, portfolio management team and average annual total returns please refer to the Fund’s website at www.nuveen.com.
For changes that occurred to your Fund both during and subsequent to this reporting period, please refer to the Notes to Financial Statements section of this report.
For average annual total returns as of the end of this reporting period, please refer to the Performance Overview and Holding Summaries section within this report.
5
Fund Leverage
IMPACT OF THE FUNDS’ LEVERAGE STRATEGIES ON PERFORMANCE
One important factor impacting the returns of the Funds’ common shares relative to their comparative benchmarks was the Funds’ use of leverage through their issuance of preferred shares and/or investments in inverse floating rate securities, which represent leveraged investments in underlying bonds. The Funds use leverage because our research has shown that, over time, leveraging provides opportunities for additional income. The opportunity arises when short-term rates that the Fund pays on its leveraging instruments are lower than the interest the Fund earns on its portfolio of long-term bonds that it has bought with the proceeds of that leverage. This has been particularly true in the recent market environment where short-term rates have been low by historical standards.
However, use of leverage can expose Fund common shares to additional price volatility. When a Fund uses leverage, the Fund’s common shares will experience a greater increase in their net asset value if the municipal bonds acquired through the use of leverage increase in value, but will also experience a correspondingly larger decline in their net asset value if the bonds acquired through leverage decline in value. All this will make the shares’ total return performance more variable, over time.
In addition, common share income in levered funds will typically decrease in comparison to unlevered funds when short-term interest rates increase and increase when short-term interest rates decrease. In recent quarters, fund leverage expenses have generally tracked the overall movement of short-term tax-exempt interest rates. While fund leverage expenses are somewhat higher than their recent lows, leverage nevertheless continues to provide the opportunity for incremental common share income, particularly over longer-term periods.
NAC and NKX's use of leverage significantly detracted from relative performance during the reporting period. However, the Funds' use of leverage was accretive to overall common share income.
As of August 31, 2022, the Funds’ percentages of leverage are as shown in the accompanying table.
| | NAC | NKX | NCA | NXC |
| Effective Leverage* | 40.54% | 41.24% | 0.00% | 0.00% |
| Regulatory Leverage* | 40.40% | 40.10% | 0.00% | 0.00% |
| * | | Effective Leverage is a Fund’s effective economic leverage, and includes both regulatory leverage and the leverage effects of certain derivative and other investments in a Fund’s portfolio that increase the Fund’s investment exposure. Currently, the leverage effects of Tender Option Bond (TOB) inverse floater holdings are included in effective leverage values, in addition to any regulatory leverage. Regulatory leverage consists of preferred shares issued or borrowings of a Fund. Both of these are part of a Fund’s capital structure. A Fund, however, may from time to time borrow on a typically transient basis in connection with its day-to-day operations, primarily in connection with the need to settle portfolio trades. Such incidental borrowings are excluded from the calculation of a Fund’s effective leverage ratio. Regulatory leverage is subject to asset coverage limits set forth in the Investment Company Act of 1940. |
6
THE FUNDS’ REGULATORY LEVERAGE
As of August 31, 2022, the following Funds have issued and outstanding preferred shares as shown in the accompanying table. As mentioned previously, NCA and NXC do not use regulatory leverage.
| | | | |
| | Variable Rate | Variable Rate | |
| | Preferred* | Remarketed Preferred** | |
| | Shares | Shares | |
| | Issued at | Issued at | |
| | Liquidation | Liquidation | |
| | Preference | Preference | Total |
| NAC | $729,900,000 | $547,700,000 | $1,277,600,000 |
| NKX | $ — | $432,600,000 | $ 432,600,000 |
| * | | Preferred shares of the Fund featuring a floating rate dividend based on a predetermined formula or spread to an index rate. Includes the following preferred shares AMTP, iMTP, MFP-VRM and VRDP in Special Rate Mode, where applicable. See Notes to Financial Statements, Note 5 – Fund Shares, for further details. |
| ** | | Preferred shares of the Fund featuring floating rate dividends set by a remarketing agent via a regular remarketing. Includes the following preferred shares VRDP not in Special Rate Mode, MFP-VRRM and MFP-VRDM, where applicable. See Notes to Financial Statements, Note 5 – Fund Shares, for further details. |
Refer to Notes to Financial Statements, Note 5 — Fund Shares, for further details on preferred shares and each Fund’s respective transactions.
7
Common Share Information
COMMON SHARE DISTRIBUTION INFORMATION
The following information regarding the Funds’ distributions is current as of August 31, 2022. Each Fund’s distribution levels may vary over time based on each Fund’s investment activity and portfolio investments value changes.
During the current reporting period, each Fund’s distributions to common shareholders were as shown in the accompanying table.
| | Per Common Share Amounts |
| Monthly Distributions (Ex-Dividend Date) | NAC | NKX | NCA | NXC |
| March 2022 | $0.0545 | $0.0565 | $0.0245 | $0.0400 |
| April | 0.0515 | 0.0565 | 0.0245 | 0.0400 |
| May | 0.0515 | 0.0565 | 0.0245 | 0.0400 |
| June | 0.0515 | 0.0565 | 0.0245 | 0.0400 |
| July | 0.0515 | 0.0520 | 0.0265 | 0.0400 |
| August 2022 | 0.0515 | 0.0520 | 0.0265 | 0.0400 |
| Total Distributions from Net Investment Income | $0.3120 | $0.3300 | $0.1510 | $0.2400 |
| Yields | | | | |
| Market Yield* | 5.09% | 4.64% | 3.52% | 3.52% |
| Taxable-Equivalent Yield* | 11.09% | 10.11% | 7.67% | 7.67% |
| * | | Market Yield is based on the Fund’s current annualized monthly distribution divided by the Fund’s current market price as of the end of the reporting period. Taxable-Equivalent Yield represents the yield that must be earned on a fully taxable investment in order to equal the yield of the Fund on an after-tax basis. It is based on a combined federal and state income tax rate of 54.1%. Your actual combined federal and state income tax rate may differ from the assumed rate. The Taxable-Equivalent Yield also takes into account the percentage of the Fund’s income generated and paid by the Fund (based on payments made during the previous calendar year) that was either exempt from federal income tax but not from state income tax (e.g., income from an out-of-state municipal bond), or was exempt from neither federal nor state income tax. Separately, if the comparison were instead to investments that generate qualified dividend income, which is taxable at a rate lower than an individual’s ordinary graduated tax rate, the fund’s Taxable-Equivalent Yield would be lower. |
Each Fund seeks to pay regular monthly dividends out of its net investment income at a rate that reflects its past and projected net income performance. To permit each Fund to maintain a more stable monthly dividend, the Fund may pay dividends at a rate that may be more or less than the amount of net income actually earned by the Fund during the period. Distributions to common shareholders are determined on a tax basis, which may differ from amounts recorded in the accounting records. In instances where the monthly dividend exceeds the earned net investment income, the Fund would report a negative undistributed net ordinary income. Refer to Note 6 – Income Tax Information for additional information regarding the amounts of undistributed net ordinary income and undistributed net long-term capital gains and the character of the actual distributions paid by the Fund during the period.
All monthly dividends paid by each Fund during the current reporting period were paid from net investment income. If a portion of the Fund’s monthly distributions is sourced or comprised of elements other than net investment income, including capital gains and/or a return of capital, shareholders will be notified of those sources. For financial reporting purposes, the per share amounts of each Fund’s distributions for the reporting period are presented in this report’s Financial Highlights. For income tax purposes, distribution information for each Fund as of its most recent tax year end is presented in Note 6 – Income Tax Information within the Notes to Financial Statements of this report.
NUVEEN CLOSED-END FUND DISTRIBUTION AMOUNTS
The Nuveen Closed-End Funds’ monthly and quarterly periodic distributions to shareholders are posted on www.nuveen.com and can be found on Nuveen’s enhanced closed-end fund resource page, which is at https://www.nuveen.com/resource-center-closed-end-funds, along with other Nuveen closed-end fund product updates. To ensure timely access to the latest information, shareholders may use a subscribe function, which can be activated at this web page (https://www.nuveen.com/subscriptions).
8
COMMON SHARE REPURCHASES
During August 2022, the Funds’ Board of Trustees reauthorized an open–market share repurchase program, allowing each Fund to repurchase an aggregate of up to approximately 10% of its outstanding common shares.
During the current reporting period, the Funds did not repurchase any of their outstanding common shares. As of August 31, 2022, (and since the inception of the Funds’ repurchase programs), each Fund has cumulatively repurchased and retired its outstanding common shares as shown in the accompanying table.
| | NAC | NKX | NCA | NXC |
| Common shares cumulatively repurchased and retired | 370,000 | 230,000 | — | — |
| Common shares authorized for repurchase | 14,470,000 | 4,750,000 | 3,310,000 | 635,000 |
OTHER COMMON SHARE INFORMATION
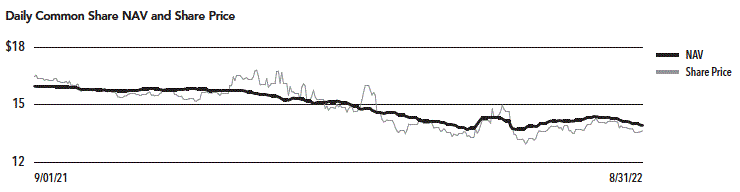
As of August 31, 2022, the Funds’ common share prices were trading at a premium/(discount) to their common share NAV, and trading at an average premium/(discount) to NAV during the current reporting period, as follows:
| | | | | |
| | NAC | NKX | NCA | NXC |
| Common share NAV | $13.02 | $13.60 | $9.39 | $13.92 |
| Common share price | $12.14 | $13.46 | $9.04 | $13.64 |
| Premium/(Discount) to NAV | (6.76)% | (1.03)% | (3.73)% | (2.01)% |
| Average premium/(discount) to NAV | (8.37)% | (5.41)% | (6.81)% | (1.75)% |
9
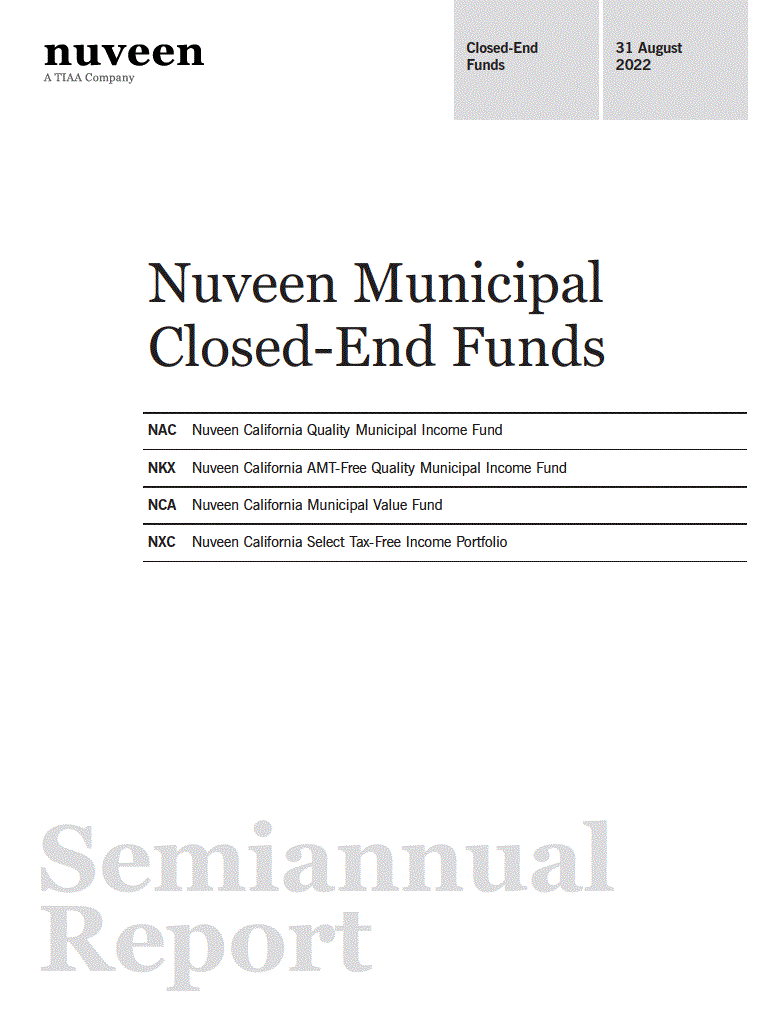
| NAC | Nuveen California Quality Municipal |
| | Income Fund |
| | Performance Overview and Holding Summaries as of August 31, 2022 |
Refer to the Glossary of Terms Used in this Report for further definition of the terms used within this section.
Average Annual Total Returns as of August 31, 2022*
| | Cumulative | | Average Annual | |
| | 6-Month | 1-Year | 5-Year | 10-Year |
| NAC at Common Share NAV | (11.59)% | (16.34)% | 0.40% | 3.32% |
| NAC at Common Share Price | (9.22)% | (20.51)% | (0.03)% | 3.11% |
| S&P Municipal Bond Index | (5.44)% | (8.08)% | 1.33% | 2.32% |
| S&P Municipal Bond California Index | (5.45)% | (8.33)% | 1.20% | 2.58% |
* For purposes of Fund performance, relative results are measured against the S&P Municipal Bond California Index.
Performance data shown represents past performance and does not predict or guarantee future results. Current performance may be higher or lower than the data shown. Returns do not reflect the deduction of taxes that shareholders may have to pay on Fund distributions or upon the sale of Fund shares. Returns at NAV are net of Fund expenses, and assume reinvestment of distributions. Comparative index return information is provided for the Fund’s shares at NAV only. Indexes are not available for direct investment.
10
This data relates to the securities held in the Fund’s portfolio of investments as of the end of the reporting period. It should not be construed as a measure of performance for the Fund itself. Holdings are subject to change.
For financial reporting purposes, the ratings disclosed are the highest rating given by one of the following national rating agencies: Standard & Poor’s Group, Moody’s Investors Service, Inc. or Fitch, Inc. This treatment of split-rated securities may differ from that used for other purposes, such as for Fund investment policies. Credit ratings are subject to change. AAA, AA, A and BBB are investment grade ratings; BB, B, CCC, CC, C and D are below-investment grade ratings. Holdings designated N/R are not rated by these national rating agencies.
| Fund Allocation | |
| (% of net assets) | |
| Municipal Bonds | 166.2% |
| Other Assets Less Liabilities | 1.4% |
| Net Assets Plus MFP shares, net of | |
| deferred offering costs and VRDP | |
| Shares, net of deferred offering costs | 167.6% |
| MFP Shares, net of deferred offering costs | (17.0)% |
| VRDP Shares, net of deferred offering costs (50.6)% |
| Net Assets | 100% |
| States and Territories | |
| (% of total municipal bonds)2 | |
| California | 96.2% |
| Puerto Rico | 3.0% |
| Guam | 0.7% |
| Virgin Islands | 0.1% |
| New York | 0.0% |
| Total | 100% |
| Portfolio Composition1 | |
| (% of total investments) | |
| Tax Obligation/General | 20.0% |
| Transportation | 14.5% |
| Utilities | 14.4% |
| U.S. Guaranteed | 14.0% |
| Tax Obligation/Limited | 11.7% |
| Health Care | 11.3% |
| Housing/Multifamily | 10.4% |
| Other | 3.7% |
| Total | 100% |
| Portfolio Credit Quality | |
| (% of total investment exposure) | |
| U.S. Guaranteed | 12.3% |
| AAA | 5.3% |
| AA | 35.4% |
| A | 11.9% |
| BBB | 7.7% |
| BB or Lower | 3.0% |
| N/R (not rated) | 24.4% |
| Total | 100% |
| (1) | | See the Portfolio of Investments for the remaining industries/sectors comprising "Other" and not listed in the Portfolio Composition above. |
| (2) | | The Fund may invest up to 20% of its net assets in municipal bonds that are exempt from regular federal income tax, but not from California personal income tax if, in the judgment of the Fund’s sub-adviser, such purchases are expected to enhance the Fund's after-tax total return potential. |
11
| | |
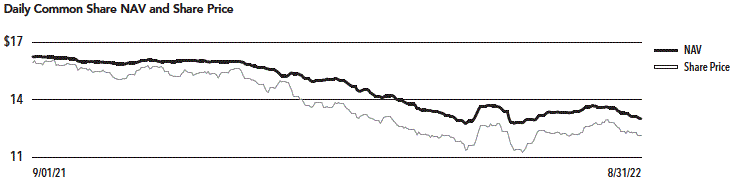
| NKX | Nuveen California AMT-Free Quality |
| | Municipal Income Fund |
| | Performance Overview and Holding Summaries as of August 31, 2022 |
Refer to the Glossary of Terms Used in this Report for further definition of the terms used within this section.
Average Annual Total Returns as of August 31, 2022*
| | Cumulative | | Average Annual | |
| | 6-Month | 1-Year | 5-Year | 10-Year |
| NKX at Common Share NAV | (10.98)% | (15.69)% | 1.00% | 3.72% |
| NKX at Common Share Price | (2.53)% | (14.88)% | 1.15% | 4.06% |
| S&P Municipal Bond Index | (5.44)% | (8.08)% | 1.33% | 2.32% |
| S&P Municipal Bond California Index | (5.45)% | (8.33)% | 1.20% | 2.58% |
* For purposes of Fund performance, relative results are measured against the S&P Municipal Bond California Index.
Performance data shown represents past performance and does not predict or guarantee future results. Current performance may be higher or lower than the data shown. Returns do not reflect the deduction of taxes that shareholders may have to pay on Fund distributions or upon the sale of Fund shares. Returns at NAV are net of Fund expenses, and assume reinvestment of distributions. Comparative index return information is provided for the Fund’s shares at NAV only. Indexes are not available for direct investment.
12
This data relates to the securities held in the Fund’s portfolio of investments as of the end of the reporting period. It should not be construed as a measure of performance for the Fund itself. Holdings are subject to change.
For financial reporting purposes, the ratings disclosed are the highest rating given by one of the following national rating agencies: Standard & Poor’s Group, Moody’s Investors Service, Inc. or Fitch, Inc. This treatment of split-rated securities may differ from that used for other purposes, such as for Fund investment policies. Credit ratings are subject to change. AAA, AA, A and BBB are investment grade ratings; BB, B, CCC, CC, C and D are below-investment grade ratings. Holdings designated N/R are not rated by these national rating agencies.
| Fund Allocation | |
| (% of net assets) | |
| Municipal Bonds | 168.3% |
| Other Assets Less Liabilities | 1.6% |
| Net Assets Plus Floating Rate | |
| Obligations, MFP shares, net of | |
| deferred offering costs and VRDP | |
| Shares, net of deferred offering costs | 169.9% |
| Floating Rate Obligations | (3.2)% |
| MFP Shares, net of deferred offering costs | (21.7)% |
| VRDP Shares, net of deferred offering costs | (45.0)% |
| Net Assets | 100% |
| States and Territories | |
| (% of total municipal bonds)2 | |
| California | 93.7% |
| Puerto Rico | 4.7% |
| Guam | 1.1% |
| Virgin Islands | 0.4% |
| New York | 0.1% |
| Total | 100% |
| Portfolio Composition1 | |
| (% of total investments) | |
| Tax Obligation/General | 23.0% |
| Tax Obligation/Limited | 16.3% |
| U.S. Guaranteed | 16.1% |
| Utilities | 14.1% |
| Health Care | 11.2% |
| Housing/Multifamily | 10.3% |
| Transportation | 6.8% |
| Other | 2.2% |
| Total | 100% |
| Portfolio Credit Quality | |
| (% of total investment exposure) | |
| U.S. Guaranteed | 15.0% |
| AAA | 5.6% |
| AA | 39.6% |
| A | 9.3% |
| BBB | 5.8% |
| BB or Lower | 3.2% |
| N/R (not rated) | 21.5% |
| Total | 100% |
| (1) | | See the Portfolio of Investments for the remaining industries/sectors comprising "Other" and not listed in the Portfolio Composition above. |
| (2) | | The Fund may invest up to 20% of its net assets in municipal bonds that are exempt from regular federal income tax, but not from California personal income tax if, in the judgment of the Fund’s sub-adviser, such purchases are expected to enhance the Fund's after-tax total return potential. |
13
| | |
| NCA | Nuveen California Municipal Value Fund |
| | Performance Overview and Holding Summaries as of August 31, 2022 |
Refer to the Glossary of Terms Used in this Report for further definition of the terms used within this section.
Average Annual Total Returns as of August 31, 2022*
| | Cumulative | | Average Annual | |
| | 6-Month | 1-Year | 5-Year | 10-Year |
| NCA at Common Share NAV | (7.57)% | (10.95)% | 0.98% | 2.88% |
| NCA at Common Share Price | (3.54)% | (12.50)% | 0.49% | 2.68% |
| S&P Municipal Bond Index | (5.44)% | (8.08)% | 1.33% | 2.32% |
| S&P Municipal Bond California Index | (5.45)% | (8.33)% | 1.20% | 2.58% |
* For purposes of Fund performance, relative results are measured against the S&P Municipal Bond California Index.
Performance data shown represents past performance and does not predict or guarantee future results. Current performance may be higher or lower than the data shown. Returns do not reflect the deduction of taxes that shareholders may have to pay on Fund distributions or upon the sale of Fund shares. Returns at NAV are net of Fund expenses, and assume reinvestment of distributions. Comparative index return information is provided for the Fund’s shares at NAV only. Indexes are not available for direct investment.
14
This data relates to the securities held in the Fund’s portfolio of investments as of the end of the reporting period. It should not be construed as a measure of performance for the Fund itself. Holdings are subject to change.
For financial reporting purposes, the ratings disclosed are the highest rating given by one of the following national rating agencies: Standard & Poor’s Group, Moody’s Investors Service, Inc. or Fitch, Inc. This treatment of split-rated securities may differ from that used for other purposes, such as for Fund investment policies. Credit ratings are subject to change. AAA, AA, A and BBB are investment grade ratings; BB, B, CCC, CC, C and D are below-investment grade ratings. Holdings designated N/R are not rated by these national rating agencies.
| Fund Allocation | |
| (% of net assets) | |
| Municipal Bonds | 98.7% |
| Other Assets Less Liabilities | 1.3% |
| Net Assets | 100% |
| States and Territories | |
| (% of total municipal bonds)2 | |
| California | 97.7% |
| Puerto Rico | 2.3% |
| Total | 100% |
| Portfolio Composition1 | |
| (% of total investments) | |
| Tax Obligation/General | 25.7% |
| Utilities | 19.5% |
| Transportation | 18.5% |
| Housing/Multifamily | 9.8% |
| Tax Obligation/Limited | 9.4% |
| Health Care | 9.0% |
| U.S. Guaranteed | 6.1% |
| Other | 2.0% |
| Total | 100% |
| Portfolio Credit Quality | |
| (% of total investment exposure) | |
| U.S. Guaranteed | 6.1% |
| AAA | 10.9% |
| AA | 39.5% |
| A | 12.7% |
| BBB | 6.8% |
| BB or Lower | 2.4% |
| N/R (not rated) | 21.6% |
| Total | 100% |
| 1 | | See the Portfolio of Investments for the remaining industries/sectors comprising "Other" and not listed in the Portfolio Composition above. |
| 2 | | The Fund may invest up to 20% of its net assets in municipal bonds that are exempt from regular federal income tax, but not from California personal income tax if, in the judgment of the Fund’s sub-adviser, such purchases are expected to enhance the Fund's after-tax total return potential. |
15
| | |
| NXC | Nuveen California Select Tax-Free |
| | Income Portfolio |
| | Performance Overview and Holding Summaries as of August 31, 2022 |
Refer to the Glossary of Terms Used in this Report for further definition of the terms used within this section.
Average Annual Total Returns as of August 31, 2022*
| | Cumulative | | Average Annual | |
| | 6-Month | 1-Year | 5-Year | 10-Year |
| NXC at Common Share NAV | (6.56)% | (9.76)% | 1.43% | 3.17% |
| NXC at Common Share Price | (6.30)% | (14.26)% | 0.56% | 3.30% |
| S&P Municipal Bond Index | (5.44)% | (8.08)% | 1.33% | 2.32% |
| S&P Municipal Bond California Index | (5.45)% | (8.33)% | 1.20% | 2.58% |
* For purposes of Fund performance, relative results are measured against the S&P Municipal Bond California Index.
Performance data shown represents past performance and does not predict or guarantee future results. Current performance may be higher or lower than the data shown. Returns do not reflect the deduction of taxes that shareholders may have to pay on Fund distributions or upon the sale of Fund shares. Returns at NAV are net of Fund expenses, and assume reinvestment of distributions. Comparative index return information is provided for the Fund’s shares at NAV only. Indexes are not available for direct investment.
16
This data relates to the securities held in the Fund’s portfolio of investments as of the end of the reporting period. It should not be construed as a measure of performance for the Fund itself. Holdings are subject to change.
For financial reporting purposes, the ratings disclosed are the highest rating given by one of the following national rating agencies: Standard & Poor’s Group, Moody’s Investors Service, Inc. or Fitch, Inc. This treatment of split-rated securities may differ from that used for other purposes, such as for Fund investment policies. Credit ratings are subject to change. AAA, AA, A and BBB are investment grade ratings; BB, B, CCC, CC, C and D are below-investment grade ratings. Holdings designated N/R are not rated by these national rating agencies.
| Fund Allocation | |
| (% of net assets) | |
| Municipal Bonds | 98.0% |
| Other Assets Less Liabilities | 2.0% |
| Net Assets | 100% |
| States and Territories | |
| (% of total municipal bonds)2 | |
| California | 98.6% |
| Puerto Rico | 1.4% |
| Total | 100% |
| Portfolio Composition1 | |
| (% of total investments) | |
| Tax Obligation/General | 21.9% |
| Utilities | 19.6% |
| Tax Obligation/Limited | 13.6% |
| U.S. Guaranteed | 12.1% |
| Transportation | 11.9% |
| Health Care | 10.2% |
| Housing/Multifamily | 9.6% |
| Other | 1.1% |
| Total | 100% |
| Portfolio Credit Quality | |
| (% of total investment exposure) | |
| U.S. Guaranteed | 12.0% |
| AAA | 13.9% |
| AA | 30.8% |
| A | 11.0% |
| BBB | 5.8% |
| BB or Lower | 2.7% |
| N/R (not rated) | 23.8% |
| Total | 100% |
| 1 | | See the Portfolio of Investments for the remaining industries/sectors comprising "Other" and not listed in the Portfolio Composition above. |
| 2 | | The Fund may invest up to 20% of its net assets in municipal bonds that are exempt from regular federal income tax, but not from California personal income tax if, in the judgment of the Fund's sub-adviser, such purchases are expected to enhance the Fund’s after-tax total return potential. |
17
Shareholder Meeting Report
The annual meeting of shareholders was held on August 5, 2022 for NXC. The meeting was held virtually due to public health concerns regarding the ongoing COVID-19 pandemic; at this meeting the shareholders were asked to elect Board members.
| | NXC |
| | Common |
| | Shares |
| Approval of the Board Members was reached as follows: | |
| William C. Hunter | |
| For | 5,107,876 |
| Withhold | 98,576 |
| Total | 5,206,452 |
| Judith M. Stockdale | |
| For | 5,111,450 |
| Withhold | 95,002 |
| Total | 5,206,452 |
| Carole E. Stone | |
| For | 5,117,348 |
| Withhold | 89,104 |
| Total | 5,206,452 |
| Margaret L. Wolff | |
| For | 5,119,127 |
| Withhold | 87,325 |
| Total | 5,206,452 |
18
| | |
| NAC | Nuveen California Quality Municipal |
| | Income Fund |
| | Portfolio of Investments |
| | August 31, 2022 (Unaudited) |
| Principal | | Optional Call | | |
| Amount (000) | Description (1) | Provisions (2) | Ratings (3) | Value |
| | LONG-TERM INVESTMENTS – 166.2% (100.0% of Total Investments) | | | |
| | MUNICIPAL BONDS – 166.2% (100.0% of Total Investments) | | | |
| | Consumer Staples – 0.6% (0.4% of Total Investments) | | | |
| $ 1,000 | California County Tobacco Securitization Agency, Tobacco Settlement Asset-Backed Bonds, | 9/22 at 100.00 | N/R | $ 963,780 |
| | Golden Gate Tobacco Funding Corporation, Turbo, Series 2007A, 5.000%, 6/01/47 | | | |
| 680 | California County Tobacco Securitization Agency, Tobacco Settlement Asset-Backed Bonds, | 6/30 at 100.00 | BBB+ | 639,479 |
| | Los Angeles County Securitization Corporation, Series 2020A, 4.000%, 6/01/49 | | | |
| 25,000 | California Statewide Financing Authority, Tobacco Settlement Asset-Backed Bonds, Pooled | 9/22 at 23.24 | N/R | 5,797,750 |
| | Tobacco Securitization Program, Series 2006A, 0.000%, 6/01/46 | | | |
| 19,000 | Silicon Valley Tobacco Securitization Authority, California, Tobacco Settlement | 10/22 at 24.12 | N/R | 4,561,140 |
| | Asset-Backed Bonds, Santa Clara County Tobacco Securitization Corporation, Series 2007B, | | | |
| | 0.000%, 6/01/47 | | | |
| 45,680 | Total Consumer Staples | | | 11,962,149 |
| | Education and Civic Organizations – 5.6% (3.3% of Total Investments) | | | |
| 7,000 | California Educational Facilities Authority, Revenue Bonds,Stanford University, | No Opt. Call | AAA | 8,281,560 |
| | Refunding Series 2014U-6, 5.000%, 5/01/45 | | | |
| | California Municipal Finance Authority, Revenue Bonds, Creative Center of Los Altos | | | |
| | Project Pinewood & Oakwood Schools, Series 2016B: | | | |
| 800 | 4.000%, 11/01/36, 144A | 11/26 at 100.00 | N/R | 695,808 |
| 1,000 | 4.500%, 11/01/46, 144A | 11/26 at 100.00 | N/R | 848,180 |
| 1,000 | California Municipal Finance Authority, Revenue Bonds, Biola University, Series 2013, | 10/23 at 100.00 | Baa1 | 1,017,000 |
| | 5.000%, 10/01/38 | | | |
| | California Municipal Finance Authority, Revenue Bonds, Linxs APM Project, Senior Lien | | | |
| | Series 2018A: | | | |
| 3,500 | 5.000%, 12/31/43, (AMT) | 6/28 at 100.00 | BBB– | 3,567,480 |
| 2,040 | 4.000%, 12/31/47, (AMT) | 6/28 at 100.00 | A2 | 1,823,434 |
| 1,600 | California Municipal Finance Authority, Revenue Bonds, Linxs APM Project, Senior Lien | 6/28 at 100.00 | BBB– | 1,622,784 |
| | Series 2018B, 5.000%, 6/01/48, (AMT) | | | |
| 350 | California School Finance Authority, Charter School Revenue Bonds, Kepler Neighborhood | No Opt. Call | N/R | 351,043 |
| | School, Series 2017A, 5.000%, 5/01/27, 144A | | | |
| 1,615 | California School Finance Authority, School Facility Revenue Bonds, Alliance for | 7/25 at 100.00 | BBB | 1,637,045 |
| | College-Ready Public Schools Project, Series 2015A, 5.000%, 7/01/45, 144A | | | |
| 2,150 | California School Finance Authority, School Facility Revenue Bonds, Alliance for | 7/25 at 100.00 | BBB | 2,178,079 |
| | College-Ready Public Schools Project, Series 2016A, 5.000%, 7/01/46, 144A | | | |
| | California School Finance Authority, School Facility Revenue Bonds, Alliance for | | | |
| | College-Ready Public Schools Project, Series 2016C: | | | |
| 5,995 | 5.000%, 7/01/46, 144A | 7/25 at 101.00 | BBB | 6,098,833 |
| 8,340 | 5.250%, 7/01/52, 144A | 7/25 at 101.00 | BBB | 8,538,659 |
| 800 | California School Finance Authority, School Facility Revenue Bonds, Value Schools, | 7/26 at 100.00 | BB+ | 844,608 |
| | Series 2016A, 6.000%, 7/01/51, 144A | | | |
| 4,140 | California State University, Systemwide Revenue Bonds, Series 2016A, 4.000%, 11/01/38 | 5/26 at 100.00 | Aa2 | 4,162,232 |
| 10,440 | California State University, Systemwide Revenue Bonds, Series 2019A, 5.000%, 11/01/44 | 11/29 at 100.00 | Aa2 | 11,468,444 |
| 7,505 | California State University, Systemwide Revenue Bonds, Series 2020C, 3.000%, 11/01/40 | 11/30 at 100.00 | Aa2 | 6,277,182 |
| 1,000 | Dutchess County Local Development Corporation, New York, Revenue Bonds, Marist College | 7/25 at 100.00 | A+ | 1,025,680 |
| | Project, Series 2015A, 5.000%, 7/01/45 | | | |
| 12,750 | University of California, General Revenue Bonds, Limited Project Series 2017M, | 5/27 at 100.00 | AA– | 13,644,667 |
| | 5.000%, 5/15/47 | | | |
| 4,400 | University of California, General Revenue Bonds, Limited Project Series 2018O, | 5/28 at 100.00 | AA– | 4,744,696 |
| | 5.000%, 5/15/48 | | | |
| 6,775 | University of California, General Revenue Bonds, Series 2017AV, 5.250%, 5/15/47 | 5/27 at 100.00 | AA | 7,335,767 |
19
| | |
| NAC | Nuveen California Quality Municipal Income Fund |
| | Portfolio of Investments (continued) |
| | August 31, 2022 (Unaudited) |
| Principal | | Optional Call | | |
| Amount (000) | Description (1) | Provisions (2) | Ratings (3) | Value |
| | Education and Civic Organizations (continued) | | | |
| $ 8,500 | University of California, General Revenue Bonds, Series 2018AZ, 5.000%, 5/15/48 | 5/28 at 100.00 | AA | $ 9,184,165 |
| 10,000 | University of California, General Revenue Bonds, Series 2020BE, 4.000%, 5/15/47 | 5/30 at 100.00 | AA | 9,631,500 |
| 101,700 | Total Education and Civic Organizations | | | 104,978,846 |
| | Financials – 0.0% (0.0% of Total Investments) | | | |
| 1,305 | Puerto Rico Urgent Interest Fund Corp (COFINA), National | No Opt. Call | N/R | 321,957 |
| | Taxable Trust Unit, Series 2007A Sr. Bond, 0.000%, 8/01/54 (4) | | | |
| | Health Care – 18.7% (11.3% of Total Investments) | | | |
| 9,345 | ABAG Finance Authority for Nonprofit Corporations, California, Revenue Bonds, Sharp | 8/23 at 100.00 | AA | 9,498,351 |
| | HealthCare, Series 2014A, 5.000%, 8/01/43 | | | |
| | California Health Facilities Financing Authority, California, Revenue Bonds, Sutter | | | |
| | Health, Series 2018A: | | | |
| 6,135 | 5.000%, 11/15/36 | 11/27 at 100.00 | A1 | 6,585,002 |
| 29,795 | 5.000%, 11/15/48 | 11/27 at 100.00 | A1 | 31,390,820 |
| 7,350 | California Health Facilities Financing Authority, Revenue Bonds, Adventist Health | 3/26 at 100.00 | A+ | 7,103,334 |
| | System/West, Refunding Series 2016A, 4.000%, 3/01/39 | | | |
| 5,810 | California Health Facilities Financing Authority, Revenue Bonds, Adventist Health | 3/23 at 100.00 | A+ | 5,379,595 |
| | System/West, Series 2013A, 4.000%, 3/01/43 | | | |
| 15,000 | California Health Facilities Financing Authority, Revenue Bonds, Cedars-Sinai Medical | 8/26 at 100.00 | Aa3 | 15,001,950 |
| | Center, Refunding Series 2016B, 4.000%, 8/15/39 | | | |
| 3,900 | California Health Facilities Financing Authority, Revenue Bonds, Children’s Hospital Los | 8/27 at 100.00 | BBB+ | 4,034,160 |
| | Angeles, Series 2017A, 5.000%, 8/15/42 | | | |
| | California Health Facilities Financing Authority, Revenue Bonds, City of Hope National | | | |
| | Medical Center, Series 2019: | | | |
| 10,625 | 4.000%, 11/15/45 | 11/29 at 100.00 | A+ | 10,086,312 |
| 20,630 | 5.000%, 11/15/49 | 11/26 at 100.00 | A+ | 21,096,651 |
| | California Health Facilities Financing Authority, Revenue Bonds, CommonSpirit Health, | | | |
| | Series 2020A: | | | |
| 31,810 | 4.000%, 4/01/44 | 4/30 at 100.00 | BBB+ | 29,852,412 |
| 10,855 | 4.000%, 4/01/45 | 4/30 at 100.00 | BBB+ | 10,135,748 |
| 2,815 | 4.000%, 4/01/49 | 4/30 at 100.00 | BBB+ | 2,588,702 |
| 14,395 | California Health Facilities Financing Authority, Revenue Bonds, Lucile Salter Packard | 5/32 at 100.00 | N/R | 13,521,224 |
| | Children’s Hospital at Stanford, Refunding Series 2022A. Forward Delivery, 4.000%, 5/15/51 | | | |
| 6,105 | California Health Facilities Financing Authority, Revenue Bonds, Lucile Salter Packard | 8/24 at 100.00 | AA– | 6,255,671 |
| | Children’s Hospital, Series 2014A, 5.000%, 8/15/43 | | | |
| 1,250 | California Health Facilities Financing Authority, Revenue Bonds, Memorial Health | 10/22 at 100.00 | AA– | 1,251,837 |
| | Services, Series 2012A, 5.000%, 10/01/33 | | | |
| | California Health Facilities Financing Authority, Revenue Bonds, Providence Health & | | | |
| | Services, Refunding Series 2014A: | | | |
| 2,230 | 5.000%, 10/01/38 | 10/24 at 100.00 | AA– | 2,318,241 |
| 8,375 | California Health Facilities Financing Authority, Revenue Bonds, Providence Health & | 10/24 at 100.00 | AA– | 8,666,199 |
| | Services, Series 2014B, 5.000%, 10/01/44 | | | |
| 16,330 | California Health Facilities Financing Authority, Revenue Bonds, Providence Saint Joseph | 10/26 at 100.00 | AA– | 15,479,697 |
| | Health, Refunding Series 2016A, 4.000%, 10/01/47 | | | |
| 16,185 | California Municipal Finance Authority, Revenue Bonds, Community Health System, Series | 2/32 at 100.00 | N/R | 15,538,895 |
| | 2021A, 4.000%, 2/01/51 – AGM Insured | | | |
| 685 | California Municipal Finance Authority, Revenue Bonds, Eisenhower Medical Center, | 7/27 at 100.00 | Baa2 | 703,796 |
| | Refunding Series 2017A, 5.000%, 7/01/42 | | | |
| 5,000 | California Municipal Finance Authority, Revenue Bonds, Eisenhower Medical Center, | 7/27 at 100.00 | Baa2 | 5,102,200 |
| | Refunding Series 2017B, 5.000%, 7/01/47 | | | |
| | California Municipal Finance Authority, Revenue Bonds, NorthBay Healthcare Group, Series 2017A: | | | |
| 11,520 | 5.250%, 11/01/41 | 11/26 at 100.00 | BBB– | 11,828,736 |
| 6,750 | 5.000%, 11/01/47 | 11/26 at 100.00 | BBB– | 6,784,088 |
20
| Principal | | Optional Call | | |
| Amount (000) | Description (1) | Provisions (2) | Ratings (3) | Value |
| | Health Care (continued) | | | |
| $ 4,820 | California Public Finance Authority, Revenue Bonds, Henry Mayo Newhall Hospital, Series | 10/26 at 100.00 | BBB– | $ 4,925,317 |
| | 2017, 5.000%, 10/15/47 | | | |
| 5,760 | California Public Finance Authority, Revenue Bonds, Sharp HealthCare, Series 2017A, | 2/28 at 100.00 | AA | 6,036,941 |
| | 5.000%, 8/01/47 | | | |
| 2,000 | California Statewide Communities Development Authority, California, Redlands Community | 10/26 at 100.00 | A– | 2,066,100 |
| | Hospital, Revenue Bonds, Series 2016, 5.000%, 10/01/46 | | | |
| | California Statewide Communities Development Authority, California, Revenue Bonds, Loma | | | |
| | Linda University Medical Center, Series 2014A: | | | |
| 1,000 | 5.250%, 12/01/34 | 12/24 at 100.00 | BB | 1,023,980 |
| 1,200 | 5.250%, 12/01/44 | 12/24 at 100.00 | BB | 1,219,812 |
| 2,375 | 5.500%, 12/01/54 | 12/24 at 100.00 | BB | 2,426,918 |
| | California Statewide Communities Development Authority, California, Revenue Bonds, Loma | | | |
| | Linda University Medical Center, Series 2016A: | | | |
| 9,385 | 5.000%, 12/01/46, 144A | 6/26 at 100.00 | BB | 9,151,408 |
| 33,895 | 5.250%, 12/01/56, 144A | 6/26 at 100.00 | BB | 33,933,979 |
| 16,445 | California Statewide Communities Development Authority, California, Revenue Bonds, Loma | 6/28 at 100.00 | BB | 16,642,504 |
| | Linda University Medical Center, Series 2018A, 5.500%, 12/01/58, 144A | | | |
| | California Statewide Communities Development Authority, Revenue Bonds, Adventist Health | | | |
| | System/West, Series 2015A: | | | |
| 2,345 | 5.000%, 3/01/35 | 3/26 at 100.00 | A+ | 2,447,430 |
| 3,000 | 5.000%, 3/01/45 | 3/26 at 100.00 | A+ | 3,070,560 |
| | California Statewide Community Development Authority, Revenue Bonds, Daughters of | | | |
| | Charity Health System, Series 2005A: | | | |
| 353 | 5.750%, 7/01/24 (5),(6) | 1/22 at 100.00 | N/R | 352,908 |
| 385 | 5.750%, 7/01/30 (5),(6) | 1/22 at 100.00 | N/R | 385,006 |
| 270 | 5.750%, 7/01/35 (5),(6) | 1/22 at 100.00 | N/R | 269,522 |
| 363 | 5.500%, 7/01/39 (5),(6) | 1/22 at 100.00 | N/R | 363,375 |
| 6,200 | Madera County, California, Certificates of Participation, Valley Children’s Hospital | 10/22 at 100.00 | A1 | 6,668,472 |
| | Project, Series 1995, 5.750%, 3/15/28 – NPFG Insured | | | |
| | Palomar Pomerado Health System, California, Revenue Bonds, Refunding Series 2016: | | | |
| 4,500 | 4.000%, 11/01/39 | 11/26 at 100.00 | BBB | 4,135,230 |
| 7,910 | 5.000%, 11/01/39 | 11/26 at 100.00 | BBB | 8,135,039 |
| 9,720 | University of California Regents, Medical Center Pooled Revenue Bonds, Series 2016L, | 5/26 at 100.00 | N/R | 9,613,469 |
| | 4.000%, 5/15/44 | | | |
| 354,821 | Total Health Care | | | 353,071,591 |
| | Housing/Multifamily – 17.3% (10.4% of Total Investments) | | | |
| 22,285 | California Community Housing Agency, California, Essential Housing Revenue Bonds, | 8/31 at 100.00 | N/R | 17,830,897 |
| | Creekwood, Series 2021A, 4.000%, 2/01/56, 144A | | | |
| 22,070 | California Community Housing Agency, California, Essential Housing Revenue Bonds, | 8/31 at 100.00 | N/R | 17,036,495 |
| | Glendale Properties, Junior Series 2021A-2, 4.000%, 8/01/47, 144A | | | |
| 23,610 | California Community Housing Agency, California, Essential Housing Revenue Bonds, | 2/30 at 100.00 | N/R | 22,265,647 |
| | Serenity at Larkspur Apartments, Series 2020A, 5.000%, 2/01/50, 144A | | | |
| 6,960 | California Community Housing Agency, California, Essential Housing Revenue Bonds, | 2/31 at 100.00 | N/R | 5,606,002 |
| | Stoneridge Apartments, Series 2021A, 4.000%, 2/01/56, 144A | | | |
| 660 | California Community Housing Agency, California, Essential Housing Revenue Bonds, Summit | 8/32 at 100.00 | N/R | 534,224 |
| | at Sausalito Apartments, Series 2021A-2, 4.000%, 2/01/50, 144A | | | |
| 1,385 | California Community Housing Agency, California, Essential Housing Revenue Bonds, | 8/29 at 100.00 | N/R | 1,306,789 |
| | Verdant at Green Valley Apartments, Series 2019A, 5.000%, 8/01/49, 144A | | | |
| 7,575 | California Community Housing Agency, Workforce Housing Revenue Bonds, Annadel | 4/29 at 100.00 | N/R | 7,048,765 |
| | Apartments, Series 2019A, 5.000%, 4/01/49, 144A | | | |
| 22,911 | California Housing Finance Agency, Municipal Certificate Revenue Bonds, Class A Series | No Opt. Call | BBB+ | 22,723,146 |
| | 2019-2, 4.000%, 3/20/33 | | | |
| 18,962 | California Housing Finance Agency, Municipal Certificate Revenue Bonds, Class A Series | No Opt. Call | BBB+ | 17,674,258 |
| | 2021-1, 3.500%, 11/20/35 | | | |
21
| NAC | Nuveen California Quality Municipal Income Fund |
| | Portfolio of Investments (continued) |
| | August 31, 2022 (Unaudited) |
| Principal | | Optional Call | | |
| Amount (000) | Description (1) | Provisions (2) | Ratings (3) | Value |
| | Housing/Multifamily (continued) | | | |
| $ 3,401 | California Housing Finance Agency, Municipal Certificate Revenue Bonds, Class A | No Opt. Call | BBB+ | $ 3,413,133 |
| | Series2019-1, 4.250%, 1/15/35 | | | |
| | California Municipal Finance Authority, Mobile Home Park Revenue Bonds, Caritas | | | |
| | Affordable Housing Inc Projects, Senior Series 2014A: | | | |
| 1,680 | 5.250%, 8/15/39 | 8/24 at 100.00 | A– | 1,716,943 |
| 2,150 | 5.250%, 8/15/49 | 8/24 at 100.00 | A– | 2,186,894 |
| | California Public Finance Authority, University Housing Revenue Bonds, National Campus | | | |
| | Community Development – Claremont Properties LLC Claremont Colleges Project, Series 2017A: | | | |
| 1,325 | 5.000%, 7/01/37, 144A | 7/27 at 100.00 | Caa2 | 1,036,388 |
| 1,000 | 5.000%, 7/01/47, 144A | 7/27 at 100.00 | Caa2 | 747,100 |
| 23,750 | CMFA Special Finance Agency I, California, Essential Housing Revenue Bonds, The Mix at | 4/31 at 100.00 | N/R | 19,374,775 |
| | Center City, Series 2021A-2, 4.000%, 4/01/56, 144A | | | |
| 8,060 | CMFA Special Finance Agency, California, Essential Housing Revenue Bonds, Enclave | 2/32 at 100.00 | N/R | 6,768,143 |
| | Apartments, Senior Series 2022A-1, 4.000%, 8/01/58, 144A | | | |
| 7,345 | CMFA Special Finance Agency, California, Essential Housing Revenue Bonds, Latitude 33, | 12/31 at 100.00 | N/R | 5,219,430 |
| | Senior Series 2021A-1, 3.000%, 12/01/56, 144A | | | |
| 3,265 | CSCDA Community Improvement Authority, California, Essential Housing Revenue Bonds, 777 | 5/32 at 100.00 | N/R | 2,739,466 |
| | Place-Pomona, Senior Lien Series 2021A-1, 3.600%, 5/01/47, 144A | | | |
| 11,510 | CSCDA Community Improvement Authority, California, Essential Housing Revenue Bonds, 777 | 5/32 at 100.00 | N/R | 8,573,108 |
| | Place-Pomona, Senior Lien Series 2021A-2, 3.250%, 5/01/57, 144A | | | |
| 1,720 | CSCDA Community Improvement Authority, California, Essential Housing Revenue Bonds, | 10/31 at 100.00 | N/R | 1,317,176 |
| | Acacia on Santa Rosa Creek, Mezzanine Lien Series 2021B, 4.000%, 10/01/46, 144A | | | |
| 8,910 | CSCDA Community Improvement Authority, California, Essential Housing Revenue Bonds, | 10/31 at 100.00 | N/R | 7,952,086 |
| | Acacia on Santa Rosa Creek, Senior Lien Series 2021A, 4.000%, 10/01/56, 144A | | | |
| 20,500 | CSCDA Community Improvement Authority, California, Essential Housing Revenue Bonds, | 10/31 at 100.00 | N/R | 16,482,000 |
| | Altana Glendale, Series 2021A-2, 4.000%, 10/01/56, 144A | | | |
| 23,610 | CSCDA Community Improvement Authority, California, Essential Housing Revenue Bonds, | 1/31 at 100.00 | N/R | 22,154,916 |
| | Center City Anaheim, Series 2020A, 5.000%, 1/01/54, 144A | | | |
| 3,750 | CSCDA Community Improvement Authority, California, Essential Housing Revenue Bonds, | 2/32 at 100.00 | N/R | 2,702,925 |
| | Dublin Social Senior Lien Series 2021A-2, 3.000%, 2/01/57, 144A | | | |
| 5,245 | CSCDA Community Improvement Authority, California, Essential Housing Revenue Bonds, | 8/31 at 100.00 | N/R | 4,555,912 |
| | Jefferson-Anaheim Series 2021A-1, 2.875%, 8/01/41, 144A | | | |
| 7,030 | CSCDA Community Improvement Authority, California, Essential Housing Revenue Bonds, | 8/31 at 100.00 | N/R | 5,199,599 |
| | Jefferson-Anaheim Series 2021A-2, 3.125%, 8/01/56, 144A | | | |
| | CSCDA Community Improvement Authority, California, Essential Housing Revenue Bonds, | | | |
| | Millennium South Bay-Hawthorne, Series 2021A-1 and A-2: | | | |
| 6,210 | 3.375%, 7/01/43, 144A | 7/32 at 100.00 | N/R | 5,189,883 |
| 8,060 | 3.250%, 7/01/56, 144A | 7/32 at 100.00 | N/R | 5,862,683 |
| 21,695 | CSCDA Community Improvement Authority, California, Essential Housing Revenue Bonds, Moda | 10/31 at 100.00 | N/R | 17,528,692 |
| | at Monrovia Station, Social Series 2021A-2, 4.000%, 10/01/56, 144A | | | |
| | CSCDA Community Improvement Authority, California, Essential Housing Revenue Bonds, | | | |
| | Monterrey Station Apartments, Senior Lien Series 2021A-1: | | | |
| 2,215 | 3.000%, 7/01/43, 144A | 7/32 at 100.00 | N/R | 1,728,121 |
| 9,645 | 3.125%, 7/01/56, 144A | 7/32 at 100.00 | N/R | 6,817,665 |
| 450 | CSCDA Community Improvement Authority, California, Essential Housing Revenue Bonds, | 3/32 at 100.00 | N/R | 338,355 |
| | Orange City Portfolio, Mezzanine Lien Series 2021B, 4.000%, 3/01/57, 144A | | | |
| 7,185 | CSCDA Community Improvement Authority, California, Essential Housing Revenue Bonds, | 3/32 at 100.00 | N/R | 5,206,323 |
| | Orange City Portfolio, Senior Lien Series 2021A-2, 3.000%, 3/01/57, 144A | | | |
| 12,115 | CSCDA Community Improvement Authority, California, Essential Housing Revenue Bonds, | 8/31 at 100.00 | N/R | 9,943,507 |
| | Parallel-Anaheim Series 2021A, 4.000%, 8/01/56, 144A | | | |
| 5,720 | CSCDA Community Improvement Authority, California, Essential Housing Revenue Bonds, | 12/31 at 100.00 | N/R | 4,490,543 |
| | Pasadena Portfolio Social Bond, Mezzanine Senior Series 2021B, 4.000%, 12/01/56, 144A | | | |
22
| Principal | | Optional Call | | |
| Amount (000) | Description (1) | Provisions (2) | Ratings (3) | Value |
| | Housing/Multifamily (continued) | | | |
| $ 4,000 | CSCDA Community Improvement Authority, California, Essential Housing Revenue Bonds, | 12/31 at 100.00 | N/R | $ 2,896,560 |
| | Pasadena Portfolio Social Bond, Series 2021A-2, 3.000%, 12/01/56 | | | |
| 590 | CSCDA Community Improvement Authority, California, Essential Housing Revenue Bonds, | 7/31 at 100.00 | N/R | 557,296 |
| | Renaissance at City Center, Series 2020A, 5.000%, 7/01/51, 144A | | | |
| 8,025 | CSCDA Community Improvement Authority, California, Essential Housing Revenue Bonds, | 7/31 at 100.00 | N/R | 6,215,282 |
| | Union South Bay, Series 2021A-2, 4.000%, 7/01/56, 144A | | | |
| 2,010 | CSCDA Community Improvement Authority, California, Essential Housing Revenue Bonds, | 9/31 at 100.00 | N/R | 1,563,921 |
| | Waterscape Apartments, Mezzanine Lien Series 2021B, 4.000%, 9/01/46, 144A | | | |
| 5,700 | CSCDA Community Improvement Authority, California, Essential Housing Revenue Bonds, | 6/31 at 100.00 | N/R | 4,339,410 |
| | Westgate Phase 1-Pasadena Apartments, Senior Lien Series 2021A-1, 3.000%, 6/01/47, 144A | | | |
| 20,760 | CSCDA Community Improvement Authority, California, Essential Housing Revenue Bonds, | 6/31 at 100.00 | N/R | 14,610,680 |
| | Westgate Phase 1-Pasadena Apartments, Senior Lien Series 2021A-2, 3.125%, 6/01/57, 144A | | | |
| 21,185 | CSCDA Community Improvement Authority, California, Essential Housing Revenue Bonds, Wood | 6/32 at 100.00 | N/R | 14,842,635 |
| | Creek Apartments, Senior Lien Series 2021A-1, 3.000%, 12/01/49 | | | |
| 396,234 | Total Housing/Multifamily | | | 326,297,773 |
| | Tax Obligation/General – 33.2% (20.0% of Total Investments) | | | |
| 4,125 | Alameda Unified School District, Alameda County, California, General Obligation Bonds, | No Opt. Call | AA | 3,824,122 |
| | Series 2004A, 0.000%, 8/01/25 – AGM Insured | | | |
| 5,245 | California State, General Obligation Bonds, Refunding Various Purpose Series 2012, | 10/22 at 100.00 | Aa2 | 5,257,431 |
| | 5.000%, 9/01/36 | | | |
| | California State, General Obligation Bonds, Refunding Various Purpose Series 2013: | | | |
| 9,260 | 5.000%, 2/01/29 | 2/23 at 100.00 | Aa2 | 9,366,490 |
| 1,710 | 5.000%, 2/01/31 | 2/23 at 100.00 | Aa2 | 1,728,810 |
| | California State, General Obligation Bonds, Refunding Various Purpose Series 2016: | | | |
| 3,750 | 5.000%, 9/01/30 | 9/26 at 100.00 | Aa2 | 4,107,600 |
| 4,600 | 5.000%, 8/01/33 | 8/26 at 100.00 | Aa2 | 4,996,336 |
| 8,000 | 5.000%, 9/01/37 | 9/26 at 100.00 | Aa2 | 8,611,360 |
| 7,250 | California State, General Obligation Bonds, Refunding Various Purpose Series 2020, | 11/30 at 100.00 | Aa2 | 6,900,840 |
| | 3.000%, 11/01/35 | | | |
| | California State, General Obligation Bonds, Various Purpose Refunding Series 2015: | | | |
| 6,700 | 5.000%, 8/01/32 | 2/25 at 100.00 | Aa2 | 7,083,307 |
| 11,000 | 5.000%, 8/01/34 | 8/25 at 100.00 | Aa2 | 11,709,280 |
| 5,000 | California State, General Obligation Bonds, Various Purpose Refunding Series 2016, | 9/26 at 100.00 | Aa2 | 5,390,000 |
| | 5.000%, 9/01/36 | | | |
| | California State, General Obligation Bonds, Various Purpose Series 2013: | | | |
| 9,940 | 5.000%, 4/01/37 | 4/23 at 100.00 | Aa2 | 10,079,955 |
| 9,755 | 5.000%, 2/01/43 | 2/23 at 100.00 | Aa2 | 9,850,989 |
| 15,145 | 5.000%, 4/01/43 | 4/23 at 100.00 | Aa2 | 15,353,850 |
| 7,240 | 5.000%, 11/01/43 | 11/23 at 100.00 | Aa2 | 7,438,666 |
| | California State, General Obligation Bonds, Various Purpose Series 2014: | | | |
| 24,970 | 5.000%, 5/01/32 | 5/24 at 100.00 | Aa2 | 25,983,782 |
| 8,910 | 5.000%, 10/01/39 | 10/24 at 100.00 | Aa2 | 9,327,701 |
| 10,245 | 5.000%, 12/01/43 | 12/23 at 100.00 | Aa2 | 10,545,383 |
| 1,815 | 5.000%, 10/01/44 | 10/24 at 100.00 | Aa2 | 1,895,205 |
| 9,500 | California State, General Obligation Bonds, Various Purpose Series 2015, 5.000%, 3/01/45 | 3/25 at 100.00 | Aa2 | 9,954,100 |
| 3,780 | California State, General Obligation Bonds, Various Purpose Series 2017, | 11/27 at 100.00 | Aa2 | 4,059,833 |
| | 5.000%, 11/01/47 | | | |
| 8,360 | California State, General Obligation Bonds, Various Purpose Series 2018, | 4/26 at 100.00 | Aa2 | 8,849,729 |
| | 5.000%, 10/01/47 | | | |
| 8,000 | California State, General Obligation Bonds, Various Purpose Series 2018. Bid Group A/B, | 10/28 at 100.00 | Aa2 | 8,677,920 |
| | 5.000%, 10/01/48 | | | |
| 3,570 | California State, General Obligation Bonds, Various Purpose Series 2019, | 10/29 at 100.00 | N/R | 3,895,513 |
| | 5.000%, 10/01/49 | | | |
23
| NAC | Nuveen California Quality Municipal Income Fund |
| | Portfolio of Investments (continued) |
| | August 31, 2022 (Unaudited) |
| Principal | | Optional Call | | |
| Amount (000) | Description (1) | Provisions (2) | Ratings (3) | Value |
| | Tax Obligation/General (continued) | | | |
| $ 1,770 | California State, General Obligation Bonds, Various Purpose Series 2020, | 11/25 at 100.00 | Aa2 | $ 1,770,814 |
| | 4.000%, 11/01/45 | | | |
| 1,500 | California State, General Obligation Bonds, Various Purpose Series 2021, | 4/31 at 100.00 | N/R | 1,670,835 |
| | 5.000%, 10/01/41 | | | |
| 3,480 | Centinela Valley Union High School District, Los Angeles County, California, General | No Opt. Call | A+ | 3,656,332 |
| | Obligation Bonds, Series 2002A, 5.250%, 2/01/26 – NPFG Insured | | | |
| 5,400 | Central Unified School District, Fresno County, California, General Obligation Bonds, | 8/26 at 100.00 | Aa3 | 5,177,034 |
| | 2016 Election Series 2018B., 4.000%, 8/01/48 | | | |
| 7,860 | Corona-Norco Unified School District, Riverside County, California, General Obligation | 8/28 at 100.00 | N/R | 6,412,974 |
| | Bonds, Election 2014, Series 2019C, 3.000%, 8/01/44 – BAM Insured | | | |
| 5,000 | Elk Grove Unified School District, Sacramento County, California, General Obligation | 8/26 at 100.00 | N/R | 4,848,800 |
| | Bonds, Election of 2016, Series 2017, 4.000%, 8/01/46 | | | |
| 3,300 | Evergreen School District, Santa Clara County, California, General Obligation Bonds, | 8/28 at 100.00 | Aa2 | 3,563,934 |
| | Election of 2014, Series 2018, 5.000%, 8/01/46 | | | |
| 12,500 | Glendale Community College District, Los Angeles County, California, General Obligation | 8/29 at 100.00 | Aa2 | 12,302,875 |
| | Bonds, Election 2016 Taxable Refunding Series 2020B, 4.000%, 8/01/50 | | | |
| 18,500 | Grossmont Healthcare District, California, General Obligation Bonds, Refunding Series | 7/25 at 100.00 | N/R | 18,256,910 |
| | 2015D, 4.000%, 7/15/40 | | | |
| 5,150 | Hacienda La Puente Unified School District Facilities Financing Authority, California, | No Opt. Call | AA | 5,648,262 |
| | General Obligation Revenue Bonds, Program Series 2007, 5.000%, 8/01/26 – AGM Insured | | | |
| 3,000 | Hacienda La Puente Unified School District, Los Angeles County, California, General | 8/27 at 100.00 | AAA | 2,883,780 |
| | Obligation Bonds, 2016 Election, Series 2017A, 4.000%, 8/01/47 | | | |
| 5,585 | Lake Elsinore Unified School District, Riverside County, California, General Obligation | 8/27 at 100.00 | N/R | 5,150,822 |
| | Bonds, 2016 Election Series B, 4.000%, 8/01/49 – BAM Insured | | | |
| 5,630 | Lake Tahoe Unified School District, El Dorado County, California, General Obligation | No Opt. Call | AA | 4,361,730 |
| | Bonds, Series 2010, 6.375%, 8/01/45 – AGM Insured (7) | | | |
| 1,285 | Los Angeles Unified School District, Los Angeles County, California, General Obligation | 7/30 at 100.00 | N/R | 1,310,867 |
| | Bonds, Measure Q Series 2020C, 4.000%, 7/01/38 | | | |
| 3,100 | Manteca Unified School District, San Joaquin County, California, General Obligation | 8/27 at 100.00 | Aa2 | 3,055,205 |
| | Bonds, Election 2014 Series 2017B, 4.000%, 8/01/42 | | | |
| | Marin Healthcare District, Marin County, California, General Obligation Bonds, 2013 | | | |
| | Election, Series 2015A: | | | |
| 10,000 | 4.000%, 8/01/40 | 8/25 at 100.00 | N/R | 9,864,700 |
| 7,500 | 4.000%, 8/01/45 | 8/25 at 100.00 | N/R | 7,156,950 |
| 4,100 | Monrovia Unified School District, Los Angeles County, California, General Obligation | No Opt. Call | Aa3 | 3,522,187 |
| | Bonds, Series 2001B, 0.000%, 8/01/27 – FGIC Insured | | | |
| 6,950 | Morgan Hill Unified School District, Santa Clara County, California, General Obligation | 8/27 at 100.00 | Aa1 | 6,881,959 |
| | Bonds, Election 2012 Series 2017B, 4.000%, 8/01/47 | | | |
| 10,765 | North Orange County Community College District, California, General Obligation Bonds, | No Opt. Call | AA+ | 9,288,257 |
| | Election of 2002 Series 2003B, 0.000%, 8/01/27 – FGIC Insured | | | |
| 1,815 | Orland Joint Unified School District, Glenn and Tehama Counties, California, General | 8/37 at 100.00 | AA | 1,314,677 |
| | Obligation Bonds, 2008 Election, Series 2012B, 6.000%, 8/01/51 (7) | | | |
| | Pajaro Valley Unified School District, Santa Cruz County, California, General Obligation | | | |
| | Bonds, Refunding Election 2012 Series 2013A: | | | |
| 9,650 | 4.250%, 8/01/47 | 8/23 at 100.00 | N/R | 9,651,062 |
| 10,330 | Palomar Pomerado Health, California, General Obligation Bonds, Convertible Capital | No Opt. Call | A2 | 5,819,405 |
| | Appreciation, Election 2004 Series 2010A, 0.000%, 8/01/35 | | | |
| 5,000 | Paramount Unified School District, Los Angeles County, California, General Obligation | 2/33 at 100.00 | Aa3 | 5,878,900 |
| | Bonds, Election 2006 Series 2011, 0.000%, 8/01/45 (7) | | | |
| 2,500 | Pleasant Valley School District, Ventura County, California, General Obligation Bonds, | 8/29 at 100.00 | N/R | 2,469,025 |
| | Refunding Series B, 4.000%, 8/01/46 | | | |
24
| | | | | |
| Principal | | Optional Call | | |
| Amount (000) | Description (1) | Provisions (2) | Ratings (3) | Value |
| | Tax Obligation/General (continued) | | | |
| | Puerto Rico, General Obligation Bonds, Restructured Series 2022A-1: | | | |
| $ 7,495 | 4.000%, 7/01/37 | 7/31 at 103.00 | N/R | $ 6,716,195 |
| 23,736 | 4.000%, 7/01/41 | 7/31 at 103.00 | N/R | 20,728,886 |
| 5,281 | 4.000%, 7/01/46 | 7/31 at 103.00 | N/R | 4,484,678 |
| 28,000 | San Bernardino Community College District, California, General Obligation Bonds, | No Opt. Call | Aa1 | 10,840,760 |
| | Election of 2008 Series 2009B, 0.000%, 8/01/44 | | | |
| 8,075 | San Dieguito Union High School District, San Diego County, California, General | 8/28 at 100.00 | Aa1 | 8,006,443 |
| | Obligation Bonds, Election 2012, Series 2018D-2, 4.000%, 8/01/42 | | | |
| 7,500 | San Francisco Bay Area Rapid Transit District, General Obligation Bonds, Election of | 2/32 at 100.00 | N/R | 7,573,275 |
| | 2016, Green Series 2022D-1, 4.250%, 8/01/52 | | | |
| 9,760 | San Francisco Community College District, California, General Obligation Bonds, Election | 6/30 at 100.00 | N/R | 9,278,734 |
| | 2020 Series 2020A, 4.000%, 6/15/45 | | | |
| 21,000 | San Marcos Unified School District, San Diego County, California, General Obligation | No Opt. Call | AA– | 5,665,170 |
| | Bonds, 2010 Election, Series 2012B, 0.000%, 8/01/51 | | | |
| 20,220 | San Mateo County Community College District, California, General Obligation Bonds, | 9/28 at 100.00 | AAA | 21,997,540 |
| | Election 2014 Series 2018B, 5.000%, 9/01/45 | | | |
| 1,220 | San Mateo Union High School District, San Mateo County, California, General Obligation | 9/41 at 100.00 | Aaa | 856,233 |
| | Bonds, Election 2010 Series 2011A, 0.000%, 7/01/51 (7) | | | |
| 4,970 | San Rafael City High School District, Marin County, California, General Obligation | No Opt. Call | AA+ | 4,277,878 |
| | Bonds, Series 2004B, 0.000%, 8/01/27 – FGIC Insured | | | |
| 1,540 | Santa Maria Joint Union High School District, Santa Barbara and San Luis Obispo | No Opt. Call | Aa3 | 1,611,656 |
| | Counties, California, General Obligation Bonds, Series 2003B, 5.625%, 8/01/24 – AGM Insured | | | |
| 4,175 | Southwestern Community College District, San Diego County, California, General | No Opt. Call | Aa2 | 3,847,179 |
| | Obligation Bonds, Election of 2000, Series 2004, 0.000%, 8/01/25 – FGIC Insured | | | |
| 5,530 | Stockton Unified School District, San Joaquin County, California, General Obligation | 8/37 at 100.00 | AA | 5,830,666 |
| | Bonds, Election 2008 Series 2011D, 0.000%, 8/01/50 – AGM Insured (7) | | | |
| 26,000 | Sylvan Union School District, Stanislaus County, California, General Obligation Bonds, | No Opt. Call | AA | 21,546,980 |
| | Election of 2006, Series 2010, 0.000%, 8/01/49 – AGM Insured (7) | | | |
| | Washington Township Health Care District, Alameda County, California, General Obligation | | | |
| | Bonds, 2004 Election Series 2013B: | | | |
| 4,740 | 5.500%, 8/01/38 | 8/24 at 100.00 | A1 | 4,932,444 |
| 4,830 | 5.500%, 8/01/40 | 8/24 at 100.00 | A1 | 5,017,984 |
| | Washington Township Health Care District, Alameda County, California, General Obligation | | | |
| | Bonds, 2012 Election Series 2013A: | | | |
| 4,355 | 5.500%, 8/01/38 | 8/24 at 100.00 | A1 | 4,531,813 |
| 3,500 | 5.500%, 8/01/40 | 8/24 at 100.00 | A1 | 3,636,220 |
| 28,920 | Washington Township Health Care District, Alameda County, California, General Obligation | 8/25 at 100.00 | N/R | 27,465,035 |
| | Bonds, 2012 Election Series 2015B, 4.000%, 8/01/45 | | | |
| 2,015 | Wiseburn School District, Los Angeles County, California, General Obligation Bonds, | 9/22 at 100.00 | Aa2 | 2,017,841 |
| | Series 2012C, 5.000%, 8/01/26 | | | |
| 140,160 | Yosemite Community College District, California, General Obligation Bonds, Capital | No Opt. Call | Aa2 | 107,752,205 |
| | Appreciation, Election 2004, Series 2010D, 0.000%, 8/01/42 (7) | | | |
| 702,562 | Total Tax Obligation/General | | | 625,422,313 |
| | Tax Obligation/Limited – 19.5% (11.7% of Total Investments) | | | |
| 1,675 | Beaumont Financing Authority, California, Local Agency Revenue Bonds, Improvement Area | 9/25 at 100.00 | N/R | 1,739,286 |
| | 19A, Series 2015B, 5.000%, 9/01/35 | | | |
| 1,655 | Bell Community Housing Authority, California, Lease Revenue Bonds, Series 2005, 5.000%, | 10/22 at 100.00 | N/R | 1,662,911 |
| | 10/01/36 – AMBAC Insured | | | |
| 745 | Bell Community Redevelopment Agency, California, Tax Allocation Bonds, Bell Project | 10/22 at 100.00 | AA | 747,250 |
| | Area, Series 2003, 5.500%, 10/01/23 – RAAI Insured | | | |
25
| NAC | Nuveen California Quality Municipal Income Fund |
| | Portfolio of Investments (continued) |
| | August 31, 2022 (Unaudited) |
| Principal | | Optional Call | | |
| Amount (000) | Description (1) | Provisions (2) | Ratings (3) | Value |
| | Tax Obligation/Limited (continued) | | | |
| $ 1,200 | California Infrastructure and Economic Development Bank, Lease Revenue Bonds, California | | | |
| | State Teachers Retirement System Headquarters Expansion, Green Bond-Climate Bond Certified | | | |
| | Series 2019, 5.000%, 8/01/39 | 8/29 at 100.00 | N/R | $ 1,304,592 |
| | California State Public Works Board, Lease Revenue Bonds, Department of Corrections & | | | |
| | Rehabilitation, Series 2013G: | | | |
| 10,690 | 5.250%, 9/01/30 | 9/23 at 100.00 | Aa3 | 10,988,358 |
| 18,135 | 5.250%, 9/01/32 | 9/23 at 100.00 | Aa3 | 18,613,945 |
| | California State Public Works Board, Lease Revenue Bonds, Department of Corrections & | | | |
| | Rehabilitation, Various Correctional Facilities Series 2013F: | | | |
| 8,685 | 5.250%, 9/01/31 | 9/23 at 100.00 | Aa3 | 8,920,450 |
| 1,450 | 5.250%, 9/01/33 | 9/23 at 100.00 | Aa3 | 1,487,280 |
| 10,525 | California State Public Works Board, Lease Revenue Bonds, Department of Corrections & | 9/24 at 100.00 | Aa3 | 10,978,627 |
| | Rehabilitation, Various Correctional Facilities Series 2014A, 5.000%, 9/01/39 | | | |
| 17,395 | California State Public Works Board, Lease Revenue Bonds, Judicial Council of | 10/24 at 100.00 | Aa3 | 18,174,470 |
| | California, New Stockton Courthouse, Series 2014B, 5.000%, 10/01/39 | | | |
| 1,000 | California State Public Works Board, Lease Revenue Bonds, Judicial Council of | 3/23 at 100.00 | Aa3 | 1,013,090 |
| | California, Various Projects Series 2013A, 5.000%, 3/01/30 | | | |
| 1,000 | California State Public Works Board, Lease Revenue Bonds, Judicial Council of | 6/23 at 100.00 | Aa3 | 1,018,200 |
| | California, Yuba City Courthouse, Series 2013D, 5.000%, 6/01/32 | | | |
| 9,950 | California State Public Works Board, Lease Revenue Bonds, Various Capital Projects, | 11/23 at 100.00 | Aa3 | 10,216,063 |
| | Series 2013I, 5.000%, 11/01/38 | | | |
| 13,520 | California State Public Works Board, Lease Revenue Bonds, Various Capital Projects, | 9/24 at 100.00 | Aa3 | 14,102,712 |
| | Series 2014E, 5.000%, 9/01/39 | | | |
| | Government of Guam, Business Privilege Tax Bonds, Refunding Series 2015D: | | | |
| 9,000 | 5.000%, 11/15/29 | 11/25 at 100.00 | BB | 9,333,180 |
| 11,000 | 5.000%, 11/15/35 | 11/25 at 100.00 | BB | 11,269,280 |
| 190 | Inglewood Redevelopment Agency, California, Tax Allocation Bonds, Merged Redevelopment | No Opt. Call | N/R | 192,795 |
| | Project, Refunding Series 1998A, 5.250%, 5/01/23 – AMBAC Insured | | | |
| | Jurupa Public Financing Authority, California, Special Tax Revenue Bonds, Series 2014A: | | | |
| 530 | 5.000%, 9/01/29 | 9/24 at 100.00 | A+ | 554,634 |
| 1,900 | 5.000%, 9/01/30 | 9/24 at 100.00 | A+ | 1,985,291 |
| 1,220 | 5.000%, 9/01/31 | 9/24 at 100.00 | A+ | 1,272,582 |
| 1,955 | Jurupa Public Financing Authority, California, Special Tax Revenue Bonds, Series 2015A, | 9/25 at 100.00 | A+ | 2,053,806 |
| | 5.000%, 9/01/43 | | | |
| 810 | Lake Elsinore Public Financing Authority, California, Local Agency Revenue Bonds, | 9/25 at 100.00 | N/R | 834,025 |
| | Refunding Series 2015, 5.000%, 9/01/40 | | | |
| 1,000 | Lathrop, California, Limited Obligation Improvement Bonds, Crossroads Assessment | 9/25 at 100.00 | N/R | 1,029,690 |
| | District, Series 2015, 5.000%, 9/02/40 | | | |
| | Los Angeles County Metropolitan Transportation Authority, California, Measure R Sales | | | |
| | Tax Revenue Bonds, Senior Series 2016A: | | | |
| 5,125 | 5.000%, 6/01/36 | 6/26 at 100.00 | AAA | 5,551,656 |
| 5,620 | 5.000%, 6/01/37 | 6/26 at 100.00 | AAA | 6,077,749 |
| 5,210 | Los Angeles County Metropolitan Transportation Authority, California, Proposition A | 7/27 at 100.00 | AAA | 5,676,451 |
| | First Tier Senior Sales Tax Revenue Bonds, Green Series 2017A, 5.000%, 7/01/41 | | | |
| | Los Angeles County Metropolitan Transportation Authority, California, Proposition C | | | |
| | Sales Tax Revenue Bonds, Senior Lien Series 2017A: | | | |
| 10,455 | 5.000%, 7/01/38 | 7/27 at 100.00 | AAA | 11,441,639 |
| 3,995 | 5.000%, 7/01/39 | 7/27 at 100.00 | AAA | 4,365,576 |
| 15,615 | 5.000%, 7/01/42 | 7/27 at 100.00 | AAA | 16,985,216 |
| 15,000 | Los Angeles County Metropolitan Transportation Authority, California, Proposition C | 7/31 at 100.00 | N/R | 16,911,600 |
| | Sales Tax Revenue Bonds, Senior Lien Series 2021A, 5.000%, 7/01/42 | | | |
| 2,000 | Los Angeles County Public Works Financing Authority, California, Lease Revenue Bonds, | 12/29 at 100.00 | AA+ | 2,195,480 |
| | Series 2019E-1, 5.000%, 12/01/49 | | | |
26
| Principal | | Optional Call | | |
| Amount (000) | Description (1) | Provisions (2) | Ratings (3) | Value |
| | Tax Obligation/Limited (continued) | | | |
| | Lynwood Redevelopment Agency, California, Tax Allocation Revenue Bonds, Project Area A, | | | |
| | Subordinate Lien Series 2011A: | | | |
| $ 1,345 | 6.750%, 9/01/26 | 10/22 at 100.00 | A | $ 1,349,102 |
| 750 | 7.000%, 9/01/31 | 10/22 at 100.00 | A | 752,528 |
| 1,835 | Modesto, California, Special Tax Bonds, Community Facilties District 2004-1 Village One | 9/24 at 100.00 | BBB+ | 1,898,840 |
| | 2, Refunding Series 2014, 5.000%, 9/01/31 | | | |
| 1,000 | Norco Redevelopment Agency, California, Tax Allocation Bonds, Project Area 1, Series | 10/22 at 100.00 | A+ | 1,003,310 |
| | 2009, 7.000%, 3/01/34 | | | |
| 11,095 | Ontario Redevelopment Financing Authority, San Bernardino County, California, Revenue | No Opt. Call | Baa2 | 11,791,100 |
| | Bonds, Redevelopment Project 1, Refunding Series 1995, 7.400%, 8/01/25 – NPFG Insured | | | |
| | Patterson Public Finance Authority, California, Revenue Bonds, Community Facilities | | | |
| | District 2001-1, Senior Series 2013A: | | | |
| 11,240 | 5.250%, 9/01/30 | 9/23 at 100.00 | N/R | 11,452,211 |
| 10,075 | 5.750%, 9/01/39 | 9/23 at 100.00 | N/R | 10,265,821 |
| 1,545 | Patterson Public Finance Authority, California, Revenue Bonds, Community Facilities | 9/23 at 100.00 | N/R | 1,576,132 |
| | District 2001-1, Subordinate Lien Series 2013B, 5.875%, 9/01/39 | | | |
| 8,750 | Pittsburg Redevelopment Agency, California, Tax Allocation Bonds, Los Medanos Community | No Opt. Call | AA– | 8,537,375 |
| | Development Project, Series 1999, 0.000%, 8/01/23 – AMBAC Insured | | | |
| | Puerto Rico Sales Tax Financing Corporation, Sales Tax Revenue Bonds, Restructured 2018A-1: | | | |
| 14,741 | 0.000%, 7/01/51 | 7/28 at 30.01 | N/R | 3,143,666 |
| 58,772 | 5.000%, 7/01/58 | 7/28 at 100.00 | N/R | 57,014,717 |
| 43 | Puerto Rico Sales Tax Financing Corporation, Sales Tax Revenue Bonds, Taxable | 7/28 at 100.00 | N/R | 39,687 |
| | Restructured Cofina Project Series 2019A-2, 4.536%, 7/01/53 | | | |
| 3,500 | Rancho Cucamonga Redevelopment Agency Successor Agency, California, Tax Allocation | 9/24 at 100.00 | AA+ | 3,673,670 |
| | Bonds, Rancho Redevelopment Project, Series 2014, 5.000%, 9/01/30 | | | |
| 815 | River Islands Public Financing Authority, California, Special Tax Bonds, Community | 9/29 at 103.00 | N/R | 800,794 |
| | Facilities District 2003-1 Improvement Area 1, Refunding Series 2022A-1, 4.250%, | | | |
| | 9/01/47 - AGM Insured | | | |
| 5,000 | Riverside County Transportation Commission, California, Sales Tax Revenue Bonds, | 12/27 at 100.00 | AA+ | 5,452,550 |
| | Refunding Limited Tax Series 2017B, 5.000%, 6/01/39 | | | |
| | Riverside County, California, Special Tax Bonds, Community Facilities District 04-2 Lake | | | |
| | Hill Crest, Series 2012: | | | |
| 990 | 5.000%, 9/01/29 | 3/23 at 100.00 | N/R | 998,593 |
| 2,615 | 5.000%, 9/01/35 | 3/23 at 100.00 | N/R | 2,632,390 |
| | Riverside County, California, Special Tax Bonds, Community Facilities District 05-8 | | | |
| | Scott Road, Series 2013: | | | |
| 555 | 5.000%, 9/01/30 | 10/22 at 100.00 | N/R | 555,727 |
| 710 | 5.000%, 9/01/42 | 10/22 at 100.00 | N/R | 710,518 |
| | Roseville, California, Special Tax Bonds, Community Facilities District 1 Westpark, | | | |
| | Refunding Series 2015: | | | |
| 385 | 5.000%, 9/01/31 | 9/25 at 100.00 | N/R | 403,553 |
| 575 | 5.000%, 9/01/37 | 9/25 at 100.00 | N/R | 597,201 |
| 5,500 | Sacramento Area Flood Control Agency, California, Consolidated Capital Assessment | 10/26 at 100.00 | AA | 5,866,080 |
| | District 2 Bonds, Series 2016A, 5.000%, 10/01/41 | | | |
| 2,540 | Sacramento Area Flood Control Agency, California, Consolidated Capital Assessment | 10/30 at 100.00 | AA | 2,515,057 |
| | District 2 Bonds, Series 2020, 4.000%, 10/01/40 | | | |
| 4,250 | Sacramento City Financing Authority, California, Tax Allocation Revenue Bonds, Merged | No Opt. Call | A | 3,051,415 |
| | Downtown Sacramento and Oak Park Projects, Series 2005A, 0.000%, 12/01/31 – FGIC Insured | | | |
| | San Buenaventura Redevelopment Agency, California, Tax Allocation Bonds, Merged Project | | | |
| | Areas, Series 2008: | | | |
| 1,000 | 7.750%, 8/01/28 | 10/22 at 100.00 | A | 1,004,110 |
| 1,325 | 8.000%, 8/01/38 | 10/22 at 100.00 | A | 1,330,512 |
| 615 | San Clemente, California, Special Tax Revenue Bonds, Community Facilities District | 9/25 at 100.00 | N/R | 633,241 |
| | 2006-1 Marblehead Coastal, Series 2015, 5.000%, 9/01/40 | | | |
27
| NAC | Nuveen California Quality Municipal Income Fund |
| | Portfolio of Investments (continued) |
| | August 31, 2022 (Unaudited) |
| Principal | | Optional Call | | |
| Amount (000) | Description (1) | Provisions (2) | Ratings (3) | Value |
| | Tax Obligation/Limited (continued) | | | |
| $ 255 | San Francisco City and County Redevelopment Agency Successor Agency, California, Special | 10/22 at 100.00 | N/R | $ 255,275 |
| | Tax Bonds, Community Facilities District 6 Mission Bay South Public Improvements, Refunding | | | |
| | Series 2013A, 5.000%, 8/01/33 | | | |
| 1,805 | San Francisco City and County Redevelopment Agency Successor Agency, California, Special | 8/24 at 100.00 | N/R | 1,841,010 |
| | Tax Bonds, Community Facilities District 7, Hunters Point Shipyard Phase One Improvements, | | | |
| | Refunding Series 2014, 5.000%, 8/01/39 | | | |
| 5,000 | San Francisco City and County Redevelopment Agency Successor Agency, California, Tax | 8/26 at 100.00 | A | 5,215,300 |
| | Allocation Bonds, Mission Bay North Redevelopment Project, Refunding Series 2016A, 5.000%, | | | |
| | 8/01/41 – NPFG Insured | | | |
| 1,060 | Signal Hill Redevelopment Agency, California, Project 1 Tax Allocation Bonds, Series | 10/22 at 100.00 | N/R | 1,063,318 |
| | 2011, 7.000%, 10/01/26 | | | |
| 2,500 | Stockton Public Financing Authority, California, Revenue Bonds, Arch Road East Community | 9/25 at 103.00 | N/R | 2,652,050 |
| | Facility District 99-02, Series 2018A, 5.000%, 9/01/37 | | | |
| | Temecula Public Financing Authority, California, Special Tax Bonds, Community Facilities | | | |
| | District 16-01, Series 2017: | | | |
| 1,145 | 5.500%, 9/01/27, 144A | No Opt. Call | N/R | 1,187,617 |
| 1,435 | 5.750%, 9/01/32, 144A | 9/27 at 100.00 | N/R | 1,536,569 |
| 5,520 | 6.250%, 9/01/47, 144A | 9/27 at 100.00 | N/R | 5,737,102 |
| 1,350 | Temecula Valley Unified School District, Riverside County, California, Special Tax | 10/22 at 100.00 | N/R | 1,351,498 |
| | Bonds, Community Facilities District 2002-1 Improvement Area 1, Series 2012, 5.000%, 9/01/33 | | | |
| 4,085 | Transbay Joint Powers Authority, California, Tax Allocation Bonds, Senior Green Series | 4/30 at 100.00 | A– | 4,314,495 |
| | 2020A, 5.000%, 10/01/45 | | | |
| 1,565 | Tustin, California, Special Tax Bonds, Community Facilities District 06-1 Tustin | 9/25 at 100.00 | A– | 1,640,042 |
| | Legacy/Columbus Villages, Refunding Series 2015A, 5.000%, 9/01/32 | | | |
| 1,620 | Virgin Islands Public Finance Authority, Gross Receipts Taxes Loan Note, Refunding | 10/22 at 100.00 | AA | 1,627,906 |
| | Series 2012A, 5.000%, 10/01/32 – AGM Insured | | | |
| 1,280 | William S Hart School Financing Authority, California, Refunding Revenue Bonds, Series | 9/23 at 100.00 | A | 1,311,565 |
| | 2013, 5.000%, 9/01/34 | | | |
| 368,436 | Total Tax Obligation/Limited | | | 367,481,531 |
| | Transportation – 24.2% (14.5% of Total Investments) | | | |
| 10,000 | Bay Area Toll Authority, California, Revenue Bonds, San Francisco Bay Area Toll Bridge, | 4/27 at 100.00 | N/R | 10,161,600 |
| | Subordinate Fixed Rate Series 2017S-7, 4.000%, 4/01/37 | | | |
| 5,295 | California Municipal Finance Authority, Special Facility Revenue Bonds, United Airlines, | No Opt. Call | B+ | 5,247,610 |
| | Inc. Los Angeles International Airport Project, Series 2019, 4.000%, 7/15/29, (AMT) | | | |
| 1,200 | Long Beach, California, Harbor Revenue Bonds, Series 2015D, 5.000%, 5/15/42 | 5/25 at 100.00 | AA | 1,266,528 |
| | Long Beach, California, Harbor Revenue Bonds, Series 2019A: | | | |
| 10,840 | 5.000%, 5/15/44 | 5/29 at 100.00 | Aa2 | 11,873,811 |
| 1,000 | 5.000%, 5/15/49 | 5/29 at 100.00 | Aa2 | 1,089,330 |
| | Los Angeles Department of Airports, California, Revenue Bonds, Los Angeles International | | | |
| | Airport, Refunding & Subordinate Series 2022C: | | | |
| 3,730 | 4.000%, 5/15/41, (AMT) | 5/32 at 100.00 | N/R | 3,552,601 |
| 4,000 | 3.250%, 5/15/49, (AMT) | 5/32 at 100.00 | N/R | 3,162,600 |
| 4,850 | Los Angeles Department of Airports, California, Revenue Bonds, Los Angeles International | 5/31 at 100.00 | N/R | 5,139,351 |
| | Airport, Refunding Subordinate Lien Series 2021A. Private Activity, 5.000%, 5/15/41, (AMT) | | | |
| 3,000 | Los Angeles Department of Airports, California, Revenue Bonds, Los Angeles International | 5/31 at 100.00 | N/R | 3,260,100 |
| | Airport, Refunding Subordinate Lien Series 2021B, 5.000%, 5/15/45 | | | |
| | Los Angeles Department of Airports, California, Revenue Bonds, Los Angeles International | | | |
| | Airport, Senior Lien Series 2015D: | | | |
| 2,600 | 5.000%, 5/15/31, (AMT) | 5/25 at 100.00 | Aa2 | 2,721,342 |
| 11,420 | 5.000%, 5/15/33, (AMT) | 5/25 at 100.00 | Aa2 | 11,887,306 |
| 3,000 | 5.000%, 5/15/36, (AMT) | 5/25 at 100.00 | Aa2 | 3,111,090 |
28
| Principal | | Optional Call | | |
| Amount (000) | Description (1) | Provisions (2) | Ratings (3) | Value |
| | Transportation (continued) | | | |
| | Los Angeles Department of Airports, California, Revenue Bonds, Los Angeles International | | | |
| | Airport, Subordinate Lien Series 2016B: | | | |
| $ 1,765 | 5.000%, 5/15/30, (AMT) | 5/26 at 100.00 | Aa3 | $ 1,873,900 |
| 1,000 | 5.000%, 5/15/34, (AMT) | 5/26 at 100.00 | Aa3 | 1,049,150 |
| | Los Angeles Department of Airports, California, Revenue Bonds, Los Angeles International | | | |
| | Airport, Subordinate Lien Series 2017A: | | | |
| 13,680 | 5.000%, 5/15/42, (AMT) | 5/27 at 100.00 | Aa3 | 14,211,331 |
| 33,265 | 5.000%, 5/15/47, (AMT) | 5/27 at 100.00 | Aa3 | 34,283,907 |
| 11,335 | Los Angeles Department of Airports, California, Revenue Bonds, Los Angeles International | 5/28 at 100.00 | Aa3 | 11,751,335 |
| | Airport, Subordinate Lien Series 2018A, 5.000%, 5/15/44, (AMT) | | | |
| 1,240 | Los Angeles Department of Airports, California, Revenue Bonds, Los Angeles International | 11/28 at 100.00 | N/R | 1,283,822 |
| | Airport, Subordinate Lien Series 2019D, 5.000%, 5/15/49, (AMT) | | | |
| 5,485 | Los Angeles Department of Airports, California, Revenue Bonds, Los Angeles International | 11/28 at 100.00 | N/R | 5,822,711 |
| | Airport, Subordinate Lien Series 2019E, 5.000%, 5/15/49 | | | |
| | Los Angeles Department of Airports, California, Revenue Bonds, Los Angeles International | | | |
| | Airport, Subordinate Lien Series 2021D: | | | |
| 1,000 | 5.000%, 5/15/34, (AMT) | 11/31 at 100.00 | N/R | 1,089,190 |
| 24,625 | 4.000%, 5/15/51, (AMT) | 11/31 at 100.00 | N/R | 22,639,240 |
| 6,835 | Los Angeles Department of Airports, California, Revenue Bonds, Los Angeles International | 5/32 at 100.00 | N/R | 7,211,540 |
| | Airport, Subordinate Lien Series 2022A, 5.000%, 5/15/45, (AMT) | | | |
| 5,000 | Los Angeles Harbors Department, California, Revenue Bonds, Refunding Series 2014B, | 8/24 at 100.00 | AA | 5,192,450 |
| | 5.000%, 8/01/44 | | | |
| | Los Angeles Harbors Department, California, Revenue Bonds, Series 2014C: | | | |
| 1,160 | 5.000%, 8/01/34 | 8/24 at 100.00 | AA | 1,209,555 |
| 1,575 | 5.000%, 8/01/35 | 8/24 at 100.00 | AA | 1,641,087 |
| 1,865 | 5.000%, 8/01/36 | 8/24 at 100.00 | AA | 1,942,472 |
| 6,610 | 5.000%, 8/01/44 | 8/24 at 100.00 | AA | 6,864,419 |
| 4,780 | Riverside County Transportation Commission, California, Toll Revenue Second Lien Bonds, | 6/31 at 100.00 | N/R | 4,317,535 |
| | RCTC 91 Express Lanes, Refunding Series 2021C, 4.000%, 6/01/47 | | | |
| 7,750 | Riverside County Transportation Commission, California, Toll Revenue Senior Lien Bonds, | 6/31 at 100.00 | N/R | 7,112,562 |
| | RCTC 91 Express Lanes, Refunding Series 2021B-1, 4.000%, 6/01/46 | | | |
| | San Diego County Regional Airport Authority, California, Airport Revenue Bonds, | | | |
| | Refunding Subordinate Series 2019A: | | | |
| 3,750 | 5.000%, 7/01/35 | 7/29 at 100.00 | N/R | 4,107,937 |
| 1,250 | 5.000%, 7/01/39 | 7/29 at 100.00 | A+ | 1,349,113 |
| 6,000 | San Diego County Regional Airport Authority, California, Airport Revenue Bonds, | 7/31 at 100.00 | N/R | 5,653,800 |
| | Subordinate Series 2021A, 4.000%, 7/01/51 | | | |
| 17,515 | San Diego County Regional Airport Authority, California, Airport Revenue Bonds, | 7/31 at 100.00 | N/R | 18,181,271 |
| | Subordinate Series 2021B, 5.000%, 7/01/51, (AMT) | | | |
| 27,930 | San Francisco Airports Commission, California, Revenue Bonds, San Francisco | 5/27 at 100.00 | A1 | 29,713,610 |
| | International Airport, Governmental Purpose Second Series 2017B, 5.000%, 5/01/47 | | | |
| 4,500 | San Francisco Airports Commission, California, Revenue Bonds, San Francisco | 5/24 at 100.00 | A1 | 4,615,560 |
| | International Airport, Second Series 2014B, 5.000%, 5/01/44 | | | |
| 2,690 | San Francisco Airports Commission, California, Revenue Bonds, San Francisco | 5/27 at 100.00 | A+ | 2,753,484 |
| | International Airport, Second Series 2017A, 5.000%, 5/01/47, (AMT) | | | |
| | San Francisco Airports Commission, California, Revenue Bonds, San Francisco | | | |
| | International Airport, Second Series 2018D: | | | |
| 4,110 | 5.000%, 5/01/43, (AMT) | 5/28 at 100.00 | A1 | 4,261,906 |
| 101,175 | 5.000%, 5/01/48, (AMT) | 5/28 at 100.00 | A1 | 104,424,741 |
| 6,200 | 5.250%, 5/01/48, (AMT) | 5/28 at 100.00 | A1 | 6,476,148 |
| 5,350 | San Francisco Airports Commission, California, Revenue Bonds, San Francisco | 5/28 at 100.00 | A1 | 5,673,300 |
| | International Airport, Second Series 2018E, 5.000%, 5/01/48 | | | |
| | San Francisco Airports Commission, California, Revenue Bonds, San Francisco | | | |
| | International Airport, Second Series 2019A: | | | |
| 2,000 | 5.000%, 5/01/44, (AMT) | 5/29 at 100.00 | A1 | 2,083,040 |
| 17,080 | 5.000%, 5/01/49, (AMT) | 5/29 at 100.00 | A1 | 17,702,566 |
29
| NAC | Nuveen California Quality Municipal Income Fund |
| | Portfolio of Investments (continued) |
| | August 31, 2022 (Unaudited) |
| Principal | | Optional Call | | |
| Amount (000) | Description (1) | Provisions (2) | Ratings (3) | Value |
| | Transportation (continued) | | | |
| | San Francisco Airports Commission, California, Revenue Bonds, San Francisco | | | |
| | International Airport, Second Series 2019E: | | | |
| $ 4,900 | 5.000%, 5/01/39, (AMT) | 5/29 at 100.00 | A1 | $ 5,161,660 |
| 3,335 | 5.000%, 5/01/40, (AMT) | 5/29 at 100.00 | A1 | 3,506,119 |
| 4,000 | San Francisco Airports Commission, California, Revenue Bonds, San Francisco | 5/29 at 100.00 | N/R | 4,247,760 |
| | International Airport, Second Series 2019F, 5.000%, 5/01/50 | | | |
| 19,510 | San Francisco Municipal Transportation Agency, California, Revenue Bonds, Green Series | 3/31 at 100.00 | Aa2 | 21,325,406 |
| | 2021C, 5.000%, 3/01/51 | | | |
| 16,936 | San Joaquin Hills Transportation Corridor Agency, Orange County, California, Refunding | 1/32 at 100.00 | N/R | 15,477,133 |
| | Senior Lien Toll Road Revenue Bonds, Series 2021A, 4.000%, 1/15/50 | | | |
| | San Jose, California, Airport Revenue Bonds, Refunding Series 2017A: | | | |
| 3,250 | 5.000%, 3/01/36, (AMT) | 3/27 at 100.00 | A2 | 3,383,575 |
| 3,000 | 5.000%, 3/01/37, (AMT) | 3/27 at 100.00 | A2 | 3,116,250 |
| 444,386 | Total Transportation | | | 455,183,854 |
| | U.S. Guaranteed – 23.2% (14.0% of Total Investments) (8) | | | |
| 18,400 | Antelope Valley Community College District, Los Angeles County, California, General | 2/27 at 100.00 | AA | 20,667,984 |
| | Obligation Bonds, Election 2016 Series 2017A, 5.250%, 8/01/42, (Pre-refunded 2/15/27) | | | |
| 5,705 | Bay Area Toll Authority, California, Revenue Bonds, San Francisco Bay Area Toll Bridge, | 4/23 at 100.00 | A1 | 5,803,126 |
| | Series 2013S-4, 5.250%, 4/01/48, (Pre-refunded 4/01/23) | | | |
| 9,500 | Bay Area Toll Authority, California, Revenue Bonds, San Francisco Bay Area Toll Bridge, | 4/29 at 100.00 | AA– | 10,989,125 |
| | Subordinate Series 2019S-H, 5.000%, 4/01/49, (Pre-refunded 4/01/29) | | | |
| | Bay Area Water Supply and Conservation Agency, California, Revenue Bonds, Capital Cost | | | |
| | Recovery Prepayment Program, Series 2013A: | | | |
| 2,000 | 5.000%, 10/01/27, (Pre-refunded 4/01/23) | 4/23 at 100.00 | AA– | 2,030,380 |
| 7,000 | 5.000%, 10/01/34, (Pre-refunded 4/01/23) | 4/23 at 100.00 | AA– | 7,106,330 |
| 1,285 | California Health Facilities Financing Authority, California, Revenue Bonds, Sutter | 8/25 at 100.00 | A1 | 1,379,820 |
| | Health, Refunding Series 2015A, 5.000%, 8/15/43, (Pre-refunded 8/15/25) | | | |
| 15,535 | California Health Facilities Financing Authority, California, Revenue Bonds, Sutter | 11/26 at 100.00 | N/R | 17,194,138 |
| | Health, Refunding Series 2016B, 5.000%, 11/15/46, (Pre-refunded 11/15/26) | | | |
| 16,250 | California Health Facilities Financing Authority, California, Revenue Bonds, Sutter | 11/25 at 100.00 | A1 | 17,571,287 |
| | Health, Series 2016A, 5.000%, 11/15/46, (Pre-refunded 11/15/25) | | | |
| | California Health Facilities Financing Authority, Revenue Bonds, Providence Health & | | | |
| | Services, Refunding Series 2014A: | | | |
| 1,700 | 5.000%, 10/01/38, (Pre-refunded 10/01/24) | 10/24 at 100.00 | N/R | 1,793,126 |
| 5,360 | California Infrastructure and Economic Development Bank, First Lien Revenue Bonds, San | 10/21 at 100.00 | AA+ | 5,481,297 |
| | Francisco Bay Area Toll Bridge, Series 2003A, 5.000%, 7/01/23 – AGM Insured, (ETM) | | | |
| 21,255 | California Infrastructure and Economic Development Bank, Infrastructure State Revolving | 10/26 at 100.00 | AAA | 23,419,609 |
| | Fund Revenue Bonds, Series 2016A, 5.000%, 10/01/41, (Pre-refunded 10/01/26) | | | |
| 18,250 | California Municipal Finance Authority, Revenue Bonds, Pomona College, Series 2017, | 1/28 at 100.00 | AAA | 20,666,847 |
| | 5.000%, 1/01/48, (Pre-refunded 1/01/28) | | | |
| 3,770 | California State Public Works Board, Lease Revenue Bonds, Various Capital Projects, | 11/22 at 100.00 | Aa3 | 3,787,455 |
| | Series 2012G, 5.000%, 11/01/37, (Pre-refunded 11/01/22) | | | |
| 5,500 | California Statewide Communities Development Authority, Revenue Bonds, Buck Institute | 11/24 at 100.00 | AA | 5,818,395 |
| | for Research on Aging, Series 2014, 5.000%, 11/15/44, (Pre-refunded 11/15/24) – AGM Insured | | | |
| 2,670 | California Statewide Communities Development Authority, Revenue Bonds, Huntington | 7/24 at 100.00 | A– | 2,799,442 |
| | Memorial Hospital, Refunding Series 2014B, 5.000%, 7/01/44, (Pre-refunded 7/01/24) | | | |
| 7,500 | Desert Community College District, Riverside County, California, General Obligation | 2/26 at 100.00 | AA | 8,158,275 |
| | Bonds, Refunding Series 2016, 5.000%, 8/01/37, (Pre-refunded 2/01/26) | | | |
| 20,725 | Foothill/Eastern Transportation Corridor Agency, California, Toll Road Revenue Bonds, | 1/24 at 100.00 | BBB+ | 21,737,002 |
| | Refunding Junior Lien Series 2013C, 6.500%, 1/15/43, (Pre-refunded 1/15/24) | | | |
| | Foothill/Eastern Transportation Corridor Agency, California, Toll Road Revenue Bonds, | | | |
| | Refunding Series 2013A: | | | |
| 45,735 | 5.750%, 1/15/46, (Pre-refunded 1/15/24) | 1/24 at 100.00 | A– | 47,844,755 |
| 45,725 | 6.000%, 1/15/53, (Pre-refunded 1/15/24) | 1/24 at 100.00 | A– | 47,968,726 |
30
| Principal | | Optional Call | | |
| Amount (000) | Description (1) | Provisions (2) | Ratings (3) | Value |
| | U.S. Guaranteed (continued) (8) | | | |
| | Golden State Tobacco Securitization Corporation, California, Enhanced Tobacco Settlement | | | |
| | Asset-Backed Revenue Bonds, Refunding Series 2015A: | | | |
| $ 1,790 | 5.000%, 6/01/40, (Pre-refunded 6/01/25) | 6/25 at 100.00 | N/R | $ 1,915,694 |
| 1,460 | 5.000%, 6/01/40, (Pre-refunded 6/01/25) | 6/25 at 100.00 | AA– | 1,560,506 |
| 86,320 | 5.000%, 6/01/45, (Pre-refunded 6/01/25) | 6/25 at 100.00 | Aa3 | 92,381,391 |
| 1,000 | Golden State Tobacco Securitization Corporation, California, Enhanced Tobacco Settlement | 6/23 at 100.00 | Aa3 | 1,020,680 |
| | Asset-Backed Revenue Bonds, Series 2013A, 5.000%, 6/01/30, (Pre-refunded 6/01/23) | | | |
| 4,000 | Hesperia Unified School District, San Bernardino County, California, Certificates of | 2/23 at 100.00 | AA | 4,044,520 |
| | Participation, Series 2013A, 5.000%, 2/01/38, (Pre-refunded 2/01/23) – BAM Insured | | | |
| 5,840 | Orange County Water District, California, Revenue Certificates of Participation, Series | No Opt. Call | N/R | 6,670,156 |
| | 1999A, 5.375%, 8/15/29, (ETM) | | | |
| 905 | Orange County Water District, California, Revenue Certificates of Participation, Series | 8/32 at 100.00 | N/R | 1,075,973 |
| | 2003B, 5.000%, 8/15/34, (Pre-refunded 8/15/32) – NPFG Insured | | | |
| 2,370 | Oxnard School District, Ventura County, California, General Obligation Bonds, Election | 8/23 at 100.00 | AA | 2,428,776 |
| | 2012 Series 2013B, 5.000%, 8/01/43, (Pre-refunded 8/01/23) – AGM Insured | | | |
| | Pajaro Valley Unified School District, Santa Cruz County, California, General Obligation | | | |
| | Bonds, Refunding Election 2012 Series 2013A: | | | |
| 9,385 | 5.000%, 8/01/43, (Pre-refunded 8/01/23) | 8/23 at 100.00 | Aa3 | 9,617,748 |
| 465 | Pomona, California, GNMA/FHLMC Collateralized Single Family Mortgage Revenue Refunding | No Opt. Call | AA+ | 480,224 |
| | Bonds, Series 1990B, 7.500%, 8/01/23, (ETM) | | | |
| 2,000 | Puerto Rico Public Finance Corporation, Commonwealth Appropriation Bonds, Series 2002E, | No Opt. Call | N/R | 2,240,760 |
| | 6.000%, 8/01/26, (ETM) | | | |
| 1,000 | Riverside County Transportation Commission, California, Toll Revenue Senior Lien Bonds, | 6/23 at 100.00 | A | 1,025,970 |
| | Series 2013A, 5.750%, 6/01/44, (Pre-refunded 6/01/23) | | | |
| 1,460 | Rohnert Park Community Development Commission, California, Tax Allocation Bonds, | 10/22 at 100.00 | Baa2 | 1,530,927 |
| | Redevelopment Project Series 2007R, 5.000%, 8/01/37 – FGIC Insured, (ETM) | | | |
| 5,825 | Sacramento, California, Wastewater Revenue Bonds, Series 2013, 5.000%, 9/01/42, | 9/23 at 100.00 | AA | 5,982,042 |
| | (Pre-refunded 9/01/23) | | | |
| 4,250 | San Diego Community College District, San Diego County, California, General Obligation | 8/26 at 100.00 | AAA | 4,681,247 |
| | Bonds, Refunding Series 2016, 5.000%, 8/01/41, (Pre-refunded 8/01/26) | | | |
| 9,550 | San Diego County Regional Airport Authority, California, Airport Revenue Bonds, Senior | 7/23 at 100.00 | AA– | 9,750,264 |
| | Series 2013B, 5.000%, 7/01/43, (Pre-refunded 7/01/23), (AMT) | | | |
| 5,000 | San Diego County Regional Transportation Commission, California, Sales Tax Revenue | 4/24 at 100.00 | AAA | 5,210,850 |
| | Bonds, Series 2014A, 5.000%, 4/01/44, (Pre-refunded 4/01/24) | | | |
| | Silicon Valley Clean Water, Mateo County, California, Wastewater Revenue Bonds, Series 2015: | | | |
| 3,000 | 5.000%, 8/01/40, (Pre-refunded 8/01/25) | 8/25 at 100.00 | Aa2 | 3,227,310 |
| 1,600 | 5.000%, 8/01/45, (Pre-refunded 8/01/25) | 8/25 at 100.00 | Aa2 | 1,721,232 |
| 8,760 | University of California Regents, Medical Center Pooled Revenue Bonds, Series 2013J, | 5/23 at 100.00 | AA– | 8,944,486 |
| | 5.250%, 5/15/31, (Pre-refunded 5/15/23) | | | |
| 409,845 | Total U.S. Guaranteed | | | 437,727,875 |
| | Utilities – 23.9% (14.4% of Total Investments) | | | |
| | Bay Area Water Supply and Conservation Agency, California, Revenue Bonds, Capital Cost | | | |
| | Recovery Prepayment Program, Series 2013A: | | | |
| 6,010 | 5.000%, 10/01/29 | 4/23 at 100.00 | AA– | 6,101,292 |
| 10,000 | California Community Choice Financing Authority, Clean Energy Project Revenue Bonds, | 5/31 at 100.63 | A1 | 10,094,500 |
| | Green Series 2021B-1, 4.000%, 2/01/52, (Mandatory Put 8/01/31) | | | |
| 5,000 | California Infrastructure and Economic Development Bank. Clean Water State Revolving | 4/28 at 100.00 | AAA | 5,492,000 |
| | Fund Revenue Bonds, Green Series 2018, 5.000%, 10/01/43 | | | |
| | California Pollution Control Financing Authority, Water Furnishing Revenue Bonds, | | | |
| | Poseidon Resources Channelside LP Desalination Project, Series 2012: | | | |
| 3,925 | 5.000%, 7/01/37, (AMT), 144A | 1/23 at 100.00 | BBB | 3,934,263 |
| 65,500 | 5.000%, 11/21/45, (AMT), 144A | 1/23 at 100.00 | BBB | 65,591,700 |
| 40 | California Statewide Community Development Authority, Water and Wastewater Revenue | 10/22 at 100.00 | AA | 40,096 |
| | Bonds, Pooled Financing Program, Series 2003A, 5.250%, 10/01/23 – AGM Insured | | | |
31
| NAC | Nuveen California Quality Municipal Income Fund |
| | Portfolio of Investments (continued) |
| | August 31, 2022 (Unaudited) |
| Principal | | Optional Call | | |
| Amount (000) | Description (1) | Provisions (2) | Ratings (3) | Value |
| | Utilities (continued) | | | |
| $ 170 | California Statewide Community Development Authority, Water and Wastewater Revenue | 10/22 at 100.00 | AA | $ 170,406 |
| | Bonds, Pooled Financing Program, Series 2004A, 5.250%, 10/01/24 – AGM Insured | | | |
| | East Bay Municipal Utility District, Alameda and Contra Costa Counties, California, | | | |
| | Water System Revenue Bonds, Green Series 2017A: | | | |
| 5,000 | 5.000%, 6/01/42 | 6/27 at 100.00 | AAA | 5,450,200 |
| 2,200 | 5.000%, 6/01/45 | 6/27 at 100.00 | AAA | 2,389,288 |
| 10,000 | East Bay Municipal Utility District, Alameda and Contra Costa Counties, California, | 6/24 at 100.00 | AAA | 10,388,600 |
| | Water System Revenue Bonds, Series 2014C, 5.000%, 6/01/44 | | | |
| | Long Beach Bond Finance Authority, California, Natural Gas Purchase Revenue Bonds, | | | |
| | Series 2007A: | | | |
| 14,140 | 5.000%, 11/15/35 | No Opt. Call | AA– | 15,064,897 |
| 7,610 | 5.500%, 11/15/37 | No Opt. Call | AA– | 8,486,596 |
| 4,865 | Los Angeles Department of Water and Power, California, Power System Revenue Bonds, | 7/23 at 100.00 | Aa2 | 4,972,273 |
| | Series 2013B, 5.000%, 7/01/28 | | | |
| 4,000 | Los Angeles Department of Water and Power, California, Power System Revenue Bonds, | 1/24 at 100.00 | Aa2 | 4,116,840 |
| | Series 2014B, 5.000%, 7/01/43 | | | |
| 43,605 | Los Angeles Department of Water and Power, California, Power System Revenue Bonds, | 1/27 at 100.00 | Aa2 | 46,694,414 |
| | Series 2017A, 5.000%, 7/01/42 | | | |
| 53,615 | Los Angeles Department of Water and Power, California, Power System Revenue Bonds, | 7/27 at 100.00 | Aa2 | 57,520,853 |
| | Series 2017C, 5.000%, 7/01/47 | | | |
| 10,650 | Los Angeles Department of Water and Power, California, Power System Revenue Bonds, | 1/28 at 100.00 | Aa2 | 11,652,271 |
| | Series 2018A, 5.000%, 7/01/38 | | | |
| | Los Angeles Department of Water and Power, California, Power System Revenue Bonds, | | | |
| | Series 2018D: | | | |
| 8,960 | 5.000%, 7/01/38 | 7/28 at 100.00 | Aa2 | 9,875,533 |
| 8,215 | 5.000%, 7/01/39 | 7/28 at 100.00 | Aa2 | 9,029,435 |
| 8,980 | Los Angeles Department of Water and Power, California, Power System Revenue Bonds, | 7/29 at 100.00 | Aa2 | 9,845,223 |
| | Series 2019D, 5.000%, 7/01/44 | | | |
| 17,000 | Los Angeles Department of Water and Power, California, Power System Revenue Bonds, | 1/31 at 100.00 | Aa2 | 18,529,320 |
| | Series 2021B, 5.000%, 7/01/48 | | | |
| 4,000 | Los Angeles Department of Water and Power, California, Power System Revenue Bonds, | 7/31 at 100.00 | N/R | 4,397,680 |
| | Series 2022A, 5.000%, 7/01/46 | | | |
| 5,000 | Los Angeles Department of Water and Power, California, Power System Revenue Bonds, | 7/32 at 100.00 | N/R | 5,658,650 |
| | Series 2022B, 5.000%, 7/01/40 | | | |
| 10,000 | Los Angeles Department of Water and Power, California, Water System Revenue Bonds, | 1/32 at 100.00 | N/R | 10,940,300 |
| | Series 2022B, 5.000%, 7/01/52 | | | |
| 24,070 | Los Angeles Department of Water and Power, California, Waterworks Revenue Bonds, Series | 7/24 at 100.00 | AA+ | 25,029,912 |
| | 2014A, 5.000%, 7/01/44 | | | |
| 6,770 | Los Angeles Department of Water and Power, California, Waterworks Revenue Bonds, Series | 1/26 at 100.00 | AA+ | 7,153,791 |
| | 2016A, 5.000%, 7/01/46 | | | |
| 10,000 | Los Angeles Department of Water and Power, California, Waterworks Revenue Bonds, Series | 1/27 at 100.00 | AA+ | 10,741,100 |
| | 2017A, 5.000%, 7/01/41 | | | |
| | Los Angeles Department of Water and Power, California, Waterworks Revenue Bonds, Series | | | |
| | 2018B: | | | |
| 2,000 | 5.000%, 7/01/38 | 7/28 at 100.00 | AA+ | 2,208,860 |
| 6,650 | 5.000%, 7/01/48 | 7/28 at 100.00 | AA+ | 7,229,082 |
| 1,490 | Los Angeles, California, Wastewater System Revenue Bonds, Green Series 2015C, | 6/25 at 100.00 | AA+ | 1,557,169 |
| | 5.000%, 6/01/45 | | | |
| 4,420 | Los Angeles, California, Wastewater System Revenue Bonds, Green Subordinate Lien Series | 6/27 at 100.00 | AA | 4,821,469 |
| | 2017A, 5.250%, 6/01/47 | | | |
| 5,000 | Los Angeles, California, Wastewater System Revenue Bonds, Green Subordinate Series | 6/28 at 100.00 | AA | 5,397,150 |
| | 2018A, 5.000%, 6/01/48 | | | |
32
| Principal | | Optional Call | | |
| Amount (000) | Description (1) | Provisions (2) | Ratings (3) | Value |
| | Utilities (continued) | | | |
| | Los Angeles, California, Wastewater System Revenue Bonds, Refunding Subordinate Lien | | | |
| | Series 2013A: | | | |
| $ 1,245 | 5.000%, 6/01/34 | 6/23 at 100.00 | AA | $ 1,267,659 |
| 6,840 | 5.000%, 6/01/35 | 6/23 at 100.00 | AA | 6,963,462 |
| 5,025 | Metropolitan Water District of Southern California, Water Revenue Bonds, Refunding | 7/30 at 100.00 | AAA | 5,713,375 |
| | Series 2020C, 5.000%, 7/01/38 | | | |
| 7,525 | Moulton Niguel Water District, California, Certificates of Participation, Series 2019, | 3/29 at 100.00 | N/R | 6,170,124 |
| | 3.000%, 9/01/44 | | | |
| 7,030 | Northern California Energy Authority, California, Commodity Supply Revenue Bonds, Series | 4/24 at 100.24 | A2 | 7,141,144 |
| | 2018A, 4.000%, 7/01/49, (Mandatory Put 7/01/24) | | | |
| 6,970 | Public Facilities Financing Authority of the City of San Diego, California, Subordinated | 5/32 at 100.00 | N/R | 7,742,764 |
| | Sewer Revenue Bonds, Series 2022A, 5.000%, 5/15/52 | | | |
| 3,000 | Sacramento County Sanitation Districts Financing Authority, California, Revenue Bonds, | 6/24 at 100.00 | AA | 3,114,510 |
| | Sacramento Regional County Sanitation District, Series 2014A, 5.000%, 12/01/33 | | | |
| 2,500 | Sacramento Municipal Utility District, California, Electric Revenue Bonds, Tender Option | 8/23 at 100.00 | AA | 2,713,350 |
| | Bond Trust 2016-XG0060, 13.155%, 8/15/41, 144A, (IF) (9) | | | |
| 4,000 | San Diego Public Facilities Financing Authority, California, Water Utility Revenue | 8/26 at 100.00 | Aa3 | 4,327,240 |
| | Bonds, Refunding Subordinate Lien Series 2016B, 5.000%, 8/01/37 | | | |
| 2,570 | San Francisco City and County Public Utilities Commission, California, Wastewater | 4/28 at 100.00 | AA | 2,787,191 |
| | Revenue Bonds, Series 2018B, 5.000%, 10/01/43 | | | |
| 2,555 | Santa Clara Valley Water District, California, Water System Revenue Bonds, Refunding | 6/30 at 100.00 | Aa1 | 2,797,802 |
| | Series 2020A, 5.000%, 6/01/50 | | | |
| 1,095 | Silicon Valley Clean Water, Mateo County, California, Wastewater Revenue Bonds, Series | 2/28 at 100.00 | AA | 1,049,120 |
| | 2018, 4.000%, 8/01/46 | | | |
| | Southern California Public Power Authority, California, Revenue Bonds, Apex Power | | | |
| | Project Series 2014A: | | | |
| 1,565 | 5.000%, 7/01/35 | 7/24 at 100.00 | AA– | 1,627,412 |
| 1,500 | 5.000%, 7/01/38 | 7/24 at 100.00 | AA– | 1,557,360 |
| 4,000 | Southern California Public Power Authority, Natural Gas Project 1 Revenue Bonds, Series | No Opt. Call | A2 | 4,299,720 |
| | 2007A, 5.000%, 11/01/33 | | | |
| 426,305 | Total Utilities | | | 449,847,396 |
| $ 3,251,274 | Total Long-Term Investments (cost $3,125,168,268) | | | 3,132,295,285 |
| | MuniFund Preferred Shares, net of deferred offering costs – (17.0)% (10) | | | (319,844,457) |
| | Variable Rate Demand Preferred Shares, net of deferred offering costs – (50.6)% (11) | | | (954,484,890) |
| | Other Assets Less Liabilities – 1.4% | | | 26,926,329 |
| | Net Assets Applicable to Common Shares – 100% | | | $ 1,884,892,267 |
33
| NAC | Nuveen California Quality Municipal Income Fund |
| | Portfolio of Investments (continued) |
| | August 31, 2022 (Unaudited) |
| (1) | | All percentages shown in the Portfolio of Investments are based on net assets applicable to common shares unless otherwise noted. |
| (2) | | Optional Call Provisions: Dates (month and year) and prices of the earliest optional call or redemption. There may be other call provisions at varying prices at later dates. Certain mortgage-backed securities may be subject to periodic principal paydowns. |
| (3) | | For financial reporting purposes, the ratings disclosed are the highest of Standard & Poor’s Group (“Standard & Poor’s”), Moody’s Investors Service, Inc. (“Moody’s”) or Fitch, Inc. (“Fitch”) rating. This treatment of split-rated securities may differ from that used for other purposes, such as for Fund investment policies. Ratings below BBB by Standard & Poor’s, Baa by Moody’s or BBB by Fitch are considered to be below investment grade. Holdings designated N/R are not rated by any of these national rating agencies. |
| (4) | | Effective February 12, 2019, the par value of the original bonds was replaced with taxable and tax exempt Puerto Rico Sales Tax Financing Corporation (commonly known as COFINA) bond units that are collateralized by a bundle of zero and coupon paying bonds. The quantity shown represents units in a trust, which were assigned according to the original bond’s accreted value. These securities do not have a stated coupon interest rate and income will be recognized through accretion of the discount associated with the trust units. The factor at which these units accrete can also decrease, primarily for principal payments generated from coupon payments received or dispositions of the underlying bond collateral. The quantity of units will not change as a result of these principal payments. |
| (5) | | Defaulted security. A security whose issuer has failed to fully pay principal and/or interest when due, or is under the protection of bankruptcy. |
| (6) | | Investment valued at fair value using methods determined in good faith by, or at the discretion of, the Board. For fair value measurement disclosure purposes, investment classified as Level 3. |
| (7) | | Step-up coupon bond, a bond with a coupon that increases ("steps up"), usually at regular intervals, while the bond is outstanding. The rate shown is the coupon as of the end of the reporting period. |
| (8) | | Backed by an escrow or trust containing sufficient U.S. Government or U.S. Government agency securities, which ensure the timely payment of principal and interest. |
| (9) | | Investment, or portion of investment, has been pledged to collateralize the net payment obligations for investments in inverse floating rate transactions. |
| (10) | | MuniFund Preferred Shares, net of deferred offering costs as a percentage of Total Investments is 10.2%. |
| (11) | | Variable Rate Demand Preferred Shares, net of deferred offering costs as a percentage of Total Investments is 30.5%. |
| 144A | | Investment is exempt from registration under Rule 144A of the Securities Act of 1933, as amended. These investments may only be resold in transactions exempt from registration, which are normally those transactions with qualified institutional buyers. |
| AMT | | Alternative Minimum Tax |
| IF | | Inverse floating rate security issued by a tender option bond (“TOB”) trust, the interest rate on which varies inversely with the Securities Industry Financial Markets Association (SIFMA) short-term rate, which resets weekly, or a similar short-term rate, and is reduced by the expenses related to the TOB trust. See accompanying notes to financial statements. |
34
| NKX | Nuveen California AMT-Free Quality |
| | Municipal Income Fund |
| | Portfolio of Investments |
| | August 31, 2022 (Unaudited) |
| Principal | | Optional Call | | |
| Amount (000) | Description (1) | Provisions (2) | Ratings (3) | Value |
| | LONG-TERM INVESTMENTS – 168.3% (100.0% of Total Investments) | | | |
| | MUNICIPAL BONDS – 168.3% (100.0% of Total Investments) | | | |
| | Consumer Staples – 0.0% (0.0% of Total Investments) | | | |
| $ 235 | California County Tobacco Securitization Agency, Tobacco Settlement Asset-Backed Bonds, | 6/30 at 100.00 | BBB+ | $ 220,996 |
| | Los Angeles County Securitization Corporation, Series 2020A, 4.000%, 6/01/49 | | | |
| | Education and Civic Organizations – 3.2% (1.9% of Total Investments) | | | |
| 1,560 | California Municipal Finance Authority, Revenue Bonds, Goodwill Industries of Sacramento | 10/22 at 100.00 | N/R | 1,550,952 |
| | Valley & Northern Nevada Project, Series 2012A, 6.875%, 1/01/42, 144A | | | |
| 635 | California School Finance Authority, School Facility Revenue Bonds, Alliance for | 7/25 at 100.00 | BBB | 643,668 |
| | College-Ready Public Schools Project, Series 2015A, 5.000%, 7/01/45, 144A | | | |
| 750 | California School Finance Authority, School Facility Revenue Bonds, Alliance for | 7/25 at 100.00 | BBB | 759,795 |
| | College-Ready Public Schools Project, Series 2016A, 5.000%, 7/01/46, 144A | | | |
| 4,925 | California School Finance Authority, School Facility Revenue Bonds, Alliance for | 7/25 at 101.00 | BBB | 5,010,301 |
| | College-Ready Public Schools Project, Series 2016C, 5.000%, 7/01/46, 144A | | | |
| 280 | California School Finance Authority, School Facility Revenue Bonds, Value Schools, | 7/26 at 100.00 | BB+ | 294,683 |
| | Series 2016A, 5.750%, 7/01/41, 144A | | | |
| 1,725 | California State University, Systemwide Revenue Bonds, Series 2016A, 4.000%, 11/01/38 | 5/26 at 100.00 | Aa2 | 1,734,263 |
| 10,000 | University of California, General Revenue Bonds, Series 2018AZ, 5.000%, 5/15/48 | 5/28 at 100.00 | AA | 10,804,900 |
| 19,875 | Total Education and Civic Organizations | | | 20,798,562 |
| | Health Care – 18.8% (11.2% of Total Investments) | | | |
| 13,295 | California Health Facilities Financing Authority, California, Revenue Bonds, Sutter | | | |
| | Health, Refunding Series 2016B, 4.000%, 11/15/41 | 11/26 at 100.00 | A1 | 12,989,880 |
| | California Health Facilities Financing Authority, California, Revenue Bonds, Sutter | | | |
| | Health, Refunding Series 2017A: | | | |
| 10,000 | 4.000%, 11/15/48 | 11/27 at 100.00 | A1 | 9,496,200 |
| 9,415 | 5.000%, 11/15/48 | 11/27 at 100.00 | A1 | 9,919,267 |
| 6,460 | California Health Facilities Financing Authority, California, Revenue Bonds, Sutter | 11/27 at 100.00 | A1 | 6,805,997 |
| | Health, Series 2018A, 5.000%, 11/15/48 | | | |
| 1,255 | California Health Facilities Financing Authority, Revenue Bonds, Children’s Hospital Los | 11/22 at 100.00 | BBB+ | 1,258,727 |
| | Angeles, Series 2012A, 5.000%, 11/15/29 | | | |
| 1,000 | California Health Facilities Financing Authority, Revenue Bonds, City of Hope National | 11/22 at 100.00 | A+ | 1,003,770 |
| | Medical Center, Series 2012A, 5.000%, 11/15/35 | | | |
| 2,930 | California Health Facilities Financing Authority, Revenue Bonds, City of Hope National | 11/29 at 100.00 | A+ | 2,781,449 |
| | Medical Center, Series 2019, 4.000%, 11/15/45 | | | |
| | California Health Facilities Financing Authority, Revenue Bonds, CommonSpirit Health, | | | |
| | Series 2020A: | | | |
| 3,390 | 4.000%, 4/01/44 | 4/30 at 100.00 | BBB+ | 3,181,380 |
| 11,720 | 4.000%, 4/01/49 | 4/30 at 100.00 | BBB+ | 10,777,829 |
| 2,520 | California Health Facilities Financing Authority, Revenue Bonds, Lucile Salter Packard | 8/24 at 100.00 | AA– | 2,582,194 |
| | Children’s Hospital, Series 2014A, 5.000%, 8/15/43 | | | |
| 2,000 | California Health Facilities Financing Authority, Revenue Bonds, Memorial Health | 10/22 at 100.00 | AA– | 2,002,940 |
| | Services, Series 2012A, 5.000%, 10/01/33 | | | |
| | California Health Facilities Financing Authority, Revenue Bonds, Providence Health & | | | |
| | Services, Refunding Series 2014A: | | | |
| 795 | 5.000%, 10/01/38 | 10/24 at 100.00 | AA– | 826,458 |
| 2,800 | California Health Facilities Financing Authority, Revenue Bonds, Providence Health & | 10/24 at 100.00 | AA– | 2,897,356 |
| | Services, Series 2014B, 5.000%, 10/01/44 | | | |
35
| NKX | Nuveen California AMT-Free Quality |
| | Municipal Income Fund |
| | Portfolio of Investments (continued) |
| | August 31, 2022 (Unaudited) |
| Principal | | Optional Call | | |
| Amount (000) | Description (1) | Provisions (2) | Ratings (3) | Value |
| | Health Care (continued) | | | |
| | California Municipal Finance Authority, Revenue Bonds, Community Health System, | | | |
| | Series 2021A: | | | |
| $ 4,615 | 4.000%, 2/01/51 | 2/32 at 100.00 | N/R | $ 4,293,796 |
| 5,495 | 4.000%, 2/01/51 – AGM Insured | 2/32 at 100.00 | N/R | 5,275,640 |
| | California Municipal Finance Authority, Revenue Bonds, Eisenhower Medical Center, | | | |
| | Refunding Series 2017A: | | | |
| 250 | 5.000%, 7/01/42 | 7/27 at 100.00 | Baa2 | 256,860 |
| 9,635 | 5.000%, 7/01/47 | 7/27 at 100.00 | Baa2 | 9,823,557 |
| 1,750 | California Municipal Finance Authority, Revenue Bonds, NorthBay Healthcare Group, Series | 11/24 at 100.00 | BBB– | 1,757,840 |
| | 2015, 5.000%, 11/01/44 | | | |
| | California Municipal Finance Authority, Revenue Bonds, NorthBay Healthcare Group, | | | |
| | Series 2017A: | | | |
| 1,690 | 5.250%, 11/01/36 | 11/26 at 100.00 | BBB– | 1,759,983 |
| 1,000 | 5.000%, 11/01/47 | 11/26 at 100.00 | BBB– | 1,005,050 |
| | California Statewide Communities Development Authority, California, Revenue Bonds, Loma | | | |
| | Linda University Medical Center, Series 2014A: | | | |
| 1,200 | 5.250%, 12/01/44 | 12/24 at 100.00 | BB | 1,219,812 |
| 4,000 | 5.500%, 12/01/54 | 12/24 at 100.00 | BB | 4,087,440 |
| 14,740 | California Statewide Communities Development Authority, California, Revenue Bonds, Loma | 6/26 at 100.00 | BB | 14,756,951 |
| | Linda University Medical Center, Series 2016A, 5.250%, 12/01/56, 144A | | | |
| 2,000 | California Statewide Communities Development Authority, California, Revenue Bonds, Loma | 6/28 at 100.00 | BB | 2,008,400 |
| | Linda University Medical Center, Series 2018A, 5.250%, 12/01/48, 144A | | | |
| | California Statewide Community Development Authority, Revenue Bonds, Daughters of | | | |
| | Charity Health System, Series 2005A: | | | |
| 24 | 5.750%, 7/01/24 (4),(5) | 1/22 at 100.00 | N/R | 24,423 |
| 148 | 5.750%, 7/01/30 (4),(5) | 1/22 at 100.00 | N/R | 147,932 |
| 4 | 5.750%, 7/01/35 2035 2035 (4),(5) | 1/22 at 100.00 | N/R | 3,663 |
| 8,895 | Palomar Pomerado Health System, California, Revenue Bonds, Refunding Series 2016, | 11/26 at 100.00 | BBB | 8,173,971 |
| | 4.000%, 11/01/39 | | | |
| 123,026 | Total Health Care | | | 121,118,765 |
| | Housing/Multifamily – 17.4% (10.3% of Total Investments) | | | |
| 7,680 | California Community Housing Agency, California, Essential Housing Revenue Bonds, | 8/31 at 100.00 | N/R | 6,144,998 |
| | Creekwood, Series 2021A, 4.000%, 2/01/56, 144A | | | |
| 7,570 | California Community Housing Agency, California, Essential Housing Revenue Bonds, | 8/31 at 100.00 | N/R | 5,843,510 |
| | Glendale Properties, Junior Series 2021A-2, 4.000%, 8/01/47, 144A | | | |
| 3,590 | California Community Housing Agency, California, Essential Housing Revenue Bonds, | 2/30 at 100.00 | N/R | 3,385,585 |
| | Serenity at Larkspur Apartments, Series 2020A, 5.000%, 2/01/50, 144A | | | |
| 2,970 | California Community Housing Agency, California, Essential Housing Revenue Bonds, | 2/31 at 100.00 | N/R | 2,392,216 |
| | Stoneridge Apartments, Series 2021A, 4.000%, 2/01/56, 144A | | | |
| 230 | California Community Housing Agency, California, Essential Housing Revenue Bonds, Summit | 8/32 at 100.00 | N/R | 186,169 |
| | at Sausalito Apartments, Series 2021A-2, 4.000%, 2/01/50, 144A | | | |
| 500 | California Community Housing Agency, California, Essential Housing Revenue Bonds, | 8/29 at 100.00 | N/R | 471,765 |
| | Verdant at Green Valley Apartments, Series 2019A, 5.000%, 8/01/49, 144A | | | |
| 4,750 | California Community Housing Agency, Workforce Housing Revenue Bonds, Annadel | 4/29 at 100.00 | N/R | 4,420,018 |
| | Apartments, Series 2019A, 5.000%, 4/01/49, 144A | | | |
| 7,803 | California Housing Finance Agency, Municipal Certificate Revenue Bonds, Class A Series | No Opt. Call | BBB+ | 7,739,077 |
| | 2019-2, 4.000%, 3/20/33 | | | |
| 6,440 | California Housing Finance Agency, Municipal Certificate Revenue Bonds, Class A Series | No Opt. Call | BBB+ | 6,002,492 |
| | 2021-1, 3.500%, 11/20/35 | | | |
| 1,161 | California Housing Finance Agency, Municipal Certificate Revenue Bonds, Class A | No Opt. Call | BBB+ | 1,164,876 |
| | Series2019-1, 4.250%, 1/15/35 | | | |
| | California Municipal Finance Authority, Mobile Home Park Revenue Bonds, Caritas | | | |
| | Affordable Housing Inc Projects, Senior Series 2014A: | | | |
| 260 | 5.250%, 8/15/39 | 8/24 at 100.00 | A– | 265,717 |
| 705 | 5.250%, 8/15/49 | 8/24 at 100.00 | A– | 717,098 |
36
| Principal | | Optional Call | | |
| Amount (000) | Description (1) | Provisions (2) | Ratings (3) | Value |
| | Housing/Multifamily (continued) | | | |
| $ 140 | California Public Finance Authority, University Housing Revenue Bonds, National Campus | 7/27 at 100.00 | Caa2 | $ 109,505 |
| | Community Development – Claremont Properties LLC Claremont Colleges Project, Series 2017A, | | | |
| | 5.000%, 7/01/37, 144A | | | |
| 8,205 | CMFA Special Finance Agency I, California, Essential Housing Revenue Bonds, The Mix at | 4/31 at 100.00 | N/R | 6,693,475 |
| | Center City, Series 2021A-2, 4.000%, 4/01/56, 144A | | | |
| 2,740 | CMFA Special Finance Agency, California, Essential Housing Revenue Bonds, Enclave | 2/32 at 100.00 | N/R | 2,300,833 |
| | Apartments, Senior Series 2022A-1, 4.000%, 8/01/58, 144A | | | |
| 1,435 | CMFA Special Finance Agency, California, Essential Housing Revenue Bonds, Latitude 33, | 12/31 at 100.00 | N/R | 1,019,725 |
| | Senior Series 2021A-1, 3.000%, 12/01/56, 144A | | | |
| 1,440 | CSCDA Community Improvement Authority, California, Essential Housing Revenue Bonds, 777 | 5/32 at 100.00 | N/R | 1,208,218 |
| | Place-Pomona, Senior Lien Series 2021A-1, 3.600%, 5/01/47, 144A | | | |
| 3,980 | CSCDA Community Improvement Authority, California, Essential Housing Revenue Bonds, 777 | 5/32 at 100.00 | N/R | 2,964,463 |
| | Place-Pomona, Senior Lien Series 2021A-2, 3.250%, 5/01/57, 144A | | | |
| 595 | CSCDA Community Improvement Authority, California, Essential Housing Revenue Bonds, | 10/31 at 100.00 | N/R | 455,651 |
| | Acacia on Santa Rosa Creek, Mezzanine Lien Series 2021B, 4.000%, 10/01/46, 144A | | | |
| 5,135 | CSCDA Community Improvement Authority, California, Essential Housing Revenue Bonds, | 10/31 at 100.00 | N/R | 4,582,936 |
| | Acacia on Santa Rosa Creek, Senior Lien Series 2021A, 4.000%, 10/01/56, 144A | | | |
| 7,065 | CSCDA Community Improvement Authority, California, Essential Housing Revenue Bonds, | 10/31 at 100.00 | N/R | 5,680,260 |
| | Altana Glendale, Series 2021A-2, 4.000%, 10/01/56, 144A | | | |
| 8,125 | CSCDA Community Improvement Authority, California, Essential Housing Revenue Bonds, | 1/31 at 100.00 | N/R | 7,624,256 |
| | Center City Anaheim, Series 2020A, 5.000%, 1/01/54, 144A | | | |
| 1,250 | CSCDA Community Improvement Authority, California, Essential Housing Revenue Bonds, | 2/32 at 100.00 | N/R | 900,975 |
| | Dublin Social Senior Lien Series 2021A-2, 3.000%, 2/01/57, 144A | | | |
| | CSCDA Community Improvement Authority, California, Essential Housing Revenue Bonds, | | | |
| | Millennium South Bay-Hawthorne, Series 2021A-1 and A-2: | | | |
| 2,150 | 3.375%, 7/01/43, 144A | 7/32 at 100.00 | N/R | 1,796,820 |
| 2,745 | 3.250%, 7/01/56, 144A | 7/32 at 100.00 | N/R | 1,996,658 |
| 6,820 | CSCDA Community Improvement Authority, California, Essential Housing Revenue Bonds, Moda | 10/31 at 100.00 | N/R | 5,510,287 |
| | at Monrovia Station, Social Series 2021A-2, 4.000%, 10/01/56, 144A | | | |
| | CSCDA Community Improvement Authority, California, Essential Housing Revenue Bonds, | | | |
| | Monterrey Station Apartments, Senior Lien Series 2021A-1: | | | |
| 770 | 3.000%, 7/01/43, 144A | 7/32 at 100.00 | N/R | 600,746 |
| 3,340 | 3.125%, 7/01/56, 144A | 7/32 at 100.00 | N/R | 2,360,913 |
| 155 | CSCDA Community Improvement Authority, California, Essential Housing Revenue Bonds, | 3/32 at 100.00 | N/R | 116,545 |
| | Orange City Portfolio, Mezzanine Lien Series 2021B, 4.000%, 3/01/57, 144A | | | |
| 4,735 | CSCDA Community Improvement Authority, California, Essential Housing Revenue Bonds, | 3/32 at 100.00 | N/R | 3,431,028 |
| | Orange City Portfolio, Senior Lien Series 2021A-2, 3.000%, 3/01/57, 144A | | | |
| 4,105 | CSCDA Community Improvement Authority, California, Essential Housing Revenue Bonds, | 8/31 at 100.00 | N/R | 3,369,220 |
| | Parallel-Anaheim Series 2021A, 4.000%, 8/01/56, 144A | | | |
| 1,935 | CSCDA Community Improvement Authority, California, Essential Housing Revenue Bonds, | 12/31 at 100.00 | N/R | 1,519,091 |
| | Pasadena Portfolio Social Bond, Mezzanine Senior Series 2021B, 4.000%, 12/01/56, 144A | | | |
| 1,555 | CSCDA Community Improvement Authority, California, Essential Housing Revenue Bonds, | 12/31 at 100.00 | N/R | 1,126,038 |
| | Pasadena Portfolio Social Bond, Series 2021A-2, 3.000%, 12/01/56 | | | |
| 200 | CSCDA Community Improvement Authority, California, Essential Housing Revenue Bonds, | 7/31 at 100.00 | N/R | 188,914 |
| | Renaissance at City Center, Series 2020A, 5.000%, 7/01/51, 144A | | | |
| 2,720 | CSCDA Community Improvement Authority, California, Essential Housing Revenue Bonds, | 7/31 at 100.00 | N/R | 2,106,613 |
| | Union South Bay, Series 2021A-2, 4.000%, 7/01/56, 144A | | | |
| 1,975 | CSCDA Community Improvement Authority, California, Essential Housing Revenue Bonds, | 6/31 at 100.00 | N/R | 1,503,567 |
| | Westgate Phase 1-Pasadena Apartments, Senior Lien Series 2021A-1, 3.000%, 6/01/47, 144A | | | |
| 7,200 | CSCDA Community Improvement Authority, California, Essential Housing Revenue Bonds, | 6/31 at 100.00 | N/R | 5,067,288 |
| | Westgate Phase 1-Pasadena Apartments, Senior Lien Series 2021A-2, 3.125%, 6/01/57, 144A | | | |
| 7,285 | CSCDA Community Improvement Authority, California, Essential Housing Revenue Bonds, Wood | 6/32 at 100.00 | N/R | 5,104,017 |
| | Creek Apartments, Senior Lien Series 2021A-1, 3.000%, 12/01/49 | | | |
37
| NKX | Nuveen California AMT-Free Quality |
| | Municipal Income Fund |
| | Portfolio of Investments (continued) |
| | August 31, 2022 (Unaudited) |
| Principal | | Optional Call | | |
| Amount (000) | Description (1) | Provisions (2) | Ratings (3) | Value |
| | Housing/Multifamily (continued) | | | |
| $ 3,285 | Independent Cities Finance Authority, California, Mobile Home Park Revenue Bonds, | 4/23 at 100.00 | A– | $ 3,305,925 |
| | Rancho Vallecitos Mobile Home Park, Series 2013, 5.000%, 4/15/38 | | | |
| | La Verne, California, Mobile Home Park Revenue Bonds, Copacabana Mobile Home Park, | | | |
| | Refunding Series 2014: | | | |
| 670 | 5.000%, 6/15/44 | 6/24 at 100.00 | A+ | 693,135 |
| 185 | 5.000%, 6/15/49 | 6/24 at 100.00 | A+ | 191,094 |
| 135,599 | Total Housing/Multifamily | | | 112,261,717 |
| | Long-Term Care – 0.5% (0.3% of Total Investments) | | | |
| 1,755 | California Health Facilities Financing Authority, Insured Revenue Bonds, Community | 10/22 at 100.00 | AA | 1,760,546 |
| | Program for Persons with Developmental Disabilities, Series 2011A, 6.250%, 2/01/26 | | | |
| 1,300 | California Health Facilities Financing Authority, Revenue Bonds, Northern California | 7/25 at 100.00 | AA | 1,374,854 |
| | Presbyterian Homes & Services Inc., Refunding Series 2015, 5.000%, 7/01/39 | | | |
| 3,055 | Total Long-Term Care | | | 3,135,400 |
| | Tax Obligation/General – 38.7% (23.0% of Total Investments) | | | |
| 1,600 | California State, General Obligation Bonds, Refunding Various Purpose Series 2016, | 8/26 at 100.00 | Aa2 | 1,737,856 |
| | 5.000%, 8/01/33 | | | |
| | California State, General Obligation Bonds, Various Purpose Series 2013: | | | |
| 3,500 | 5.000%, 4/01/37 | 4/23 at 100.00 | Aa2 | 3,549,280 |
| 2,000 | 5.000%, 2/01/43 | 2/23 at 100.00 | Aa2 | 2,019,680 |
| 5,520 | 5.000%, 11/01/43 | 11/23 at 100.00 | Aa2 | 5,671,469 |
| | California State, General Obligation Bonds, Various Purpose Series 2014: | | | |
| 2,460 | 5.000%, 10/01/39 | 10/24 at 100.00 | Aa2 | 2,575,325 |
| 9,000 | 5.000%, 12/01/43 | 12/23 at 100.00 | Aa2 | 9,263,880 |
| 9,000 | 5.000%, 10/01/44 | 10/24 at 100.00 | Aa2 | 9,397,710 |
| 8,000 | California State, General Obligation Bonds, Various Purpose Series 2015, 5.000%, 3/01/45 | 3/25 at 100.00 | Aa2 | 8,382,400 |
| 5,390 | California State, General Obligation Bonds, Various Purpose Series 2016, 5.000%, 9/01/46 | 9/26 at 100.00 | Aa2 | 5,742,775 |
| 7,995 | California State, General Obligation Bonds, Various Purpose Series 2017, | 11/27 at 100.00 | Aa2 | 8,586,870 |
| | 5.000%, 11/01/47 | | | |
| 15,000 | California State, General Obligation Bonds, Various Purpose Series 2020, | 11/30 at 100.00 | N/R | 17,023,650 |
| | 5.000%, 11/01/36 | | | |
| 2,000 | Chaffey Community College District, San Bernardino County, California, General | 6/28 at 100.00 | N/R | 1,946,820 |
| | Obligation Bonds, Taxable Refunding Series 2019, 4.000%, 6/01/43 | | | |
| 20,750 | Coachella Valley Unified School District, Riverside County, California, General | No Opt. Call | AA | 7,969,037 |
| | Obligation Bonds, Election 2005 Series 2010C, 0.000%, 8/01/43 – AGM Insured | | | |
| | Corona-Norco Unified School District, Riverside County, California, General Obligation | | | |
| | Bonds, Election 2014, Series 2018B: | | | |
| 4,500 | 4.000%, 8/01/43 | 8/28 at 100.00 | AAA | 4,383,000 |
| 9,840 | 5.000%, 8/01/47 | 8/28 at 100.00 | AAA | 10,620,509 |
| 9,790 | Glendale Community College District, Los Angeles County, California, General Obligation | 8/29 at 100.00 | Aa2 | 9,635,612 |
| | Bonds, Election 2016 Taxable Refunding Series 2020B, 4.000%, 8/01/50 | | | |
| 1,500 | Marin Healthcare District, Marin County, California, General Obligation Bonds, 2013 | 8/25 at 100.00 | N/R | 1,431,390 |
| | Election, Series 2015A, 4.000%, 8/01/45 | | | |
| 4,500 | Mount Diablo Unified School District, Contra Costa County, California, General | 8/25 at 100.00 | AA | 4,877,910 |
| | Obligation Bonds, Series 2010A, 5.500%, 8/01/30 – AGM Insured | | | |
| 1,300 | Mount San Jacinto Community College District, Riverside County, California, General | 8/28 at 100.00 | Aa1 | 1,296,763 |
| | Obligation Bonds, Election 2014, Series 2018B, 4.000%, 8/01/43 | | | |
| 2,125 | Pajaro Valley Unified School District, Santa Cruz County, California, General Obligation | 8/23 at 100.00 | N/R | 2,125,234 |
| | Bonds, Refunding Election 2012 Series 2013A, 4.250%, 8/01/47 | | | |
| | Puerto Rico, General Obligation Bonds, Restructured Series 2022A-1: | | | |
| 850 | 4.000%, 7/01/37 | 7/31 at 103.00 | N/R | 761,676 |
| 16,744 | 4.000%, 7/01/41 | 7/31 at 103.00 | N/R | 14,622,703 |
| 10,565 | 4.000%, 7/01/46 | 7/31 at 103.00 | N/R | 8,971,904 |
38
| Principal | | Optional Call | | |
| Amount (000) | Description (1) | Provisions (2) | Ratings (3) | Value |
| | Tax Obligation/General (continued) | | | |
| $ 11,980 | San Diego Unified School District, San Diego County, California, General Obligation | No Opt. Call | Aa2 | $ 9,064,308 |
| | Bonds, Refunding Series 2012R-1, 0.000%, 7/01/31 | | | |
| 3,400 | San Francisco Community College District, California, General Obligation Bonds, Election | 6/30 at 100.00 | N/R | 3,232,346 |
| | 2020 Series 2020A, 4.000%, 6/15/45 | | | |
| 2,000 | San Mateo County Community College District, California, General Obligation Bonds, | 9/28 at 100.00 | AAA | 2,175,820 |
| | Election 2014 Series 2018B, 5.000%, 9/01/45 | | | |
| 2,670 | San Mateo Union High School District, San Mateo County, California, General Obligation | No Opt. Call | Aaa | 2,387,247 |
| | Bonds, Capital Appreciation, Election 2010, Refunding Series 2011A, 0.000%, 9/01/33 (6) | | | |
| 1,580 | Santa Ana College Improvement District 1, Orange County, California, General Obligation | 8/26 at 100.00 | N/R | 1,358,911 |
| | Bonds, Rancho Santiago Community College District, Election of 2012, Series 2019C, | | | |
| | 3.000%, 8/01/39 | | | |
| 10,000 | Southwestern Community College District, San Diego County, California, General | No Opt. Call | Aa2 | 4,602,800 |
| | Obligation Bonds, Election of 2008, Series 2011C, 0.000%, 8/01/41 | | | |
| | Stockton Unified School District, San Joaquin County, California, General Obligation | | | |
| | Bonds, Election 2008 Series 2011D: | | | |
| 23,280 | 0.000%, 8/01/47 – AGC Insured (6) | 8/37 at 100.00 | AA | 24,481,713 |
| 38,845 | 0.000%, 8/01/50 – AGM Insured (6) | 8/37 at 100.00 | AA | 40,957,003 |
| 15,780 | Sylvan Union School District, Stanislaus County, California, General Obligation Bonds, | No Opt. Call | AA | 13,077,359 |
| | Election of 2006, Series 2010, 0.000%, 8/01/49 – AGM Insured (6) | | | |
| 8,345 | Yosemite Community College District, California, General Obligation Bonds, Capital | No Opt. Call | Aa2 | 6,415,469 |
| | Appreciation, Election 2004, Series 2010D, 0.000%, 8/01/42 (6) | | | |
| 271,809 | Total Tax Obligation/General | | | 250,346,429 |
| | Tax Obligation/Limited – 27.5% (16.3% of Total Investments) | | | |
| 1,000 | Bell Community Redevelopment Agency, California, Tax Allocation Bonds, Bell Project | 10/22 at 100.00 | AA | 1,003,330 |
| | Area, Series 2003, 5.625%, 10/01/33 – RAAI Insured | | | |
| 4,690 | Brea and Olinda Unified School District, Orange County, California, Certificates of | 10/22 at 100.00 | AA | 4,698,583 |
| | Participation Refunding, Series 2002A, 5.125%, 8/01/26 – AGM Insured | | | |
| | California Infrastructure and Economic Development Bank, Revenue Bonds, North County | | | |
| | Center for Self-Sufficiency Corporation, Series 2004: | | | |
| 1,695 | 5.000%, 12/01/22 – AMBAC Insured | 10/22 at 100.00 | AA+ | 1,698,780 |
| 1,780 | 5.000%, 12/01/23 – AMBAC Insured | 10/22 at 100.00 | AA+ | 1,784,148 |
| 1,865 | 5.000%, 12/01/24 – AMBAC Insured | 10/22 at 100.00 | AA+ | 1,869,084 |
| 7,000 | California State Public Works Board, Lease Revenue Bonds, Department of Corrections & | 9/23 at 100.00 | Aa3 | 7,189,770 |
| | Rehabilitation, Various Correctional Facilities Series 2013F, 5.250%, 9/01/31 | | | |
| | California State Public Works Board, Lease Revenue Bonds, Department of Education, | | | |
| | Riverside Campus Project, Series 2012H: | | | |
| 2,790 | 5.000%, 4/01/30 | 10/22 at 100.00 | Aa3 | 2,796,026 |
| 2,065 | 5.000%, 4/01/31 | 10/22 at 100.00 | Aa3 | 2,069,419 |
| 20,330 | California State Public Works Board, Lease Revenue Bonds, Judicial Council of | 10/24 at 100.00 | Aa3 | 21,240,987 |
| | California, New Stockton Courthouse, Series 2014B, 5.000%, 10/01/39 | | | |
| 1,990 | California State Public Works Board, Lease Revenue Bonds, Judicial Council of | 3/23 at 100.00 | Aa3 | 2,013,860 |
| | California, Various Projects Series 2013A, 5.000%, 3/01/33 | | | |
| 4,720 | El Monte, California, Senior Lien Certificates of Participation, Department of Public | 10/22 at 100.00 | Aa2 | 4,731,281 |
| | Services Facility Phase II, Series 2001, 5.250%, 1/01/34 – AMBAC Insured, 144A | | | |
| | Government of Guam, Business Privilege Tax Bonds, Refunding Series 2015D: | | | |
| 7,610 | 5.000%, 11/15/30 | 11/25 at 100.00 | BB | 7,873,686 |
| 4,000 | 5.000%, 11/15/34 | 11/25 at 100.00 | BB | 4,103,520 |
| 90 | Inglewood Redevelopment Agency, California, Tax Allocation Bonds, Merged Redevelopment | No Opt. Call | N/R | 91,324 |
| | Project, Refunding Series 1998A, 5.250%, 5/01/23 – AMBAC Insured | | | |
| 1,110 | Lake Elsinore Public Financing Authority, California, Local Agency Revenue Bonds, | 9/25 at 100.00 | N/R | 1,142,923 |
| | Refunding Series 2015, 5.000%, 9/01/40 | | | |
39
| NKX | Nuveen California AMT-Free Quality |
| | Municipal Income Fund |
| | Portfolio of Investments (continued) |
| | August 31, 2022 (Unaudited) |
| Principal | | Optional Call | | |
| Amount (000) | Description (1) | Provisions (2) | Ratings (3) | Value |
| | Tax Obligation/Limited (continued) | | | |
| $ 2,000 | Lammersville Joint Unified School District, California, Special Tax Bonds, Community | 9/23 at 100.00 | N/R | $ 2,042,620 |
| | Facilities District 2007-1 Mountain House – Shea Homes Improvement Area 1, Series 2013, | | | |
| | 6.000%, 9/01/38 | | | |
| 1,000 | Lathrop, California, Limited Obligation Improvement Bonds, Crossroads Assessment | 9/25 at 100.00 | N/R | 1,029,690 |
| | District, Series 2015, 5.000%, 9/02/40 | | | |
| | Los Angeles County Metropolitan Transportation Authority, California, Proposition A | | | |
| | First Tier Senior Sales Tax Revenue Bonds, Green Series 2017A: | | | |
| 7,860 | 5.000%, 7/01/39 | 7/27 at 100.00 | AAA | 8,589,094 |
| 7,140 | 5.000%, 7/01/41 | 7/27 at 100.00 | AAA | 7,779,244 |
| 3,220 | Los Angeles County Metropolitan Transportation Authority, California, Proposition C | 7/27 at 100.00 | AAA | 3,502,555 |
| | Sales Tax Revenue Bonds, Senior Lien Series 2017A, 5.000%, 7/01/42 | | | |
| 3,855 | Los Angeles County Public Works Financing Authority, California, Lease Revenue Bonds, | 12/29 at 100.00 | AA+ | 4,231,788 |
| | Series 2019E-1, 5.000%, 12/01/49 | | | |
| 475 | Lynwood Redevelopment Agency, California, Tax Allocation Revenue Bonds, Project Area A, | 10/22 at 100.00 | A | 476,648 |
| | Subordinate Lien Series 2011A, 7.250%, 9/01/38 | | | |
| | Patterson Public Finance Authority, California, Revenue Bonds, Community Facilities | | | |
| | District 2001-1, Senior Series 2013A: | | | |
| 3,715 | 5.250%, 9/01/30 | 9/23 at 100.00 | N/R | 3,785,139 |
| 3,320 | 5.750%, 9/01/39 | 9/23 at 100.00 | N/R | 3,382,881 |
| 500 | Patterson Public Finance Authority, California, Revenue Bonds, Community Facilities | 9/23 at 100.00 | N/R | 510,075 |
| | District 2001-1, Subordinate Lien Series 2013B, 5.875%, 9/01/39 | | | |
| 1,750 | Peninsula Corridor Joint Powers Board, California, Measure RR Sales Tax Revenue Bonds, | 6/31 at 100.00 | N/R | 1,936,095 |
| | Green Bonds-Climate Bond Certified, Series 2022A, 5.000%, 6/01/51 | | | |
| 1,940 | Perris Joint Powers Authority, California, Local Agency Revenue Bonds, Community | 9/23 at 100.00 | N/R | 1,974,513 |
| | Facilities District 2001-1 May Farms Improvement Area 1,2 and 3, Refunding Series 2014A, | | | |
| | 5.375%, 9/01/33 | | | |
| | Puerto Rico Sales Tax Financing Corporation, Sales Tax Revenue Bonds, Restructured 2018A-1: | | | |
| 32,445 | 0.000%, 7/01/51 | 7/28 at 30.01 | N/R | 6,919,221 |
| 20,429 | 5.000%, 7/01/58 | 7/28 at 100.00 | N/R | 19,818,173 |
| 12 | Puerto Rico Sales Tax Financing Corporation, Sales Tax Revenue Bonds, Taxable | 7/28 at 100.00 | N/R | 11,075 |
| | Restructured Cofina Project Series 2019A-2, 4.536%, 7/01/53 | | | |
| 2,160 | River Islands Public Financing Authority, California, Special Tax Bonds, Community | 9/29 at 103.00 | N/R | 2,359,498 |
| | Facilities District 2003-1 Improvement Area 1, Refunding Series 2022A-1, 5.250%, 9/01/52 - | | | |
| | AGM Insured | | | |
| | Riverside County, California, Special Tax Bonds, Community Facilities District 05-8 | | | |
| | Scott Road, Series 2013: | | | |
| 660 | 5.000%, 9/01/32 | 10/22 at 100.00 | N/R | 660,779 |
| 1,775 | 5.000%, 9/01/42 | 10/22 at 100.00 | N/R | 1,776,295 |
| 400 | Roseville, California, Special Tax Bonds, Community Facilities District 1 Westpark, | 9/25 at 100.00 | N/R | 417,480 |
| | Refunding Series 2015, 5.000%, 9/01/33 | | | |
| | Sacramento Area Flood Control Agency, California, Consolidated Capital Assessment | | | |
| | District 2 Bonds, Series 2016A: | | | |
| 3,695 | 5.000%, 10/01/36 | 10/26 at 100.00 | AA | 3,982,397 |
| 8,290 | 5.000%, 10/01/41 | 10/26 at 100.00 | AA | 8,841,783 |
| 6,230 | 5.000%, 10/01/47 | 10/26 at 100.00 | AA | 6,601,121 |
| 210 | San Clemente, California, Special Tax Revenue Bonds, Community Facilities District | 9/25 at 100.00 | N/R | 216,229 |
| | 2006-1 Marblehead Coastal, Series 2015, 5.000%, 9/01/40 | | | |
| 1,215 | San Diego Redevelopment Agency, California, Subordinate Lien Tax Increment and Parking | 10/22 at 100.00 | AAA | 1,217,916 |
| | Revenue Bonds, Centre City Project, Series 2003B, 5.250%, 9/01/26 | | | |
| 380 | San Francisco City and County Redevelopment Agency Successor Agency, California, Special | 10/22 at 100.00 | N/R | 380,410 |
| | Tax Bonds, Community Facilities District 6 Mission Bay South Public Improvements, Refunding | | | |
| | Series 2013A, 5.000%, 8/01/33 | | | |
40
| Principal | | Optional Call | | |
| Amount (000) | Description (1) | Provisions (2) | Ratings (3) | Value |
| | Tax Obligation/Limited (continued) | | | |
| $ 605 | San Francisco City and County Redevelopment Agency Successor Agency, California, Special | 8/24 at 100.00 | N/R | $ 617,070 |
| | Tax Bonds, Community Facilities District 7, Hunters Point Shipyard Phase One Improvements, | | | |
| | Refunding Series 2014, 5.000%, 8/01/39 | | | |
| 2,700 | San Francisco City and County Redevelopment Financing Authority, California, Tax | No Opt. Call | AA | 2,572,047 |
| | Allocation Revenue Bonds, San Francisco Redevelopment Projects, Series 1998D, 0.000%, | | | |
| | 8/01/24 - NPFG Insured | | | |
| 40 | Signal Hill Redevelopment Agency, California, Project 1 Tax Allocation Bonds, Series | 10/22 at 100.00 | N/R | 40,125 |
| | 2011, 7.000%, 10/01/26 | | | |
| 3,600 | Stockton Public Financing Authority, California, Revenue Bonds, Arch Road East Community | 9/25 at 103.00 | N/R | 3,841,920 |
| | Facility District 99-02, Series 2018A, 5.000%, 9/01/33 | | | |
| | Temecula Public Financing Authority, California, Special Tax Bonds, Community Facilities | | | |
| | District 16-01, Series 2017: | | | |
| 2,145 | 6.125%, 9/01/37, 144A | 9/27 at 100.00 | N/R | 2,242,962 |
| 990 | 6.250%, 9/01/47, 144A | 9/27 at 100.00 | N/R | 1,028,937 |
| 635 | Transbay Joint Powers Authority, California, Tax Allocation Bonds, Senior Green Series | 4/30 at 100.00 | A– | 668,395 |
| | 2020A, 5.000%, 10/01/49 | | | |
| 4,500 | Virgin Islands Public Finance Authority, Gross Receipts Taxes Loan Note, Refunding | 10/22 at 100.00 | AA | 4,521,960 |
| | Series 2012A, 5.000%, 10/01/32 – AGM Insured | | | |
| | West Patterson Financing Authority, California, Special Tax Bonds, Community Facilities | | | |
| | District 2015-1 Arambel-KDN, Refunding Series 2015: | | | |
| 350 | 5.250%, 9/01/35 | 9/25 at 100.00 | N/R | 364,987 |
| 790 | 5.250%, 9/01/45 | 9/25 at 100.00 | N/R | 815,398 |
| 4,060 | West Sacramento Financing Authority, California, Special Tax Revenue Bonds, Series 2014, | 3/23 at 101.50 | N/R | 4,181,556 |
| | 5.500%, 9/01/31 | | | |
| 197,826 | Total Tax Obligation/Limited | | | 177,644,797 |
| | Transportation – 11.4% (6.8% of Total Investments) | | | |
| | Los Angeles Department of Airports, California, Revenue Bonds, Los Angeles International | | | |
| | Airport, Senior Lien Series 2015E: | | | |
| 150 | 5.000%, 5/15/31 | 5/25 at 100.00 | Aa2 | 159,201 |
| 1,270 | 5.000%, 5/15/34 | 5/25 at 100.00 | Aa2 | 1,340,498 |
| 1,345 | 5.000%, 5/15/36 | 5/25 at 100.00 | Aa2 | 1,416,809 |
| 4,000 | Los Angeles Department of Airports, California, Revenue Bonds, Los Angeles International | 5/27 at 100.00 | Aa3 | 4,234,320 |
| | Airport, Subordinate Lien Series 2017B, 5.000%, 5/15/42 | | | |
| 13,000 | San Diego County Regional Airport Authority, California, Airport Revenue Bonds, | 7/31 at 100.00 | N/R | 12,249,900 |
| | Subordinate Series 2021A, 4.000%, 7/01/51 | | | |
| 4,535 | San Francisco Airports Commission, California, Revenue Bonds, San Francisco | 5/27 at 100.00 | A1 | 4,824,605 |
| | International Airport, Governmental Purpose Second Series 2017B, 5.000%, 5/01/47 | | | |
| 44,650 | San Francisco Airports Commission, California, Revenue Bonds, San Francisco | 5/28 at 100.00 | A1 | 47,348,199 |
| | International Airport, Second Series 2018E, 5.000%, 5/01/48 | | | |
| 2,025 | San Joaquin Hills Transportation Corridor Agency, Orange County, California, Refunding | 1/32 at 100.00 | N/R | 1,850,567 |
| | Senior Lien Toll Road Revenue Bonds, Series 2021A, 4.000%, 1/15/50 | | | |
| 70,975 | Total Transportation | | | 73,424,099 |
| | U.S. Guaranteed – 27.1% (16.1% of Total Investments) (7) | | | |
| 1,115 | Bay Area Toll Authority, California, Revenue Bonds, San Francisco Bay Area Toll Bridge, | 4/23 at 100.00 | A1 | 1,134,178 |
| | Series 2013S-4, 5.250%, 4/01/48, (Pre-refunded 4/01/23) | | | |
| 7,600 | Bay Area Water Supply and Conservation Agency, California, Revenue Bonds, Capital Cost | 4/23 at 100.00 | AA– | 7,715,444 |
| | Recovery Prepayment Program, Series 2013A, 5.000%, 10/01/34, (Pre-refunded 4/01/23) | | | |
| 655 | Beaumont Financing Authority, California, Local Agency Revenue Bonds, Improvement Area | 9/23 at 100.00 | N/R | 672,004 |
| | 19C, Series 2013A, 5.000%, 9/01/27, (Pre-refunded 9/01/23) | | | |
| 3,000 | California Educational Facilities Authority, Revenue Bonds, Pepperdine University, | 9/25 at 100.00 | AA– | 3,233,550 |
| | Series 2015, 5.000%, 9/01/40, (Pre-refunded 9/01/25) | | | |
| 430 | California Health Facilities Financing Authority, California, Revenue Bonds, Sutter | 8/25 at 100.00 | A1 | 461,730 |
| | Health, Refunding Series 2015A, 5.000%, 8/15/43, (Pre-refunded 8/15/25) | | | |
41
| NKX | Nuveen California AMT-Free Quality |
| | Municipal Income Fund |
| | Portfolio of Investments (continued) |
| | August 31, 2022 (Unaudited) |
| Principal | | Optional Call | | |
| Amount (000) | Description (1) | Provisions (2) | Ratings (3) | Value |
| | U.S. Guaranteed (continued) (7) | | | |
| $ 2,040 | California Health Facilities Financing Authority, California, Revenue Bonds, Sutter | | | |
| | Health, Refunding Series 2016B, 5.000%, 11/15/46, (Pre-refunded 11/15/26) | 11/26 at 100.00 | N/R | $ 2,257,872 |
| | California Health Facilities Financing Authority, California, Revenue Bonds, Sutter | | | |
| | Health, Series 2016A: | | | |
| 18,430 | 5.000%, 11/15/41, (Pre-refunded 11/15/25) | 11/25 at 100.00 | A1 | 19,928,543 |
| 7,500 | 5.000%, 11/15/46, (Pre-refunded 11/15/25) | 11/25 at 100.00 | A1 | 8,109,825 |
| 610 | California Health Facilities Financing Authority, Revenue Bonds, Providence Health & | | | |
| | Services, Refunding Series 2014A, 5.000%, 10/01/38, (Pre-refunded 10/01/24) | 10/24 at 100.00 | N/R | 643,416 |
| 2,250 | California Infrastructure and Economic Development Bank, First Lien Revenue Bonds, San | 1/28 at 100.00 | AA+ | 2,547,968 |
| | Francisco Bay Area Toll Bridge, Series 2003A, 5.000%, 7/01/36, (Pre-refunded 1/01/28) – | | | |
| | AMBAC Insured | | | |
| 3,000 | California Infrastructure and Economic Development Bank, Infrastructure State Revolving | 10/26 at 100.00 | AAA | 3,305,520 |
| | Fund Revenue Bonds, Series 2016A, 5.000%, 10/01/41, (Pre-refunded 10/01/26) | | | |
| 4,475 | California Municipal Finance Authority Charter School Revenue Bonds, Albert Einstein | 8/23 at 100.00 | BB | 4,665,277 |
| | Academies Project, Series 2013A, 7.125%, 8/01/43, (Pre-refunded 8/01/23) | | | |
| | California Municipal Finance Authority, Mobile Home Park Revenue Bonds, Windsor Mobile | | | |
| | Country Club Series 2013A: | | | |
| 2,000 | 5.625%, 11/15/33, (Pre-refunded 11/15/23) | 11/23 at 100.00 | N/R | 2,075,740 |
| 8,000 | 6.000%, 11/15/48, (Pre-refunded 11/15/23) | 11/23 at 100.00 | N/R | 8,336,320 |
| 7,875 | California Municipal Finance Authority, Revenue Bonds, Pomona College, Series 2017, | 1/28 at 100.00 | AAA | 8,917,886 |
| | 5.000%, 1/01/48, (Pre-refunded 1/01/28) | | | |
| 6,750 | Foothill/Eastern Transportation Corridor Agency, California, Toll Road Revenue Bonds, | 1/24 at 100.00 | BBB+ | 7,079,603 |
| | Refunding Junior Lien Series 2013C, 6.500%, 1/15/43, (Pre-refunded 1/15/24) | | | |
| | Foothill/Eastern Transportation Corridor Agency, California, Toll Road Revenue Bonds, | | | |
| | Refunding Series 2013A: | | | |
| 14,885 | 5.750%, 1/15/46, (Pre-refunded 1/15/24) | 1/24 at 100.00 | A– | 15,571,645 |
| 14,885 | 6.000%, 1/15/53, (Pre-refunded 1/15/24) | 1/24 at 100.00 | A– | 15,615,407 |
| 45,825 | Golden State Tobacco Securitization Corporation, California, Enhanced Tobacco Settlement | 6/25 at 100.00 | Aa3 | 49,042,831 |
| | Asset-Backed Revenue Bonds, Refunding Series 2015A, 5.000%, 6/01/45, (Pre-refunded 6/01/25) | | | |
| 1,000 | Golden State Tobacco Securitization Corporation, California, Enhanced Tobacco Settlement | 6/23 at 100.00 | Aa3 | 1,020,680 |
| | Asset-Backed Revenue Bonds, Series 2013A, 5.000%, 6/01/30, (Pre-refunded 6/01/23) | | | |
| | Lake Elsinore Public Financing Authority, California, Local Agency Revenue Bonds, Canyon | | | |
| | Hills Improvement Area D, Series 2014A: | | | |
| 1,140 | 5.500%, 9/01/33, (Pre-refunded 9/01/23) | 9/23 at 100.00 | N/R | 1,175,180 |
| 2,105 | 5.750%, 9/01/44, (Pre-refunded 9/01/23) | 9/23 at 100.00 | N/R | 2,175,118 |
| 1,115 | Rio Elementary School District, California, Special Tax Bonds, Community Facilities | 9/23 at 100.00 | N/R | 1,149,966 |
| | District 1, Series 2013, 5.500%, 9/01/39, (Pre-refunded 9/01/23) | | | |
| 2,870 | Sanger Unified School District, Fresno County, California, General Obligation Bonds, | 8/24 at 100.00 | AA | 3,012,409 |
| | Election 2012, Series 2014B, 5.000%, 8/01/39, (Pre-refunded 8/01/24) – AGM Insured | | | |
| 5,000 | Walnut Valley Unified School District, Los Angeles County, California, General | 8/24 at 100.00 | Aa1 | 5,252,900 |
| | Obligation Bonds, Election 2007 Measure S, Series 2014C, 5.000%, 8/01/39, (Pre-refunded 8/01/24) | | | |
| 164,555 | Total U.S. Guaranteed | | | 175,101,012 |
| | Utilities – 23.7% (14.1% of Total Investments) | | | |
| 5,850 | California Infrastructure and Economic Development Bank. Clean Water State Revolving | 4/28 at 100.00 | AAA | 6,425,640 |
| | Fund Revenue Bonds, Green Series 2018, 5.000%, 10/01/43 | | | |
| 3,675 | California Pollution Control Financing Authority, Water Furnishing Revenue Bonds, San | 1/29 at 100.00 | BBB | 3,634,869 |
| | Diego County Water Authority Desalination Project Pipeline, Refunding Series 2019, 5.000%, | | | |
| | 11/21/45, 144A | | | |
| | Long Beach Bond Finance Authority, California, Natural Gas Purchase Revenue Bonds, | | | |
| | Series 2007A: | | | |
| 2,490 | 5.000%, 11/15/35 | No Opt. Call | AA– | 2,652,871 |
| 1,835 | 5.500%, 11/15/37 | No Opt. Call | AA– | 2,046,374 |
42
| Principal | | Optional Call | | |
| Amount (000) | Description (1) | Provisions (2) | Ratings (3) | Value |
| | Utilities (continued) | | | |
| $ 4,280 | Los Angeles Department of Water and Power, California, Power System Revenue Bonds, | 7/23 at 100.00 | Aa2 | $ 4,374,374 |
| | Series 2013B, 5.000%, 7/01/28 | | | |
| 5,000 | Los Angeles Department of Water and Power, California, Power System Revenue Bonds, | 1/26 at 100.00 | Aa2 | 5,276,950 |
| | Series 2016A, 5.000%, 7/01/46 | | | |
| 6,015 | Los Angeles Department of Water and Power, California, Power System Revenue Bonds, | 1/27 at 100.00 | Aa2 | 6,441,163 |
| | Series 2017A, 5.000%, 7/01/42 | | | |
| 12,900 | Los Angeles Department of Water and Power, California, Power System Revenue Bonds, | 7/27 at 100.00 | Aa2 | 13,839,765 |
| | Series 2017C, 5.000%, 7/01/47 | | | |
| 3,575 | Los Angeles Department of Water and Power, California, Power System Revenue Bonds, | 7/29 at 100.00 | Aa2 | 3,919,451 |
| | Series 2019D, 5.000%, 7/01/44 | | | |
| 3,000 | Los Angeles Department of Water and Power, California, Power System Revenue Bonds, | 7/31 at 100.00 | N/R | 3,298,260 |
| | Series 2022A, 5.000%, 7/01/46 | | | |
| 3,775 | Los Angeles Department of Water and Power, California, Waterworks Revenue Bonds, | 1/26 at 100.00 | AA+ | 4,034,682 |
| | Refunding Series 2016B, 5.000%, 7/01/35 | | | |
| 10,515 | Los Angeles Department of Water and Power, California, Waterworks Revenue Bonds, Series | 7/24 at 100.00 | AA+ | 10,934,338 |
| | 2014A, 5.000%, 7/01/44 | | | |
| | Los Angeles Department of Water and Power, California, Waterworks Revenue Bonds, Series 2016A: | | | |
| 5,680 | 5.000%, 7/01/35 | 1/26 at 100.00 | AA+ | 6,070,727 |
| 1,000 | 5.000%, 7/01/36 | 1/26 at 100.00 | AA+ | 1,067,710 |
| | Los Angeles Department of Water and Power, California, Waterworks Revenue Bonds, Series 2017A: | | | |
| 9,455 | 5.000%, 7/01/44 | 1/27 at 100.00 | AA+ | 10,115,432 |
| 5,000 | 5.250%, 7/01/44 | 1/27 at 100.00 | AA+ | 5,399,350 |
| 2,210 | Los Angeles, California, Wastewater System Revenue Bonds, Green Subordinate Lien Series | 6/27 at 100.00 | AA | 2,410,734 |
| | 2017A, 5.250%, 6/01/47 | | | |
| 5,000 | Los Angeles, California, Wastewater System Revenue Bonds, Green Subordinate Series | 6/28 at 100.00 | AA | 5,397,150 |
| | 2018A, 5.000%, 6/01/48 | | | |
| 9,500 | Los Angeles, California, Wastewater System Revenue Bonds, Refunding Green Series 2015A, | 6/25 at 100.00 | AA+ | 9,997,990 |
| | 5.000%, 6/01/44 | | | |
| | Los Angeles, California, Wastewater System Revenue Bonds, Refunding Subordinate Lien | | | |
| | Series 2013A: | | | |
| 2,000 | 5.000%, 6/01/34 | 6/23 at 100.00 | AA | 2,036,400 |
| 3,500 | 5.000%, 6/01/35 | 6/23 at 100.00 | AA | 3,563,175 |
| 1,000 | New York State Environmental Facilities Corporation, State Clean Water and Drinking | 6/28 at 100.00 | AAA | 1,085,380 |
| | Water Revolving Funds Revenue Bonds, New York City Municipal Water Finance Authority | | | |
| | Projects-Second Resolution Bonds, Subordinated SRF Series 2018B, 5.000%, 6/15/48 | | | |
| 2,500 | Sacramento County Sanitation Districts Financing Authority, California, Revenue Bonds, | 6/24 at 100.00 | AA | 2,595,425 |
| | Sacramento Regional County Sanitation District, Series 2014A, 5.000%, 12/01/33 | | | |
| 4,000 | San Diego Public Facilities Financing Authority, California, Water Utility Revenue | 8/26 at 100.00 | Aa3 | 4,327,240 |
| | Bonds, Refunding Subordinate Lien Series 2016B, 5.000%, 8/01/37 | | | |
| 26,220 | San Francisco City and County Public Utilities Commission, California, Water Revenue | 11/27 at 100.00 | Aa2 | 29,156,116 |
| | Bonds, Refunding Green Series 2017D, 5.000%, 11/01/33, (UB) (8) | | | |
| 2,975 | Southern California Public Power Authority, California, Revenue Bonds, Apex Power | 7/24 at 100.00 | AA– | 3,089,835 |
| | Project Series 2014A, 5.000%, 7/01/37 | | | |
| 142,950 | Total Utilities | | | 153,191,401 |
| $ 1,129,905 | Total Long-Term Investments (cost $1,067,572,438) | | | 1,087,243,178 |
| | Floating Rate Obligations – (3.2)% | | | (20,975,000) |
| | MuniFund Preferred Shares, net of deferred offering costs – (21.7)% (9) | | | (140,017,115) |
| | Variable Rate Demand Preferred Shares, net of deferred offering costs – (45.0)% (10) | | | (290,632,353) |
| | Other Assets Less Liabilities – 1.6% | | | 10,555,319 |
| | Net Assets Applicable to Common Shares – 100% | | | $ 646,174,029 |
43
| NKX | Nuveen California AMT-Free Quality |
| | Municipal Income Fund |
| | Portfolio of Investments (continued) |
| | August 31, 2022 (Unaudited) |
| (1) | All percentages shown in the Portfolio of Investments are based on net assets applicable to common shares unless otherwise noted. |
(2)
| Optional Call Provisions: Dates (month and year) and prices of the earliest optional call or redemption. There may be other call provisions at varying prices at later dates. Certain mortgage-backed securities may be subject to periodic principal paydowns. |
(3)
| For financial reporting purposes, the ratings disclosed are the highest of Standard & Poor’s Group (“Standard & Poor’s”), Moody’s Investors Service, Inc. (“Moody’s”) or Fitch, Inc. (“Fitch”) rating. This treatment of split-rated securities may differ from that used for other purposes, such as for Fund investment policies. Ratings below BBB by Standard & Poor’s, Baa by Moody’s or BBB by Fitch are considered to be below investment grade. Holdings designated N/R are not rated by any of these national rating agencies. |
| (4) | Defaulted security. A security whose issuer has failed to fully pay principal and/or interest when due, or is under the protection of bankruptcy. |
(5)
| Investment valued at fair value using methods determined in good faith by, or at the discretion of, the Board. For fair value measurement disclosure purposes, investment classified as Level 3. |
(6)
| Step-up coupon bond, a bond with a coupon that increases ("steps up"), usually at regular intervals, while the bond is outstanding. The rate shown is the coupon as of the end of the reporting period. |
| (7) | Backed by an escrow or trust containing sufficient U.S. Government or U.S. Government agency securities, which ensure the timely payment of principal and interest. |
| (8) | Investment, or portion of investment, has been pledged to collateralize the net payment obligations for investments in inverse floating rate transactions. |
| (9) | MuniFund Preferred Shares, net of deferred offering costs as a percentage of Total Investments is 12.9%. |
| (10) | Variable Rate Demand Preferred Shares, net of deferred offering costs as a percentage of Total Investments is 26.7%. |
144A
| Investment is exempt from registration under Rule 144A of the Securities Act of 1933, as amended. These investments may only be resold in transactions exempt from registration, which are normally those transactions with qualified institutional buyers. |
| UB | Underlying bond of an inverse floating rate trust reflected as a financing transaction. |
| | See accompanying notes to financial statements. |
44
| NCA | Nuveen California Municipal Value Fund |
| | Portfolio of Investments |
| | August 31, 2022 (Unaudited) |
| Principal | | Optional Call | | |
| Amount (000) | Description (1) | Provisions (2) | Ratings (3) | Value |
| | LONG-TERM INVESTMENTS – 98.7% (100.0% of Total Investments) | | | |
| | MUNICIPAL BONDS – 98.7% (100.0% of Total Investments) | | | |
| | Consumer Staples – 0.6% (0.6% of Total Investments) | | | |
| $ 70 | California County Tobacco Securitization Agency, Tobacco Settlement Asset-Backed Bonds, | 6/30 at 100.00 | BBB+ | $ 65,829 |
| | Los Angeles County Securitization Corporation, Series 2020A, 4.000%, 6/01/49 | | | |
| 4,895 | Silicon Valley Tobacco Securitization Authority, California, Tobacco Settlement | 10/22 at 35.16 | N/R | 1,712,858 |
| | Asset-Backed Bonds, Santa Clara County Tobacco Securitization Corporation, Series 2007A, | | | |
| | 0.000%, 6/01/41 | | | |
| 4,965 | Total Consumer Staples | | | 1,778,687 |
| | Education and Civic Organizations – 1.2% (1.2% of Total Investments) | | | |
| 200 | California Municipal Finance Authority, Charter School Revenue Bonds, Partnerships to | 10/22 at 100.00 | BB | 196,118 |
| | Uplift Communities Project, Series 2012A, 5.250%, 8/01/42 | | | |
| 1,000 | California Municipal Finance Authority, Revenue Bonds, Linxs APM Project, Senior Lien | 6/28 at 100.00 | BBB– | 1,019,280 |
| | Series 2018A, 5.000%, 12/31/43, (AMT) | | | |
| 220 | California School Finance Authority, School Facility Revenue Bonds, Alliance for | 7/25 at 100.00 | BBB | 222,873 |
| | College-Ready Public Schools Project, Series 2016A, 5.000%, 7/01/46, 144A | | | |
| 1,425 | California School Finance Authority, School Facility Revenue Bonds, Alliance for | 7/25 at 101.00 | BBB | 1,458,944 |
| | College-Ready Public Schools Project, Series 2016C, 5.250%, 7/01/52, 144A | | | |
| 690 | California State University, Systemwide Revenue Bonds, Series 2016A, 4.000%, 11/01/38 | 5/26 at 100.00 | Aa2 | 693,705 |
| 3,535 | Total Education and Civic Organizations | | | 3,590,920 |
| | Health Care – 8.8% (9.0% of Total Investments) | | | |
| | California Health Facilities Financing Authority, California, Revenue Bonds, Sutter | | | |
| | Health, Series 2018A: | | | |
| 1,200 | 5.000%, 11/15/34 | 11/27 at 100.00 | A1 | 1,294,536 |
| 4,105 | 5.000%, 11/15/48 | 11/27 at 100.00 | A1 | 4,324,864 |
| 2,045 | California Health Facilities Financing Authority, Revenue Bonds, City of Hope National | 11/29 at 100.00 | A+ | 1,941,319 |
| | Medical Center, Series 2019, 4.000%, 11/15/45 | | | |
| | California Health Facilities Financing Authority, Revenue Bonds, CommonSpirit Health, | | | |
| | Series 2020A: | | | |
| 1,815 | 4.000%, 4/01/44 | 4/30 at 100.00 | BBB+ | 1,703,305 |
| 3,830 | 4.000%, 4/01/49 | 4/30 at 100.00 | BBB+ | 3,522,106 |
| 625 | California Health Facilities Financing Authority, Revenue Bonds, Lucile Salter Packard | 8/24 at 100.00 | AA– | 640,425 |
| | Children’s Hospital, Series 2014A, 5.000%, 8/15/43 | | | |
| | California Health Facilities Financing Authority, Revenue Bonds, Providence Health & | | | |
| | Services, Refunding Series 2014A: | | | |
| 240 | 5.000%, 10/01/38 | 10/24 at 100.00 | AA– | 249,497 |
| 840 | California Health Facilities Financing Authority, Revenue Bonds, Providence Health & | 10/24 at 100.00 | AA– | 869,207 |
| | Services, Series 2014B, 5.000%, 10/01/44 | | | |
| 1,600 | California Municipal Finance Authority, Revenue Bonds, Community Health System, Series | 2/32 at 100.00 | N/R | 1,536,128 |
| | 2021A, 4.000%, 2/01/51 – AGM Insured | | | |
| | California Municipal Finance Authority, Revenue Bonds, Eisenhower Medical Center, | | | |
| | Refunding Series 2017A: | | | |
| 120 | 5.000%, 7/01/42 | 7/27 at 100.00 | Baa2 | 123,293 |
| 2,000 | 4.000%, 7/01/47 | 7/27 at 100.00 | N/R | 1,742,280 |
| | California Municipal Finance Authority, Revenue Bonds, NorthBay Healthcare Group, Series | | | |
| | 2017A: | | | |
| 100 | 5.250%, 11/01/41 | 11/26 at 100.00 | BBB– | 102,680 |
| 1,090 | 5.000%, 11/01/47 | 11/26 at 100.00 | BBB– | 1,095,504 |
| 400 | 5.250%, 11/01/47 | 11/26 at 100.00 | BBB– | 406,804 |
45
| NCA | Nuveen California Municipal Value Fund |
| | Portfolio of Investments (continued) |
| | August 31, 2022 (Unaudited) |
| Principal | | Optional Call | | |
| Amount (000) | Description (1) | Provisions (2) | Ratings (3) | Value |
| | Health Care (continued) | | | |
| $ 1,000 | California Statewide Communities Development Authority, California, Redlands Community | 10/26 at 100.00 | A– | $ 1,033,050 |
| | Hospital, Revenue Bonds, Series 2016, 5.000%, 10/01/46 | | | |
| 150 | California Statewide Communities Development Authority, California, Revenue Bonds, Loma | 12/24 at 100.00 | BB | 153,597 |
| | Linda University Medical Center, Series 2014A, 5.250%, 12/01/34 | | | |
| | California Statewide Communities Development Authority, California, Revenue Bonds, Loma | | | |
| | Linda University Medical Center, Series 2016A: | | | |
| 2,390 | 5.000%, 12/01/46, 144A | 6/26 at 100.00 | BB | 2,330,513 |
| 3,410 | 5.250%, 12/01/56, 144A | 6/26 at 100.00 | BB | 3,413,921 |
| 1,000 | California Statewide Communities Development Authority, California, Revenue Bonds, Loma | 6/28 at 100.00 | BB | 1,004,200 |
| | Linda University Medical Center, Series 2018A, 5.250%, 12/01/48, 144A | | | |
| 27,960 | Total Health Care | | | 27,487,229 |
| | Housing/Multifamily – 9.7% (9.8% of Total Investments) | | | |
| 2,175 | California Community Housing Agency, California, Essential Housing Revenue Bonds, | 8/31 at 100.00 | N/R | 1,740,283 |
| | Creekwood, Series 2021A, 4.000%, 2/01/56, 144A | | | |
| 2,190 | California Community Housing Agency, California, Essential Housing Revenue Bonds, | 8/31 at 100.00 | N/R | 1,690,527 |
| | Glendale Properties, Junior Series 2021A-2, 4.000%, 8/01/47, 144A | | | |
| 1,420 | California Community Housing Agency, California, Essential Housing Revenue Bonds, | 2/30 at 100.00 | N/R | 1,339,145 |
| | Serenity at Larkspur Apartments, Series 2020A, 5.000%, 2/01/50, 144A | | | |
| 800 | California Community Housing Agency, California, Essential Housing Revenue Bonds, | 2/31 at 100.00 | N/R | 644,368 |
| | Stoneridge Apartments, Series 2021A, 4.000%, 2/01/56, 144A | | | |
| 1,115 | California Community Housing Agency, Workforce Housing Revenue Bonds, Annadel | 4/29 at 100.00 | N/R | 1,037,541 |
| | Apartments, Series 2019A, 5.000%, 4/01/49, 144A | | | |
| 2,223 | California Housing Finance Agency, Municipal Certificate Revenue Bonds, Class A Series | No Opt. Call | BBB+ | 2,204,378 |
| | 2019-2, 4.000%, 3/20/33 | | | |
| 1,871 | California Housing Finance Agency, Municipal Certificate Revenue Bonds, Class A Series | No Opt. Call | BBB+ | 1,743,690 |
| | 2021-1, 3.500%, 11/20/35 | | | |
| 330 | California Housing Finance Agency, Municipal Certificate Revenue Bonds, Class A | No Opt. Call | BBB+ | 330,767 |
| | Series2019-1, 4.250%, 1/15/35 | | | |
| | California Municipal Finance Authority, Mobile Home Park Revenue Bonds, Caritas | | | |
| | Affordable Housing Inc Projects, Senior Series 2014A: | | | |
| 80 | 5.250%, 8/15/39 | 8/24 at 100.00 | A– | 81,759 |
| 215 | 5.250%, 8/15/49 | 8/24 at 100.00 | A– | 218,689 |
| 2,320 | CMFA Special Finance Agency I, California, Essential Housing Revenue Bonds, The Mix at | 4/31 at 100.00 | N/R | 1,892,609 |
| | Center City, Series 2021A-2, 4.000%, 4/01/56, 144A | | | |
| 800 | CMFA Special Finance Agency, California, Essential Housing Revenue Bonds, Enclave | 2/32 at 100.00 | N/R | 671,776 |
| | Apartments, Senior Series 2022A-1, 4.000%, 8/01/58, 144A | | | |
| 405 | CMFA Special Finance Agency, California, Essential Housing Revenue Bonds, Latitude 33, | 12/31 at 100.00 | N/R | 287,797 |
| | Senior Series 2021A-1, 3.000%, 12/01/56, 144A | | | |
| 125 | CSCDA Community Improvement Authority, California, Essential Housing Revenue Bonds, 777 | 5/32 at 100.00 | N/R | 104,880 |
| | Place-Pomona, Senior Lien Series 2021A-1, 3.600%, 5/01/47, 144A | | | |
| 1,130 | CSCDA Community Improvement Authority, California, Essential Housing Revenue Bonds, 777 | 5/32 at 100.00 | N/R | 841,669 |
| | Place-Pomona, Senior Lien Series 2021A-2, 3.250%, 5/01/57, 144A | | | |
| 175 | CSCDA Community Improvement Authority, California, Essential Housing Revenue Bonds, | 10/31 at 100.00 | N/R | 134,015 |
| | Acacia on Santa Rosa Creek, Mezzanine Lien Series 2021B, 4.000%, 10/01/46, 144A | | | |
| 1,465 | CSCDA Community Improvement Authority, California, Essential Housing Revenue Bonds, | 10/31 at 100.00 | N/R | 1,307,498 |
| | Acacia on Santa Rosa Creek, Senior Lien Series 2021A, 4.000%, 10/01/56, 144A | | | |
| 2,005 | CSCDA Community Improvement Authority, California, Essential Housing Revenue Bonds, | 10/31 at 100.00 | N/R | 1,612,020 |
| | Altana Glendale, Series 2021A-2, 4.000%, 10/01/56, 144A | | | |
| 2,310 | CSCDA Community Improvement Authority, California, Essential Housing Revenue Bonds, | 1/31 at 100.00 | N/R | 2,167,635 |
| | Center City Anaheim, Series 2020A, 5.000%, 1/01/54, 144A | | | |
46
| | | | | |
| Principal | | Optional Call | | |
| Amount (000) | Description (1) | Provisions (2) | Ratings (3) | Value |
| | Housing/Multifamily (continued) | | | |
| | CSCDA Community Improvement Authority, California, Essential Housing Revenue Bonds, | | | |
| | Millennium South Bay-Hawthorne, Series 2021A-1 and A-2: | | | |
| $ 610 | 3.375%, 7/01/43, 144A | 7/32 at 100.00 | N/R | $ 509,795 |
| 800 | 3.250%, 7/01/56, 144A | 7/32 at 100.00 | N/R | 581,904 |
| 1,925 | CSCDA Community Improvement Authority, California, Essential Housing Revenue Bonds, Moda | 10/31 at 100.00 | N/R | 1,555,323 |
| | at Monrovia Station, Social Series 2021A-2, 4.000%, 10/01/56, 144A | | | |
| | CSCDA Community Improvement Authority, California, Essential Housing Revenue Bonds, | | | |
| | Monterrey Station Apartments, Senior Lien Series 2021A-1: | | | |
| 220 | 3.000%, 7/01/43, 144A | 7/32 at 100.00 | N/R | 171,642 |
| 950 | 3.125%, 7/01/56, 144A | 7/32 at 100.00 | N/R | 671,517 |
| 1,345 | CSCDA Community Improvement Authority, California, Essential Housing Revenue Bonds, | 3/32 at 100.00 | N/R | 974,600 |
| | Orange City Portfolio, Senior Lien Series 2021A-2, 3.000%, 3/01/57, 144A | | | |
| 880 | CSCDA Community Improvement Authority, California, Essential Housing Revenue Bonds, | 8/31 at 100.00 | N/R | 722,269 |
| | Parallel-Anaheim Series 2021A, 4.000%, 8/01/56, 144A | | | |
| 750 | CSCDA Community Improvement Authority, California, Essential Housing Revenue Bonds, | 12/31 at 100.00 | N/R | 588,795 |
| | Pasadena Portfolio Social Bond, Mezzanine Senior Series 2021B, 4.000%, 12/01/56, 144A | | | |
| 555 | CSCDA Community Improvement Authority, California, Essential Housing Revenue Bonds, | 12/31 at 100.00 | N/R | 401,898 |
| | Pasadena Portfolio Social Bond, Series 2021A-2, 3.000%, 12/01/56 | | | |
| 795 | CSCDA Community Improvement Authority, California, Essential Housing Revenue Bonds, | 7/31 at 100.00 | N/R | 615,719 |
| | Union South Bay, Series 2021A-2, 4.000%, 7/01/56, 144A | | | |
| 560 | CSCDA Community Improvement Authority, California, Essential Housing Revenue Bonds, | 6/31 at 100.00 | N/R | 426,328 |
| | Westgate Phase 1-Pasadena Apartments, Senior Lien Series 2021A-1, 3.000%, 6/01/47, 144A | | | |
| 2,035 | CSCDA Community Improvement Authority, California, Essential Housing Revenue Bonds, | 6/31 at 100.00 | N/R | 1,432,213 |
| | Westgate Phase 1-Pasadena Apartments, Senior Lien Series 2021A-2, 3.125%, 6/01/57, 144A | | | |
| 2,080 | CSCDA Community Improvement Authority, California, Essential Housing Revenue Bonds, Wood | 6/32 at 100.00 | N/R | 1,457,290 |
| | Creek Apartments, Senior Lien Series 2021A-1, 3.000%, 12/01/49 | | | |
| 36,658 | Total Housing/Multifamily | | | 30,160,339 |
| | Long-Term Care – 0.3% (0.2% of Total Investments) | | | |
| 780 | California Health Facilities Financing Authority, Insured Revenue Bonds, Community | 10/22 at 100.00 | AA | 782,465 |
| | Program for Persons with Developmental Disabilities, Series 2011A, 6.250%, 2/01/26 | | | |
| | Tax Obligation/General – 25.3% (25.7% of Total Investments) | | | |
| 4,000 | Anaheim Union High School District, Orange County, California, General Obligation Bonds, | 8/27 at 100.00 | N/R | 3,361,520 |
| | 2014 Election Series 2019, 3.000%, 8/01/40 – BAM Insured | | | |
| 1,000 | California State, General Obligation Bonds, Refunding Various Purpose Series 2013, | 2/23 at 100.00 | Aa2 | 1,011,500 |
| | 5.000%, 2/01/29 | | | |
| 3,000 | California State, General Obligation Bonds, Various Purpose Refunding Series 2015, | 8/25 at 100.00 | Aa2 | 3,193,440 |
| | 5.000%, 8/01/34 | | | |
| | California State, General Obligation Bonds, Various Purpose Series 2013: | | | |
| 2,500 | 5.000%, 4/01/37 | 4/23 at 100.00 | Aa2 | 2,535,200 |
| 2,500 | 5.000%, 2/01/43 | 2/23 at 100.00 | Aa2 | 2,524,600 |
| 2,240 | 5.000%, 11/01/43 | 11/23 at 100.00 | Aa2 | 2,301,465 |
| | California State, General Obligation Bonds, Various Purpose Series 2014: | | | |
| 5,000 | 5.000%, 5/01/32 | 5/24 at 100.00 | Aa2 | 5,203,000 |
| 1,970 | 5.000%, 10/01/39 | 10/24 at 100.00 | Aa2 | 2,062,354 |
| 2,000 | California State, General Obligation Bonds, Various Purpose Series 2018, | 4/26 at 100.00 | Aa2 | 2,117,160 |
| | 5.000%, 10/01/47 | | | |
| 2,100 | Carlsbad Unified School District, San Diego County, California, General Obligation | 5/24 at 100.00 | Aa1 | 2,221,758 |
| | Bonds, Series 2009B, 6.000%, 5/01/34 | | | |
| 3,000 | Chaffey Community College District, San Bernardino County, California, General | 6/28 at 100.00 | N/R | 2,920,230 |
| | Obligation Bonds, Taxable Refunding Series 2019, 4.000%, 6/01/43 | | | |
47
| NCA | Nuveen California Municipal Value Fund |
| | Portfolio of Investments (continued) |
| | August 31, 2022 (Unaudited) |
| Principal | | Optional Call | | |
| Amount (000) | Description (1) | Provisions (2) | Ratings (3) | Value |
| | Tax Obligation/General (continued) | | | |
| | Los Angeles Unified School District, Los Angeles County, California, General Obligation | | | |
| | Bonds, Election 2008 Series 2018B-1: | | | |
| $ 1,000 | 5.000%, 7/01/37 | 1/28 at 100.00 | AA+ | $ 1,098,910 |
| 4,000 | 5.000%, 7/01/38 | 1/28 at 100.00 | AA+ | 4,386,760 |
| 1,000 | 5.250%, 7/01/42 | 1/28 at 100.00 | AA+ | 1,101,620 |
| 2,000 | Marin Healthcare District, Marin County, California, General Obligation Bonds, 2013 | 8/25 at 100.00 | N/R | 1,972,940 |
| | Election, Series 2015A, 4.000%, 8/01/40 | | | |
| 1,000 | Oxnard Union High School District, Ventura County, California, General Obligation Bonds, | 8/28 at 100.00 | Aa2 | 1,081,200 |
| | Election 2018 Series 2020B, 5.000%, 8/01/45 | | | |
| 2,000 | Pittsburg Unified School District Financing Authority, Contra Costa County, California, | 9/28 at 100.00 | AA | 2,155,120 |
| | General Obligation Bonds, Pittsburg Unified School District Bond Program, Series 2019, | | | |
| | 5.000%, 9/01/47 – AGM Insured | | | |
| | Puerto Rico, General Obligation Bonds, Restructured Series 2022A-1: | | | |
| 245 | 4.000%, 7/01/37 | 7/31 at 103.00 | N/R | 219,542 |
| 519 | 4.000%, 7/01/41 | 7/31 at 103.00 | N/R | 453,248 |
| 2,000 | 4.000%, 7/01/46 | 7/31 at 103.00 | N/R | 1,698,420 |
| 840 | San Benito High School District, San Benito and Santa Clara Counties, California, | 8/27 at 100.00 | Aa3 | 908,141 |
| | General Obligation Bonds, 2016 Election Series 2017, 5.250%, 8/01/46 | | | |
| 9,000 | San Marcos Unified School District, San Diego County, California, General Obligation | No Opt. Call | AA– | 2,427,930 |
| | Bonds, 2010 Election, Series 2012B, 0.000%, 8/01/51 | | | |
| 5,000 | San Mateo County Community College District, California, General Obligation Bonds, | 9/28 at 100.00 | AAA | 5,439,550 |
| | Election 2014 Series 2018B, 5.000%, 9/01/45 | | | |
| 11,875 | San Mateo Union High School District, San Mateo County, California, General Obligation | 9/36 at 100.00 | Aaa | 11,061,206 |
| | Bonds, Election 2010 Series 2011A, 0.000%, 9/01/41 (4) | | | |
| 19,860 | Yosemite Community College District, California, General Obligation Bonds, Capital | No Opt. Call | Aa2 | 15,267,971 |
| | Appreciation, Election 2004, Series 2010D, 0.000%, 8/01/42 (4) | | | |
| 89,649 | Total Tax Obligation/General | | | 78,724,785 |
| | Tax Obligation/Limited – 9.3% (9.4% of Total Investments) | | | |
| | Bell Community Redevelopment Agency, California, Tax Allocation Bonds, Bell Project | | | |
| | Area, Series 2003: | | | |
| 665 | 5.500%, 10/01/23 – RAAI Insured | 10/22 at 100.00 | AA | 667,008 |
| 1,000 | 5.625%, 10/01/33 – RAAI Insured | 10/22 at 100.00 | AA | 1,003,330 |
| 1,000 | California Infrastructure and Economic Development Bank, Lease Revenue Bonds, California | 8/29 at 100.00 | N/R | 1,102,770 |
| | State Teachers? Retirement System Headquarters Expansion, Green Bond-Climate Bond Certified | | | |
| | Series 2019, 5.000%, 8/01/35 | | | |
| 1,500 | California State Public Works Board, Lease Revenue Bonds, Department of Corrections & | 9/23 at 100.00 | Aa3 | 1,538,565 |
| | Rehabilitation, Various Correctional Facilities Series 2013F, 5.250%, 9/01/33 | | | |
| 1,250 | California State Public Works Board, Lease Revenue Bonds, Department of Corrections & | 9/24 at 100.00 | Aa3 | 1,303,875 |
| | Rehabilitation, Various Correctional Facilities Series 2014A, 5.000%, 9/01/39 | | | |
| 4,000 | Los Angeles County Metropolitan Transportation Authority, California, Measure R Sales | 6/26 at 100.00 | AAA | 4,319,440 |
| | Tax Revenue Bonds, Senior Series 2016A, 5.000%, 6/01/38 | | | |
| 2,300 | Los Angeles County Metropolitan Transportation Authority, California, Proposition C | 7/27 at 100.00 | AAA | 2,513,348 |
| | Sales Tax Revenue Bonds, Senior Lien Series 2017A, 5.000%, 7/01/39 | | | |
| 1,000 | Los Angeles County Public Works Financing Authority, California, Lease Revenue Bonds, | 12/29 at 100.00 | AA+ | 1,097,740 |
| | Series 2019E-1, 5.000%, 12/01/49 | | | |
| | Patterson Public Finance Authority, California, Revenue Bonds, Community Facilities | | | |
| | District 2001-1, Senior Series 2013A: | | | |
| 1,140 | 5.250%, 9/01/30 | 9/23 at 100.00 | N/R | 1,161,523 |
| 1,040 | 5.750%, 9/01/39 | 9/23 at 100.00 | N/R | 1,059,698 |
| 165 | Patterson Public Finance Authority, California, Revenue Bonds, Community Facilities | 9/23 at 100.00 | N/R | 168,325 |
| | District 2001-1, Subordinate Lien Series 2013B, 5.875%, 9/01/39 | | | |
| 4,708 | Puerto Rico Sales Tax Financing Corporation, Sales Tax Revenue Bonds, Restructured | 7/28 at 100.00 | N/R | 4,567,231 |
| | 2018A-1, 5.000%, 7/01/58 | | | |
48
| Principal | | Optional Call | | |
| Amount (000) | Description (1) | Provisions (2) | Ratings (3) | Value |
| | Tax Obligation/Limited (continued) | | | |
| $ 625 | River Islands Public Financing Authority, California, Special Tax Bonds, Community | 9/29 at 103.00 | N/R | $ 682,725 |
| | Facilities District 2003-1 Improvement Area 1, Refunding Series 2022A-1, 5.250%, 9/01/52 - | | | |
| | AGM Insured | | | |
| 70 | San Clemente, California, Special Tax Revenue Bonds, Community Facilities District | 9/25 at 100.00 | N/R | 72,076 |
| | 2006-1 Marblehead Coastal, Series 2015, 5.000%, 9/01/40 | | | |
| 150 | San Francisco City and County Redevelopment Agency Successor Agency, California, Special | 8/24 at 100.00 | N/R | 152,993 |
| | Tax Bonds, Community Facilities District 7, Hunters Point Shipyard Phase One Improvements, | | | |
| | Refunding Series 2014, 5.000%, 8/01/39 | | | |
| 5,000 | San Francisco City and County Redevelopment Agency Successor Agency, California, Tax | 8/26 at 100.00 | A | 5,215,300 |
| | Allocation Bonds, Mission Bay North Redevelopment Project, Refunding Series 2016A, 5.000%, | | | |
| | 8/01/41 – NPFG Insured | | | |
| 110 | Signal Hill Redevelopment Agency, California, Project 1 Tax Allocation Bonds, Series | 10/22 at 100.00 | N/R | 110,344 |
| | 2011, 7.000%, 10/01/26 | | | |
| | Stockton Public Financing Authority, California, Revenue Bonds, Arch Road East Community | | | |
| | Facility District 99-02, Series 2018A: | | | |
| 1,000 | 5.000%, 9/01/33 | 9/25 at 103.00 | N/R | 1,067,200 |
| 765 | 5.000%, 9/01/43 | 9/25 at 103.00 | N/R | 802,623 |
| 195 | Temecula Public Financing Authority, California, Special Tax Bonds, Community Facilities | 9/27 at 100.00 | N/R | 208,802 |
| | District 16-01, Series 2017, 5.750%, 9/01/32, 144A | | | |
| 185 | Transbay Joint Powers Authority, California, Tax Allocation Bonds, Senior Green Series | 4/30 at 100.00 | A– | 194,729 |
| | 2020A, 5.000%, 10/01/49 | | | |
| 27,868 | Total Tax Obligation/Limited | | | 29,009,645 |
| | Transportation – 18.2% (18.5% of Total Investments) | | | |
| 225 | California Municipal Finance Authority, Special Facility Revenue Bonds, United Airlines, | No Opt. Call | B+ | 222,986 |
| | Inc. Los Angeles International Airport Project, Series 2019, 4.000%, 7/15/29, (AMT) | | | |
| | Foothill/Eastern Transportation Corridor Agency, California, Toll Road Revenue Bonds, | | | |
| | Refunding Series 2013A: | | | |
| 1,945 | 5.000%, 1/15/42 – AGM Insured | 1/24 at 100.00 | AA | 2,000,899 |
| 2,580 | Long Beach, California, Harbor Revenue Bonds, Series 2019A, 5.000%, 5/15/49 | 5/29 at 100.00 | Aa2 | 2,810,471 |
| 1,480 | Los Angeles Department of Airports, California, Revenue Bonds, Los Angeles International | 5/29 at 100.00 | Aa3 | 1,535,959 |
| | Airport, Private Activity/AMT Subordinate Series 2019A, 5.000%, 5/15/49, (AMT) | | | |
| | Los Angeles Department of Airports, California, Revenue Bonds, Los Angeles International | | | |
| | Airport, Subordinate Lien Series 2018A: | | | |
| 5,665 | 5.000%, 5/15/44, (AMT) | 5/28 at 100.00 | Aa3 | 5,873,075 |
| 3,130 | 5.250%, 5/15/48, (AMT) | 5/28 at 100.00 | Aa3 | 3,276,672 |
| | Los Angeles Department of Airports, California, Revenue Bonds, Los Angeles International | | | |
| | Airport, Subordinate Lien Series 2019D: | | | |
| 2,670 | 5.000%, 5/15/33, (AMT) | 11/28 at 100.00 | Aa3 | 2,854,497 |
| 1,000 | 5.000%, 5/15/38, (AMT) | 11/28 at 100.00 | N/R | 1,055,420 |
| 3,000 | Los Angeles Harbors Department, California, Revenue Bonds, Series 2014C, 5.000%, 8/01/44 | 8/24 at 100.00 | AA | 3,115,470 |
| 3,075 | San Diego County Regional Airport Authority, California, Airport Revenue Bonds, | 7/31 at 100.00 | N/R | 2,897,573 |
| | Subordinate Series 2021A, 4.000%, 7/01/51 | | | |
| 5,000 | San Diego County Regional Airport Authority, California, Airport Revenue Bonds, | 7/31 at 100.00 | N/R | 4,565,800 |
| | Subordinate Series 2021B, 4.000%, 7/01/51, (AMT) | | | |
| 15,570 | San Francisco Airports Commission, California, Revenue Bonds, San Francisco | 5/27 at 100.00 | A1 | 16,564,300 |
| | International Airport, Governmental Purpose Second Series 2017B, 5.000%, 5/01/47 | | | |
| 4,160 | San Francisco Airports Commission, California, Revenue Bonds, San Francisco | 5/29 at 100.00 | A1 | 4,311,632 |
| | International Airport, Second Series 2019A, 5.000%, 5/01/49, (AMT) | | | |
| 4,465 | San Francisco Airports Commission, California, Revenue Bonds, San Francisco | 5/29 at 100.00 | N/R | 4,741,562 |
| | International Airport, Second Series 2019F, 5.000%, 5/01/50 | | | |
| 665 | San Joaquin Hills Transportation Corridor Agency, Orange County, California, Refunding | 1/32 at 100.00 | N/R | 607,717 |
| | Senior Lien Toll Road Revenue Bonds, Series 2021A, 4.000%, 1/15/50 | | | |
49
| NCA | Nuveen California Municipal Value Fund |
| | Portfolio of Investments (continued) |
| | August 31, 2022 (Unaudited) |
| Principal | | Optional Call | | |
| Amount (000) | Description (1) | Provisions (2) | Ratings (3) | Value |
| | Transportation (continued) | | | |
| $ 250 | San Joaquin Hills Transportation Corridor Agency, Orange County, California, Toll Road | 1/25 at 100.00 | BBB+ | $ 256,153 |
| | Revenue Bonds, Refunding Junior Lien Series 2014B, 5.250%, 1/15/44 | | | |
| 54,880 | Total Transportation | | | 56,690,186 |
| | U.S. Guaranteed – 6.1% (6.1% of Total Investments) (5) | | | |
| 1,500 | Bay Area Toll Authority, California, Revenue Bonds, San Francisco Bay Area Toll Bridge, | 4/29 at 100.00 | AA– | 1,735,125 |
| | Subordinate Series 2019S-H, 5.000%, 4/01/44, (Pre-refunded 4/01/29) | | | |
| 285 | California Health Facilities Financing Authority, California, Revenue Bonds, Sutter | 8/25 at 100.00 | A1 | 306,030 |
| | Health, Refunding Series 2015A, 5.000%, 8/15/43, (Pre-refunded 8/15/25) | | | |
| 795 | California Health Facilities Financing Authority, California, Revenue Bonds, Sutter | 11/26 at 100.00 | N/R | 879,906 |
| | Health, Refunding Series 2016B, 5.000%, 11/15/46, (Pre-refunded 11/15/26) | | | |
| 185 | California Health Facilities Financing Authority, Revenue Bonds, Providence Health & | | | |
| | Services, Refunding Series 2014A, 5.000%, 10/01/38, (Pre-refunded 10/01/24) | 10/24 at 100.00 | N/R | 195,134 |
| 3,000 | California State Public Works Board, Lease Revenue Bonds, Various Capital Projects, | 11/22 at 100.00 | Aa3 | 3,013,890 |
| | Series 2012G, 5.000%, 11/01/37, (Pre-refunded 11/01/22) | | | |
| 2,215 | Foothill/Eastern Transportation Corridor Agency, California, Toll Road Revenue Bonds, | 1/24 at 100.00 | BBB+ | 2,323,159 |
| | Refunding Junior Lien Series 2013C, 6.500%, 1/15/43, (Pre-refunded 1/15/24) | | | |
| | Foothill/Eastern Transportation Corridor Agency, California, Toll Road Revenue Bonds, | | | |
| | Refunding Series 2013A: | | | |
| 4,875 | 5.750%, 1/15/46, (Pre-refunded 1/15/24) | 1/24 at 100.00 | A– | 5,099,884 |
| 4,875 | 6.000%, 1/15/53, (Pre-refunded 1/15/24) | 1/24 at 100.00 | A– | 5,114,216 |
| | Golden State Tobacco Securitization Corporation, California, Enhanced Tobacco Settlement | | | |
| | Asset-Backed Revenue Bonds, Refunding Series 2015A: | | | |
| 100 | 5.000%, 6/01/40, (Pre-refunded 6/01/25) | 6/25 at 100.00 | N/R | 107,022 |
| 80 | 5.000%, 6/01/40, (Pre-refunded 6/01/25) | 6/25 at 100.00 | AA– | 85,507 |
| 17,910 | Total U.S. Guaranteed | | | 18,859,873 |
| | Utilities – 19.2% (19.5% of Total Investments) | | | |
| 1,000 | California Infrastructure and Economic Development Bank. Clean Water State Revolving | 4/28 at 100.00 | AAA | 1,098,400 |
| | Fund Revenue Bonds, Green Series 2018, 5.000%, 10/01/43 | | | |
| | California Pollution Control Financing Authority, Water Furnishing Revenue Bonds, | | | |
| | Poseidon Resources Channelside LP Desalination Project, Series 2012: | | | |
| 1,375 | 5.000%, 7/01/37, (AMT), 144A | 1/23 at 100.00 | BBB | 1,378,245 |
| 3,750 | 5.000%, 11/21/45, (AMT), 144A | 1/23 at 100.00 | BBB | 3,755,250 |
| 1,500 | California Pollution Control Financing Authority, Water Furnishing Revenue Bonds, San | 1/29 at 100.00 | BBB | 1,483,620 |
| | Diego County Water Authority Desalination Project Pipeline, Refunding Series 2019, | | | |
| | 5.000%, 11/21/45, 144A | | | |
| 4,240 | East Bay Municipal Utility District, Alameda and Contra Costa Counties, California, | 6/27 at 100.00 | AAA | 4,604,810 |
| | Water System Revenue Bonds, Green Series 2017A, 5.000%, 6/01/45 | | | |
| 2,000 | Irvine Ranch Water District, California, Certificates of Participation, Irvine Ranch | 9/26 at 100.00 | AAA | 2,153,160 |
| | Water District Series 2016, 5.000%, 3/01/41 | | | |
| 1,800 | Long Beach Bond Finance Authority, California, Natural Gas Purchase Revenue Bonds, | No Opt. Call | AA– | 2,007,342 |
| | Series 2007A, 5.500%, 11/15/37 | | | |
| 1,000 | Los Angeles Department of Water and Power, California, Power System Revenue Bonds, | 1/26 at 100.00 | Aa2 | 1,061,240 |
| | Series 2016A, 5.000%, 7/01/40 | | | |
| 835 | Los Angeles Department of Water and Power, California, Power System Revenue Bonds, | 1/26 at 100.00 | Aa2 | 889,191 |
| | Series 2016B, 5.000%, 7/01/37 | | | |
| 4,850 | Los Angeles Department of Water and Power, California, Power System Revenue Bonds, | 1/27 at 100.00 | Aa2 | 5,193,622 |
| | Series 2017A, 5.000%, 7/01/42 | | | |
| 2,630 | Los Angeles Department of Water and Power, California, Power System Revenue Bonds, | 7/27 at 100.00 | Aa2 | 2,836,245 |
| | Series 2017C, 5.000%, 7/01/42 | | | |
| 1,890 | Los Angeles Department of Water and Power, California, Power System Revenue Bonds, | 1/28 at 100.00 | Aa2 | 2,067,868 |
| | Series 2018A, 5.000%, 7/01/38 | | | |
50
| Principal | | Optional Call | | |
| Amount (000) | Description (1) | Provisions (2) | Ratings (3) | Value |
| | Utilities (continued) | | | |
| $ 6,000 | Los Angeles Department of Water and Power, California, Waterworks Revenue Bonds, Series | 1/27 at 100.00 | AA+ | $ 6,444,660 |
| | 2017A, 5.000%, 7/01/41 | | | |
| 4,475 | Los Angeles Department of Water and Power, California, Waterworks Revenue Bonds, Series | 1/28 at 100.00 | AA+ | 4,834,119 |
| | 2018A, 5.000%, 7/01/48 | | | |
| 4,000 | Los Angeles Department of Water and Power, California, Waterworks Revenue Bonds, Series | 7/28 at 100.00 | AA+ | 4,417,720 |
| | 2018B, 5.000%, 7/01/38 | | | |
| 375 | Los Angeles, California, Wastewater System Revenue Bonds, Green Subordinate Lien Series | 6/27 at 100.00 | AA | 409,061 |
| | 2017A, 5.250%, 6/01/47 | | | |
| 1,400 | Los Angeles, California, Wastewater System Revenue Bonds, Green Subordinate Series | 6/28 at 100.00 | AA | 1,533,448 |
| | 2018A, 5.000%, 6/01/38 | | | |
| 2,355 | Mesa Water District, California, Certificates of Participation, Series 2020, | 3/30 at 100.00 | AAA | 2,351,915 |
| | 4.000%, 3/15/45 | | | |
| 1,000 | M-S-R Energy Authority, California, Gas Revenue Bonds, Citigroup Prepay Contracts, | No Opt. Call | A | 1,208,260 |
| | Series 2009C, 6.500%, 11/01/39 | | | |
| 1,190 | Sacramento, California, Wastewater Revenue Bonds, Series 2019, 5.000%, 9/01/39 | 9/29 at 100.00 | AA | 1,322,875 |
| | San Diego Public Facilities Financing Authority, California, Water Utility Revenue | | | |
| | Bonds, Refunding Subordinate Lien Series 2016B: | | | |
| 2,670 | 5.000%, 8/01/32 | 8/26 at 100.00 | Aa3 | 2,915,186 |
| 3,000 | 5.000%, 8/01/37 | 8/26 at 100.00 | Aa3 | 3,245,430 |
| 2,400 | Southern California Public Power Authority, Natural Gas Project 1 Revenue Bonds, Series | No Opt. Call | A2 | 2,494,896 |
| | 2007A, 5.250%, 11/01/24 | | | |
| 55,735 | Total Utilities | | | 59,706,563 |
| $ 319,940 | Total Long-Term Investments (cost $304,542,622) | | | 306,790,692 |
| | Other Assets Less Liabilities – 1.3% | | | 3,998,195 |
| | Net Asset Applicable to Common Shares – 100% | | | $ 310,788,887 |
| (1) | All percentages shown in the Portfolio of Investments are based on net assets applicable to common shares unless otherwise noted. |
(2)
| Optional Call Provisions: Dates (month and year) and prices of the earliest optional call or redemption. There may be other call provisions at varying prices at later dates. Certain mortgage-backed securities may be subject to periodic principal paydowns. |
(3)
| For financial reporting purposes, the ratings disclosed are the highest of Standard & Poor’s Group (“Standard & Poor’s”), Moody’s Investors Service, Inc. (“Moody’s”) or Fitch, Inc. (“Fitch”) rating. This treatment of split-rated securities may differ from that used for other purposes, such as for Fund investment policies. Ratings below BBB by Standard & Poor’s, Baa by Moody’s or BBB by Fitch are considered to be below investment grade. Holdings designated N/R are not rated by any of these national rating agencies. |
(4)
| Step-up coupon bond, a bond with a coupon that increases ("steps up"), usually at regular intervals, while the bond is outstanding. The rate shown is the coupon as of the end of the reporting period. |
| (5) | Backed by an escrow or trust containing sufficient U.S. Government or U.S. Government agency securities, which ensure the timely payment of principal and interest. |
144A
| Investment is exempt from registration under Rule 144A of the Securities Act of 1933, as amended. These investments may only be resold in transactions exempt from registration, which are normally those transactions with qualified institutional buyers. |
| AMT | Alternative Minimum Tax |
| | See accompanying notes to financial statements. |
51
| NXC | Nuveen California Select Tax-Free |
| | Income Portfolio |
| | Portfolio of Investments |
| | August 31, 2022 (Unaudited) |
| Principal | | Optional Call | | |
| Amount (000) | Description (1) | Provisions (2) | Ratings (3) | Value |
| | LONG-TERM INVESTMENTS – 98.0% (100.0% of Total Investments) | | | |
| | MUNICIPAL BONDS – 98.0% (100.0% of Total Investments) | | | |
| | Consumer Staples – 0.0% (0.0% of Total Investments) | | | |
| $ 20 | California County Tobacco Securitization Agency, Tobacco Settlement Asset-Backed Bonds, | 6/30 at 100.00 | BBB+ | $ 18,808 |
| | Los Angeles County Securitization Corporation, Series 2020A, 4.000%, 6/01/49 | | | |
| | Education and Civic Organizations – 1.1% (1.1% of Total Investments) | | | |
| 550 | California Municipal Finance Authority, Charter School Revenue Bonds, Partnerships to | 10/22 at 100.00 | BB | 539,324 |
| | Uplift Communities Project, Series 2012A, 5.250%, 8/01/42 | | | |
| 60 | California School Finance Authority, School Facility Revenue Bonds, Alliance for | 7/25 at 100.00 | BBB | 60,784 |
| | College-Ready Public Schools Project, Series 2016A, 5.000%, 7/01/46, 144A | | | |
| 385 | California School Finance Authority, School Facility Revenue Bonds, Alliance for | 7/25 at 101.00 | BBB | 391,668 |
| | College-Ready Public Schools Project, Series 2016C, 5.000%, 7/01/46, 144A | | | |
| 995 | Total Education and Civic Organizations | | | 991,776 |
| | Health Care – 10.0% (10.2% of Total Investments) | | | |
| 1,000 | California Health Facilities Financing Authority, California, Revenue Bonds, Sutter | 11/27 at 100.00 | A1 | 1,053,560 |
| | Health, Refunding Series 2017A, 5.000%, 11/15/48 | | | |
| 1,590 | California Health Facilities Financing Authority, California, Revenue Bonds, Sutter | 11/27 at 100.00 | A1 | 1,675,161 |
| | Health, Series 2018A, 5.000%, 11/15/48 | | | |
| 1,240 | California Health Facilities Financing Authority, Revenue Bonds, City of Hope National | 11/29 at 100.00 | A+ | 1,177,132 |
| | Medical Center, Series 2019, 4.000%, 11/15/45 | | | |
| 1,000 | California Health Facilities Financing Authority, Revenue Bonds, CommonSpirit Health, | 4/30 at 100.00 | BBB+ | 919,610 |
| | Series 2020A, 4.000%, 4/01/49 | | | |
| 1,365 | California Health Facilities Financing Authority, Revenue Bonds, Kaiser Permanente | 11/27 at 100.00 | AA– | 1,301,869 |
| | System, Series 2017A-2, 4.000%, 11/01/44 | | | |
| 115 | California Health Facilities Financing Authority, Revenue Bonds, Lucile Salter Packard | 8/24 at 100.00 | AA– | 117,838 |
| | Children’s Hospital, Series 2014A, 5.000%, 8/15/43 | | | |
| 70 | California Health Facilities Financing Authority, Revenue Bonds, Providence Health & | | | |
| | Services, Refunding Series 2014A, 5.000%, 10/01/38 | 10/24 at 100.00 | AA– | 72,770 |
| 255 | California Health Facilities Financing Authority, Revenue Bonds, Providence Health & | 10/24 at 100.00 | AA– | 263,866 |
| | Services, Series 2014B, 5.000%, 10/01/44 | | | |
| 450 | California Municipal Finance Authority, Revenue Bonds, Community Health System, Series | 2/32 at 100.00 | N/R | 432,036 |
| | 2021A, 4.000%, 2/01/51 – AGM Insured | | | |
| 35 | California Municipal Finance Authority, Revenue Bonds, Eisenhower Medical Center, | 7/27 at 100.00 | Baa2 | 35,960 |
| | Refunding Series 2017A, 5.000%, 7/01/42 | | | |
| 130 | California Municipal Finance Authority, Revenue Bonds, NorthBay Healthcare Group, Series | 11/26 at 100.00 | BBB– | 133,484 |
| | 2017A, 5.250%, 11/01/41 | | | |
| 350 | California Statewide Communities Development Authority, California, Revenue Bonds, Loma | 12/24 at 100.00 | BB | 358,393 |
| | Linda University Medical Center, Series 2014A, 5.250%, 12/01/34 | | | |
| | California Statewide Communities Development Authority, California, Revenue Bonds, Loma | | | |
| | Linda University Medical Center, Series 2016A: | | | |
| 825 | 5.000%, 12/01/46, 144A | 6/26 at 100.00 | BB | 804,466 |
| 540 | 5.250%, 12/01/56, 144A | 6/26 at 100.00 | BB | 540,621 |
| 8,965 | Total Health Care | | | 8,886,766 |
| | Housing/Multifamily – 9.4% (9.6% of Total Investments) | | | |
| 615 | California Community Housing Agency, California, Essential Housing Revenue Bonds, | 8/31 at 100.00 | N/R | 492,080 |
| | Creekwood, Series 2021A, 4.000%, 2/01/56, 144A | | | |
| 590 | California Community Housing Agency, California, Essential Housing Revenue Bonds, | 8/31 at 100.00 | N/R | 455,439 |
| | Glendale Properties, Junior Series 2021A-2, 4.000%, 8/01/47, 144A | | | |
52
| Principal | | Optional Call | | |
| Amount (000) | Description (1) | Provisions (2) | Ratings (3) | Value |
| | Housing/Multifamily (continued) | | | |
| $ 800 | California Community Housing Agency, California, Essential Housing Revenue Bonds, | 2/30 at 100.00 | N/R | $ 754,448 |
| | Serenity at Larkspur Apartments, Series 2020A, 5.000%, 2/01/50, 144A | | | |
| 200 | California Community Housing Agency, California, Essential Housing Revenue Bonds, | 2/31 at 100.00 | N/R | 161,092 |
| | Stoneridge Apartments, Series 2021A, 4.000%, 2/01/56, 144A | | | |
| 623 | California Housing Finance Agency, Municipal Certificate Revenue Bonds, Class A Series | No Opt. Call | BBB+ | 617,606 |
| | 2019-2, 4.000%, 3/20/33 | | | |
| 529 | California Housing Finance Agency, Municipal Certificate Revenue Bonds, Class A Series | No Opt. Call | BBB+ | 492,980 |
| | 2021-1, 3.500%, 11/20/35 | | | |
| 91 | California Housing Finance Agency, Municipal Certificate Revenue Bonds, Class A | No Opt. Call | BBB+ | 91,081 |
| | Series2019-1, 4.250%, 1/15/35 | | | |
| | California Municipal Finance Authority, Mobile Home Park Revenue Bonds, Caritas | | | |
| | Affordable Housing Inc Projects, Senior Series 2014A: | | | |
| 25 | 5.250%, 8/15/39 | 8/24 at 100.00 | A– | 25,550 |
| 65 | 5.250%, 8/15/49 | 8/24 at 100.00 | A– | 66,115 |
| 660 | CMFA Special Finance Agency I, California, Essential Housing Revenue Bonds, The Mix at | 4/31 at 100.00 | N/R | 538,415 |
| | Center City, Series 2021A-2, 4.000%, 4/01/56, 144A | | | |
| 225 | CMFA Special Finance Agency, California, Essential Housing Revenue Bonds, Enclave | 2/32 at 100.00 | N/R | 188,937 |
| | Apartments, Senior Series 2022A-1, 4.000%, 8/01/58, 144A | | | |
| 115 | CMFA Special Finance Agency, California, Essential Housing Revenue Bonds, Latitude 33, | 12/31 at 100.00 | N/R | 81,720 |
| | Senior Series 2021A-1, 3.000%, 12/01/56, 144A | | | |
| 320 | CSCDA Community Improvement Authority, California, Essential Housing Revenue Bonds, 777 | 5/32 at 100.00 | N/R | 238,349 |
| | Place-Pomona, Senior Lien Series 2021A-2, 3.250%, 5/01/57, 144A | | | |
| 425 | CSCDA Community Improvement Authority, California, Essential Housing Revenue Bonds, | 10/31 at 100.00 | N/R | 379,308 |
| | Acacia on Santa Rosa Creek, Senior Lien Series 2021A, 4.000%, 10/01/56, 144A | | | |
| 560 | CSCDA Community Improvement Authority, California, Essential Housing Revenue Bonds, | 10/31 at 100.00 | N/R | 450,240 |
| | Altana Glendale, Series 2021A-2, 4.000%, 10/01/56, 144A | | | |
| 650 | CSCDA Community Improvement Authority, California, Essential Housing Revenue Bonds, | 1/31 at 100.00 | N/R | 609,941 |
| | Center City Anaheim, Series 2020A, 5.000%, 1/01/54, 144A | | | |
| | CSCDA Community Improvement Authority, California, Essential Housing Revenue Bonds, | | | |
| | Millennium South Bay-Hawthorne, Series 2021A-1 and A-2: | | | |
| 175 | 3.375%, 7/01/43, 144A | 7/32 at 100.00 | N/R | 146,253 |
| 195 | 3.250%, 7/01/56, 144A | 7/32 at 100.00 | N/R | 141,839 |
| 540 | CSCDA Community Improvement Authority, California, Essential Housing Revenue Bonds, Moda | 10/31 at 100.00 | N/R | 436,298 |
| | at Monrovia Station, Social Series 2021A-2, 4.000%, 10/01/56, 144A | | | |
| 265 | CSCDA Community Improvement Authority, California, Essential Housing Revenue Bonds, | 7/32 at 100.00 | N/R | 187,318 |
| | Monterrey Station Apartments, Senior Lien Series 2021A-1, 3.125%, 7/01/56, 144A | | | |
| 380 | CSCDA Community Improvement Authority, California, Essential Housing Revenue Bonds, | 3/32 at 100.00 | N/R | 275,352 |
| | Orange City Portfolio, Senior Lien Series 2021A-2, 3.000%, 3/01/57, 144A | | | |
| 250 | CSCDA Community Improvement Authority, California, Essential Housing Revenue Bonds, | 8/31 at 100.00 | N/R | 205,190 |
| | Parallel-Anaheim Series 2021A, 4.000%, 8/01/56, 144A | | | |
| 150 | CSCDA Community Improvement Authority, California, Essential Housing Revenue Bonds, | 12/31 at 100.00 | N/R | 117,759 |
| | Pasadena Portfolio Social Bond, Mezzanine Senior Series 2021B, 4.000%, 12/01/56, 144A | | | |
| 100 | CSCDA Community Improvement Authority, California, Essential Housing Revenue Bonds, | 12/31 at 100.00 | N/R | 72,414 |
| | Pasadena Portfolio Social Bond, Series 2021A-2, 3.000%, 12/01/56 | | | |
| 185 | CSCDA Community Improvement Authority, California, Essential Housing Revenue Bonds, | 7/31 at 100.00 | N/R | 143,281 |
| | Union South Bay, Series 2021A-2, 4.000%, 7/01/56, 144A | | | |
| 160 | CSCDA Community Improvement Authority, California, Essential Housing Revenue Bonds, | 6/31 at 100.00 | N/R | 121,808 |
| | Westgate Phase 1-Pasadena Apartments, Senior Lien Series 2021A-1, 3.000%, 6/01/47, 144A | | | |
| 585 | CSCDA Community Improvement Authority, California, Essential Housing Revenue Bonds, | 6/31 at 100.00 | N/R | 411,717 |
| | Westgate Phase 1-Pasadena Apartments, Senior Lien Series 2021A-2, 3.125%, 6/01/57, 144A | | | |
53
| NXC | Nuveen California Select Tax-Free Income Portfolio |
| | Portfolio of Investments (continued) |
| | August 31, 2022 (Unaudited) |
| Principal | | Optional Call | | |
| Amount (000) | Description (1) | Provisions (2) | Ratings (3) | Value |
| | Housing/Multifamily (continued) | | | |
| $ 600 | CSCDA Community Improvement Authority, California, Essential Housing Revenue Bonds, Wood | 6/32 at 100.00 | N/R | $ 420,372 |
| | Creek Apartments, Senior Lien Series 2021A-1, 3.000%, 12/01/49 | | | |
| 10,077 | Total Housing/Multifamily | | | 8,322,902 |
| | Tax Obligation/General – 21.5% (21.9% of Total Investments) | | | |
| 1,000 | California State, General Obligation Bonds, Various Purpose Refunding Series 2015, | 8/25 at 100.00 | Aa2 | 1,064,480 |
| | 5.000%, 8/01/34 | | | |
| 1,000 | Los Angeles Unified School District, Los Angeles County, California, General Obligation | 1/28 at 100.00 | AA+ | 1,101,620 |
| | Bonds, Election 2008 Series 2018B-1, 5.250%, 7/01/42 | | | |
| 1,000 | Marin Healthcare District, Marin County, California, General Obligation Bonds, 2013 | 8/25 at 100.00 | N/R | 954,260 |
| | Election, Series 2015A, 4.000%, 8/01/45 | | | |
| 2,790 | Natomas Unified School District, Sacramento County, California, General Obligation | 8/26 at 100.00 | N/R | 2,634,039 |
| | Bonds, Election of 2018, Series 2020A, 4.000%, 8/01/49 – AGM Insured | | | |
| 7,575 | Palomar Pomerado Health, California, General Obligation Bonds, Convertible Capital | No Opt. Call | A2 | 4,508,261 |
| | Appreciation, Election 2004 Series 2010A, 0.000%, 8/01/34 | | | |
| | Puerto Rico, General Obligation Bonds, Restructured Series 2022A-1: | | | |
| 70 | 4.000%, 7/01/37 | 7/31 at 103.00 | N/R | 62,726 |
| 65 | 4.000%, 7/01/41 | 7/31 at 103.00 | N/R | 56,765 |
| 161 | 4.000%, 7/01/46 | 7/31 at 103.00 | N/R | 136,723 |
| 1,000 | San Benito High School District, San Benito and Santa Clara Counties, California, | 8/27 at 100.00 | Aa3 | 1,081,120 |
| | General Obligation Bonds, 2016 Election Series 2017, 5.250%, 8/01/46 | | | |
| 8,075 | San Bernardino Community College District, California, General Obligation Bonds, | No Opt. Call | Aa1 | 3,126,398 |
| | Election of 2008 Series 2009B, 0.000%, 8/01/44 | | | |
| 2,050 | San Mateo County Community College District, California, General Obligation Bonds, | 9/28 at 100.00 | AAA | 2,230,216 |
| | Election 2014 Series 2018B, 5.000%, 9/01/4 | | | |
| 2,000 | West Hills Community College District, California, General Obligation Bonds, School | 8/31 at 100.00 | AA | 2,039,040 |
| | Facilities Improvement District 3, 2008 Election Series 2011, 0.000%, 8/01/38 – AGM Insured (4) | | | |
| 26,786 | Total Tax Obligation/General | | | 18,995,648 |
| | Tax Obligation/Limited – 13.4% (13.6% of Total Investments) | | | |
| 1,000 | Bell Community Redevelopment Agency, California, Tax Allocation Bonds, Bell Project | 10/22 at 100.00 | AA | 1,003,330 |
| | Area, Series 2003, 5.625%, 10/01/33 – RAAI Insured | | | |
| 2,000 | California State Public Works Board, Lease Revenue Bonds, Department of Corrections & | 9/23 at 100.00 | Aa3 | 2,051,420 |
| | Rehabilitation, Various Correctional Facilities Series 2013F, 5.250%, 9/01/33 | | | |
| 1,000 | Los Angeles County Metropolitan Transportation Authority, California, Measure R Sales | 6/26 at 100.00 | AAA | 1,079,860 |
| | Tax Revenue Bonds, Senior Series 2016A, 5.000%, 6/01/38 | | | |
| 3,000 | Los Angeles County Metropolitan Transportation Authority, California, Proposition C | 7/27 at 100.00 | AAA | 3,263,250 |
| | Sales Tax Revenue Bonds, Senior Lien Series 2017A, 5.000%, 7/01/42 | | | |
| 1,000 | Norco Redevelopment Agency, California, Tax Allocation Bonds, Project Area 1, Series | 10/22 at 100.00 | A+ | 1,003,310 |
| | 2009, 7.000%, 3/01/34 | | | |
| | Patterson Public Finance Authority, California, Revenue Bonds, Community Facilities | | | |
| | District 2001-1, Senior Series 2013A: | | | |
| 350 | 5.250%, 9/01/30 | 9/23 at 100.00 | N/R | 356,608 |
| 320 | 5.750%, 9/01/39 | 9/23 at 100.00 | N/R | 326,061 |
| 60 | Patterson Public Finance Authority, California, Revenue Bonds, Community Facilities | 9/23 at 100.00 | N/R | 61,209 |
| | District 2001-1, Subordinate Lien Series 2013B, 5.875%, 9/01/39 | | | |
| 948 | Puerto Rico Sales Tax Financing Corporation, Sales Tax Revenue Bonds, Restructured | 7/28 at 100.00 | N/R | 919,655 |
| | 2018A-1, 5.000%, 7/01/58 | | | |
| 180 | River Islands Public Financing Authority, California, Special Tax Bonds, Community | 9/29 at 103.00 | N/R | 196,625 |
| | Facilities District 2003-1 Improvement Area 1, Refunding Series 2022A-1, 5.250%, 9/01/52 - | | | |
| | AGM Insured | | | |
| 20 | San Clemente, California, Special Tax Revenue Bonds, Community Facilities District | 9/25 at 100.00 | N/R | 20,593 |
| | 2006-1 Marblehead Coastal, Series 2015, 5.000%, 9/01/40 | | | |
54
| Principal | | Optional Call | | |
| Amount (000) | Description (1) | Provisions (2) | Ratings (3) | Value |
| | Tax Obligation/Limited (continued) | | | |
| $ 60 | San Francisco City and County Redevelopment Agency Successor Agency, California, Special | 8/24 at 100.00 | N/R | $ 61,197 |
| | Tax Bonds, Community Facilities District 7, Hunters Point Shipyard Phase One Improvements, | | | |
| | Refunding Series 2014, 5.000%, 8/01/39 | | | |
| 30 | Signal Hill Redevelopment Agency, California, Project 1 Tax Allocation Bonds, Series | 10/22 at 100.00 | N/R | 30,094 |
| | 2011, 7.000%, 10/01/26 | | | |
| 1,285 | Stockton Public Financing Authority, California, Revenue Bonds, Arch Road East Community | 9/25 at 103.00 | N/R | 1,386,271 |
| | Facility District 99-02, Series 2018A, 5.000%, 9/01/28 | | | |
| 50 | Transbay Joint Powers Authority, California, Tax Allocation Bonds, Senior Green Series | 4/30 at 100.00 | A– | 52,629 |
| | 2020A, 5.000%, 10/01/49 | | | |
| 11,303 | Total Tax Obligation/Limited | | | 11,812,112 |
| | Transportation – 11.6% (11.9% of Total Investments) | | | |
| 60 | California Municipal Finance Authority, Special Facility Revenue Bonds, United Airlines, | No Opt. Call | B+ | 59,463 |
| | Inc. Los Angeles International Airport Project, Series 2019, 4.000%, 7/15/29, (AMT) | | | |
| 1,000 | Foothill/Eastern Transportation Corridor Agency, California, Toll Road Revenue Bonds, | | | |
| | Refunding Series 2013A, 5.000%, 1/15/42 – AGM Insured | 1/24 at 100.00 | AA | 1,028,740 |
| 800 | Long Beach, California, Harbor Revenue Bonds, Series 2015D, 5.000%, 5/15/42 | 5/25 at 100.00 | AA | 844,352 |
| 1,525 | Los Angeles Department of Airports, California, Revenue Bonds, Los Angeles International | 5/29 at 100.00 | Aa3 | 1,582,660 |
| | Airport, Private Activity/AMT Subordinate Series 2019A, 5.000%, 5/15/49, (AMT) | | | |
| 1,860 | Los Angeles Department of Airports, California, Revenue Bonds, Los Angeles International | 5/32 at 100.00 | N/R | 1,782,122 |
| | Airport, Refunding & Subordinate Series 2022C, 4.000%, 5/15/40, (AMT) | | | |
| 3,250 | Riverside County Transportation Commission, California, Toll Revenue Senior Lien Bonds, | 6/31 at 100.00 | N/R | 3,113,337 |
| | RCTC 91 Express Lanes, Refunding Series 2021B-1, 4.000%, 6/01/39 | | | |
| 1,000 | San Diego County Regional Airport Authority, California, Airport Revenue Bonds, | 7/31 at 100.00 | N/R | 1,038,040 |
| | Subordinate Series 2021B, 5.000%, 7/01/51, (AMT) | | | |
| 90 | San Joaquin Hills Transportation Corridor Agency, Orange County, California, Refunding | 1/32 at 100.00 | N/R | 82,247 |
| | Senior Lien Toll Road Revenue Bonds, Series 2021A, 4.000%, 1/15/50 | | | |
| 750 | San Joaquin Hills Transportation Corridor Agency, Orange County, California, Toll Road | 1/25 at 100.00 | BBB+ | 768,458 |
| | Revenue Bonds, Refunding Junior Lien Series 2014B, 5.250%, 1/15/44 | | | |
| 10,335 | Total Transportation | | | 10,299,419 |
| | U.S. Guaranteed – 11.8% (12.1% of Total Investments) (5) | | | |
| 1,000 | Bay Area Water Supply and Conservation Agency, California, Revenue Bonds, Capital Cost | 4/23 at 100.00 | AA– | 1,015,190 |
| | Recovery Prepayment Program, Series 2013A, 5.000%, 10/01/34, (Pre-refunded 4/01/23) | | | |
| 410 | California Health Facilities Financing Authority, California, Revenue Bonds, Sutter | 11/26 at 100.00 | N/R | 453,788 |
| | Health, Refunding Series 2016B, 5.000%, 11/15/46, (Pre-refunded 11/15/26) | | | |
| 2,500 | California Health Facilities Financing Authority, California, Revenue Bonds, Sutter | 11/25 at 100.00 | A1 | 2,703,275 |
| | Health, Series 2016A, 5.000%, 11/15/41, (Pre-refunded 11/15/25) | | | |
| 55 | California Health Facilities Financing Authority, Revenue Bonds, Providence Health & | | | |
| | Services, Refunding Series 2014A, 5.000%, 10/01/38, (Pre-refunded 10/01/24) | 10/24 at 100.00 | N/R | 58,013 |
| 530 | Foothill/Eastern Transportation Corridor Agency, California, Toll Road Revenue Bonds, | 1/24 at 100.00 | BBB+ | 555,880 |
| | Refunding Junior Lien Series 2013C, 6.500%, 1/15/43, (Pre-refunded 1/15/24) | | | |
| | Foothill/Eastern Transportation Corridor Agency, California, Toll Road Revenue Bonds, | | | |
| | Refunding Series 2013A: | | | |
| 1,170 | 5.750%, 1/15/46, (Pre-refunded 1/15/24) | 1/24 at 100.00 | A– | 1,223,972 |
| 1,175 | 6.000%, 1/15/53, (Pre-refunded 1/15/24) | 1/24 at 100.00 | A– | 1,232,657 |
| | Golden State Tobacco Securitization Corporation, California, Enhanced Tobacco Settlement | | | |
| | Asset-Backed Revenue Bonds, Refunding Series 2015A: | | | |
| 1,650 | 5.000%, 6/01/40, (Pre-refunded 6/01/25) | 6/25 at 100.00 | N/R | 1,765,863 |
| 1,350 | 5.000%, 6/01/40, (Pre-refunded 6/01/25) | 6/25 at 100.00 | AA– | 1,442,934 |
| 9,840 | Total U.S. Guaranteed | | | 10,451,572 |
55
| NXC | Nuveen California Select Tax-Free Income Portfolio |
| | Portfolio of Investments (continued) |
| | August 31, 2022 (Unaudited) |
| Principal | | Optional Call | | |
| Amount (000) | Description (1) | Provisions (2) | Ratings (3) | Value |
| | Utilities – 19.2% (19.6% of Total Investments) | | | |
| $ 1,480 | California Infrastructure and Economic Development Bank, Clean Water State Revolving | 4/27 at 100.00 | AAA | $ 1,631,197 |
| | Fund Revenue Bonds, Green Series 2017, 5.000%, 10/01/33 | | | |
| | California Pollution Control Financing Authority, Water Furnishing Revenue Bonds, | | | |
| | Poseidon Resources Channelside LP Desalination Project, Series 2012: | | | |
| 375 | 5.000%, 7/01/37, (AMT), 144A | 1/23 at 100.00 | BBB | 375,885 |
| 1,160 | 5.000%, 11/21/45, (AMT), 144A | 1/23 at 100.00 | BBB | 1,161,624 |
| 1,730 | East Bay Municipal Utility District, Alameda and Contra Costa Counties, California, | 6/27 at 100.00 | AAA | 1,727,664 |
| | Water System Revenue Bonds, Green Series 2017A, 4.000%, 6/01/45 | | | |
| 2,000 | Irvine Ranch Water District, California, Certificates of Participation, Irvine Ranch | 9/26 at 100.00 | AAA | 2,153,160 |
| | Water District Series 2016, 5.000%, 3/01/41 | | | |
| 645 | Long Beach Bond Finance Authority, California, Natural Gas Purchase Revenue Bonds, | No Opt. Call | AA– | 719,297 |
| | Series 2007A, 5.500%, 11/15/37 | | | |
| 3,000 | Los Angeles Department of Water and Power, California, Power System Revenue Bonds, | 7/27 at 100.00 | Aa2 | 3,218,550 |
| | Series 2017C, 5.000%, 7/01/47 | | | |
| 2,000 | Los Angeles Department of Water and Power, California, Power System Revenue Bonds, | 1/28 at 100.00 | Aa2 | 2,188,220 |
| | Series 2018A, 5.000%, 7/01/38 | | | |
| 1,970 | Los Angeles Department of Water and Power, California, Waterworks Revenue Bonds, Series | 7/24 at 100.00 | AA+ | 2,048,564 |
| | 2014A, 5.000%, 7/01/44 | | | |
| 1,000 | Los Angeles Department of Water and Power, California, Waterworks Revenue Bonds, Series | 7/28 at 100.00 | AA+ | 1,104,430 |
| | 2018B, 5.000%, 7/01/38 | | | |
| 620 | Los Angeles, California, Wastewater System Revenue Bonds, Green Subordinate Lien Series | 6/27 at 100.00 | AA | 676,315 |
| | 2017A, 5.250%, 6/01/47 | | | |
| 15,980 | Total Utilities | | | 17,004,906 |
| $ 94,301 | Total Long-Term Investments (cost $85,957,744) | | | 86,783,909 |
| | Other Assets Less Liabilities – 2.0% | | | 1,762,921 |
| | Net Assets Applicable to Common Shares – 100% | | | $ 88,546,830 |
| (1) | All percentages shown in the Portfolio of Investments are based on net assets applicable to common shares unless otherwise noted. |
(2)
| Optional Call Provisions: Dates (month and year) and prices of the earliest optional call or redemption. There may be other call provisions at varying prices at later dates. Certain mortgage-backed securities may be subject to periodic principal paydowns. |
(3)
| For financial reporting purposes, the ratings disclosed are the highest of Standard & Poor’s Group (“Standard & Poor’s”), Moody’s Investors Service, Inc. (“Moody’s”) or Fitch, Inc. (“Fitch”) rating. This treatment of split-rated securities may differ from that used for other purposes, such as for Fund investment policies. Ratings below BBB by Standard & Poor’s, Baa by Moody’s or BBB by Fitch are considered to be below investment grade. Holdings designated N/R are not rated by any of these national rating agencies. |
(4)
| Step-up coupon bond, a bond with a coupon that increases ("steps up"), usually at regular intervals, while the bond is outstanding. The rate shown is the coupon as of the end of the reporting period. |
| (5) | Backed by an escrow or trust containing sufficient U.S. Government or U.S. Government agency securities, which ensure the timely payment of principal and interest. |
144A
| Investment is exempt from registration under Rule 144A of the Securities Act of 1933, as amended. These investments may only be resold in transactions exempt from registration, which are normally those transactions with qualified institutional buyers. |
| AMT | Alternative Minimum Tax |
| | See accompanying notes to financial statements. |
56
Statement of Assets and Liabilities
August 31, 2022 (Unaudited)
| | NAC | NKX | NCA | NXC |
| Assets | | | | |
| Long-term investments, at value (cost $3,125,168,268, $1,067,572,438, | | | | |
| $304,542,622 and $85,957,744, respectively) | $3,132,295,285 | $1,087,243,178 | $306,790,692 | $86,783,909 |
| Cash | — | — | 1,083,094 | 1,117,140 |
| Receivable for: | | | | |
| Interest | 34,720,497 | 12,351,289 | 3,286,503 | 934,783 |
| Investments sold | 2,742,400 | 2,371,650 | 670,150 | 10,000 |
| Other assets | 1,044,819 | 371,816 | 59,770 | 29,407 |
| Total assets | 3,170,803,001 | 1,102,337,933 | 311,890,209 | 88,875,239 |
| Liabilities | | | | |
| Cash overdraft | 1,711,285 | 1,097,861 | — | — |
| Floating rate obligations | — | 20,975,000 | — | — |
| Payable for: | | | | |
| Dividends | 7,227,419 | 2,363,408 | 837,869 | 245,738 |
| Interest | 16,791 | 196,413 | — | — |
| MuniFund Preferred (“MFP”) Shares, net of deferred offering costs | | | | |
| (liquidation preference $320,000,000, $140,400,000, $— and $— respectively) | 319,844,457 | 140,017,115 | — | — |
| Variable Rate Demand Preferred (“VRDP”) Shares, net of deferred offering costs | | | | |
| (liquidation preference $957,600,000 and $292,200,000, $— and | | | | |
| $— respectively) | 954,484,890 | 290,632,353 | — | — |
| Accrued expenses: | | | | |
| Management fees | 1,521,064 | 549,814 | 124,884 | 19,679 |
| Trustees fees | 669,166 | 171,658 | 50,572 | 26,896 |
| Other | 435,662 | 160,282 | 87,997 | 36,096 |
| Total liabilities | 1,285,910,734 | 456,163,904 | 1,101,322 | 328,409 |
| Commitments and Contingencies (as disclosed in Note 8) | | | | |
| Net Assets applicable to common shares | $1,884,892,267 | $ 646,174,029 | $310,788,887 | $88,546,830 |
| Common shares outstanding | 144,735,059 | 47,520,334 | 33,108,196 | 6,360,883 |
| Net asset value ("NAV") per common share outstanding | $ 13.02 | $ 13.60 | $ 9.39 | $ 13.92 |
| Net assets applicable to common shares consist of: | | | | |
| Common shares, $0.01 par value per share | $ 1,447,351 | $ 475,203 | $ 331,082 | $ 63,609 |
| Paid-in surplus | 1,965,384,993 | 636,361,514 | 312,875,866 | 88,530,802 |
| Total distributable earnings (loss) | (81,940,077) | 9,337,312 | (2,418,061) | (47,581) |
| Net assets applicable to common shares | $1,884,892,267 | $ 646,174,029 | $310,788,887 | $88,546,830 |
| Authorized shares: | | | | |
| Common | Unlimited | Unlimited | Unlimited | Unlimited |
| Preferred | Unlimited | Unlimited | N/A | N/A |
| N/A – Fund is not authorized to issue Preferred shares. | | | | |
See accompanying notes to financial statements.
57
| Statement of Operations |
| Six Months Ended August 31, 2022 (Unaudited) |
| | NAC | NKX | NCA | NXC |
| Investment income | $ 64,459,019 | $ 22,105,495 | $ 6,144,904 | $ 1,732,186 |
| Expenses | | | | |
| Management fees | 9,102,031 | 3,293,713 | 745,066 | 116,987 |
| Interest expense and amortization of offering costs | 8,751,812 | 2,292,491 | 3,973 | 1,101 |
| Liquidity fees | 2,145,948 | 1,128,956 | — | — |
| Remarketing fees | 267,209 | 353,715 | — | — |
| Custodian expenses, net | 140,757 | 52,812 | 15,397 | 10,435 |
| Trustees fees | 52,664 | 17,925 | 4,843 | 1,376 |
| Professional fees | 174,478 | 57,613 | 27,814 | 18,820 |
| Shareholder reporting expenses | 58,376 | 25,361 | 18,049 | 7,618 |
| Shareholder servicing agent fees | 12,709 | 3,713 | 4,548 | 1,120 |
| Stock exchange listing fees | 21,812 | 7,162 | 16,892 | 3,686 |
| Investor relations expenses | 73,715 | 25,228 | 7,676 | 2,304 |
| Other | 66,983 | 47,086 | 4,369 | 3,914 |
| Total expenses | 20,868,494 | 7,305,775 | 848,627 | 167,361 |
| Net investment income (loss) | 43,590,525 | 14,799,720 | 5,296,277 | 1,564,825 |
| Realized and Unrealized Gain (Loss) | | | | |
| Net realized gain (loss) from Investments | (64,159,111) | (10,639,271) | (3,538,394) | (961,822) |
| Change in net unrealized appreciation (depreciation) of Investments | (230,455,692) | (85,298,175) | (27,773,453) | (6,882,045) |
| Net realized and unrealized gain (loss) | (294,614,803) | (95,937,446) | (31,311,847) | (7,843,867) |
| Net increase (decrease) in net assets applicable to | | | | |
| common shares from operations | $(251,024,278) | $(81,137,726) | $(26,015,570) | $(6,279,042) |
See accompanying notes to financial statements.
58
Statement of Changes in Net Assets
| | NAC | | NKX |
| | Six Months | | | Six Months | |
| | Ended | Year | | Ended | Year |
| | 8/31/22 | Ended | | 8/31/22 | Ended |
| | (Unaudited) | 2/28/22 | | (Unaudited) | 2/28/22 |
| Operations | | | | | |
| Net investment income (loss) | $ 43,590,525 | $ 96,175,613 | | $ 14,799,720 | $ 32,467,323 |
| Net realized gain (loss) from investments | (64,159,111) | (2,554,993) | | (10,639,271) | 458,904 |
| Change in net unrealized appreciation (depreciation) of investments | (230,455,692) | (120,601,420) | | (85,298,175) | (41,296,515) |
| Net increase (decrease) in net assets applicable to common shares | | | | | |
| from operations | (251,024,278) | (26,980,800) | | (81,137,726) | (8,370,288) |
| Distributions to Common Shareholders | | | | | |
| Dividends | (45,157,338) | (94,656,728) | | (15,681,710) | (31,838,623) |
| Decrease in net assets applicable to common shares from | | | | | |
| distributions to common shareholders | (45,157,338) | (94,656,728) | | (15,681,710) | (31,838,623) |
| Capital Share Transactions | | | | | |
| Common shares: | | | | | |
| Net proceeds from shares issued to shareholders due to | | | | | |
| reinvestment of distributions | — | — | | — | — |
| Issued in the Reorganization | — | — | | — | — |
| Net increase (decrease) in net assets applicable to common | | | | | |
| shares from capital share transactions | — | — | | — | — |
| Net increase (decrease) in net assets applicable to common shares | (296,181,616) | (121,637,528) | | (96,819,436) | (40,208,911) |
| Net assets applicable to common shares at the beginning of period | 2,181,073,883 | 2,302,711,411 | | 742,993,465 | 783,202,376 |
| Net assets applicable to common shares at the end of period | $1,884,892,267 | $2,181,073,883 | | $646,174,029 | $742,993,465 |
See accompanying notes to financial statements.
59
Statement of Changes in Net Assets (continued)
| | | | | | | |
| | NCA | | | NXC | |
| | Six Months | | | Six Months | | |
| | Ended | Year | | Ended | Eleven Months | Year |
| | 8/31/22 | Ended | | 8/31/22 | Ended | Ended |
| | (Unaudited) | 2/28/22 | | (Unaudited) | 2/28/22 | 3/31/21 |
| Operations | | | | | | |
| Net investment income (loss) | $ 5,296,277 | $ 10,135,155 | | $ 1,564,825 | $ 2,887,651 | $ 3,270,899 |
| Net realized gain (loss) from investments | (3,538,394) | 182,061 | | (961,822) | 33,430 | 460,516 |
| Change in net unrealized appreciation | | | | | | |
| (depreciation) of investments | (27,773,453) | (11,767,724) | | (6,882,045) | (4,195,935) | 2,121,520 |
| Net increase (decrease) in net assets applicable to | | | | | | |
| common shares from operations | (26,015,570) | (1,450,508) | | (6,279,042) | (1,274,854) | 5,852,935 |
| Distributions to Common Shareholders | | | | | | |
| Dividends | (4,999,338) | (9,911,780) | | (1,526,612) | (3,049,063) | (3,331,881) |
| Decrease in net assets applicable to common shares from | | | | | | |
| distributions to common shareholders | (4,999,338) | (9,911,780) | | (1,526,612) | (3,049,063) | (3,331,881) |
| Capital Share Transactions | | | | | | |
| Common shares: | | | | | | |
| Net proceeds from shares issued to shareholders | | | | | | |
| due to reinvestment of distributions | — | — | | — | 75,933 | 66,551 |
| Issued in the Reorganization | — | 53,540,962 | | — | — | — |
| Net increase (decrease) in net assets applicable to | | | | | | |
| common shares from capital share transactions | — | 53,540,962 | | — | 75,933 | 66,551 |
| Net increase (decrease) in net assets applicable to | | | | | | |
| common shares | (31,014,908) | 42,178,674 | | (7,805,654) | (4,247,984) | 2,587,605 |
| Net assets applicable to common shares at the | | | | | | |
| beginning of period | 341,803,795 | 299,625,121 | | 96,352,484 | 100,600,468 | 98,012,863 |
| Net assets applicable to common shares at the | | | | | | |
| end of period | $310,788,887 | $341,803,795 | | $88,546,830 | $ 96,352,484 | $100,600,468 |
See accompanying notes to financial statements.
60
| Statement of Cash Flows |
| Six Months Ended August 31, 2022 (Unaudited) |
| | NAC | NKX |
| Cash Flows from Operating Activities: | | |
| Net Increase (Decrease) in Net Assets Applicable to Common Shares from Operations | $ (251,024,278) | $ (81,137,726) |
| Adjustments to reconcile the net increase (decrease) in net assets applicable to common shares | | |
| from operations to net cash provided by (used in) operating activities: | | |
| Purchases of investments | (1,204,421,747) | (279,674,768) |
| Proceeds from sales and maturities of investments | 1,193,849,164 | 282,098,156 |
| Taxes paid | (9,608) | (381) |
| Amortization (Accretion) of premiums and discounts, net | 5,764,999 | 1,052,433 |
| Amortization of deferred offering costs | 99,308 | 49,503 |
| (Increase) Decrease in: | | |
| Receivable for interest | 1,453,822 | 593,027 |
| Receivable for investments sold | 18,964,678 | 668,750 |
| Other assets | 139,424 | 35,490 |
| Increase (Decrease) in: | | |
| Payable for interest | 16,791 | 154,558 |
| Payable for investments purchased – regular settlement | (4,928,112) | — |
| Accrued management fees | 45,889 | 16,790 |
| Accrued Trustees fees | (138,892) | (35,318) |
| Accrued other expenses | (155,266) | (59,830) |
| Net realized (gain) loss from: | | |
| Investments | 64,159,111 | 10,639,271 |
| Paydowns | (392,624) | (8,333) |
| Change in net unrealized appreciation (depreciation) of investments | 230,455,692 | 85,298,175 |
| Net cash provided by (used in) operating activities | 53,878,351 | 19,689,797 |
| Cash Flow from Financing Activities: | | |
| Proceeds from borrowings | 84,100,000 | 11,700,000 |
| (Repayments of) borrowings | (84,100,000) | (11,700,000) |
| Increase (Decrease) in Cash overdraft | (8,301,684) | (3,782,031) |
| Cash distributions paid to common shareholders | (45,576,667) | (15,907,766) |
| Net cash provided by (used in) financing activities | (53,878,351) | (19,689,797) |
| Net Increase (Decrease) in Cash | — | — |
| Cash at the beginning of period | — | — |
| Cash at the end of period | $ — | $ — |
| |
| Supplemental Disclosure of Cash Flow Information | NAC | NKX |
| Cash paid for interest (excluding amortization of offering costs) | $ 8,589,873 | $ 2,080,758 |
See accompanying notes to financial statements.
61
| Financial Highlights |
| Selected data for a common share outstanding throughout each period: |
| | | | | | Less Distributions | | | | |
| | Investment Operations | | to Common Shareholders | | Common Share |
| | | | | | | | | Premium | Discount | | |
| | | | | | | | | per | per | | |
| | | | | | | From | | Share | Share | | |
| | Beginning | Net | Net | | From | Accumu- | | Sold | Repur- | | |
| | Common | Investment | Realized/ | | Net | lated Net | | through | chased | | Ending |
| | Share | Income Unrealized | | Investment | Realized | | Shelf | and | Ending | Share |
| | NAV | (Loss) Gain (Loss) | Total | Income | Gains | Total | Offering | Retired | NAV | Price |
| NAC | | | | | | | | | | | |
| Year Ended 2/28–2/29: | | | | | | | | | | | |
| 2023(d) | $15.07 | $0.30 | $(2.04) | $(1.74) | $(0.31) | $ — | $(0.31) | $ — | $ — | $13.02 | $12.14 |
| 2022 | 15.91 | 0.66 | (0.85) | (0.19) | (0.65) | — | (0.65) | — | — | 15.07 | 13.71 |
| 2021 | 16.71 | 0.64 | (0.80) | (0.16) | (0.64) | — | (0.64) | — | — | 15.91 | 14.57 |
| 2020 | 14.95 | 0.65 | 1.76 | 2.41 | (0.65) | — | (0.65) | — | — | 16.71 | 15.09 |
| 2019 | 15.17 | 0.67 | (0.22) | 0.45 | (0.68) | — | (0.68) | — | 0.01 | 14.95 | 13.30 |
| 2018 | 15.31 | 0.73 | (0.10) | 0.63 | (0.77) | — | (0.77) | — | — | 15.17 | 13.49 |
| NKX | | | | | | | | | | | |
| Year Ended 2/28-2/29: | | | | | | | | | | | |
| 2023(d) | 15.64 | 0.31 | (2.02) | (1.71) | (0.33) | — | (0.33) | — | — | 13.60 | 13.46 |
| 2022 | 16.48 | 0.68 | (0.85) | (0.17) | (0.67) | — | (0.67) | — | — | 15.64 | 14.15 |
| 2021 | 17.27 | 0.66 | (0.80) | (0.14) | (0.65) | — | (0.65) | — | — | 16.48 | 15.13 |
| 2020 | 15.17 | 0.63 | 2.09 | 2.72 | (0.62) | — | (0.62) | — | — | 17.27 | 15.53 |
| 2019 | 15.26 | 0.66 | (0.11) | 0.55 | (0.65) | — | (0.65) | — | 0.01 | 15.17 | 13.50 |
| 2018 | 15.35 | 0.72 | (0.04) | 0.68 | (0.77) | — | (0.77) | — | — | 15.26 | 13.97 |
(a)
| Total Return Based on Common Share NAV is the combination of changes in common share NAV, reinvested dividend income at NAV and reinvested capital gains distributions at NAV, if any. The last dividend declared in the period, which is typically paid on the first business day of the following month, is assumed to be reinvested at the ending NAV. The actual reinvest price for the last dividend declared in the period may often be based on the Fund’s market price (and not its NAV), and therefore may be different from the price used in the calculation. Total returns are not annualized.
Total Return Based on Common Share Price is the combination of changes in the market price per share and the effect of reinvested dividend income and reinvested capital gains distributions, if any, at the average price paid per share at the time of reinvestment. The last dividend declared in the period, which is typically paid on the first business day of the following month, is assumed to be reinvested at the ending market price. The actual reinvestment for the last dividend declared in the period may take place over several days, and in some instances may not be based on the market price, so the actual reinvestment price may be different from the price used in the calculation. Total returns are not annualized. |
62
| | | | Common Share Supplemental Data/ | |
| | | | Ratios Applicable to Common Shares | |
| Common Share | | | | |
| Total Returns | | Ratios to Average Net Assets(b) | |
| |
| | Based | Ending | | | |
| Based | on | Net | | Net | Portfolio |
| on | Share | Assets | | Investment | Turnover |
| NAV(a) | Price(a) | (000) | Expenses | Income (Loss) | Rate(c) |
| |
| (11.59)% | (9.22)% | $1,884,892 | 2.10%** | 4.39%** | 37% |
| (1.33) | (1.81) | 2,181,074 | 1.46 | 4.14 | 12 |
| (0.90) | 0.88 | 2,302,711 | 1.67 | 4.00 | 17 |
| 16.37 | 18.54 | 2,418,423 | 2.26 | 4.11 | 11 |
| 3.01 | 3.79 | 2,163,282 | 2.42 | 4.48 | 30 |
| 4.19 | (2.27) | 2,201,952 | 1.97 | 4.71 | 14 |
| |
| (10.98) | (2.53) | 646,174 | 2.16** | 4.37** | 25 |
| (1.19) | (2.44) | 742,993 | 1.51 | 4.10 | 9 |
| (0.77) | 1.67 | 783,202 | 1.72 | 4.03 | 8 |
| 18.23 | 19.88 | 820,662 | 2.27 | 3.91 | 11 |
| 3.73 | 1.45 | 720,786 | 2.50 | 4.34 | 28 |
| 4.42 | 0.51 | 728,662 | 2.24 | 4.58 | 14 |
| (b) | | • Net Investment Income (Loss) ratios reflect income earned and expenses incurred (as further described below) on assets attributable to preferred shares issued by the Fund, where applicable. |
| • | | The expense ratios reflect, among other things, all interest expense and other costs related to preferred shares (as described in Note 5 – Fund Shares) and/or the interest expense deemed to have been paid by the Fund on the floating rate certificates issued by the special purpose trusts for the self-deposited inverse floaters held by the Fund (as described in Note 4 – Portfolio Securities and Investments in Derivatives), where applicable, as follows: |
| | Ratios of Interest Expense | | | Ratios of Interest Expense |
| | to Average Net Assets Applicable | | | to Average Net Assets Applicable |
| | to Common Shares | | | to Common Shares |
| NAC | | | NKX | |
| Year Ended 2/28–2/29: | | Year Ended 2/28-2/29: |
| 2023(d) | 1.13%** | | 2023(d) | 1.12%** |
| 2022 | 0.55 | | 2022 | 0.49 |
| 2021 | 0.74 | | 2021 | 0.74 |
| 2020 | 1.33 | | 2020 | 1.28 |
| 2019 | 1.45 | | 2019 | 1.45 |
| 2018 | 1.02 | | 2018 | 1.20 |
| (c) | | Portfolio Turnover Rate is calculated based on the lesser of long-term purchases or sales (as disclosed in Note 4 – Portfolio Securities and Investments in Derivatives) divided by the average long-term market value during the period. |
| (d) | | Unaudited. For the six months ended August 31, 2022. |
See accompanying notes to financial statements.
63
Financial Highlights (continued)
Selected data for a common share outstanding throughout each period:
| | | | | | Less Distributions | | | | | | |
| | | Investment Operations | | to Common Shareholders | | | Common Share | | |
| | | | | | | | | | Premium | Discount | | |
| | | | | | | | | | per | per | | |
| | | | | | | From | | | Share | Share | | |
| | Beginning | Net | Net | | From | Accumu- | | | Sold | Repur- | | |
| | Common | | Investment | Realized/ | | Net | lated Net | | Shelf | through | chased | | Ending |
| | Share | Income | Unrealized | | Investment | Realized | | Offering | Shelf | and | Ending | Share |
| | NAV | (Loss) | Gain (Loss) | Total | Income | Gains | Total | Cost | Offering | Retired | NAV | Price |
| NCA | | | | | | | | | | | | |
| Year Ended 2/28–2/29: | | | | | | | | | | | | |
| 2023(d) | $10.32 | $0.16 | $(0.94) | $(0.78) | $(0.15) | $ — | $(0.15) | $ — | $ — | $ — | $ 9.39 | $ 9.04 |
| 2022 | 10.66 | 0.31 | (0.35) | (0.04) | (0.30) | — | (0.30) | — | — | — | 10.32 | 9.53 |
| 2021 | 11.05 | 0.32 | (0.39) | (0.07) | (0.32) | — | (0.32) | — | — | — | 10.66 | 10.21 |
| 2020 | 10.13 | 0.34 | 0.92 | 1.26 | (0.34) | — | (0.34) | — | — | — | 11.05 | 10.45 |
| 2019 | 10.19 | 0.34 | (0.06) | 0.28 | (0.34) | — | (0.34) | —* | — | — | 10.13 | 9.42 |
| 2018 | 10.24 | 0.38 | (0.03) | 0.35 | (0.40) | — | (0.40) | — | —* | — | 10.19 | 9.55 |
| NXC | | | | | | | | | | | | |
| Year Ended 2/28-2/29: | | | | | | | | | | | | |
| 2023(d) | 15.15 | 0.25 | (1.24) | (0.99) | (0.24) | — | (0.24) | — | — | — | 13.92 | 13.64 |
| 2022(e) | 15.83 | 0.45 | (0.65) | (0.20) | (0.44) | (0.04) | (0.48) | — | — | — | 15.15 | 14.81 |
| Year Ended 3/31: | | | | | | | | | | | | |
| 2021 | 15.43 | 0.51 | 0.41 | 0.92 | (0.52) | — | (0.52) | — | — | — | 15.83 | 16.29 |
| 2020 | 15.21 | 0.53 | 0.21 | 0.74 | (0.52) | — | (0.52) | — | — | — | 15.43 | 14.50 |
| 2019 | 15.02 | 0.50 | 0.19 | 0.69 | (0.52) | — | (0.52) | 0.02 | — | — | 15.21 | 14.12 |
| 2018 | 15.00 | 0.57 | 0.09 | 0.66 | (0.58) | (0.06) | (0.64) | — | —* | — | 15.02 | 13.90 |
| 2017 | 15.68 | 0.60 | (0.56) | 0.04 | (0.62) | (0.10) | (0.72) | — | — | — | 15.00 | 14.83 |
| (a) | | Total Return Based on Common Share NAV is the combination of changes in common share NAV, reinvested dividend income at NAV and reinvested capital gains distributions at NAV, if any. The last dividend declared in the period, which is typically paid on the first business day of the following month, is assumed to be reinvested at the ending NAV. The actual reinvest price for the last dividend declared in the period may often be based on the Fund’s market price (and not its NAV), and therefore may be different from the price used in the calculation. Total returns are not annualized. |
Total Return Based on Common Share Price is the combination of changes in the market price per share and the effect of reinvested dividend income and reinvested capital gains distributions, if any, at the average price paid per share at the time of reinvestment. The last dividend declared in the period, which is typically paid on the first business day of the following month, is assumed to be reinvested at the ending market price. The actual reinvestment for the last dividend declared in the period may take place over several days, and in some instances may not be based on the market price, so the actual reinvestment price may be different from the price used in the calculation. Total returns are not annualized.
64
| | | | Common Share Supplemental Data/ | |
| | | | Ratios Applicable to Common Shares | |
| Common Share | | | | |
| Total Returns | | Ratios to Average Net Assets | |
| |
| | Based | Ending | | | |
| Based | on | Net | | Net | Portfolio |
| on | Share | Assets | | Investment | Turnover |
| NAV(a) | Price(a) | (000) | Expenses(b) | Income (Loss) | Rate(c) |
| |
| (7.57)% | (3.54)% | $310,789 | 0.53%** | 3.29%** | 28% |
| (0.43) | (3.89) | 341,804 | 0.56 | 2.85 | 6 |
| (0.62) | 0.73 | 299,625 | 0.60 | 2.94 | 9 |
| 12.63 | 14.67 | 310,278 | 0.52 | 3.22 | 8 |
| 2.82 | 2.31 | 284,624 | 0.62 | 3.38 | 38 |
| 3.45 | (2.72) | 286,121 | 0.56 | 3.67 | 23 |
| |
| (6.56) | (6.30) | 88,547 | 0.37** | 3.42** | 21 |
| (1.34) | (6.27) | 96,352 | 0.35** | 3.14** | 9 |
| |
| 6.05 | 16.13 | 100,600 | 0.35 | 3.26 | 5 |
| 4.86 | 6.26 | 98,013 | 0.36 | 3.41 | 10 |
| 4.82 | 5.44 | 96,573 | 0.55 | 3.38 | 23 |
| 4.37 | (2.23) | 95,357 | 0.37 | 3.73 | 20 |
| 0.20 | (6.98) | 94,310 | 0.37 | 3.89 | 24 |
| (b) | | • The expense ratios reflect, among other things, the interest expense deemed to have been paid by the Fund on the floating rate certificates issued by the special purpose trusts for the self-deposited inverse floaters held by the Fund (as described in Note 4 – Portfolio Securities and Investments in Derivatives), where applicable, as follows: |
| | Ratios of Interest Expense | | | Ratios of Interest Expense |
| | to Average Net Assets Applicable | | to Average Net Assets Applicable |
| | to Common Shares | | | to Common Shares |
| NCA | | | NXC | |
| Year Ended 2/28–2/29: | | Year Ended 2/28-2/29: |
| 2023(d) | —%** | | 2023(d) | —%** |
| 2022 | — | | 2022(e) | —** |
| 2021 | — | | Year Ended 3/31: | |
| 2020 | — | | 2021 | — |
| 2019 | — | | 2020 | — |
| 2018 | — | | 2019 | — |
| | | | 2018 | — |
| | | | 2017 | — |
| (c) | | Portfolio Turnover Rate is calculated based on the lesser of long-term purchases or sales (as disclosed in Note 4 – Portfolio Securities and Investments in Derivatives) divided by the average long-term market value during the period. |
| (d) | | Unaudited. For the six months ended August 31, 2022. |
| (e) | | For the eleven months ended February 28, 2022. |
See accompanying notes to financial statements.
65
Financial Highlights (continued)
The following table sets forth information regarding each Fund’s outstanding senior securities as of the end of each of the Fund’s last five fiscal periods, as applicable.
| | | | | | MFP |
| | | | | | and VRDP |
| | MFP Shares | VRDP Shares | Shares |
| | Aggregate | Asset | Aggregate | Asset | Asset Coverage |
| | Amount | Coverage | Amount | Coverage | Per $1 |
| | Outstanding | Per $100,000 | Outstanding Per | $100,000 | Liquidation |
| | (000)(a) | Share(b) | (000)(a) | Share(b) | Preference |
| NAC | | | | | |
| Year Ended 2/28-2/29: | | | | | |
| 2023(c) | $320,000 | $247,534 | $957,600 | $247,534 | $2.48 |
| 2022 | 320,000 | 270,716 | 957,600 | 270,716 | 2.71 |
| 2021 | 320,000 | 280,237 | 957,600 | 280,237 | 2.80 |
| 2020 | 320,000 | 289,294 | 957,600 | 289,294 | 2.89 |
| 2019 | 320,000 | 269,324 | 957,600 | 269,324 | 2.69 |
| 2018 | 320,000 | 272,351 | 957,600 | 272,351 | 2.72 |
| |
| NKX | | | | | |
| Year Ended 2/28-2/29: | | | | | |
| 2023(c) | 140,400 | 249,370 | 292,200 | 249,370 | 2.49 |
| 2022 | 140,400 | 271,751 | 292,200 | 271,751 | 2.72 |
| 2021 | 140,400 | 281,045 | 292,200 | 281,045 | 2.81 |
| 2020 | 140,400 | 289,705 | 292,200 | 289,705 | 2.90 |
| 2019 | 140,400 | 266,617 | 292,200 | 266,617 | 2.67 |
| 2018 | 140,400 | 268,438 | 292,200 | 268,438 | 2.68 |
| (a) | | Aggregate Amount Outstanding: Aggregate amount outstanding represents the liquidation preference as of the end of the relevant fiscal year. |
| (b) | | Asset Coverage Per $100,000: Asset coverage per $100,000 is calculated by subtracting the Fund’s liabilities and indebtedness not represented by senior securities from the Fund’s total assets, dividing the result by the aggregate amount of the Fund’s senior securities representing indebtedness then outstanding (if applicable,) plus the aggregate of the involuntary liquidation preference of the outstanding preferred shares, if applicable, and multiplying the result by 100,000. |
| (c) | | Unaudited. For the six months ended August 31, 2022. |
See accompanying notes to financial statements.
66
Notes to
Financial Statements (Unaudited)
1. General Information
Fund Information
The funds covered in this report and their corresponding New York Stock Exchange (“NYSE”) symbols are as follows (each a “Fund” and collectively, the “Funds”):
• Nuveen California Quality Municipal Income Fund (NAC)
• Nuveen California AMT-Free Quality Municipal Income Fund (NKX)
• Nuveen California Municipal Value Fund (NCA)
• Nuveen California Select Tax-Free Income Portfolio (NXC)
The Funds are registered under the Investment Company Act of 1940 (the “1940 Act”), as amended, as diversified closed-end management investment companies. NAC, NKX and NXC were organized as Massachusetts business trusts on December 1, 1998, July 29, 2002, and March 30, 1992, respectively. NCA was organized as a Massachusetts business trust on March 8, 2021 (previously organized as a Minnesota trust on July 15, 1987).
Change in Fiscal and Tax Year End for NXC
Effective February 24, 2022, NXC’s fiscal and tax year end changed from March 31 to February 28/29 as approved by the Fund's Board of Trustees (the “Board”). As a result, NXC has prepared an annual report for the period April 1, 2021 through February 28, 2022 (the “eleven months ended February 28, 2022”).
Current Fiscal Period
The end of the reporting period for the Funds is August 31, 2022, and the period covered by these Notes to Financial Statements is the six months ended August 30, 2022 (the “current fiscal period”).
Investment Adviser and Sub-Adviser
The Funds’ investment adviser is Nuveen Fund Advisors, LLC (the “Adviser”), a subsidiary of Nuveen, LLC (“Nuveen”). Nuveen is the investment management arm of Teachers Insurance and Annuity Association of America (TIAA). The Adviser has overall responsibility for management of the Funds, oversees the management of the Funds’ portfolios, manages the Funds’ business affairs and provides certain clerical, bookkeeping and other administrative services, and, if necessary, asset allocation decisions. The Adviser has entered into sub-advisory agreements with Nuveen Asset Management, LLC (the “Sub-Adviser“), a subsidiary of the Adviser, under which the Sub-Adviser manages the investment portfolios of the Funds.
Fund Reorganization
Effective prior to the opening of business on March 8, 2021, Nuveen California Municipal Value Fund 2 (NCB) (the “Target Fund“) was reorganized into NCA (the “Acquiring Fund“) (the “Reorganization“).
For accounting and performance reporting purposes, the Acquiring Fund is the survivor.
Upon the closing of the Reorganization, the Target Fund transferred its assets to the Acquiring Fund in exchange for common shares of the Acquiring Fund and the assumption by the Acquiring Fund of the liabilities of the Target Fund. The Target Fund was then liquidated, dissolved and terminated in accordance with its Declaration of Trust. Shareholders of the Target Fund became shareholders of the Acquiring Fund. Holders of common shares of the Target Fund received newly issued common shares of the Acquiring Fund, the aggregate net asset value (“NAV”) of which was equal to the aggregate NAV of the common shares of the Target Fund held immediately prior to the Reorganization (including for this purpose fractional Acquiring Fund shares to which shareholders were entitled).
Developments Regarding the Funds’ Control Share By-Law
On October 5, 2020, the Funds and certain other closed-end funds in the Nuveen fund complex amended their by-laws. Among other things, the amended by-laws included provisions pursuant to which, in summary, a shareholder who obtains beneficial ownership of common shares in a Control Share Acquisition (as defined in the by-laws) shall have the same voting rights as other common shareholders only to the extent authorized by the other disinterested shareholders (the “Control Share By-Law”). On January 14, 2021, a shareholder of certain Nuveen closed-end funds filed a civil complaint in the U.S. District Court for the Southern District of New York (the “District Court”) against certain Nuveen funds and their trustees, seeking a declaration that such funds’ Control Share By-Laws violate the 1940 Act, rescission of such fund’s Control Share By-Laws and a permanent injunction
67
Notes to Financial Statements (Unaudited) (continued)
against such funds applying the Control Share By-Laws. On February 18, 2022, the District Court granted judgment in favor of the plaintiff’s claim for rescission of such funds’ Control Share By-Laws and the plaintiff’s declaratory judgment claim, and declared that such funds’ Control Share By-Laws violate Section 18(i) of the 1940 Act. Following review of the judgment of the District Court, on February 22, 2022, the Board amended the Funds’ bylaws to provide that the Funds’ Control Share By-Law shall be of no force and effect for so long as the judgment of the District Court is effective and that if the judgment of the District Court is reversed, overturned, vacated, stayed, or otherwise nullified, the Funds’ Control Share By-Law will be automatically reinstated and apply to any beneficial owner of common shares acquired in a Control Share Acquisition, regardless of whether such Control Share Acquisition occurs before or after such reinstatement, for the duration of the stay or upon issuance of the mandate reversing, overturning, vacating or otherwise nullifying the judgment of the District Court. On February 25, 2022, the Board and the Funds appealed the District Court’s decision to the U.S. Court of Appeals for the Second Circuit.
Other Matters
The outbreak of the novel coronavirus (“COVID-19”) and subsequent global pandemic began significantly impacting the U.S. and global financial markets and economies during the calendar quarter ended March 31, 2020. The worldwide spread of COVID-19 has created significant uncertainty in the global economy. The duration and extent of COVID-19 over the long term cannot be reasonably estimated at this time. The ultimate impact of COVID-19 and the extent to which COVID-19 impacts the Funds’ normal course of business, results of operations, investments, and cash flows will depend on future developments, which are highly uncertain and difficult to predict. Management continues to monitor and evaluate this situation.
2. Significant Accounting Policies
The accompanying financial statements were prepared in accordance with accounting principles generally accepted in the United States of America (“U.S. GAAP”), which may require the use of estimates made by management and the evaluation of subsequent events. Actual results may differ from those estimates. Each Fund is an investment company and follows the accounting guidance in the Financial Accounting Standards Board (“FASB”) Accounting Standards Codification 946, Financial Services—Investment Companies. The NAV for financial reporting purposes may differ from the NAV for processing security and common share transactions. The NAV for financial reporting purposes includes security and common share transactions through the date of the report. Total return is computed based on the NAV used for processing security and common share transactions. The following is a summary of the significant accounting policies consistently followed by the Funds.
Compensation
The Funds pay no compensation directly to those of its trustees or to its officers, all of whom receive remuneration for their services to the Funds from the Adviser or its affiliates. The Board has adopted a deferred compensation plan for independent trustees that enables trustees to elect to defer receipt of all or a portion of the annual compensation they are entitled to receive from certain Nuveen-advised funds. Under the plan, deferred amounts are treated as though equal dollar amounts had been invested in shares of select Nuveen-advised funds.
Custodian Fee Credit
As an alternative to overnight investments, each Fund has an arrangement with its custodian bank, State Street Bank and Trust Company, (the “Custodian”) whereby certain custodian fees and expenses are reduced by net credits earned on each Fund’s cash on deposit with the bank. Credits for cash balances may be offset by charges for any days on which a Fund overdraws its account at the Custodian. The amount of custodian fee credit earned by a Fund is recognized on the Statement of Operations as a component of “Custodian expenses, net.” During the current reporting period, the custodian fee credit earned by each Fund was as follows:
| | NAC | NKX | NCA | NXC |
| Custodian Fee Credit | $3,937 | $2,442 | $3,868 | $680 |
Distributions to Common Shareholders
Distributions to common shareholders are recorded on the ex-dividend date. The amount, character and timing of distributions are determined in accordance with federal income tax regulations, which may differ from U.S. GAAP.
Indemnifications
Under the Funds’ organizational documents, their officers and trustees are indemnified against certain liabilities arising out of the performance of their duties to the Funds. In addition, in the normal course of business, the Funds enter into contracts that provide general indemnifications to other parties. The Funds’ maximum exposure under these arrangements is unknown as this would involve future claims that may be made against the Funds that have not yet occurred. However, the Funds have not had prior claims or losses pursuant to these contracts and expect the risk of loss to be remote.
Investments and Investment Income
Securities transactions are accounted for as of the trade date for financial reporting purposes. Realized gains and losses on securities transactions are based upon the specific identification method. Investment income is comprised of interest income, which is recorded on an accrual basis and includes
68
the accretion of discounts and the amortization of premiums for financial reporting purposes. Investment income also reflects payment-in-kind (“PIK”) interest and paydown gains and losses, if any. PIK interest represents income received in the form of securities in lieu of cash.
Netting Agreements
In the ordinary course of business, the Funds may enter into transactions subject to enforceable International Swaps and Derivatives Association, Inc. (ISDA) master agreements or other similar arrangements (“netting agreements”). Generally, the right to offset in netting agreements allows each Fund to offset certain securities and derivatives with a specific counterparty, when applicable, as well as any collateral received or delivered to that counterparty based on the terms of the agreements. Generally, each Fund manages its cash collateral and securities collateral on a counterparty basis.
The Funds’ investments subject to netting agreements as of the end of the reporting period, if any, are further described in Note 4 – Portfolio Securities and Investments in Derivatives.
New Accounting Pronouncements and Rule Issuances
Reference Rate Reform
In March 2020, FASB issued Accounting Standards Update (“ASU”) 2020-04, Reference Rate Reform: Facilitation of the Effects of Reference Rate Reform on Financial Reporting. The main objective of the new guidance is to provide relief to companies that will be impacted by the expected change in benchmark interest rates, when participating banks will no longer be required to submit London Interbank Offered Rate (LIBOR) quotes by the UK Financial Conduct Authority (FCA). The new guidance allows companies to, provided the only change to existing contracts are a change to an approved benchmark interest rate, account for modifications as a continuance of the existing contract without additional analysis. For new and existing contracts, the Funds may elect to apply the amendments as of March 12, 2020 through December 31, 2022. Management has not yet elected to apply the amendments, is continuously evaluating the potential effect a discontinuation of LIBOR could have on the Funds’ investments and has currently determined that it is unlikely the ASU’s adoption will have a significant impact on the Funds’ financial statements and various filings.
New Rules to Modernize Fund Valuation Framework Take Effect
A new rule adopted by the Securities and Exchange Commission (the “SEC”) governing fund valuation practices, Rule 2a-5 under the 1940 Act, has established requirements for determining fair value in good faith for purposes of the 1940 Act. Rule 2a-5 permits fund boards to designate certain parties to perform fair value determinations, subject to board oversight and certain other conditions. Rule 2a-5 also defines when market quotations are “readily available” for purposes of Section 2(a)(41) of the 1940 Act, which requires a fund to fair value a security when market quotations are not readily available. Separately, new SEC Rule 31a-4 under the 1940 Act sets forth the recordkeeping requirements associated with fair value determinations. The Funds adopted a valuation policy conforming to the new rules, effective September 1, 2022, and there was no material impact to the Funds.
3. Investment Valuation and Fair Value Measurements
The Funds’ investments in securities are recorded at their estimated fair value utilizing valuation methods approved by the Board. Fair value is defined as the price that would be received upon selling an investment or transferring a liability in an orderly transaction to an independent buyer in the principal or most advantageous market for the investment. U.S. GAAP establishes the three-tier hierarchy which is used to maximize the use of observable market data and minimize the use of unobservable inputs and to establish classification of fair value measurements for disclosure purposes. Observable inputs reflect the assumptions market participants would use in pricing the asset or liability. Observable inputs are based on market data obtained from sources independent of the reporting entity. Unobservable inputs reflect management’s assumptions about the assumptions market participants would use in pricing the asset or liability. Unobservable inputs are based on the best information available in the circumstances. The following is a summary of the three-tiered hierarchy of valuation input levels.
Level 1 – Inputs are unadjusted and prices are determined using quoted prices in active markets for identical securities.
Level 2 – Prices are determined using other significant observable inputs (including quoted prices for similar securities, interest rates, credit spreads, etc.).
Level 3 – Prices are determined using significant unobservable inputs (including management’s assumptions in determining the fair value of investments).
A description of the valuation techniques applied to the Funds’ major classifications of assets and liabilities measured at fair value follows:
Prices of fixed-income securities are generally provided by an independent pricing service (“pricing service”) approved by the Board. The pricing service establishes a security’s fair value using methods that may include consideration of the following: yields or prices of investments of comparable quality, type of issue, coupon, maturity and rating, market quotes or indications of value from security dealers, evaluations of anticipated cash flows or collateral, general market conditions and other information and analysis, including the obligor’s credit characteristics considered relevant. In pricing certain securities, particularly less liquid and lower quality securities, the pricing service may consider information about a security, its issuer or market activity provided by the Adviser. These securities are generally classified as Level 2.
69
Notes to Financial Statements (Unaudited) (continued)
Any portfolio security or derivative for which market quotations are not readily available or for which the above valuation procedures are deemed not to reflect fair value are valued at fair value, as determined in good faith using procedures approved by the Board. As a general principle, the fair value of a security would appear to be the amount that the owner might reasonably expect to receive for it in a current sale. A variety of factors may be considered in determining the fair value of such securities, which may include consideration of the following: yields or prices of investments of comparable quality, type of issue, coupon, maturity and rating, market quotes or indications of value from security dealers, evaluations of anticipated cash flows or collateral, general market conditions and other information and analysis, including the obligor’s credit characteristics considered relevant. To the extent the inputs are observable and timely, the values would be classified as Level 2 of the fair value hierarchy; otherwise they would be classified as Level 3.
The following table summarizes the market value of the Funds’ investments as of the end of the reporting period, based on the inputs used to value them:
| NAC | Level 1 | Level 2 | Level 3 | Total |
| Long-Term Investments*: | | | | |
| Municipal Bonds | $ — | $3,130,924,474 | $1,370,811** | $3,132,295,285 |
| NKX | | | | |
| Long-Term Investments*: | | | | |
| Municipal Bonds | $ — | $1,087,067,160 | $ 176,018** | $1,087,243,178 |
| NCA | | | | |
| Long-Term Investments*: | | | | |
| Municipal Bonds | $ — | $ 306,790,692 | $ — | $ 306,790,692 |
| NXC | | | | |
| Long-Term Investments*: | | | | |
| Municipal Bonds | $ — | $ 86,783,909 | $ — | $ 86,783,909 |
| * | | Refer to the Fund’s Portfolio of Investments for industry classifications. |
| ** | | Refer to the Fund’s Portfolio of Investments for securities classified as Level 3. |
The Funds hold liabilities in floating rate obligations and preferred shares, where applicable, which are not reflected in the tables above. The fair values of the Funds’ liabilities for floating rate obligations approximate their liquidation values. Floating rate obligations are generally classified as Level 2 and further described in Note 4 - Portfolio Securities and Investments in Derivatives. The fair values of the Funds’ liabilities for preferred shares approximate their liquidation preference. Preferred shares are generally classified as Level 2 and further described in Note 5 - Fund Shares.
4. Portfolio Securities and Investments in Derivatives
Portfolio Securities
Inverse Floating Rate Securities
Each Fund is authorized to invest in inverse floating rate securities. An inverse floating rate security is created by depositing a municipal bond (referred to as an “Underlying Bond”), typically with a fixed interest rate, into a special purpose tender option bond (“TOB”) trust (referred to as the “TOB Trust”) created by or at the direction of one or more Funds. In turn, the TOB Trust issues (a) floating rate certificates (referred to as “Floaters”), in face amounts equal to some fraction of the Underlying Bond’s par amount or market value, and (b) an inverse floating rate certificate (referred to as an “Inverse Floater”) that represents all remaining or residual interest in the TOB Trust. Floaters typically pay short-term tax-exempt interest rates to third parties who are also provided a right to tender their certificate and receive its par value, which may be paid from the proceeds of a remarketing of the Floaters, by a loan to the TOB Trust from a third party liquidity provider (“Liquidity Provider”), or by the sale of assets from the TOB Trust. The Inverse Floater is issued to a long term investor, such as one or more of the Funds. The income received by the Inverse Floater holder varies inversely with the short-term rate paid to holders of the Floaters, and in most circumstances the Inverse Floater holder bears substantially all of the Underlying Bond’s downside investment risk and also benefits disproportionately from any potential appreciation of the Underlying Bond’s value. The value of an Inverse Floater will be more volatile than that of the Underlying Bond because the interest rate is dependent on not only the fixed coupon rate of the Underlying Bond but also on the short-term interest paid on the Floaters, and because the Inverse Floater essentially bears the risk of loss (and possible gain) of the greater face value of the Underlying Bond.
The Inverse Floater held by a Fund gives the Fund the right to (a) cause the holders of the Floaters to tender their certificates at par (or slightly more than par in certain circumstances), and (b) have the trustee of the TOB Trust (the “Trustee”) transfer the Underlying Bond held by the TOB Trust to the Fund, thereby collapsing the TOB Trust.
The Fund may acquire an Inverse Floater in a transaction where it (a) transfers an Underlying Bond that it owns to a TOB Trust created by a third party or (b) transfers an Underlying Bond that it owns, or that it has purchased in a secondary market transaction for the purpose of creating an Inverse
70
Floater, to a TOB Trust created at its direction, and in return receives the Inverse Floater of the TOB Trust (referred to as a “self-deposited Inverse Floater”). A Fund may also purchase an Inverse Floater in a secondary market transaction from a third party creator of the TOB Trust without first owning the Underlying Bond (referred to as an “externally-deposited Inverse Floater”).
An investment in a self-deposited Inverse Floater is accounted for as a “financing” transaction (i.e., a secured borrowing). For a self-deposited Inverse Floater, the Underlying Bond deposited into the TOB Trust is identified in the Fund’s Portfolio of Investments as “(UB) – Underlying bond of an inverse floating rate trust reflected as a financing transaction,” with the Fund recognizing as liabilities, labeled “Floating rate obligations” on the Statement of Assets and Liabilities, (a) the liquidation value of Floaters issued by the TOB Trust, and (b) the amount of any borrowings by the TOB Trust from a Liquidity Provider to enable the TOB Trust to purchase outstanding Floaters in lieu of a remarketing. In addition, the Fund recognizes in “Investment Income” the entire earnings of the Underlying Bond, and recognizes (a) the interest paid to the holders of the Floaters or on the TOB Trust’s borrowings, and (b) other expenses related to remarketing, administration, trustee, liquidity and other services to a TOB Trust, as a component of “Interest expense and amortization of offering costs” on the Statement of Operations. Earnings due from the Underlying Bond and interest due to the holders of the Floaters as of the end of the reporting period are recognized as components of “Receivable for interest” and “Payable for interest” on the Statement of Assets and Liabilities, respectively.
In contrast, an investment in an externally-deposited Inverse Floater is accounted for as a purchase of the Inverse Floater and is identified in the Fund’s Portfolio of Investments as “(IF) – Inverse floating rate investment.” For an externally-deposited Inverse Floater, a Fund’s Statement of Assets and Liabilities recognizes the Inverse Floater and not the Underlying Bond as an asset, and the Fund does not recognize the Floaters, or any related borrowings from a Liquidity Provider, as a liability. Additionally, the Fund reflects in “Investment Income” only the net amount of earnings on the Inverse Floater (net of the interest paid to the holders of the Floaters or the Liquidity Provider as lender, and the expenses of the Trust), and does not show the amount of that interest paid or the expenses of the TOB Trust as described above as interest expense on the Statement of Operations.
Fees paid upon the creation of a TOB Trust for self-deposited Inverse Floaters and externally-deposited Inverse Floaters are recognized as part of the cost basis of the Inverse Floater and are capitalized over the term of the TOB Trust.
As of the end of the reporting period, the aggregate value of Floaters issued by each Fund’s TOB Trust for self-deposited Inverse Floaters and externally-deposited Inverse Floaters was as follows:
| Floating Rate Obligations Outstanding | NAC | NKX | NCA | NXC |
| Floating rate obligations: self-deposited Inverse Floaters | $ — | $20,975,000 | $ — | $ — |
| Floating rate obligations: externally-deposited Inverse Floaters | 7,500,000 | — | — | — |
| Total | $7,500,000 | $20,975,000 | $ — | $ — |
During the current fiscal period, the average amount of Floaters (including any borrowings from a Liquidity Provider) outstanding, and the average annual interest rate and fees related to self-deposited Inverse Floaters, were as follows:
| Self-Deposited Inverse Floaters | NAC | NKX | NCA | NXC |
| Average floating rate obligations outstanding | $ — | $20,975,000 | $ — | $ — |
| Average annual interest rate and fees | —% | 1.34% | —% | —% |
TOB Trusts are supported by a liquidity facility provided by a Liquidity Provider pursuant to which the Liquidity Provider agrees, in the event that Floaters are (a) tendered to the Trustee for remarketing and the remarketing does not occur, or (b) subject to mandatory tender pursuant to the terms of the TOB Trust agreement, to either purchase Floaters or to provide the Trustee with an advance from a loan facility to fund the purchase of Floaters by the TOB Trust. In certain circumstances, the Liquidity Provider may otherwise elect to have the Trustee sell the Underlying Bond to retire the Floaters that were tendered and not remarketed prior to providing such a loan. In these circumstances, the Liquidity Provider remains obligated to provide a loan to the extent that the proceeds of the sale of the Underlying Bond is not sufficient to pay the purchase price of the Floaters.
The size of the commitment under the loan facility for a given TOB Trust is at least equal to the balance of that TOB Trust’s outstanding Floaters plus any accrued interest. In consideration of the loan facility, fee schedules are in place and are charged by the Liquidity Provider(s). Any loans made by the Liquidity Provider will be secured by the purchased Floaters held by the TOB Trust. Interest paid on any outstanding loan balances will be effectively borne by the Fund that owns the Inverse Floaters of the TOB Trust that has incurred the borrowing and may be at a rate that is greater than the rate that would have been paid had the Floaters been successfully remarketed.
As described above, any amounts outstanding under a liquidity facility are recognized as a component of “Floating rate obligations” on the Statement of Assets and Liabilities by the Fund holding the corresponding Inverse Floaters issued by the borrowing TOB Trust. As of the end of the reporting period, there were no loans outstanding under any such facility for any of the Funds as of the end of the reporting period.
Each Fund may also enter into shortfall and forbearance agreements (sometimes referred to as a “recourse arrangement”) (TOB Trusts involving such agreements are referred to herein as “Recourse Trusts”), under which a Fund agrees to reimburse the Liquidity Provider for the Trust’s Floaters, in
71
Notes to Financial Statements (Unaudited) (continued)
certain circumstances, for the amount (if any) by which the liquidation value of the Underlying Bond held by the TOB Trust may fall short of the sum of the liquidation value of the Floaters issued by the TOB Trust plus any amounts borrowed by the TOB Trust from the Liquidity Provider, plus any shortfalls in interest cash flows. Under these agreements, a Fund’s potential exposure to losses related to or on an Inverse Floater may increase beyond the value of the Inverse Floater as a Fund may potentially be liable to fulfill all amounts owed to holders of the Floaters or the Liquidity Provider. Any such shortfall amount in the aggregate is recognized as “Unrealized depreciation on Recourse Trusts” on the Statement of Assets and Liabilities.
As of the end of the reporting period, each Fund’s maximum exposure to the Floaters issued by Recourse Trusts for self-deposited Inverse Floaters and externally-deposited Inverse Floaters was as follows:
| Floating Rate Obligations – Recourse Trusts | NAC | NKX | NCA | NXC |
| Maximum exposure to Recourse Trusts: self-deposited Inverse Floaters | $ — | $20,975,000 | $ — | $ — |
| Maximum exposure to Recourse Trusts: externally-deposited Inverse Floaters | 7,500,000 | — | — | — |
| Total | $7,500,000 | $20,975,000 | $ — | $ — |
Zero Coupon Securities
A zero coupon security does not pay a regular interest coupon to its holders during the life of the security. Income to the holder of the security comes from accretion of the difference between the original purchase price of the security at issuance and the par value of the security at maturity and is effectively paid at maturity. The market prices of zero coupon securities generally are more volatile than the market prices of securities that pay interest periodically.
Investment Transactions
Long-term purchases and sales (including maturities) during the current fiscal period were as follows:
| | NAC | NKX | NCA | NXC |
| Purchases | $1,204,421,747 | $279,674,768 | $88,250,179 | $18,442,659 |
| Sales and Maturities | 1,193,849,164 | 282,098,156 | 90,105,576 | 18,189,977 |
The Funds may purchase securities on a when-issued or delayed-delivery basis. Securities purchased on a when-issued or delayed-delivery basis may have extended settlement periods; interest income is not accrued until settlement date. Any securities so purchased are subject to market fluctuation during this period. The Funds have earmarked securities in their portfolios with a current value at least equal to the amount of the when-issued/ delayed-delivery purchase commitments. If a Fund has outstanding when-issued/delayed-delivery purchases commitments as of the end of the reporting period, such amounts are recognized on the Statement of Assets and Liabilities.
Investments in Derivatives
In addition to the inverse floating rate securities in which each Fund may invest, which are considered portfolio securities for financial reporting purposes, each Fund is authorized to invest in certain derivative instruments such as futures, options and swap contracts. Each Fund limits its investments in futures, options on futures and swap contracts to the extent necessary for the Adviser to claim the exclusion from registration by the Commodity Futures Trading Commission as a commodity pool operator with respect to the Fund. The Funds record derivative instruments at fair value, with changes in fair value recognized on the Statement of Operations, when applicable. Even though the Funds’ investments in derivatives may represent economic hedges, they are not considered to be hedge transactions for financial reporting purposes.
Although the Funds are authorized to invest in derivative instruments and may do so in future, they did not make any such investments during the current fiscal period.
Market and Counterparty Credit Risk
In the normal course of business each Fund may invest in financial instruments and enter into financial transactions where risk of potential loss exists due to changes in the market (market risk) or failure of the other party to the transaction to perform (counterparty credit risk). The potential loss could exceed the value of the financial assets recorded on the financial statements. Financial assets, which potentially expose each Fund to counterparty credit risk, consist principally of cash due from counterparties on forward, option and swap transactions, when applicable. The extent of each Fund’s exposure to counterparty credit risk in respect to these financial assets approximates their carrying value as recorded on the Statement of Assets and Liabilities.
Each Fund helps manage counterparty credit risk by entering into agreements only with counterparties the Adviser believes have the financial resources to honor their obligations and by having the Adviser monitor the financial stability of the counterparties. Additionally, counterparties may be required to pledge collateral daily (based on the daily valuation of the financial asset) on behalf of each Fund with a value approximately equal to the amount of any unrealized gain above a pre-determined threshold. Reciprocally, when each Fund has an unrealized loss, the Funds have instructed the custodian to pledge assets of the Funds as collateral with a value approximately equal to the amount of the unrealized loss above a pre-determined threshold. Collateral pledges are monitored and subsequently adjusted if and when the valuations fluctuate, either up or down, by at least the pre-determined threshold amount.
72
5. Fund Shares
Common Shares
Common Shares Equity Shelf Programs and Offering Costs
NKX had filed a registration statement with the SEC authorizing the Fund to issue additional common shares through one or more equity shelf programs (“Shelf Offering”), which became effective with the SEC during prior fiscal periods.
Under this Shelf Offering, the Fund, subject to market conditions, may raise additional equity capital by issuing additional common shares from time to time in varying amounts and by different offering methods at a net price at or above the Fund’s NAV per common share. In the event the Fund’s Shelf Offering registration statement is no longer current, the Fund may not issue additional common shares until a post-effective amendment to the registration statement has been filed with the SEC.
Additional authorized common shares, common shares sold and offering proceeds, net of offering costs under the Fund’s Shelf Offering during the Fund’s current fiscal period were as follows:
| | NKX |
| | Six Months | Year |
| | Ended | Ended |
| | 8/31/22 | 2/28/22 |
| Additional authorized common shares | — | 4,100,000* |
| Common shares sold | — | — |
| Offering proceeds, net of offering cost | — | — |
| * | | Represents additional authorized common shares for the period March 1, 2020 through June 30, 2021. |
Costs incurred by the Fund in connection with its initial shelf registration are recorded as a prepaid expense and recognized as “Deferred offering costs” on the Statement of Assets and Liabilities. These costs are amortized pro rata as common shares are sold and are recognized as a component of “Proceeds from shelf offering, net of offering costs” on the Statement of Changes in Net Assets. Any deferred offering costs remaining after the effectiveness of the initial shelf registration will be expensed. Costs incurred by the Fund to keep the shelf registration current are expensed as incurred and recognized as a component of “Other expenses” on the Statement of Operations.
| Common Share Transactions | | | | | |
Transactions in common shares for the Funds during the Funds’ current and prior fiscal period, where applicable, were as follows:
| | NCA | NXC |
| | | | | Eleven | |
| | Six Months | Year | Six Months | Months | Year |
| | Ended | Ended | Ended | Ended | Ended |
| | 8/31/22 | 2/28/22 | 8/31/22 | 2/28/22 | 3/31/21 |
| Common shares: | | | | | |
| Issued to shareholders due to reinvestment of distributions | — | — | — | 4,779 | 4,192 |
| Issued in the Reorganization | — | 5,011,513 | — | — | — |
Preferred Shares
MuniFund Preferred Shares
NAC and NKX have issued and have outstanding MuniFund Preferred (“MFP”) Shares, with a $100,000 liquidation preference per share. These MFP Shares were issued via private placement and are not publicly available.
The Funds are obligated to redeem their MFP Shares by the date as specified in its offering documents (“Term Redemption Date”), unless earlier redeemed by the Funds. MFP Shares are initially issued in a pre-specified mode, however, MFP Shares can be subsequently designated as an alternative mode at a later date at the discretion of the Funds. The modes within MFP Shares detail the dividend mechanics and are described as follows. At a subsequent date, the Funds may establish additional mode structures with the MFP Share.
| • | | Variable Rate Remarketed Mode (“VRRM”) – Dividends for MFP Shares within this mode will be established by a remarketing agent; therefore, market value of the MFP Shares is expected to approximate its liquidation preference. Shareholders have the ability to request a best-efforts tender of its shares upon seven days notice. If the remarketing agent is unable to identify an alternative purchaser, the shares will be retained by the shareholder requesting tender and the subsequent dividend rate will increase to its step-up dividend rate. If after one consecutive year of unsuccessful remarketing attempts, the Fund will be required to designate an alternative mode or redeem the shares. |
73
Notes to Financial Statements (Unaudited) (continued)
Each Fund will pay a remarketing fee on the aggregate principal amount of all MFP Shares while designated in VRRM. Payments made by the Fund to the remarketing agent are recognized as “Remarketing fees” on the Statement of Operations.
| • | | Variable Rate Mode (“VRM”) – Dividends for MFP Shares designated in this mode are based upon a short-term index plus an additional fixed “spread” amount established at the time of issuance or renewal / conversion of its mode. At the end of the period of the mode, the Fund will be required to either extend the term of the mode, designate an alternative mode or redeem the MFP Shares. |
The fair value of MFP Shares while in VRM are expected to approximate their liquidation preference so long as the fixed “spread” on the shares remains roughly in line with the “spread” being demanded by investors on instruments having similar terms in the current market. In current market conditions, the Adviser has determined that the fair value of the shares are approximately their liquidation preference, but their fair value could vary if market conditions change materially.
| • | | Variable Rate Demand Mode (“VRDM”) – Dividends for MFP Shares designated in this mode will be established by a remarketing agent; therefore, the market value of the MFP Shares is expected to approximate its liquidation preference. While in this mode, shares will have an unconditional liquidity feature that enable its shareholders to require a liquidity provider, which the Fund has entered into a contractual agreement, to purchase shares in the event that the shares are not able to be successfully remarketed. In the event that shares within this mode are unable to be successfully remarketed and are purchased by the liquidity provider, the dividend rate will be the maximum rate which is designed to escalate according to a specified schedule in order to enhance the remarketing agent’s ability to successfully remarket the shares. Each Fund is required to redeem any shares that are still owned by a liquidity provider after six months of continuous, unsuccessful remarketing. |
The Fund will pay a liquidity and remarketing fee on the aggregate principal amount of all MFP shares while within VRDM. Payments made by the Fund to the liquidity provider and remarketing agent are recognized as “Liquidity fees” and “Remarketing fees”, respectively, on the Statement Operations.
For financial reporting purposes, the liquidation preference of MFP Shares is recorded as a liability and is recognized as a component of “MuniFund Preferred (“MFP”) Shares, net of deferred offering costs” on the Statement of Assets and Liabilities. Dividends on the MFP shares are treated as interest payments for financial reporting purposes. Unpaid dividends on MFP shares are recognized as a component on “Interest payable” on the Statement of Assets and Liabilities. Dividends accrued on MFP Shares are recognized as a component of “Interest expense and amortization of offering costs” on the Statement of Operations.
Subject to certain conditions, MFP Shares may be redeemed, in whole or in part, at any time at the option of the Fund. The Fund may also be required to redeem certain MFP shares if the Fund fails to maintain certain asset coverage requirements and such failures are not cured by the applicable cure date. The redemption price per share in all circumstances is equal to the liquidation preference per share plus any accumulated but unpaid dividends.
Costs incurred in connection with each Fund’s offering of MFP Shares were recorded as deferred charges and are amortized over the life of the shares and are recognized as a component of “MuniFund Preferred (“MFP”) Shares, net of deferred offering costs” on the Statement of Assets and Liabilities and “Interest expense and amortization of offering costs” on the Statement of Operations.
As of the end of the reporting period, details of each Fund’s MFP Shares outstanding as of the end of the reporting period, were as follows:
| | | | | Liquidation | | | |
| | | | | Preference, | | | |
| | | Shares | Liquidation | net of deferred | Term | | Mode |
| Fund | Series | Outstanding | Preference | offering costs | Redemption Date | Mode | Termination Date |
| NAC | A | 3,200 | $320,000,000 | $319,844,457 | 1/03/28 | VRM | 1/03/28* |
| NKX | A | 1,404 | 140,400,000 | 140,017,115 | 10/01/47 | VRRM | N/A |
* Subject to earlier termination by either the Fund or the holder.
The average liquidation preference of MFP Shares outstanding and annualized dividend rate for the Funds during the current fiscal period were as follows:
| | NAC | NKX |
| Average liquidation preference of MFP Shares outstanding | $320,000,000 | $140,400,000 |
| Annualized dividend rate | 1.60% | 1.19% |
Variable Rate Demand Preferred Shares
The following Funds have issued and have outstanding Variable Rate Demand Preferred (“VRDP”) Shares, with a $100,000 liquidation preference per share. VRDP Shares are issued via private placement and are not publicly available.
74
As of the end of the reporting period, NAC and NKX had $954,484,890 and $290,632,353 of VRDP Shares at liquidation preference, net of deferred offering costs, respectively. Further details of the Funds’ VRDP Shares outstanding as of the reporting period, were as follows:
| | | Shares | Remarketing | Liquidation | |
| Fund | Series | Outstanding | Fees* | Preference | Maturity |
| NAC | 1 | 1,362 | 0.10% | $136,200,000 | June 1, 2041 |
| | 2 | 910 | N/A | 91,000,000 | December 1, 2040 |
| | 3 | 498 | 0.05 | 49,800,000 | March 1, 2040 |
| | 4 | 1,056 | 0.10 | 105,600,000 | December 1, 2042 |
| | 5 | 1,589 | N/A | 158,900,000 | August 1, 2040 |
| | 6 | 1,581 | 0.10 | 158,100,000 | August 1, 2040 |
| | 7 | 980 | 0.10 | 98,000,000 | August 3, 2043 |
| | 8 | 1,600 | N/A | 160,000,000 | November 6, 2026 |
| |
| NKX | 2 | 355 | 0.10% | $ 35,500,000 | June 1, 2040 |
| | 3 | 427 | 0.05 | 42,700,000 | March 1, 2040 |
| | 4 | 1,090 | 0.10 | 109,000,000 | December 1, 2040 |
| | 6 | 1,050 | 0.10 | 105,000,000 | June 1, 2046 |
| |
| * | Remarketing fees as a percentage of the aggregate principal amount of all VRDP Shares outstanding for each series. |
| N/A | Not applicable. Series is considered to be Special Rate VRDP and therefore does not pay a remarketing fee. |
VRDP Shares include a liquidity feature that allows VRDP shareholders to have their shares purchased by a liquidity provider with whom each Fund has contracted in the event that VRDP Shares are not able to be successfully remarketed. Each Fund is required to redeem any VRDP Shares that are still owned by the liquidity provider after six months of continuous, unsuccessful remarketing. Each Fund pays an annual remarketing fee on the aggregate principal amount of all VRDP Shares outstanding. Each Fund’s VRDP Shares have successfully remarketed since issuance.
NAC’s Series 2, Series 5 and Series 8 VRDP Shares are considered to be Special Rate VRDP, which are sold to institutional investors. The special rate period will expire on February 6, 2023, September 1, 2023 and November 6, 2026, for the Fund’s Series 2, 5 and 8 VRDP Shares, respectively. The special rate period for NAC’s Series 8 VRDP Shares is subject to earlier termination by either the Fund or the holder. During the special rate period, the VRDP Shares will not be remarketed by a remarketing agent, be subject to optional or mandatory tender events, or be supported by a liquidity provider and are not subject to remarketing fees or liquidity fees. During the special rate period, VRDP dividends will be set monthly as a floating rate based on the predetermined formula. Following the initial special rate period, Special Rate Period VRDP Shares may transition to traditional VRDP Shares with dividends set at weekly remarketings, and be supported by designated liquidity provider, or the Board may approve a subsequent special rate period.
Dividends on the VRDP Shares (which are treated as interest payments for financial reporting purposes) are set at a rate established by a remarketing agent; therefore, the market value of the VRDP Shares is expected to approximate its liquidation preference. In the event that VRDP shares are unable to be successfully remarketed, the dividend rate will be the maximum rate which is designed to escalate according to a specified schedule in order to enhance the remarketing agent’s ability to successfully remarket the VRDP Shares.
Subject to certain conditions, VRDP Shares may be redeemed, in whole or in part, at any time at the option of each Fund. Each Fund may also redeem certain of the VRDP Shares if the Fund fails to maintain certain asset coverage requirements and such failures are not cured by the applicable cure date. The redemption price per share is equal to the sum of the liquidation preference per share plus any accumulated but unpaid dividends.
The average liquidation preference of VRDP Shares outstanding and annualized dividend rate for each Fund during the current fiscal period were as follows:
| | NAC | NKX |
| Average liquidation preference of VRDP Shares outstanding | $957,600,000 | $292,200,000 |
| Annualized dividend rate | 2.18% | 0.85% |
For financial reporting purposes, the liquidation preference of VRDP Shares is a liability and is recognized as a component of “Variable Rate Demand Preferred (“VRDP”) Shares, net of deferred offering costs” on the Statement of Assets and Liabilities. Unpaid dividends on VRDP Shares are recognized as a component of “Interest payable” on the Statement of Assets and Liabilities, when applicable. Dividends accrued on VRDP Shares are recognized as a component of “Interest expense and amortization of offering costs” on the Statement of Operations. Costs incurred by the Funds in connection with their offerings of VRDP Shares were recorded as a deferred charge, which are being amortized over the life of the shares and are recognized as a component of “Variable Rate Demand Preferred (“VRDP”) Shares, net of deferred offering costs” on the Statement of Assets and Liabilities and “Interest expense and amortization of offerings costs” on the Statement of Operations. In addition to interest expense, each Fund also pays a per annum liquidity fee to the liquidity provider, as well as a remarketing fee, which are recognized as “Liquidity fees” and “Remarketing fees,” respectively, on the Statement of Operations.
75
Notes to Financial Statements (Unaudited) (continued)
Preferred Share Transactions
The Funds did not have any transactions in preferred shares during the current and prior fiscal period.
6. Income Tax Information
Each Fund is a separate taxpayer for federal income tax purposes. Each Fund intends to distribute substantially all of its net investment income and net capital gains to shareholders and otherwise comply with the requirements of Subchapter M of the Internal Revenue Code applicable to regulated investment companies. Therefore, no federal income tax provision is required.
Each Fund intends to satisfy conditions that will enable interest from municipal securities, which is exempt from regular federal and designated state income taxes, and in the case of NKX the alternative minimum tax applicable to individuals to retain such tax-exempt status when distributed to shareholders of the Funds. Net realized capital gains and ordinary income distributions paid by the Funds are subject to federal taxation.
Each Fund files income tax returns in U.S. federal and applicable state and local jurisdictions. A Fund’s federal income tax returns are generally subject to examination for a period of three fiscal years after being filed. State and local tax returns may be subject to examination for an additional period of time depending on the jurisdiction. Management has analyzed each Fund’s tax positions taken for all open tax years and has concluded that no provision for income tax is required in the Fund’s financial statements.
As of the end of the reporting period, the aggregate cost and net unrealized appreciation/(depreciation) of all investments for federal income tax purposes was as follows:
| | | Gross | Gross | Net Unrealized |
| | | Unrealized | Unrealized | Appreciation |
| Fund | Tax Cost | Appreciation | (Depreciation) | (Depreciation) |
| NAC | $3,126,274,236 | $96,542,505 | $(90,521,456) | $6,021,049 |
| NKX | 1,046,940,217 | 48,484,994 | (29,156,998) | 19,327,996 |
| NCA | 304,324,722 | 12,381,203 | (9,915,233) | 2,465,970 |
| NXC | 85,940,422 | 3,217,785 | (2,374,298) | 843,487 |
For purposes of this disclosure, tax cost generally includes the cost of portfolio investments as well as up-front fees or premiums exchanged on derivatives and any amounts unrealized for income statement reporting but realized income and/or capital gains for tax reporting, if applicable.
As of prior fiscal period end, the components of accumulated earnings on a tax basis were as follows:
| | Undistributed | Undistributed | Undistributed | Unrealized | | Late-Year | Other | |
| | Tax-Exempt | Ordinary | Long-Term | Appreciation | Capital Loss | Loss | Book-to-Tax | |
| Fund | Income1 | Income | Capital Gains | (Depreciation) | Carryforwards | Deferrals | Differences | Total |
| NAC | $7,665,707 | $179,255 | $ — | $236,388,924 | $(22,113,894) | $ — | $(7,888,061) | $214,231,931 |
| NKX | 4,940,693 | 14,752 | — | 104,619,336 | (733,515) | — | (2,684,899) | 106,156,367 |
| NCA | 978,851 | — | — | 30,214,793 | (1,787,880) | — | (811,151) | 28,594,613 |
| NXC | 277,128 | — | 13,809 | 7,721,570 | — | — | (254,435) | 7,758,072 |
| 1 | | Undistributed tax-exempt income (on a tax basis) has not been reduced for the dividend declared on February 1, 2022, and paid on March 1, 2022. |
As of prior fiscal period end, the Funds had capital loss carryforwards, which will not expire:
| Fund | | | | | | Short-Term | Long-Term | Total |
| NAC | | | | | | $22,113,894 | $ — | $22,113,894 |
| NKX | | | | | | 733,515 | — | 733,515 |
| NCA | | | | | | 1,787,880 | — | 1,787,880 |
| NXC | | | | | | — | — | — |
7. Management Fees and Other Transactions with Affiliates
Management Fees
Each Fund’s management fee compensates the Adviser for overall investment advisory and administrative services and general office facilities. The Sub-Adviser is compensated for its services to the Funds from the management fees paid to the Adviser.
Each Fund’s management fee consists of two components – a fund-level fee, based only on the amount of assets within each individual Fund, and a complex-level fee, based on the aggregate amount of all eligible fund assets managed by the Adviser, and for NCA a gross interest income component. This pricing structure enables Fund shareholders to benefit from growth in the assets within their respective Fund as well as from growth in the amount of complex-wide assets managed by the Adviser.
76
NCA pays an annual fund-level fee, payable monthly, of 0.15% of the average daily net assets of the Fund, as well as 4.125% of the gross interest income (excluding interest on bonds underlying a “self-deposited inverse floater” trust that is attributed to the Fund over and above the net interest earned on the inverse floater itself) of the Fund.
The annual fund-level fee, payable monthly, for NAC and NKX is calculated according to the following schedules:
| Average Daily Managed Assets* | NAC | NKX |
| For the first $125 million | 0.4500% | 0.4500% |
| For the next $125 million | 0.4375 | 0.4375 |
| For the next $250 million | 0.4250 | 0.4250 |
| For the next $500 million | 0.4125 | 0.4125 |
| For the next $1 billion | 0.4000 | 0.4000 |
| For the next $3 billion | 0.3750 | 0.3750 |
| For managed assets over $5 billion | 0.3625 | 0.3625 |
The annual fund-level fee, payable monthly, for NXC is calculated according to the following schedule:
| | | NXC |
| Average Daily Net Assets* | Fund-Level Fee Rate |
| For the first $125 million | | 0.1000% |
| For the next $125 million | | 0.0875 |
| For the next $250 million | | 0.0750 |
| For the next $500 million | | 0.0625 |
| For the next $1 billion | | 0.0500 |
| For the next $3 billion | | 0.0250 |
| For managed assets over $5 billion | | 0.0125 |
The annual complex-level fee, payable monthly, for each Fund is calculated by multiplying the current complex-wide fee rate, determined according to the following schedule by the Funds’ daily managed assets (net assets for NCA and NXC):
| Complex-Level Eligible Asset Breakpoint Level* | Effective Complex-Level Fee Rate at Breakpoint Level |
| $55 billion | 0.2000% |
| $56 billion | 0.1996 |
| $57 billion | 0.1989 |
| $60 billion | 0.1961 |
| $63 billion | 0.1931 |
| $66 billion | 0.1900 |
| $71 billion | 0.1851 |
| $76 billion | 0.1806 |
| $80 billion | 0.1773 |
| $91 billion | 0.1691 |
| $125 billion | 0.1599 |
| $200 billion | 0.1505 |
| $250 billion | 0.1469 |
| $300 billion | 0.1445 |
| * | | For the complex-level fees, managed assets include closed-end fund assets managed by the Adviser that are attributable to certain types of leverage. For these purposes, leverage includes the funds’ use of preferred stock and borrowings and certain investments in the residual interest certificates (also called inverse floating rate securities) in tender option bond (TOB) trusts, including the portion of assets held by a TOB trust that has been effectively financed by the trust’s issuance of floating rate securities, subject to an agreement by the Adviser as to certain funds to limit the amount of such assets for determining managed assets in certain circumstances. The complex-level fee is calculated based upon the aggregate daily managed assets of all Nuveen open-end and closed-end funds that constitute “eligible assets.” Eligible assets do not include assets attributable to investments in other Nuveen funds or assets in excess of a determined amount (originally $2 billion) added to the Nuveen fund complex in connection with the Adviser’s assumption of the management of the former First American Funds effective January 1, 2011, but do not include certain assets of certain Nuveen funds that were reorganized into funds advised by an affiliate of the Adviser during the 2019 calendar year. As of August 31, 2022, the complex-level fee for each Fund was 0.1567%. |
Other Transactions with Affiliates
Each Fund is permitted to purchase or sell securities from or to certain other funds or accounts managed by the Sub-Adviser (“Affiliated Entity”) under specified conditions outlined in procedures adopted by the Board (“cross-trade”). These procedures have been designed to ensure that any cross-trade of securities by the Fund from or to an Affiliated Entity by virtue of having a common investment adviser (or affiliated investment adviser), common officer and/or common trustee complies with Rule 17a-7 under the 1940 Act. These transactions are effected at the current market price (as provided by an independent pricing service) without incurring broker commissions.
77
Notes to Financial Statements (Unaudited) (continued)
During the current fiscal period, the following Fund engaged in cross-trades pursuant to these procedures as follows:
| Cross-Trades | NAC | NKX | NCA | NXC |
| Purchases | $30,481,135 | $6,578,845 | $3,876,458 | $1,012,130 |
| Sales | 30,650,745 | 6,606,145 | 3,892,544 | 1,016,330 |
| Realized gain(loss) | (478,891) | — | — | — |
8. Commitments and Contingencies
In the normal course of business, each Fund enters into a variety of agreements that may expose the Fund to some risk of loss. These could include recourse arrangements for certain TOB Trusts and certain agreements related to preferred shares, which are each described elsewhere in these Notes to Financial Statements. The risk of future loss arising from such agreements, while not quantifiable, is expected to be remote. As of the end of the reporting period, the Funds did not have any unfunded commitments.
From time to time, the Funds may be a party to certain legal proceedings in the ordinary course of business, including proceedings relating to the enforcement of the Funds’ rights under contracts. As of the end of the reporting period, management has determined that any legal proceeding(s) the Fund are subject to, including those described within this report, are unlikely to have a material impact to any of the Funds’ financial statements.
9. Borrowing Arrangements
Committed Line of Credit
The Funds, along with certain other funds managed by the Adviser (“Participating Funds”), have established a 364-day, $2.700 billion standby credit facility with a group of lenders, under which the Participating Funds may borrow for temporary purposes (other than on-going leveraging for investment purposes). Each Participating Fund is allocated a designated proportion of the facility’s capacity (and its associated costs, as described below) based upon a multi-factor assessment of the likelihood and frequency of its need to draw on the facility, the size of the Fund and its anticipated draws, and the potential importance of such draws to the operations and well-being of the Fund, relative to those of the other Funds. A Fund may effect draws on the facility in excess of its designated capacity if and to the extent that other Participating Funds have undrawn capacity. The credit facility expires in June 2023 unless extended or renewed.
The credit facility has the following terms: 0.15% per annum on unused commitment amounts and a drawn interest rate equal to the higher of (a) OBFR (Overnight Bank Funding Rate) plus 1.20% per annum or (b) the Fed Funds Effective Rate plus 1.20% per annum on amounts borrowed. The Participating Funds also incurred a 0.05% upfront fee on the increased commitments from select lenders. Interest expense incurred by the Participating Funds, when applicable, is recognized as a component of “Interest expense” on the Statement of Operations. Participating Funds paid administration, legal and arrangement fees, which are recognized as a component of “Interest expense” on the Statement of Operations, and along with commitment fees, have been allocated among such Participating Funds based upon the relative proportions of the facility’s aggregate capacity reserved for them and other factors deemed relevant by the Adviser and the Board of each Participating Fund.
During the current fiscal period, the following Funds utilized this facility. Each Fund’s maximum outstanding balance during the utilization period was as follows:
| | NAC | NKX |
| Maximum outstanding balance | $25,000,000 | $11,700,000 |
During each Fund’s utilization period(s) during the current fiscal period, the average daily balance outstanding and average annual interest rate on the Borrowings were as follows:
| | NAC | NKX |
| Utilization period (days outstanding) | 34 | 9 |
| Average daily balance outstanding | $19,291,176 | $11,700,000 |
| Average annual interest rate | 2.10% | 1.53% |
Borrowings outstanding as of the end of the reporting period, if any, are recognized as “Borrowings” on the Statement of Assets and Liabilities, where applicable.
Inter-Fund Borrowing and Lending
The SEC has granted an exemptive order permitting registered open-end and closed-end Nuveen funds to participate in an inter-fund lending facility whereby the Nuveen funds may directly lend to and borrow money from each other for temporary purposes (e.g., to satisfy redemption requests or when a sale of securities “fails,” resulting in an unanticipated cash shortfall) (the “Inter-Fund Program”). The closed-end Nuveen funds, including the Funds covered by this shareholder report, will participate only as lenders, and not as borrowers, in the Inter-Fund Program because such closed-end
78
funds rarely, if ever, need to borrow cash to meet redemptions. The Inter-Fund Program is subject to a number of conditions, including, among other things, the requirements that (1) no fund may borrow or lend money through the Inter-Fund Program unless it receives a more favorable interest rate than is typically available from a bank or other financial institution for a comparable transaction; (2) no fund may borrow on an unsecured basis through the Inter-Fund Program unless the fund’s outstanding borrowings from all sources immediately after the inter-fund borrowing total 10% or less of its total assets; provided that if the borrowing fund has a secured borrowing outstanding from any other lender, including but not limited to another fund, the inter-fund loan must be secured on at least an equal priority basis with at least an equivalent percentage of collateral to loan value; (3) if a fund’s total outstanding borrowings immediately after an inter-fund borrowing would be greater than 10% of its total assets, the fund may borrow through the interfund loan on a secured basis only; (4) no fund may lend money if the loan would cause its aggregate outstanding loans through the Inter-Fund Program to exceed 15% of its net assets at the time of the loan; (5) a fund’s inter-fund loans to any one fund shall not exceed 5% of the lending fund’s net assets; (6) the duration of inter-fund loans will be limited to the time required to receive payment for securities sold, but in no event more than seven days; and (7) each inter-fund loan may be called on one business day’s notice by a lending fund and may be repaid on any day by a borrowing fund. In addition, a Nuveen fund may participate in the Inter-Fund Program only if and to the extent that such participation is consistent with the fund’s investment objective and investment policies. The Board is responsible for overseeing the Inter-Fund Program.
The limitations detailed above and the other conditions of the SEC exemptive order permitting the Inter-Fund Program are designed to minimize the risks associated with Inter-Fund Program for both the lending fund and the borrowing fund. However, no borrowing or lending activity is without risk. When a fund borrows money from another fund, there is a risk that the loan could be called on one day’s notice or not renewed, in which case the fund may have to borrow from a bank at a higher rate or take other actions to payoff such loan if an inter-fund loan is not available from another fund. Any delay in repayment to a lending fund could result in a lost investment opportunity or additional borrowing costs.
During the current reporting period, none of the Funds covered by this shareholder report have entered into any inter-fund loan activity.
79
Risk Considerations (Unaudited)
Fund common shares are not guaranteed or endorsed by any bank or other insured depository institution, and are not federally insured by the Federal Deposit Insurance Corporation.
Nuveen California Quality Municipal Income Fund (NAC)
Investing in closed-end funds involves risk; principal loss is possible. There is no guarantee the Fund’s investment objectives will be achieved. Closed-end fund shares may frequently trade at a discount or premium to their net asset value. Debt or fixed income securities such as those held by the Fund, are subject to market risk, credit risk, interest rate risk, derivatives risk, liquidity risk, and income risk. As interest rates rise, bond prices fall. Leverage increases return volatility and magnifies the Fund’s potential return and its risks; there is no guarantee a fund’s leverage strategy will be successful. State concentration makes the Fund more susceptible to local adverse economic, political, or regulatory changes affecting municipal bond issuers. These and other risk considerations such as inverse floater risk and tax risk are described in more detail on the Fund’s web page at www.nuveen.com/NAC.
Nuveen California AMT-Free Quality Municipal Income Fund (NKX)
Investing in closed-end funds involves risk; principal loss is possible. There is no guarantee the Fund’s investment objectives will be achieved. Closed-end fund shares may frequently trade at a discount or premium to their net asset value. Debt or fixed income securities such as those held by the Fund, are subject to market risk, credit risk, interest rate risk, derivatives risk, liquidity risk, and income risk. As interest rates rise, bond prices fall. Leverage increases return volatility and magnifies the Fund’s potential return and its risks; there is no guarantee a fund’s leverage strategy will be successful. State concentration makes the Fund more susceptible to local adverse economic, political, or regulatory changes affecting municipal bond issuers. These and other risk considerations such as inverse floater risk and tax risk are described in more detail on the Fund’s web page at www.nuveen.com/NKX.
Nuveen California Municipal Value Fund, Inc. (NCA)
Investing in closed-end funds involves risk; principal loss is possible. There is no guarantee the Fund’s investment objectives will be achieved. Closed-end fund shares may frequently trade at a discount or premium to their net asset value. Debt or fixed income securities such as those held by the Fund, are subject to market risk, credit risk, interest rate risk, derivatives risk, liquidity risk, and income risk. As interest rates rise, bond prices fall. State concentration makes the Fund more susceptible to local adverse economic, political, or regulatory changes affecting municipal bond issuers. These and other risk considerations such as tax risk are described in more detail on the Fund’s web page at www.nuveen.com/NCA.
Nuveen California Select Tax-Free Income Portfolio (NXC)
Investing in closed-end funds involves risk; principal loss is possible. There is no guarantee the Fund’s investment objectives will be achieved. Closed-end fund shares may frequently trade at a discount or premium to their net asset value. Debt or fixed income securities such as those held by the Fund, are subject to market risk, credit risk, interest rate risk, derivatives risk, liquidity risk, and income risk. As interest rates rise, bond prices fall. State concentration makes the Fund more susceptible to local adverse economic, political, or regulatory changes affecting municipal bond issuers. These and other risk considerations such as tax risk are described in more detail on the Fund’s web page at www.nuveen.com/NXC.
80
Additional Fund Information (Unaudited)
| Board of Trustees | | | | | |
| Jack B. Evans | William C. Hunter | Amy B.R. Lancellotta | Joanne T. Medero | Albin F. Moschner | John K. Nelson |
| Judith M. Stockdale | Carole E. Stone | Mathew Thornton III | Terence J. Toth | Margaret L. Wolff | Robert L. Young |
| Investment Adviser | Custodian | Legal Counsel | Independent Registered | Transfer Agent and |
| Nuveen Fund Advisors, LLC | State Street Bank | Chapman and Cutler LLP | Public Accounting Firm | Shareholder Services |
| 333 West Wacker Drive | & Trust Company | Chicago, IL 60603 | KPMG LLP | Computershare Trust |
| Chicago, IL 60606 | One Lincoln Street | | 200 East Randolph Street | Company, N.A. |
| | Boston, MA 02111 | | Chicago, IL 60601 | 150 Royall Street |
| | | | | Canton, MA 02021 |
| | | | | (800) 257-8787 |
Portfolio of Investments Information
Each Fund is required to file its complete schedule of portfolio holdings with the Securities and Exchange Commission (SEC) for the first and third quarters of each fiscal year as an exhibit to its report on Form N-PORT. You may obtain this information on the SEC’s Website at http://www.sec.gov.
Nuveen Funds’ Proxy Voting Information
You may obtain (i) information regarding how each fund voted proxies relating to portfolio securities held during the most recent twelve-month period ended June 30, without charge, upon request, by calling Nuveen toll-free at (800) 257-8787 or on Nuveen’s website at www.nuveen.com and (ii) a description of the policies and procedures that each fund used to determine how to vote proxies relating to portfolio securities without charge, upon request, by calling Nuveen toll free at (800) 257-8787. You may also obtain this information directly from the SEC. Visit the SEC on-line at http://www.sec.gov.
CEO Certification Disclosure
Each Fund’s Chief Executive Officer (CEO) has submitted to the New York Stock Exchange (NYSE) the annual CEO certification as required by Section 303A.12(a) of the NYSE Listed Company Manual. Each Fund has filed with the SEC the certification of its CEO and Chief Financial Officer required by Section 302 of the Sarbanes – Oxley Act.
Common Share Repurchases
Each Fund intends to repurchase, through its open-market share repurchase program, shares of its own common stock at such times and in such amounts as is deemed advisable. During the period covered by this report, each Fund repurchased shares of its common stock as shown in the accompanying table. Any future repurchases will be reported to shareholders in the next annual or semi-annual report.
| | NAC | NKX | NCA | NXC |
| Common shares repurchased | 0 | 0 | 0 | 0 |
FINRA BrokerCheck
The Financial Industry Regulatory Authority (FINRA) provides information regarding the disciplinary history of FINRA member firms and associated investment professionals. This information as well as an investor brochure describing FINRA BrokerCheck is available to the public by calling the FINRA BrokerCheck Hotline number at (800) 289-9999 or by visiting www.FINRA.org.
81
Glossary of Terms Used in this Report (Unaudited)
| ■ | | Average Annual Total Return: This is a commonly used method to express an investment’s performance over a particular, usually multi-year time period. It expresses the return that would have been necessary each year to equal the investment’s actual cumulative performance (including change in NAV or market price and reinvested dividends and capital gains distributions, if any) over the time period being considered. |
| ■ | | Effective Leverage: Effective leverage is a fund’s effective economic leverage, and includes both regulatory leverage (see leverage) and the leverage effects of certain derivative investments in the fund’s portfolio. Currently, the leverage effects of Tender Option Bond (TOB) inverse floater holdings are included in effective leverage values, in addition to any regulatory leverage. |
| ■ | | Inverse Floating Rate Securities: Inverse floating rate securities, also known as inverse floaters or tender option bonds (TOBs), are created by depositing a municipal bond, typically with a fixed interest rate, into a special purpose trust. This trust, in turn, (a) issues floating rate certificates typically paying short-term tax-exempt interest rates to third parties in amounts equal to some fraction of the deposited bond’s par amount or market value, and (b) issues an inverse floating rate certificate (sometimes referred to as an “inverse floater”) to an investor (such as a Fund) interested in gaining investment exposure to a long-term municipal bond. The income received by the holder of the inverse floater varies inversely with the short-term rate paid to the floating rate certificates’ holders, and in most circumstances the holder of the inverse floater bears substantially all of the underlying bond’s downside investment risk. The holder of the inverse floater typically also benefits disproportionately from any potential appreciation of the underlying bond’s value. Hence, an inverse floater essentially represents an investment in the underlying bond on a leveraged basis. |
| ■ | | Leverage: Leverage is created whenever a fund has investment exposure (both reward and/or risk) equivalent to more than 100% of the investment capital. |
| ■ | | Net Asset Value (NAV) Per Share: A fund’s Net Assets is equal to its total assets (securities, cash, accrued earnings and receivables) less its total liabilities. NAV per share is equal to the fund’s Net Assets divided by its number of shares outstanding. |
| ■ | | Pre-Refunded Bond/Pre-Refunding: Pre-Refunded Bond/Pre-Refunding, also known as advanced refundings or refinancings, is a procedure used by state and local governments to refinance municipal bonds to lower interest expenses. The issuer sells new bonds with a lower yield and uses the proceeds to buy U.S. Treasury securities, the interest from which is used to make payments on the higher yielding bonds. Because of this collateral, pre-refunding generally raises a bond’s credit rating and thus its value. |
| ■ | | Regulatory Leverage: Regulatory leverage consists of preferred shares issued by or borrowings of a fund. Both of these are part of a fund’s capital structure. Regulatory leverage is subject to asset coverage limits set in the Investment Company Act of 1940. |
| ■ | | S&P Municipal Bond California Index: An index designed to measure the performance of the tax-exempt California municipal bond market. Index returns assume reinvestment of distributions, but do not reflect any applicable sales charges or management fees. |
| ■ | | S&P Municipal Bond Index: An index designed to measure the performance of the tax-exempt U.S. municipal bond market. Index returns assume reinvestment of distributions, but do not reflect any applicable sales charges or management fees. |
| ■ | | Tax Obligation/General Bonds: Bonds backed by the general revenues of an issuer, including taxes, where the issuer has the ability to increase taxes by an unlimited amount to pay the bonds back. |
82
| ■ | | Tax Obligation/Limited Bonds: Bonds backed by the general revenues of an issuer, including taxes, where the issuer doesn't have the ability to increase taxes by an unlimited amount to pay the bonds back. |
| ■ | | Total Investment Exposure: Total investment exposure is a fund’s assets managed by the Adviser that are attributable to financial leverage. For these purposes, financial leverage includes a fund’s use of preferred stock and borrowings and investments in the residual interest certificates (also called inverse floating rate securities) in tender option bond (TOB) trusts, including the portion of assets held by a TOB trust that has been effectively financed by the trust’s issuance of floating rate securities. |
83
Annual Investment Management Agreement Approval Process (Unaudited)
At a meeting held on May 23-25, 2022 (the “May Meeting”), the Boards of Trustees (collectively, the “Board” and each Trustee, a “Board Member”) of the Funds, which are comprised entirely of Board Members who are not “interested persons” (as defined under the Investment Company Act of 1940 (the “1940 Act”)) (the “Independent Board Members”), approved, for their respective Fund, the renewal of the management agreement (each, an “Investment Management Agreement”) with Nuveen Fund Advisors, LLC (the “Adviser”) pursuant to which the Adviser serves as investment adviser to such Fund and the sub-advisory agreement (each, a “Sub-Advisory Agreement”) with Nuveen Asset Management, LLC (the “Sub-Adviser”) pursuant to which the Sub-Adviser serves as the sub-adviser to such Fund for an additional one-year term. As the Board is comprised of all Independent Board Members, the references to the Board and the Independent Board Members are interchangeable.
Following up to an initial two-year period, the Board considers the renewal of each Investment Management Agreement and Sub-Advisory Agreement on behalf of the applicable Fund on an annual basis. The Investment Management Agreements and Sub-Advisory Agreements are collectively referred to as the “Advisory Agreements,” and the Adviser and the Sub-Adviser are collectively, the “Fund Advisers” and each, a “Fund Adviser.” The Board has established various standing committees composed of various Independent Board Members that are assigned specific responsibilities to enhance the effectiveness of the Board’s oversight and decision making. Throughout the year, the Board and its committees meet regularly and, at these meetings, receive regular and/or special reports that cover an extensive array of topics and information that are relevant to the Board’s annual consideration of the renewal of the advisory agreements for the Nuveen funds. Such information may address, among other things, fund performance and risk information; the Adviser’s strategic plans; product initiatives for various funds; the review of the funds and investment teams; compliance, regulatory and risk management matters; the trading practices of the various sub-advisers to the Nuveen funds; management of distributions; valuation of securities; fund expenses; securities lending; liquidity management; overall market and regulatory developments; and with respect to closed-end funds, capital management initiatives, institutional ownership, management of leverage financing and the secondary market trading of the closed-end funds and any actions to address discounts. The Board also seeks to meet periodically with the Nuveen funds’ sub-advisers and/or portfolio teams, when feasible. The Board further meets, among other things, to specifically consider the annual renewal of the advisory agreements for the Nuveen funds.
In connection with its annual consideration of the advisory agreements for the Nuveen funds, the Board, through its independent legal counsel, requested and received extensive materials and information prepared specifically for its review of such advisory agreements by the Adviser and by Broadridge Financial Solutions, Inc. (“Broadridge”), an independent provider of investment company data. The materials cover a wide range of topics including, but not limited to, a description of the nature, extent and quality of services provided by the Fund Advisers; a review of product actions taken during 2021 (such as mergers, liquidations, fund launches, changes to investment teams, and changes to investment policies); a review of each sub-adviser to the Nuveen funds and/or the applicable investment teams; an analysis of fund performance in absolute terms and as compared to the performance of certain peer funds and benchmarks with a focus on any performance outliers; an analysis of the fees and expense ratios of the Nuveen funds in absolute terms and as compared to those of certain peer funds with a focus on any expense outliers; a review of management fee schedules; a description of portfolio manager compensation; an overview of the secondary market trading of shares of the Nuveen closed-end funds (including, among other things, an analysis of secondary market performance and commentary regarding the leverage management, share repurchase and shelf offering programs of Nuveen closed-end funds); a review of the performance of various service providers; a description of various initiatives Nuveen had undertaken or continued in 2021 and 2022 for the benefit of particular fund(s) and/or the complex; a description of the profitability or financial data of Nuveen and the sub-advisers to the Nuveen funds; and a description of indirect benefits received by the Adviser and the sub-advisers as a result of their relationships with the Nuveen funds. The information prepared specifically for the annual review supplemented the information provided to the Board and its committees and the evaluations of the Nuveen funds by the Board and its committees during the year.
84
The Board’s review of the advisory agreements for the Nuveen funds is based on all the information provided to the Board and its committees throughout the year as well as the information prepared specifically with respect to the annual review of such advisory agreements.
In continuing its practice, the Board met prior to the May Meeting to begin its considerations of the renewal of the Advisory Agreements. Accordingly, on April 13-14, 2022 (the “April Meeting”), the Board met to review and discuss, in part, the performance of the Nuveen funds and the Adviser’s evaluation of each sub-adviser to the Nuveen funds and/or its investment teams. At the April Meeting, the Board Members asked questions and requested additional information that was provided for the May Meeting.
The Independent Board Members considered the review of the advisory agreements for the Nuveen funds to be an ongoing process and employed the accumulated information, knowledge and experience the Board Members had gained during their tenure on the boards governing the Nuveen funds and working with the Adviser and sub-advisers in their review of the advisory agreements. The contractual arrangements are a result of multiple years of review, negotiation and information provided in connection with the boards’ annual review of the Nuveen funds’ advisory arrangements and oversight of the Nuveen funds.
The Independent Board Members were advised by independent legal counsel during the annual review process as well as throughout the year, including meeting in executive sessions with such counsel at which no representatives from the Adviser or the Sub-Adviser were present. In connection with their annual review, the Independent Board Members also received a memorandum from independent legal counsel outlining their fiduciary duties and legal standards in reviewing the Advisory Agreements, including guidance from court cases evaluating advisory fees.
The Board’s decision to renew the Advisory Agreements was not based on a single identified factor, but rather the decision reflected the comprehensive consideration of all the information provided to the Board and its committees throughout the year as well as the materials prepared specifically in connection with the renewal process. Each Board Member may have attributed different levels of importance to the various factors and information considered in connection with the approval process and may place different emphasis on the relevant information year to year in light of, among other things, changing market and economic conditions. A summary of the principal factors and information, but not all the factors, the Board considered in deciding to renew the Advisory Agreements is set forth below.
A. Nature, Extent and Quality of Services
In evaluating the renewal of the Advisory Agreements, the Independent Board Members received and considered information regarding the nature, extent and quality of the applicable Fund Adviser’s services provided to the respective Fund with particular focus on the services and enhancements to such services provided during the last year. The Independent Board Members considered the Investment Management Agreements and the Sub-Advisory Agreements separately in the course of their review. With this approach, they considered the respective roles of the Adviser and the Sub-Adviser in providing services to the Funds.
The Board recognized that the Nuveen funds operate in a highly regulated industry and, therefore, the Adviser has provided a wide array of management, oversight and administrative services to manage and operate the funds, and the scope and complexity of these services have expanded over time as a result of, among other things, regulatory, market and other developments. The Board accordingly considered the Adviser’s dedication of extensive resources, time, people and capital employed to support and manage the Nuveen funds as well as the Adviser’s continued program of developing improvements and innovations for the benefit of the funds and shareholders and to meet the ever increasing regulatory requirements applicable to the funds. In this regard, the Board received and reviewed information regarding, among other things, the Adviser’s investment oversight responsibilities, regulatory and compliance services, administrative duties and other services. The Board considered the Adviser’s investment oversight team’s extensive services in overseeing the various sub-advisers to the Nuveen funds; evaluating fund performance; and preparing reports to the Board addressing, among other things, fund performance, market conditions, investment team matters, product developments and management proposals. The Board further recognized the range of services the various teams of the Adviser provided including, but not limited to, overseeing operational and risk
85
Annual Investment Management Agreement Approval Process (Unaudited) (continued)
management; managing liquidity; overseeing the daily valuation process; and managing distributions in seeking to deliver long-term fund earnings to shareholders consistent with the respective Nuveen fund’s product design and positioning. The Board also considered the structure of investment personnel compensation of each Fund Adviser and whether the structure provides appropriate incentives to attract and maintain qualified personnel and to act in the best interests of the respective Nuveen fund.
The Board further recognized that the Adviser’s compliance and regulatory functions were integral to the investment management of the Nuveen funds. The Board recognized such services included, but were not limited to, managing compliance policies; monitoring compliance with applicable policies, law and regulations; devising internal compliance programs and a framework to review and assess compliance programs; overseeing sub-adviser compliance testing; preparing compliance training materials; and responding to regulatory requests. The Board further considered information regarding the Adviser’s business continuity and disaster recovery plans as well as information regarding its information security program, including presentations of such program provided at a site visit in 2022, to help identify and manage information security risks.
In addition to the above functions, the Board considered that the Adviser also provides, among other things, fund administration services (such as preparing fund tax returns and other tax compliance services; preparing regulatory filings; interacting with the Nuveen funds’ independent public accountants and overseeing other service providers; and managing fund budgets and expenses); product management services (such as evaluating and enhancing products and strategies); legal services (such as helping to prepare and file registration statements and proxy statements; overseeing fund activities and providing legal interpretations regarding such activities; maintaining regulatory registrations and negotiating agreements with other fund service providers; and monitoring changes in regulatory requirements and commenting on rule proposals impacting investment companies); oversight of shareholder services and transfer agency functions (such as overseeing transfer agent service providers which include registered shareholder customer service and transaction processing; overseeing proxy solicitation and tabulation services; and overseeing the production and distribution of financial reports by service providers); and with respect to the Nuveen closed-end funds, managing leverage, monitoring asset coverage and seeking to promote an orderly secondary market.
The Board also considered the quality of support services and communications the Adviser provided the Board, including, in part, organizing and administrating Board meetings and supporting Board committees; preparing regular and ad hoc reports on fund performance, market conditions and investment team matters; providing due diligence reports addressing product development and management proposals; and coordinating site visits of the Board and presentations by investment teams and senior management.
In addition to the services provided, the Board considered the financial resources of the Adviser and its affiliates and their willingness to make investments in the technology, personnel and infrastructure to support the Nuveen funds, including maintaining a seed capital budget to support new or existing funds and/or facilitate changes for a respective fund. Further, the Board noted the benefits to shareholders of investing in a fund that is a part of a large fund complex with a variety of investment disciplines, capabilities, expertise and resources available to navigate and support the Nuveen funds including during stressed times. The Board recognized the overall reputation and capabilities of the Adviser and its affiliates, the Adviser’s continuing commitment to provide high quality services, its willingness to implement operational or organizational changes in seeking, among other things, to enhance efficiencies and services to the Nuveen funds and its responsiveness to the Board’s questions and/or concerns raised throughout the year and during the annual review of advisory agreements. The Board also considered the significant risks borne by the Adviser and its affiliates in connection with their services to the Nuveen funds, including entrepreneurial risks in sponsoring new funds and ongoing risks with managing the funds such as investment, operational, reputational, regulatory, compliance and litigation risks.
In evaluating services, the Board reviewed various highlights of the initiatives the Adviser and its affiliates have undertaken or continued in 2021 and 2022 to benefit the Nuveen complex and/or particular Nuveen funds and meet the requirements of an increasingly complex regulatory environment including, but not limited to:
86
| • | | Centralization of Functions – ongoing initiatives to centralize investment leadership and create a more cohesive market approach and centralized shared support model (including through the consolidation of certain affiliated sub-advisers) in seeking to operate more effectively and enhance the research capabilities and services to the Nuveen funds; |
| • | | Fund Improvements and Product Management Initiatives – continuing to proactively manage the Nuveen fund complex as a whole and at the individual fund level with an aim to continually improve product platforms and investment strategies to better serve shareholders through, among other things, rationalizing the product line and gaining efficiencies through mergers, repositionings and liquidations; launching new funds; reviewing and updating investment policies and benchmarks; soft closing certain funds; modifying the conversion periods on certain share classes; and evaluating and adjusting portfolio management teams as appropriate for various funds; |
| • | | Capital Initiatives – continuing to invest capital to support new Nuveen funds with initial capital as well as to support existing funds; |
| • | | Compliance Program Initiatives – continuing efforts to mitigate compliance risk with a focus on environmental, social and governance (“ESG”) controls and processes, increase operating efficiencies, implement enhancements to strengthen ongoing execution of key compliance program elements, support international business growth and facilitate integration of Nuveen’s operating model; |
| • | | Investment Oversight – preparing reports to the Board addressing, among other things, fund performance; market conditions; investment team matters; product developments; changes to mandates, policies and benchmarks; and other management proposals as well as preparing and coordinating investment presentations to the Board; |
| • | | Risk Management and Valuation Services – continuing to oversee and manage risk including, among other things, conducting ongoing calculations and monitoring of risk measures across the Nuveen funds, instituting investment risk controls, providing risk reporting throughout Nuveen, participating in internal oversight committees, dedicating the resources and time to develop the processes necessary to help address fund compliance with the new derivatives rule and continuing to implement an operational risk framework that seeks to provide greater transparency of operational risk matters across the complex as well as provide multiple other risk programs that seek to provide a more disciplined and consistent approach to identifying and mitigating Nuveen’s operational risks. Further, the securities valuation team continues, among other things, to oversee the daily valuation process of the portfolio securities of the funds, maintain the valuation policies and procedures, facilitate valuation committee meetings, manage relationships with pricing vendors, prepare relevant valuation reports and design methods to simplify and enhance valuation workflow within the organization and implement processes and procedures to help address compliance with the new valuation rule applicable to the funds; |
| • | | Regulatory Matters – continuing efforts to monitor regulatory trends and advocate on behalf of Nuveen and/or the Nuveen funds, to implement and comply with new or revised rules and mandates and to respond to regulatory inquiries and exams; |
| • | | Government Relations – continuing efforts of various Nuveen teams and Nuveen’s affiliates to develop policy positions on a broad range of issues that may impact the Nuveen funds, advocate and communicate these positions to lawmakers and other regulatory authorities and work with trade associations to ensure these positions are represented; |
| • | | Business Continuity, Disaster Recovery and Information Security – continuing efforts of Nuveen to periodically test and update business continuity and disaster recovery plans and, together with its affiliates, to maintain an information security program that seeks to identify and manage information security risks, and provide reports to the Board, at least annually, addressing, among other things, management’s security risk assessment, cyber risk profile, potential impact of new or revised laws and regulations, incident tracking and other relevant information technology risk-related reports; |
| • | | Distribution Management Services – continuing to manage the distributions among the varying types of Nuveen funds within the Nuveen complex to be consistent with the respective fund’s product design and positioning in striving to deliver those earnings to shareholders in a relatively consistent manner over time as well as assisting in the development of new products or the restructuring of existing funds; and |
87
Annual Investment Management Agreement Approval Process (Unaudited) (continued)
| • | | with respect specifically to closed-end funds, such continuing services also included: |
| •• | | Leverage Management Services – continuing to actively manage the various forms of leverage utilized across the complex, including through committing resources and focusing on sourcing/structure development and bank provider management; |
| •• | | Capital Management, Market Intelligence and Secondary Market Services – ongoing capital management efforts which may include at times shelf offerings, tender offers, capital return programs and share repurchases as well as providing market data analysis to help understand closed-end fund ownership cycles and their impact on secondary market trading as well as to improve proxy solicitation efforts; and |
| •• | | Closed-end Fund Investor Relations Program – maintaining the closed-end fund investor relations program which, among other things, raises awareness, provides educational materials and cultivates advocacy for closed-end funds and the Nuveen closed-end fund product line. |
The Board further considered the division of responsibilities between the Adviser and the Sub-Adviser and recognized that the Sub-Adviser and its investment personnel generally are responsible for the management of each Fund’s portfolio under the oversight of the Adviser and the Board. The Board considered an analysis of the Sub-Adviser provided by the Adviser which included, among other things, the assets under management of the applicable investment team and changes thereto, a summary of the applicable investment team and changes thereto, the investment process and philosophy of the applicable investment team, the performance of the Nuveen funds sub-advised by the Sub-Adviser over various periods of time and a summary of any significant policy and/or other changes to the Nuveen funds sub-advised by the Sub-Adviser. The Board further considered at the May Meeting or prior meetings evaluations of the Sub-Adviser’s compliance programs and trade execution. The Board noted that the Adviser recommended the renewal of the Sub-Advisory Agreements.
Based on its review, the Board determined, in the exercise of its reasonable business judgment, that it was satisfied with the nature, extent and quality of services provided to the respective Funds under each applicable Advisory Agreement.
B. The Investment Performance of the Funds and Fund Advisers
In evaluating the quality of the services provided by the Fund Advisers, the Board also received and considered a variety of investment performance data of the Nuveen funds they advise. In evaluating performance, the Board recognized that performance data may differ significantly depending on the ending date selected, particularly during periods of market volatility, and therefore considered the broader perspective of performance over a variety of time periods that may include full market cycles. In this regard, the Board reviewed, among other things, Fund performance over the quarter, one-, three- and five-year periods ending December 31, 2021 and March 31, 2022. The performance data prepared for the annual review of the advisory agreements for the Nuveen funds supplemented the fund performance data that the Board received throughout the year at its meetings representing differing time periods. In its review, the Board took into account the discussions with representatives of the Adviser; the Adviser’s analysis regarding fund performance that occurred at these Board meetings with particular focus on funds that were considered performance outliers (both overperformance and underperformance); the factors contributing to the performance; and any recommendations or steps taken to address performance concerns. Regardless of the time period reviewed by the Board, the Board recognized that shareholders may evaluate performance based on their own holding periods which may differ from the periods reviewed by the Board and lead to differing results.
In its review, the Board reviewed both absolute and relative fund performance during the annual review over the various time periods. With respect to the latter, the Board considered fund performance in comparison to the performance of peer funds (the “Performance Peer Group”) and recognized and/or customized benchmarks (i.e., generally benchmarks derived from multiple recognized benchmarks). For Nuveen funds that had changes in portfolio managers or other significant changes to their investment strategies or policies since March 2019, the Board reviewed certain tracking performance data comparing the
88
performance of such funds before and after such changes. In considering performance data, the Board is aware of certain inherent limitations with such data, including that differences between the objective(s), strategies and other characteristics of the Nuveen funds compared to the respective Performance Peer Group and/or benchmark(s); differences in the composition of the Performance Peer Group over time; and differences in the types and/or levels of any leverage and related costs with that of the Performance Peer Group would all necessarily contribute to differences in performance results and limit the value of the comparative information. Further, the Board recognized the inherent limitations in comparing the performance of an actively managed fund to a benchmark index due to the fund’s pursuit of an investment strategy that does not directly follow the index. To assist the Board in its review of the comparability of the relative performance, the Adviser has ranked the relevancy of the peer group to the Funds as low, medium or high.
The Board also evaluated performance in light of various relevant factors which may include, among other things, general market conditions, issuer-specific information, asset class information, leverage and fund cash flows. In relation to general market conditions, the Board had recognized the recent periods in 2022 of general market volatility and underperformance. In their review from year to year, the Board Members consider and may place different emphasis on the relevant information in light of changing circumstances in market and economic conditions. Further, the Board recognized that the market and economic conditions may significantly impact a fund’s performance, particularly over shorter periods, and such performance may be more reflective of such economic or market events and not necessarily reflective of management skill. Accordingly, depending on the facts and circumstances including any differences between the respective Nuveen fund and its benchmark and/or Performance Peer Group, the Board may be satisfied with a fund’s performance notwithstanding that its performance may be below that of its benchmark or peer group for certain periods. However, with respect to any Nuveen funds for which the Board has identified performance issues, the Board monitors such funds closely until performance improves, discusses with the Adviser the reasons for such results, considers whether any steps are necessary or appropriate to address such issues, and reviews the results of any steps undertaken.
The secondary market trading of shares of the Nuveen closed-end funds also continues to be a priority for the Board given its importance to shareholders, and therefore the Board and/or its Closed-end Fund committee reviews certain performance data reflecting, among other things, the premiums and discounts at which the shares of the closed-end funds have traded over specified periods throughout the year. In its review, the Board considers, among other things, changes to investment mandates and guidelines, distribution policies, leverage levels and types; share repurchases and similar capital market actions; and effective communications programs to build greater awareness and deepen understanding of closed-end funds.
The Board’s determinations with respect to each Fund are summarized below.
For Nuveen California Quality Municipal Income Fund (the “California Quality Fund”), the Board noted that the Fund outperformed its benchmark for the one-, three-, and five-year periods ended December 31, 2021 and ranked in the third quartile of its Performance Peer Group for the one-year period and second quartile for the three- and five-year periods ended December 31, 2021. Although the Fund’s performance was below the performance of its benchmark for the one- and three-year periods ended March 31, 2022, the Fund outperformed its benchmark for the five-year period ended March 31, 2022 and ranked in the third quartile of its Performance Peer Group for the one- and three-year periods ended March 31, 2022 and the second quartile for the five-year period ended March 31, 2022. Based on its review, the Board was generally satisfied with the Fund’s overall performance.
For Nuveen California AMT-Free Quality Municipal Income Fund (the “California AMT-Free Quality Fund”), the Board noted that the Fund outperformed its benchmark for the one-, three- and five year periods ended December 31, 2021 and ranked in the third quartile of its Performance Peer Group for the one-year period and first quartile for the three- and five-year periods ended December 31, 2021. Although the Fund’s performance was below the performance of its benchmark for the one-year period ended March 31, 2022, the Fund outperformed its benchmark for the three- and five-year periods ended March 31, 2022 and
89
Annual Investment Management Agreement Approval Process (Unaudited) (continued)
ranked in the third quartile of its Performance Peer Group for the one-year period and first quartile for the three- and five-year periods ended March 31, 2022. Based on its review, the Board was generally satisfied with the Fund’s overall performance.
For Nuveen California Municipal Value Fund (the “California Municipal Value Fund”), the Board noted that although the Fund ranked in the fourth quartile of its Performance Peer Group for the one-, three- and five-year periods ended December 31, 2021, the Fund outperformed its benchmark for such periods. Further, although the Fund’s performance was below the performance of its benchmark for the one-year period ended March 31, 2022, the Fund outperformed its benchmark for the three- and five-year periods ended March 31, 2022 and ranked in the first quartile of its Performance Peer Group for the one-year period, second quartile for the three-year period and third quartile for the five-year period ended March 31, 2022. In its review, the Board recognized that the Performance Peer Group was classified as low for relevancy. Based on its review, the Board was generally satisfied with the Fund’s overall performance.
For Nuveen California Select Tax-Free Income Portfolio (the “California Select Fund”), the Board noted that although the Fund ranked in the fourth quartile of its Performance Peer Group for the one-, three- and five-year periods ended December 31, 2021, the Fund outperformed its benchmark for such periods. Further, although the Fund’s performance was below the performance of its benchmark for the one-year period ended March 31, 2022, the Fund outperformed its benchmark for the three- and five-year periods ended March 31, 2022 and ranked in the first quartile of its Performance Peer Group for the one-and three-year periods and second quartile for the five-year period ended March 31, 2022. In its review, the Board recognized that the Performance Peer Group was classified as low for relevancy. Based on its review, the Board was generally satisfied with the Fund’s overall performance.
C. Fees, Expenses and Profitability
1. Fees and Expenses
As part of its annual review, the Board considered the contractual management fee and net management fee (the management fee after taking into consideration fee waivers and/or expense reimbursements, if any) paid by a Nuveen fund to the Adviser in light of the nature, extent and quality of the services provided. The Board also considered the total operating expense ratio of a fund before and after any fee waivers and/or expense reimbursements. More specifically, the Independent Board Members reviewed, among other things, each fund’s gross and net management fee rates (i.e., before and after expense reimbursements and/or fee waivers, if any) and net total expense ratio in relation to those of a comparable universe of funds (the “Peer Universe”) established by Broadridge (subject to certain exceptions). The Independent Board Members reviewed the methodology Broadridge employed to establish its Peer Universe and recognized that differences between the applicable fund and its respective Peer Universe as well as changes to the composition of the Peer Universe from year to year may limit some of the value of the comparative data. The Independent Board Members take these limitations and differences into account when reviewing comparative peer data. The Independent Board Members also considered a fund’s operating expense ratio as it more directly reflected the shareholder’s costs in investing in the respective fund.
In their review, the Independent Board Members considered, in particular, each fund with a net expense ratio (excluding investment-related costs of leverage) of six basis points or higher compared to that of its peer average (each, an “Expense Outlier Fund”) and an analysis as to the factors contributing to each such fund’s higher relative net expense ratio. In addition, although the Board reviewed a fund’s total net expenses both including and excluding investment-related expenses (i.e., leverage costs) for certain of the closed-end funds, the Board recognized that leverage expenses will vary across funds and in comparison to peers because of differences in the forms and terms of leverage employed by the respective fund. Accordingly, in reviewing the comparative data between a fund and its peers, the Board generally considered the fund’s net expense ratio and fees (excluding leverage costs and leveraged assets) to be higher if they were over 10 basis points higher, slightly higher if they were 6 to 10 basis points higher, in line if they were within approximately 5 basis points higher than the peer average and below if they were below the peer average of the Peer Universe. The Independent Board Members also considered, in relevant part, a fund’s net management fee and net total expense ratio in light of its performance history.
90
In their review of the fee arrangements for the Nuveen funds, the Independent Board Members considered the management fee schedules, including the complex-wide and fund-level breakpoint schedules, as applicable. The Board noted that across the Nuveen fund complex, the complex-wide fee breakpoints reduced fees by approximately $72.5 million and fund-level breakpoints reduced fees by approximately $89.1 million in 2021.
With respect to the Sub-Adviser, the Board also considered, among other things, the sub-advisory fee schedule paid to the Sub-Adviser in light of the sub-advisory services provided to the respective Fund and comparative data of the fees the Sub-Adviser charges to other clients, if any. In its review, the Board recognized that the compensation paid to the Sub-Adviser is the responsibility of the Adviser, not the Funds.
The Independent Board Members noted that (a) the California Quality Fund had a net management fee that was in line with the peer average and a net expense ratio that was below the peer average; (b) the California AMT-Free Quality Fund had a net management fee that was slightly higher than the peer average, but a net expense ratio that was in line with the peer average; and (c) the California Municipal Value Fund and the California Select Fund each had a net management fee and a net expense ratio that were below the respective peer averages.
Based on its review of the information provided, the Board determined that each Fund’s management fees (as applicable) to a Fund Adviser were reasonable in light of the nature, extent and quality of services provided to the Fund.
2. Comparisons with the Fees of Other Clients
In determining the appropriateness of fees, the Board also considered information regarding the fee rates the respective Fund Advisers charged to certain other types of clients and the type of services provided to these other clients. With respect to the Adviser and/or the Sub-Adviser, such other clients may include retail and institutional managed accounts, exchange-traded funds (“ETFs”) sub-advised by the Sub-Adviser that are offered by another fund complex, municipal managed accounts offered by an unaffiliated adviser and private limited partnerships offered by Nuveen. With respect to the Sub-Adviser, the Board reviewed, among other things, the fee range and average fee of municipal retail advisory accounts and municipal institutional accounts as well as the sub-advisory fee the Sub-Adviser received for serving as sub-adviser to certain ETFs offered outside the Nuveen family.
In considering the fee data of other clients, the Board recognized, among other things, that differences in the amount, type and level of services provided to the Nuveen funds relative to other types of clients as well as any differences in portfolio investment policies, the types of assets managed and related complexities in managing such assets, the entrepreneurial and other risks associated with a particular strategy, investor profiles, account sizes and regulatory requirements will contribute to the variations in the fee schedules. The Board recognized the breadth of services the Adviser had provided to the Nuveen funds compared to these other types of clients as the funds operate in a highly regulated industry with increasing regulatory requirements as well as the increased entrepreneurial, legal and regulatory risks that the Adviser incurs in sponsoring and managing the funds. In general, higher fee levels reflect higher levels of service provided by the Adviser, increased investment management complexity, greater product management requirements, and higher levels of business risk or some combination of these factors. The Board further considered that the Sub-Adviser’s fee is essentially for portfolio management services and therefore more comparable to the fees it receives for retail wrap accounts and other external sub-advisory mandates. The Board concluded the varying levels of fees were justified given, among other things, the inherent differences in the products and the level of services provided to the Nuveen funds versus other clients, the differing regulatory requirements and legal liabilities and the entrepreneurial, legal and regulatory risks incurred in sponsoring and advising a registered investment company.
3. Profitability of Fund Advisers
In their review, the Independent Board Members considered information regarding Nuveen’s level of profitability for its advisory services to the Nuveen funds for the calendar years 2021 and 2020. The Board reviewed, among other things, the net margins (pre-tax) for Nuveen Investments, Inc. (“Nuveen Investments”), the gross and net revenue margins (pre- and post-tax and excluding
91
Annual Investment Management Agreement Approval Process (Unaudited) (continued)
distribution) and the revenues, expenses and net income (pre- and post-tax and before distribution expenses) of Nuveen Investments from the Nuveen funds only; and comparative profitability data comparing the operating margins of Nuveen Investments compared to the adjusted operating margins of certain peers that had publicly available data and with the most comparable assets under management (based on asset size and asset composition) for each of the last two calendar years. The Board also reviewed the revenues, expenses and operating margin (pre- and post-tax) the Adviser derived from its ETF product line for the 2021 and 2020 calendar years.
In reviewing the profitability data, the Independent Board Members recognized the subjective nature of calculating profitability as the information is not audited and is dependent on cost allocation methodologies to allocate corporate-wide overhead/shared service expenses, TIAA (defined below) corporate-wide overhead expenses and partially fund related expenses to the Nuveen complex and its affiliates and to further allocate such expenses between the Nuveen fund and non-fund businesses. The Independent Board Members reviewed a description of the cost allocation methodologies employed to develop the financial information, a summary of the history of changes to the methodology over the years from 2010 to 2021, and the net revenue margins derived from the Nuveen funds (pre-tax and including and excluding distribution) and total company margins from Nuveen Investments compared to the firm-wide adjusted operating margins of the peers for each calendar year from 2012 to 2021.
The Board had also appointed four Independent Board Members to serve as the Board’s liaisons, with the assistance of independent counsel, to review the development of the profitability data and to report to the full Board. In its evaluation, the Board, however, recognized that other reasonable and valid allocation methodologies could be employed and could lead to significantly different results. The Independent Board Members also reviewed a summary of the key drivers that affected Nuveen’s revenues and expenses impacting profitability in 2021 versus 2020.
In reviewing the comparative peer data noted above, the Board considered that the operating margins of Nuveen Investments compared favorably to the peer group range of operating margins; however, the Independent Board Members also recognized the limitations of the comparative data given that peer data is not generally public and the calculation of profitability is subjective and affected by numerous factors (such as types of funds a peer manages, its business mix, its cost of capital, the numerous assumptions underlying the methodology used to allocate expenses and other factors) that can have a significant impact on the results.
Aside from Nuveen’s profitability, the Board recognized that the Adviser is a subsidiary of Nuveen, LLC, the investment management arm of Teachers Insurance and Annuity Association of America (“TIAA”). Accordingly, the Board also reviewed a balance sheet for TIAA reflecting its assets, liabilities and capital and contingency reserves for the 2021 and 2020 calendar years to consider the financial strength of TIAA. The Board recognized the benefit of an investment adviser and its parent with significant resources, particularly during periods of market volatility. The Board also noted the reinvestments Nuveen, its parent and/or other affiliates made into its business through, among other things, the investment of seed capital in certain Nuveen funds and continued investments in enhancements to technological capabilities.
In addition to Nuveen, the Independent Board Members considered the profitability of the Sub-Adviser from its relationships with the Nuveen funds. In this regard, the Independent Board Members reviewed, among other things, the Sub-Adviser’s revenues, expenses and net revenue margins (pre- and post-tax) for its advisory activities to the respective funds for the calendar years ended December 31, 2021 and December 31, 2020. The Independent Board Members also reviewed a profitability analysis reflecting the revenues, expenses and revenue margin (pre- and post-tax) by asset type for the Sub-Adviser for the calendar years ending December 31, 2021 and December 31, 2020 and the pre- and post-tax revenue margins from 2021 and 2020.
In evaluating the reasonableness of the compensation, the Independent Board Members also considered any other ancillary benefits derived by the respective Fund Adviser from its relationship with the Nuveen funds as discussed in further detail below.
Based on a consideration of all the information provided, the Board noted that Nuveen’s and the Sub-Adviser’s level of profitability was acceptable and not unreasonable in light of the services provided.
92
D. Economies of Scale and Whether Fee Levels Reflect These Economies of Scale
The Board considered whether there have been economies of scale with respect to the management of the Nuveen funds and whether these economies of scale have been appropriately shared with the funds. The Board recognized that although economies of scale are difficult to measure and certain expenses may not decline with a rise in assets, there are several methods to help share the benefits of economies of scale, including breakpoints in the management fee schedule, fee waivers and/or expense limitations, the pricing of Nuveen funds at scale at inception and investments in Nuveen’s business which can enhance the services provided to the funds for the fees paid. The Board noted that Nuveen generally has employed these various methods, and the Board considered the extent to which the Nuveen funds will benefit from economies of scale as their assets grow. In this regard, the Board recognized that the management fee of the Adviser is generally comprised of a fund-level component and a complex-level component each with its own breakpoint schedule, subject to certain exceptions. The Board reviewed the fund-level and complex-level fee schedules. The Board considered that the fund-level breakpoint schedules are designed to share economies of scale with shareholders if the particular fund grows, and the complex-level breakpoint schedule is designed to deliver the benefits of economies of scale to shareholders when the eligible assets in the complex pass certain thresholds even if the assets of a particular fund are unchanged or have declined. Further, with respect to the Nuveen closed-end funds, the Independent Board Members noted that, although such funds may from time to time make additional share offerings, the growth of their assets would occur primarily through the appreciation of such funds’ investment portfolios. As noted above, the Independent Board Members also recognized the continued reinvestment in Nuveen’s business.
Based on its review, the Board concluded that the current fee arrangements together with the reinvestment in Nuveen’s business appropriately shared any economies of scale with shareholders.
E. Indirect Benefits
The Independent Board Members received and considered information regarding other benefits the respective Fund Adviser or its affiliates may receive as a result of their relationship with the Nuveen funds. The Board considered the compensation that an affiliate of the Adviser received for serving as co-manager in the initial public offerings of new closed-end funds and for serving as an underwriter on shelf offerings of existing closed-end funds.
In addition, the Independent Board Members also noted that various sub-advisers (including the Sub-Adviser) may engage in soft dollar transactions pursuant to which they may receive the benefit of research products and other services provided by broker-dealers executing portfolio transactions on behalf of the applicable Nuveen funds. However, the Board noted that any benefits for the Sub-Adviser when transacting in fixed-income securities may be more limited as such securities generally trade on a principal basis and therefore do not generate brokerage commissions.
Based on its review, the Board concluded that any indirect benefits received by a Fund Adviser as a result of its relationship with the Funds were reasonable and within acceptable parameters.
F. Other Considerations
The Board Members did not identify any single factor discussed previously as all-important or controlling. The Board Members, including the Independent Board Members, concluded that the terms of each Advisory Agreement were reasonable, that the respective Fund Adviser’s fees were reasonable in light of the services provided to each Fund and that the Advisory Agreements be renewed.
93
Notes
94
Notes
95

Nuveen:
Serving Investors for Generations
Since 1898, financial professionals and their clients have relied on Nuveen to provide dependable investment solutions through continued adherence to proven, long-term investing principles. Today, we offer a range of high quality solutions designed to be integral components of a well-diversified core portfolio.
Focused on meeting investor needs.
Nuveen is the investment manager of TIAA. We have grown into one of the world’s premier global asset managers, with specialist knowledge across all major asset classes and particular strength in solutions that provide income for investors and that draw on our expertise in alternatives and responsible investing. Nuveen is driven not only by the independent investment processes across the firm, but also the insights, risk management, analytics and other tools and resources that a truly world-class platform provides. As a global asset manager, our mission is to work in partnership with our clients to create solutions which help them secure their financial future.
Find out how we can help you.
To learn more about how the products and services of Nuveen may be able to help you meet your financial goals, talk to your financial professional, or call us at (800) 257-8787. Please read the information provided carefully before you invest. Investors should consider the investment objective and policies, risk considerations, charges and expenses of any investment carefully. Where applicable, be sure to obtain a prospectus, which contains this and other relevant information. To obtain a prospectus, please contact your securities representative or Nuveen, 333 W. Wacker Dr., Chicago, IL 60606. Please read the prospectus carefully before you invest or send money.
Learn more about Nuveen Funds at: www.nuveen.com/closed-end funds
Nuveen Securities, LLC, member FINRA and SIPC | 333 West Wacker Drive Chicago, IL 60606 | www.nuveen.com

ESA-A-0822D 2452048-INV-B-10/23
ITEM 2. CODE OF ETHICS.
Not applicable to this filing.
ITEM 3. AUDIT COMMITTEE FINANCIAL EXPERT.
Not applicable to this filing.
ITEM 4. PRINCIPAL ACCOUNTANT FEES AND SERVICES.
Not applicable to this filing.
ITEM 5. AUDIT COMMITTEE OF LISTED REGISTRANTS.
Not applicable to this filing.
ITEM 6. SCHEDULE OF INVESTMENTS.
(a) See Portfolio of Investments in Item 1.
(b) Not applicable.
ITEM 7. DISCLOSURE OF PROXY VOTING POLICIES AND PROCEDURES FOR CLOSED-END MANAGEMENT INVESTMENT COMPANIES.
Not applicable to this filing.
ITEM 8. PORTFOLIO MANAGERS OF CLOSED-END MANAGEMENT INVESTMENT COMPANIES.
Not applicable to this filing.
ITEM 9. PURCHASES OF EQUITY SECURITIES BY CLOSED-END MANAGEMENT INVESTMENT COMPANY AND AFFILIATED PURCHASERS.
Not applicable.
ITEM 10. SUBMISSION OF MATTERS TO A VOTE OF SECURITY HOLDERS.
There have been no material changes to the procedures by which shareholders may recommend nominees to the registrant’s Board implemented after the registrant last provided disclosure in response to this Item.
ITEM 11. CONTROLS AND PROCEDURES.
(a) | The registrant’s principal executive and principal financial officers, or persons performing similar functions, have concluded that the registrant’s disclosure controls and procedures (as defined in Rule 30a-3(c) under the Investment Company Act of 1940, as amended (the “1940 Act”) (17 CFR 270.30a-3(c))) are effective, as of a date within 90 days of the filing date of this report that includes the disclosure required by this paragraph, based on their evaluation of the controls and procedures required by Rule 30a-3(b) under the 1940 Act (17 CFR 270.30a-3(b)) and Rules 13a-15(b) or 15d-15(b) under the Securities Exchange Act of 1934, as amended (the “Exchange Act”)(17 CFR 240.13a-15(b) or 240.15d-15(b)). |
(b) | There were no changes in the registrant’s internal control over financial reporting (as defined in Rule 30a-3(d) under the 1940 Act (17 CFR 270.30a-3(d)) that occurred during the period covered by this report that has materially affected, or is reasonably likely to materially affect, the registrant’s internal control over financial reporting. |
ITEM 12. DISCLOSURE OF SECURITIES LENDING ACTIVITIES FOR CLOSED-END MANAGEMENT INVESTMENT COMPANIES.
Not applicable.
ITEM 13. EXHIBITS.
File the exhibits listed below as part of this Form.
(a)(1) | Any code of ethics, or amendment thereto, that is the subject of the disclosure required by Item 2, to the extent that the registrant intends to satisfy the Item 2 requirements through filing of an exhibit: Not applicable to this filing. |
(a)(3) | Any written solicitation to purchase securities under Rule 23c-1 under the 1940 Act (17 CFR 270.23c-1) sent or given during the period covered by the report by or on behalf of the registrant to 10 or more persons: Not applicable. |
(a)(4) | Change in the registrant’s independent public accountant. Not applicable. |
SIGNATURES
Pursuant to the requirements of the Securities Exchange Act of 1934 and the Investment Company Act of 1940, the registrant has duly caused this report to be signed on its behalf by the undersigned, thereunto duly authorized.
(Registrant) Nuveen California AMT-Free Quality Municipal Income Fund
By (Signature and Title) /s/ Mark L. Winget
Mark L. Winget
Vice President and Secretary
Date: November 4, 2022
Pursuant to the requirements of the Securities Exchange Act of 1934 and the Investment Company Act of 1940, this report has been signed below by the following persons on behalf of the registrant and in the capacities and on the dates indicated.
By (Signature and Title) /s/ David J. Lamb
David J. Lamb
Chief Administrative Officer
(principal executive officer)
Date: November 4, 2022
By (Signature and Title) /s/ E. Scott Wickerham
E. Scott Wickerham
Vice President and Controller
(principal financial officer)
Date: November 4, 2022