EXHIBIT 99.2

NASDAQ: HMSY
First Quarter 2007 Investor Call
Safe Harbor Statement
Certain statements in this presentation constitute “forward-looking statements” within the meaning of the Private Securities Litigation Reform Act of 1995 (the “Reform Act”). Such forward-looking statements involve known and unknown risks, uncertainties, and other factors that may cause the actual results, performance, or achievements of HMSY, or industry results, to be materially different from any future results, performance, or achievements expressed or implied by such forward-looking statements. The important factors that could cause actual results to differ materially from those indicated by such forward-looking statements include, but are not limited to (i) the information being of a preliminary nature and therefore subject to further adjustment; (ii) the uncertainties of litigation; (iii) HMSY’s dependence on significant customers; (iv) changing conditions in the healthcare industry which could simplify the reimbursement process and adversely affect HMSY’s business; (v) government regulatory and political pressures which could reduce the rate of growth of healthcare expenditures and/or discourage the assertion of claims for reimbursement against and delay the ultimate receipt of payment from third party payors; (vi) competitive actions by other companies, including the development by competitors of new or superior services or products or the entry into the market of new competitors; (vii) all the risks inherent in the development, introduction, and implementation of new products and services; and (viii) other risk factors described from time to time in HMSY’s filings with the SEC, including HMSY’s Form 10-K for the year ended December 31, 2006. HMSY assumes no responsibility to update the forward-looking statements contained in this release as a result of new information, future events or otherwise. When/if used in this presentation, the words “focus,” “believe,” “confident,” “anticipate,” “expected,” “strong,” “potential,” and similar expressions are intended to identify forward-looking statements, and the above described risks inherent therein.
| | |
1 | First Quarter 2007 Investor Call | 
|
Discussion Outline
Q1 2007 financial performance
Integration status
New business
Medical support services business
2007 guidance: updated
Q & A
| | |
2 | First Quarter 2007 Investor Call |
|
Consolidated Statements of Income
| | | | | | | |
| | Three Months Ended March 31 | |
| | ($ in thousands) | |
| |
| |
| | 2007 | | 2006 | |
|
Revenue | | $ | 32,238 | | $ | 16,378 | |
| | | | | | | |
Cost of Services: | | | | | | | |
Compensation | | | 13,073 | | | 7,878 | |
Data Processing | | | 2,147 | | | 1,449 | |
Occupancy | | | 1,981 | | | 1,245 | |
Direct project costs | | | 5,157 | | | 2,688 | |
Other operating costs | | | 2,843 | | | 1,410 | |
Amortization of acquisition related intangibles | | | 1,163 | | | — | |
| | | | | | | |
Total cost of services | | $ | 26,364 | | $ | 14,670 | |
| | | | | | | |
Operating income | | | 5,874 | | | 1,708 | |
| | | | | | | |
Interest income | | | (709 | ) | | — | |
Net interest income | | | 105 | | | 515 | |
| | | | | | | |
Income before income taxes | | | 5,270 | | | 2,223 | |
Income taxes | | | 2,298 | | | 918 | |
| | | | | | | |
Net income | | $ | 2,972 | | $ | 1,305 | |
| | |
3 | First Quarter 2007 Investor Call |
|
Condensed Balance Sheets
| | | | | | | | | | | |
| | March 31, 2007
($ in thousands) | | December 31, 2006
($ in thousands) | |
| |
| |
| |
Assets | | | | | | | |
Current assets: | | | | | | | |
Cash and cash equivalents and short-term investments | | | $ | 8,470 | | | | $ | 12,527 | | |
Accounts receivable, net | | | | 32,636 | | | | | 30,930 | | |
Prepaid expenses and other current assets | | | | 4,799 | | | | | 5,352 | | |
Total current assets | | | | 45,905 | | | | | 48,809 | | |
| | | | | | | | | | | |
Property and equipment, net | | | | 13,220 | | | | | 12,160 | | |
Other non-current assets | | | | 93,856 | | | | | 96,274 | | |
| | | | | | | | | | | |
Total assets | | | $ | 152,981 | | | | $ | 157,243 | | |
| | | | | | | | | | | |
Liabilities and Shareholders’ Equity | | | | | | | | | | | |
Current liabilities: | | | | | | | | | | | |
Accounts payable, accrued expenses and other liabilities | | | $ | 10,036 | | | | $ | 14,285 | | |
Amounts due to PCG, Inc. | | | | 417 | | | | | 1,385 | | |
Current portion of long-term debt | | | | 6,300 | | | | | 7,875 | | |
Total current liabilities | | | | 16,753 | | | | | 23,545 | | |
Long-term debt | | | | 22,050 | | | | | 23,625 | | |
Other liabilities | | | | 3,119 | | | | | 3,166 | | |
Total long-term liabilities | | | | 25,169 | | | | | 26,791 | | |
Total liabilities | | | $ | 41,922 | | | | $ | 50,336 | | |
| | | | | | | | | | | |
Common stock | | | | 252 | | | | | 250 | | |
Capital in excess of par value | | | | 112,075 | | | | | 110,876 | | |
Retained earnings | | | | 8,203 | | | | | 5,231 | | |
Treasury stock | | | | (9,397 | ) | | | | (9,397 | ) | |
Other comprehensive loss | | | | (74 | ) | | | | (53 | ) | |
Total shareholders’ equity | | | $ | 111,059 | | | | $ | 106,907 | | |
| | | | | | | | | | | |
Total liabilities and shareholders’ equity | | | $ | 152,981 | | | | $ | 157,243 | | |
| | |
4 | First Quarter 2007 Investor Call |
|
Condensed Statements of Cash Flow
| | | | | | | |
| | Three Months Ended March 31 | |
| | ($ in thousands) | |
| |
| |
| | 2007 | | 2006 | |
|
Net income | | $ | 2,972 | | $ | 1,305 | |
Net cash provided by (used in) operating activities | | | 845 | | | (853 | ) |
Net cash used in investing activities | | | (2,402 | ) | | (1,499 | ) |
Net cash provided by (used in) financing activities | | | (2,500 | ) | | 1,703 | |
Net decrease in cash and cash equivalents | | | (4,057 | ) | | (649 | ) |
| | | | | | | |
Cash / cash equivalents at beginning of period | | | 12,527 | | | 3,641 | |
Cash / cash equivalents at end of period | | $ | 8,470 | | $ | 2,992 | |
| | |
5 | First Quarter 2007 Investor Call |
|
EBITDA Reconciliation
Reconciliation of Net Income to EBITDA and Adjusted EBITDA
| | | | | | | |
| | Three Months Ended March 31
($ in thousands) | |
| |
| |
| | 2007 | | 2006 | |
|
Net income | | $ | 2,972 | | $ | 1,305 | |
Net interest expense (income) | | | 604 | | | (515 | ) |
Income taxes | | | 2,298 | | | 918 | |
Depreciation and amortization, net of deferred financing costs included in net interest expense | | | 2,346 | | | 617 | |
Earnings before interest, taxes, depreciation and amortization (EBITDA) | | | 8,220 | | | 2,325 | |
Share based compensation expense | | | 551 | | | 274 | |
Adjusted EBITDA | | $ | 8,771 | | $ | 2,599 | |
| | |
6 | First Quarter 2007 Investor Call |
|
Integration Status
Data Center migration
Billing/Recovery consolidation
Best Practices
Organization
| | |
| • | State Government Services reorganization |
| | |
| • | Government Relations |
| | |
| • | Human Resources |
| | |
7 | First Quarter 2007 Investor Call |
|
New Business
| | |
State Government |
| | |
| • | Kansas: Estates Recovery |
| | |
| • | Arizona: extended through 6/30/08 |
| | |
| • | Arkansas: extended through 6/30/08 |
| | |
Managed Care |
| | |
| • | Molina Healthcare |
| | |
| • | Boston Medical Center Health Plan |
| | |
Medical Support Services |
| | |
| • | New Hampshire |
| | |
| • | California counties: Orange, San Mateo, Alameda |
| | |
8 | First Quarter 2007 Investor Call |
|
Medical Support Services: Overview
Health insurance provided by custodial or non-custodial parents for their dependent children
Child support is not based on income eligibility (vs. Medicaid)
Legislative background
| | |
| • | 1975: Child Support Enforcement created under Title IV-D of SSA |
| | |
| • | 1993: Omnibus Budget Reconciliation Act created “Qualified Medical Support Order” |
| | |
| • | 1996: Personal Responsibility and Work Reduction Act requires provision for healthcare coverage in all child support orders |
| | |
| • | 1998: Child Support Performance and Incentive Act mandates steps to improve enforcement |
| | |
| • | 1999: Work Group recommends adoption of medical support as a “Performance Measure” for Federal funding |
| | |
| • | 2005: Deficit Reduction Act (DRA) requires states to enforce medical support from both non-custodial and custodial parent |
| | |
9 | First Quarter 2007 Investor Call |
|
Medical Support Services: Marketplace Overview
> 16 million child support cases in U.S.
90% of orders include provision for medical support
HHS estimates 57% of cases have employer-sponsored insurance available
| | |
10 | First Quarter 2007 Investor Call |
|
HMSY’s Medical Support Services
Locate insurance for children where not previously identified by child support agency
| | |
| • | Carrier matches |
| | |
| • | Employer matches |
| | |
Enforce enrollment in insurance plan where ordered parent has not done so |
| | |
| • | National Medical Support Notice mailing |
| | |
| • | Employer follow-up |
| | |
| • | Employer website |
| | |
| • | Customer call centers |
| | |
11 | First Quarter 2007 Investor Call |
|
Medical Support Services: HMSY Position
Consortium developed in January 2005
Clients in 14 states; 10 under Arkansas Consortium
HMS is the only medical support services vendor with full-scope offering
Flagship client: Texas Office of Attorney General
| | |
| • | Full outsource model |
| | |
| • | 870,000 new insurance policies provided |
| | |
12 | First Quarter 2007 Investor Call |
|
2007 Guidance: Updated
Revenue and Adjusted EBITDA
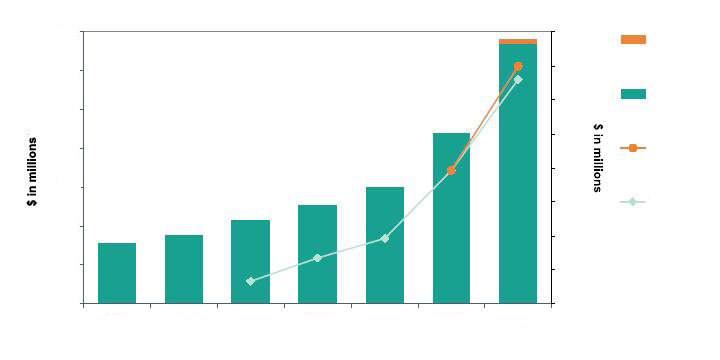
$140
$120
$100
$80
$60
$40
$20
$0
2001
2002
2003
2004
2005
2006
2007E
40.0
35.0
30.0
25.0
20.0
15.0
10.0
5.0
0.0
Updated
Revenue
Revenue
Updated
Adjusted
EBITDA
Adjusted
EBITDA
| | |
13 | First Quarter 2007 Investor Call |
|
Appendix: EBITDA
EBITDA is defined as earnings before interest, taxes, depreciation and amortization and adjusted EBITDA represents EBITDA adjusted for share based compensation expense. EBITDA is a measure commonly used by the capital markets to value enterprises. Interest, taxes, depreciation and amortization can vary significantly between companies due in part to differences in accounting policies, tax strategies, levels of indebtedness and interest rates. Excluding these items provides insight into the underlying results of operations and facilitates comparisons between HMSY and other companies. EBITDA is also a useful measure of the company’s ability to service debt and is one of the measures used for determining debt covenant compliance. In addition, because of the varying methodologies for determining stock-based compensation expense, and the subjective assumptions involved in those determinations, we believe excluding stock-based compensation expense from EBITDA enhances the ability of management and investors to compare our core operating results over multiple periods with those of other companies. Management believes EBITDA and adjusted EBITDA information is useful to investors for these reasons. Both EBITDA and adjusted EBITDA are non-GAAP financial measures and should not be viewed as an alternative to GAAP measures of performance. Management believes the most directly comparable GAAP financial measure is net income and has provided a reconciliation of EBITDA and adjusted EBITDA to net income in this presentation.
| | |
14 | First Quarter 2007 Investor Call |
|
NASDAQ: HMSY