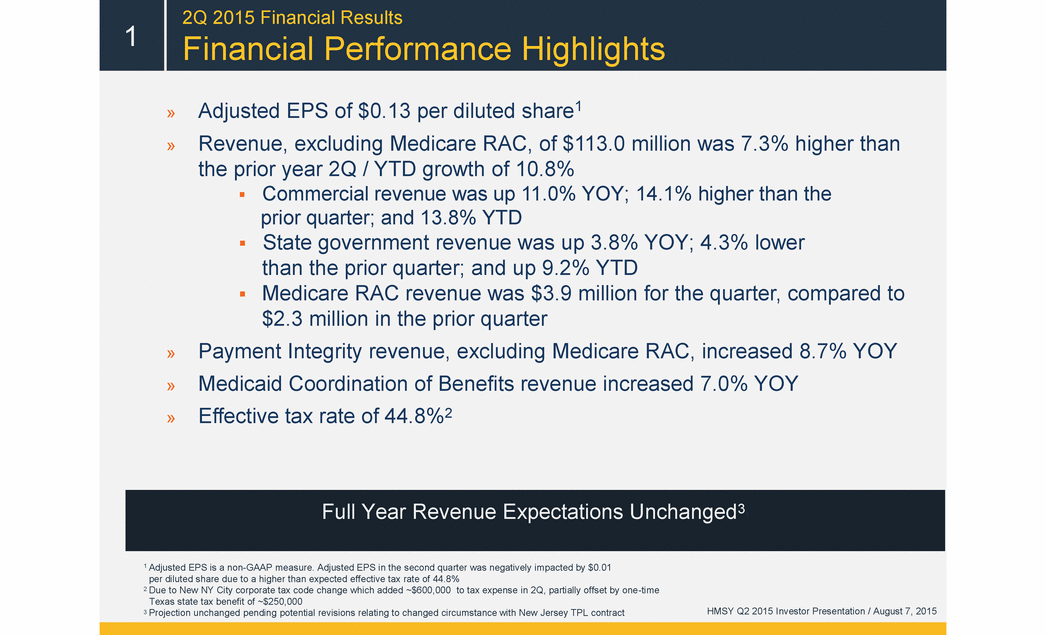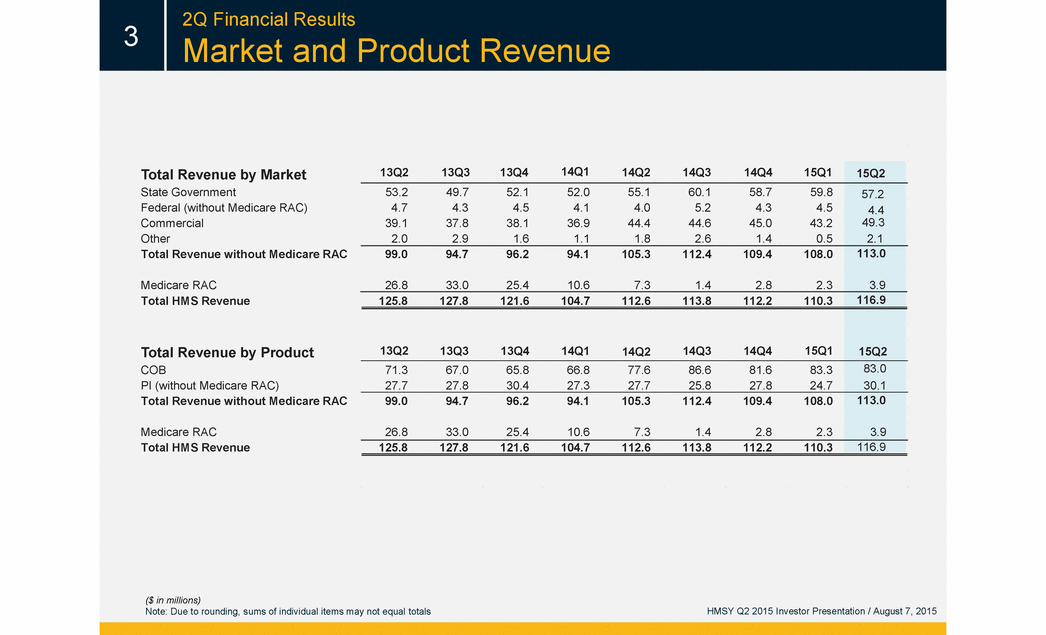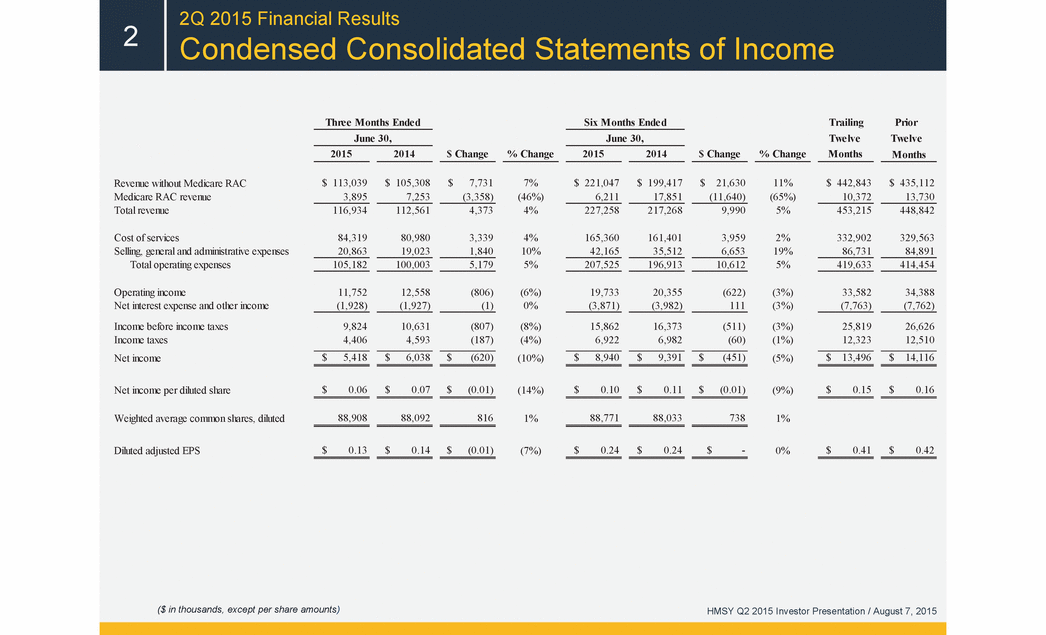
| 2Q 2015 Financial Results 2 Condensed Consolidated Statements of Income Three Months Ended Six Months Ended Trailing Prior June 30, June 30, Twelve Twelve 2015 2014 $ Change % Change 2015 2014 $ Change % Change Months Months Revenue without Medicare RAC $ 113,039 $ 105,308 $ 7,731 7% $ 221,047 $ 199,417 $ 21,630 11% $ 442,843 $ 435,112 Medicare RAC revenue 3,895 7,253 (3,358) (46%) 6,211 17,851 (11,640) (65%) 10,372 13,730 Total revenue 116,934 112,561 4,373 4% 227,258 217,268 9,990 5% 453,215 448,842 Cost of services 84,319 80,980 3,339 4% 165,360 161,401 3,959 2% 332,902 329,563 Selling, general and administrative expenses 20,863 19,023 1,840 10% 42,165 35,512 6,653 19% 86,731 84,891 Total operating expenses 105,182 100,003 5,179 5% 207,525 196,913 10,612 5% 419,633 414,454 Operating income 11,752 12,558 (806) (6%) 19,733 20,355 (622) (3%) 33,582 34,388 Net interest expense and other income (1,928) (1,927) (1) 0% (3,871) (3,982) 111 (3%) (7,763) (7,762) Income before income taxes 9,824 10,631 (807) (8%) 15,862 16,373 (511) (3%) 25,819 26,626 Income taxes 4,406 4,593 (187) (4%) 6,922 6,982 (60) (1%) 12,323 12,510 Net income $ 5,418 $ 6,038 $ (620) (10%) $ 8,940 $ 9,391 $ (451) (5%) $ 13,496 $ 14,116 Net income per diluted share $ 0.06 $ 0.07 $ (0.01) (14%) $ 0.10 $ 0.11 $ (0.01) (9%) $ 0.15 $ 0.16 Weighted average common shares, diluted 88,908 88,092 816 1% 88,771 88,033 738 1% Diluted adjusted EPS $ 0.13 $ 0.14 $ (0.01) (7%) $ 0.24 $ 0.24 $ - 0% $ 0.41 $ 0.42 ($ in thousands, except per share amounts) HMSY Q2 2015 Investor Presentation / August 7, 2015 |
