Exhibit 99.1

J.P. Morgan 35th Annual Healthcare Conference Bill Lucia, Chairman & CEO January 9 , 2017 1
Disclaimers FORWARD LOOKING STATEMENTS : This presentation contains "forward - looking statements" within the meaning of the U . S . Private Securities Litigation Reform Act of 1995 . Such statements give our projections or forecasts of future events and are based on our current expectations and assumptions regarding our business, the economy and other future conditions ; they do not relate strictly to historical or current facts . Forward - looking statements can be identified by words such as “aims,” “anticipates,” “believes,” “estimates,” “expects,” “forecasts,” “intends,” “likely,” “may,” “plans,” “projects,” “seeks,” “targets,” “will,” “would,” “could,” “should,” and similar expressions and references to guidance, although some forward - looking statements may be expressed differently . In particular, these include statements relating to future actions, business plans, objectives and prospects, future operating or financial performance, and specifically include the information under “Customer Profile : State Government,” “Customer Profile : Commercial Market,” “Customer Profile : Federal Government,” and certain sections of the presentation “Growth Drivers” and “Strategic Priorities for 2017 . ” Factors or events that could cause actual results to differ may emerge from time to time and it is not possible for us to predict all of them . Should known or unknown risks or uncertainties materialize, or should underlying assumptions prove inaccurate, actual results could differ materially from past results and those anticipated, estimated or projected . We caution you therefore against relying on any of these forward - looking statements . Factors that could cause or contribute to such differences, include, but are not limited to : negative or reduced growth rate of spending on Medicaid/Medicare ; variations in our results of operations ; our ability to execute our business plans or growth strategy ; development and implementation of new product solutions or new process improvements ; the nature of investment and acquisition opportunities we are pursuing, and the successful execution of such investments and acquisitions ; our ability to successfully integrate acquired businesses ; our failure to comply with applicable laws and regulations governing the conduct of certain electronic health transactions and the confidentiality of individually identifiable health information, such as HIPAA, or to protect such information from theft and misuse ; our ability to maintain effective information and technology systems and networks, and to protect them from damage, interruption or breach ; our reliance on subcontractors, vendors or other third party providers and sources to perform services ; emergence of new competitors or competitors’ introduction of new or superior products or services ; a failure to protect our intellectual property rights, confidential and proprietary information, or the confidential or proprietary information of others in our possession, despite our efforts ; the unexpected reduction in scope or termination of a significant contract ; customer dissatisfaction, our non - compliance with contractual provisions or regulatory requirements, or our failure to meet performance standards triggering significant costs or liabilities under our contracts ; our cash flows from operations, available cash and ability to generate sufficient cash to cover our interest and principal payments under our credit facility or to borrow or use credit ; the risk that guidance may not be achieved ; our ability to continue to secure contracts or favorable contract terms through the competitive bidding process ; changes in the U . S . healthcare environment or healthcare financing system and steps we take in anticipation of such changes ; pending or threatened litigation ; our ability to retain customers or the loss of one or more major customers ; the cancellation or delay of procurements or contract implementation due to protests or challenges to government awards ; regulatory, budgetary or political actions that affect procurement practices ; unanticipated changes in our effective tax rates ; unfavorable outcomes in legal proceedings, including contract award protests ; negative results of government or customer reviews, audits or investigations ; restrictions on bidding or performing certain work due to perceived conflicts of interests ; the market price of our common stock ; and other factors, risks and uncertainties described in our most recent Annual Report on Form 10 - K and subsequent filings with the Securities and Exchange Commission . Any forward - looking statements are made as of the date of this presentation . Except as may be required by law, we disclaim any obligation to publicly update forward - looking statements, whether as a result of new information, future events or otherwise . NON - GAAP FINANCIAL INFORMATION : This presentation contains certain non - GAAP measures . These non - GAAP measures, as calculated by the Company, are not necessarily comparable to similarly titled measures reported by other companies . Additionally, these non - GAAP measures should not be considered alternatives to the Company's other financial information determined under GAAP . See slide 41 for definitions and reconciliations of certain non - GAAP measures . MARKET AND INDUSTRY DATA : This presentation contains market and industry data and forecasts that have been obtained from publicly available information, various industry publications, other published industry sources and our internal data and estimates . We have not independently verified the information and cannot make any representation as to the accuracy or completeness of such information . None of the reports and other materials of third party sources referred to in this presentation were prepared for use in, or in connection with, this presentation . Our internal data and estimates are based upon information obtained from our customers, our partners, trade and business organizations, publicly available information and other contacts in the markets in which we operate and our management’s understanding of industry conditions . Estimates are difficult to develop and inherently uncertain and we cannot assure you that they are accurate . Our estimates involve risks and uncertainties and are subject to change based on various factors, including those discussed above . 2 J.P. Morgan / 35 th Annual Healthcare Conference / January 9, 2017

3 Presentation Outline ▪ Business Overview ▪ The Market Opportunity ▪ Growth Drivers ▪ Strategic Priorities for 2017 ▪ Potential Medicaid Changes ▪ Conclusion ▪ Appendix J.P. Morgan / 35 th Annual Healthcare Conference / January 9, 2017

4 Business Overview ▪ Products ▪ Key Assets ▪ Principal Customers

HMS CONFIDENTIAL. DO NOT DISTRIBUTE. Coordination of Benefits Payment Integrity Care Management and Member Analytics Technologies Identify the responsible party to pay claims ▪ Prospective cost avoidance ▪ Retrospective cost recoveries Determine if billed claims are paid accurately ▪ Proper Coding ▪ Correct setting ▪ Appropriate care ▪ Correct billed amount - consistent with customer payment policies and contracts Actionable intelligence for customers ▪ To manage quality, risk, cost and compliance across all lines of business ▪ Focus on improved workflow, outcomes and patient engagement Our Products Help Payers B end the Cost C urve Solving customer problems with an integrated suite of cost containment solutions spanning the entire service and claims payment continuum J.P. Morgan / 35 th Annual Healthcare Conference / January 9, 2017 5
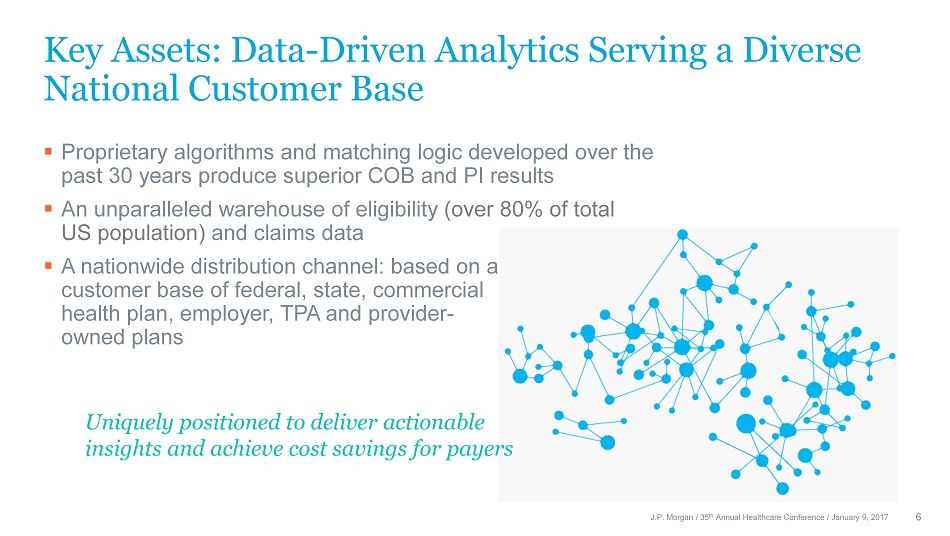
6 ▪ Proprietary algorithms and matching logic developed over the past 30 years produce superior COB and PI results ▪ An unparalleled warehouse of eligibility (over 80% of total US population) and claims data ▪ A nationwide distribution channel: based on a customer base of federal, state, commercial health plan, employer, TPA and provider - owned plans J.P. Morgan / 35 th Annual Healthcare Conference / January 9, 2017 Uniquely positioned to deliver actionable insights and achieve cost savings for payers Key Assets: Data - Driven Analytics Serving a Diverse National Customer Base

HMS CONFIDENTIAL. DO NOT DISTRIBUTE. Key Assets: HMS Expertise Matters ▪ Bringing a deep knowledge of the dramatic variations in Federal and state - specific program rules and regulations ▪ Acting as a trusted data steward for PHI: ▪ Providing access to more than 800 credentialed professionals 2 ▪ Leveraging m ore than 575 technology experts 3 , many holding advanced certifications, who have been recognized nationally with awards for excellence and innovation in IT and security 1 HMS is certified by the Health Information Trust Alliance (HITRUST) established the Common Security Framework (CSF) for organizations that create, access , store or exchange personal health and financial information 2 Includes full - time, part - time, and contract employees who are Board - certified physicians, RNs and certified coders working with review and audit specialists 3 Includes full - time, part - time, and contract employees - certified 1 HMS has evolved over the past ten years from the leading COB service provider to a ‘one - stop shop’ for integrated cost containment and analytics solutions 7 J.P. Morgan / 35 th Annual Healthcare Conference / January 9, 2017
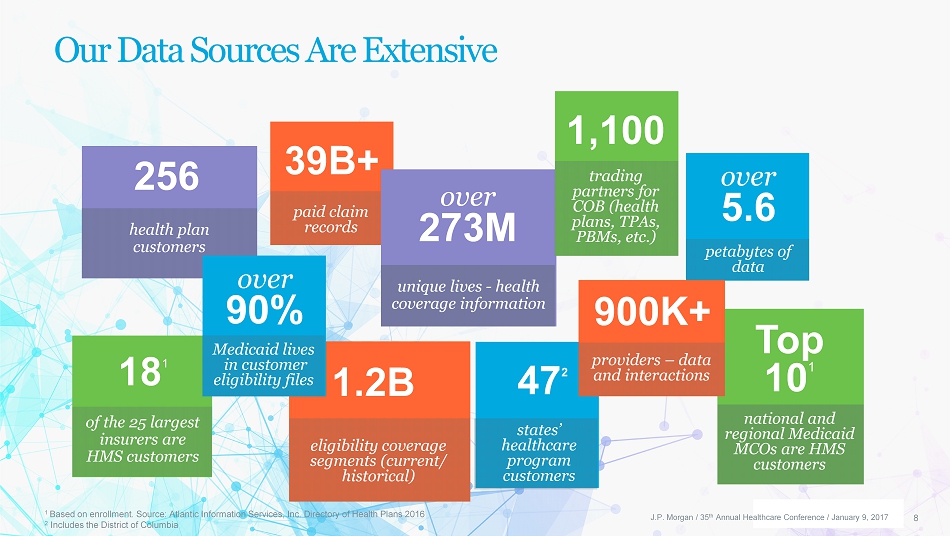
HMS CONFIDENTIAL. DO NOT DISTRIBUTE. 39B+ Our Data Sources Are Extensive 256 health plan customers 1.2B national and regional Medicaid MCOs are HMS customers Top 10 1 18 1 states’ healthcare program customers 47 2 over 90% over 273M unique lives - health coverage information eligibility coverage segments (current / historical) Medicaid lives in customer eligibility files of the 25 largest insurers are HMS customers paid claim records over 5.6 petabytes of data 1,100 trading partners for COB (health plans, TPAs, PBMs, etc.) 900K+ providers – data and interactions 8 J.P. Morgan / 35 th Annual Healthcare Conference / January 9, 2017 1 Based on enrollment. Source: Atlantic Information Services, Inc. Directory of Health Plans 2016 2 Includes the District of Columbia

Customer Profile: State Government 9 ▪ Healthcare programs served in 47 states 1 ▪ Longer sales cycle due to government procurement process and average contract length of ~6 years (including extensions) ▪ Three of top 10 state TPL contracts scheduled for re - procurement in 2017 2 ▪ Expected annual revenue growth profile - low single digits Data as of January 2017 1 Includes the District of Columbia 2 Massachusetts was extended for 6 months in December 2016 (expires 6/30/17), Connecticut (expires 9/30/17), and North Carolina (expires 12/7/17) J.P. Morgan / 35 th Annual Healthcare Conference / January 9, 2017
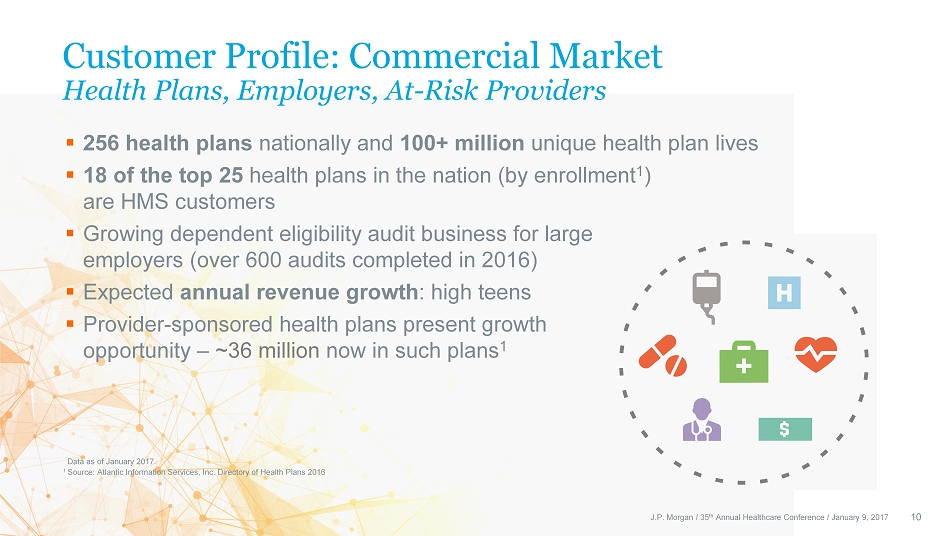
Customer Profile: Commercial Market Health Plans, Employers, At - Risk Providers 10 ▪ 256 health plans nationally and 100+ million unique health plan lives ▪ 18 of the top 25 health plans in the nation (by enrollment 1 ) are HMS customers ▪ Growing dependent eligibility audit business for large employers (over 600 audits completed in 2016 ) ▪ Expected annual revenue growth : high teens ▪ Provider - sponsored health plans present growth opportunity – ~36 million now in such plans 1 Data as of January 2017. J.P. Morgan / 35 th Annual Healthcare Conference / January 9, 2017 1 Source : Atlantic Information Services, Inc. Directory of Health Plans 2016

Customer Profile: Federal Government 11 ▪ HMS works with CMS as a Medicare RAC auditor, a UPIC - eligible contactor, and a Trusted Third Party participant in The Fraud P revention Partnership ▪ CMS awarded HMS the Western RAC Region in October 2016 ▪ Same region as previous contract ▪ 6.5 - year contract beginning 10/31/16; lack of clarity to date on the pace of approval and scope of allowable audits ▪ Expecting slow ramp of new RAC program through 1H’17 and FY’17 revenue of ~$ 6 - 10 million ▪ COB work for the Veterans Administration J.P. Morgan / 35 th Annual Healthcare Conference / January 9, 2017

12 The Market Opportunity
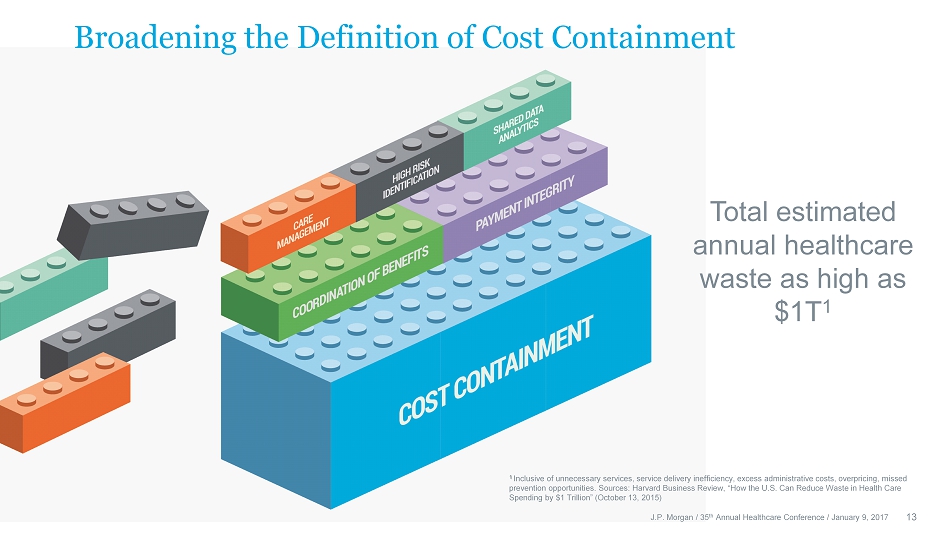
Broadening the Definition of Cost Containment Total estimated annual healthcare waste as high as $1T 1 13 1 Inclusive of unnecessary services, service delivery inefficiency, excess administrative costs, overpricing, missed prevention opportunities. Sources : Harvard Business Review, “How the U.S. Can Reduce Waste in Health Care Spending by $1 Trillion” (October 13, 2015) J.P. Morgan / 35 th Annual Healthcare Conference / January 9, 2017

14 Growth Drivers

15 ▪ Leverage historic strength in COB and expand PI presence – particularly with health plan at - risk and ASO lines of business ▪ Position HMS as a trusted state partner to help overcome Medicaid challenges, particularly if federal reimbursement levels change ▪ Pursue product innovation as a key competitive advantage ▪ Pursue acquisitions to expand product offerings and/or data analytics capacity ▪ Continue focus on organizational efficiency to convert sales to revenue more quickly, improve product yield and reduce operating costs Growth Philosophy J.P. Morgan / 35 th Annual Healthcare Conference / January 9, 2017

16 ▪ Medicare enrollment is expected to grow 12% by 2020 to 62.6 million 1 , with the majority of new beneficiaries enrolling in Medicare Advantage plans ▪ The aging US population has a concentration of individuals with high - cost chronic conditions ▪ Employer - sponsored insurance continues to be the dominant source of coverage : 172.2 million lives projected by 2020 1 ▪ Large self - insured employers are demanding more cost savings from their ASO partners ▪ Potentially fewer dollars for state government programs historically increases focus on cost savings J.P. Morgan / 35 th Annual Healthcare Conference / January 9, 2017 1 CMS Office of the Actuary, National Healthcare Expenditure Data – Historical and Projections 2009 - 2025 (July 2016) Macro Environment Remains Favorable for Growth

HMS CONFIDENTIAL. DO NOT DISTRIBUTE. Historical Composition of Health Plan Growth 19 ▪ Full - year run rate impact of prior year implementations, which are typically back - end loaded ▪ Expanded product sales to existing customers ▪ Product yield improvements ▪ Sales to new customer populations ▪ Medical cost inflation ▪ Customer organic enrollment growth (Medicare Advantage, employer sponsored and Medicaid managed care) 17 J.P. Morgan / 35 th Annual Healthcare Conference / January 9, 2017
18 ▪ Process improvements during 2016 to improve yield and decrease costs should positively influence year - over - year PI growth for 2017, particularly with health plan customers ▪ The 2017 rollout of new data onboarding technology (Hadoop) is expected to accelerate new revenue generation ▪ Ongoing innovation and greater use of technology increases our ability to create and deploy new edits and algorithms ▪ Focused effort to sell PI in the state market, in anticipation of reduced federal reimbursements pursuant to proposed changes to the ACA J.P. Morgan / 35 th Annual Healthcare Conference / January 9, 2017 Payment Integrity Product Growth

19 J.P. Morgan / 35 th Annual Healthcare Conference / January 9, 2017 Opportunities for Margin Expansion ▪ Scalable business model – core infrastructure is in place ▪ I ncremental revenue comes with margins higher than the Company average ▪ Ongoing Lean Six Sigma initiatives to achieve quality improvement and business optimization ▪ More automation and greater process efficiencies to increase yields ▪ E nhancements to the implementation process resulting in quicker revenue ▪ IT investments to drive operational savings

20 Strategic Priorities for 2017

21 ▪ Use big data to create a more nimble environment and to identify new revenue opportunities within our current service delivery models ▪ Work collaboratively with customers to identify additional enhancements to product yield ▪ Utilize automation and innovation to modify existing products, reduce costs and improve financial performance across the Company ▪ Adopt innovative technologies to meet customer demand to move more processes upstream ▪ Develop new products and broaden customer base Putting the Customer First Broad Strategic Themes for 2017 J.P. Morgan / 35 th Annual Healthcare Conference / January 9, 2017
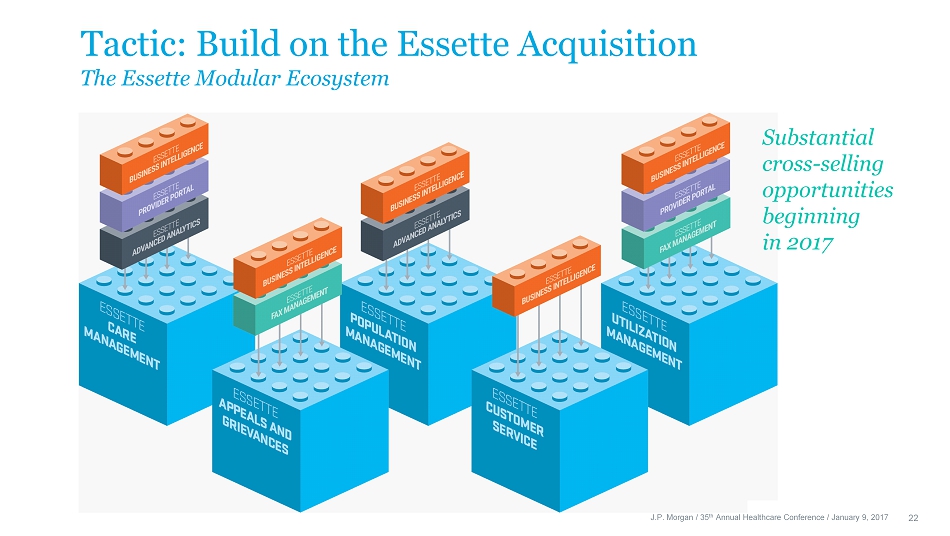
HMS CONFIDENTIAL. DO NOT DISTRIBUTE. Tactic: Build on the Essette Acquisition The Essette Modular Ecosystem Substantial cross - selling opportunities beginning in 2017 22 J.P. Morgan / 35 th Annual Healthcare Conference / January 9, 2017

Tactic: Bring New Member Analytics Products to Market 23 ▪ Give payers a member health profile at enrollment, rather than waiting months for claims to be incurred and patterns of illness to emerge ▪ Analytics to identify health conditions based on HMS claims database ▪ Track medical management of high utilizers post enrollment J.P. Morgan / 35 th Annual Healthcare Conference / January 9, 2017 Early identification of chronic illnesses, resulting in better care for members and reduced costs for payers
24 ▪ Pursuing a robust pipeline of acquisitions to: ▪ Complement core cost containment expertise ▪ Build care management and coordination adjacencies to complement Essette acquisition ▪ Expand data analytics capabilities ▪ Conducting an ongoing “buy vs. build” analysis – to accelerate go - to - market strategies and minimize risks ▪ The prudent deployment of capital for inorganic growth remains a strategic priority for 2017 Strong balance sheet 1 and solid quarterly cash flow support acquisition strategy Tactic: Ongoing Acquisitions 1 $171.5 million cash on the balance sheet at 9/30/16 J.P. Morgan / 35 th Annual Healthcare Conference / January 9, 2017

25 Potential Medicaid Changes
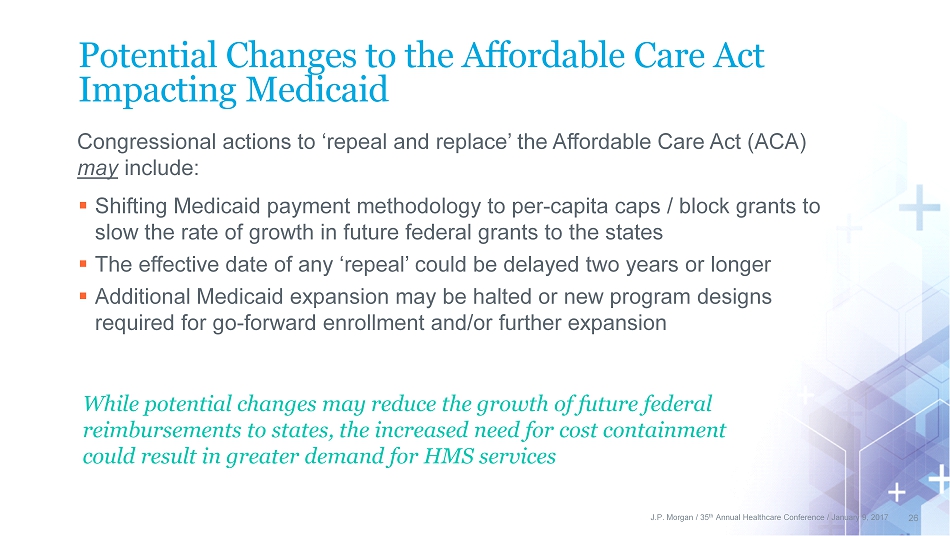
HMS CONFIDENTIAL. DO NOT DISTRIBUTE. Potential Changes to the Affordable Care Act Impacting Medicaid Congressional actions to ‘repeal and replace’ the Affordable Care Act (ACA) may include: ▪ Shifting Medicaid payment methodology to per - capita caps / block grants to slow the rate of growth in future federal grants to the states ▪ The effective date of any ‘repeal’ could be delayed two years or longer ▪ Additional Medicaid expansion may be halted or new program designs required for go - forward enrollment and/or further expansion While potential changes may reduce the growth of future federal reimbursements to states, the increased need for cost containment could result in greater demand for HMS services 26 J.P. Morgan / 35 th Annual Healthcare Conference / January 9, 2017

27 Conclusion
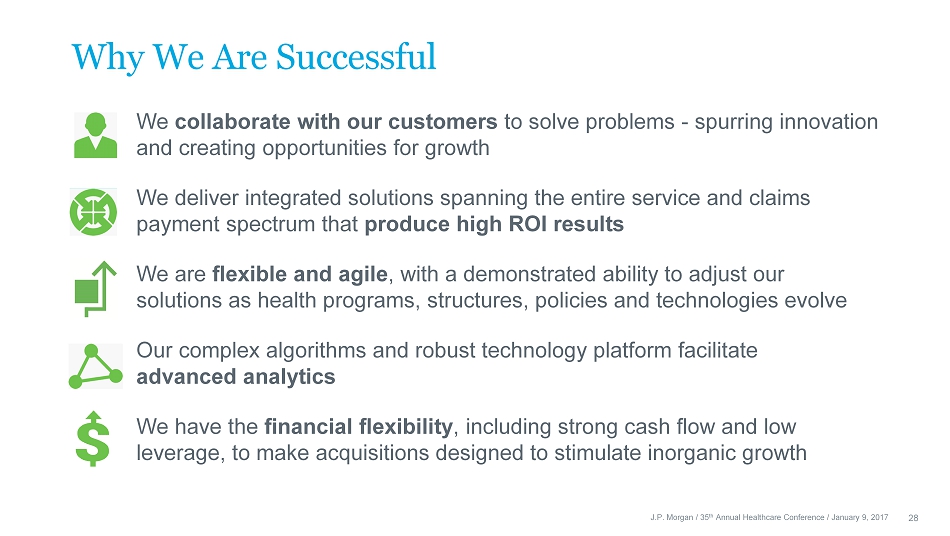
HMS CONFIDENTIAL. DO NOT DISTRIBUTE. Why We Are Successful ▪ We collaborate with our customers to solve problems - spurring innovation and creating opportunities for growth ▪ We deliver integrated solutions spanning the entire service and claims payment spectrum that produce high ROI results ▪ We are flexible and agile , with a demonstrated ability to adjust our solutions as health programs, structures, policies and technologies evolve ▪ Our complex algorithms and robust technology platform facilitate advanced analytics ▪ We have the financial flexibility , including strong cash flow and low leverage, to make acquisitions designed to stimulate inorganic growth 28 J.P. Morgan / 35 th Annual Healthcare Conference / January 9, 2017
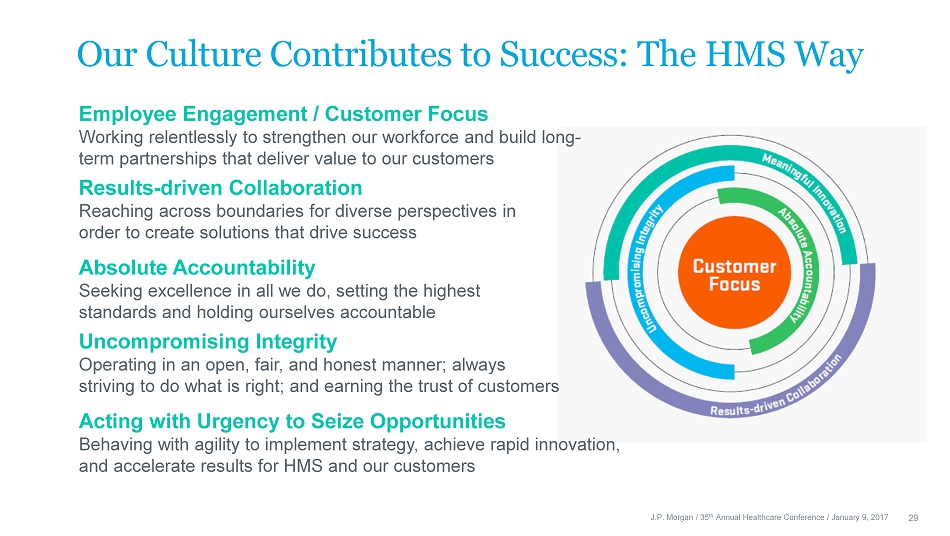
HMS CONFIDENTIAL. DO NOT DISTRIBUTE. Employee Engagement / Customer Focus Working relentlessly to strengthen our workforce and build long - term partnerships that deliver value to our customers Results - driven Collaboration Reaching across boundaries for diverse perspectives in order to create solutions that drive success Absolute Accountability Seeking excellence in all we do, setting the highest standards and holding ourselves accountable Uncompromising Integrity Operating in an open, fair, and honest manner ; always striving to do what is right; and earning the trust of customers Acting with Urgency to Seize Opportunities Behaving with agility to implement strategy, achieve rapid innovation, and accelerate results for HMS and our customers Our Culture Contributes to Success: The HMS Way 29 J.P. Morgan / 35 th Annual Healthcare Conference / January 9, 2017
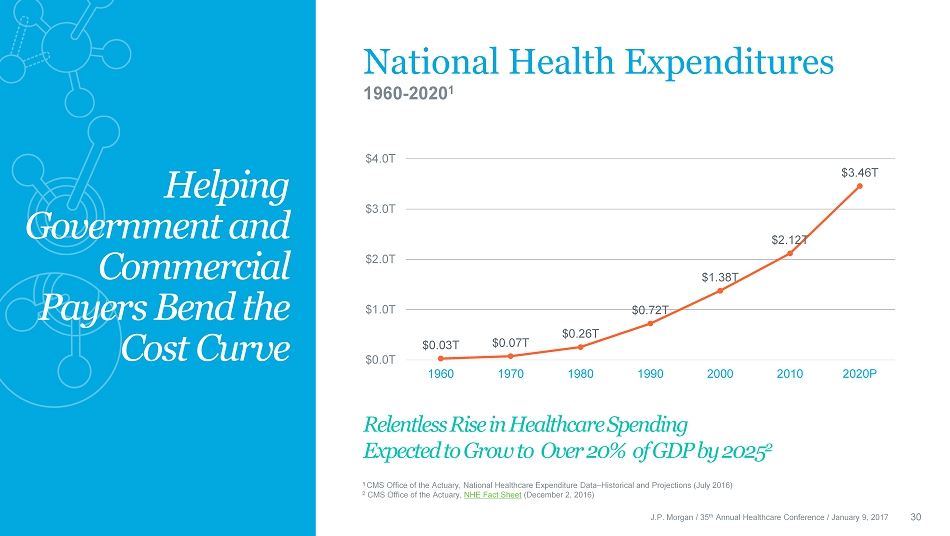
30 National Health Expenditures 1960 - 2020 1 1 CMS Office of the Actuary, National Healthcare Expenditure Data – Historical and Projections ( July 2016) 2 CMS Office of the Actuary, NHE Fact Sheet (December 2, 2016) Relentless Rise in Healthcare Spending Expected to Grow to Over 20% of GDP by 2025 2 $0.03T $0.07T $0.26T $0.72T $1.38T $2.12T $3.46T $0.0T $1.0T $2.0T $3.0T $4.0T 1960 1970 1980 1990 2000 2010 2020P Helping Government and Commercial Payers Bend the Cost Curve J.P. Morgan / 35 th Annual Healthcare Conference / January 9, 2017

31 Appendix

32 The HMS Product Suite ▪ Coordination of Benefits ▪ Payment Integrity ▪ Care Management and Member Analytics Technologies
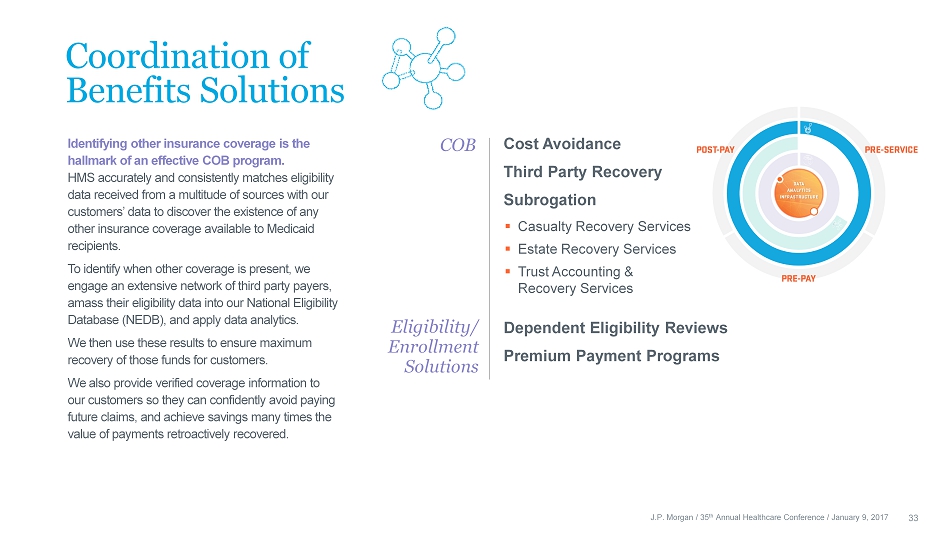
HMS CONFIDENTIAL. DO NOT DISTRIBUTE. COB Coordination of Benefits Solutions Identifying other insurance coverage is the hallmark of an effective COB program. HMS accurately and consistently matches eligibility data received from a multitude of sources with our customers’ data to discover the existence of any other insurance coverage available to Medicaid recipients. To identify when other coverage is present, we engage an extensive network of third party payers, amass their eligibility data into our National Eligibility Database (NEDB), and apply data analytics . We then use these results to ensure maximum recovery of those funds for customers. We also provide verified coverage information to our customers so they can confidently avoid paying future claims, and achieve savings many times the value of payments retroactively recovered. Dependent Eligibility Reviews Premium Payment Programs Cost Avoidance Third Party Recovery Subrogation ▪ Casualty Recovery Services ▪ Estate Recovery Services ▪ Trust Accounting & Recovery Services Eligibility/ Enrollment Solutions 33 J.P. Morgan / 35 th Annual Healthcare Conference / January 9, 2017

HMS CONFIDENTIAL. DO NOT DISTRIBUTE. Claim Edits/Analytics Payment Integrity Solutions The HMS suite of Payment Integrity (PI) solutions is a combination of software and services designed to ensure that payments for healthcare claims are paid correctly, according to contractual terms, free of error or duplication, and without fraudulent, wasteful or abusive practices. We help our customers address improper payments across the entire payment life cycle and deliver applications and tools to automate, monitor, manage, eliminate or recover improper payments made on medical claims. Our data analytics and algorithm libraries mine, analyze and provide actionable insight on opportunities to avoid or recover improper payments . Our services promote payment efficiency and efficacy by analyzing and verifying claims, finding errors, and detecting patterns of abuse or other improper billing trends. Payment Integrity Portal ▪ Advanced Analytics ▪ Link Visualization ▪ Provider Scoring Clinical Claim Reviews Prior Authorization / Utilization Review Fraud and Analytics Solutions Special Investigation Unit (SIU) Support Services ▪ Analytics Support ▪ Investigation Support ▪ Case Management 34 J.P. Morgan / 35 th Annual Healthcare Conference / January 9, 2017
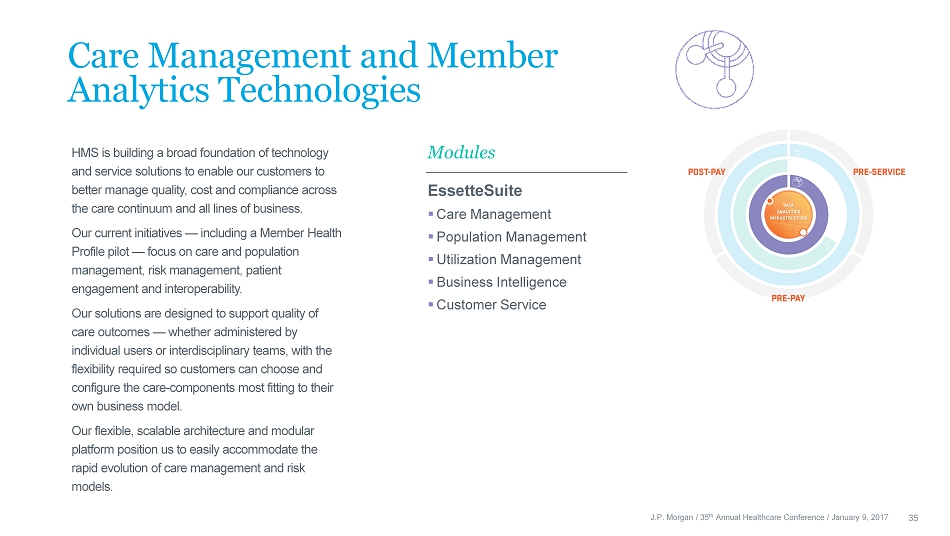
HMS CONFIDENTIAL. DO NOT DISTRIBUTE. Care Management and Member Analytics Technologies HMS is building a broad foundation of technology and service solutions to enable our customers to better manage quality, cost and compliance across the care continuum and all lines of business. Our current initiatives — including a Member Health Profile pilot — focus on care and population management , risk management, patient engagement and interoperability. Our solutions are designed to support quality of care outcomes — whether administered by individual users or interdisciplinary teams, with the flexibility required so customers can choose and configure the care - components most fitting to their own business model. Our flexible, scalable architecture and modular platform position us to easily accommodate the rapid evolution of care management and risk models. Modules EssetteSuite ▪ Care Management ▪ Population Management ▪ Utilization Management ▪ Business Intelligence ▪ Customer Service 35 J.P. Morgan / 35 th Annual Healthcare Conference / January 9, 2017

Quarterly Financial Information ▪ Financial Results ▪ Market and Product Revenue ▪ Reconciliation of Net Income to GAAP EPS and Adjusted EPS 36

1 Diluted adjusted EPS is a non - GAAP measure (see reconciliation on slide 41 (Unaudited , $ in thousands, except per share amounts )) Q3'15 Q4'15 Revenue $ 118,444 $ 128,514 $ 119,763 $ 123,550 $ 124,604 Cost of services: Compensation 43,628 46,694 46,401 47,343 48,298 Data processing 10,023 10,409 9,624 9,104 9,541 Occupancy 4,188 3,765 3,627 3,631 3,388 Direct project costs 12,702 14,776 14,483 11,473 10,997 Other operating costs 6,551 8,453 5,776 6,407 8,465 Amortization of acquisition related software and intangible assets 7,041 7,012 7,013 7,013 6,390 Total cost of services 84,133 91,109 86,924 84,971 87,079 Selling, general & administrative expenses 21,295 22,582 22,930 22,227 24,875 Total operating expenses 105,428 113,691 109,854 107,198 111,954 Operating income 13,016 14,823 9,909 16,352 12,650 Interest expense (1,948) (1,970) (2,091) (2,100) (2,121) Interest income 11 15 47 60 105 Income before income taxes 11,079 12,868 7,865 14,312 10,634 Income taxes 4,217 4,143 3,305 5,746 (2,874) Net income $ 6,862 $ 8,725 $ 4,560 $ 8,566 $ 13,508 Net income per diluted share $ 0.08 $ 0.10 $ 0.05 $ 0.10 $ 0.16 Weighted average common shares, diluted 87,792 87,110 84,479 84,528 84,853 Diluted adjusted EPS 1 $ 0.15 $ 0.19 $ 0.14 $ 0.18 $ 0.24 Q3'16Q1'16 Q2'16 Quarterly Financial Information 2016 Q3 Financial Results 37 J.P. Morgan / 35 th Annual Healthcare Conference / January 9, 2017

HMS CONFIDENTIAL. DO NOT DISTRIBUTE. Financial Performance Highlights Comparison of YTD Results through first 9 months As of September 30, 2016 : Cash in the bank $171.5M in cash and cash equivalents Outstanding Debt $ 197.8M Leverage Ratio 1.7X Debt/AEBITDA 0.2X Net Debt/AEBITDA 2015 First 9 months results 2016 First 9 months results Revenue $ 345.7M $ 367.9M (+6.4%) Net Income $ 15.8M $ 26.6M (+68.4%) Diluted EPS $0.18 $0.31 ( +72.2%) Cash flow from Ops $ 40.5M $ 54.4M (+34.3%) Operating Margin 9.5% 10.6% 38 J.P. Morgan / 35 th Annual Healthcare Conference / January 9, 2017
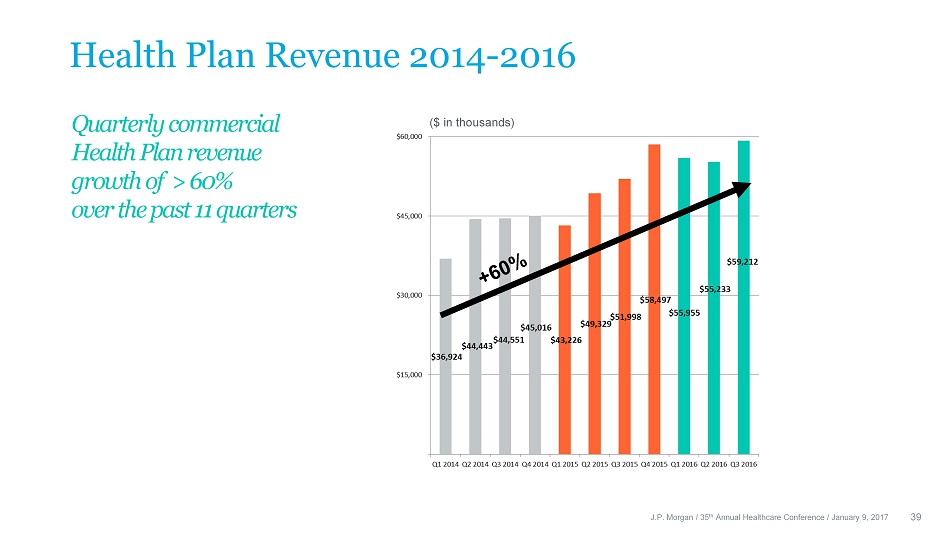
Health Plan Revenue 2014 - 2016 39 Quarterly commercial Health Plan revenue growth of > 6 0% over the past 11 quarters J.P. Morgan / 35 th Annual Healthcare Conference / January 9, 2017 ($ in thousands)
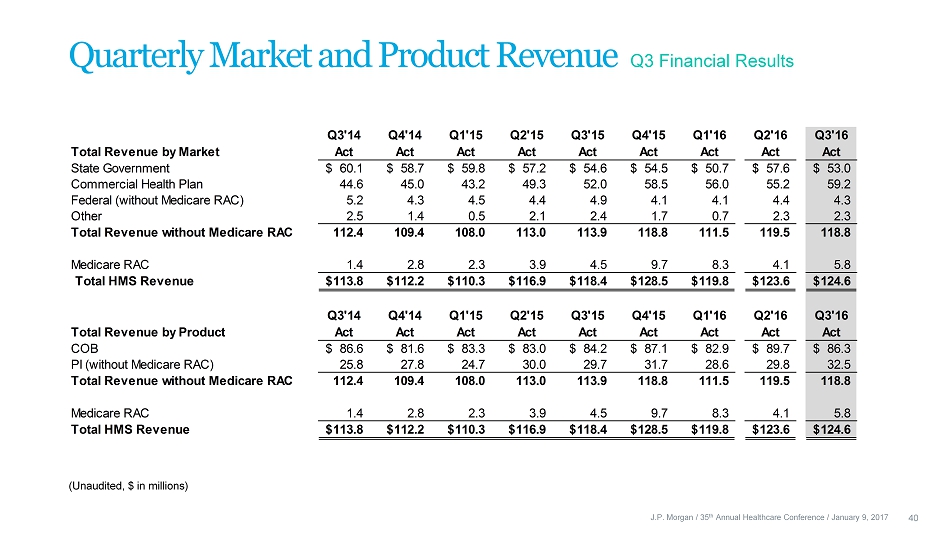
(Unaudited, $ in millions) Q3'14 Q4'14 Q1'15 Q2'15 Q3'15 Q4'15 Q1'16 Q2'16 Q3'16 Total Revenue by Market Act Act Act Act Act Act Act Act Act State Government 60.1$ 58.7$ 59.8$ 57.2$ 54.6$ 54.5$ 50.7$ 57.6$ 53.0$ Commercial Health Plan 44.6 45.0 43.2 49.3 52.0 58.5 56.0 55.2 59.2 Federal (without Medicare RAC) 5.2 4.3 4.5 4.4 4.9 4.1 4.1 4.4 4.3 Other 2.5 1.4 0.5 2.1 2.4 1.7 0.7 2.3 2.3 Total Revenue without Medicare RAC 112.4 109.4 108.0 113.0 113.9 118.8 111.5 119.5 118.8 Medicare RAC 1.4 2.8 2.3 3.9 4.5 9.7 8.3 4.1 5.8 Total HMS Revenue 113.8$ 112.2$ 110.3$ 116.9$ 118.4$ 128.5$ 119.8$ 123.6$ 124.6$ Q3'14 Q4'14 Q1'15 Q2'15 Q3'15 Q4'15 Q1'16 Q2'16 Q3'16 Total Revenue by Product Act Act Act Act Act Act Act Act Act COB 86.6$ 81.6$ 83.3$ 83.0$ 84.2$ 87.1$ 82.9$ 89.7$ 86.3$ PI (without Medicare RAC) 25.8 27.8 24.7 30.0 29.7 31.7 28.6 29.8 32.5 Total Revenue without Medicare RAC 112.4 109.4 108.0 113.0 113.9 118.8 111.5 119.5 118.8 Medicare RAC 1.4 2.8 2.3 3.9 4.5 9.7 8.3 4.1 5.8 Total HMS Revenue 113.8$ 112.2$ 110.3$ 116.9$ 118.4$ 128.5$ 119.8$ 123.6$ 124.6$ Quarterly Market and Product Revenue Q3 Financial Results 40 J.P. Morgan / 35 th Annual Healthcare Conference / January 9, 2017

41 Reconciliation of Net Income to GAAP EPS and Adjusted EPS Note: The Company believes that the non - GAAP financial measure above provides useful information to the Company's management, investors and other interested parties about the Company's operating performance because it allows them to understand and compare the Company's operating results during the current periods to the prior year periods in a more consistent manner. The non - GAAP measure presented in this slide may not be comparable to similarly titled measures used by other companies. 1 In periods prior to 2016, legal fees related to disputes involving PCG were not included in adjusted earnings because they we re not considered non - recurring at the time. 2 Tax effect of adjustments is computed as the pre - tax effect of the adjustments multiplied by the annual effective tax rate for the t hree months Legal fees related to disputes involving PCG $ 943 $ 1,351 Income taxes on legal fees (2) (343) (451) Sub-total $ 600 $ 900 Diluted Adjusted EPS $ 0.01 $ 0.01 Q3'15 Q4'15 As summarized in the following table, diluted earnings per share adjusted for stock - based compensation expense, non - recurring legal expense, amortization of acquisition related software and intangible assets and related taxes (adjusted EPS) was $0.24 for the third quarter of 2016. J.P. Morgan / 35 th Annual Healthcare Conference / January 9, 2017 Net income $ 6,862 $ 8,725 $ 4,560 $ 8,566 $ 13,508 Stock-based compensation 3,140 4,089 4,240 4,405 2,102 Non-recurring legal fees (1) - - 1,248 315 - Amortization of acquisition related software and intangible assets 7,041 7,013 7,013 7,013 7,015 (3,711) (3,350) (5,253) (4,704) (2,644) Sub-total $ 13,332 $ 16,477 11,808 15,595 19,981 Weighted average common shares, diluted 87,792 87,110 84,479 84,528 84,853 Diluted GAAP EPS 0.08$ 0.10$ $ 0.05 $ 0.10 $ 0.16 Diluted Adjusted EPS 0.15$ 0.19$ $ 0.14 $ 0.18 $ 0.24 Income tax related adjustments (2) Q3'16Q3'15 Q4'15 Q1'16 Q2'16 (Unaudited, $ in thousands, except per share data)
Enterprising healthcare