UNITED STATES
SECURITIES AND EXCHANGE COMMISSION
WASHINGTON, D.C. 20549
FORM N-CSR
CERTIFIED SHAREHOLDER REPORT OF REGISTERED MANAGEMENT
INVESTMENT COMPANIES
Investment Company Act file number 811-21233
PARADIGM FUNDS
(Exact name of registrant as specified in charter)
Nine Elk Street, Albany, NY 12207-1002
(Address of principal executive offices) (Zip code)
Robert A. Benton
Nine Elk Street, Albany, NY 12207-1002
(Name and address of agent for service)
Registrant's telephone number, including area code: (518) 431-3500
Date of fiscal year end: December 31
Date of reporting period: June 30, 2006
Form N-CSR is to be used by management investment companies to file reports with the Commission not later than 10 days after the transmission to stockholders of any report that is required to be transmitted to stockholders under Rule 30e-1 under the Investment Company Act of 1940 (17 CFR 270.30e-1). The Commission may use the information provided on Form N-CSR in its regulatory, disclosure review, inspection and policymaking roles.
A registrant is required to disclose the information specified by Form N-CSR, and the Commission will make this information public. A registrant is not required to respond to the collection of information contained in Form N-CSR unless the Form displays a currently valid Office of Management and Budget ("OMB") control number. Please direct comments concerning the accuracy of the information collection burden estimate and any suggestions for reducing the burden to Secretary, Securities and Exchange Commission, 450 Fifth Street, NW, Washington, DC 20549-0609. The OMB has reviewed this collection of information under the clearance requirements of 44 U.S.C. § 3507.
Item 1. Reports to Stockholders.
Paradigm Funds
Paradigm Value Fund
Paradigm Opportunity Fund
Paradigm Select Fund
For Investors Seeking Long-Term Capital Appreciation
SEMI-ANNUAL REPORT
June 30, 2006
Table of Contents
Paradigm Value Fund
Letter to Shareholders
2
Sector Allocation
3
Performance Information
3
Schedule of Investments
4
Statement of Assets and Liabilities
7
Statement of Operations
7
Statement of Changes in Net Assets
8
Financial Highlights
8
Paradigm Opportunity Fund
Letter to Shareholders
9
Sector Allocation
10
Performance Information
10
Schedule of Investments
11
Statement of Assets and Liabilities
13
Statement of Operations
13
Statement of Changes in Net Assets
14
Financial Highlights
14
Paradigm Select Fund
Letter to Shareholders
15
Sector Allocation
16
Performance Information
16
Schedule of Investments
17
Statement of Assets and Liabilities
20
Statement of Operations
20
Statement of Changes in Net Assets
21
Financial Highlights
21
NOTES TO FINANCIAL STATEMENTS
22
DISCLOSURE OF EXPENSES
25
OTHER INFORMATION
26
2006 Semi-Annual Report 1
Paradigm Value Fund
Letter to Shareholders
We enjoyed a very successful year in 2005. We handily beat our benchmark the Russell 2000 Value Index and registered one of the best performances for "small cap value" funds. The Russell 2000 Value Index was up a modest 4.71%, trailing the broad market and the average of the last decade. Stock selection, our chosen tool, seems to have worked well.
In 2005, the fund generated double-digit returns in nine out of the twelve Russell 2000 Value sectors and outperformed the Russell in nine of those sectors. Other/Multi-Sector was the top contributor to excess return, other sectors contributing to excess return included Other Energy, Producer Durables and Materials & Processing. No one sector was a material detractor from return, though Financial Services was challenging.
Our largest holding, Foster Wheeler, was the largest individual contributor. This engineering and construction company, on the brink of failure just a few years ago, completed a financial restructuring and worked through problem contracts. The firm is now positioned for strong demand for its services in refineries, petrochemical facilities and liquidified natural gas. Other top performers for the year were Frontier Oil, Intergraph Corp. and Blair Corp.
But that's all in the past. The New Year is looking challenging. While the economy is continuing to expand, valuations are high and rising interest rates are threatening to reduce equity valuations.
That sounds a lot like what we said last year and in fact we were right. Returns in the domestic equity markets were generally lackluster and we do not expect the New Year to be much different.
Your team at Paradigm Funds Advisor does not change its methods or goals due to market outlooks. We endeavor to use our skills in stock selection to add value over the long term. We are having to work harder to find great values and we are being more cautious in evaluating the financial strength and earnings power of the stocks which we select.
We continue to focus our analysis on the strength of the company's business franchise, the ability of the management team, the near-term prospects for improving returns and relative valuation. We believe that this simple strategy will reward our investors over the long term.
Thank you for your continued confidence.
Sincerely,
![[paradigmncsr2006semiannua001.jpg]](https://capedge.com/proxy/N-CSRS/0001162044-06-000450/paradigmncsr2006semiannua001.jpg)
John B. Walthausen, CFA
2006 Semi-Annual Report 2
Paradigm Value Fund
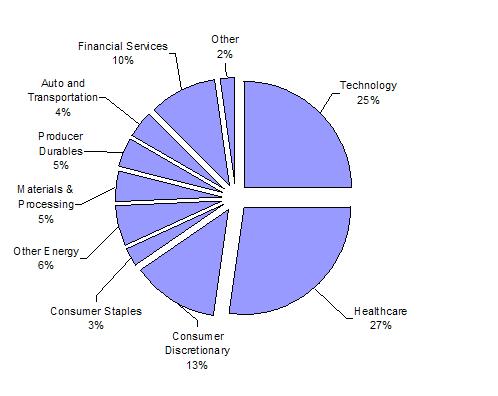
PARADIGM VALUE FUND
Sector Allocation (Unaudited)
(As a Percentage of Common Stock Held)
![[paradigmncsr2006semiannua002.jpg]](https://capedge.com/proxy/N-CSRS/0001162044-06-000450/paradigmncsr2006semiannua002.jpg)
PERFORMANCE INFORMATION (Unaudited)
Average Annual Rate of Return (%) for The Periods Ended June 30, 2006
(Fund Inception January 1, 2003)
June 30, 2006 NAV $45.57
Since
1 Year(A)
3 Year(A)
Inception (A)
Paradigm Value Fund
18.42%
29.86%
32.83%
S&P 600 Index(B)
13.93%
20.45%
21.46%
Russell 2000 Value Index(C)
14.61%
21.01%
23.11%
(A)1 Year, 3 Year and Since Inception returns include change in share prices and in each case includes reinvestment of any dividends and capital gain distributions.
(B)The S&P 600 index is a small capitalization benchmark index made up of 600 domestic stocks chosen for market size, liquidity and industry group representation whose composition is different from the Fund. For purposes of the graph and the accompanying table, it is assumed that all dividends and distributions were reinvested.
(C)The Russell 2000® Value Index is an unmanaged index of small-capitalization stocks with lower price-to-book ratios and lower forecasted growth values than the total population of small-capitalization stocks whose composition is different from the Fund. For purposes of the graph and the accompanying table, it is assumed that all dividends and distributions were reinvested.
PAST PERFORMANCE DOES NOT GUARANTEE FUTURE RESULTS. INVESTMENT RETURN AND PRINCIPAL VALUE WILL FLUCTUATE SO THAT SHARES, WHEN REDEEMED, MAY BE WORTH MORE OR LESS THAN THEIR ORIGINAL COST. RETURNS DO NOT REFLECT THE DEDUCTION OF TAXES THAT A SHAREHOLDER WOULD PAY ON FUND DISTRIBUTIONS OR THE REDEMPTION OF FUND SHARES. CURRENT PERFORMANCE MAY BE LOWER OR HIGHER THAT THE PERFORMANCE DATA QUOTED. TO OBTAIN PERFORMANCE DATA CURRENT TO THE MOST RECENT MONTH END, PLEASE CALL 1-800-239-0732.
2006 Semi-Annual Report 3
Paradigm Value Fund |
|
|
| |
Schedule of Investments | ||||
June 30, 2006 (Unaudited) | ||||
Shares/Principal Amount |
| Market Value | % of Net Assets | |
COMMON STOCKS | ||||
Agricultural Chemicals | ||||
13,000 | LESCO Inc. * | $ 202,020 | 0.49% | |
Air Transportation, Scheduled | ||||
64,100 | Frontier Airlines Holdings, Inc. * | 462,161 | 1.12% | |
Air-Cond & Warm Air Heating Equipment | ||||
1,600 | Mestek Inc. * | 26,560 | 0.06% | |
Aircraft Engines & Engine Parts | ||||
3,500 | Sequa Corp. * Class A | 285,250 | 0.69% | |
Aircraft Parts & Auxiliary Equipment | ||||
20,000 | CPI Aerostructures Inc. * | 144,000 | 0.35% | |
Asphalt Paving & Roofing Materials | ||||
26,100 | ElkCorp. | 724,797 | 1.75% | |
Ball & Roller Bearings | ||||
35,000 | NN Inc. | 432,250 | 1.04% | |
Canned, Frozen & Preserved Fruit, Veg & Food Specialties | ||||
23,500 | Corn Products International Inc. | 719,100 | 1.74% | |
Commercial Printing | ||||
10,000 | Banta Corp. | 463,300 | ||
19,000 | Cadmus Communications Corp. | 332,120 | ||
795,420 | 1.92% | |||
Communications Services | ||||
42,500 | LodgeNet Entertainment Corp. * | 792,625 | 1.91% | |
Computer Communications Equipment | ||||
10,200 | Black Box Corp. | 390,966 | 0.94% | |
Construction - Special Trade Contractors | ||||
14,800 | Layne Christensen Co. * | 419,580 | 1.01% | |
Crude Petroleum & Natural Gas | ||||
10,300 | Denbury Resources Inc. * | 326,201 | ||
40,000 | Natural Gas Systems Inc. * | 116,000 | ||
6,100 | Whiting Petroleum Corp. * | 255,407 | ||
697,608 | 1.69% | |||
Deep Sea Foreign Transportation of Freight | ||||
7,600 | Seacor Holdings Inc. * | 623,960 | 1.51% | |
Electric Services | ||||
185,000 | Aquila Inc. * | 778,850 | ||
6,100 | Cleco Corp. | 141,825 | ||
920,675 | 2.22% | |||
Electrical Industrial Apparatus | ||||
23,500 | Woodward Governor Co. | 716,985 | 1.73% | |
Electronic Components & Accessories | ||||
38,000 | AVX Corp. | 600,020 | 1.45% | |
Electronic Components, NEC | ||||
46,350 | Spectrum Control Inc. * | 428,738 | 1.04% | |
Fire, Marine & Casualty Insurance | ||||
44,000 | 21st Century Insurance Group | 633,600 | 1.53% | |
Food and Kindred Products | ||||
18,500 | Flowers Foods Inc. | 529,840 | 1.28% | |
Games, Toys & Children's Vehicles (No Dolls & Bicycles) | ||||
28,500 | JAKKS Pacific Inc. * | 572,565 | 1.38% | |
Glass Products | ||||
31,700 | Apogee Enterprises Inc. | 465,990 | 1.13% | |
Greeting Cards | ||||
19,935 | CSS Industries Inc. | 573,131 | 1.38% | |
*Non-Income Producing Securities.
The accompanying notes are an integral part of these
financial statements.
2006 Semi-Annual Report 4
Paradigm Value Fund |
|
|
| |
Schedule of Investments | ||||
June 30, 2006 (Unaudited) | ||||
Shares/Principal Amount |
| Market Value | % of Net Assets | |
COMMON STOCKS | ||||
Heavy Construction Other Than Bldg Const - Contractors | ||||
37,200 | Foster Wheeler Ltd. * | 1,607,040 | 3.88% | |
Household Furniture | ||||
57,500 | Tempur Pedic International Inc. * | 776,825 | 1.88% | |
Industrial Instruments For Measurement, Display and Control | ||||
11,300 | K-Tron International Inc. * | 576,300 | 1.39% | |
Industrial Trucks, Tractors, Trailers & Stackers | ||||
17,400 | Cascade Corp. | 688,170 | 1.66% | |
Insurance Carriers | ||||
24,400 | Pre-Paid Legal Services Inc. | 841,800 | 2.03% | |
Life Insurance | ||||
�� 2,400 | National Western Life Insurance Co. * | 575,160 | 1.39% | |
Magnetic & Optical Recording Media | ||||
13,300 | Imation Corp. | 545,965 | 1.32% | |
Measuring & Controlling Devices | ||||
23,900 | Measurement Specialties Inc. * | 532,253 | 1.29% | |
Miscellaneous Chemical Products | ||||
14,100 | WD-40 Co. | 473,337 | 1.14% | |
Miscellaneous Electrical Machinery, Equipment & Supplies | ||||
13,900 | United Industrial Corp. + | 628,975 | 1.52% | |
Miscellaneous Industrial & Commercial Machinery & Equipment | ||||
26,200 | Curtiss-Wright Corp. | 809,056 | 1.95% | |
Mobile Homes | ||||
5,000 | Cavco Industries Inc. * | 222,200 | 0.54% | |
Motor Vehicle Parts & Accessories | ||||
27,900 | Drew Industries Inc. * | 903,960 | 2.18% | |
Nonferrous Foundries | ||||
19,000 | Superior Essex Inc. * | 568,670 | 1.37% | |
Office Furniture | ||||
37,000 | MITY Enterprises Inc. * | 667,850 | 1.61% | |
Petroleum Refining | ||||
25,400 | Frontier Oil Corp. | 822,960 | ||
7,000 | Suncor Energy Inc. | 567,070 | ||
1,390,030 | 3.36% | |||
Plastic Materials, Synth Resins & Non-vulcan Elastomers | ||||
20,300 | Rogers Corp. * | 1,143,702 | 2.76% | |
Public Building & Related Furniture | ||||
33,559 | Virco Manufacturing Corp. * | 167,795 | 0.41% | |
Railroads, Line-Haul Operating | ||||
15,900 | Kansas City Southern * + | 440,430 | 1.06% | |
Real Estate Dealers (For Their Own Account) | ||||
4,200 | Texas Pacific Land Trust | 624,750 | 1.51% | |
Refrigeration & Service Industry Machinery | ||||
23,300 | Standex International Corp. | 707,155 | 1.71% | |
Retail - Catalog & Mail-Order Houses | ||||
12,656 | Blair Corp. + | 376,516 | 0.91% | |
Retail - Grocery Stores | ||||
1,355 | Arden Group Inc. | 153,345 | 0.37% | |
Semiconductors & Related Devices | ||||
115,000 | Leadis Technology Inc. * | 634,800 | ||
122,000 | White Electronic Designs Corp. * | 619,760 | ||
1,254,560 | 3.03% | |||
+ Securities partially pledged as collateral on securities sold short.
*Non-Income Producing Securities.
The accompanying notes are an integral part of these
financial statements.
2006 Semi-Annual Report 5
Paradigm Value Fund |
|
|
| |
Schedule of Investments | ||||
June 30, 2006 (Unaudited) | ||||
Shares/Principal Amount |
| Market Value | % of Net Assets | |
COMMON STOCKS | ||||
Services - Automotive Repair, Service & Parking | ||||
18,800 | Monro Muffler Brake Inc. | 612,128 | 1.48% | |
Services - Business Services | ||||
28,100 | CBIZ Inc. * | 208,221 | 0.50% | |
Services - Computer Integrated Systems Design | ||||
24,000 | Intergraph Corp. * | 755,760 | 1.83% | |
Services - Educational Services | ||||
61,200 | Nobel Learning Communities Inc. * | 621,792 | 1.51% | |
Services - Equipment Rental & Leasing | ||||
34,500 | Rent-A-Center Inc. * | 857,670 | ||
41,000 | Interpool Inc. | 911,020 | ||
1,768,690 | 4.28% | |||
Services - Hospitals | ||||
44,400 | Rehabcare Group Inc. * | 771,672 | 1.87% | |
Services - Offices & Clinics of Doctors of Medicine | ||||
30,000 | Prospect Medical Holdings Inc. * | 165,000 | 0.40% | |
Services - Prepackaged Software | ||||
160,000 | Quovadx Inc. * | 412,800 | 1.00% | |
Sporting & Athletic Goods | ||||
80,600 | Escalade Inc. | 1,047,800 | 2.53% | |
Surgical & Medical Instruments & Apparatus | ||||
32,600 | Cantel Medical Corp. * | 464,224 | 1.12% | |
Telephone Communications | ||||
23,500 | D&E Communications Inc. | 254,740 | ||
14,400 | Leap Wireless International Inc. * | 683,280 | ||
938,020 | 2.27% | |||
Water, Sewer, Pipeline, Comm & Power Line Construction | ||||
13,500 | Preformed Line Products Co. | 511,650 | 1.24% | |
Wholesale - Groceries & Related Products | ||||
29,000 | Nash Finch Co. | 617,410 | 1.49% | |
Wholesale - Machinery, Equipment & Supplies | ||||
3,500 | Kaman Corp. | 63,700 | 0.15% | |
Wholesale - Medical, Dental & Hospital Equipment & Supplies | ||||
24,500 | Owens & Minor Inc. | 700,700 | 1.69% | |
Wood Household Furniture | ||||
15,000 | Ethan Allen Interiors Inc. | 548,250 | 1.32% | |
Total for Common Stock (Cost $32,860,008) | $ 39,041,502 | 94.31% | ||
Cash Equivalents | ||||
1,263,964 | SEI Daily Income Treasury Government CL B 4.37% ** | 1,263,964 | 3.06% | |
(Cost $1,263,964) | ||||
Total Investment Securities | 40,305,466 | 97.37% | ||
(Cost $34,123,972) | ||||
Other Assets In Excess of Liabilities | 1,089,903 | 2.63% | ||
| ||||
Net Assets | $ 41,395,369 | 100.00% | ||
Securities Sold Short | ||||
Common Stock | ||||
15,000 | American Vanguard Corp. | $ 232,200 | 0.56% | |
Total Securities Sold Short (Proceeds - $272,647) | $ 232,200 | |||
+ Securities partially pledged as collateral on securities sold short.
*Non-Income Producing Securities.
**Variable Rate Security; The Yield Rate shown
represents the rate at June 30, 2006.
The accompanying notes are an integral part of these
financial statements.
2006 Semi-Annual Report 6
Paradigm Value Fund |
|
Statement of Assets and Liabilities (Unaudited) | |
June 30, 2006 | |
Assets: | |
Investment Securities at Market Value | $ 40,305,466 |
(Cost - $34,123,972) | |
Cash | 30,069 |
Deposit with Brokers for Securities Sold Short | 210,869 |
Dividend Receivable | 12,383 |
Interest Receivable | 8,964 |
Receivable for Fund Shares Sold | 754,762 |
Receivable for Securities Sold | 544,687 |
Total Assets | 41,867,200 |
Liabilities: | |
Securities Sold Short, at Market Value (Proceeds - $ 272,647) | 232,200 |
Payable to Advisor | 65,444 |
Payable for Fund Shares Sold | 1,139 |
Payable for Securities Purchased | 173,048 |
Total Liabilities | 471,831 |
Net Assets | $ 41,395,369 |
Net Assets Consist of: | |
Paid In Capital | $ 34,411,366 |
Accumulated Net Investment Income (Loss) | (183,540) |
Accumulated Undistributed Realized Gain on Investments - Net | 945,602 |
Unrealized Appreciation in Value | |
of Investments Based on Cost - Net | 6,221,941 |
Net Assets, for 908,389 Shares Outstanding | $ 41,395,369 |
(Unlimited shares authorized, without par value) | |
Net Asset Value and Offering Price (Note 2) * | |
Per Share ($41,395,369/908,389 shares) | $ 45.57 |
Statement of Operations (Unaudited) | |
For the six months ended June 30, 2006 | |
Investment Income: | |
Dividends | $ 121,598 |
Interest | 44,462 |
Total Investment Income | 166,060 |
Expenses: | |
Investment Advisor Fees | 342,761 |
Interest Expense | 6,839 |
Total Expenses | 349,600 |
Net Investment Loss | (183,540) |
Realized and Unrealized Gain (Loss) on Investments: | |
Net Realized Gain on Investments | 962,394 |
Net Realized Gain on Short Positions | 38,763 |
Net Change in Unrealized Appreciation on Investments | 415,400 |
Net Change in Unrealized Appreciation on Short Positions | 3,823 |
Net Realized and Unrealized Gain on Investments | 1,420,380 |
Net Increase in Net Assets from Operations | $ 1,236,840 |
* Redemption price varies on length of time held (Note 2).
The accompanying notes are an integral part of these
financial statements.
2006 Semi-Annual Report 7
Paradigm Value Fund |
|
|
|
| |||
Statements of Changes in Net Assets | |||||||
(Unaudited) | |||||||
1/1/2006 | 1/1/2005 | ||||||
to | to | ||||||
6/30/2006 | 12/31/2005 | ||||||
From Operations: | |||||||
Net Investment Loss | $ (183,540) | $ (198,525) | |||||
Net Realized Gain on Investments | 1,001,157 | 1,208,085 | |||||
Change in Net Unrealized Appreciation | 419,223 | 2,649,198 | |||||
Increase in Net Assets from Operations | 1,236,840 | 3,658,758 | |||||
From Distributions to Shareholders: | |||||||
Net Investment Income | 0 | 0 | |||||
Net Realized Gain from Security Transactions | 0 | (1,056,140) | |||||
Total Distributions to Shareholders | 0 | (1,056,140) | |||||
From Capital Share Transactions: | |||||||
Proceeds From Sale of Shares | 18,824,794 | 9,866,980 | |||||
Proceeds from Redemption Fees (Note 2) | 62 | 0 | |||||
Shares Issued on Reinvestment of Dividends | 0 | 1,025,297 | |||||
Cost of Shares Redeemed | (2,668,217) | (4,021,340) | |||||
Net Increase from Shareholder Activity | 16,156,639 | 6,870,937 | |||||
Net Increase in Net Assets | 17,393,479 | 9,473,555 | |||||
Net Assets at Beginning of Period | 24,001,890 | 14,528,335 | |||||
Net Assets at End of Period (Including Accumulated Net Investment | |||||||
Income (Loss) of ($183,540) and $0, respectively) | $41,395,369 | $24,001,890 | |||||
Share Transactions: | |||||||
Issued | 408,572 | 245,658 | |||||
Reinvested | 0 | 23,823 | |||||
Redeemed | (59,671) | (97,330) | |||||
Net Increase in Shares | 348,901 | 172,151 | |||||
Shares Outstanding Beginning of Period | 559,488 | 387,337 | |||||
Shares Outstanding End of Period | 908,389 | 559,488 | |||||
Financial Highlights | |||||||
(Unaudited) | |||||||
Selected data for a share outstanding throughout the period: | 1/1/2006 | 1/1/2005 | 1/1/2004 | 1/1/2003 * | |||
to | to | to | to | ||||
6/30/2006 | 12/31/2005 | 12/31/2004 | 12/31/2003 | ||||
Net Asset Value - Beginning of Period | $ 42.90 | $ 37.51 | $ 28.83 | $ 20.00 | |||
Net Investment Loss *** | (0.24) | (0.40) | (0.44) | (0.33) | |||
Net Gains on Securities (realized and unrealized) | 2.91 | 7.75 | 9.69 | 12.52 | |||
Total from Investment Operations | 2.67 | 7.35 | 9.25 | 12.19 | |||
Distributions (From Net Investment Income) | 0.00 | 0.00 | 0.00 | 0.00 | |||
Distributions (From Capital Gains) | 0.00 | (1.96) | (0.57) | (3.36) | |||
Total Distributions | 0.00 | (1.96) | (0.57) | (3.36) | |||
Proceeds from Redemption Fee (Note 2) | 0.00 | (a) | 0.00 | 0.00 | 0.00 | ||
Net Asset Value - End of Period | $ 45.57 | $ 42.90 | $ 37.51 | $ 28.83 | |||
Total Return **** | 6.22% | 19.61% | 32.09% | 60.89% | |||
Ratios/Supplemental Data | |||||||
Net Assets - End of Period | $41,395,369 | $24,001,890 | $14,528,335 | $ 4,212,913 | |||
Ratio of Expenses to Average Net Assets, | |||||||
Excluding Dividends on Securities Sold Short | |||||||
and Interest Expense to Average Net Assets | 2.00% | ** | 2.00% | 1.99% | 2.00% | ||
Ratio of Dividend Expense on Securities Sold Short | |||||||
and Interest Expense to Average Net Assets | 0.03% | ** | 0.06% | 0.04% | 0.00% | ||
Ratio of Expenses to Average Net Assets | 2.03% | ** | 2.06% | 2.03% | 2.00% | ||
Ratio of Net Investment Loss to Average Net Assets | -1.07% | ** | -0.98% | -1.34% | -1.28% | ||
Portfolio Turnover Rate | 30.99% | 67.39% | 91.66% | 138.81% |
* Commencement of operations. **Annualized. ***Per share amount calculated using the average shares method. ****Total return in the above table represents the rate that the investor would have earned or lost on an investment in the fund assuming reinvestment of dividends. Returns do not reflect the deduction of taxes a shareholder would pay on Fund distributions or redemption of Fund shares.
(a) Amount rounds to less than $0.01 per share.
The accompanying notes are an integral part of these
financial statements.
2006 Semi-Annual Report 8
Paradigm Opportunity Fund
Letter to Shareholders
The Paradigm Opportunity Fund (the "Fund") declined 2.72% for the first 6 months of 2006 compared to a return of 10.44% for its small cap benchmark, the Russell 2000 Value Index ("R2000V").
The stock market was volatile in the first half of 2006, particularly in the small cap arena. Small caps surged out of the gate with the R2000V up 8.27% in January and 13.51% in the first quarter. Strong economic and corporate profit growth drove the cyclical Information Technology and Industrial sectors. Energy and Materials stocks benefited from oil and commodity prices reaching multi-decade highs in some cases. After advancing 16.68% through May 5th and achieving an all-time high, the R2000V corrected 11.20% to its June 14th low. Investor concerns over higher interest rates, inflationary pressures, and slowing economic growth dominated the headlines. Markets treaded water until the Federal Reserve raised rates another 25bps to 5.25% on June 29. Investors interpreted the Fed's policy statement as less hawkish compared to recent public comments from a number of officials, which set off a buying spree aided by th e Russell rebalance that drove the R2000V up 5.02% over the last 2 days of the quarter.
The Fund's under performance relative to the R2000V was partially attributable to its large cash position in the first quarter during which the index returned 13.51%. The Fund invested the excess cash over the first quarter and was fully invested by April. Performance was also negatively impacted by the Fund's decision to overweight the Health Care and Information Technology sectors. These two sectors were a combined 50% of assets in the second quarter. The Health Care and Information Technology sectors were two of the weakest performing sectors in the benchmark in the second quarter with declines of 4.72% and 10.46%, respectively.
Top performing stocks in the first half of the year included Sciele Pharma, Bio-Reference Labs, and MRO Software. Bio-Reference Labs has a strong presence in the New York metro region and a rapidly growing national franchise. After a year of reimbursement challenges and investments for long-term growth, the company was poised to expand operating margins and accelerate earnings growth in 2006. Strong first and second quarter financial results validated our investment thesis and propelled the stock up 32%, at which point the Fund locked in its gains with the achievement of our price target.
Turning our attention to the balance of 2006 and beyond, interest rates, inflation, economic growth, and profit growth will remain center stage. In addition, debate on whether the small cap out performance cycle has run its course is becoming increasingly prevalent. The upcoming second quarter earnings season will be closely watched for slowing profit growth and all eyes will be on the Federal Reserve for direction on interest rates and inflation. Until a clear trend emerges, stocks will likely remain volatile over the short-term. Given this backdrop, the Fund continues to focus on identifying quality companies offering attractive valuations, margin expansion potential, and sustainable earnings growth.
Sincerely,
![[paradigmncsr2006semiannua003.jpg]](https://capedge.com/proxy/N-CSRS/0001162044-06-000450/paradigmncsr2006semiannua003.jpg)
Jason V. Ronovech, CFA
2006 Semi-Annual Report 9
Paradigm Opportunity Fund
PARADIGM OPPORTUNITY FUND
Sector Allocation (Unaudited)
(As a Percentage of Common Stock Held)
PERFORMANCE INFORMATION (Unaudited)
Average Annual Rate of Return (%) for The Periods Ended June 30, 2006
(Fund Inception January 1, 2005)
June 30, 2006 NAV $20.75
Since
1 Year(A)
Inception (A)
Paradigm Opportunity Fund
3.64%
3.15%
Russell 2000 Value Index(B)
14.61%
10.20%
Russell 2000 Index(C)
14.58%
8.60%
(A)1 Year and Since Inception returns include change in share prices and in each case includes reinvestment of any dividends and capital gain distributions.
(B)The Russell 2000® Value Index is an unmanaged index of small-capitalization stocks with lower price-to-book ratios and lower forecasted growth values than the total population of small-capitalization stocks whose composition is different from the Fund. For purposes of the graph and the accompanying table, it is assumed that all dividends and distributions were reinvested.
(C)The Russell 2000® Index consists of the smallest 2,000 companies in the Russell 3000 Index (which represents approximately 98% of the investable U.S. equity market). The Index is an unmanaged index generally considered as the premier of small capitalization stocks. For purposes of the graph and the accompanying table, it is assumed that all dividends and distributions were reinvested Given the Paradigm Opportunity Fund’s stock selection and sector allocation strategies the Russell 2000® Index is more representative than the Russell 2000® Value Index and therefore has been added.
PAST PERFORMANCE DOES NOT GUARANTEE FUTURE RESULTS. INVESTMENT RETURN AND PRINCIPAL VALUE WILL FLUCTUATE SO THAT SHARES, WHEN REDEEMED, MAY BE WORTH MORE OR LESS THAN THEIR ORIGINAL COST. RETURNS DO NOT REFLECT THE DEDUCTION OF TAXES THAT A SHAREHOLDER WOULD PAY ON FUND DISTRIBUTIONS OR THE REDEMPTION OF FUND SHARES. CURRENT PERFORMANCE MAY BE LOWER OR HIGHER THAT THE PERFORMANCE DATA QUOTED. TO OBTAIN PERFORMANCE DATA CURRENT TO THE MOST RECENT MONTH END, PLEASE CALL 1-800-239-0732.
2006 Semi-Annual Report 10
Paradigm Opportunity Fund |
|
|
| |
Schedule of Investments | ||||
June 30, 2006 (Unaudited) | ||||
Shares/Principal Amount |
| Market Value | % of Net Assets | |
COMMON STOCKS | ||||
Communications Services | ||||
2,000 | Hughes Communications, Inc. * | $ 70,000 | 2.19% | |
Crude Petroleum & Natural Gas | ||||
1,600 | Unit Corp. * | 91,024 | 2.84% | |
Electromedical & Electrotherapeutic Apparatus | ||||
4,600 | Syneron Medical Ltd. * | 96,048 | 3.00% | |
Industrial Inorganic Chemicals | ||||
1,400 | Mineral Technologies Inc. | 72,800 | 2.27% | |
Investment Management Company | ||||
5,600 | MCG Capital Corporation | 89,040 | 2.78% | |
Laboratory Analytical Instruments | ||||
6,300 | PerkinElmer Inc. | 131,670 | 4.11% | |
Mining & Quarrying of Nonmetallic Minerals (No Fuels) | ||||
2,600 | Amcol International Corp. | 68,510 | 2.14% | |
Miscellaneous Food Preparation & Kindred Products | ||||
2,100 | Green Mountain Coffee Roasters Inc. * | 84,357 | 2.63% | |
National Commercial Banks | ||||
2,400 | First Midwest Bancorp Inc. | 88,992 | 2.78% | |
Oil & Gas Field Machinery & Equipment | ||||
1,200 | Hydril Co. * | 94,224 | 2.94% | |
Orthopedic, Prosthetic & Surgical Appliances & Supplies | ||||
1,600 | Mentor Corp. | 69,600 | ||
�� 3,700 | Respironics Inc. * | 126,614 | ||
196,214 | 6.13% | |||
Perfumes, Cosmetics & Other Toilet Preparations | ||||
6,600 | Parlux Fragrances Inc. * | 63,954 | 2.00% | |
Pharmaceutical Preparations | ||||
5,300 | K V Pharmaceutical Co. * | 98,898 | ||
5,300 | Sciele Pharma Inc. * | 122,907 | ||
221,805 | 6.93% | |||
Printing Trades Machinery & Equipment | ||||
8,000 | Presstek Inc. * | 74,480 | 2.33% | |
Radio & TV Broadcasting & Communications Equipment | ||||
6,000 | Radyne Corp. * | 68,280 | ||
5,200 | ViaSat Inc. * | 133,536 | ||
201,816 | 6.30% | |||
Real Estate Investment Trusts | ||||
9,600 | Highland Hospitality Corp. | 135,168 | 4.22% | |
Retail - Apparel & Accessory Stores | ||||
4,400 | Pacific Sunwear of California Inc. * | 78,892 | 2.46% | |
Retail - Miscellaneous Shopping | ||||
4,500 | Big 5 Sporting Goods Corp. | 87,750 | 2.74% | |
Retail - Reatail Stores | ||||
4,000 | Petsmart Inc. | 102,400 | 3.20% | |
Search, Detection, Navagation, Guidance, Aeronautical Systems | ||||
2,051 | DRS Technologies Inc. | 99,986 | ||
2,900 | FLIR Systems Inc. * | 66,410 | ||
166,396 | 5.21% | |||
Services - Commercial Physical & Biological Research | ||||
4,400 | PRA International * | 97,988 | 3.06% | |
Services - Medical Laboratories | ||||
1,800 | Bio-Reference Laboratories Inc. * | 39,168 | 1.22% | |
*Non-Income Producing Securities.
The accompanying notes are an integral part of these
financial statements.
2006 Semi-Annual Report 11
Paradigm Opportunity Fund |
|
|
| |
Schedule of Investments | ||||
June 30, 2006 (Unaudited) | ||||
Shares/Principal Amount |
| Market Value | % of Net Assets | |
COMMON STOCKS | ||||
Services - Motion Picture Theaters | ||||
3,200 | Regal Entertainment Group | 65,024 | 2.03% | |
Service - Prepackaged Software | ||||
11,600 | Epicor Software Corp. * | 122,148 | ||
4,400 | MRO Software Inc. * | 88,308 | ||
10,000 | Parametric Technology Corp. * | 127,100 | ||
337,556 | 10.54% | |||
Surgical & Medical Instruments & Apparatus | ||||
6,900 | Cardiac Science Corporation * | 54,441 | ||
3,400 | Orthofix International NV * ** | 129,574 | ||
184,015 | 5.75% | |||
Trucking (No Local) | ||||
5,000 | JB Hunt Transport Services Inc. | 124,550 | 3.89% | |
Total for Common Stock (Cost $3,080,006) | $ 3,063,841 | 95.69% | ||
Cash Equivalents | ||||
43,552 | SEI Daily Income Treasury Government CL B 4.37% *** | 43,552 | 1.36% | |
(Cost $43,552) | ||||
Total Investment Securities | 3,107,393 | 97.05% | ||
(Cost $3,123,558) | ||||
Other Assets in Excess of Liabilities | 94,425 | 2.95% | ||
| ||||
Net Assets | $ 3,201,818 | 100.00% | ||
*Non-Income Producing Securities.
**ADR - American Depository Receipt.
***Variable Rate Security; The Yield Rate shown represents
the rate at June 30, 2006.
The accompanying notes are an integral part of these
financial statements.
2006 Semi-Annual Report 12
Paradigm Opportunity Fund |
|
Statement of Assets and Liabilities (Unaudited) | |
June 30, 2006 | |
Assets: | |
Investment Securities at Market Value | $ 3,107,393 |
(Cost - $ $3,123,558) | |
Receivable from Advisor | 1,263 |
Receivable for Securities Sold | 91,558 |
Dividend Receivable | 5,916 |
Interest Receivable | 874 |
Total Assets | 3,207,004 |
Liabilities: | |
Payable to Advisor | 5,186 |
Total Liabilities | 5,186 |
Net Assets | $ 3,201,818 |
Net Assets Consist of: | |
Paid In Capital | $ 3,173,672 |
Accumulated Net Investment Loss | (2,845) |
Accumulated Realized Gain on Investments - Net | 47,156 |
Unrealized Appreciation (Depreciation) in Value | |
of Investments Based on Cost - Net | (16,165) |
Net Assets, for 154,271 Shares Outstanding | $ 3,201,818 |
(Unlimited shares authorized, without par value) | |
Net Asset Value and Offering Price (Note 2) * | |
Per Share ($3,201,818/154,271 shares) | $ 20.75 |
Statement of Operations (Unaudited) | |
For the six months ended June 30, 2006 | |
Investment Income: | |
Dividends | $ 12,870 |
Interest | 9,239 |
Total Investment Income | 22,109 |
Expenses: | |
Investment Advisor Fees | 33,367 |
Total Expenses | 33,367 |
Less: Expenses Waived | (8,342) |
Net Expenses | 25,025 |
Net Investment Loss | (2,916) |
Realized and Unrealized Gain (Loss) on Investments: | |
Realized Gain on Investments | 47,141 |
Net Change in Unrealized Depreciation on Investments | (132,462) |
Net Realized and Unrealized Loss on Investments | (85,321) |
Net Decrease in Net Assets from Operations | $ (88,237) |
* Redemption price varies on length of time held (Note 2).
The accompanying notes are an integral part of these
financial statements.
2006 Semi-Annual Report 13
Paradigm Opportunity Fund |
|
|
|
Statement of Changes in Net Assets | |||
(Unaudited) | |||
1/1/2006 | 1/1/2005* | ||
to | to | ||
6/30/2006 | 12/31/2005 | ||
From Operations: | |||
Net Investment Income (Loss) | $ (2,916) | $ 3,609 | |
Net Realized Gain on Investments | 47,141 | 27,181 | |
Net Change in Net Unrealized Appreciation | (132,462) | 116,297 | |
Increase in Net Assets from Operations | (88,237) | 147,087 | |
From Distributions to Shareholders: | |||
Net Investment Income | 0 | (3,538) | |
Net Realized Gain from Security Transactions | 0 | (27,166) | |
Change in Net Assets from Distributions | 0 | (30,704) | |
From Capital Share Transactions: | |||
Proceeds From Sale of Shares | 6,424 | 3,147,652 | |
Proceeds From Redemption Fees (Note 2) | 0 | 0 | |
Shares Issued on Reinvestment of Dividends | 0 | 30,704 | |
Cost of Shares Redeemed | (4,927) | (6,181) | |
Net Increase from Shareholder Activity | 1,497 | 3,172,175 | |
Net Increase/Decrease in Net Assets | (86,740) | 3,288,558 | |
Net Assets at Beginning of Period | 3,288,558 | 0 | |
Net Assets at End of Period (Including Accumulated Net Investment | |||
Income (Loss) of ($2,845) and $71, respectively) | $ 3,201,818 | $ 3,288,558 | |
Share Transactions: | |||
Issued | 292 | 153,082 | |
Reinvested | 0 | 1,435 | |
Redeemed | (220) | (318) | |
Net Increase in Shares | 72 | 154,199 | |
Shares Outstanding Beginning of Period | 154,199 | - | |
Shares Outstanding End of Period | 154,271 | 154,199 | |
Financial Highlights | |||
(Unaudited) | |||
Selected data for a share outstanding throughout the period: | 1/1/2006 | 1/1/2005* | |
to | to | ||
6/30/2006 | 12/31/2005 | ||
Net Asset Value - Beginning of Period | $ 21.33 | $ 20.00 | |
Net Investment Income (Loss) *** | (0.02) | 0.04 | |
Net Gains (Loss) on Securities (realized and unrealized) | (0.56) | 1.49 | |
Total from Investment Operations | (0.58) | 1.53 | |
Distributions (From Net Investment Income) | 0.00 | (0.02) | |
Distributions (From Capital Gains) | 0.00 | (0.18) | |
Total Distributions | 0.00 | (0.20) | |
Proceeds from Redemption Fee (Note 2) | 0.00 | 0.00 | |
Net Asset Value - End of Period | $ 20.75 | $ 21.33 | |
Total Return **** | (2.72)% | 7.65% | |
Ratios/Supplemental Data | |||
Net Assets - End of Period | $ 3,201,818 | $ 3,288,558 | |
Before Reimbursement | |||
Ratio of Expenses to Average Net Assets | 2.00% | ** | 2.00% |
Ratio of Net Investment Loss to Average Net Assets | -0.67% | ** | -0.11% |
After Reimbursement | |||
Ratio of Expenses to Average Net Assets ***** | 1.50% | ** | 1.69% |
Ratio of Net Investment Income to Average Net Assets ***** | -0.17% | ** | 0.21% |
Portfolio Turnover Rate | 52.87% | 129.06% |
* Commencement of operations. ** Annualized.
*** Per share amount calculated using the average shares method.
**** Total return in the above table represents the rate that the investor would have earned or lost on an investment in the Fund assuming reinvestment of dividends. Returns do not reflect the deduction of taxes a shareholder would pay on Fund distributions or redemption of Fund shares.
***** Such percentages reflect an expense waiver.
The accompanying notes are an integral part of these
financial statements.
2006 Semi-Annual Report 14
Paradigm Select Fund
Letter to Shareholders
As we had expected, 2006 has its challenges. We had expected the markets to worry that the economic expansion is aging, energy and other commodity costs are up and the Federal Reserve is moving interest rates up. None of these factors are good for equity markets. Even so the stock market was strong in the first quarter, but then the issues that worried us started to emerge and the small cap indexes pulled back. Value stocks have again done better than growth, and our Fund with a gain of 8.51% beat the Russell 2000 index benchmark which returned 8.21%.
We continued to concentrate on companies with what we believe to be good and improving returns on capital, strong balance sheets, ample free cash flow and moderate valuation. And there were several instances which showed this strategy to our advantage. Two of our holdings (Aviall and Stewart & Stevenson) were acquired by other companies. In both cases we thought that the value of the companies was being substantially improved by management actions and in fact, we were doing well with the stocks even before strategic buyers stepped in with takeover offers. In other instances we benefited when well conceived investments began to bear fruit in favorable earnings and stock price moves. For example, Commercial Metals' management has built a different type of steel company. By aggressive investment in recycling, scrap, fabrication and trading, they are leveraging the sizable investment in steel making, gaining useful information about the market and producing a more stable flow of earnings than their peers. Another example is Denbury Resources which has paired its investment in aged oil fields with the ownership of a major natural reserve of carbon dioxide gas to help extract remaining oil reserves from those old fields.
Looking forward, July has started out on a down note amid worries of higher rates, inflation and a slowing growth pattern. We will continue to focus on stock selection, endeavoring to pick the most promising of the stocks which meet our criteria.
Your team at Paradigm Funds Advisor LLC does not change its methods or goals due to market outlooks. We endeavor to use our skills in stock selection to add value over the long term. We are having to work harder to find great values and we are being more cautious in evaluating the financial strength and earnings power of the stocks which we select.
We continue to focus our analysis on the strength of the company's business franchise, the ability of the management team, the near-term prospects for improving returns and relative valuation. We believe that this simple strategy will reward our investors over the long term.
Thank you for your continued confidence.
Sincerely,
![[paradigmncsr2006semiannua005.jpg]](https://capedge.com/proxy/N-CSRS/0001162044-06-000450/paradigmncsr2006semiannua005.jpg)
John B. Walthausen, CFA
2006 Semi-Annual Report 15
Paradigm Select Fund
PARADIGM SELECT FUND
Sector Allocation (Unaudited)
(As a Percentage of Common Stock Held)
![[paradigmncsr2006semiannua006.jpg]](https://capedge.com/proxy/N-CSRS/0001162044-06-000450/paradigmncsr2006semiannua006.jpg)
PERFORMANCE INFORMATION (Unaudited)
Average Annual Rate of Return (%) for The Periods Ended June 30, 2006
(Fund Inception January 1, 2005)
June 30, 2006 NAV $24.23
Since
1 Year(A)
Inception(A)
Paradigm Select Fund
15.03%
14.04%
Russell 2000 Index(B)
14.58%
8.60%
(A)1 Year and Since Inception returns include change in share prices and in each case includes reinvestment of any dividends and capital gain distributions.
(B)The Russell 2000® Index consists of the smallest 2,000 companies in the Russell 3000 Index (which represents approximately 98% of the investable U.S. equity market). The Index is an unmanaged index generally considered as the premier of small capitalization stocks. For purposes of the graph and the accompanying table, it is assumed that all dividends and distributions were reinvested.
PAST PERFORMANCE DOES NOT GUARANTEE FUTURE RESULTS. INVESTMENT RETURN AND PRINCIPAL VALUE WILL FLUCTUATE SO THAT SHARES, WHEN REDEEMED, MAY BE WORTH MORE OR LESS THAN THEIR ORIGINAL COST. RETURNS DO NOT REFLECT THE DEDUCTION OF TAXES THAT A SHAREHOLDER WOULD PAY ON FUND DISTRIBUTIONS OR THE REDEMPTION OF FUND SHARES. CURRENT PERFORMANCE MAY BE LOWER OR HIGHER THAT THE PERFORMANCE DATA QUOTED. TO OBTAIN PERFORMANCE DATA CURRENT TO THE MOST RECENT MONTH END, PLEASE CALL 1-800-239-0732.
2006 Semi-Annual Report 16
Paradigm Select Fund |
|
|
| |
Schedule of Investments | ||||
June 30, 2006 (Unaudited) | ||||
Shares/Principal Amount |
| Market Value | % of Net Assets | |
COMMON STOCKS | ||||
Agricultural Production - Crops | ||||
2,800 | Chiquita Brands International Inc. | $ 38,584 | 1.24% | |
Blankbooks, Looseleaf Binders & Bookbinding & Related Work | ||||
1,200 | John H. Harland Company | 52,200 | 1.67% | |
Books: Publishing or Publishing & Printing | ||||
1,600 | Scholastic Corp. * | 41,552 | 1.33% | |
Canned, Frozen & Preserved Fruit, Veg & Food Specialties | ||||
1,100 | Lancaster Colony Corp. | 43,417 | 1.39% | |
Cement, Hydraulic | ||||
1,100 | Eagle Materials Inc. | 52,250 | 1.67% | |
Communications Equipment | ||||
2,200 | Checkpoint Systems Inc. * | 48,862 | 1.57% | |
Computer Storage Devices | ||||
2,700 | Overland Storage Inc. * | 18,090 | 0.58% | |
Crude Petroleum & Natural Gas | ||||
1,300 | Denbury Resources Inc. * | 41,171 | ||
600 | Swift Energy Co. * | 25,758 | ||
66,929 | 2.14% | |||
Drilling Oil & Gas Wells | ||||
2,600 | Parker Drilling Co. * | 18,668 | 0.60% | |
Electric & Other Services Combined | ||||
3,000 | CMS Energy Corp. * | 38,820 | ||
1,900 | Pepco Holdings Inc. | 44,802 | ||
83,622 | 2.68% | |||
Electric Services | ||||
2,200 | Duquesne Light Holdings Inc. | 36,168 | ||
6,200 | Dynegy Inc. * | 33,914 | ||
70,082 | 2.25% | |||
Electrical Industrial Apparatus | ||||
1,800 | Woodward Governor Co. | 54,918 | 1.76% | |
Electronic Components & Accessories | ||||
2,900 | AVX Corp. | 45,791 | 1.47% | |
Fabricated Rubber Products | ||||
700 | Carlisle Companies Inc. | 55,510 | ||
1,000 | West Pharmaceutical Services, Inc. | 36,280 | ||
91,790 | 2.94% | |||
Fire, Marine & Casualty Insurance | ||||
200 | Alleghany Inc. * | 55,272 | ||
1,400 | HCC Insurance Holdings Inc. | 41,216 | ||
96,488 | 3.09% | |||
Food & Kindred Products | ||||
1,650 | Flowers Foods Inc. | 47,256 | 1.51% | |
Heavy Construction | ||||
600 | Jacobs Engineering Group Inc. * | 47,784 | 1.53% | |
Hospital & Medical Service Plans | ||||
900 | Humana Inc. * | 48,330 | 1.55% | |
Household Furniture | ||||
3,300 | Tempur Pedic International Inc. * | 44,583 | 1.43% | |
Magnetic & Optical Recording Media | ||||
1,000 | Imation Corp. | 41,050 | 1.32% | |
Meat Packing Plants | ||||
1,400 | Hormel Foods Corp. | 51,996 | 1.67% | |
*Non-Income Producing Securities.
The accompanying notes are an integral part of these
financial statements.
2006 Semi-Annual Report 17
Paradigm Select Fund |
|
|
| |
Schedule of Investments | ||||
June 30, 2006 (Unaudited) | ||||
Shares/Principal Amount |
| Market Value | % of Net Assets | |
COMMON STOCKS | ||||
Miscellaneous Electrical Machinery, Equipment, & Supplies | ||||
1,100 | United Industrial Corp. | 49,775 | 1.59% | |
Miscellaneous Industrial & Commercial Machinery & Equipment | ||||
1,200 | Curtiss-Wright Corp. | 37,056 | 1.19% | |
Motor Vehicles Parts & Accessories | ||||
1,500 | CLARCOR Inc. | 44,685 | 1.43% | |
Natural Gas Distribution | ||||
1,500 | Atmos Energy Corp. | 41,865 | 1.34% | |
Newspapers: Publishing or Publishing & Printing | ||||
3,900 | Journal Communications, Inc. | 43,836 | ||
1,100 | Media General, Inc. | 46,079 | ||
89,915 | 2.88% | |||
Office Furniture | ||||
700 | HNI Corp. | 31,745 | 1.02% | |
Paper Mills | ||||
1,700 | Bowater Inc. | 38,675 | 1.24% | |
Petroleum Refining | ||||
200 | Suncor Energy Inc. | 16,202 | ||
700 | Tesoro Corp. | 52,052 | ||
68,254 | 2.19% | |||
Plastic Materials, Synth Resins & Nonvulcan Elastomers | ||||
1,100 | Rogers Corp. * | 61,974 | 1.99% | |
Plastics Products | ||||
900 | AptarGroup Inc. | 44,649 | 1.43% | |
Prefabricated Metal Buildings & Components | ||||
1,000 | NCI Building Systems Inc. * | 53,170 | 1.70% | |
Radiotelephone Communications | ||||
1,200 | Telephone & Data Systems Inc. | 46,680 | 1.50% | |
Railroad Equipment | ||||
1,000 | Wabtec Corporation | 37,400 | 1.20% | |
Railroad, Line-Haul Operating | ||||
1,600 | Kansas City Southern * | 44,320 | 1.42% | |
Retail - Catalog & Mail-Order Houses | ||||
900 | CDW Corp. | 49,185 | 1.58% | |
Retail - Department Stores | ||||
1,700 | Dillard's Inc. | 54,145 | 1.73% | |
Retail - Radio, TV & Consumer Electronics Stores | ||||
2,100 | RadioShack Corp. | 29,400 | 0.94% | |
Retail - Shoe Stores | ||||
1,100 | Payless Shoesource Inc. * | 29,887 | 0.96% | |
Security Brokers, Dealers & Flotation Companies | ||||
1,200 | Calamos Asset Management Inc. | 34,788 | 1.11% | |
Semiconductors & Related Devices | ||||
1,500 | Cabot Microelectronics Corp. * | 45,465 | ||
1,400 | MEMC Electronic Materials Inc. * | 52,500 | ||
97,965 | 3.14% | |||
Services - Advertising Agencies | ||||
2,000 | Catalina Marketing Corp. | 56,920 | 1.82% | |
Services - Business Services | ||||
1,800 | Moneygram International Inc. | 61,110 | ||
5,500 | Premiere Global Services Inc.* | 41,525 | ||
102,635 | 3.29% | |||
*Non-Income Producing Securities.
The accompanying notes are an integral part of these
financial statements.
2006 Semi-Annual Report 18
Paradigm Select Fund |
|
|
| |
Schedule of Investments | ||||
June 30, 2006 (Unaudited) | ||||
Shares/Principal Amount |
| Market Value | % of Net Assets | |
COMMON STOCKS | ||||
Services - Computer Integrated Systems Design | ||||
3,300 | Convergys Corp. * | 64,350 | ||
1,500 | Intergraph Corp. * | 47,235 | ||
1,700 | Reynolds & Reynolds Co. | 52,139 | ||
4,500 | Tyler Technologies Inc. * | 50,400 | ||
214,124 | 6.85% | |||
Services - Hospitals | ||||
1,300 | Magellan Health Services Inc. * | 58,903 | 1.89% | |
Services - Management Consulting Services | ||||
1,600 | Watson Wyatt Worldwide Inc. | 56,224 | 1.80% | |
Services - Misc Health & Allied Services | ||||
2,400 | AMN Healthcare Services Inc. * | 48,720 | 1.56% | |
Services - Offices & Clinics of Doctors of Medicine | ||||
1,900 | AmSurg Corp. * | 43,225 | 1.38% | |
Services - Personal Services | ||||
1,500 | Jackson Hewitt Tax Service Inc. | 47,025 | 1.51% | |
Soap, Detergents, Cleaning Preparations, Perfumes, Cosmetics | ||||
1,300 | Church & Dwight Co., Inc. | 47,346 | 1.52% | |
Special Industry Machinery | ||||
1,200 | Varian Semiconductor Equipment Associates Inc. * | 39,132 | 1.25% | |
Steel Works, Blast Furnaces & Rolling Mills | ||||
2,400 | Commercial Metals Co. | 61,680 | 1.98% | |
Sugar & Confectionery Products | ||||
1,636 | Tootsie Roll Industries Inc. | 47,657 | 1.53% | |
Telephone Communications | ||||
1,200 | Centurytel Inc. | 44,580 | ||
800 | Leap Wireless International Inc. * | 37,960 | ||
82,540 | 2.64% | |||
Wholesale - Electronic Parts & Equipment | ||||
1,800 | Avnet Inc. * | 36,036 | 1.15% | |
Wholesale - Machinery, Equipment & Supplies | ||||
1,200 | Aviall Inc. * | 57,024 | 1.83% | |
Total for Common Stock (Cost $2,753,655) | $ 3,088,966 | 98.97% | ||
Cash Equivalents | ||||
33,740 | SEI Daily Income Treasury Government CL B 4.37% ** | 33,740 | 1.08% | |
(Cost $33,740) | ||||
Total Investment Securities | 3,122,706 | 100.05% | ||
(Cost $2,787,395) | ||||
Liabilities in Excess of Other Assets | (1,582) | -0.05% | ||
| ||||
Net Assets | $ 3,121,124 | 100.00% | ||
*Non-Income Producing Securities.
**Variable Rate Security; The Yield Rate shown
represents the rate at June 30, 2006.
The accompanying notes are an integral part of these
financial statements.
2006 Semi-Annual Report 19
Paradigm Select Fund |
|
Statement of Assets and Liabilities (Unaudited) | |
June 30, 2006 | |
Assets: | |
Investment Securities at Market Value | $ 3,122,706 |
(Cost - $2,787,395) | |
Dividend Receivable | 2,056 |
Interest Receivable | 120 |
Total Assets | 3,124,882 |
Liabilities: | |
Payable to Advisor | 3,758 |
Total Liabilities | 3,758 |
Net Assets | $ 3,121,124 |
Net Assets Consist of: | |
Paid In Capital | $ 2,727,368 |
Accumulated Net Investment Loss | (7,865) |
Accumulated Undistributed Realized Gain On Investments - Net | 66,310 |
Unrealized Appreciation in Value | |
of Investments Based on Cost - Net | 335,311 |
Net Assets, for 128,807 Shares Outstanding | $ 3,121,124 |
(Unlimited shares authorized, without par value) | |
Net Asset Value and Offering Price (Note 2) * | |
Per Share ($3,121,124/128,807 shares) | $ 24.23 |
Statement of Operations (Unaudited) | |
For the six months ended June 30, 2006 | |
Investment Income: | |
Dividends | $ 12,064 |
Interest | 2,664 |
Total Investment Income | 14,728 |
Expenses: | |
Investment Advisor Fees | 22,593 |
Total Expenses | 22,593 |
Net Investment Loss | (7,865) |
Realized and Unrealized Gain on Investments: | |
Realized Gain on Investments | 80,718 |
Net Change in Unrealized Appreciation on Investments | 151,710 |
Net Realized and Unrealized Gain on Investments | 232,428 |
Net Increase in Net Assets from Operations | $ 224,563 |
* Redemption price varies on length of time held (Note 2).
The accompanying notes are an integral part of these
financial statements.
2006 Semi-Annual Report 20
Paradigm Select Fund |
|
| |
Statement of Changes in Net Assets | |||
(Unaudited) | |||
1/1/2006 | 1/1/2005* | ||
to | to | ||
6/30/2006 | 12/31/2005 | ||
From Operations: | |||
Net Investment Loss | $ (7,865) | $ (6,182) | |
Net Realized Gains on Investments | 80,718 | 985 | |
Net Change in Net Unrealized Appreciation | 151,710 | 183,601 | |
Increase in Net Assets from Operations | 224,563 | 178,404 | |
From Distributions to Shareholders: | |||
Net Investment Income | 0 | 0 | |
Net Realized Gain from Security Transactions | 0 | (9,211) | |
Change in Net Assets from Distributions | 0 | (9,211) | |
From Capital Share Transactions: | |||
Proceeds From Sale of Shares | 410,604 | 2,749,506 | |
Proceeds From Redemption Fees (Note 2) | 0 | 0 | |
Shares Issued on Reinvestment of Dividends | 0 | 9,211 | |
Cost of Shares Redeemed | (35,000) | (406,953) | |
Net Increase from Shareholder Activity | 375,604 | 2,351,764 | |
Net Increase in Net Assets | 600,167 | 2,520,957 | |
Net Assets at Beginning of Period | 2,520,957 | 0 | |
Net Assets at End of Period (Including Accumulated Net Investment | |||
Income (Loss) of ($7,865) and $0 respectively) | $ 3,121,124 | $ 2,520,957 | |
Share Transactions: | |||
Issued | 17,338 | 131,401 | |
Reinvested | 0 | 410 | |
Redeemed | (1,405) | (18,937) | |
Net Increase in Shares | 15,933 | 112,874 | |
Shares Outstanding Beginning of Period | 112,874 | - | |
Shares Outstanding End of Period | 128,807 | 112,874 | |
Financial Highlights | |||
(Unaudited) | |||
Selected data for a share outstanding throughout the period: | 1/1/2006 | 1/1/2005* | |
to | to | ||
6/30/2006 | 12/31/2005 | ||
Net Asset Value - Beginning of Period | $ 22.33 | $ 20.00 | |
Net Investment Loss *** | (0.06) | (0.08) | |
Net Gains on Securities (realized and unrealized) | 1.96 | 2.49 | |
Total from Investment Operations | 1.90 | 2.41 | |
Distributions (From Net Investment Income) | 0.00 | 0.00 | |
Distributions (From Capital Gains) | 0.00 | (0.08) | |
Total Distributions | 0.00 | (0.08) | |
Proceeds from Redemption Fee (Note 2) | 0.00 | 0.00 | |
Net Asset Value - End of Period | $ 24.23 | $ 22.33 | |
Total Return **** | 8.51% | 12.06% | |
Ratios/Supplemental Data | |||
Net Assets - End of Period | $ 3,121,124 | $ 2,520,957 | |
Ratio of Expenses to Average Net Assets | 1.50% | ** | 1.50% |
Ratio of Net Investment Loss to Average Net Assets | -0.52% | ** | -0.36% |
Portfolio Turnover Rate | 21.26% | 68.56% |
* Commencement of operations.
** Annualized.
*** Per share amount calculated using the average shares method.
**** Total return in the above table represents the rate that the investor would have earned or lost on an investment in the Fund assuming reinvestment of dividends. Returns do not reflect the deduction of taxes a shareholder would pay on Fund distributions or redemption of Fund shares.
The accompanying notes are an integral part of these
financial statements.
2006 Semi-Annual Report 21
NOTES TO FINANCIAL STATEMENTS
PARADIGM FUNDS
June 30, 2006
(Unaudited)
1.) ORGANIZATION
The Paradigm Funds (the "Trust”) is an open-end management investment company organized in Ohio as a business trust on September 13, 2002 that may offer shares of beneficial interest in a number of separate series, each series representing a distinct fund with its own investment objectives and policies. The Paradigm Value Fund (“Value”) commenced operations on January 1, 2003. The Paradigm Value Fund's investment objective is long-term capital appreciation. The Paradigm Opportunity Fund (“Opportunity”) and Paradigm Select Fund (“Select”) both commenced operations on January 1, 2005 with long-term capital appreciation as their objective. The Advisor to Value, Opportunity and Select (collectively the “Funds”) is Paradigm Funds Advisor LLC (the “Advisor”).
2.) SIGNIFICANT ACCOUNTING POLICIES
SECURITY VALUATION: Securities that are traded on any exchange, including the NASDAQ, are generally valued by a pricing service at the last quoted sale price. Lacking a last sale price, an equity security is valued at its last bid price except when, in the Advisor's opinion, the last bid price does not accurately reflect the current value of the security. All other securities for which over-the-counter market quotations are readily available are valued at their last bid price. When market quotations are not readily available, when the Advisor determines the last bid price does not accurately reflect the current value or when restricted securities are being valued, such securities are valued as determined in good faith by the Advisor, in conformity with guidelines adopted by and subject to review of the Board of Trustees of the Trust.
Fixed income securities generally are valued on the basis of prices furnished by a pricing service when the Advisor believes such prices accurately reflect the fair market value of such securities. A pricing service utilizes electronic data processing techniques based on yield spreads relating to securities with similar characteristics to determine prices for normal institutional-size trading units of debt securities without regard to sale or bid prices. If the Advisor decides that a price provided by the pricing service does not accurately reflect the fair market value of the securities, when prices are not readily available from a pricing service or when restricted or illiquid securities are being valued, securities are valued at fair value as determined in good faith by the Advisor, in conformity with guidelines adopted by and subject to review of the Board of Trustees. Short term investments in fixed income securities with maturitie s of less than 60 days when acquired, or which subsequently are within 60 days of maturity, are valued by using the amortized cost method of valuation, which the Board of Trustees has determined will represent fair value.
In accordance with the Trust's good faith pricing guidelines, the Adviser is required to consider all appropriate factors relevant to the value of securities for which it has determined other pricing sources are not available or reliable as described above. No single standard for determining fair value controls, since fair value depends upon the circumstances of each individual case. As a general principle, the current fair value of an issue of securities being valued by the adviser would appear to be the amount which the owner might reasonably expect to receive for them upon their current sale. Methods which are in accord with this principle may, for example, be based on (i) a multiple of earnings; (ii) a discount from market of a similar freely traded security (including a derivative security or a basket of securities traded on other markets, exchanges or among dealers); or (iii) yield to maturity with respect to debt issues, or a com bination of these and other methods.
SECURITY TRANSACTIONS AND OTHER: Security transactions are recorded based on a trade date. Dividend income is recognized on the ex-dividend date. Interest income is recognized on an accrual basis. The Funds use the specific identification basis in computing gain or loss on sale of investment securities. Discounts and premiums on fixed income securities purchased are amortized over the lives of the respective securities. Withholding taxes on foreign dividends have been provided for in accordance with the Funds’ understanding of the applicable country’s tax rules and rates.
SHARE VALUATION: The net asset value (the “NAV”) is generally calculated as of the close of trading on the New York Stock Exchange (normally 4:00 p.m. Eastern time) every day the Exchange is open. The NAV is calculated by taking the total value of a Fund’s assets, subtracting its liabilities, and then dividing by the total number of shares outstanding, rounded to the nearest cent. The offering price and redemption price per share is equal to the net asset value per share, except that shares of each fund are subject to a redemption fee of 2% if redeemed within 90 days of purchase. During the period ended June 30, 2006 proceeds from redemption fees were $62, $0 and $0 for Paradigm Value Fund, Paradigm Opportunity Fund and Paradigm Select Fund, respectively.
2006 Semi-Annual Report 22
Notes to the Financial Statements (Unaudited) - continued
SHORT SALES: A Fund may sell a security it does not own in anticipation of a decline in the fair value of the security. When a Fund sell a security short, it must borrow the security sold short and deliver it to the broker-dealer through which it made the short sale. A gain, limited to the price at which a Fund sold the security short, or a loss, unlimited in size, will be recognized upon the termination of a short sale.
INCOME TAXES: The Funds’ policy is to continue to comply with the requirements of Subchapter M of the Internal Revenue Code that are applicable to regulated investment companies and to distribute all of their taxable income to their shareholders. Therefore, no federal income tax provision is required.
ESTIMATES: The preparation of financial statements in conformity with accounting principles generally accepted in the United States of America requires management to make estimates and assumptions that affect the reported amounts of assets and liabilities and disclosure of contingent assets and liabilities at the date of the financial statements and the reported amounts of increases and decreases in net assets from operations during the reporting period. Actual results could differ from those estimates.
DISTRIBUTIONS TO SHAREHOLDERS: Distributions to shareholders, which are determined in accordance with income tax regulations, are recorded on the ex-dividend date. The treatment for financial reporting purposes of distributions made to shareholders during the year from net investment income or net realized capital gains may differ from their ultimate treatment for federal income tax purposes. These differences are caused primarily by differences in the timing of recognition of certain components of income, expense or realized capital gain for federal income tax purposes. Where such differences are permanent in nature, they are reclassified in the components of the net assets based on their ultimate characterization for federal income tax purposes. Any such reclassification will have no effect on net assets, results of operations or net asset values per share of any Fund. For the six month period ended June 30, 2006 no distribution s were made to shareholders of any of the Funds.
3.) INVESTMENT ADVISORY AGREEMENT
Each of the Funds had investment advisory agreements (the "Management Agreements") with Paradigm Capital Management, Inc. (the "Company"). On December 16, 2005, the Advisor assumed the obligations of the Company under the Management Agreements. The Company and the Advisor are controlled by the same shareholders. Under the terms of the Management Agreements, the Advisor manages the investment portfolios of the Funds, subject to policies adopted by the Trust’s Board of Trustees. Under the Management Agreements, the Advisor, at its own expense and without reimbursement from the Trust, furnishes office space and all necessary office facilities, equipment and executive personnel necessary for managing the assets of the Funds. The Advisor also pays the salaries and fees of all of its officers and employees that serve as officers and trustees of the Trust. For its services, the Advisor receives an annual in vestment management fee of 2.00% of the average daily net assets from both the Paradigm Value Fund and Paradigm Opportunity Fund; and 1.50% of the average daily net assets from the Paradigm Select Fund. As a result of the above calculation, for the six month period ended June 30, 2006, the Advisor earned management fees totaling $342,761, $33,367 (before the wavier described below) and $22,593 for the Paradigm Value Fund, Paradigm Opportunity Fund and Paradigm Select Fund, respectively. At June 30, 2006, $65,444, $5,186 and $3,758 was due to the Advisor from the Paradigm Value Fund, Paradigm Opportunity Fund and Paradigm Select Fund, respectively. As of September 1, 2005, the Advisor has agreed to waive management fees and/or reimburse the Paradigm Opportunity Fund to the extent necessary to maintain total annual operating expenses of the Fund (excluding brokerage fees and commissions, interest and other borrowing expenses, taxes and extraordinary expenses) at 1.50% of its daily net assets through May 1, 2007. A total of $8,342 was waived for the period ended June 30, 2006. The Advisor pays all operating expenses of the Funds with the exception of taxes, brokerage fees and commissions, borrowing costs (such as (a) interest and (b) dividend expenses on securities sold short) and extraordinary expenses as defined under accounting principles generally accepted in the United States of America.
Certain officers and shareholders of the Advisor are also officers and/or a Trustee of the Trust. These individuals may receive benefits from the Advisor resulting from management fees paid to the Advisor from the Funds.
The Trustees who are not interested persons of the Funds were paid $2,000 for each meeting attended for the six month period ended June 30, 2006 for the Trust. Under the Management Agreements, the Advisor pays these fees.
2006 Semi-Annual Report 23
Notes to the Financial Statements (Unaudited) – continued
4.) INVESTMENTS
For the six month period ended June 30, 2006, purchases and sales of investment securities other than U.S. Government obligations and short-term investments were as follows:
Paradigm Paradigm Paradigm
Value Opportunity Select
Fund Fund Fund
Purchases
$24,337,106 $2,295,884 $1,072,938
Sales
$10,123,420 $1,550,559 $629,132
There were no purchases or sales of U.S. Government obligations.
For federal income tax purposes, at June 30, 2006 the cost of securities on a tax basis and the composition of gross unrealized appreciation (the excess of value over tax cost) and depreciation (the excess of tax cost over value) were as follows:
Paradigm Paradigm Paradigm
Value Opportunity Select
Fund Fund Fund
Cost of Investments
$34,123,972
$3,123,558
$2,787,395
Proceeds from Short Investments
$272,647
$0
$0
Gross Unrealized Appreciation
$7,149,683
$177,839
$479,653
Gross Unrealized Depreciation
($927,742) ($194,004)
($144,342)
Net Unrealized Appreciation
on Investments
$6,221,941
($16,165)
$335,311
5.) CAPITAL SHARES
At June 30, 2006, the Trust was authorized to issue an unlimited number of shares of beneficial interest. The following are the shares issued and paid in capital outstanding for the Funds:
Paradigm Paradigm Paradigm
Value Opportunity Select
Fund Fund Fund
Shares Issued
and outstanding
908,389
154,271
128,807
Paid in Capital
$34,411,366
$3,173,672
$2,727,368
6.) CONTROL OWNERSHIP
The beneficial ownership, either directly or indirectly, of more than 25% of the voting shares of a fund creates a presumption of control of the Fund, under section 2(a)(9) of the Investment Company Act of 1940. At June 30, 2006, Charles Schwab & Co., Inc. held through an omnibus account, in aggregate, 25.26% of the Paradigm Value Fund, and therefore may be deemed to control the Fund. Candace King Weir held, in aggregate, 95.51% of the Paradigm Opportunity Fund, and therefore may be deemed to control the Fund. Also, Candace King Weir held, in aggregate, 27.27% of the Paradigm Select Fund, and therefore may be deemed to control the Fund.
7.) DISTRIBUTIONS TO SHAREHOLDERS
The tax character of distributions paid during the fiscal year 2005 and the six months ended June 30, 2006 were as follows:
PARADIGM VALUE FUND
(Unaudited)
Six Months Ended Fiscal Year Ended
June 30,2006 December 31, 2005
Ordinary Income
$ -
$ -0-
Short-term Capital Gain
-
90,235
Long-term Capital Gain
-
965,905
$ -
$1,056,140
PARADIGM OPPORTUNITY FUND
Ordinary Income
$ -
$ 3,538
Short-term Capital Gain
-
27,166
Long-term Capital Gain
-
-0-
$ -
$ 30,704
PARADIGM SELECT FUND
Ordinary Income
$ -
$ -0-
Short-term Capital Gain
-
9,211
Long-term Capital Gain
-
-0-
$ -
$ 9,211
2006 Semi-Annual Report 24
DISCLOSURE OF EXPENSES(Unaudited)
Shareholders of the Paradigm Funds (the “Funds”) incur ongoing costs. The ongoing costs associated with the Paradigm Value Fund include management fees, interest expense and dividend expense on securities sold short. The ongoing costs associated with the Paradigm Opportunity Fund and Paradigm Select Fund consist solely of management fees. Although the Funds charge no sales loads or transaction fees, you will be assessed fees for outgoing wire transfers, returned checks and stop payment orders at prevailing rates charged by Mutual Shareholder Services, LLC, the Funds’ transfer agent. IRA accounts will be charged an $8.00 annual maintenance fee. The following example is intended to help you understand your ongoing costs of investing in the Funds and to compare these costs with similar costs of investing in other mutual funds. The example is based on an investment of $1,000 invested in the Funds on De cember 31, 2005 and held through June 30, 2006.
The first line of the table below provides information about actual account values and actual expenses. In order to estimate the expenses a shareholder paid during the period covered by this report, shareholders can divide their account value by $1,000 (for example, an $8,600 account value divided by $1,000 = 8.6) and then multiply the result by the number in the first line under the heading entitled "Expenses Paid During the Period."
The second line of the table below provides information about hypothetical account values and hypothetical expenses based on the Funds’ actual expense ratios and an assumed rate of return of 5% per year before expenses, which is not the Funds’ actual return. The hypothetical account values and expenses may not be used to estimate the actual ending account balance or expenses paid by a shareholder for the period. Shareholders may use this information to compare the ongoing costs of investing in the Funds and other funds. In order to do so, compare these 5% hypothetical examples with the 5% hypothetical examples that appear in other funds' shareholder reports.
PARADIGM VALUE FUND
Expenses Paid
Beginning Ending During the Period*
Account Value Account Value December 31, 2005
December 31, 2005 June 30, 2006 to June 30, 2006
Actual $1,000.00 $1,062.24 $10.38
Hypothetical $1,000.00 $1,014.73 $10.14
(5% annual return
before expenses)
* Expenses are equal to the Fund’s annualized expense ratio of 2.03%, multiplied by the average account value over the period, multiplied by 181/365 ( to reflect the one-half year period).
PARADIGM OPPORTUNITY FUND
Expenses Paid
Beginning Ending During the Period*
Account Value Account Value December 31, 2005
December 31, 2005 June 30, 2006 to June 30, 2006
Actual $1,000.00 $972.81 $7.34
Hypothetical $1,000.00 $1,017.36 $7.50
(5% annual return
before expenses)
* Expenses are equal to the Fund’s annualized expense ratio of 1.50%, multiplied by the average account value over the period, multiplied by 181/365 ( to reflect the one-half year period).
PARADIGM SELECT FUND
Expenses Paid
Beginning Ending During the Period*
Account Value Account Value December 31, 2005
December 31, 2005 June 30, 2006 to June 30, 2006
Actual $1,000.00 $1,085.09 $7.75
Hypothetical $1,000.00 $1,017.36 $7.50
(5% annual return
before expenses)
* Expenses are equal to the Fund’s annualized expense ratio of 1.50%, multiplied by the average account value over the period, multiplied by 181/365 ( to reflect the one-half year period).
2006 Semi-Annual Report 25
AVAILABILITY OF QUARTERLY SCHEDULE OF INVESTMENTS
(Unaudited)
The Funds file their complete schedules of portfolio holdings with the Securities and Exchange Commission ("SEC") for the first and third quarters of each fiscal year on Form N-Q. The Funds’ Forms N-Q are available on the SEC's Web site at http://www.sec.gov. The Funds’ Forms N-Q may also be reviewed and copied at the SEC's Public Reference Room in Washington, DC. Information on the operation of the Public Reference Room may be obtained by calling 1-800-SEC-0330.
PROXY VOTING GUIDELINES
(Unaudited)
Paradigm Funds Advisor LLC, the Funds’ Advisor, is responsible for exercising the voting rights associated with the securities held by the Funds. A description of the policies and procedures used by the Advisor in fulfilling this responsibility is available without charge on the Funds’ web site at www.paradigm-funds.com. It is also included in the Funds’ Statement of Additional Information, which is available on the Securities and Exchange Commission’s web site at http://www.sec.gov.
Information regarding how the Funds voted proxies, Form N-PX, relating to portfolio securities during the most recent 12-month period ended June 30 is available without charge, upon request, by calling our toll free number(1-800-239-0732). This information is also available on the Securities and Exchange Commission’s web site at http://www.sec.gov.
ADDITIONAL INFORMATION
You will find more information about the Funds at www.paradigm-funds.com. For shareholder inquiries, please call toll-free in the U.S. at 1-800-239-0732.
2006 Semi-Annual Report 26
Board of Trustees
Carl A. Florio
Lewis Golub
Candace King Weir
Anthony Mashuta
Investment Advisor
Paradigm Funds Advisor LLC
Nine Elk Street
Albany, NY 12207-1002
Counsel
Thompson Hine LLP
312 Walnut Street, 14th Floor
Cincinnati, OH 45202
Custodian
U.S. Bank, NA
425 Walnut Street
P.O. Box 1118
Cincinnati, OH 45201
Dividend Paying Agent,
Shareholders' Servicing Agent,
Transfer Agent
Mutual Shareholder Services
8000 Town Centre Dr., Suite 400
Broadview Hts., OH 44147
Fund Administrator
Premier Fund Solutions, Inc.
480 N. Magnolia Avenue, Suite 103
El Cajon, CA 92020
Independent Registered Public Accounting Firm
Cohen Fund Audit Services, Ltd.
(FKA Cohen McCurdy Ltd.)
800 Westpoint Pkwy., Suite 1100
Westlake, OH 44145-1524
This report is provided for the general information of the shareholders of the Paradigm Funds. This report is not intended for distribution to prospective investors in the Funds, unless preceded or accompanied by an effective prospectus.
Item 2. Code of Ethics. Not applicable.
Item 3. Audit Committee Financial Expert. Not applicable.
Item 4. Principal Accountant Fees and Services. Not applicable.
Item 5. Audit Committee of Listed Companies. Not applicable.
Item 6. Schedule of Investments. Not applicable. Schedule filed with Item 1.
Item 7. Disclosure of Proxy Voting Policies and Procedures for Closed-End Funds. Not applicable.
Item 8. Portfolio Managers of Closed End Funds. Not applicable.
Item 9. Purchases of Equity Securities by Closed-End Management Investment Companies and Affiliated Purchasers. Not applicable.
Item 10. Submission of Matters to a Vote of Security Holders.
The registrant has not adopted procedures by which shareholders may recommend nominees to the registrant’s board of trustees.
Item 11. Controls and Procedures.
(a)
The Registrant’s president and chief financial officer concluded that the disclosure controls and procedures (as defined in Rule 30a-3(c) under the Investment Company Act of 1940 (the “Act”)) were effective as of a date within 90 days of the filing date of this report, based on the evaluation of these controls and procedures required by Rule 30a-3(b) under the Act.
(b)
There were no changes in the registrant’s internal control over financial reporting (as defined in Rule 30a-3(d) under the Act) that occurred during the registrant’s second fiscal quarter of the period covered by this report that have materially affected, or are reasonably likely to materially affect, the registrant’s internal control over financial reporting.
Item 12. Exhibits.
(a)(1)
Code of Ethics. Not applicable.
(a)(2)
Certifications pursuant to Section 302 of the Sarbanes-Oxley Act of 2002. Filed herewith.
(b) Certification pursuant to Section 906 of the Sarbanes-Oxley Act of 2002. Filed herewith.
SIGNATURES
Pursuant to the requirements of the Securities Exchange Act of 1934 and the Investment Company Act of 1940, the registrant has duly caused this report to be signed on its behalf by the undersigned, thereunto duly authorized.
Paradigm Funds
By : /s/ Candace King Weir
Candace King Weir
President
Date: 9-8-2006
Pursuant to the requirements of the Securities Exchange Act of 1934 and the Investment Company Act of 1940, this report has been signed below by the following persons on behalf of the registrant and in the capacities and on the dates indicated.
By : /s/ Candace King Weir
Candace King Weir
President
Date: 9-8-2006
By : /s/ Robert A. Benton
Robert A. Benton
Chief Financial Officer
Date: 9-8-2006