| UNITED STATES SECURITIES AND EXCHANGE COMMISSION WASHINGTON, D.C. 20549 |
| FORM N-CSR |
CERTIFIED SHAREHOLDER REPORT OF REGISTERED MANAGEMENT
INVESTMENT COMPANIES
| Investment Company Act file number 811-21233 |
| PARADIGM FUNDS |
| (Exact name of registrant as specified in charter) |
Nine Elk Street, Albany, NY 12207-1002
(Address of principal executive offices) (Zip code)
| Robert A. Benton Nine Elk Street, Albany, NY 12207-1002 (Name and address of agent for service) |
Registrant's telephone number, including area code: (518) 431-3500
Date of fiscal year end: December 31
Date of reporting period: June 30, 2010
Form N-CSR is to be used by management investment companies to file reports with the Commission not later than 10 days after the transmission to stockholders of any report that is required to be transmitted to stockholders under Rule 30e-1 under the Investment Company Act of 1940 (17 CFR 270.30e -1). The Commission may use the information provided on Form N-CSR in its regulatory, disclosure review, inspection and policymaking roles.
A registrant is required to disclose the information specified by Form N-CSR, and the Commission will make this information public. A registrant is not required to respond to the collection of information contained in Form N-CSR unless the Form displays a currently valid Office of Management and Budget ("OMB") control number. Please direct comments concerning the accuracy of the information collection burden estimate and any suggestions for reducing the burden to Secretary, Securities and Exchange Commission, 450 Fifth Street, NW, Washington, DC 20549-0609. The OMB has reviewed this collection of information under the clearance requirements of 44 U.S.C. § 3507.
Paradigm Funds
Paradigm Value Fund
Paradigm Select Fund
Paradigm Opportunity Fund
Paradigm Intrinsic Value Fund
For Investors Seeking Long-Term Capital Appreciation
SEMI-ANNUAL REPORT
June 30, 2010
| Table of Contents | |
| PARADIGM FUNDS | |
| Letter to Shareholders | 2 |
| Sector Allocation | 6 |
| Performance Information | 8 |
| Schedules of Investments | 10 |
| Statements of Assets and Liabilities | 20 |
| Statements of Operations | 20 |
| Statements of Changes in Net Assets | 22 |
| Financial Highlights | 24 |
| NOTES TO FINANCIAL STATEMENTS | 26 |
| DISCLOSURE OF EXPENSES | 31 |
| ADDITIONAL INFORMATION | 33 |
2010 Semi-Annual Report 1
| Letter to Shareholders |
The first half of 2010 was a tale of dramatically different market environments. After a correction into early February, markets rallied strongly and small-cap stocks, measured by the Russell 2000 Index, returned 15.04% through the end of April. Volatility, measured by the CBOE Market Volatility Index (VIX), had retreated to 16, a level last experienced prior to the financial crisis and recession. Economic debate was centered on the strength of the recovery and whether it could be "V-shaped." This prevailing mindset was in contradiction to the thoughts we laid out in our 2009 annual letter. Specifically, we were cautious and believed that the recovery would be muted. In particular, we were concerned about poor employment conditions and weakness in the United States housing market becoming a drag on an economic recovery.
In early May, investor psychology and sentiment turned on a dime. Global economic news in the second quarter was a game of "pick your poison." European sovereign debt and contagion concerns, debate about the strength of China's growth trajectory, the specter of a double-dip recession in the U.S., and the BP oil spill all roiled the markets in recent months. Significantly increased government intervention in multiple industries has amplified this volatility and distorted business and profit cycles. Markets sold off dramatically and small-cap stocks, measured by the Russell 2000 Index, ended the first half of the year down 1.95% . Volatility surged, with the VIX jumping over 40, a level last experienced in April 2009. While uncertainty and volatility present challenges, they also provide opportunities for disciplined active investment management to capitalize on market inefficiencies and outperform over cycles.
We still approach the second half of 2010 with a degree of caution, as the economic recovery continues to provide conflicting data points. Deteriorating employment data and the April 30 expiration of the housing tax credit combined to create an increasingly poor array of economic news in the second quarter. As feared, the housing tax credit expiration sharply diminished any hopes for a nascent recovery in the housing market. Nearly every recent data point on housing demand, whether sales, starts, permits, or mortgage applications showed precipitous drops in May and June. For example, June new home sales dropped by 33%, the lowest level since 1963. Meanwhile, delinquencies, defaults, and foreclosures remain at elevated levels, which will likely contribute to incremental future housing supply. We believe that the impact of these supply and demand dynamics on housing prices will be a key determinant of economic growth over the next year. Employment also showed continued weak data throughout May and June. The June Bureau of Labor Statistics jobs report confirmed that the private sector has yet to fully rebound, and hiring remains muted. Consumer confidence remains shaky, and on a defla-tionary note, recent data indicate that consumers believe their incomes will decrease rather than increase over the next six months, which could imply that they are likely to spend less. In this challenging environment, corporate earnings over the past year have been a bright spot. Corporations have done an exceptional job adjusting their business models to preserve profit margins. Corporate balance sheets are strong, with cash and investments at a record level of 11% of assets for the S&P 500. Even in a low-growth environment, corporate earnings should expand from current levels, which would make current valuation levels attractive after the recent correction.
Thus, in spite of the above issues we have enumerated, we continue to believe that this is a stock picker's market. The selection process requires rigor, given the continued crosscur-rents of the economy and significant price appreciation in certain stocks and sectors over the past year. In our opinion, the current environment of uncertainty is unique when compared to prior post-recession periods (consider, for example, expanding levels of national debt, wavering confidence in the government and its economic policies, health care reform, and the BP oil spill as an unprecedented environmental disaster, among other issues). In light of this backdrop, needless to say, stock-picking has taken on a new degree of complexity.
While the economic data trends do not currently indicate that we are headed for a double-dip recession, we would continue to reiterate that this type of an economic recovery is not the sort where a rising tide lifts all boats. While the task is simple in description (i.e., pick good companies), this in fact has required an intensive effort by our investment team, in what has been a reaffirmation of our own process and discipline. This has been our heritage for 30-plus years, and by definition we are comfortable executing through these unusual and challenging times.
We have positioned the Funds with companies that we believe have sustainable competitive advantages, strong management teams, and business models that generate excess cash that provides flexibility and downside protection. These companies have navigated
2010 Semi-Annual Report 2
the downturn and do not require an acceleration in global growth and a robust cyclical recovery to deliver positive financial results. Overall, we think the recent sharp pullback has certainly made our portfolio more compelling from a valuation perspective and created new buying opportunities.
We appreciate the faith you have placed in Paradigm Funds.
Paradigm Value Fund
Portfolio Performance
The Paradigm Value Fund declined 0.89% for the six months ended June 30, 2010 compared to a decline of 1.64% for its benchmark, the Russell 2000 Value Index. Over the past three years on an annualized basis, the Fund declined 6.16% versus a 9.85% decline for the benchmark. Over the past five years on an annualized basis, the Fund appreciated 3.76% versus -0.51% for the benchmark. Since inception (January 1, 2003), the Fund has generated an annualized return of 14.39% compared to 7.80% for the Russell 2000 Value Index.
The Fund's top three performing sectors for the six months ended June 30, 2010 were Consumer Staples (7.18%), Consumer Discretionary (2.04%), and Information Technology (1.95%) . M&A activity was a major contributor to the Fund's out-performance versus the benchmark in the first half of 2010, as four of our companies were acquired during this period. We have built a portfolio of high-quality companies with sustainable competitive advantages, strong and consistent cash flow generation, and proven management teams. These types of businesses are attractive to both strategic and financial buyers.
Our top two performing stocks were Sybase and American Italian Pasta. In March of 2008, the Fund invested in enterprise software and service company Sybase (SY) in the $26 range, which was roughly 13X earnings and 11X free cash flow. We were impressed by management's vision for enabling mobile communication, coupled with strong fundamentals and discounted valuations. The company performed exceptionally well through the economic downturn, with revenue expanding from $1 billion in 2007 to $1.2 billion currently, while earnings jumped from $1.50 to $2.50 over the same period. In May, SAP America made a cash tender offer of $65 per share for all of Sybase's outstanding shares, a 44% premium over Sybase's three-month average price (and a healthy appreciation from our $26 purchase price).
American Italian Pasta agreed to be acquired by Ralcorp Holdings. Paradigm invested in American Italian Pasta in 2009 at $32 per share, which equated to 10X earnings, when the market was concerned about wheat costs. However, we believed the company had solid fundamentals and was positioned to benefit from enhanced distribution through Wal-Mart. That thesis played out, and the company was acquired at $53 per share.
The Consumer Discretionary sector was the worst-performing sector in the Russell 2000 Value Index and also the Fund's biggest detractor in the second quarter. Career Education Corp. is a leading for-profit provider of vocational education programs. The company is experiencing accelerating enrollment, strong margins, and good cash flow. The stock was one of our top performers in the first quarter but subsequently sold off due to regulatory concerns. However, we believe the company's prospects are good even if the strictest proposed legislations are implemented, and we have added to the position.
Retailer American Eagle had a good holiday season, closed an unprofitable business unit, and we believe they are well-positioned to weather a potentially lengthy downturn. The stock sold off on inventory concerns and second-quarter guidance revisions, but we see a management team that now is in aggressive cost-cutting mode, focused on cash-flow generation and cost containment. We have added to the position based on what we believe to be attractive valuations.
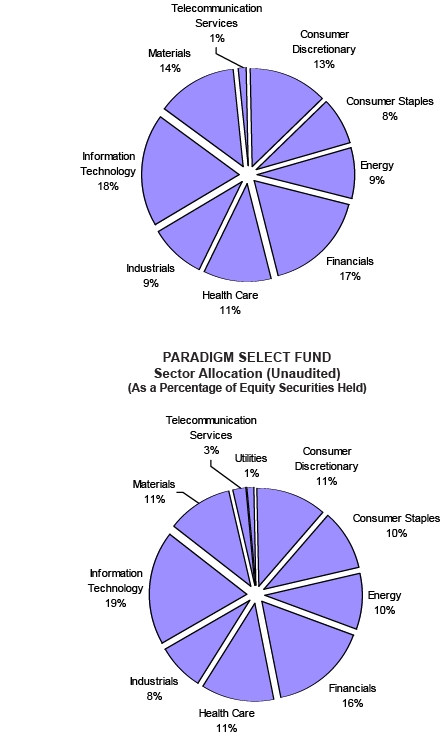
Paradigm Select Fund
Portfolio Performance
The Paradigm Select Fund declined 2.52% for the six months ended June 30, 2010 compared to a decline of 1.69% for its benchmark, the Russell 2500 Index. Over the past three years on an annualized basis, the Fund declined 6.94% versus a 7.98% decline for the benchmark. Over the past five years on an annualized basis, the Fund appreciated 2.59%
2010 Semi-Annual Report 3
versus 0.98% for the benchmark. Since inception (January 1, 2005), the Fund has generated an annualized return of 3.39% compared to 1.12% for the Russell 2500 Index.
The Fund's top three performing sectors for the six months ended June 30, 2010 were Consumer Staples (7.02%), Health Care (3.00%), and Consumer Discretionary (2.92%) . Similar to the Paradigm Value Fund, M&A activity was a major contributor to the Fund's outperformance versus the benchmark in the first half of 2010. Sybase and American Italian Pasta, both of which were acquired, were the top two performing stocks.
The portfolio's Consumer Discretionary holdings were the largest detractors in the quarter, though their underperformance was partially offset by the portfolio's underweight to this worst-performing benchmark sector. Two examples illustrate the challenges and opportunities we see in the sector.
Career Education Corp. is a leading for-profit provider of vocational education programs. The company is experiencing accelerating enrollment, strong margins, and good cash flow. The stock was one of our top performers in the first quarter but subsequently sold off due to regulatory concerns. However, we believe the company's prospects are good even if the strictest proposed legislations are implemented, and we have added to the position. Retailer American Eagle had a good holiday season, closed an unprofitable business unit, and we believe they are well-positioned to weather a potentially lengthy downturn. The stock sold off on inventory concerns and second-quarter guidance revisions, but we see a management team that now is in aggressive cost-cutting mode, focused on cash-flow generation and cost containment. We have added to the position based on what we believe to be attractive valuations.
Paradigm Opportunity Fund
Portfolio Performance
The Paradigm Opportunity Fund declined 1.87% for the six months ended June 30, 2010 compared to a decline of 1.95% for its benchmark, the Russell 2000 Index. Over the past three years on an annualized basis, the Fund declined 8.15% versus an 8.60% decline for the benchmark. Over the past five years on an annualized basis, the Fund appreciated 0.96% versus 0.37% for the benchmark. Since inception (January 1, 2005), the Fund has generated an annualized return of 1.07% compared to 0.10% for the Russell 2000 Index.
The Fund's top three performing sectors for the six months ended June 30, 2010 were Financials (7.56%), Information Technology (0.20%), and Health Care (0.13%) .
Kulicke & Soffa Industries was the top performing stock in the first half of 2010, returning 52% over the holding period. Kulicke & Soffa manufactures capital equipment and packaging materials used to assemble semiconductor devices. Capacity expansion combined with a technology transition from gold to copper wire bonders drove record orders and significantly higher profitability. We booked profits in the second quarter after the shares rallied above our price target, as we were concerned that the current levels of shipments were unsustainable.
Spectrum Control was the second-best performing stock, returning 46% over the holding period. The company manufactures custom electronic components and systems for the defense, aerospace, and communication markets. Strong military demand, combined with stabilization in commercial end markets, drove improved profitability and sent the shares higher.
The Consumer Discretionary and Industrials sectors were the only significant detractors in the second quarter. Hawaiian Holdings was the single largest decliner in the Industrials sector. The company operates passenger airline service in the Hawaiian inter island and trans-Pacific markets with leading market share in both markets. Bankruptcy and consolidation in the inter island market over the past two years is driving steady cash flow generation. The company has over $300 million in cash on the balance sheet, which is higher than current market capitalization. The company is using its strong balance sheet and cash flow generation to upgrade its fleet to Airbus A330 and expand its Asian footprint. We acquired shares at approximately 7X our 2010 earnings projections. However, the stock sold off significantly in the second quarter due to concerns about consumer spending, as well as downward revenue guidance from previous estimates. We continue to have conviction in the pos ition.
2010 Semi-Annual Report 4
Paradigm Intrinsic Value Fund
Portfolio Performance
The Paradigm Intrinsic Value Fund declined 5.45% for the six months ended June 30, 2010 compared to a decline of 6.65% for the S&P 500, its primary benchmark. Since inception in January 2008, on an annualized basis, the Fund has declined 6.06% compared with a decline of 11.16% for the S&P 500.
The Fund's top three performing sectors for the six months ended June 30, 2010 were Financials (2.75%), Materials (-2.06%) and Information Technology (-8.52%) .
Berkshire Hathaway was the Fund's top performing stock during this period, returning 21.26% . The iShares Comex Gold ETF ("Gold") was the Fund's second best performer, up 13.35% . Both securities benefited from a flight to quality in the financial markets over the last six months: Berkshire Hathaway as a high-quality, large-capitalization financial institution focused on insurance rather than lending; and Gold as an alternative to currencies at risk because of high levels of deficit spending in Europe and the United States.
Consumer Staples hurt performance most on a relative basis, largely due to the portfolio's position in CVS Caremark Corp.("CVS"), which sold off due to concerns about a conflict with Walgreens over the Caremark pharmacy benefits management ("PBM") business. We view this position as a special situation given that the current low valuations of CVS completely discount the PBM acquisition.
Despite strong stock selection, the Materials sector detracted from returns due to the portfolio's significant overweight in the worst-performing Russell 3000 sector. We have looked for diverse underlying end-customer exposures in this sector. For example, Arch Chemical makes water additives and biocides, and their business is remarkably recession-resistant. Compass Materials, at the other end of the spectrum, manufactures road salt. Both have attractive fundamentals, but very different customer bases.
Sincerely,

Candace King Weir | Amelia F. Weir |
2010 Semi-Annual Report 5
Paradigm Funds (Unaudited)
PARADIGM VALUE FUND
Sector Allocation (Unaudited)
(As a Percentage of Equity Securities Held)
2010 Semi-Annual Report 6
Paradigm Funds (Unaudited)
| PARADIGM OPPORTUNITY FUND Sector Allocation (Unaudited) (As a Percentage of Equity Securities Held) |
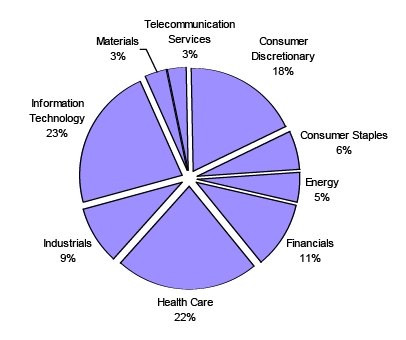
PARADIGM INTRINSIC VALUE FUND |

2010 Semi-Annual Report 7
Paradigm Value Fund (Unaudited)
PERFORMANCE INFORMATION
Average Annual Rate of Return (%) for The Periods Ended June 30, 2010
June 30, 2010 NAV $42.37
| Since | ||||||||
| 1 Year(A) | 3 Years(A) | 5 Years(A) | Inception(A) | |||||
| Paradigm Value Fund | 17.08% | (6.16)% | 3.76% | 14.39% | ||||
| Russell 2000® Value Index(B) | 25.07% | (9.85)% | (0.51)% | 7.80% |
(A)1 Year, 3 Years, 5 Years and Since Inception returns include change in share prices and in each case includes reinvestment of any dividends and capital gain distributions. The inception date of the Paradigm Value Fund was January 1, 2003.
(B)The Russell 2000® Value Index (whose composition is different from the Fund) is an unmanaged index of small-capitalization stocks with lower price-to-book ratios and lower forecasted growth values than the total population of small-capitalization stocks.
For purposes of the graph and the accompanying table, it is assumed that all dividends and distributions were reinvested.
Paradigm Select Fund (Unaudited)
PERFORMANCE INFORMATION
Average Annual Rate of Return (%) for The Periods Ended June 30, 2010
June 30, 2010 NAV $23.22
| Since | ||||||||
| 1 Year(A) | 3 Years(A) | 5 Years(A) | Inception(A) | |||||
| Paradigm Select Fund | 16.90% | (6.94)% | 2.59% | 3.39% | ||||
| Russell 2500® Index(B) | 24.03% | (7.98)% | 0.98% | 1.12% |
(A)1 Year, 3 Years, 5 Years and Since Inception returns include change in share prices and in each case includes reinvestment of any dividends and capital gain distributions. The inception date of the Paradigm Select Fund was January 1, 2005.
(B)The Russell 2500® Index (whose composition is different from the Fund) measures the performance of the small to mid-cap segment of the U.S. equity universe, commonly referred to as "mid" cap. The Russell 2500 Index is a subset of the Russell 3000® Index. It includes approximately 2,500 of the smallest securities based on a combination of their market cap and current index membership.
For purposes of the graph and the accompanying table, it is assumed that all dividends and distributions were reinvested.
PAST PERFORMANCE DOES NOT GUARANTEE FUTURE RESULTS. INVESTMENT RETURN AND PRINCIPAL VALUE WILL FLUCTUATE SO THAT SHARES, WHEN REDEEMED, MAY BE WORTH MORE OR LESS THAN THEIR ORIGINAL COST. RETURNS DO NOT REFLECT THE DEDUCTION OF TAXES THAT A SHAREHOLDER WOULD PAY ON FUND DISTRIBUTIONS OR THE REDEMPTION OF FUND SHARES. CURRENT PERFORMANCE MAY BE LOWER OR HIGHER THAN THE PERFORMANCE DATA QUOTED. TO OBTAIN PERFORMANCE DATA CURRENT TO THE MOST RECENT MONTH END, PLEASE CALL 1-800-239-0732 OR VISIT OUR WEBSITE AT www.paradigm-funds.com.
2010 Semi-Annual Report 8
Paradigm Opportunity Fund (Unaudited)
PERFORMANCE INFORMATION
Average Annual Rate of Return (%) for The Periods Ended June 30, 2010
| June 30, 2010 NAV $19.91 | ||||||||
| Since | ||||||||
| 1 Year(A) | 3 Years(A) | 5 Years(A) | Inception(A) | |||||
| Paradigm Opportunity Fund | 17.74% | (8.15)% | 0.96% | 1.07% | ||||
| Russell 2000® Index(B) | 21.48% | (8.60)% | 0.37% | 0.10% |
(A)1 Year, 3 Years, 5 Years and Since Inception returns include change in share prices and in each case includes reinvestment of any dividends and capital gain distributions. The inception date of the Paradigm Opportunity Fund was January 1, 2005.
(b)The Russell 2000® Index (whose composition is different from the Fund) consists of the smallest 2,000 companies in the Russell 3000 Index (which represents approximately 98% of the investable U.S. equity market). The Index is an unmanaged index generally considered as the premier of small capitalization stocks.
For purposes of the graph and the accompanying table, it is assumed that all dividends and distributions were reinvested.
Paradigm Intrinsic Value Fund (Unaudited)
PERFORMANCE INFORMATION
Average Annual Rate of Return (%) for The Periods Ended June 30, 2010
| June 30, 2010 NAV $17.01 | ||||
| Since | ||||
| 1 Year(A) | Inception(A) | |||
| Paradigm Intrinsic Value Fund | 10.74% | (6.06)% | ||
| S&P 500® Index(B) | 14.43% | (11.16)% | ||
| Russell 3000® Index(C) | 15.72% | (10.61)% |
(A)1 Year and Since Inception returns include change in share prices and in each case includes reinvestment of any dividends and capital gain distributions. The inception date of the Paradigm Intrinsic Value Fund was January 1, 2008.
(B)The S&P 500® Index (whose composition is different from the Fund) is an umanaged index which measures the performance of 500 companies chosen by Standard & Poor’s to represent the large cap U.S. equity market.
(C)The Russell 3000® Index is an unmanaged index which measures the performance of the 3000 largest companies in the U.S. Equity Market. It is used as a market wide proxy.
For purposes of the graph and the accompanying table, it is assumed that all dividends and distributions were reinvested.
PAST PERFORMANCE DOES NOT GUARANTEE FUTURE RESULTS. INVESTMENT RETURN AND PRINCIPAL VALUE WILL FLUCTUATE SO THAT SHARES, WHEN REDEEMED, MAY BE WORTH MORE OR LESS THAN THEIR ORIGINAL COST. RETURNS DO NOT REFLECT THE DEDUCTION OF TAXES THAT A SHAREHOLDER WOULD PAY ON FUND DISTRIBUTIONS OR THE REDEMPTION OF FUND SHARES. CURRENT PERFORMANCE MAY BE LOWER OR HIGHER THAN THE PERFORMANCE DATA QUOTED. TO OBTAIN PERFORMANCE DATA CURRENT TO THE MOST RECENT MONTH END, PLEASE CALL 1-800-239-0732 OR VISIT OUR WEBSITE AT www.paradigm-funds.com.
2010 Semi-Annual Report 9
| Paradigm Value Fund | |||
| Schedule of Investments | |||
| June 30, 2010 (Unaudited) | |||
| Shares/Principal Amount | Fair Value | % of Net Assets | |
| COMMON STOCKS | |||
| Agriculture Production - Crops | |||
| 270,100 | Dole Food Company Inc. * | $ 2,817,143 | |
| 108,000 | Fresh Del Monte Produce Inc. * | 2,185,920 | |
| 5,003,063 | 2.98% | ||
| Air Transportation, Scheduled | |||
| 307,800 | Hawaiian Holdings Inc. * | 1,591,326 | 0.95% |
| Biological Products, (No Diagnostic Substances) | |||
| 56,300 | Life Technologies Corporation * | 2,660,175 | 1.59% |
| Chemical & Allied Products | |||
| 100,700 | Arch Chemicals Inc. | 3,095,518 | |
| 134,200 | Innospec Inc. | 1,258,796 | |
| 122,100 | Olin Corp. | 2,208,789 | |
| 6,563,103 | 3.92% | ||
| Computer Communications Equipment | |||
| 163,800 | QLogic Corp. * | 2,722,356 | 1.62% |
| Construction - Special Trade Contractors | |||
| 184,700 | Matrix Service Co. * | 1,719,557 | 1.03% |
| Crude Petroleum & Natural Gas | |||
| 148,200 | Carrizo Oil & Gas Inc. * | 2,301,546 | |
| 208,300 | McMoRan Exploration Co. * | 2,314,213 | |
| 206,600 | Resolute Energy Corporation * | 2,528,784 | |
| 52,200 | St. Mary Land & Exploration Co. | 2,096,352 | |
| 9,240,895 | 5.51% | ||
| Drilling Oil & Gas Wells | |||
| 82,300 | Atwood Oceanics Inc. * | 2,100,296 | |
| 48,800 | Union Drilling, Inc. * | 268,888 | |
| 2,369,184 | 1.41% | ||
| Electrical Work | |||
| 106,800 | EMCOR Group Inc. * | 2,474,556 | 1.48% |
| Electronic Components & Accessories | |||
| 398,600 | Vishay Intertechnology * | 3,085,164 | 1.84% |
| Fabricated Plater Work (Boiler Shops) | |||
| 96,200 | Chart Industries, Inc. * | 1,498,796 | |
| 1,089,581 | Global Power Equipment Group Inc. * | 1,961,246 | |
| 3,460,042 | 2.06% | ||
| Fire, Marine & Casualty Insurance | |||
| 56,500 | Harleysville Group Inc. | 1,753,195 | |
| 157,500 | Hilltop Holdings Inc. * | 1,576,575 | |
| 3,329,770 | 1.99% | ||
| Food and Kindred Products | |||
| 103,850 | Flowers Foods Inc. | 2,537,055 | 1.52% |
| Grain Mill Products | |||
| 48,500 | Corn Products International Inc. | 1,469,550 | 0.88% |
| Heavy Construction Other Than Building Construction - Contractors | |||
| 180,600 | Orion Marine Group, Inc. * | 2,564,520 | 1.53% |
| Hospital & Medical Service Plans | |||
| 78,100 | AMERIGROUP Corporation * | 2,536,688 | 1.51% |
| Industrial Organic Chemicals | |||
| 105,677 | Sensient Technologies Corp. | 2,740,205 | 1.63% |
| Laboratory Analytical Instruments | |||
| 116,700 | PerkinElmer Inc. | 2,412,189 | 1.44% |
| Life Insurance | |||
| 8,100 | National Western Life Insurance Co. Class A | 1,237,356 | 0.74% |
| *Non-Income Producing Securities. The accompanying notes are an integral part of these financial statements. |
2010 Semi-Annual Report 10
| Paradigm Value Fund | |||
| Schedule of Investments | |||
| June 30, 2010 (Unaudited) | |||
| Shares/Principal Amount | Fair Value | % of Net Assets | |
| COMMON STOCKS | |||
| Men's & Boy's Furnishings, Work Clothing & Allied Garments | |||
| 47,700 | Phillips-Van Heusen Corp. | $ 2,207,079 | 1.32% |
| Metal Cans | |||
| 113,400 | Silgan Holdings Inc. | 3,218,292 | 1.92% |
| Mining & Quarrying of Nonmetallic Minerals (No Fuels) | |||
| 44,075 | Compass Minerals International Inc. | 3,097,591 | 1.85% |
| Miscellaneous Food Preparations & Kindred Products | |||
| 62,502 | American Italian Pasta Co. Class A * | 3,304,481 | 1.97% |
| Motor Vehicle Parts & Accessories | |||
| 155,200 | Superior Industries International Inc. | 2,085,888 | 1.24% |
| Operative Builders | |||
| 105,300 | Avatar Holdings Inc. * | 2,019,654 | 1.20% |
| Pharmaceutical Preparations | |||
| 175,800 | Endo Pharmaceuticals Holdings Inc. * | 3,835,956 | 2.29% |
| Retail - Eating Places | |||
| 287,700 | Ruby Tuesday, Inc. * | 2,445,450 | 1.46% |
| Retail - Family Clothing Stores | |||
| 229,500 | American Eagle Outfitters | 2,696,625 | 1.61% |
| Retail - Miscellaneous Retail | |||
| 154,900 | EZCORP Inc. Class A * | 2,873,395 | 1.71% |
| Retail - Shoe Stores | |||
| 206,100 | Foot Locker, Inc. | 2,600,982 | 1.55% |
| Retail - Variety Stores | |||
| 84,500 | Big Lots Inc. * | 2,711,605 | 1.62% |
| Savings Institution, Federally Chartered | |||
| 137,800 | United Financial Bancorp | 1,880,970 | |
| 102,400 | Westfield Financial Inc. | 852,992 | |
| 2,733,962 | 1.63% | ||
| Security Brokers, Dealers & Flotation Companies | |||
| 221,300 | Knight Capital Group Inc. * | 3,051,727 | |
| 711,256 | LaBranche & Co., Inc. * | 3,044,176 | |
| 52,400 | Piper Jaffray Companies * | 1,688,328 | |
| 7,784,231 | 4.64% | ||
| Semiconductors & Related Devices | |||
| 278,100 | Verigy, Ltd. * (Singapore) | 2,416,689 | 1.44% |
| Services - Business Services | |||
| 70,600 | Fair Isaac Corp. | 1,538,374 | |
| 320,905 | Premiere Global Services, Inc. * | 2,034,538 | |
| 154,900 | TNS, Inc. * | 2,701,456 | |
| 6,274,368 | 3.74% | ||
| Services - Computer Integrated Systems Design | |||
| 156,200 | Convergys Corp. * | 1,532,322 | |
| 68,950 | MICROS Systems, Inc. * | 2,197,436 | |
| 3,729,758 | 2.23% | ||
| Services - Computer Programming, Data Processing, Etc. | |||
| 181,962 | EarthLink Inc. | 1,448,418 | 0.86% |
| Services - Direct Mail Advertising Services | |||
| 190,800 | infoGROUP Inc. * | 1,522,584 | 0.91% |
| Services - Educational Services | |||
| 112,100 | Career Education Corp. * | 2,580,542 | 1.54% |
| *Non-Income Producing Securities. The accompanying notes are an integral part of these financial statements. |
2010 Semi-Annual Report 11
| Paradigm Value Fund | |||
| Schedule of Investments | |||
| June 30, 2010 (Unaudited) | |||
| Shares/Principal Amount | Fair Value | % of Net Assets | |
| COMMON STOCKS | |||
| Services - Hospitals | |||
| 74,900 | Magellan Health Services Inc. * | $ 2,720,368 | |
| 50,300 | MEDNAX, Inc. * | 2,797,183 | |
| 5,517,551 | 3.29% | ||
| Services - Management Consulting Services | |||
| 56,000 | FTI Consulting, Inc. * | 2,441,040 | 1.46% |
| Services - Motion Picture & Video Tape Production | |||
| 2,070 | CKX Inc. * | 10,329 | 0.01% |
| Services - Motion Picture Theaters | |||
| 199,000 | Regal Entertainment Group Class A | 2,594,960 | 1.55% |
| Services - Prepackaged Software | |||
| 384,000 | Compuware Corp. * | 3,064,320 | |
| 315,400 | Lawson Software, Inc. * | 2,302,420 | |
| 5,366,740 | 3.20% | ||
| Special Industry Machinery | |||
| 77,100 | Cymer, Inc. * | 2,316,084 | 1.38% |
| Transportation Services | |||
| 73,400 | GATX Corp. | 1,958,312 | 1.17% |
| Wholesale - Chemicals & Allied Products | |||
| 118,400 | Innophos Holdings Inc | 3,087,872 | 1.84% |
| Wholesale - Electronic Parts & Equipment, NEC | |||
| 347,400 | Brightpoint, Inc. * | 2,431,800 | 1.45% |
| Wholesale - Miscellaneous Durable Goods | |||
| 75,500 | Schnitzer Steel Industries, Inc. | 2,959,600 | 1.77% |
| Total for Common Stock (Cost $149,216,823) | $ 149,988,592 | 89.48% | |
| CORPORATE BONDS | |||
| 2,900,000 | Smurfit-Stone Container Corporation, 8.0%, 3/15/2017 | 2,250,980 | |
| Total for Corporate Bonds (Cost $2,363,500) | 2,250,980 | 1.34% | |
| REAL ESTATE INVESTMENT TRUSTS | |||
| 61,000 | Invesco Mortgage Capital Inc. | 1,220,610 | |
| 368,600 | MFA Mortgage Investments Inc. | 2,727,640 | |
| 53,700 | Mid-America Apartment Communities Inc. | 2,763,939 | |
| Total for Real Estate Investment Trusts (Cost $6,096,783) | 6,712,189 | 4.00% | |
| MONEY MARKET FUNDS | |||
| 13,508,241 | SEI Daily Income Treasury Government CL B 0.05% *** | 13,508,241 | 8.06% |
(Cost $13,508,241) | |||
| Total Investment Securities | 172,460,002 | 102.88% | |
| (Cost $171,185,347) | |||
| Liabilities In Excess of Other Assets | (4,832,075) | -2.88% | |
| Net Assets | $ 167,627,927 | 100.00% | |
| *Non-Income Producing Securities. ***Variable Rate Security; the rate shown was the rate at June 30, 2010. The accompanying notes are an integral part of these financial statements. |
2010 Semi-Annual Report 12
| Paradigm Select Fund | |||
| Schedule of Investments | |||
| June 30, 2010 (Unaudited) | |||
| Shares/Principal Amount | Fair Value | % of Net Assets | |
| COMMON STOCKS | |||
| Agriculture Production - Crops | |||
| 4,600 | Dole Food Company Inc. * | $ 47,978 | |
| 1,800 | Fresh Del Monte Produce Inc. * | 36,432 | |
| 84,410 | 2.99% | ||
| Biological Products, (No Diagnostic Substances) | |||
| 1,200 | Life Technologies Corporation * | 56,700 | 2.01% |
| Canned, Fruits, Vegetables, Preserves, Jams & Jellies | |||
| 700 | The J. M. Smucker Company | 42,154 | 1.50% |
| Chemical & Allied Products | |||
| 2,800 | Innospec Inc. | 26,264 | |
| 2,200 | Olin Corp. | 39,798 | |
| 66,062 | 2.34% | ||
| Computer Communications Equipment | |||
| 2,500 | QLogic Corp. * | 41,550 | 1.47% |
| Construction - Special Trade Contractors | |||
| 2,700 | Matrix Service Co. * | 25,137 | 0.89% |
| Crude Petroleum & Natural Gas | |||
| 2,275 | Carrizo Oil & Gas Inc. * | 35,331 | |
| 2,300 | EXCO Resources Inc. | 33,603 | |
| 1,550 | Plains Exploration & Production Company * | 31,945 | |
| 3,700 | Resolute Energy Corporation * | 45,288 | |
| 800 | St. Mary Land & Exploration Co. | 32,128 | |
| 400 | Whiting Petroleum Corp. * | 31,368 | |
| 209,663 | 7.44% | ||
| Electric & Other Services Combined | |||
| 1,700 | CMS Energy Corp. | 24,905 | 0.88% |
| Electrical Work | |||
| 1,700 | EMCOR Group Inc. * | 39,389 | 1.40% |
| Electronic Components & Accessories | |||
| 5,200 | Vishay Intertechnology * | 40,248 | 1.43% |
| Fabricated Plater Work (Boiler Shops) | |||
| 1,800 | Chart Industries, Inc. * | 28,044 | 0.99% |
| Fire, Marine & Casualty Insurance | |||
| 154 | Alleghany Inc. * | 45,168 | |
| 1,100 | American Financial Group Inc. | 30,052 | |
| 300 | Everest Re Group Ltd. | 21,216 | |
| 1,200 | Harleysville Group Inc. | 37,236 | |
| 2,600 | Hilltop Holdings Inc. * | 26,026 | |
| 50 | Markel Corp. * | 17,000 | |
| 176,698 | 6.27% | ||
| Food & Kindred Products | |||
| 1,675 | Flowers Foods Inc. | 40,920 | 1.45% |
| Games, Toys & Children's Vehicles (No Dolls & Bicycles) | |||
| 900 | Hasbro Inc. | 36,990 | 1.31% |
| Grain Mill Products | |||
| 900 | Corn Products International Inc. | 27,270 | 0.97% |
| Guided Missiles & Space Vehicles & Parts | |||
| 400 | Alliant Techsystems Inc. * | 24,824 | 0.88% |
| Hospital & Medical Service Plans | |||
| 1,200 | AMERIGROUP Corporation * | 38,976 | 1.38% |
| Industrial Organic Chemicals | |||
| 1,800 | Sensient Technologies Corporation | 46,674 | |
| 1,300 | Westlake Chemical Corp. | 24,141 | |
| 70,815 | 2.51% | ||
| *Non-Income Producing Securities. The accompanying notes are an integral part of these financial statements. |
2010 Semi-Annual Report 13
| Paradigm Select Fund | |||
| Schedule of Investments | |||
| June 30, 2010 (Unaudited) | |||
| Shares/Principal Amount | Fair Value | % of Net Assets | |
| COMMON STOCKS | |||
| Iron & Steel Foundries | |||
| 400 | Precision Castparts Corp. | $ 41,168 | 1.46% |
| Laboratory Analytical Instruments | |||
| 1,950 | PerkinElmer Inc. | 40,307 | 1.43% |
| Men's & Boy's Furnishings, Work Clothing & Allied Garments | |||
| 1,080 | Phillips-Van Heusen Corp. | 49,972 | 1.77% |
| Metal Cans | |||
| 1,400 | Silgan Holdings Inc. | 39,732 | 1.41% |
| Mining & Quarrying of Nonmetallic Minerals (No Fuels) | |||
| 600 | Compass Minerals International Inc. | 42,168 | 1.50% |
| Miscellaneous Food Preparations & Kindred Products | |||
| 1,100 | American Italian Pasta Co. Class A * | 58,157 | 2.06% |
| Miscellaneous Industrial & Commercial Machinery & Equipment | |||
| 800 | Curtiss-Wright Corp. | 23,232 | 0.82% |
| Pharmaceutical Preparations | |||
| 2,700 | Endo Pharmaceuticals Holdings Inc. * | 58,914 | 2.09% |
| Plastics Products | |||
| 700 | AptarGroup Inc. | 26,474 | 0.94% |
| Radiotelephone Communications | |||
| 1,000 | Telephone & Data Systems Inc. | 26,540 | 0.95% |
| Retail - Family Clothing Stores | |||
| 3,500 | American Eagle Outfitters | 41,125 | 1.46% |
| Retail - Miscellaneous Retail | |||
| 2,500 | EZCORP Inc. Class A * | 46,375 | 1.65% |
| Retail - Shoe Stores | |||
| 2,900 | Foot Locker, Inc. | 36,598 | 1.30% |
| Retail - Variety Stores | |||
| 1,300 | Big Lots Inc. * | 41,717 | 1.48% |
| Security Brokers, Dealers & Flotation Companies | |||
| 1,900 | Jefferies Group Inc. | 40,052 | |
| 3,400 | Knight Capital Group Inc. * | 46,886 | |
| 1,000 | Piper Jaffray Companies * | 32,220 | |
| 119,158 | 4.23% | ||
| Semiconductors & Related Devices | |||
| 4,300 | Verigy, Ltd. * (Singapore) | 37,367 | 1.33% |
| Services - Business Services | |||
| 1,300 | Fair Isaac Corp. | 28,327 | |
| 1,303 | Lender Processing Services, Inc. | 40,797 | |
| 5,200 | Premiere Global Services Inc. * | 32,968 | |
| 2,400 | TNS, Inc. * | 41,856 | |
| 143,948 | 5.11% | ||
| Services - Computer Integrated Systems Design | |||
| 2,500 | Convergys Corp. * | 24,525 | |
| 1,100 | MICROS Systems, Inc. * | 35,057 | |
| 59,582 | 2.11% | ||
| Services - Computer Programming, Data Processing, Etc. | |||
| 3,200 | EarthLink Inc. | 25,472 | 0.90% |
| Services - Educational Services | |||
| 1,700 | Career Education Corp. * | 39,134 | 1.39% |
| *Non-Income Producing Securities. The accompanying notes are an integral part of these financial statements. |
2010 Semi-Annual Report 14
| Paradigm Select Fund | |||
| Schedule of Investments | |||
| June 30, 2010 (Unaudited) | |||
| Shares/Principal Amount | Fair Value | % of Net Assets | |
| COMMON STOCKS | |||
| Services - Hospitals | |||
| 1,200 | Magellan Health Services Inc. * | $ 43,584 | |
| 800 | MEDNAX, Inc. * | 44,488 | |
| 88,072 | 3.12% | ||
| Services - Management Consulting Services | |||
| 1,000 | FTI Consulting, Inc. * | 43,590 | 1.55% |
| Services - Motion Picture Theaters | |||
| 2,900 | Regal Entertainment Group Class A | 37,816 | 1.34% |
| Services - Prepackaged Software | |||
| 6,200 | Compuware Corp. * | 49,476 | |
| 4,000 | Lawson Software, Inc. * | 29,200 | |
| 78,676 | 2.79% | ||
| Special Industry Machinery | |||
| 1,400 | Cymer, Inc. * | 42,056 | 1.49% |
| Wholesale - Electronic Parts & Equipment, NEC | |||
| 6,500 | Brightpoint, Inc. * | 45,500 | 1.61% |
| Wholesale - Miscellaneous Durable Goods | |||
| 900 | Schnitzer Steel Industries, Inc. | 35,280 | 1.25% |
| Total for Common Stock (Cost $2,229,876) | $ 2,442,885 | 86.66% | |
| REAL ESTATE INVESTMENT TRUSTS | |||
| 6,100 | MFA Mortgage Investments Inc. | 45,140 | |
| 400 | Mid-America Apartment Communities Inc. | 20,588 | |
| Total for Real Estate Investment Trusts (Cost $65,181) | 65,728 | 2.34% | |
| MONEY MARKET FUNDS | |||
| 292,460 | SEI Daily Income Treasury Government CL B 0.05% *** | 292,460 | 10.37% |
| (Cost $292,460) | |||
| Total Investment Securities | 2,801,073 | 99.37% | |
(Cost $2,587,517) | |||
| Other Assets In Excess of Liabilities | 17,826 | 0.63% | |
| Net Assets | $ 2,818,899 | 100.00% | |
| *Non-Income Producing Securities. ***Variable Rate Security; the rate shown was the rate at June 30, 2010. The accompanying notes are an integral part of these financial statements. |
2010 Semi-Annual Report 15
| Paradigm Opportunity Fund | |||
| Schedule of Investments | |||
| June 30, 2010 (Unaudited) | |||
| Shares/Principal Amount | Fair Value | % of Net Assets | |
| COMMON STOCKS | |||
| Agriculture Production - Crops | |||
| 10,600 | Dole Food Company Inc. * | $ 110,558 | |
| 5,400 | Fresh Del Monte Produce Inc. * | 109,296 | |
| 219,854 | 5.66% | ||
| Air Transportation, Scheduled | |||
| 19,600 | Hawaiian Holdings Inc. * | 101,332 | 2.61% |
| Biological Products, (No Diagnostic Substances) | |||
| 3,400 | Life Technologies Corporation * | 160,650 | 4.14% |
| Computer Communications Equipment | |||
| 6,900 | QLogic Corp. * | 114,678 | 2.95% |
| Construction - Special Trade Contractors | |||
| 8,800 | Matrix Service Co. * | 81,928 | 2.11% |
| Crude Petroleum & Natural Gas | |||
| 6,500 | Carrizo Oil & Gas Inc. * | 100,945 | 2.60% |
| Electrical Work | |||
| 4,800 | EMCOR Group Inc. * | 111,216 | 2.86% |
| Heavy Construction Other Than Building Construction - Contractors | |||
| 8,500 | Orion Marine Group, Inc. * | 120,700 | 3.11% |
| Hospital & Medical Service Plans | |||
| 4,100 | AMERIGROUP Corporation * | 133,168 | 3.43% |
| Industrial Organic Chemicals | |||
| 4,800 | Sensient Technologies Corporation | 124,464 | 3.21% |
| Laboratory Analytical Instruments | |||
| 5,700 | PerkinElmer Inc. | 117,819 | 3.04% |
| Pharmaceutical Preparations | |||
| 6,100 | Endo Pharmaceuticals Holdings Inc. * | 133,102 | 3.43% |
| Retail - Eating Places | |||
| 11,500 | Ruby Tuesday, Inc. * | 97,750 | 2.52% |
| Retail - Family Clothing Stores | |||
| 10,000 | American Eagle Outfitters | 117,500 | 3.03% |
| Retail - Miscellaneous Retail | |||
| 7,100 | EZCORP Inc. Class A * | 131,705 | 3.39% |
| Retail - Shoe Stores | |||
| 7,600 | Foot Locker, Inc. | 95,912 | 2.47% |
| Retail - Variety Stores | |||
| 3,700 | Big Lots Inc. * | 118,733 | 3.06% |
| Security Brokers, Dealers & Flotation Companies | |||
| 9,100 | Knight Capital Group Inc. * | 125,489 | 3.23% |
| Semiconductors & Related Devices | |||
| 11,100 | Verigy, Ltd. * (Singapore) | 96,459 | 2.48% |
| Services - Business Services | |||
| 17,100 | Premiere Global Services Inc. * | 108,414 | |
| 6,800 | TNS, Inc. * | 118,592 | |
| 227,006 | 5.85% | ||
| Services - Computer Integrated Systems Design | |||
| 6,900 | Convergys Corp. * | 67,689 | |
| 3,000 | MICROS Systems, Inc. * | 95,610 | |
| 163,299 | 4.21% | ||
| Services - Direct Mail Advertising Services | |||
| 14,800 | infoGROUP Inc. * | 118,104 | 3.04% |
| Services - Educational Services | |||
| 4,900 | Career Education Corp. * | 112,798 | 2.91% |
| *Non-Income Producing Securities. The accompanying notes are an integral part of these financial statements. |
2010 Semi-Annual Report 16
| Paradigm Opportunity Fund | |||
| Schedule of Investments | |||
| June 30, 2010 (Unaudited) | |||
| Shares/Principal Amount | Fair Value | % of Net Assets | |
| COMMON STOCKS | |||
| Services - Hospitals | |||
| 3,500 | Magellan Health Services Inc. * | $ 127,120 | |
| 2,300 | MEDNAX, Inc. * | 127,903 | |
| 255,023 | 6.57% | ||
| Services - Motion Picture Theaters | |||
| 8,600 | Regal Entertainment Group Class A | 112,144 | 2.89% |
| Service - Prepackaged Software | |||
| 15,300 | Compuware Corp. * | 122,094 | |
| 15,400 | Lawson Software, Inc. * | 112,420 | |
| 234,514 | 6.04% | ||
| Total for Common Stock (Cost $3,446,636) | $ 3,526,292 | 90.84% | |
| REAL ESTATE INVESTMENT TRUSTS | |||
| 2,600 | Mid-America Apartment Communities Inc. | 133,822 | |
| Total for Real Estate Investment Trusts (Cost $102,610) | 133,822 | 3.44% | |
| MONEY MARKET FUNDS | |||
| 108,631 | SEI Daily Income Treasury Government CL B 0.05% *** | 108,631 | 2.80% |
| (Cost $108,631) | |||
| Total Investment Securities | 3,768,745 | 97.08% | |
| (Cost $3,657,877) | |||
| Other Assets In Excess of Liabilities | 113,235 | 2.92% | |
| Net Assets | $ 3,881,980 | 100.00% | |
*Non-Income Producing Securities. |
2010 Semi- Annual Report 17
| Paradigm Intrinsic Value Fund | |||
| Schedule of Investments | |||
| June 30, 2010 (Unaudited) | |||
| Shares/Principal Amount | Fair Value | % of Net Assets | |
| COMMON STOCKS | |||
| Beverages | |||
| 875 | Pepsico, Inc. | $ 53,331 | 1.93% |
| Chemicals & Allied Products | |||
| 1,915 | Arch Chemicals Inc. | 58,867 | |
| 5,900 | Innospec Inc. | 55,342 | |
| 114,209 | 4.14% | ||
| Computer Communications Equipment | |||
| 1,725 | QLogic Corp. * | 28,669 | 1.04% |
| Crude Petroleum & Natural Gas | |||
| 320 | Cenovus Energy Inc. (Canada) | 8,253 | |
| 320 | EnCana Corp. | 9,709 | |
| 5,590 | EXCO Resources Inc. | 81,670 | |
| 765 | Plains Exploration & Production Company * | 15,767 | |
| 5,135 | Resolute Energy Corporation * | 62,852 | |
| 178,251 | 6.46% | ||
| Electronic Components & Accessories | |||
| 7,500 | Vishay Intertechnology * | 58,050 | 2.10% |
| Fire, Marine & Casualty Insurance | |||
| 700 | Berkshire Hathaway Inc. Class B * | 55,783 | 2.02% |
| Food and Kindred Products | |||
| 1,652 | Nestle SA ** | 79,379 | 2.88% |
| Grain Mill Products | |||
| 1,610 | Corn Products International Inc. | 48,783 | 1.77% |
| Investment Advice | |||
| 2,135 | Onex Corporation * (Canada) | 51,027 | 1.85% |
| Iron & Steel Foundries | |||
| 490 | Precision Castparts Corp. | 50,431 | 1.83% |
| Laboratory Analytical Instruments | |||
| 3,225 | PerkinElmer Inc. | 66,661 | 2.42% |
| Men's & Boys' Furnishings, Work Clothing, and Allied Garments | |||
| 1,290 | Phillips-Van Heusen Corp. | 59,688 | 2.16% |
| Metal Cans | |||
| 3,030 | Silgan Holdings Inc. | 85,991 | 3.12% |
| Mineral Royalty Traders | |||
| 1,030 | Royal Gold, Inc. | 49,440 | 1.79% |
| Mining & Quarrying of Nonmetallic Minerals (No Fuels) | |||
| 870 | Compass Minerals International Inc. | 61,144 | 2.22% |
| Newspapers: Publishing or Publishing & Printing | |||
| 1,990 | News Corp. Class A | 23,800 | 0.86% |
| Petroleum Refining | |||
| 255 | ConocoPhillips | 12,518 | 0.45% |
| Railroads, Line-Haul Operating | |||
| 1,220 | Canadian National Railway Company (Canada) | 70,004 | 2.54% |
| Retail - Drug Stores and Proprietary Stores | |||
| 2,775 | CVS Caremark Corporation | 81,363 | 2.95% |
| Retail - Family Clothing Stores | |||
| 6,775 | American Eagle Outfitters | 79,606 | 2.89% |
| Security Brokers, Dealers & Flotation Companies | |||
| 3,725 | Jefferies Group Inc. * | 78,523 | |
| 26,875 | LaBranche & Co., Inc. * | 115,025 | |
| 1,450 | Piper Jaffray Companies * | 46,719 | |
| 240,267 | 8.71% | ||
| *Non-Income Producing Securities. **ADR - American Depositary Receipt. The accompanying notes are an integral part of these financial statements. |
2010 Semi-Annual Report 18
| Paradigm Intrinsic Value Fund | |||
| Schedule of Investments | |||
| June 30, 2010 (Unaudited) | |||
| Shares/Principal Amount | Fair Value | % of Net Assets | |
| COMMON STOCKS | |||
| Services - Business Services | |||
| 2,550 | Lender Processing Services, Inc. | $ 79,840 | 2.89% |
| Services - Computer Programming, Data Processing, Etc. | |||
| 3,225 | EarthLink Inc. | 25,671 | 0.93% |
| Services - Hospitals | |||
| 1,525 | Magellan Health Services Inc. * | 55,388 | 2.01% |
| Ship & Boat Building & Repairing | |||
| 1,415 | General Dynamics Corp. | 82,862 | 3.00% |
| Wholesale - Chemicals & Allied Products | |||
| 2,130 | Innophos Holdings Inc | 55,550 | 2.02% |
| Wholesale - Electronic Parts & Equipment, NEC | |||
| 3,180 | Avnet Inc. * | 76,670 | |
| 10,930 | Brightpoint, Inc. * | 76,510 | |
| 153,180 | 5.56% | ||
| Wholesale - Miscellaneous Durable Goods | |||
| 1,900 | Schnitzer Steel Industries, Inc. | 74,480 | 2.71% |
| Total for Common Stock (Cost $2,074,283) | $ 2,075,366 | 75.25% | |
| CORPORATE BONDS | |||
| 100,000 | Smurfit-Stone Container Corporation, 8.0%, 3/15/2017 | 77,620 | |
| Total for Corporate Bonds (Cost $81,500) | 77,620 | 2.81% | |
| EXCHANGE TRADED FUNDS | |||
| 11,650 | iShares COMEX Gold Trust * | 141,781 | |
| 2,000 | UltraShort 20+ Year Treasury ProShares * | 70,960 | |
| Total for Exchange Traded Funds (Cost - $183,555) | 212,741 | 7.72% | |
| REAL ESTATE INVESTMENT TRUSTS | |||
| 6,785 | MFA Mortgage Investments Inc. | 50,209 | |
| Total for Real Estate Investment Trusts (Cost - $45,287) | 50,209 | 1.82% | |
| MONEY MARKET FUNDS | |||
| 388,983 | SEI Daily Income Treasury Government CL B 0.05% *** | 388,983 | 14.10% |
| (Cost $388,983) | |||
| Total Investment Securities | 2,804,919 | 101.70% | |
| (Cost $2,773,608) | |||
| Liabilities In Excess of Other Assets | (46,796 ) | -1.70% | |
| Net Assets | $ 2,758,123 | 100.00% | |
*Non-Income Producing Securities. |
2010 Semi-Annual Report 19
| Paradigm Funds | |||
| Statements of Assets and Liabilities (Unaudited) | Value | Select | |
| June 30, 2010 | Fund | Fund | |
| Assets: | |||
| Investment Securities at Fair Value* | $ 172,460,002 | $ 2,801,073 | |
| Cash | 122,621 | - | |
| Receivable for Securities Sold | - | 43,796 | |
| Receivable for Fund Shares Sold | 180,030 | - | |
| Dividend Receivable | 130,035 | 888 | |
| Interest Receivable | 525 | 9 | |
| Total Assets | 172,893,213 | 2,845,766 | |
| Liabilities: | |||
| Payable for Securities Purchased | 4,890,389 | 22,933 | |
| Payable for Fund Shares Redeemed | 139,050 | - | |
| Payable to Advisor | 235,847 | 3,934 | |
| Total Liabilities | 5,265,286 | 26,867 | |
| Net Assets | $ 167,627,927 | $ 2,818,899 | |
| Net Assets Consist of: | |||
| Paid In Capital | $ 179,545,325 | $ 3,002,257 | |
| Accumulated Undistributed Net Investment Income | 74,549 | 1,659 | |
| Accumulated Realized Loss on Investments - Net | (13,266,602) | (398,573) | |
| Unrealized Appreciation (Depreciation) in Value of Investment Securities - Net | 1,274,655 | 213,556 | |
| Net Assets | $ 167,627,927 | $ 2,818,899 | |
| Net Asset Value and Offering Price (Note 2) | $ 42.37 | $ 23.22 | |
| * Investments at Identified Cost | $ 171,185,347 | $ 2,587,517 | |
| Shares Outstanding (Unlimited number of shares | 3,956,417 | 121,408 | |
| authorized without par value) | |||
| Statements of Operations (Unaudited) | |||
| For the six month period ended June 30, 2010 | |||
| Investment Income: | |||
| Dividends | $ 861,291 | $ 13,510 | |
| Interest | 3,338 | 42 | |
| Total Investment Income | 864,629 | 13,552 | |
| Expenses: | |||
| Investment Advisor Fees | 1,532,526 | 21,142 | |
| Total Expenses | 1,532,526 | 21,142 | |
| Less: Expenses Waived | (325,194) | - | |
| Net Expenses | 1,207,332 | 21,142 | |
| Net Investment Loss | (342,703) | (7,590) | |
| Realized and Unrealized Gain (Loss) on Investments: | |||
| Net Realized Gain on Investments | 11,396,642 | 116,840 | |
| Net Change in Unrealized Appreciation (Depreciation) on Investments | (14,353,954) | (200,675) | |
| Net Realized and Unrealized Loss on Investments | (2,957,312) | (83,835) | |
| Net Decrease in Net Assets from Operations | $ (3,300,015) | $ (91,425) | |
The accompanying notes are an integral part of these |
2010 Semi-Annual Report 20
| Paradigm Funds | |||
| Statements of Assets and Liabilities (Unaudited) | Opportunity | Intrinsic Value | |
| June 30, 2010 | Fund | Fund | |
| Assets: | |||
| Investment Securities at Fair Value* | $ 3,768,745 | $ 2,804,919 | |
| Receivable for Securities Sold | 123,698 | 65,180 | |
| Dividend Receivable | 1,100 | 2,073 | |
| Interest Receivable | 6 | 14 | |
| Total Assets | 3,893,549 | 2,872,186 | |
| Liabilities: | |||
| Payable for Securities Purchased | 5,947 | 110,764 | |
| Payable to Advisor | 5,622 | 3,299 | |
| Total Liabilities | 11,569 | 114,063 | |
| Net Assets | $ 3,881,980 | $ 2,758,123 | |
| Net Assets Consist of: | |||
| Paid In Capital | $ 4,354,758 | $ 3,160,628 | |
| Accumulated Undistributed Net Investment Income (Loss) | (21,801) | 14,638 | |
| Accumulated Realized Loss on Investments - Net | (561,845) | (448,454) | |
| Unrealized Appreciation (Depreciation) in Value of Investment Securities - Net | 110,868 | 31,311 | |
| Net Assets | $ 3,881,980 | $ 2,758,123 | |
| Net Asset Value and Offering Price (Note 2) | $ 19.91 | $ 17.01 | |
| * Investments at Identified Cost | $ 3,657,877 | $ 2,773,608 | |
| Shares Outstanding (Unlimited number of shares | 194,997 | 162,161 | |
| authorized without par value) | |||
| Statements of Operations (Unaudited) | |||
| For the six month period ended June 30, 2010 | |||
| Investment Income: | |||
| Dividends (Net of foreign withholding tax and fees of $0 and $22, respectively) | $ 8,196 | $ 14,678 | |
| Interest | 67 | 89 | |
| Total Investment Income | 8,263 | 14,767 | |
| Expenses: | |||
| Investment Advisor Fees | 40,086 | 17,491 | |
| Total Expenses | 40,086 | 17,491 | |
| Less: Expenses Waived | (10,022) | - | |
| Net Expenses | 30,064 | 17,491 | |
| Net Investment Loss | (21,801) | (2,724) | |
| Realized and Unrealized Gain (Loss) on Investments: | |||
| Net Realized Gain (Loss) on Investments | 499,713 | (60,568) | |
| Net Change in Unrealized Appreciation on Investments | (588,354) | (109,671) | |
| Net Realized and Unrealized Loss on Investments | (88,641) | (170,239) | |
| Net Decrease in Net Assets from Operations | $ (110,442 ) | $ (172,963) | |
The accompanying notes are an integral part of these |
2010 Semi-Annual Report 21
| Paradigm Funds | |||||
| Statements of Changes in Net Assets | Value Fund | Select Fund | |||
| (Unaudited) | (Unaudited) | ||||
| 1/1/2010 | 1/1/2009 | 1/1/2010 | 1/1/2009 | ||
| to | to | to | to | ||
| 6/30/2010 | 12/31/2009 | 6/30/2010 | 12/31/2009 | ||
| From Operations: | |||||
| Net Investment Income (Loss) | $ (342,703) | $ 417,252 | $ (7,590) | $ 9,242 | |
| Net Realized Gain (Loss) on Investments and Short Positions | 11,396,642 | (10,391,010) | 116,840 | (97,878) | |
| Change in Net Unrealized Appreciation (Depreciation) | (14,353,954) | 36,815,592 | (200,675) | 675,543 | |
| Increase (Decrease) in Net Assets from Operations | (3,300,015) | 26,841,834 | (91,425) | 586,907 | |
| From Distributions to Shareholders: | |||||
| Net Investment Income | - | - | - | (7,825) | |
| Net Realized Gain from Security Transactions | - | - | - | - | |
| Total Distributions to Shareholders | - | - | - | (7,825) | |
| From Capital Share Transactions: | |||||
| Proceeds From Sale of Shares | 64,039,767 | 42,333,512 | 450,493 | 291,985 | |
| Proceeds from Redemption Fees (Note 2) | 6,346 | 28,816 | 10 | 219 | |
| Shares Issued on Reinvestment of Dividends | - | - | - | 7,825 | |
| Cost of Shares Redeemed | (16,161,436) | (31,178,990) | (249,775) | (200,548) | |
| Net Increase (Decrease) from Shareholder Activity | 47,884,677 | 11,183,338 | 200,728 | 99,481 | |
| Net Increase (Decrease) in Net Assets | 44,584,662 | 38,025,172 | 109,303 | 678,563 | |
| Net Assets at Beginning of Period | 123,043,265 | 85,018,093 | 2,709,596 | 2,031,033 | |
| Net Assets at End of Period | $ 167,627,927 | $ 123,043,265 | $ 2,818,899 | $ 2,709,596 | |
| Accumulated Undistributed Net Investment Income | $ 74,549 | $ 417,252 | $ 1,659 | $ 9,249 | |
| Share Transactions: | |||||
| Issued | 1,436,666 | 1,152,252 | 17,816 | 14,285 | |
| Reinvested | - | - | - | 326 | |
| Redeemed | (358,554 ) | (889,119) | (10,139 ) | (10,486) | |
| Net Increase (Decrease) in Shares | 1,078,112 | 263,133 | 7,677 | 4,125 | |
| Shares Outstanding Beginning of Period | 2,878,305 | 2,615,172 | 113,731 | 109,606 | |
| Shares Outstanding End of Period | 3,956,417 | 2,878,305 | 121,408 | 113,731 | |
The accompanying notes are an integral part of these |
2010 Semi-Annual Report 22
| Paradigm Funds | |||||
| Statements of Changes in Net Assets | Opportunity Fund | Intrinsic Value Fund | |||
| (Unaudited) | (Unaudited) | ||||
| 1/1/2010 | 1/1/2009 | 1/1/2010 | 1/1/2009 | ||
| to | to | to | to | ||
| 6/30/2010 | 12/31/2009 | 6/30/2010 | 12/31/2009 | ||
| From Operations: | |||||
| Net Investment Income (Loss) | $ (21,801) | $ (1,294) | $ (2,724) | $ 17,291 | |
| Net Realized Gain (Loss) on Investments | 499,713 | (331,430) | (60,568) | (154,813) | |
| Change in Net Unrealized Appreciation (Depreciation) | (588,354) | 1,495,258 | (109,671) | 623,104 | |
| Increase (Decrease) in Net Assets from Operations | (110,442) | 1,162,534 | (172,963) | 485,582 | |
| From Distributions to Shareholders: | |||||
| Net Investment Income | - | - | - | (15,052) | |
| Net Realized Gain from Security Transactions | - | - | - | - | |
| Total Distributions to Shareholders | - | - | - | (15,052) | |
| From Capital Share Transactions: | |||||
| Proceeds From Sale of Shares | 369,087 | 141,464 | 355,814 | 495,676 | |
| Proceeds from Redemption Fees (Note 2) | 10 | - | - | 50 | |
| Shares Issued on Reinvestment of Dividends | - | - | - | 15,052 | |
| Cost of Shares Redeemed | (69,981) | (35,784) | - | (25,913) | |
| Net Increase (Decrease) from Shareholder Activity | 299,116 | 105,680 | 355,814 | 484,865 | |
| Net Increase (Decrease) in Net Assets | 188,674 | 1,268,214 | 182,851 | 955,395 | |
| Net Assets at Beginning of Period | 3,693,306 | 2,425,092 | 2,575,272 | 1,619,877 | |
| Net Assets at End of Period | $ 3,881,980 | $ 3,693,306 | $ 2,758,123 | $ 2,575,272 | |
| Accumulated Undistributed Net Investment Income | $ (21,801) | $ - | $ 14,638 | $ 17,362 | |
| Share Transactions: | |||||
| Issued | 16,161 | 8,258 | 18,979 | 28,321 | |
| Reinvested | - | - | - | 832 | |
| Redeemed | (3,173) | (2,067) | - | (1,832) | |
| Net Increase (Decrease) in Shares | 12,988 | 6,191 | 18,979 | 27,321 | |
| Shares Outstanding Beginning of Period | 182,009 | 175,818 | 143,182 | 115,861 | |
| Shares Outstanding End of Period | 194,997 | 182,009 | 162,161 | 143,182 | |
The accompanying notes are an integral part of these |
2010 Semi-Annual Report 22
| Paradigm Value Fund | |||||||||||
| Financial Highlights - Paradigm Value Fund | |||||||||||
| (Unaudited) | |||||||||||
| Selected data for a share outstanding | 1/1/2010 | 1/1/2009 | 1/1/2008 | 1/1/2007 | 1/1/2006 | 1/1/2005 | |||||
| throughout the period: | to | to | to | to | to | to | |||||
| 6/30/2010 | 12/31/2009 | 12/31/2008 | 12/31/2007 | 12/31/2006 | 12/31/2005 | ||||||
| Net Asset Value - Beginning of Period | $ 42.75 | $ 32.51 | $ 49.27 | $ 48.55 | $ 42.90 | $ 37.51 | |||||
| Net Investment Income/(Loss) (a) | (0.10) | 0.16 | (0.22) | (0.40) | (0.47) | (0.40) | |||||
| Net Gains (Loss) on Securities (realized and unrealized) | (0.28) | 10.07 | (16.52) | 2.84 | 8.69 | 7.75 | |||||
| Total from Investment Operations | (0.38) | 10.23 | (16.74) | 2.44 | 8.22 | 7.35 | |||||
| Distributions (From Net Investment Income) | - | - | - | - | - | - | |||||
| Distributions (From Capital Gains) | - | - | (0.07) | (1.73) | (2.58) | (1.96) | |||||
| Total Distributions | - | - | (0.07) | (1.73) | (2.58) | (1.96) | |||||
| Proceeds from Redemption Fee (Note 2) | - | + | 0.01 | 0.05 | 0.01 | 0.01 | - | ||||
| Net Asset Value - End of Period | $ 42.37 | $ 42.75 | $ 32.51 | $ 49.27 | $ 48.55 | $ 42.90 | |||||
| Total Return (b) | (0.89)% | *** | 31.50% | (33.88)% | 5.03% | 19.19% | 19.61% | ||||
| Ratios/Supplemental Data | |||||||||||
| Net Assets - End of Period (Thousands) | $ 167,628 | $ 123,043 | $ 85,018 | $ 116,247 | $ 56,743 | $ 24,002 | |||||
| Before Reimbursement | |||||||||||
| Ratio of Expenses to Average Net Assets | 1.90% | ** | 1.98% | 1.99% | 2.02% | 2.02% | 2.06% | ||||
| After Reimbursement | |||||||||||
| Ratio of Expenses to Average Net Assets (c) ++ | 1.50% | ** | 1.63% | 1.99% | 2.02% | 2.02% | 2.06% | ||||
| Ratio of Net Investment Income (Loss) to Average | |||||||||||
| Net Assets (c) ++ | -0.43% | ** | 0.43% | -0.52% | -0.78% | -1.02% | -0.98% | ||||
| Portfolio Turnover Rate | 43.90% | *** | 69.85% | 67.84% | 59.75% | 69.95% | 67.39% | ||||
| Paradigm Select Fund | |||||||||||
| Financial Highlights - Paradigm Select Fund | |||||||||||
| (Unaudited) | |||||||||||
| Selected data for a share outstanding throughout the period: | 1/1/2010 | 1/1/2009 | 1/1/2008 | 1/1/2007 | 1/1/2006 | 1/1/2005* | |||||
| to | to | to | to | to | to | ||||||
| 6/30/2010 | 12/31/2009 | 12/31/2008 | 12/31/2007 | 12/31/2006 | 12/31/2005 | ||||||
| Net Asset Value - Beginning of Period | $ 23.82 | $ 18.53 | $ 27.91 | $ 26.48 | $ 22.33 | $ 20.00 | |||||
| Net Investment Income/(Loss) (a) | (0.07) | 0.08 | 0.03 | (0.06) | (0.08) | (0.08) | |||||
| Net Gains (Loss) on Securities (realized and unrealized) | (0.53) | 5.28 | (9.41) | 1.54 | 4.92 | 2.49 | |||||
| Total from Investment Operations | (0.60) | 5.36 | (9.38) | 1.48 | 4.84 | 2.41 | |||||
| Distributions (From Net Investment Income) | - | (0.07) | - | - | - | - | |||||
| Distributions (From Capital Gains) | - | - | - | (0.05) | (0.69) | (0.08) | |||||
| Total Distributions | - | (0.07) | - | (0.05) | (0.69) | (0.08) | |||||
| Proceeds from Redemption Fee (Note 2) | - | + | - | + | - | - | - | - | |||
| Net Asset Value - End of Period | $ 23.22 | $ 23.82 | $ 18.53 | $ 27.91 | $ 26.48 | $ 22.33 | |||||
| Total Return (b) | (2.52)% | *** | 28.92% | (33.61)% | 5.57% | 21.67% | 12.06% | ||||
| Ratios/Supplemental Data | |||||||||||
| Net Assets - End of Period (Thousands) | $ 2,819 | $ 2,710 | $ 2,031 | $ 11,109 | $ 6,674 | $ 2,521 | |||||
| Ratio of Expenses to Average Net Assets | 1.50% | ** | 1.50% | 1.50% | 1.50% | 1.50% | 1.50% | ||||
| Ratio of Net Investment Income/(Loss) to | |||||||||||
| Average Net Assets | -0.54% | ** | 0.42% | 0.13% | -0.23% | -0.30% | -0.36% | ||||
| Portfolio Turnover Rate | 34.15% | *** | 65.57% | 47.71% | 64.68% | 72.15% | 68.56% | ||||
* Commencement of operations. ** Annualized *** Not Annualized. |
| The accompanying notes are an integral part of these financial statements. |
2010 Semi-Annual Report 24
| Paradigm Opportunity Fund | |||||||||||
| Financial Highlights - Paradigm Opportunity Fund | |||||||||||
| (Unaudited) | |||||||||||
| Selected data for a share outstanding throughout the period: | 1/1/2010 | 1/1/2009 | 1/1/2008 | 1/1/2007 | 1/1/2006 | 1/1/2005* | |||||
| to | to | to | to | to | to | ||||||
| 6/30/2010 | 12/31/2009 | 12/31/2008 | 12/31/2007 | 12/31/2006 | 12/31/2005 | ||||||
| Net Asset Value - Beginning of Period | $ 20.29 | $ 13.79 | $ 22.94 | $ 23.21 | $ 21.33 | $ 20.00 | |||||
| Net Investment Income (Loss) (a) | (0.12) | (0.01) | (0.13) | (0.04) | (0.04) | 0.04 | |||||
| Net Gains (Loss) on Securities (realized and unrealized) | (0.26) | 6.51 | (9.02) | 0.47 | 2.47 | 1.49 | |||||
| Total from Investment Operations | (0.38) | 6.50 | (9.15) | 0.43 | 2.43 | 1.53 | |||||
| Distributions (From Net Investment Income) | - | - | - | - | - | (0.02) | |||||
| Distributions (From Capital Gains) | - | - | - | (0.70) | (0.55) | (0.18) | |||||
| Total Distributions | $ - | $ - | $ - | (0.70) | (0.55) | (0.20) | |||||
| Proceeds from Redemption Fee (Note 2) | - | + | - | - | - | - | - | ||||
| Net Asset Value - End of Period | $ 19.91 | $ 20.29 | $ 13.79 | $ 22.94 | $ 23.21 | $ 21.33 | |||||
| Total Return (b) | (1.87)% | *** | 47.14% | (39.89)% | 1.85% | 11.39% | 7.65% | ||||
| Ratios/Supplemental Data | |||||||||||
| Net Assets - End of Period (Thousands) | $ 3,882 | $ 3,693 | $ 2,425 | $ 5,613 | $ 3,719 | $ 3,289 | |||||
| Before Reimbursement | |||||||||||
| Ratio of Expenses to Average Net Assets | 2.00% | ** | 2.00% | 2.00% | 2.00% | 2.00% | 2.00% | ||||
| Ratio of Net Investment Loss to Average Net Assets | -1.59% | ** | -0.54% | -1.17% | -0.67% | -0.68% | -0.11% | ||||
| After Reimbursement | |||||||||||
| Ratio of Expenses to Average Net Assets (c) | 1.50% | ** | 1.50% | 1.50% | 1.50% | 1.50% | 1.69% | ||||
| Ratio of Net Investment Income/(Loss) to Average | |||||||||||
| Net Assets (c) | -1.09% | ** | -0.04% | -0.67% | -0.17% | -0.18% | 0.21% | ||||
| Portfolio Turnover Rate | 63.77% | *** | 135.62% | 164.89% | 169.26% | 122.62% | 129.06% | ||||
| Paradigm Intrinsic Value Fund | |||||
| Financial Highlights - Paradigm Intrinsic Value Fund | |||||
| (Unaudited) | |||||
| Selected data for a share outstanding throughout the period: | 1/1/2010 | 1/1/2009 | 1/1/2008* | ||
| to | to | to | |||
| 6/30/2010 | 12/31/2009 | 12/31/2008 | |||
| Net Asset Value - Beginning of Period | $ 17.99 | $ 13.98 | $ 20.00 | ||
| Net Investment Income (Loss) (a) | (0.02) | 0.14 | 0.15 | ||
| Net Gains (Loss) on Securities (realized and unrealized) | (0.96) | 3.98 | (6.17) | ||
| Total from Investment Operations | (0.98) | 4.12 | (6.02) | ||
| Distributions (From Net Investment Income) | - | (0.11) | - | ||
| Distributions (From Capital Gains) | - | - | - | ||
| Total Distributions | - | (0.11) | - | ||
| Proceeds from Redemption Fee (Note 2) | - | + | - | + | - |
| Net Asset Value - End of Period | $ 17.01 | $ 17.99 | $ 13.98 | ||
| Total Return (b) | (5.45)% | *** | 29.44% | (30.10)% | |
| Ratios/Supplemental Data | |||||
| Net Assets - End of Period (Thousands) | $ 2,758 | $ 2,575 | $ 1,620 | ||
| Ratio of Expenses to Average Net Assets | 1.25% | ** | 1.25 % | 1.25% | |
| Ratio of Net Investment Income (Loss) to Average Net Assets | -0.19% | ** | 0.92% | 0.86% | |
| Portfolio Turnover Rate | 42.25% | *** | 79.35% | 70.57% | |
| * Commencement of operations. ** Annualized *** Not Annualized. (a) Per share amount calculated using the average shares method. (b) Total return in the above table represents the rate that the investor would have earned or lost on an investment in the fund assuming reinvestment of dividends. Returns do not reflect the deduction of taxes a shareholder would pay on Fund distributions or redemption of Fund shares. (c) Such percentages reflect an expense waiver by the Advisor. + Amount calculated is less than $0.005. |
| The accompanying notes are an integral part of these financial statements. |
2010 Semi-Annual Report 25
NOTES TO THE FINANCIAL STATEMENTS
PARADIGM FUNDS
June 30, 2010
(Unaudited)
1.) ORGANIZATION
The Paradigm Funds (the "Trust”) is an open-end management investment company organized in Ohio as a business trust on September 13, 2002 that may offer shares of beneficial interest in a number of separate series, each series representing a distinct fund with its own investment objectives and policies. The Paradigm Value Fund (“Value”) commenced operations on January 1, 2003. The Paradigm Value Fund's investment objective is long-term capital appreciation. The Paradigm Opportunity Fund (“Opportunity”) and Paradigm Select Fund (“Select”) both commenced operations on January 1, 2005 with long-term capital appreciation as their objective. The Paradigm Intrinsic Value Fund (“Intrinsic Value”) commenced operations on January 1, 2008. The Paradigm Intrinsic Value Fund's investment objective is long-term capital appreciation. The investment advisor to Value, Opportunity, Select and Intrinsic Value (collectively the “Funds”) is Paradi gm Funds Advisor LLC (the “Advisor”). The Funds are diversified.
2.) SIGNIFICANT ACCOUNTING POLICIES
SECURITY VALUATION: All investments in securities are recorded at their estimated fair value, as described in note 3.
SECURITY TRANSACTIONS AND OTHER: Security transactions are recorded based on a trade date. Dividend income is recognized on the ex-dividend date. Interest income is recognized on an accrual basis. The Funds use the highest cost basis in computing gain or loss on sale of investment securities. Discounts and premiums on fixed income securities purchased are amortized over the lives of the respective securities. Withholding taxes on foreign dividends have been provided for in accordance with the Funds’ understanding of the applicable country’s tax rules and rates. The Funds may invest in real estate investment trusts (“REITs”) that pay distributions to their shareholders based on available funds from operations. It is common for these distributions to exceed the REITs taxable earnings and profits resulting in the excess portion of such distribution to be designated as return of capital. Distributions received from REITs are generally recorded as dividend inc ome and, if necessary, are reclassified annually in accordance with tax information provided by the underlying REITs.
SHARE VALUATION: The net asset value (the “NAV”) is generally calculated as of the close of trading on the New York Stock Exchange (normally 4:00 p.m. Eastern time) every day the Exchange is open. The NAV for each fund is calculated by taking the total value of the fund’s assets, subtracting its liabilities, and then dividing by the total number of shares outstanding, rounded to the nearest cent. The offering price and redemption price per share is equal to the net asset value per share, except that shares of each Fund are subject to a redemption fee of 2% if redeemed within 90 days of purchase. During the six months ended June 30, 2010 proceeds from redemption fees were $6,346, $10, $10 and $0 for Value, Select, Opportunity and Intrinsic Value, respectively.
SHORT SALES: A Fund may sell a security it does not own in anticipation of a decline in the fair value of the security. When a Fund sells a security short, it must borrow the security sold short and deliver it to the broker-dealer through which it made the short sale. A gain, limited to the price at which a Fund sold the security short, or a loss, unlimited in size, will be recognized upon the termination of a short sale.
INCOME TAXES: The Funds’ policy is to continue to comply with the requirements of the Internal Revenue Code that are applicable to regulated investment companies and to distribute all of their taxable income to shareholders. Therefore, no federal income tax provision is required. It is the Funds’ policy to distribute annually, prior to the end of the calendar year, dividends sufficient to satisfy excise tax requirements of the Internal Revenue Code. This Internal Revenue Code requirement may cause an excess of distributions over the book year-end accumulated income. In addition, it is the Funds’ policy to distribute annually, after the end of the fiscal year, any remaining net investment income and net realized capital gains.
The Funds recognize the tax benefits of certain tax positions only where the position is “more likely than not” to be sustained assuming examination by tax authorities. Management has analyzed the Funds’ tax positions, and has concluded that no liability for unrecognized tax benefits should be recorded related to uncertain tax positions taken on returns filed for open tax years (2006-2008), or expected to be taken on the Funds’ 2009 tax return. The Funds identify their major tax jurisdictions
2010 Semi-Annual Report 26
Notes to the Financial Statements (Unaudited) - continued
as U.S. Federal and New York State tax authorities; however the Funds are not aware of any tax positions for which they are reasonably possible that the total amounts of unrecognized tax benefits will change materially in the next twelve months. The Funds recognize interest and penalties, if any, related to unrecognized tax benefits as income tax expense in the statements of operations. During the period, the Funds did not incur any interest or penalties.
ESTIMATES: The preparation of financial statements in conformity with accounting principles generally accepted in the United States of America (“GAAP”) requires management to make estimates and assumptions that affect the reported amounts of assets and liabilities and disclosure of contingent assets and liabilities at the date of the financial statements and the reported amounts of increases and decreases in net assets from operations during the reporting period. Actual results could differ from those estimates.
DISTRIBUTIONS TO SHAREHOLDERS: Distributions to shareholders, which are determined in accordance with income tax regulations, are recorded on the ex-dividend date. The treatment for financial reporting purposes of distributions made to shareholders during the year from net investment income or net realized capital gains may differ from their ultimate treatment for federal income tax purposes. These differences are caused primarily by differences in the timing of recognition of certain components of income, expense or realized capital gain for federal income tax purposes. Where such differences are permanent in nature, they are reclassified in the components of the net assets based on their ultimate characterization for federal income tax purposes. Any such reclassification will have no effect on net assets, results of operations or net asset values per share of any Fund.
SUBSEQUENT EVENTS: In preparing these financial statements, management has performed an evaluation of subsequent events and transactions for potential recognition or disclosure through the date of issuance of the financial statements.
3.) SECURITIES VALUATIONS
The Funds utilize various methods to measure the fair value of most of their investments on a recurring basis. GAAP establishes a hierarchy that prioritizes inputs to valuation methods. The three levels of inputs are:
Level 1 - Unadjusted quoted prices in active markets for identical assets or liabilities that the Funds have the ability to access.
Level 2 - Observable inputs other than quoted prices included in level 1 that are observable for the asset or liability, either directly or indirectly. These inputs may include quoted prices for the identical instrument on an inactive market, prices for similar instruments, interest rates, prepayment speeds, credit risk, yield curves, default rates and similar data.
Level 3 - Unobservable inputs for the asset or liability, to the extent relevant observable inputs are not available, representing the Funds’ own assumptions about the assumptions a market participant would use in valuating the assets or liabilities, and would be based on the best information available.
The availability of observable inputs can vary from security to security and is affected by a wide variety of factors, including, for example, the type of security, whether the security is new and not yet established in the marketplace, the liquidity of markets, and other characteristics particular to the security. To the extent that valuation is based on models or inputs that are less observable or unobservable in the market, the determination of fair value requires more judgment. Accordingly, the degree of judgment exercised in determining fair value is greatest for instruments categorized in level 3.
The inputs used to measure fair value may fall into different levels of the fair value hierarchy. In such cases, for disclosure purposes, the level in the fair value hierarchy within which the fair value measurement falls in its entirety, is determined based on the lowest level input that is significant to the fair value measurement in its entirety.
FAIR VALUE MEASUREMENTS
A description of the valuation techniques applied to the Funds’ major categories of assets and liabilities measured at fair value on a recurring basis follows.
Equity securities (common stock, real estate investment trusts and exchange traded funds). Equity securities are carried at fair value. The market quotation used for equity securities, including those listed on the NASDAQ National Market System, is the last sale price on the date on which the valua-
2010 Semi-Annual Report 27
Notes to the Financial Statements (Unaudited) - continued
tion is made or, in the absence of sales, at the closing bid price. Over-the-counter securities will be valued on the basis of the bid price at the close of each business day. Generally, if the security is traded in an active market and is valued at the last sale price, the security is categorized as a level 1 security. When the security position is not considered to be part of an active market or when the security is valued at the bid price, the position is generally categorized as level 2. When market quotations are not readily available, when the Advisor determines the last bid price does not accurately reflect the current value or when restricted securities are being valued, such securities are valued as determined in good faith by the Advisor, in conformity with guidelines adopted by and subject to review of the Board of Trustees (the “Trustees”) and are categorized in level 2 or level 3, when appropriate.
Money markets. Money market securities are valued at a net asset value of $1.00 and are classified in level 1 of the fair value hierarchy.
Fixed income securities (corporate bonds). Fixed income securities generally are valued by using market quotations, but may be valued on the basis of prices furnished by a pricing service when the Advisor believes such prices accurately reflect the fair value of such securities. A pricing service utilizes electronic data processing techniques based on yield spreads relating to securities with similar characteristics to determine prices for normal institutional-size trading units of debt securities without regard to sale or bid prices. When prices are not readily available from a pricing service, or when restricted or illiquid securities are being valued, securities are valued at fair value as determined in good faith by the Advisor, subject to review of the Trustees. Short-term investments in fixed income securities with maturities of less than 60 days when acquired, or which subsequently are within 60 days of maturity, are valued by using t he amortized cost method of valuation. Generally, fixed income securities are categorized as level 2.
In accordance with the Trust's good faith pricing guidelines, the Advisor is required to consider all appropriate factors relevant to the value of securities for which it has determined other pricing sources are not available or reliable as described above. There is no single standard for determining fair value controls, since fair value depends upon the circumstances of each individual case. As a general principle, the current fair value of an issue of securities being valued by the Advisor would appear to be the amount which the owner might reasonably expect to receive for them upon their current sale. Methods which are in accordance with this principle may, for example, be based on (i) a multiple of earnings; (ii) a discount from market of a similar freely traded security (including a derivative security or a basket of securities traded on other markets, exchanges or among dealers); or (iii) yield to maturity with respect to debt issues, or a combination of these and othe r methods.
The following tables summarize the inputs used to value the Funds’ assets measured at fair value as of June 30, 2010:
| Value: | ||||
| Valuation Inputs of Assets | Level 1 | Level 2 | Level 3 | Total |
| Common Stock | $ 149,988,592 | $0 | $0 | $149,988,592 |
| Corporate Bonds | 2,250,980 | 0 | 0 | 2,250,980 |
| Real Estate Investment Trusts | 6,712,189 | 0 | 0 | 6,712,189 |
| Money Market Funds | 13,508,241 | 0 | 0 | 13,508,241 |
| Total | $ 172,460,002 | $0 | $0 | $172,460,002 |
| Select: | ||||
| Valuation Inputs of Assets | Level 1 | Level 2 | Level 3 | Total |
| Common Stock | $ 2,442,885 | $0 | $0 | $ 2,442,885 |
| Real Estate Investment Trusts | 65,728 | 0 | 0 | 65,728 |
| Money Market Funds | 292,460 | 0 | 0 | 292,460 |
| Total | $ 2,801,073 | $0 | $0 | $ 2,801,073 |
| Opportunity: | ||||
| Valuation Inputs of Assets | Level 1 | Level 2 | Level 3 | Total |
| Common Stock | $ 3,526,292 | $0 | $0 | $ 3,526,292 |
| Real Estate Investment Trusts | 133,822 | 0 | 0 | 133,822 |
| Money Market Funds | 108,631 | 0 | 0 | 108,631 |
| Total | $ 3,768,745 | $0 | $0 | $ 3,768,745 |
2010 Semi-Annual Report 28
| Notes to the Financial Statements (Unaudited) - continued | ||||
| Intrinsic Value: | ||||
| Valuation Inputs of Assets | Level 1 | Level 2 | Level 3 | Total |
| Common Stock | $2,075,366 | $0 | $0 | $2,075,366 |
| Corporate Bonds | 77,620 | 0 | 0 | 77,620 |
| Exchange Traded Funds | 212,741 | 0 | 0 | 212,741 |
| Real Estate Investment Trusts | 50,209 | 0 | 0 | 50,209 |
| Money Market Funds | 388,983 | 0 | 0 | 388,983 |
| Total | $2,804,919 | $0 | $0 | $2,804,919 |
Refer to each Funds’ Schedule of Investments for a listing of securities by industry. The Funds did not hold any Level 3 assets during the six months ended June 30, 2010.
4.) INVESTMENT ADVISORY AGREEMENTS
Each of the Funds has an investment advisory agreement (collectively the "Management Agreements") with the Advisor. Under the terms of the Management Agreements, the Advisor manages the investment portfolios of the Funds, subject to policies adopted by the Trust’s Board of Trustees. Under the Management Agreements, the Advisor, at its own expense and without reimbursement from the Trust, furnishes office space and all necessary office facilities, equipment and executive personnel necessary for managing the assets of the Funds. The Advisor also pays the salaries and fees of all of its officers and employees that serve as officers and trustees of the Trust. For its services and payment of certain Fund expenses as described below, the Advisor receives an annual investment management fee of 1.50% of the average daily net assets from Select, 2.00% of the average daily net assets from Opportunity; and 1.25% of the average daily net assets from Intrinsic Value. For the Value Fund, th e Advisor receives an annual investment management fee of 2.00% of the average daily net assets on assets up to and including $100 million and 1.75% of the average daily net assets over $100 million. As a result of the above calculations, for the six months ended June 30, 2010, the Advisor earned management fees (before the waivers described below) totaling $1,532,526, $21,142, $40,086 and $17,491 for Value, Select, Opportunity, and Intrinsic Value, respectively. At June 30, 2010, $235,847, $3,934, $5,622 and $3,299 was due to the Advisor from Value, Select, Opportunity and Intrinsic Value, respectively. The Advisor has contractually agreed to waive management fees and/or reimburse Opportunity to the extent necessary to maintain total annual operating expenses of the Fund (excluding brokerage fees and commissions, interest and other borrowing expenses, taxes, extraordinary expenses and indirect costs of investing in acquired funds) at 1.50% of daily net assets through May 1, 2011. A total of $10,022 was waiv ed for the six months ended June 30, 2010 for Opportunity. Effective May 1, 2009, the Advisor has also contractually agreed to waive management fees and reimburse expenses to the extent necessary to maintain total annual operating expenses (excluding brokerage fees and commissions, interest and other borrowing expenses, taxes, extraordinary expenses and indirect costs of investing in Acquired Funds) at 1.50% of the Value Fund’s average daily net assets through May 1, 2011. A total of $325,194 was waived for the six months ended June 30, 2010 for Value. The Advisor pays all operating expenses of the Funds with the exception of taxes, brokerage fees and commissions, borrowing costs (such as (a) interest and (b) dividend expenses on securities sold short) and extraordinary expenses as defined under accounting principles generally accepted in the United States of America.
Certain officers and a shareholder of the Advisor are also officers and/or a Trustee of the Trust. These individuals may receive benefits from the Advisor resulting from management fees paid to the Advisor from the Funds.
The Trustees who are not interested persons of the Funds were paid $2,000 per meeting for the six months ended June 30, 2010 for the Trust. Under the Management Agreements, the Advisor pays these fees.
5.) INVESTMENTS
For the six months ended June 30, 2010, purchases and sales of investment securities other than U.S. Government obligations and short-term investments were as follows:
| Value | Select | Opportunity | Intrinsic Value | |
| Purchases | $115,030,181 | $1,024,699 | $2,696,341 | $1,466,378 |
| Sales | $64,494,950 | $883,862 | $2,331,787 | $1,032,660 |
There were no purchases or sales of U.S. Government obligations.
2010 Semi-Annual Report 29
Notes to the Financial Statements (Unaudited) - continued
For federal income tax purposes, at June 30, 2010 the cost of securities on a tax basis and the composition of gross unrealized appreciation (the excess of value over tax cost) and depreciation (the excess of tax cost over value) were as follows:
| Value | Select | Opportunity | Intrinsic Value | |
| Cost of Investments | $171,185,347 | $2,587,517 | $3,657,877 | $2,773,608 |
| Gross Unrealized Appreciation | $15,571,258 | $384,627 | $469,941 | $212,581 |
| Gross Unrealized Depreciation | ($14,296,603) | ($171,071) | ($359,073) | ($181,270) |
| Net Unrealized Appreciation | ||||
| (Depreciation) on Investments | $1,274,655 | $213,556 | $110,868 | $31,311 |
6.) CAPITAL SHARES
At June 30, 2010, the Trust was authorized to issue an unlimited number of shares of beneficial interest. The following are the shares issued and paid in capital outstanding for the Funds at June 30, 2010:
| Value | Select | Opportunity | Intrinsic Value | |
| Shares Issued | ||||
| and Outstanding | 3,956,417 | 121,408 | 194,997 | 162,161 |
| Paid in Capital | $179,545,325 | $3,002,257 | $4,354,758 | $3,160,628 |
7.) CONTROL OWNERSHIP
The beneficial ownership, either directly or indirectly, of more than 25% of the voting shares of a fund creates a presumption of control of the fund, under section 2(a)(9) of the Investment Company Act of 1940. At June 30, 2010, Charles Schwab & Co., Inc., held, for the benefit of its customers, in aggregate, 33.28% of Value, and therefore each may be deemed to control the Fund. Candace King Weir held, in aggregate, 29.82% of Select, and therefore may be deemed to control the Fund. Candace King Weir held, in aggregate, 79.71%, of Opportunity, and therefore may be deemed to control the Fund. Also, Candace King Weir and Charles Schwab & Co., for the benefit of its customers, held, in aggregate, 46.52% and 49.28%, respectively, of Intrinsic Value, and therefore each may be deemed to control the Fund.
8.) DISTRIBUTIONS TO SHAREHOLDERS
The tax character of distributions paid during the six months ended June 30, 2010 and fiscal year ended December 31, 2009 were as follows:
| Six Months Ended | Fiscal Year Ended | |
| June 30, 2010 | December 31, 2009 | |
| PARADIGM VALUE FUND | ||
| Ordinary Income | $ - | $ - |
| Short-term Capital Gain | - | - |
| Long-term Capital Gain | - | - |
| $ - | $ - | |
| PARADIGM SELECT FUND | ||
| Ordinary Income | $ - | $ 7,825 |
| Short-term Capital Gain | - | - |
| Long-term Capital Gain | - | - |
| $ - | $ 7,825 | |
| PARADIGM OPPORTUNITY FUND | ||
| Ordinary Income | $ - | $ - |
| Short-term Capital Gain | - | - |
| Long-term Capital Gain | - | - |
| $ - | $ - | |
| PARADIGM INTRINSIC VALUE FUND | ||
| Ordinary Income | $ - | $ 15,052 |
| Short-term Capital Gain | - | - |
| Long-term Capital Gain | - | - |
| $ - | $ 15,052 | |
2010 Semi-Annual Report 30
Notes to the Financial Statements (Unaudited) - continued
9.) CAPITAL LOSS CARRYFORWARD
At December 31, 2009, the Funds’ most recent fiscal year end, Value, Select, Opportunity and Intrinsic Value Funds had available for federal tax purposes unused capital losses of $23,164,929, $476,553, $915,104 and $386,069 respectively, of which $13,889,960, $383,458, $591,674 and $211,289, respectively, expire in 2016 and $9,274,969, $93,095, $323,430 and $174,780, respectively, expire in 2017. Capital loss carryforwards are available to offset future realized capital gains. To the extent that these carryforwards are used to offset future realized capital gains, it is probable that the amount which is offset will not be distributed to shareholders.
| DISCLOSURE OF EXPENSES (Unaudited) |
Shareholders of the Paradigm Funds (the “Funds”) incur ongoing costs. The ongoing costs associated with the Paradigm Value Fund include management fees, interest expense and dividend expense on securities sold short. The ongoing costs associated with the Paradigm Opportunity Fund, Paradigm Select Fund and Paradigm Intrinsic Value Fund consist solely of management fees. Although the Funds charge no sales loads or transaction fees, you will be assessed fees for outgoing wire transfers, returned checks and stop payment orders at prevailing rates charged by Mutual Shareholder Services, LLC, the Funds’ transfer agent. IRA accounts will be charged an $8.00 annual maintenance fee. There is a 2.00% redemption fee on non-exempt shares if sold after holding them for 90 days or less. The following example is intended to help you understand your ongoing costs of investing in the Funds and to compare these costs with similar costs of investing in other mutual funds. The example is based on an investment of $1,000 invested in the Funds on January 1, 2010 and held through June 30, 2010.
The first line of the tables below provides information about actual account values and actual expenses. In order to estimate the expenses a shareholder paid during the period covered by this report, shareholders can divide their account value by $1,000 (for example, an $8,600 account value divided by $1,000 = 8.6) and then multiply the result by the number in the first line under the heading entitled "Expenses Paid During the Period."
The second line of the tables below provides information about hypothetical account values and hypothetical expenses based on the Funds’ actual expense ratios and an assumed rate of return of 5% per year before expenses, which is not the Funds’ actual return. The hypothetical account values and expenses may not be used to estimate the actual ending account balance or expenses paid by a shareholder for the period. Shareholders may use this information to compare the ongoing costs of investing in the Funds and other funds. In order to do so, compare these 5% hypothetical examples with the 5% hypothetical examples that appear in other funds' shareholder reports.
| PARADIGM VALUE FUND | |||
| Expenses Paid | |||
| Beginning | Ending | During the Period* | |
| Account Value | Account Value | January 1, 2010 | |
| January 1, 2010 | June 30, 2010 | to June 30, 2010 | |
| Actual | $1,000.00 | $991.11 | $7.41 |
| Hypothetical | $1,000.00 | $1,017.36 | $7.50 |
| (5% annual return | |||
| before expenses) | |||
* Expenses are equal to the Fund’s annualized expense ratio of 1.50%, multiplied by the average
account value over the period, multiplied by 181/365 (to reflect the one-half year period).
2010 Semi-Annual Report 31
| Disclosure of Expenses (Unaudited) - continued | |||
| PARADIGM SELECT FUND | |||
| Expenses Paid | |||
| Beginning | Ending | During the Period* | |
| Account Value | Account Value | January 1, 2010 | |
| January 1, 2010 | June 30, 2010 | to June 30, 2010 | |
| Actual | $1,000.00 | $974.81 | $7.34 |
| Hypothetical | $1,000.00 | $1,017.36 | $7.50 |
| (5% annual return | |||
| before expenses) | |||
* Expenses are equal to the Fund’s annualized expense ratio of 1.50%, multiplied by the average
account value over the period, multiplied by 181/365 (to reflect the one-half year period).
| PARADIGM OPPORTUNITY FUND | |||
| Expenses Paid | |||
| Beginning | Ending | During the Period* | |
| Account Value | Account Value | January 1, 2010 | |
| January 1, 2010 | June 30, 2010 | to June 30, 2010 | |
| Actual | $1,000.00 | $981.27 | $7.37 |
| Hypothetical | $1,000.00 | $1,017.36 | $7.50 |
| (5% annual return | |||
| before expenses) | |||
* Expenses are equal to the Fund’s annualized expense ratio of 1.50%, multiplied by the average
account value over the period, multiplied by 181/365 (to reflect the one-half year period).
| PARADIGM INTRINSIC VALUE FUND | |||
| Expenses Paid | |||
| Beginning | Ending | During the Period* | |
| Account Value | Account Value | January 1, 2010 | |
| January 1, 2010 | June 30, 2010 | to June 30, 2010 | |
| Actual | $1,000.00 | $945.53 | $6.03 |
| Hypothetical | $1,000.00 | $1,018.60 | $6.26 |
| (5% annual return | |||
| before expenses) | |||
* Expenses are equal to the Fund’s annualized expense ratio of 1.25%, multiplied by the average
account value over the period, multiplied by 181/365 (to reflect the one-half year period).
2010 Semi-Annual Report 32
| ADDITIONAL INFORMATION June 30, 2010 APPROVAL AND RENEWAL OF INVESTMENT ADVISORY AGREEMENTS (Unaudited) |
On February 24, 2010 the Board of Trustees (the “Trustees”) considered the continuance of the Management Agreements (the “Agreements”) for the Paradigm Value Fund, the Paradigm Select Fund, the Paradigm Opportunity Fund, and the Paradigm Intrinsic Value Fund. In renewing the Agreements, the Board of Trustees received material from the Advisor (the "Report") addressing the following factors: (i) the investment performance of the Funds and the Advisor; (ii) the nature, extent and quality of the services provided by the Advisor to the Funds; (iii) the cost of the services to be provided and the profits to be realized by the Advisor and its affiliates from the relationship with the Funds; (iv) the extent to which economies of scale will be realized as the Funds grow; and (v) whether the fee levels reflect these economies of scale to the benefit of shareholders.
As to the performance of the Funds, the Report included information regarding the performance of each Fund compared to a group of funds of similar size, style and objective where fees and expenses had not been completely waived by the advisers to the funds (the "Peer Group"), as well as to a larger group of funds categorized by Morningstar. All performance data was through the period ended December 31, 2009. The Report also included comparative performance information for major indexes and other accounts managed by the Advisor. The Trustees noted that the Value Fund continued to perform well. The report indicated that the Value Fund's one year, three year annualized, five year annualized and since inception returns were higher than its category average and comparative index. In regard to the Select Fund, the Trustees noted that the Fund also continued to perform well. The report indicated that the Select Fund's three year annualized, and since inception returns were higher t han its category average and comparative index, and its one year return was slightly below its category average and comparative index. In regard to the Paradigm Opportunity Fund, the Trustees noted that the Fund had a strong 2009. The report indicated that the Opportunity Fund's one year, three year annualized, and since inception returns were higher than its category average and comparative index. The Trustees then reviewed the Paradigm Intrinsic Value Fund's performance. It was noted that the Fund outperformed its index and category for the one year and since inception periods. The Trustees concluded that the Value Fund's, Select Fund's, Opportunity Fund’s, and Intrinsic Value Fund's performance was either consistent with or above performance expectations.
As to the nature, extent and quality of the services provided by the Advisor, the Trustees analyzed the Advisor's experience and capabilities. The representatives of the Advisor reviewed and discussed with the Board the Advisor's ADV and the Code of Ethics certifications. They summarized the information provided to the Board regarding matters such as the Advisor's financial condition and investment personnel of the Advisor. They also discussed the portfolio managers' backgrounds and investment management experience. Furthermore, they reviewed the Advisor's financial information and discussed the firm's ability to meet its obligations under the Agreements. The Board concluded that the nature and extent of the services provided by the Advisor were consistent with their expectations, and that the quality of services, particularly those provided by the portfolio managers, was exceptional. The Trustees also concluded that the Advisor has the resources to provide quality advisory services to the Funds.
As to the costs of the services to be provided, the Trustees reviewed the fees under the Agreements compared to the Peer Groups. The Trustees noted that each Fund pays a unitary management fee out of which the Advisor pays Fund expenses. As a result, comparison of the total operating expenses is a relevant exercise. The Value Fund's expense ratio of 1.63% was found to be higher than its Peer Group's average expense ratio of 1.43%, but within the range of its peers. The Report indicated that the Select Fund's audited expense ratio of 1.50% was lower than its Peer Group's average expense ratio of 1.80%, and that the Opportunity Fund's expense ratio of 1.50% was lower than its Peer Group's average expense ratio of 1.67% . The Intrinsic Value Fund's expense ratio of 1.25% was lower than its Peer Group's average expense ratio of 1.55% . The Advisor does not manage any other accounts. However, Paradigm Capital Management an affiliate of the Advisor, provides services to three "hed ge funds" (total assets of $235 million at December 31, 2009) for which it receives an annual fee of 75bp's and a performance fee of 20%; 13 institutional accounts (total assets of $761 million at December 31, 2009) for which it receives fees ranging from 65 - 100 bps; 112 separately managed accounts for high net-worth clients (total assets of $66 million at December 31, 2009) for which it receives fees ranging from 75 - 150 bps and a sub-advisory arrangement with a registered investment company (total assets of $393 million at December 31, 2009) with an average fee of just over 30 bps. It was noted that while the Advisor's management fees were the highest in the peer groups, the Advisor is responsible under the Agreements for paying all but a very small fraction of the Fund's expenses out of the management fees. The Trustees concluded that the management fees were reasonable, and that the shareholders were receiving excellent value for the fees paid. The Trustees also reviewed a profit and loss analysis pre pared by the Advisor that disclosed the direct and indirect expenses paid by the Advisor on behalf of each Fund,
2010 Semi-Annual Report 33
Additional Information - continued
and the total revenue derived by the Advisor from the Funds. The Trustees then reviewed a memo titled Profitability Benchmarks in Contract Renewal from Management Practice, Inc. The Trustees then noted that the Advisor did not utilize the affiliated broker and received no soft dollar benefits. The Trustees concluded that the Advisor was not overly profitable.
As for potential economies of scale, the Trustees discussed and considered information regarding whether economies of scale have been realized with respect to the management of the Funds, whether the Funds have appropriately benefited from any economies of scale, and whether there is potential for realization of any further economies of scale. The Advisor noted that it has contractually agreed to waive management fees and reimburse expenses to the extent necessary to maintain total annual operating expenses of the Value Fund and the Opportunity Fund (excluding brokerage fees and commissions, interest and other borrowing expenses, taxes, extraordinary expenses and the indirect costs of investing in Acquired Funds) at 1.50% of their average daily net assets through May 1, 2011, thereby benefiting shareholders. As for the Select Fund and the Intrinsic Value Fund, the Advisor stated that the current small size of the Funds did not warrant any additional waivers. Next, the indepe ndent Trustees met in executive session to discuss the continuation of the Advisory contracts. The officers of the Trust were excused during this discussion.
Upon reconvening the meeting, it was the consensus of the Trustees, including the independent Trustees that renewal of the Management Agreements would be in the best interests of each Fund and its shareholders.
AVAILABILITY OF QUARTERLY SCHEDULE OF INVESTMENTS (Unaudited)
The Funds file their complete schedules of portfolio holdings with the Securities and Exchange Commission ("SEC") for the first and third quarters of each fiscal year on Form N-Q. The Funds’ Forms N-Q are available on the SEC's Web site at http://www.sec.gov. The Funds’ Forms N-Q may also be reviewed and copied at the SEC's Public Reference Room in Washington, DC. Information on the operation of the Public Reference Room may be obtained by calling 1-800-SEC-0330.
| PROXY VOTING GUIDELINES (Unaudited) |
The Funds’ Advisor is responsible for exercising the voting rights associated with the securities held by the Funds. A description of the policies and procedures used by the Advisor in fulfilling this responsibility is available without charge on the Funds’ web site at www.paradigm-funds.com. It is also included in the Funds’ Statement of Additional Information, which is available on the Securities and Exchange Commission’s web site at http://www.sec.gov.
Information regarding how the Funds voted proxies, Form N-PX, relating to portfolio securities during the most recent 12-month period ended June 30 is available without charge, upon request, by calling our toll free number(1-800-239-0732). This information is also available on the Securities and Exchange Commission’s web site at http://www.sec.gov.
ADDITIONAL INFORMATION
You will find more information about the Funds at www.paradigm-funds.com. For shareholder inquiries, please call toll-free in the U.S. at 1-800-239-0732.
2010 Semi-Annual Report 34
Board of Trustees
|
| This report is provided for the general information of the shareholders of the Paradigm Funds. This report is not intended for distribution to prospective investors in the Funds, unless preceded or accompanied by an effective prospectus. |
Item 2. Code of Ethics. Not applicable.
Item 3. Audit Committee Financial Expert. Not applicable.
Item 4. Principal Accountant Fees and Services. Not applicable.
Item 5. Audit Committee of Listed Companies. Not applicable.
Item 6. Schedule of Investments. Not applicable. Schedule filed with Item 1.
Item 7. Disclosure of Proxy Voting Policies and Procedures for Closed-End Funds. Not applicable.
Item 8. Portfolio Managers of Closed End Funds. Not applicable.
Item 9. Purchases of Equity Securities by Closed-End Management Investment Companies and Affiliated Purchasers. Not applicable.
Item 10. Submission of Matters to a Vote of Security Holders.
The registrant has not adopted procedures by which shareholders may recommend nominees to the registrant’s board of trustees.
Item 11. Controls and Procedures.
(a) The Registrant’s president and chief financial officer concluded that the disclosure controls and procedures (as defined in Rule 30a-3(c) under the Investment Company Act of 1940 (the “Act”)) were effective as of a date within 90 days of the filing date of this report, based on the evaluation of these controls and procedures required by Rule 30a-3(b) under the Act.
(b) There were no changes in the registrant’s internal control over financial reporting (as defined in Rule 30a-3(d) under the Act) that occurred during the registrant’s second fiscal quarter of the period covered by this report that have materially affected, or are reasonably likely to materially affect, the registrant’s internal control over financial reporting.
Item 12. Exhibits.
(a)(1) Code of Ethics. Not applicable.
(a)(2) Certifications pursuant to Section 302 of the Sarbanes-Oxley Act of 2002. Filed herewith.
(b) Certification pursuant to Section 906 of the Sarbanes-Oxley Act of 2002. Filed herewith.
| SIGNATURES |
Pursuant to the requirements of the Securities Exchange Act of 1934 and the Investment Company Act of 1940, the registrant has duly caused this report to be signed on its behalf by the undersigned, thereunto duly authorized.
| Paradigm Funds |
| By: /s/ Candace King Weir Candace King Weir President |
| Date: 9-1-2010 |
Pursuant to the requirements of the Securities Exchange Act of 1934 and the Investment Company Act of 1940, this report has been signed below by the following persons on behalf of the registrant and in the capacities and on the dates indicated.
| By: /s/ Candace King Weir Candace King Weir President |
| Date: 9-1-2010 |
By: /s/ Robert A. Benton |
| Date: 9-1-2010
|