UNITED STATES
SECURITIES AND EXCHANGE COMMISSION
WASHINGTON, D.C. 20549
FORM N-CSR
CERTIFIED SHAREHOLDER REPORT OF REGISTERED MANAGEMENT
INVESTMENT COMPANIES
Investment Company Act file number 811-21233
PARADIGM FUNDS
(Exact name of registrant as specified in charter)
Nine Elk Street, Albany, NY 12207-1002
(Address of principal executive offices) (Zip code)
Robert A. Benton
Nine Elk Street, Albany, NY 12207-1002
(Name and address of agent for service)
Registrant's telephone number, including area code: (518) 431-3500
Date of fiscal year end: December 31
Date of reporting period: June 30, 2012
Form N-CSR is to be used by management investment companies to file reports with the Commission not later than 10 days after the transmission to stockholders of any report that is required to be transmitted to stockholders under Rule 30e-1 under the Investment Company Act of 1940 (17 CFR 270.30e -1). The Commission may use the information provided on Form N-CSR in its regulatory, disclosure review, inspection and policymaking roles.
A registrant is required to disclose the information specified by Form N-CSR, and the Commission will make this information public. A registrant is not required to respond to the collection of information contained in Form N-CSR unless the Form displays a currently valid Office of Management and Budget ("OMB") control number. Please direct comments concerning the accuracy of the information collection burden estimate and any suggestions for reducing the burden to Secretary, Securities and Exchange Commission, 450 Fifth Street, NW, Washington, DC 20549-0609. The OMB has reviewed this collection of information under the clearance requirements of 44 U.S.C. § 3507.
Paradigm Funds
Paradigm Value Fund
Paradigm Select Fund
Paradigm Opportunity Fund
Paradigm Micro-Cap Fund
For Investors Seeking Long-Term Capital Appreciation
SEMI-ANNUAL REPORT
June 30, 2012
| Table of Contents | |
| PARADIGM FUNDS | |
| Letter to Shareholders | 2 |
| Sector Allocation | 6 |
| Performance Information | 8 |
| Schedules of Investments | 10 |
| Statements of Assets and Liabilities | 20 |
| Statements of Operations | 20 |
| Statements of Changes in Net Assets | 22 |
| Financial Highlights | 24 |
| NOTES TO FINANCIAL STATEMENTS | 26 |
| DISCLOSURE OF EXPENSES | 31 |
| ADDITIONAL INFORMATION | 33 |
2012 Semi-Annual Report 1
Letter to Shareholders
Dear Fellow Shareholder:
The markets in 2012 followed the pattern of the previous two years: a strong first quarter followed by a challenging second quarter. To our regret, the Paradigm Funds were not immune to this pattern. We trailed the benchmark indices in the second quarter primarily because the markets' focus on macro factors resulted in sharp swings in sentiment that often ignored positive long-term individual company fundamentals of the Funds’ holdings. Our philosophy has always been to invest in what we know. We look for undervalued securities with strong financials, proven management teams, and the ability to weather difficult conditions over the long term. Macro concerns about an overall slowdown in the global economy hit our holdings disproportionately hard in the second quarter, with our holdings demonstrating more sensitivity than we anticipated despite their sound financials. Several stock-specific events also negatively impacted performance in the short term but did not change our long-term assessment of intrinsic value. We have taken advantage of these disconnects by selectively adding to high-conviction positions at what we consider to be even more attractive valuations.
In addition to a difficult market environment, the companies in our small-cap universe (although primarily exposed only to the US) still had to navigate against a backdrop of international turmoil, which continued to roil the equity markets. The two key global concerns were the ongoing Eurozone sovereign debt crisis and reports of an economic slowdown in China. In June alone, noteworthy events included a surprise rate cut in China, the Spanish bank bailout, Greek elections, and the Eurozone ESM announcement.
Moreover, in the US the chief new concern in the second quarter was the deceleration of the US economic recovery. The recovery we had seen gaining traction in 2011 and early 2012 began to falter in the second quarter. Decelerating growth continued throughout the quarter, with the weaker trends of April and May persisting into June. Unemployment levels remained at 8.2%, while the most recent ISM data slipped into contractionary territory, below 50. Nonetheless, we still believe that the prospects for a double-dip recession remain unlikely despite this reduced traction.
On a positive note, we finally began to see improvements in US housing demand, with recent strength reported across pending home sales, home prices, new home sales, and permits. Furthermore, the higher oil prices of the first quarter have receded sharply. As we write this letter, oil prices are down 25% since May, and gasoline prices are at a 6-month low of $3.36, which should alleviate another potential headwind for consumer sentiment and spending.
As we look out to the second half of 2012, however, we believe that the prevailing uncertainty across so many fronts will remain an overhang for the equity markets. As a slowing global economy casts a shadow on companies' growth prospects, there is no doubt that this will weigh on corporate guidance for the second half. Moreover, until US elections are behind us this fall and there is some clarity on fiscal and tax policy, we expect the US economy will remain somewhat stagnant. This policy gridlock has the potential to delay or diminish corporate spending decisions, in terms of hiring, capital expenditures, and strategic growth plans. Adding this to the continued "risk-off" sentiment for equities leads us to believe that the markets will remain challenged for the near-term, barring a deus ex machi-na event such as an announcement of additional Fed stimulus in the form of QE3, or language intimating at least the increased probability of it.
The offset to the above investment concerns is quite clear to us. We believe that valuations are excessively low for many of the names in our universe and that a good deal of the negative sentiment is already priced in. For example, a recent J.P. Morgan report highlighted that equities have a 2.3% average dividend yield, versus a 4.0% yield for the equivalent corporate bonds. This is the narrowest spread since 1976, lending further credibility to the discounted valuation of the equity markets at present.
Given the above cross-currents, we clearly feel the need to be defensive in our posture as we strive to drive performance for our clients. Thus, we continue to seek out those companies that can demonstrate solid growth even in challenging times. Moreover, we are focused on companies that have underlying support to their share prices across a variety of metrics, including free cash flow yields, net cash on the balance sheet, and active share
2012 Semi-Annual Report 2
repurchase programs. This approach does not deviate from our historical emphasis on company fundamentals with a catalyst. Rather, we simply see this as a prudent tactic for the near-term, given unpredictable markets and economies.
We remain believers in equity markets as a compelling source of returns. While it is impossible to predict short-term market conditions, we believe that markets ultimately value companies for their financial strength and growth prospects. We remain confident that taking the longer view will reward our investors over time.
Paradigm Value Fund Portfolio Commentary
The Paradigm Value Fund appreciated 3.20% in the six months ended June 30, 2012, compared to an increase of 8.23% for its benchmark, the Russell 2000 Value Index. Over the past three years on an annualized basis, the Fund appreciated 15.04% versus 17.43% for the benchmark. Over the past five years on an annualized basis, the Fund appreciated 1.45% versus a decline of 1.05% for the benchmark. Since inception (January 1, 2003), the Fund has generated an annualized return of 14.32%, compared to 9.03% for the Russell 2000 Value Index.
The Fund's top three performing companies for the first half of 2012 were Lender Processing Services, Foot Locker, and Regal Entertainment. Lender Processing Services, a provider of mortgage and consumer loan processing services, rallied after a foreclosure settlement was reached between the country's five largest banks and 49 states' attorneys. Foot Locker, a leading retailer of athletic footwear and apparel and a top performer in 2011, continued its operational success and capitalized on the positive athletic footwear cycle. The company delivered 65% earnings growth in 2011 and 37% in the first quarter of 2012. Lastly, Regal Entertainment, the largest theater operator in the United States, has benefited from favorable box office trends in 2012. Regal is a steady cash flow generator and has paid out substantial dividends over the last decade.
The Fund's bottom three performing companies for the first half of 2012 were Brightpoint, Schnitzer Steel, and Deckers Outdoor Corporation. Brightpoint, a provider of supply chain solutions to the wireless industry, experienced an unexpected reduction in demand and lost a meaningful logistics customer. Schnitzer Steel is a recycler of scrap metal. The industry has been hit hard by a combination of a slowdown in overseas purchases of recycled metals and increased competition for scrap in the US. Deckers Outdoor Corporation, a producer and marketer of footwear and accessories including the Ugg and Teva brands, experienced reduced demand for its products which management attributed primarily to the mild winter. Margins were also negatively impacted by elevated sheepskin costs.
Paradigm Select Fund Portfolio Commentary
The Paradigm Select Fund appreciated 3.74% in the six months ended June 30, 2012, compared to an increase of 8.31% for its benchmark, the Russell 2500 Index. Over the past three years on an annualized basis, the Fund appreciated 16.59% versus 19.06% for the benchmark. Over the past five years on an annualized basis, the Fund appreciated 1.79% versus 1.18% for the benchmark. Since inception (January 1, 2005), the Fund has generated an annualized return of 6.72%, compared to 5.05% for the Russell 2500 Index.
The Fund's top three performing companies for the first half of 2012 were Sunoco, Lender Processing Services, and Westlake Chemical. Sunoco, a provider of transportation fuels and new purchase in 2012, announced plans to be acquired by Energy Transfer Partners. Lender Processing Services, a provider of mortgage and consumer loan processing services, rallied after the bank foreclosure settlement was reached between the country's five largest banks and 49 states' attorneys. Westlake Chemical, a fully integrated manufacturer of petrochemicals and polymers, rallied as ethane prices, a key feedstock for the company, dropped in line with natural gas prices.
The Fund's bottom three performing companies for the first half of 2012 were Brightpoint, Deckers Outdoor Corporation, and QLogic. Brightpoint, a provider of supply chain solutions to the wireless industry, experienced an unexpected reduction in demand and lost a meaningful logistics customer. Deckers Outdoor Corporation, a producer and marketer of footwear and accessories including the Ugg and Teva brands, experienced reduced demand for its products due to the mild winter. Margins were also negatively impacted by
2012 Semi-Annual Report 3
elevated sheepskin costs. QLogic, a provider of data storage and network solutions, provided a softer-than-expected outlook for the June quarter due to a pause in the server cycle ahead of new server launches. We believe that the stock is a compelling value at 10x 2012 earnings, with cash on the balance sheet that represents 40% of the market capitalization of the company.
Paradigm Opportunity Fund Portfolio Commentary
The Paradigm Opportunity Fund appreciated 3.71% in the six months ended June 30, 2012, compared to an increase of 8.53% for its benchmark, the Russell 2000 Index. Over the past three years on an annualized basis, the Fund appreciated 15.68% versus 17.80% for the benchmark. Over the past five years on an annualized basis, the Fund appreciated 0.38% versus 0.54% for the benchmark. Since inception (January 1, 2005), the Fund has generated an annualized return of 4.53%, compared to 4.12% for the Russell 2000 Index.
The Fund's top three performing companies for the first half of 2012 were Regal Entertainment Group, Venoco, and Foot Locker. Regal Entertainment, the largest theater operator in the United States, has benefited from favorable box office trends in 2012. Regal is a steady cash flow generator and has paid out substantial dividends over the last decade. Venoco, an oil and gas exploration and production company, rallied after Venoco's Board recommended that shareholders accept the Chairman's offer to take the company private at a substantial premium. Foot Locker, a leading retailer of athletic footwear and apparel and a top performer in 2011 as well, continued to execute operationally and capitalize on the positive athletic footwear cycle. The company delivered 65% earnings growth in 2011 and 37% in the first quarter of 2012.
The Fund's bottom three performing companies for the first half of 2012 were QLogic, Magellan Health Services, and Endo Health Solutions. QLogic, a provider of data storage and network solutions, provided a softer-than-expected outlook for the June quarter due to a pause in the server cycle ahead of new server launches based on the Romley platform. We believe that the stock is a compelling value at 10x 2012 earnings, with cash on the balance sheet that represents 40% of the market capitalization of the company. Endo Health Solutions, a provider of branded and generic pharmaceuticals, medical devices and services, reported mixed first-quarter results due to supply disruptions for two key products. These issues were resolved, and we believe that the company's long-term prospects are favorable. Magellan Health, a provider of specialty managed health solutions, also reported mixed first-quarter results due to higher cost trends in its behavioral health segment and new business start-up costs. We also believe these issues are transitory and that prospects remain favorable for the company.
The Paradigm Micro-Cap Fund
The Paradigm Micro-Cap Fund appreciated 3.86% in the six months ended June 30, 2012, compared to an increase of 13.01% for the Russell Microcap Index. Over the past three years on an annualized basis, the Fund appreciated 12.59% versus 16.71% for the benchmark.
The Fund's top three performing companies for the first half of 2012 were Brown Shoe Co., Obagi Medical, and TGC Industries. Brown Shoe Co., a footwear wholesaler and retailer, returned 41% during the first half. The company posted strong quarterly earnings that significantly exceeded Street expectations. The earnings beat was driven by stronger-than-expected sales growth, which management attributed to continuing strength in the athletic shoe cycle and favorable spring weather. Obagi Medical, a specialty pharmaceutical skin-care company, reported strong sales and profits for the first quarter, and increased its share buyback plan. Moreover, the resolution of its Texas regulatory issues and the presence of an activist investor urging that the company pursue strategic alternatives also resulted in a lift for the shares. TGC Industries is a seismic data acquisition company. Driven by seasonal strength in Canada and an improvement in the seismic data market, the company announced strong revenue and earnings growth for the first quarter and initiated a quarterly dividend.
The Fund's bottom three performers for the first half of 2012 were Brightpoint, Dawson Geophysical, and Dynamics Research Corp. Brightpoint, a provider of supply chain solutions to the wireless industry, experienced an unexpected reduction in demand and lost a
2012 Semi-Annual Report 4
meaningful logistics customer. However, the company has subsequently received a takeover offer at a substantial premium. Dawson Geophysical, a seismic data acquisition company, announced strong first-quarter earnings results and margin improvement, but signaled a more cautious second-quarter outlook reflecting less certain customer demand. We believe that the company's clean balance sheet, strong free cash flow, and low valuation on an EV/EBITDA basis present a strong support for the shares. Dynamics Research, a provider of technology management solutions for government programs, lowered its 2012 guidance following an in-line first quarter, as the deferral of government procurement decisions and program cuts dampened its outlook. The stock now trades at historically low multiples, and we continue to monitor the company's progress in the face of ongoing defense budget uncertainty.
Sincerely,

Candace King Weir | Amelia F. Weir |
2012 Semi-Annual Report 5
Paradigm Funds (Unaudited)
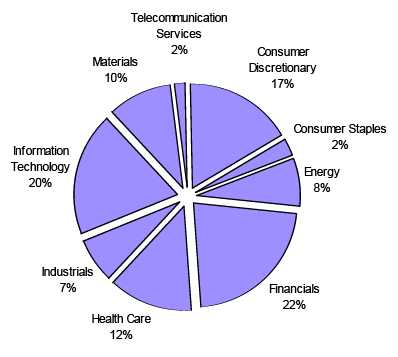
PARADIGM VALUE FUND
Sector Allocation (Unaudited)
(As a Percentage of Equity Securities Held)
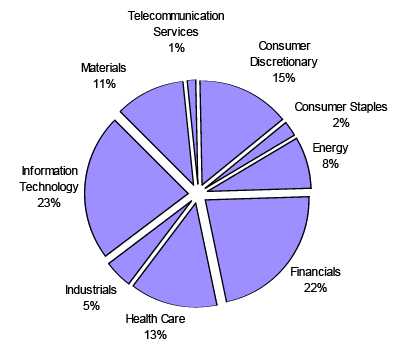
PARADIGM SELECT FUND
Sector Allocation (Unaudited)
(As a Percentage of Equity Securities Held)
2012 Semi-Annual Report 6
Paradigm Funds (Unaudited)
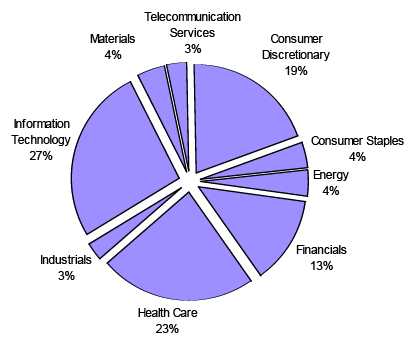
PARADIGM OPPORTUNITY FUND
Sector Allocation (Unaudited)
(As a Percentage of Equity Securities Held)
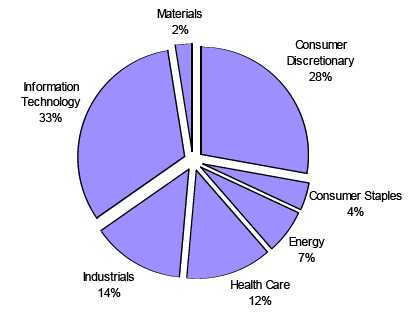
PARADIGM MICRO-CAP FUND
Sector Allocation (Unaudited)
(As a Percentage of Equity Securities Held)
2012 Semi-Annual Report 7
Paradigm Value Fund (Unaudited)
PERFORMANCE INFORMATION
Average Annual Rate of Return (%) for The Periods Ended June 30, 2012.
June 30, 2012 NAV $54.22
| Since | ||||||||
| 1 Year(A) | 3 Years(A) | 5 Years(A) | Inception(A) | |||||
| Paradigm Value Fund | (4.66)% | 15.04% | 1.45% | 14.32% | ||||
| Russell 2000® Value Index(B) | (1.44)% | 17.43% | (1.05)% | 9.03% |
(A) 1 Year, 3 Years, 5 Years and Since Inception returns include change in share prices and in each case includes reinvestment of any dividends and capital gain distributions. The inception date of the Paradigm Value Fund was January 1, 2003.
(B) The Russell 2000® Value Index (whose composition is different from the Fund) is an unmanaged index of small-capitalization stocks with lower price-to-book ratios and lower forecasted growth values than the total population of small-capitalization stocks.
For purposes of the table, it is assumed that all dividends and distributions were reinvested.
PAST PERFORMANCE DOES NOT GUARANTEE FUTURE RESULTS. INVESTMENT RETURN AND PRINCIPAL VALUE WILL FLUCTUATE SO THAT SHARES, WHEN REDEEMED, MAY BE WORTH MORE OR LESS THAN THEIR ORIGINAL COST. RETURNS DO NOT REFLECT THE DEDUCTION OF TAXES THAT A SHAREHOLDER WOULD PAY ON FUND DISTRIBUTIONS OR THE REDEMPTION OF FUND SHARES. CURRENT PERFORMANCE MAY BE LOWER OR HIGHER THAT THE PERFORMANCE DATA QUOTED. TO OBTAIN PERFORMANCE DATA CURRENT TO THE MOST RECENT MONTH END, PLEASE CALL 1-800-239-0732 OR VISIT OUR WEBSITE AT www.paradigm-funds.com.
Paradigm Select Fund (Unaudited)
PERFORMANCE INFORMATION
Average Annual Rate of Return (%) for The Periods Ended June 30, 2012.
June 30, 2012 NAV $31.36
| Since | ||||||||
| 1 Year(A) | 3 Years(A) | 5 Years(A) | Inception(A) | |||||
| Paradigm Select Fund | (0.90)% | 16.59% | 1.79% | 6.72% | ||||
| Russell 2500® Index(B) | (2.29)% | 19.06% | 1.18% | 5.05% |
(A) 1 Year, 3 Years, 5 Years and Since Inception returns include change in share prices and in each case includes reinvestment of any dividends and capital gain distributions. The inception date of the Paradigm Select Fund was January 1, 2005.
(B) The Russell 2500® Index (whose composition is different from the Fund) measures the performance of the small to mid-cap segment of the U.S. equity universe, commonly referred to as "mid" cap. The Russell 2500 Index is a subset of the Russell 3000® Index. It includes approximately 2,500 of the smallest securities based on a combination of their market cap and current index membership.
For purposes of the table, it is assumed that all dividends and distributions were reinvested.
PAST PERFORMANCE DOES NOT GUARANTEE FUTURE RESULTS. INVESTMENT RETURN AND PRINCIPAL VALUE WILL FLUCTUATE SO THAT SHARES, WHEN REDEEMED, MAY BE WORTH MORE OR LESS THAN THEIR ORIGINAL COST. RETURNS DO NOT REFLECT THE DEDUCTION OF TAXES THAT A SHAREHOLDER WOULD PAY ON FUND DISTRIBUTIONS OR THE REDEMPTION OF FUND SHARES. CURRENT PERFORMANCE MAY BE LOWER OR HIGHER THAT THE PERFORMANCE DATA QUOTED. TO OBTAIN PERFORMANCE DATA CURRENT TO THE MOST RECENT MONTH END, PLEASE CALL 1-800-239-0732 OR VISIT OUR WEBSITE AT www.paradigm-funds.com.
2012 Semi-Annual Report 8
Paradigm Opportunity Fund (Unaudited)
PERFORMANCE INFORMATION
Average Annual Rate of Return (%) for The Periods Ended June 30, 2012.
June 30, 2012 NAV $25.97
| Since | ||||||||
| 1 Year(A) | 3 Years(A) | 5 Years(A) | Inception(A) | |||||
| Paradigm Opportunity Fund | (3.69)% | 15.68% | 0.38% | 4.53% | ||||
| Russell 2000® Index(B) | (2.08)% | 17.80% | 0.54% | 4.12% |
(A) 1 Year, 3 Years, 5 Years and Since Inception returns include change in share prices and in each case includes reinvestment of any dividends and capital gain distributions. The inception date of the Paradigm Opportunity Fund was January 1, 2005.
(B) The Russell 2000® Index (whose composition is different from the Fund) consists of the smallest 2,000 companies in the Russell 3000 Index (which represents approximately 98% of the investable U.S. equity market). The Index is an unmanaged index generally considered as the premier of small capitalization stocks.
For purposes of the table, it is assumed that all dividends and distributions were reinvested.
PAST PERFORMANCE DOES NOT GUARANTEE FUTURE RESULTS. INVESTMENT RETURN AND PRINCIPAL VALUE WILL FLUCTUATE SO THAT SHARES, WHEN REDEEMED, MAY BE WORTH MORE OR LESS THAN THEIR ORIGINAL COST. RETURNS DO NOT REFLECT THE DEDUCTION OF TAXES THAT A SHAREHOLDER WOULD PAY ON FUND DISTRIBUTIONS OR THE REDEMPTION OF FUND SHARES. CURRENT PERFORMANCE MAY BE LOWER OR HIGHER THAT THE PERFORMANCE DATA QUOTED. TO OBTAIN PERFORMANCE DATA CURRENT TO THE MOST RECENT MONTH END, PLEASE CALL 1-800-239-0732 OR VISIT OUR WEBSITE AT www.paradigm-funds.com.
Paradigm Micro-Cap Fund (Unaudited)
PERFORMANCE INFORMATION
Average Annual Rate of Return (%) for The Period Ended June 30, 2012.
June 30, 2012 NAV $21.82
| Since | ||||||
| 1 Year(A) | 3 Years(A) | Inception(A) | ||||
| Paradigm Micro-Cap Fund | (2.28)% | 12.59% | 2.20% | |||
| Russell Microcap® Index(B) | (0.54)% | 16.71% | 0.32% | |||
| S&P 500® Index(C) | 5.45% | 16.40% | 0.55% |
(A) 1 Year, 3 Years and Since Inception returns include change in share prices and in each case includes reinvestment of any dividends and capital gain distributions. The inception date of the Paradigm Micro-Cap Fund was January 1, 2008. Effective December 27, 2011, the name of the Paradigm Intrinsic Value Fund was changed to the Paradigm Micro-Cap Fund.
(B) The Russell Microcap® Index measures the performance of the microcap segment of the U.S. equity market. Microcap stocks make up less than 3% of the U.S. equity market (by market cap) and consist of the smallest 1,000 securities in the small-cap Russell 2000® Index, plus the next smallest eligible securities by market cap. The Russell Microcap is completely reconstituted annually to ensure larger stocks do not distort performance and characteristics of the true microcap opportunity set. Effective December 27, 2011 the Fund changed its investment strategy. Under normal circumstances, the Micro-Cap Fund invests at least 80% of its net assets in common stocks of U.S. micro-cap companies. Therefore, the primary comparative index was changed from the S&P 500® Index to the Russell Microcap® Index.
(C)The S&P 500® Index (whose composition is different from the Fund) is an unmanaged index which measures the performance of 500 companies chosen by Standard & Poor’s to represent the large cap U.S. equity market. Effective December 27, 2011 the S&P 500® Index became the secondary comparison index. Previously the Russell 3000® Index was the secondary comparison index.
For purposes of the table, it is assumed that all dividends and distributions were reinvested.
PAST PERFORMANCE DOES NOT GUARANTEE FUTURE RESULTS. INVESTMENT RETURN AND PRINCIPAL VALUE WILL FLUCTUATE SO THAT SHARES, WHEN REDEEMED, MAY BE WORTH MORE OR LESS THAN THEIR ORIGINAL COST. RETURNS DO NOT REFLECT THE DEDUCTION OF TAXES THAT A SHAREHOLDER WOULD PAY ON FUND DISTRIBUTIONS OR THE REDEMPTION OF FUND SHARES. CURRENT PERFORMANCE MAY BE LOWER OR HIGHER THAT THE PERFORMANCE DATA QUOTED. TO OBTAIN PERFORMANCE DATA CURRENT TO THE MOST RECENT MONTH END, PLEASE CALL 1-800-239-0732 OR VISIT OUR WEBSITE AT www.paradigm-funds.com.
2012 Semi-Annual Report 9
| Paradigm Value Fund | |||||
| Schedule of Investments | |||||
| June 30, 2012 (Unaudited) | |||||
| Shares | Fair Value | % of Net Assets | |||
| COMMON STOCKS | |||||
| Agriculture Production - Crops | |||||
| 343,815 | Dole Food Company Inc. * | $ | 3,018,696 | 1.15 | % |
| Agriculture Production - Livestock & Animal Specialties | |||||
| 77,000 | Cal-Maine Foods, Inc. | 3,010,700 | 1.15 | % | |
| Apparel & Other Finished Products of Fabrics & Similar Material | |||||
| 146,200 | True Religion Apparel, Inc. * | 4,236,876 | 1.62 | % | |
| Chemical & Allied Products | |||||
| 62,548 | Innospec Inc. * | 1,852,046 | |||
| 236,000 | Olin Corp. | 4,930,040 | |||
| 6,782,086 | 2.59 | % | |||
| Computer Communications Equipment | |||||
| 375,525 | Emulex Corporation * | 2,703,780 | |||
| 456,000 | QLogic Corp. * | 6,242,640 | |||
| 8,946,420 | 3.41 | % | |||
| Construction - Special Trade Contractors | |||||
| 292,402 | Matrix Service Co. * | 3,312,915 | 1.26 | % | |
| Crude Petroleum & Natural Gas | |||||
| 342,044 | McMoRan Exploration Co. * | 4,333,697 | |||
| 589,775 | PetroQuest Energy Inc. * | 2,948,875 | |||
| 455,300 | Resolute Energy Corporation * | 4,357,221 | |||
| 11,639,793 | 4.44 | % | |||
| Drilling Oil & Gas Wells | |||||
| 99,100 | Atwood Oceanics Inc. * | 3,749,944 | 1.43 | % | |
| Electrical Work | |||||
| 146,100 | EMCOR Group Inc. | 4,064,502 | 1.55 | % | |
| Electronic Components & Accessories | |||||
| 653,100 | Vishay Intertechnology Inc.* | 6,158,733 | 2.35 | % | |
| Fabricated Plater Work (Boiler Shops) | |||||
| 197,938 | Global Power Equipment Group Inc. * | 4,322,966 | 1.65 | % | |
| Fire, Marine & Casualty Insurance | |||||
| 155,500 | Aspen Insurance Holdings Limited (Bermuda) | 4,493,950 | |||
| 198,500 | Montpelier Re Holdings Ltd. (Bermuda) | 4,226,065 | |||
| 8,720,015 | 3.33 | % | |||
| Footwear (No Rubber) | |||||
| 172,700 | Iconix Brand Group, Inc. * | 3,017,069 | 1.15 | % | |
| In Vitro & In Vivo Diagnostic Substances | |||||
| 250,200 | Myriad Genetics, Inc. * | 5,947,254 | 2.27 | % | |
| Industrial Inorganic Chemicals | |||||
| 10,275 | Tronox Inc. * | 1,240,398 | 0.47 | % | |
| Industrial Organic Chemicals | |||||
| 146,477 | Sensient Technologies Corp. | 5,380,100 | 2.05 | % | |
| Laboratory Analytical Instruments | |||||
| 127,875 | PerkinElmer Inc. | 3,299,175 | 1.26 | % | |
| Life Insurance | |||||
| 23,425 | National Western Life Insurance Co. Class A | 3,324,476 | 1.27 | % | |
| Metal Mining | |||||
| 98,100 | Richmont Mines Inc. * | 454,203 | 0.17 | % | |
| Motor Vehicle Parts & Accessories | |||||
| 150,700 | Superior Industries International Inc. | 2,466,959 | 0.94 | % | |
| Oil & Gas Field Services, NEC | |||||
| 71,600 | C&J Energy Services, Inc. * | 1,324,600 | 0.51 | % | |
| Orthopedic, Prosthetic & Surgical Appliances & Supplies | |||||
| 445,826 | Symmetry Medical, Inc. * | 3,825,187 | 1.46 | % | |
| * Non-Income Producing Securities. The accompanying notes are an integral part of these financial statements. |
2012 Semi-Annual Report 10
| Paradigm Value Fund | |||||
| Schedule of Investments | |||||
| June 30, 2012 (Unaudited) | |||||
| Shares | Fair Value | % of Net Assets | |||
| COMMON STOCKS | |||||
| Pharmaceutical Preparations | |||||
| 179,300 | Endo Pharmaceuticals Holdings Inc. * | $ | 5,554,714 | 2.12 | % |
| Plastic Materials, Synth Resin/Rubber, Cellulos (No Glass) | |||||
| 314,800 | Chemtura Corp. * | 4,564,600 | 1.74 | % | |
| Retail - Apparel & Accessory Stores | |||||
| 223,400 | Express Inc. * | 4,059,178 | |||
| 92,475 | The Men's Wearhouse, Inc. | 2,602,247 | |||
| 6,661,425 | 2.54 | % | |||
| Retail - Family Clothing Stores | |||||
| 154,725 | American Eagle Outfitters, Inc. | 3,052,724 | 1.17 | % | |
| Retail - Miscellaneous Retail | |||||
| 175,875 | EZCORP Inc. Class A * | 4,126,027 | 1.57 | % | |
| Retail - Retail Stores, NEC | |||||
| 74,150 | IAC/InterActiveCorp. | 3,381,240 | 1.29 | % | |
| Retail - Shoe Stores | |||||
| 93,500 | Foot Locker, Inc. | 2,859,230 | 1.09 | % | |
| Retail - Variety Stores | |||||
| 86,400 | Big Lots Inc. * | 3,524,256 | 1.35 | % | |
| Rubber & Plastics Footwear | |||||
| 139,025 | Deckers Outdoor Corporation * | 6,118,490 | 2.34 | % | |
| Savings Institution, Federally Chartered | |||||
| 227,400 | Capitol Federal Financial | 2,701,512 | |||
| 285,012 | SI Financial Group, Inc. | 3,277,638 | |||
| 318,000 | United Financial Bancorp | 4,572,840 | |||
| 258,200 | Viewpoint Financial Group | 4,038,248 | |||
| 358,500 | Westfield Financial Inc. | 2,617,050 | |||
| 17,207,288 | 6.57 | % | |||
| Secondary Smelting & Refining of Nonferrous Metals | |||||
| 555,000 | Metalico Inc. * | 1,221,000 | 0.47 | % | |
| Security Brokers, Dealers & Flotation Companies | |||||
| 506,425 | Knight Capital Group Inc. Class A * | 6,046,715 | 2.31 | % | |
| Semiconductors & Related Devices | |||||
| 444,125 | Kulicke & Soffa Industries Inc. * (Singapore) | 3,961,595 | |||
| 165,200 | Microsemi Corporation * | 3,054,548 | |||
| 481,550 | TriQuint Semiconductor, Inc. * | 2,648,525 | |||
| 9,664,668 | 3.69 | % | |||
| Services - Business Services | |||||
| 25,700 | Lender Processing Services, Inc. | 649,696 | |||
| 514,677 | Premiere Global Services Inc. * | 4,318,140 | |||
| 4,967,836 | 1.90 | % | |||
| Services - Computer Integrated Systems Design | |||||
| 552,875 | Convergys Corp. * | 8,165,964 | 3.12 | % | |
| Services - Hospitals | |||||
| 182,750 | Magellan Health Services Inc. * | 8,284,057 | |||
| 68,000 | MEDNAX, Inc. * | 4,660,720 | |||
| 12,944,777 | 4.94 | % | |||
| Services - Motion Picture Theaters | |||||
| 586,055 | Regal Entertainment Group Class A | 8,064,117 | 3.08 | % | |
| Services - Prepackaged Software | |||||
| 515,300 | Actuate Corporation * | 3,571,029 | |||
| 318,025 | Compuware Corp. * | 2,957,633 | |||
| 6,528,662 | 2.49 | % | |||
| Special Industry Machinery | |||||
| 61,962 | Cymer, Inc. * | 3,652,660 | 1.39 | % | |
| * Non-Income Producing Securities. The accompanying notes are an integral part of these financial statements. |
2012 Semi-Annual Report 11
| Paradigm Value Fund | |||||
| Schedule of Investments | |||||
| June 30, 2012 (Unaudited) | |||||
| Shares | Fair Value | % of Net Assets | |||
| COMMON STOCKS | |||||
| Sporting & Athletic Goods, NEC | |||||
| 478,100 | Callaway Golf Co. | $ | 2,825,571 | 1.08 | % |
| Telegraph & Other Message Communications | |||||
| 97,450 | j2 Global, Inc. | 2,574,629 | 0.98 | % | |
| Telephone & Telegraph Apparatus | |||||
| 196,500 | Comverse Technology, Inc. * | 1,141,665 | 0.44 | % | |
| Transportation Services | |||||
| 103,700 | GATX Corp. | 3,992,450 | 1.52 | % | |
| Wholesale - Chemicals & Allied Products | |||||
| 93,831 | Innophos Holdings Inc. | 5,297,698 | 2.02 | % | |
| Wholesale - Machinery, Equipment & Supplies | |||||
| 126,192 | Applied Industrial Technologies | 4,650,175 | 1.77 | % | |
| Wholesale - Miscellaneous Durable Goods | |||||
| 63,857 | Schnitzer Steel Industries, Inc. Class A | 1,789,273 | 0.68 | % | |
| Total for Common Stocks (Cost $211,463,662) | $ | 238,820,921 | 91.14 | % | |
| REAL ESTATE INVESTMENT TRUSTS | |||||
| 933,400 | Anworth Mortgage Asset Corp. | 6,580,470 | |||
| 342,400 | MFA Financial, Inc. | 2,701,536 | |||
| 104,800 | Mid-America Apartment Communities Inc. | 7,151,552 | |||
| Total for Real Estate Investment Trusts (Cost $14,183,601) | 16,433,558 | 6.27 | % | ||
| MONEY MARKET FUNDS | |||||
| 5,342,948 | SEI Daily Income Treasury Government CL B 0.02% ** | 5,342,948 | 2.04 | % | |
| (Cost $5,342,948) | |||||
| Total Investment Securities | 260,597,427 | 99.45 | % | ||
| (Cost $230,990,211) | |||||
| Other Assets In Excess of Liabilities | 1,428,898 | 0.55 | % | ||
| Net Assets | $ | 262,026,325 | 100.00 | % | |
| * Non-Income Producing Securities. ** Variable Rate Security; the rate shown was the rate at June 30, 2012. The accompanying notes are an integral part of these financial statements. |
2012 Semi-Annual Report 12
| Paradigm Select Fund | |||||
| Schedule of Investments | |||||
| June 30, 2012 (Unaudited) | |||||
| Shares | Fair Value | % of Net Assets | |||
| COMMON STOCKS | |||||
| Agriculture Production - Crops | |||||
| 12,452 | Dole Food Company Inc. * | $ | 109,328 | 0.98 | % |
| Agriculture Production - Livestock & Animal Specialties | |||||
| 2,800 | Cal-Maine Foods, Inc. | 109,480 | 0.99 | % | |
| Biological Products, (No Diagnostic Substances) | |||||
| 4,900 | Life Technologies Corporation * | 220,451 | 1.99 | % | |
| Chemical & Allied Products | |||||
| 2,000 | Innospec Inc. * | 59,220 | |||
| 7,800 | Olin Corp. | 162,942 | |||
| 222,162 | 2.00 | % | |||
| Computer & Office Equipment | |||||
| 5,700 | Lexmark International, Inc. | 151,506 | 1.36 | % | |
| Computer Communications Equipment | |||||
| 15,000 | Emulex Corporation * | 108,000 | |||
| 19,900 | QLogic Corp. * | 272,431 | |||
| 380,431 | 3.43 | % | |||
| Construction - Special Trade Contractors | |||||
| 10,700 | Matrix Service Co. * | 121,231 | 1.09 | % | |
| Crude Petroleum & Natural Gas | |||||
| 6,100 | Denbury Resources Inc. * | 92,171 | |||
| 22,200 | PetroQuest Energy Inc. * | 111,000 | |||
| 1,500 | Plains Exploration & Production Company * | 52,770 | |||
| 4,700 | Resolute Energy Corporation * | 44,979 | |||
| 2,700 | Whiting Petroleum Corp. * | 111,024 | |||
| 411,944 | 3.71 | % | |||
| Electrical Work | |||||
| 5,700 | EMCOR Group Inc. | 158,574 | 1.43 | % | |
| Electronic Components & Accessories | |||||
| 22,760 | Vishay Intertechnology Inc. * | 214,627 | 1.93 | % | |
| Fire, Marine & Casualty Insurance | |||||
| 509 | Alleghany Inc. * | 172,933 | |||
| 4,200 | American Financial Group Inc. | 164,766 | |||
| 6,000 | Aspen Insurance Holdings Limited (Bermuda) | 173,400 | |||
| 100 | Markel Corp. * | 44,170 | |||
| 9,300 | Montpelier Re Holdings Ltd. (Bermuda) | 197,997 | |||
| 753,266 | 6.79 | % | |||
| Footwear (No Rubber) | |||||
| 7,900 | Iconix Brand Group, Inc. * | 138,013 | 1.24 | % | |
| In Vitro & In Vivo Diagnostic Substances | |||||
| 11,200 | Myriad Genetics, Inc. * | 266,224 | 2.40 | % | |
| Industrial Inorganic Chemicals | |||||
| 450 | Tronox Inc. * | 54,324 | 0.49 | % | |
| Industrial Organic Chemicals | |||||
| 5,850 | Sensient Technologies Corporation | 214,871 | |||
| 3,600 | Westlake Chemical Corp. | 188,136 | |||
| 403,007 | 3.63 | % | |||
| Iron & Steel Foundries | |||||
| 800 | Precision Castparts Corp. | 131,592 | 1.19 | % | |
| Laboratory Analytical Instruments | |||||
| 5,100 | PerkinElmer Inc. | 131,580 | 1.19 | % | |
| Men's & Boy's Furnishings, Work Clothing & Allied Garments | |||||
| 2,680 | PVH Corp. | 208,477 | 1.88 | % | |
| * Non-Income Producing Securities. The accompanying notes are an integral part of these financial statements. |
2012 Semi-Annual Report 13
| Paradigm Select Fund | |||||
| Schedule of Investments | |||||
| June 30, 2012 (Unaudited) | |||||
| Shares | Fair Value | % of Net Assets | |||
| COMMON STOCKS | |||||
| Mineral Royalty Traders | |||||
| 1,500 | Royal Gold, Inc. | $ | 117,600 | 1.06 | % |
| National Commercial Banks | |||||
| 17,800 | First Niagara Financial Group, Inc. | 136,170 | 1.23 | % | |
| Petroleum Refining | |||||
| 6,000 | Sunoco, Inc. | 285,000 | 2.57 | % | |
| Pharmaceutical Preparations | |||||
| 7,175 | Endo Pharmaceuticals Holdings Inc. * | 222,282 | 2.00 | % | |
| Plastic Materials, Synth Resin/Rubber, Cellulos (No Glass) | |||||
| 11,400 | Chemtura Corp. * | 165,300 | 1.49 | % | |
| Plastics Products | |||||
| 3,200 | AptarGroup Inc. | 163,360 | 1.47 | % | |
| Retail - Apparel & Accessory Stores | |||||
| 9,000 | Express Inc. * | 163,530 | |||
| 3,700 | The Men's Wearhouse, Inc. | 104,118 | |||
| 267,648 | 2.41 | % | |||
| Retail - Family Clothing Stores | |||||
| 6,300 | American Eagle Outfitters, Inc. | 124,299 | 1.12 | % | |
| Retail - Miscellaneous Retail | |||||
| 7,100 | EZCORP Inc. Class A * | 166,566 | 1.50 | % | |
| Retail - Retail Stores, NEC | |||||
| 2,900 | IAC/InterActiveCorp. | 132,240 | 1.19 | % | |
| Retail - Shoe Stores | |||||
| 3,700 | Foot Locker, Inc. | 113,146 | 1.02 | % | |
| Retail - Variety Stores | |||||
| 2,700 | Big Lots Inc. * | 110,133 | 0.99 | % | |
| Rubber & Plastics Footwear | |||||
| 6,125 | Deckers Outdoor Corporation * | 269,561 | 2.43 | % | |
| Savings Institution, Federally Chartered | |||||
| 14,000 | Capitol Federal Financial | 166,320 | 1.50 | % | |
| Security Brokers, Dealers & Flotation Companies | |||||
| 24,600 | Knight Capital Group Inc. Class A * | 293,724 | 2.65 | % | |
| Semiconductors & Related Devices | |||||
| 17,700 | Kulicke & Soffa Industries Inc. * (Singapore) | 157,884 | |||
| 9,600 | Marvell Technology Group Ltd. * (Bermuda) | 108,288 | |||
| 6,700 | Microsemi Corporation * | 123,883 | |||
| 19,300 | TriQuint Semiconductor, Inc. * | 106,150 | |||
| 496,205 | 4.47 | % | |||
| Services - Business Services | |||||
| 1,089 | Lender Processing Services, Inc. | 27,530 | |||
| 16,170 | Premiere Global Services Inc. * | 135,666 | |||
| 163,196 | 1.47 | % | |||
| Services - Computer Integrated Systems Design | |||||
| 22,200 | Convergys Corp. * | 327,894 | 2.95 | % | |
| Services - Hospitals | |||||
| 7,500 | Magellan Health Services Inc. * | 339,975 | |||
| 2,800 | MEDNAX, Inc. * | 191,912 | |||
| 531,887 | 4.79 | % | |||
| Services - Management Consulting Services | |||||
| 2,200 | FTI Consulting, Inc. * | 63,250 | 0.57 | % | |
| Services - Motion Picture Theaters | |||||
| 21,600 | Regal Entertainment Group Class A | 297,216 | 2.68 | % | |
| * Non-Income Producing Securities. The accompanying notes are an integral part of these financial statements. |
2012 Semi-Annual Report 14
| Paradigm Select Fund | |||||
| Schedule of Investments | |||||
| June 30, 2012 (Unaudited) | |||||
| Shares | Fair Value | % of Net Assets | |||
| COMMON STOCKS | |||||
| Services - Prepackaged Software | |||||
| 13,000 | Compuware Corp. * | $ | 120,900 | 1.09 | % |
| Special Industry Machinery | |||||
| 2,700 | Cymer, Inc. * | 159,165 | 1.43 | % | |
| Telegraph & Other Message Communications | |||||
| 3,900 | j2 Global, Inc. | 103,038 | 0.93 | % | |
| Telephone & Telegraph Apparatus | |||||
| 9,000 | Comverse Technology, Inc. * | 52,290 | 0.47 | % | |
| Wholesale - Electronic Parts & Equipment, NEC | |||||
| 7,800 | Avnet, Inc. * | 240,708 | 2.17 | % | |
| Wholesale - Machinery, Equipment & Supplies | |||||
| 4,600 | Applied Industrial Technologies | 169,510 | 1.53 | % | |
| Wholesale - Miscellaneous Durable Goods | |||||
| 2,300 | Schnitzer Steel Industries, Inc. Class A | 64,446 | 0.57 | % | |
| Total for Common Stocks (Cost $8,994,264) | $ | 9,709,271 | 87.47 | % | |
| REAL ESTATE INVESTMENT TRUSTS | |||||
| 40,300 | Anworth Mortgage Asset Corp. | 284,115 | |||
| 32,300 | MFA Financial, Inc. | 254,847 | |||
| 4,200 | Mid-America Apartment Communities Inc. | 286,608 | |||
| Total for Real Estate Investment Trusts (Cost $767,062) | 825,570 | 7.44 | % | ||
| MONEY MARKET FUNDS | |||||
| 524,367 | SEI Daily Income Treasury Government CL B 0.02% ** | 524,367 | 4.72 | % | |
| (Cost $524,367) | |||||
| Total Investment Securities | 11,059,208 | 99.63 | % | ||
| (Cost $10,285,693) | |||||
| Other Assets In Excess of Liabilities | 40,872 | 0.37 | % | ||
| Net Assets | $ | 11,100,080 | 100.00 | % | |
| * Non-Income Producing Securities. ** Variable Rate Security; the rate shown was the rate at June 30, 2012. The accompanying notes are an integral part of these financial statements. |
2012 Semi-Annual Report 15
| Paradigm Opportunity Fund | |||||
| Schedule of Investments | |||||
| June 30, 2012 (Unaudited) | |||||
| Shares | Fair Value | % of Net Assets | |||
| COMMON STOCKS | |||||
| Agriculture Production - Crops | |||||
| 10,357 | Dole Food Company Inc. * | $ | 90,934 | 1.87 | % |
| Agriculture Production - Livestock & Animal Specialties | |||||
| 2,400 | Cal-Maine Foods, Inc. | �� | 93,840 | 1.93 | % |
| Biological Products, (No Diagnostic Substances) | |||||
| 3,500 | Life Technologies Corporation * | 157,465 | 3.24 | % | |
| Computer Communications Equipment | |||||
| 13,500 | Emulex Corporation * | 97,200 | |||
| 15,800 | QLogic Corp. * | 216,302 | |||
| 313,502 | 6.45 | % | |||
| Construction - Special Trade Contractors | |||||
| 9,300 | Matrix Service Co. * | 105,369 | 2.17 | % | |
| Crude Petroleum & Natural Gas | |||||
| 18,700 | PetroQuest Energy Inc. * | 93,500 | 1.92 | % | |
| Electrical Work | |||||
| 5,000 | EMCOR Group Inc. | 139,100 | 2.86 | % | |
| Industrial Organic Chemicals | |||||
| 5,250 | Sensient Technologies Corporation | 192,833 | 3.97 | % | |
| Laboratory Analytical Instruments | |||||
| 4,600 | PerkinElmer Inc. | 118,680 | 2.44 | % | |
| Orthopedic, Prosthetic & Surgical Appliances & Supplies | |||||
| 14,400 | Symmetry Medical, Inc. * | 123,552 | 2.54 | % | |
| Pharmaceutical Preparations | |||||
| 6,400 | Endo Pharmaceuticals Holdings Inc. * | 198,272 | 4.08 | % | |
| Retail - Apparel & Accessory Stores | |||||
| 8,000 | Express Inc. * | 145,360 | |||
| 3,300 | The Men's Wearhouse, Inc. | 92,862 | |||
| 238,222 | 4.90 | % | |||
| Retail - Family Clothing Stores | |||||
| 5,500 | American Eagle Outfitters, Inc. | 108,515 | 2.23 | % | |
| Retail - Miscellaneous Retail | |||||
| 6,300 | EZCORP Inc. Class A * | 147,798 | 3.04 | % | |
| Retail - Retail Stores, NEC | |||||
| 2,600 | IAC/InterActiveCorp. | 118,560 | 2.44 | % | |
| Retail - Shoe Stores | |||||
| 3,300 | Foot Locker, Inc. | 100,914 | 2.08 | % | |
| Retail - Variety Stores | |||||
| 2,400 | Big Lots Inc. * | 97,896 | 2.01 | % | |
| Security Brokers, Dealers & Flotation Companies | |||||
| 17,200 | Knight Capital Group Inc. Class A * | 205,368 | 4.22 | % | |
| Semiconductors & Related Devices | |||||
| 15,800 | Kulicke & Soffa Industries Inc. * (Singapore) | 140,936 | |||
| 5,900 | Microsemi Corporation * | 109,091 | |||
| 16,500 | TriQuint Semiconductor, Inc. * | 90,750 | |||
| 340,777 | 7.01 | % | |||
| Services - Business Services | |||||
| 16,700 | Premiere Global Services Inc. * | 140,113 | 2.88 | % | |
| Services - Computer Integrated Systems Design | |||||
| 19,800 | Convergys Corp. * | 292,446 | 6.02 | % | |
| * Non-Income Producing Securities. The accompanying notes are an integral part of these financial statements. |
2012 Semi-Annual Report 16
| Paradigm Opportunity Fund | |||||
| Schedule of Investments | |||||
| June 30, 2012 (Unaudited) | |||||
| Shares | Fair Value | % of Net Assets | |||
| COMMON STOCKS | |||||
| Services - Hospitals | |||||
| 6,500 | Magellan Health Services Inc. * | $ | 294,645 | ||
| 2,700 | MEDNAX, Inc. * | 185,058 | |||
| 479,703 | 9.87 | % | |||
| Services - Motion Picture Theaters | |||||
| 19,700 | Regal Entertainment Group Class A | 271,072 | 5.58 | % | |
| Service - Prepackaged Software | |||||
| 11,400 | Compuware Corp. * | 106,020 | 2.18 | % | |
| Sporting & Athletic Goods, NEC | |||||
| 17,100 | Callaway Golf Co. | 101,061 | 2.08 | % | |
| Telegraph & Other Message Communications | |||||
| 3,400 | j2 Global, Inc. | 89,828 | 1.84 | % | |
| Total for Common Stocks (Cost $3,807,470) | $ | 4,465,340 | 91.85 | % | |
| REAL ESTATE INVESTMENT TRUSTS | |||||
| 3,600 | Mid-America Apartment Communities Inc. | 245,664 | |||
| Total for Real Estate Investment Trusts (Cost $164,861) | 245,664 | 5.05 | % | ||
| MONEY MARKET FUNDS | |||||
| 144,478 | SEI Daily Income Treasury Government CL B 0.02% ** | 144,478 | 2.98 | % | |
| (Cost $144,478) | |||||
| Total Investment Securities | 4,855,482 | 99.88 | % | ||
| (Cost $4,116,809) | |||||
| Other Assets In Excess of Liabilities | 6,026 | 0.12 | % | ||
| Net Assets | $ | 4,861,508 | 100.00 | % | |
| * Non-Income Producing Securities. ** Variable Rate Security; the rate shown was the rate at June 30, 2012. The accompanying notes are an integral part of these financial statements. |
2012 Semi-Annual Report 17
| Paradigm Micro-Cap Fund | |||||
| Schedule of Investments | |||||
| June 30, 2012 (Unaudited) | |||||
| Shares | Fair Value | % of Net Assets | |||
| COMMON STOCKS | |||||
| Commercial Printing | |||||
| 10,000 | Consolidated Graphics, Inc. | $ | 290,500 | ||
| 40,000 | Quad/Graphics, Inc. | 575,200 | |||
| 865,700 | 5.34 | % | |||
| Commodity Contracts Brokers & Dealers | |||||
| 20,900 | MFC Industrial Ltd. (Canada) | 140,866 | 0.87 | % | |
| Communications Services, NEC | |||||
| 70,000 | Kratos Defense & Security Solutions, Inc. * | 408,800 | 2.52 | % | |
| Computer Peripheral Equipment, NEC | |||||
| 90,000 | RadiSys Corporation * | 565,200 | 3.48 | % | |
| Electromedical & Electrotherapeutic Apparatus | |||||
| 30,000 | Solta Medical, Inc. * | 87,900 | |||
| 40,000 | Syneron Medical Ltd. * (Israel) | 415,200 | |||
| 503,100 | 3.10 | % | |||
| Footwear, (No Rubber) | |||||
| 20,000 | Brown Shoe Co. Inc. | 258,200 | 1.59 | % | |
| Industrial Instruments for Measurement, Display and Control | |||||
| 60,000 | Rudolph Technologies Inc. * | 523,200 | 3.22 | % | |
| Instruments for Measuring & Testing of Electricity & Electric Signals | |||||
| 30,000 | Cohu, Inc. | 304,800 | 1.88 | % | |
| Millwood, Veneer, Plywood, & Structural Wood Members | |||||
| 10,100 | American Woodmark Corporation | 172,710 | 1.06 | % | |
| Miscellaneous Electrical Machinery, Equipment & Supplies | |||||
| 152,000 | Exide Technologies * | 510,720 | 3.15 | % | |
| Miscellaneous Furniture & Fixtures | |||||
| 20,000 | Knoll, Inc. | 268,400 | 1.65 | % | |
| Oil & Gas Field Exploration Services | |||||
| 20,000 | Dawson Geophysical Company * | 476,400 | |||
| 57,750 | TGC Industries Inc. * | 560,752 | |||
| 1,037,152 | 6.39 | % | |||
| Orthopedic, Prosthetic & Surgical Appliances & Supplies | |||||
| 17,467 | Exactech Inc. * | 292,922 | |||
| 100,000 | RTI Biologics, Inc. * | 376,000 | |||
| 668,922 | 4.12 | % | |||
| Paper Mills | |||||
| 20,000 | KapStone Paper and Packaging Corporation * | 317,000 | 1.95 | % | |
| Pharmaceutical Preparations | |||||
| 40,000 | Nature's Sunshine Products * | 604,000 | |||
| 30,000 | Obagi Medical Products, Inc. * | 458,100 | |||
| 1,062,100 | 6.55 | % | |||
| Printed Circuit Boards | |||||
| 60,000 | TTM Technologies, Inc. * | 562,800 | 3.47 | % | |
| Radio & Tv Broadcasting & Communications Equipment | |||||
| 100,000 | Harmonic Inc. | 426,000 | 2.63 | % | |
| Retail - Auto Dealers & Gasoline Stations | |||||
| 40,000 | West Marine Inc. * | 470,000 | 2.90 | % | |
| Retail - Catalog & Mail-Order Houses | |||||
| 17,000 | Insight Enterprises Inc. * | 286,110 | |||
| 4,750 | PC Connection, Inc. * | 50,445 | |||
| 336,555 | 2.07 | % | |||
| Retail - Family Clothing Stores | |||||
| 39,937 | Stein Mart Inc. * | 317,499 | 1.96 | % | |
| * Non-Income Producing Securities. The accompanying notes are an integral part of these financial statements. |
2012 Semi-Annual Report 18
| Paradigm Micro-Cap Fund | |||||
| Schedule of Investments | |||||
| June 30, 2012 (Unaudited) | |||||
| Shares | Fair Value | % of Net Assets | |||
| COMMON STOCKS | |||||
| Retail - Furniture Stores | |||||
| 44,000 | Haverty Furniture Companies Inc. | $ | 491,480 | 3.03 | % |
| Retail - Hobby, Toy & Game Shops | |||||
| 60,000 | Build-A-Bear Workshop, Inc. * | 286,800 | 1.77 | % | |
| Retail - Retail Stores, NEC | |||||
| 25,000 | Kirkland's Inc. * | 281,250 | 1.73 | % | |
| Retail - Shoe Stores | |||||
| 25,000 | Finish Line Inc. | 522,750 | 3.22 | % | |
| Retail - Women's Clothing Stores | |||||
| 300,000 | Coldwater Creek Inc. * | 165,000 | |||
| 70,000 | Wet Seal Inc. Class A * | 220,500 | |||
| 385,500 | 2.38 | % | |||
| Semiconductors & Related Devices | |||||
| 20,000 | Finisar Corporation | 299,200 | |||
| 80,000 | Photronics, Inc. * | 488,000 | |||
| 787,200 | 4.85 | % | |||
| Services - Computer Integrated Systems Design | |||||
| 30,000 | Dynamics Research Corp. * | 174,300 | 1.07 | % | |
| Services - Personal Services | |||||
| 10,000 | Steiner Leisure Limited * (Bahamas) | 464,100 | 2.86 | % | |
| Special Industry Machinery (No Metalworking Machinery) | |||||
| 15,000 | Kadant Inc. * | 351,750 | 2.17 | % | |
| Surgical & Medical Instruments | |||||
| 100,000 | Alphatec Holdings, Inc. * | 184,000 | 1.13 | % | |
| Telephone & Telegraph Apparatus | |||||
| 30,000 | Oplink Communications, Inc. * | 405,900 | 2.50 | % | |
| Wholesale - Electronic Parts & Equipment, NEC | |||||
| 80,000 | Brightpoint, Inc. * | 432,800 | |||
| 35,000 | Richardson Electronics Ltd. | 431,550 | |||
| 864,350 | 5.33 | % | |||
| Women's, Misses', and Juniors Outerwear | |||||
| 40,000 | bebe stores, inc. | 234,800 | 1.45 | % | |
| Total for Common Stocks (Cost $15,462,250) | $ | 15,153,904 | 93.39 | % | |
| MONEY MARKET FUNDS | |||||
| 572,486 | SEI Daily Income Treasury Government CL B 0.02% ** | 572,486 | 3.53 | % | |
| (Cost $572,486) | |||||
| Total Investment Securities | 15,726,390 | 96.92 | % | ||
| (Cost $16,034,736) | |||||
| Other Assets In Excess of Liabilities | 499,898 | 3.08 | % | ||
| Net Assets | $ | 16,226,288 | 100.00 | % | |
| * Non-Income Producing Securities. ** Variable Rate Security; the rate shown was the rate at June 30, 2012. The accompanying notes are an integral part of these financial statements. |
2012 Semi-Annual Report 19
| Paradigm Funds | ||||||
| Statements of Assets and Liabilities (Unaudited) | Value | Select | ||||
| June 30, 2012 | Fund | Fund | ||||
| Assets: | ||||||
| Investment Securities at Fair Value* | $ | 260,597,427 | $ | 11,059,208 | ||
| Receivable for Fund Shares Sold | 133,051 | 33,458 | ||||
| Receivable for Securities Sold | 1,991,528 | 18,626 | ||||
| Dividends Receivable | 120,728 | 3,380 | ||||
| Interest Receivable | 239 | 12 | ||||
| Total Assets | 262,842,973 | 11,114,684 | ||||
| Liabilities: | ||||||
| Payable for Fund Shares Redeemed | 386,408 | - | ||||
| Payable for Securities Purchased | 113,675 | 4,372 | ||||
| Payable to Advisor | 316,565 | 10,232 | ||||
| Total Liabilities | 816,648 | 14,604 | ||||
| Net Assets | $ | 262,026,325 | $ | 11,100,080 | ||
| Net Assets Consist of: | ||||||
| Paid In Capital | $ | 233,771,732 | $ | 10,267,206 | ||
| Accumulated Undistributed Net Investment Income (Loss) | (182,142 | ) | 3,254 | |||
| Accumulated Realized Gain (Loss) on Investments - Net | (1,170,481 | ) | 56,105 | |||
| Unrealized Appreciation (Depreciation) in Value of Investment Securities - Net | 29,607,216 | 773,515 | ||||
| Net Assets | $ | 262,026,325 | $ | 11,100,080 | ||
| Net Asset Value and Offering Price (Note 2) | $ | 54.22 | $ | 31.36 | ||
| * Investments at Identified Cost | $ | 230,990,211 | $ | 10,285,693 | ||
| Shares Outstanding (Unlimited number of shares | 4,832,997 | 353,905 | ||||
| authorized without par value) | ||||||
| Statements of Operations (Unaudited) | ||||||
| For the six month period ended June 30, 2012 | ||||||
| Investment Income: | ||||||
| Dividends | $ | 1,807,609 | $ | 60,545 | ||
| Interest | 1,433 | 58 | ||||
| Total Investment Income | 1,809,042 | 60,603 | ||||
| Expenses: | ||||||
| Investment Advisor Fees | 2,447,705 | 74,805 | ||||
| Total Expenses | 2,447,705 | 74,805 | ||||
| Less: Expenses Waived | (456,521 | ) | (17,456 | ) | ||
| Net Expenses | 1,991,184 | 57,349 | ||||
| Net Investment Income (Loss) | (182,142 | ) | 3,254 | |||
| Realized and Unrealized Gain (Loss) on Investments: | ||||||
| Net Realized Gain (Loss) on Investments | 2,117,141 | 98,777 | ||||
| Net Change in Unrealized Appreciation (Depreciation) on Investments | 5,525,041 | 84,513 | ||||
| Net Realized and Unrealized Gain (Loss) on Investments | 7,642,182 | 183,290 | ||||
| Net Increase (Decrease) in Net Assets from Operations | $ | 7,460,040 | $ | 186,544 | ||
| The accompanying notes are an integral part of these financial statements. |
2012 Semi-Annual Report 20
| Paradigm Funds | ||||||
| Statements of Assets and Liabilities (Unaudited) | Opportunity | Micro-Cap | ||||
| June 30, 2012 | Fund | Fund | ||||
| Assets: | ||||||
| Investment Securities at Fair Value* | $ | 4,855,482 | $ | 15,726,390 | ||
| Cash | 253 | - | ||||
| Receivable for Fund Shares Sold | 98 | - | ||||
| Receivable for Securities Sold | 12,409 | 510,442 | ||||
| Dividends Receivable | 1,595 | 5,364 | ||||
| Interest Receivable | 5 | 13 | ||||
| Total Assets | 4,869,842 | 16,242,209 | ||||
| Liabilities: | ||||||
| Payable for Securities Purchased | 3,498 | - | ||||
| Payable to Advisor | 4,836 | 15,921 | ||||
| Total Liabilities | 8,334 | 15,921 | ||||
| Net Assets | $ | 4,861,508 | $ | 16,226,288 | ||
| Net Assets Consist of: | ||||||
| Paid In Capital | $ | 4,121,330 | $ | 16,001,405 | ||
| Accumulated Undistributed Net Investment Income (Loss) | (10,512 | ) | (40,516 | ) | ||
| Accumulated Realized Gain (Loss) on Investments - Net | 12,017 | 573,745 | ||||
| Unrealized Appreciation (Depreciation) in Value of Investment Securities - Net | 738,673 | (308,346 | ) | |||
| Net Assets | $ | 4,861,508 | $ | 16,226,288 | ||
| Net Asset Value and Offering Price (Note 2) | $ | 25.97 | $ | 21.82 | ||
| * Investments at Identified Cost | $ | 4,116,809 | $ | 16,034,736 | ||
| Shares Outstanding (Unlimited number of shares | 187,194 | 743,730 | ||||
| authorized without par value) | ||||||
| Statements of Operations (Unaudited) | ||||||
| For the six month period ended June 30, 2012 | ||||||
| Investment Income: | ||||||
| Dividends (Net of foreign withholding taxes** of $0 and $788, respectively) | $ | 23,722 | $ | 37,733 | ||
| Interest | 15 | 95 | ||||
| Total Investment Income | 23,737 | 37,828 | ||||
| Expenses: | ||||||
| Investment Advisor Fees | 48,295 | 78,344 | ||||
| Total Expenses | 48,295 | 78,344 | ||||
| Less: Expenses Waived | (14,046 | ) | - | |||
| Net Expenses | 34,249 | 78,344 | ||||
| Net Investment Income (Loss) | (10,512 | ) | (40,516 | ) | ||
| Realized and Unrealized Gain (Loss) on Investments: | ||||||
| Net Realized Gain (Loss) on Investments | 69,868 | 689,839 | ||||
| Net Change in Unrealized Appreciation (Depreciation) on Investments | 111,325 | (858,279 | ) | |||
| Net Realized and Unrealized Gain (Loss) on Investments | 181,193 | (168,440 | ) | |||
| Net Increase (Decrease) in Net Assets from Operations | $ | 170,681 | $ | (208,956 | ) | |
| ** Foreign withholding taxes on foreign dividends have been provid- ed for in accordance with the Funds’ understanding of the applica- ble country's tax rules and rates. The accompanying notes are an integral part of these financial statements. |
2012 Semi-Annual Report 21
| Paradigm Funds | ||||||||||||
| Statements of Changes in Net Assets | Value Fund | Select Fund | ||||||||||
| (Unaudited) | (Unaudited) | |||||||||||
| 1/1/2012 | 1/1/2011 | 1/1/2012 | 1/1/2011 | |||||||||
| to | to | to | to | |||||||||
| 6/30/2012 | 12/31/2011 | 6/30/2012 | 12/31/2011 | |||||||||
| From Operations: | ||||||||||||
| Net Investment Income (Loss) | $ | (182,142 | ) | $ | (787,755 | ) | $ | 3,254 | $ | 13,610 | ||
| Net Realized Gain (Loss) on Investments | 2,117,141 | 6,680,547 | 98,777 | 198,161 | ||||||||
| Change in Net Unrealized Appreciation (Depreciation) | 5,525,041 | (21,135,754 | ) | 84,513 | (209,355 | ) | ||||||
| Increase (Decrease) in Net Assets from Operations | 7,460,040 | (15,242,962 | ) | 186,544 | 2,416 | |||||||
| From Distributions to Shareholders: | ||||||||||||
| Net Investment Income | - | - | - | (14,165 | ) | |||||||
| Net Realized Gain from Security Transactions | - | (3,448,769 | ) | - | - | |||||||
| Total Distributions to Shareholders | - | (3,448,769 | ) | - | (14,165 | ) | ||||||
| From Capital Share Transactions: | ||||||||||||
| Proceeds From Sale of Shares | 67,304,113 | 199,045,263 | 3,782,232 | 4,955,030 | ||||||||
| Proceeds from Redemption Fees (Note 2) | 7,533 | 129,958 | 783 | 77 | ||||||||
| Shares Issued on Reinvestment of Dividends | - | 3,384,204 | - | 14,125 | ||||||||
| Cost of Shares Redeemed | (47,594,489 | ) | (204,517,840 | ) | (799,196 | ) | (944,604 | ) | ||||
| Net Increase (Decrease) from Shareholder Activity | 19,717,157 | (1,958,415 | ) | 2,983,819 | 4,024,628 | |||||||
| Net Increase (Decrease) in Net Assets | 27,177,197 | (20,650,146 | ) | 3,170,363 | 4,012,879 | |||||||
| Net Assets at Beginning of Period | 234,849,128 | 255,499,274 | 7,929,717 | 3,916,838 | ||||||||
| Net Assets at End of Period | $ | 262,026,325 | $ | 234,849,128 | $ | 11,100,080 | $ | 7,929,717 | ||||
| Accumulated Undistributed Net Investment Income (Loss) | $ | (182,142 | ) | $ | - | $ | 3,254 | $ | - | |||
| Share Transactions: | ||||||||||||
| Issued | 1,216,165 | 3,563,706 | 116,258 | 161,670 | ||||||||
| Reinvested | - | 64,155 | - | 465 | ||||||||
| Redeemed | (853,042 | ) | (3,796,093 | ) | (24,563 | ) | (31,750 | ) | ||||
| Net Increase (Decrease) in Shares | 363,123 | (168,232 | ) | 91,695 | 130,385 | |||||||
| Shares Outstanding Beginning of Period | 4,469,874 | 4,638,106 | 262,210 | 131,825 | ||||||||
| Shares Outstanding End of Period | 4,832,997 | 4,469,874 | 353,905 | 262,210 | ||||||||
| The accompanying notes are an integral part of these financial statements. |
2012 Semi-Annual Report 22
| Paradigm Funds | |||||||||||||
| Statements of Changes in Net Assets | Opportunity Fund | Micro-Cap Fund | |||||||||||
| (Unaudited) | (Unaudited) | ||||||||||||
| 1/1/2012 | 1/1/2011 | 1/1/2012 | 1/1/2011 | ||||||||||
| to | to | to | to | ||||||||||
| 6/30/2012 | 12/31/2011 | 6/30/2012 | 12/31/2011 | ||||||||||
| From Operations: | |||||||||||||
| Net Investment Income (Loss) | $ | (10,512 | ) | $ | (37,003 | ) | $ | (40,516 | ) | $ | (7,121 | ) | |
| Net Realized Gain (Loss) on Investments | 69,868 | 494,674 | 689,839 | 197,926 | |||||||||
| Change in Net Unrealized Appreciation (Depreciation) | 111,325 | (537,492 | ) | (858,279 | ) | (40,694 | ) | ||||||
| Increase (Decrease) in Net Assets from Operations | 170,681 | (79,821 | ) | (208,956 | ) | 150,111 | |||||||
| From Distributions to Shareholders: | |||||||||||||
| Net Investment Income | - | - | - | - | |||||||||
| Net Realized Gain from Security Transactions | - | (37,186 | ) | - | - | ||||||||
| Total Distributions to Shareholders | - | (37,186 | ) | - | - | ||||||||
| From Capital Share Transactions: | |||||||||||||
| Proceeds From Sale of Shares | 252,104 | 14,626 | 9,428,825 | 5,073,670 | |||||||||
| Proceeds from Redemption Fees (Note 2) | - | - | - | - | |||||||||
| Shares Issued on Reinvestment of Dividends | - | 37,186 | - | - | |||||||||
| Cost of Shares Redeemed | (51,892 | ) | (383,396 | ) | (19,906 | ) | (1,645,185 | ) | |||||
| Net Increase (Decrease) from Shareholder Activity | 200,212 | (331,584 | ) | 9,408,919 | 3,428,485 | ||||||||
| Net Increase (Decrease) in Net Assets | 370,893 | (448,591 | ) | 9,199,963 | 3,578,596 | ||||||||
| Net Assets at Beginning of Period | 4,490,615 | 4,939,206 | 7,026,325 | 3,447,729 | |||||||||
| Net Assets at End of Period | $ | 4,861,508 | $ | 4,490,615 | $ | 16,226,288 | $ | 7,026,325 | |||||
| Accumulated Net Investment Income (Loss) | $ | (10,512 | ) | $ | - | $ | (40,516 | ) | $ | - | |||
| Share Transactions: | |||||||||||||
| Issued | 9,803 | 555 | 410,230 | 251,925 | |||||||||
| Reinvested | - | 1,476 | - | - | |||||||||
| Redeemed | (1,920 | ) | (15,760 | ) | (899 | ) | (80,132 | ) | |||||
| Net Increase (Decrease) in Shares | 7,883 | (13,729 | ) | 409,331 | 171,793 | ||||||||
| Shares Outstanding Beginning of Period | 179,311 | 193,040 | 334,399 | 162,606 | |||||||||
| Shares Outstanding End of Period | 187,194 | 179,311 | 743,730 | 334,399 | |||||||||
| The accompanying notes are an integral part of these financial statements. |
2012 Semi-Annual Report 23
| Paradigm Value Fund | ||||||||||||||||||
| Financial Highlights - Paradigm Value Fund | ||||||||||||||||||
| (Unaudited) | ||||||||||||||||||
| Selected data for a share outstanding | 1/1/2012 | 1/1/2011 | 1/1/2010 | 1/1/2009 | 1/1/2008 | 1/1/2007 | ||||||||||||
| throughout the period: | to | to | to | to | to | to | ||||||||||||
| 6/30/2012 | 12/31/2011 | 12/31/2010 | 12/31/2009 | 12/31/2008 | 12/31/2007 | |||||||||||||
| Net Asset Value - Beginning of Period | $ | 52.54 | $ | 55.09 | $ | 42.75 | $ | 32.51 | $ | 49.27 | $ | 48.55 | ||||||
| Net Investment Income (Loss) (a) | (0.04 | ) | (0.15 | ) | (0.07 | ) | 0.16 | (0.22 | ) | (0.40 | ) | |||||||
| Net Gains (Loss) on Securities (Realized and Unrealized) | 1.72 | (1.64 | ) | 12.49 | 10.07 | (16.52 | ) | 2.84 | ||||||||||
| Total from Investment Operations | 1.68 | (1.79 | ) | 12.42 | 10.23 | (16.74 | ) | 2.44 | ||||||||||
| Distributions (From Net Investment Income) | - | - | (0.09 | ) | - | - | - | |||||||||||
| Distributions (From Capital Gains) | - | (0.78 | ) | - | - | (0.07 | ) | (1.73 | ) | |||||||||
| Total Distributions | 0.00 | (0.78 | ) | (0.09 | ) | 0.00 | (0.07 | ) | (1.73 | ) | ||||||||
| Proceeds from Redemption Fee (Note 2) | 0.00 | + | 0.02 | 0.01 | 0.01 | 0.05 | 0.01 | |||||||||||
| Net Asset Value - End of Period | $ | 54.22 | $ | 52.54 | $ | 55.09 | $ | 42.75 | $ | 32.51 | $ | 49.27 | ||||||
| Total Return (b) | 3.20 | % ** | (3.22 | )% | 29.08 | % | 31.50 | % | (33.88 | )% | 5.03 | % | ||||||
| Ratios/Supplemental Data | ||||||||||||||||||
| Net Assets - End of Period (Thousands) | $ | 262,026 | $ | 234,849 | $ | 255,499 | $ | 123,043 | $ | 85,018 | $ | 116,247 | ||||||
| Before Reimbursement | ||||||||||||||||||
| Ratio of Expenses to Average Net Assets | 1.85 | % *** | 1.83 | % | 1.89 | % | 1.98 | % | 1.99 | % | 2.02 | % | ||||||
| After Reimbursement | ||||||||||||||||||
| Ratio of Expenses to Average Net Assets (c) ++ | 1.50 | % *** | 1.50 | % | 1.50 | % | 1.63 | % | 1.99 | % | 2.02 | % | ||||||
| Ratio of Net Investment Income (Loss) to Average | ||||||||||||||||||
| Net Assets (c) ++ | -0.14 | % *** | -0.26 | % | -0.14 | % | 0.43 | % | -0.52 | % | -0.78 | % | ||||||
| Portfolio Turnover Rate | 21.40 | % ** | 83.95 | % | 81.17 | % | 69.85 | % | 67.84 | % | 59.75 | % | ||||||
| Paradigm Select Fund | ||||||||||||||||||
| Financial Highlights - Paradigm Select Fund | ||||||||||||||||||
| (Unaudited) | ||||||||||||||||||
| Selected data for a share outstanding throughout the period: | 1/1/2012 | 1/1/2011 | 1/1/2010 | 1/1/2009 | 1/1/2008 | 1/1/2007 | ||||||||||||
| to | to | to | to | to | to | |||||||||||||
| 6/30/2012 | 12/31/2011 | 12/31/2010 | 12/31/2009 | 12/31/2008 | 12/31/2007 | |||||||||||||
| Net Asset Value - Beginning of Period | $ | 30.24 | $ | 29.71 | $ | 23.82 | $ | 18.53 | $ | 27.91 | $ | 26.48 | ||||||
| Net Investment Income (Loss) (a) | 0.01 | 0.06 | (0.05 | ) | 0.08 | 0.03 | (0.06 | ) | ||||||||||
| Net Gains (Loss) on Securities (Realized and Unrealized) | 1.11 | 0.52 | 6.01 | 5.28 | (9.41 | ) | 1.54 | |||||||||||
| Total from Investment Operations | 1.12 | 0.58 | 5.96 | 5.36 | (9.38 | ) | 1.48 | |||||||||||
| Distributions (From Net Investment Income) | - | (0.05 | ) | (0.07 | ) | (0.07 | ) | - | - | |||||||||
| Distributions (From Capital Gains) | - | - | - | - | - | (0.05 | ) | |||||||||||
| Total Distributions | - | (0.05 | ) | (0.07 | ) | (0.07 | ) | - | (0.05 | ) | ||||||||
| Proceeds from Redemption Fee (Note 2) | - + | - + | - + | - + | - | - | ||||||||||||
| Net Asset Value - End of Period | $ | 31.36 | $ | 30.24 | $ | 29.71 | $ | 23.82 | $ | 18.53 | $ | 27.91 | ||||||
| Total Return (b) | 3.74 | % ** | 1.97 | % | 25.03 | % | 28.92 | % | (33.61 | )% | 5.57 | % | ||||||
| Ratios/Supplemental Data | ||||||||||||||||||
| Net Assets - End of Period (Thousands) | $ | 11,100 | $ | 7,930 | $ | 3,917 | $ | 2,710 | $ | 2,031 | $ | 11,109 | ||||||
| Before Reimbursement | ||||||||||||||||||
| Ratio of Expenses to Average Net Assets | 1.50 | % *** | 1.50 | % | 1.50 | % | 1.50 | % | 1.50 | % | 1.50 | % | ||||||
| After Reimbursement | ||||||||||||||||||
| Ratio of Expenses to Average Net Assets ++ | 1.15 | % *** | 1.20 | % | 1.50 | % | 1.50 | % | 1.50 | % | 1.50 | % | ||||||
| Ratio of Net Investment Income/(Loss) to Average | ||||||||||||||||||
| Net Assets ++ | 0.07 | % *** | 0.21 | % | -0.20 | % | 0.42 | % | 0.13 | % | -0.23 | % | ||||||
| Portfolio Turnover Rate | 18.30 | % ** | 58.40 | % | 65.77 | % | 65.57 | % | 47.71 | % | 64.68 | % | ||||||
| ** Not Annualized. *** Annualized. (a) Per share amount calculated using the average shares method. (b) Total return in the above table represents the rate that the investor would have earned or lost on an investment in the Fund assuming reinvestment of dividends. Returns do not reflect the deduction of taxes a shareholder would pay on Fund distributions or redemption of Fund shares. (c) Includes dividend expense on securities sold short and interest expense of 0.00% for the six months ended 6/30/2012, and 0.00%, 0.00%, 0.00%, 0.00% (Amount calculated less than 0.005%) and 0.02% for the years ended 12/31/2011 - 2007, respectively. + Amount calculated is less than $0.005. ++ Such percentages reflect an expense waiver by the Advisor (for Value since 2009 and for Select since 2011). |
| The accompanying notes are an integral part of these financial statements. |
2012 Semi-Annual Report 24
| Paradigm Opportunity Fund | |||||||||||||||||||
| Financial Highlights - Paradigm Opportunity Fund | |||||||||||||||||||
| (Unaudited) | |||||||||||||||||||
| Selected data for a share outstanding throughout the period: | 1/1/2012 | 1/1/2011 | 1/1/2010 | 1/1/2009 | 1/1/2008 | 1/1/2007 | |||||||||||||
| to | to | to | to | to | to | ||||||||||||||
| 6/30/2012 | 12/31/2011 | 12/31/2010 | 12/31/2009 | 12/31/2008 | 12/31/2007 | ||||||||||||||
| Net Asset Value - Beginning of Period | $ | 25.04 | $ | 25.59 | $ | 20.29 | $ | 13.79 | $ | 22.94 | $ | 23.21 | |||||||
| Net Investment Income (Loss) (a) | (0.06 | ) | (0.20 | ) | (0.12 | ) | (0.01 | ) | (0.13 | ) | (0.04 | ) | |||||||
| Net Gains (Loss) on Securities (Realized and Unrealized) | 0.99 | (0.14 | ) | 5.42 | 6.51 | (9.02 | ) | 0.47 | |||||||||||
| Total from Investment Operations | 0.93 | (0.34 | ) | 5.30 | 6.50 | (9.15 | ) | 0.43 | |||||||||||
| Distributions (From Net Investment Income) | - | - | - | - | - | - | |||||||||||||
| Distributions (From Capital Gains) | - | (0.21 | ) | - | - | - | (0.70 | ) | |||||||||||
| Total Distributions | - | (0.21 | ) | - | - | - | (0.70 | ) | |||||||||||
| Proceeds from Redemption Fee (Note 2) | - | - | - + | - | - + | - | |||||||||||||
| Net Asset Value - End of Period | $ | 25.97 | $ | 25.04 | $ | 25.59 | $ | 20.29 | $ | 13.79 | $ | 22.94 | |||||||
| Total Return (b) | 3.71 | % ** | (1.34 | )% | 26.12 | % | 47.14 | % | (39.89 | )% | 1.85 | % | |||||||
| Ratios/Supplemental Data | |||||||||||||||||||
| Net Assets - End of Period (Thousands) | $ | 4,862 | $ | 4,491 | $ | 4,939 | $ | 3,693 | $ | 2,425 | $ | 5,613 | |||||||
| Before Reimbursement | |||||||||||||||||||
| Ratio of Expenses to Average Net Assets | 2.00 | % *** | 2.00 | % | 2.00 | % | 2.00 | % | 2.00 | % | 2.00 | % | |||||||
| After Reimbursement | |||||||||||||||||||
| Ratio of Expenses to Average Net Assets (c) | 1.42 | % *** | 1.50 | % | 1.50 | % | 1.50 | % | 1.50 | % | 1.50 | % | |||||||
| Ratio of Net Investment Income/(Loss) to Average | |||||||||||||||||||
Net Assets (c) | -0.44 | % *** | -0.76 | % | -0.56 | % | -0.04 | % | -0.67 | % | -0.17 | % | |||||||
| Portfolio Turnover Rate | 16.58 | % ** | 65.44 | % | 96.20 | % | 135.62 | % | 164.89 | % | 169.26 | % | |||||||
| Paradigm Micro-Cap Fund | |||||||||||||||
| Financial Highlights - Paradigm Micro-Cap Fund | |||||||||||||||
| (Unaudited) | |||||||||||||||
| Selected data for a share outstanding throughout the period: | 1/1/2012 | 1/1/2011 | 1/1/2010 | 1/1/2009 | 1/1/2008* | ||||||||||
| to | to | to | to | to | |||||||||||
| 6/30/2012 | 12/31/2011 | 12/31/2010 | 12/31/2009 | 12/31/2008 | |||||||||||
| Net Asset Value - Beginning of Period | $ | 21.01 | $ | 21.20 | $ | 17.99 | $ | 13.98 | $ | 20.00 | |||||
| Net Investment Income (Loss) (a) | (0.07 | ) | (0.04 | ) | (0.01 | ) | 0.14 | 0.15 | |||||||
| Net Gains (Loss) on Securities (Realized and Unrealized) | 0.88 | (d) | (0.15 | ) | 3.33 | 3.98 | (6.17 | ) | |||||||
| Total from Investment Operations | 0.81 | (0.19 | ) | 3.32 | 4.12 | (6.02 | ) | ||||||||
| Distributions (From Net Investment Income) | - | - | (0.11 | ) | (0.11 | ) | - | ||||||||
| Distributions (From Capital Gains) | - | - | - | - | - | ||||||||||
| Total Distributions | - | - | (0.11 | ) | (0.11 | ) | - | ||||||||
| Proceeds from Redemption Fee (Note 2) | - | - | - | - + | - | ||||||||||
| Net Asset Value - End of Period | $ | 21.82 | $ | 21.01 | $ | 21.20 | $ | 17.99 | $ | 13.98 | |||||
| Total Return (b) | 3.86 | % ** | (0.90 | )% | 18.44 | % | 29.44 | % | (30.10 | )% | |||||
| Ratios/Supplemental Data | |||||||||||||||
| Net Assets - End of Period (Thousands) | $ | 16,226 | $ | 7,026 | $ | 3,448 | $ | 2,575 | $ | 1,620 | |||||
| Ratio of Expenses to Average Net Assets | 1.25 | % *** | 1.25 | % | 1.25 | % | 1.25 | % | 1.25 | % | |||||
| Ratio of Net Investment Income/(Loss) to Average Net Assets | -0.64 | % *** | -0.20 | % | -0.08 | % | 0.92 | % | 0.86 | % | |||||
| Portfolio Turnover Rate | 28.31 | % ** | 126.43 | % ++ | 77.78 | % | 79.35 | % | 70.57 | % | |||||
| * Commencement of operations. ** Not Annualized. *** Annualized. (a) Per share amount calculated using the average shares method. (b) Total return in the above table represents the rate that the investor would have earned or lost on an investment in the Fund assuming reinvestment of dividends. Returns do not reflect the deduction of taxes a shareholder would pay on Fund distributions or redemption of Fund shares. (c) Such percentages reflect an expense waiver by the Advisor. (d) Realized and unrealized gains and losses per share in this caption are balancing amounts necessary to reconcile the change in the net asset value for the period, and may not reconcile with the aggregate gains and losses in the Statement of Operations due to share transactions for the period. + Amount calculated is less than $0.005. ++ The Fund's portfolio turnover rate increased due to the change in the Fund's principal investment strategy to invest (under normal circumstances) at least 80% of its net assets in the common stocks of U.S. micro-cap companies effective December 27, 2011. |
| The accompanying notes are an integral part of these financial statements. |
2012 Semi-Annual Report 25
NOTES TO FINANCIAL STATEMENTS
PARADIGM FUNDS
June 30, 2012
(Unaudited)
1.) ORGANIZATION
The Paradigm Funds (the "Trust”) is an open-end management investment company organized in Ohio as a business trust on September 13, 2002 that may offer shares of beneficial interest in a number of separate series, each series representing a distinct fund with its own investment objectives and policies. The Paradigm Value Fund (“Value”) commenced operations on January 1, 2003. The Paradigm Value Fund's investment objective is long-term capital appreciation. The Paradigm Opportunity Fund (“Opportunity”) and Paradigm Select Fund (“Select”) both commenced operations on January 1, 2005 with long-term capital appreciation as their objective. The Paradigm Micro-Cap Fund (“Micro-Cap”) commenced operations on January 1, 2008. Effective December 27, 2011, the name of the Paradigm Intrinsic Value Fund was changed to the Paradigm Micro-Cap Fund. The Paradigm Micro-Cap Fund's investment objective is long-term capital appreciation. Under normal circumstances, the Micro-Cap Fund invests at least 80% of its net assets in the common stocks of U.S. micro-cap companies. Prior to December 27, 2011, the principal investment strategy of the Fund was to invest primarily in the common stocks of small, mid or large capitalization companies that the Advisor believed had the potential for capital appreciation. Value, Opportunity, Select and Micro-Cap are all diversified funds. The advisor to Value, Opportunity, Select and Micro-Cap (each a “Fund” and collectively the “Funds”) is Paradigm Funds Advisor LLC (the “Advisor”).
2.) SIGNIFICANT ACCOUNTING POLICIES
SECURITY VALUATION: All investments in securities are recorded at their estimated fair value, as described in Note 3.
SECURITY TRANSACTIONS AND OTHER: Security transactions are recorded based on a trade date. Dividend income is recognized on the ex-dividend date. Interest income is recognized on an accrual basis. The Funds use the highest cost basis in computing gain or loss on sale of investment securities. Discounts and premiums on fixed income securities purchased are amortized over the lives of the respective securities. Withholding taxes on foreign dividends have been provided for in accordance with the Funds’ understanding of the applicable country’s tax rules and rates. The Funds may invest in real estate investment trusts (“REITs”) that pay distributions to their shareholders based on available funds from operations. It is common for these distributions to exceed the REITs taxable earnings and profits resulting in the excess portion of such distribution to be designated as return of capital. Distributions received from REITs are generally recorded as dividend income and, if necessary, are reclassified annually in accordance with tax information provided by the underlying REITs.
SHARE VALUATION: The net asset value (the “NAV”) is generally calculated as of the close of trading on the New York Stock Exchange (normally 4:00 p.m. Eastern time) every day the Exchange is open. The NAV for each Fund is calculated by taking the total value of the Fund’s assets, subtracting its liabilities, and then dividing by the total number of shares outstanding, rounded to the nearest cent. The offering price and redemption price per share is equal to the net asset value per share, except that shares of each Fund are subject to a redemption fee of 2% if redeemed within 90 days of purchase. During the six month period ended June 30, 2012 proceeds from redemption fees were $7,533, $783, $0 and $0 for Value, Select, Opportunity and Micro-Cap, respectively.
SHORT SALES: A Fund may sell a security it does not own in anticipation of a decline in the fair value of the security. When a Fund sells a security short, it must borrow the security sold short and deliver it to the broker-dealer through which it made the short sale. A gain, limited to the price at which a Fund sold the security short, or a loss, unlimited in size, will be recognized upon the termination of a short sale.
INCOME TAXES: The Funds’ policy is to continue to comply with the requirements of the Internal Revenue Code that are applicable to regulated investment companies and to distribute all of their taxable income to shareholders. Therefore, no federal income tax provision is required. It is the Funds’ policy to distribute annually, prior to the end of the calendar year, dividends sufficient to satisfy excise tax requirements of the Internal Revenue Code. This Internal Revenue Code requirement may cause an excess of distributions over the book year-end accumulated income. In addition, it is the Funds’ policy to distribute annually, after the end of the fiscal year, any remaining net investment income and net realized capital gains.
The Funds recognize the tax benefits of certain tax positions only where the position is “more likely than not” to be sustained assuming examination by tax authorities. Management has analyzed the Funds’ tax positions, and has concluded that no liability for unrecognized tax benefits should be recorded related to uncer-
2012 Semi-Annual Report 26
Notes to Financial Statements (Unaudited) - continued
tain tax positions taken on returns filed for open tax years (2008-2011), or expected to be taken on the Funds’ 2012 tax return. The Funds identify their major tax jurisdictions as U.S. Federal and New York State tax authorities; however the Funds are not aware of any tax positions for which they are reasonably possible that the total amounts of unrecognized tax benefits will change materially in the next twelve months. The Funds recognize interest and penalties, if any, related to unrecognized tax benefits as income tax expense in the statements of operations. During the six month period ended June 30, 2012, the Funds did not incur any interest or penalties.
ESTIMATES: The preparation of financial statements in conformity with accounting principles generally accepted in the United States of America (“GAAP”) requires management to make estimates and assumptions that affect the reported amounts of assets and liabilities and disclosure of contingent assets and liabilities at the date of the financial statements and the reported amounts of increases and decreases in net assets from operations during the reporting period. Actual results could differ from those estimates.
DISTRIBUTIONS TO SHAREHOLDERS: Distributions to shareholders, which are determined in accordance with income tax regulations, are recorded on the ex-dividend date. The treatment for financial reporting purposes of distributions made to shareholders during the year from net investment income or net realized capital gains may differ from their ultimate treatment for federal income tax purposes. These differences are caused primarily by differences in the timing of recognition of certain components of income, expense or realized capital gain for federal income tax purposes. Where such differences are permanent in nature, they are reclassified in the components of the net assets based on their ultimate characterization for federal income tax purposes. Any such reclassification will have no effect on net assets, results of operations or net asset values per share of any Fund.
3.) SECURITIES VALUATIONS
The Funds utilize various methods to measure the fair value of their investments on a recurring basis. GAAP establishes a hierarchy that prioritizes inputs to valuation methods. The three levels of inputs are:
Level 1 - Unadjusted quoted prices in active markets for identical assets or liabilities that the Funds have the ability to access.
Level 2 - Observable inputs other than quoted prices included in level 1 that are observable for the asset or liability, either directly or indirectly. These inputs may include quoted prices for the identical instrument on an inactive market, prices for similar instruments, interest rates, prepayment speeds, credit risk, yield curves, default rates and similar data.
Level 3 - Unobservable inputs for the asset or liability, to the extent relevant observable inputs are not available, representing the Funds’ own assumptions about the assumptions a market participant would use in valuating the assets or liabilities, and would be based on the best information available.
The availability of observable inputs can vary from security to security and is affected by a wide variety of factors, including, for example, the type of security, whether the security is new and not yet established in the marketplace, the liquidity of markets, and other characteristics particular to the security. To the extent that valuation is based on models or inputs that are less observable or unobservable in the market, the determination of fair value requires more judgment. Accordingly, the degree of judgment exercised in determining fair value is greatest for instruments categorized in level 3.
The inputs used to measure fair value may fall into different levels of the fair value hierarchy. In such cases, for disclosure purposes, the level in the fair value hierarchy within which the fair value measurement falls in its entirety, is determined based on the lowest level input that is significant to the fair value measurement in its entirety.
FAIR VALUE MEASUREMENTS
A description of the valuation techniques applied to the Funds’ major categories of assets and liabilities measured at fair value on a recurring basis follows.
Equity securities (common stocks and real estate investment trusts). Equity securities are carried at fair value. The market quotation used for equity securities, including those listed on the NASDAQ National Market System, is the last sale price on the date on which the valuation is made or, in the absence of sales, at the closing bid price. Over-the-counter securities will be valued on the basis of the bid price at the close of each business day. Generally, if the security is traded in an active market and is valued at the last sale price, the security is categorized as a level 1 security. When the security position is not considered to be part of an active market or when the security is valued at the bid price, the position is generally categorized as level 2. When market quotations are not readily available, when the Advisor determines the last bid price does not accurately reflect the current value or when restricted securities are being valued, such securities
2012 Semi-Annual Report 27
Notes to Financial Statements (Unaudited) - continued
are valued as determined in good faith by the Advisor, in conformity with guidelines adopted by and subject to review of the Board of Trustees (the “Trustees”) and are categorized in level 2 or level 3, when appropriate.
Money market funds. Money market funds are valued at a net asset value of $1.00 and are classified in level 1 of the fair value hierarchy.
Fixed income securities. Fixed income securities generally are valued by using market quotations, but may be valued on the basis of prices furnished by a pricing service when the Advisor believes such prices accurately reflect the fair value of such securities. A pricing service utilizes electronic data processing techniques based on yield spreads relating to securities with similar characteristics to determine prices for normal institutional-size trading units of debt securities without regard to sale or bid prices. When prices are not readily available from a pricing service, or when restricted or illiquid securities are being valued, securities are valued at fair value as determined in good faith by the Advisor, subject to review of the Trustees. Short-term investments in fixed income securities with maturities of less than 60 days when acquired, or which subsequently are within 60 days of maturity, are valued by using the amortized cost method of valuation. Generally, fixed income securities are categorized as level 2.
In accordance with the Trust's good faith pricing guidelines, the Advisor is required to consider all appropriate factors relevant to the value of securities for which it has determined other pricing sources are not available or reliable as described above. There is no single standard for determining fair value, since fair value depends upon the circumstances of each individual case. As a general principle, the current fair value of an issue of securities being valued by the Advisor would appear to be the amount which the owner might reasonably expect to receive for them upon their current sale. Methods which are in accordance with this principle may, for example, be based on (i) a multiple of earnings; (ii) a discount from market of a similar freely traded security (including a derivative security or a basket of securities traded on other markets, exchanges or among dealers); or (iii) yield to maturity with respect to debt issues, or a combination of these and other methods.
The following tables summarize the inputs used to value the Funds’ assets measured at fair value as of June 30, 2012:
| Value: | ||||||||
| Valuation Inputs of Assets | Level 1 | Level 2 | Level 3 | Total | ||||
| Common Stock | $238,820,921 | $0 | $0 | $238,820,921 | ||||
| Real Estate Investment Trusts | 16,433,558 | 0 | 0 | 16,433,558 | ||||
| Money Market Funds | 5,342,948 | 0 | 0 | 5,342,948 | ||||
| Total | $260,597,427 | $0 | $0 | $260,597,427 | ||||
| Select: | ||||||||
| Valuation Inputs of Assets | Level 1 | Level 2 | Level 3 | Total | ||||
| Common Stock | $9,709,271 | $0 | $0 | $9,709,271 | ||||
| Real Estate Investment Trusts | 825,570 | 0 | 0 | 825,570 | ||||
| Money Market Funds | 524,367 | 0 | 0 | 524,367 | ||||
| Total | $11,059,208 | $0 | $0 | $11,059,208 | ||||
| Opportunity: | ||||||||
| Valuation Inputs of Assets | Level 1 | Level 2 | Level 3 | Total | ||||
| Common Stock | $4,465,340 | $0 | $0 | $4,465,340 | ||||
| Real Estate Investment Trusts | 245,664 | 0 | 0 | 245,664 | ||||
| Money Market Funds | 144,478 | 0 | 0 | 144,478 | ||||
| Total | $4,855,482 | $0 | $0 | $4,855,482 | ||||
| Micro-Cap: | ||||||||
| Valuation Inputs of Assets | Level 1 | Level 2 | Level 3 | Total | ||||
| Common Stock | $15,153,904 | $0 | $0 | $15,153,904 | ||||
| Money Market Funds | 572,486 | 0 | 0 | 572,486 | ||||
| Total | $15,726,390 | $0 | $0 | $15,726,390 | ||||
Refer to each Fund’s Schedule of Investments for a listing of securities by industry. The Funds did not hold any level 3 assets during the six month period ended June 30, 2012. There were no transfers into or out of the levels during the six month period ended June 30, 2012. It is the Funds’ policy to consider transfers into or out of the levels as of the end of the reporting period.
The Funds did not invest in derivative instruments during the six month period ended June 30, 2012.
2012 Semi-Annual Report 28
Notes to Financial Statements (Unaudited) - continued
4.) INVESTMENT ADVISORY AGREEMENTS
Each of the Funds has an investment advisory agreement (collectively the "Management Agreements") with the Advisor. Under the terms of the Management Agreements, the Advisor manages the investment portfolios of the Funds, subject to policies adopted by the Trust’s Board of Trustees. Under the Management Agreements, the Advisor, at its own expense and without reimbursement from the Trust, furnishes office space and all necessary office facilities, equipment and executive personnel necessary for managing the assets of the Funds. The Advisor pays all operating expenses of the Funds with the exception of taxes, brokerage fees and commissions, borrowing costs (such as (a) interest and (b) dividend expenses on securities sold short) and extraordinary expenses as defined under accounting principles generally accepted in the United States of America. The Advisor also pays the salaries and fees of all of its officers and employees that serve as officers and trustees of the Trust. For its services and payment of certain Fund expenses as described below, the Advisor receives an annual investment management fee of 1.50% of the average daily net assets from Select, 2.00% of the average daily net assets from Opportunity; and 1.25% of the average daily net assets from Micro-Cap. Value pays the Advisor an annual investment management fee of 2.00% of the average daily net assets on assets up to and including $100 million and 1.75% of the average daily net assets over $100 million. As a result of the above calculations, for the six month period ended June 30, 2012, the Advisor earned management fees (before the waivers described below) totaling $2,447,705, $74,805, $48,295 and $78,344 for Value, Select, Opportunity, and Micro-Cap, respectively. At June 30, 2012, $316,565, $10,232, $4,836 and $15,921 was due to the Advisor from Value, Select, Opportunity and Micro-Cap, respectively. The Advisor has contractually agreed to waive management fees and/or reimburse Value and Select to the extent necessary to maintain total annual operating expenses of the Funds (excluding brokerage fees and commissions, interest and other borrowing expenses, taxes, extraordinary expenses and indirect costs of investing in acquired funds) at 1.50% and 1.15%, respectively, of daily net assets through May 1, 2013. Effective May 1, 2012 the Advisor has contractually agreed to waive management fees and reimburse expenses of Opportunity to the extent necessary to maintain total annual operating expenses of the Fund (excluding brokerage fees and commissions, interest and other borrowing expenses, taxes, extraordinary expenses and the indirect costs of investing in acquired funds) at 1.25% of its average daily net assets through May 1, 2013. Prior to May 1, 2012, the Advisor had contractually agreed to waive management fees and reimbursed expenses to maintain operating expenses of Opportunity at 1.50% of average net assets. A total of $456,521, $17,456 and $14,046 was waived with no recapture provision for the six month period ended June 30, 2012 for Value, Select and Opportunity, respectively.
5.) RELATED PARTY TRANSACTIONS
Certain officers and shareholders of the Advisor are also officers and/or a Trustee of the Trust. These individuals may receive benefits from the Advisor resulting from management fees paid to the Advisor from the Funds.
The Trustees who are not interested persons of the Funds were paid $2,000 per meeting for the six month period ended June 30, 2012 for the Trust. Under the Management Agreements, the Advisor pays these fees.
6.) INVESTMENTS
For the six month period ended June 30, 2012, purchases and sales of investment securities other than U.S. Government obligations and short-term investments were as follows:
| Value | Select | Opportunity | Micro-Cap | |||||
| Purchases | $79,400,187 | $4,729,502 | $1,055,168 | $11,802,354 | ||||
| Sales | $53,792,064 | $1,710,849 | $759,933 | $3,258,323 |
There were no purchases or sales of U.S. Government obligations.
For federal income tax purposes, at June 30, 2012 the cost of securities on a tax basis and the composition of gross unrealized appreciation (the excess of value over tax cost) and depreciation (the excess of tax cost over value) were as follows:
| Value | Select | Opportunity | Micro-Cap | |||||
| Cost of Investments | $230,990,211 | $10,285,693 | $4,116,809 | $16,034,736 | ||||
| Gross Unrealized Appreciation | $41,564,099 | $1,321,625 | $908,899 | $1,016,512 | ||||
| Gross Unrealized Depreciation | ($11,956,883 | ) | ($548,110 | ) | ($170,226 | ) | ($1,324,858 | ) |
| Net Unrealized Appreciation | ||||||||
| (Depreciation) on Investments | $29,607,216 | $773,515 | $738,673 | ($308,346 | ) | |||
7.) CAPITAL SHARES
At June 30, 2012, the Trust was authorized to issue an unlimited number of shares of beneficial interest. The following are the shares issued and paid in capital outstanding for the Funds at June 30, 2012:
2012 Semi-Annual Report 29
| Notes to Financial Statements (Unaudited) - continued | ||||||||
| Value | Select | Opportunity | Micro-Cap | |||||
| Shares Issued | ||||||||
| and Outstanding | 4,832,997 | 353,905 | 187,194 | 743,730 | ||||
| Paid in Capital | $233,771,732 | $10,267,206 | $4,121,330 | $16,001,405 | ||||
8.) DISTRIBUTIONS TO SHAREHOLDERS
The tax character of distributions paid during the six month period ended June 30, 2012 and the fiscal year ended December 31, 2011 were as follows:
| Six Months Ended | Fiscal Year Ended | ||
| June 30, 2012 | December 31, 2011 | ||
| PARADIGM VALUE FUND | |||
| Ordinary Income | $ - | $ - | |
| Long-term Capital Gain | - | 3,448,769 | |
| $ - | $3,448,769 | ||
| PARADIGM SELECT FUND | |||
| Ordinary Income | $ - | $ 14,165 | |
| Long-term Capital Gain | - | - | |
| $ - | $ 14,165 | ||
| PARADIGM OPPORTUNITY FUND | |||
| Ordinary Income | $ - | $ - | |
| Long-term Capital Gain | - | 37,186 | |
| $ - | $ 37,186 | ||
| PARADIGM MICRO-CAP FUND | |||
| Ordinary Income | $ - | $ - | |
| Long-term Capital Gain | - | - | |
| $ - | $ - | ||
9.) CAPITAL LOSS CARRYFORWARD
At December 31, 2011, Value, Select, Opportunity and Micro-Cap Funds had available for federal tax purposes unused capital losses of $0, $367, $0 and $116,032 respectively, all of which expires in 2017. Under the Regulated Investment Company Modernization Act of 2010 (the “Act”), net capital losses incurred in taxable years beginning after December 22, 2010 may now be carried forward indefinitely, and retain the character of the original loss. Under pre-enacted laws, capital losses could be carried forward for eight years, and carried forward as short-term capital, irrespective of the character of the original loss. As a transition rule, the Act requires that post-enactment net capital losses be used before pre-enactment net capital losses. To the extent that these carryforwards are used to offset future capital gains it is probable that the amount which is offset will not be distributed to shareholders.
10.) CONTROL OWNERSHIP
The beneficial ownership, either directly or indirectly, of more than 25% of the voting shares of a fund creates a presumption of control of the fund, under section 2(a)(9) of the Investment Company Act of 1940. At June 30, 2012, Charles Schwab & Co., Inc., located at 101 Montgomery Street, San Francisco, California 94101 and National Financial Services, LLC, located at 200 Liberty Street, New York, New York 10281, both for the benefit of its customers, held, in aggregate, 27.82% and 25.85%, respectively, of Value, and therefore each may be deemed to control Value. Charles Schwab & Co., Inc., located at 101 Montgomery Street, San Francisco, California 94101, held, for the benefit of its customers, in aggregate, 40.30% of Select, and therefore may be deemed to control Select. Candace King Weir, beneficial owner located at 9 Elk Street, Albany, New York 12207, held, in aggregate, 83.72%, of Opportunity, and therefore may be deemed to control Opportunity. Also, Candace King Weir, beneficial owner located at 9 Elk Street, Albany, New York 12207, held, in aggregate, 95.96% of Micro-Cap, and therefore may be deemed to control Micro-Cap.
2012 Semi-Annual Report 30
DISCLOSURE OF EXPENSES
(Unaudited)
Shareholders of the Paradigm Funds (the “Funds”) incur ongoing costs. The ongoing costs associated with the Paradigm Value Fund include management fees, interest expense and dividend expense on securities sold short. The ongoing costs associated with the Paradigm Opportunity Fund, Paradigm Select Fund and Paradigm Micro-Cap Fund consist solely of management fees. Although the Funds charge no sales loads or transaction fees, you will be assessed fees for outgoing wire transfers, returned checks and stop payment orders at prevailing rates charged by Mutual Shareholder Services, LLC, the Funds’ transfer agent. IRA accounts will be charged an $8.00 annual maintenance fee. If shares are redeemed within 90 days of purchase from the Funds, the shares are subject to a 2% redemption fee. The following example is intended to help you understand your ongoing costs of investing in the Funds and to compare these costs with similar costs of investing in other mutual funds. The example is based on an investment of $1,000 invested in the Funds on January 1, 2012 and held through June 30, 2012.
The first line of the table below provides information about actual account values and actual expenses. In order to estimate the expenses a shareholder paid during the period covered by this report, shareholders can divide their account value by $1,000 (for example, an $8,600 account value divided by $1,000 = 8.6) and then multiply the result by the number in the first line under the heading entitled "Expenses Paid During the Period."
The second line of the table below provides information about hypothetical account values and hypothetical expenses based on the Funds’ actual expense ratios and an assumed rate of return of 5% per year before expenses, which is not the Funds’ actual return. The hypothetical account values and expenses may not be used to estimate the actual ending account balance or expenses paid by a shareholder for the period. Shareholders may use this information to compare the ongoing costs of investing in the Funds and other funds. In order to do so, compare these 5% hypothetical examples with the 5% hypothetical examples that appear in other funds' shareholder reports.
| PARADIGM VALUE FUND | ||||||
| Expenses Paid | ||||||
| Beginning | Ending | During the Period* | ||||
| Account Value | Account Value | January 1, 2012 | ||||
| January 1, 2012 | June 30, 2012 | to June 30, 2012 | ||||
| Actual | $1,000.00 | $1,031.98 | $7.58 | |||
| Hypothetical | $1,000.00 | $1,017.40 | $7.52 | |||
| (5% annual return | ||||||
| before expenses) | ||||||
| * Expenses are equal to the Fund’s annualized expense ratio of 1.50%, multiplied by the average account value over the period, multiplied by 182/366 (to reflect the one-half year period). |
| PARADIGM SELECT FUND | ||||||
| Expenses Paid | ||||||
| Beginning | Ending | During the Period* | ||||
| Account Value | Account Value | January 1, 2012 | ||||
| January 1, 2012 | June 30, 2012 | to June 30, 2012 | ||||
| Actual | $1,000.00 | $1,037.04 | $5.82 | |||
| Hypothetical | $1,000.00 | $1,019.14 | $5.77 | |||
| (5% annual return | ||||||
| before expenses) | ||||||
| * Expenses are equal to the Fund’s annualized expense ratio of 1.15%, multiplied by the average account value over the period, multiplied by 182/366 (to reflect the one-half year period). |
2012 Semi-Annual Report 31
| Disclosure of Expenses (Unaudited) - continued | ||||||
| PARADIGM OPPORTUNITY FUND | ||||||
| Expenses Paid | ||||||
| Beginning | Ending | During the Period* | ||||
| Account Value | Account Value | January 1, 2012 | ||||
| January 1, 2012 | June 30, 2012 | to June 30, 2012 | ||||
| Actual | $1,000.00 | $1,037.14 | $7.19 | |||
| Hypothetical | $1,000.00 | $1,017.80 | $7.12 | |||
| (5% annual return | ||||||
| before expenses) | ||||||
| * Expenses are equal to the Fund’s annualized expense ratio of 1.42%, multiplied by the average account value over the period, multiplied by 182/366 (to reflect the one-half year period). |
| PARADIGM MICRO-CAP FUND | ||||||
| Expenses Paid | ||||||
| Beginning | Ending | During the Period* | ||||
| Account Value | Account Value | January 1, 2012 | ||||
| January 1, 2012 | June 30, 2012 | to June 30, 2012 | ||||
| Actual | $1,000.00 | $1,038.55 | $6.34 | |||
| Hypothetical | $1,000.00 | $1,018.65 | $6.27 | |||
| (5% annual return | ||||||
| before expenses) | ||||||
| * Expenses are equal to the Fund’s annualized expense ratio of 1.25%, multiplied by the average account value over the period, multiplied by 182/366 (to reflect the one-half year period). |
2012 Semi-Annual Report 32
ADDITIONAL INFORMATION
June 30, 2012
APPROVAL AND RENEWAL OF INVESTMENT ADVISORY AGREEMENTS
(Unaudited)
At a Meeting of the Board of Trustees held on February 24, 2012 (the “Meeting”) the Board of Trustees (the “Trustees”) considered the continuance of the Management Agreements (the “Agreements”) with Paradigm Funds Advisor LLC (the “Advisor”) for the Paradigm Value Fund, the Paradigm Select Fund, the Paradigm Opportunity Fund, and the Paradigm Micro-Cap Fund. In renewing the Agreements, the Board of Trustees received material from the Advisor (the "Report") addressing the following factors: (i) the investment performance of the Funds and the Advisor; (ii) the nature, extent and quality of the services provided by the Advisor to the Funds; (iii) the cost of the services to be provided and the profits to be realized by the Advisor and its affiliates from the relationship with the Funds; (iv) the extent to which economies of scale will be realized as the Funds grow; and (v) whether the fee levels reflect these economies of scale to the benefit of shareholders.
As to the performance of the Funds, the Report included information regarding the performance of each Fund compared to a group of funds of similar size, style and objective (the "Peer Group"). All performance data was through the period ended December 31, 2011. The Report also included comparative performance information for major indexes and other accounts managed by the Advisor. The Trustees noted that each of the Funds continued to perform well. The report indicated that the Value Fund's one-year, three-year annualized, five-year annualized and since inception returns were higher than its Peer Group average and comparative index. The report indicated that the Select Fund's one-year return, three-year annualized and five-year annualized returns were higher than its Peer Group average. The report also indicated that the Select Fund's three-year annualized return was slightly below its comparative index, and its one-year return, five-year annualized and since inception returns were higher than its comparative index. The report indicated that the Opportunity Fund's one-year, three-year annualized, and five-year annualized returns exceeded its Peer Group average and comparative index. The Trustees then reviewed the Paradigm Micro-Cap Fund's performance. It was noted that the Micro-Cap Fund outperformed its index and Peer Group average for its one-year return. It was also noted that the Micro-Cap Fund outperformed its index for the three-year annualized, and since inception returns. The Trustees concluded that the Funds' performance was either consistent with or above their expectations.
As to the nature, extent and quality of the services provided by the Advisor, the Trustees analyzed the Advisor's experience and capabilities. The representatives of the Advisor reviewed and discussed with the Board the Advisor's ADV and the Code of Ethics certifications. They summarized the information provided to the Board regarding matters such as the Advisor's research and investment personnel. They also discussed the portfolio managers' backgrounds and investment management experience. Furthermore, they reviewed the Advisor's financial information and discussed the firm's ability to meet its obligations under the Agreements. The Board concluded that the nature and extent of the services provided by the Advisor were consistent with their expectations, and that the quality of services, particularly those provided by the portfolio managers, was exceptional. The Trustees also concluded that the Advisor has the resources to provide quality advisory services to the Funds.
As to the costs of the services to be provided, the Board reviewed the fees under the Agreements compared to the applicable Peer Group. The Trustees noted that each Fund pays a unitary management fee out of which the Advisor pays Fund expenses. As a result, comparison of the total operating expenses is a relevant exercise. The Value Fund's expense ratio of 1.50% was found to be higher than its Peer Group's average expense ratio of 1.28%, but within the range of its peers. The Report indicated that the Select Fund's audited expense ratio of 1.20% was lower than its Peer Group's average expense ratio of 1.69%; the Opportunity Fund's expense ratio of 1.50% was lower than its Peer Group's average expense ratio of 1.77%; and that the Micro-Cap Fund's expense ratio of 1.25% was lower than its Peer Group's average expense ratio of 1.76% . Additionally, it was noted that while the Advisor's management fees were the highest in the Peer Groups, when compared to advisory fees (not total expenses), the Advisor is responsible under the Agreements for paying all but a very small fraction of the Funds' expenses out of the management fees. The Board noted that while the Advisor does not manage any other accounts, Paradigm Capital Management provides services to: four "hedge funds" (total assets of $270 million at December 31, 2011) for which it receives an annual fee of 0.75% and a performance fee of 20%; 16 institutional accounts (total assets of $561 million at December 31, 2011) for which it receives fees ranging from 0.65% - 1.00%; 178 separately managed accounts for high net-worth clients (total assets of $122 million at December 31, 2011) for which it receives fees ranging from 0.75% - 1.50% and a sub-advisory arrangement with a registered investment company (total assets of $477 million at December 31, 2011) with an average fee of just over 30 basis points. The Trustees concluded that the management
2012 Semi-Annual Report 33
Additional Information - continued
fees were reasonable, and that the shareholders were receiving excellent value for the fees paid. The Trustees also reviewed a profit and loss analysis prepared by the Advisor that disclosed the direct and indirect expenses paid by the Advisor on behalf of each Fund, and the total revenue derived by the Advisor from the Funds. The Trustees then noted that the Advisor did not utilize an affiliated broker and received no soft dollar benefits. The Trustees concluded that the Advisor was not overly profitable.
As for potential economies of scale, the Trustees discussed and considered information regarding whether economies of scale have been realized with respect to the management of the Funds, whether the Funds have appropriately benefited from any economies of scale, and whether there is potential for realization of any further economies of scale. The Board noted that the Advisor has contractually agreed to waive management fees and reimburse expenses to the extent necessary to maintain total annual operating expenses of the Value Fund and the Opportunity Fund (excluding brokerage fees and commissions, interest and other borrowing expenses, taxes, extraordinary expenses and the indirect costs of investing in Acquired Funds) at 1.50% of their average daily net assets through May 1, 2013, thereby benefiting shareholders. The Board further noted that the Advisor has contractually agreed to waive management fees and reimburse expenses to the extent necessary to maintain total annual operating expenses of the Select Fund (excluding brokerage fees and commissions, interest and other borrowing expenses, taxes, extraordinary expenses and the indirect costs of investing in Acquired Funds) at 1.15% of their average daily net assets through May 1, 2013, thereby benefiting shareholders. As for the Micro-Cap Fund, the Advisor asserted, and the Board agreed, that the current small size of the Funds did not warrant any additional waivers. Next, the independent Trustees met in executive session to discuss the continuation of the Advisory contracts. The officers of the Trust were excused during this discussion.
Upon reconvening the meeting, it was the consensus of the Trustees, including the independent Trustees, that renewal of the Management Agreements would be in the best interests of each Fund and its shareholders.
AVAILABILITY OF QUARTERLY SCHEDULE OF INVESTMENTS
(Unaudited)
The Funds file their complete schedules of portfolio holdings with the Securities and Exchange Commission ("SEC") for the first and third quarters of each fiscal year on Form N-Q. The Funds’ Forms N-Q are available on the SEC's Web site at http://www.sec.gov. The Funds’ Forms N-Q may also be reviewed and copied at the SEC's Public Reference Room in Washington, DC. Information on the operation of the Public Reference Room may be obtained by calling 1-800-SEC-0330.
PROXY VOTING GUIDELINES
(Unaudited)
Paradigm Funds Advisor LLC, the Funds’ Advisor, is responsible for exercising the voting rights associated with the securities held by the Funds. A description of the policies and procedures used by the Advisor in fulfilling this responsibility is available without charge on the Funds’ web site at www.paradigm-funds.com. It is also included in the Funds’ Statement of Additional Information, which is available on the Securities and Exchange Commission’s web site at http://www.sec.gov.
Information regarding how the Funds voted proxies, Form N-PX, relating to portfolio securities during the most recent 12-month period ended June 30 is available without charge, upon request, by calling our toll free number(1-800-239-0732). This information is also available on the Securities and Exchange Commission’s web site at http://www.sec.gov.
ADDITIONAL INFORMATION
You will find more information about the Funds at www.paradigm-funds.com. For shareholder inquiries, please call toll-free in the U.S. at 1-800-239-0732.
2012 Semi-Annual Report 34
Board of Trustees
|
| This report is provided for the general information of the shareholders of the Paradigm Funds. This report is not intended for distribution to prospective investors in the Funds, unless preceded or accompanied by an effective prospectus. |
Item 2. Code of Ethics. Not applicable.
Item 3. Audit Committee Financial Expert. Not applicable.
Item 4. Principal Accountant Fees and Services. Not applicable.
Item 5. Audit Committee of Listed Companies. Not applicable.
Item 6. Schedule of Investments. Not applicable. Schedule filed with Item 1.
Item 7. Disclosure of Proxy Voting Policies and Procedures for Closed-End Funds. Not applicable.
Item 8. Portfolio Managers of Closed End Funds. Not applicable.
Item 9. Purchases of Equity Securities by Closed-End Management Investment Companies and Affiliated Purchasers. Not applicable.
Item 10. Submission of Matters to a Vote of Security Holders.
The registrant has not adopted procedures by which shareholders may recommend nominees to the registrant’s board of trustees.
Item 11. Controls and Procedures.
(a) The Registrant’s president and chief financial officer concluded that the disclosure controls and procedures (as defined in Rule 30a-3(c) under the Investment Company Act of 1940 (the “Act”)) were effective as of a date within 90 days of the filing date of this report, based on the evaluation of these controls and procedures required by Rule 30a-3(b) under the Act.
(b) There were no changes in the registrant’s internal control over financial reporting (as defined in Rule 30a-3(d) under the Act) that occurred during the registrant’s second fiscal quarter of the period covered by this report that have materially affected, or are reasonably likely to materially affect, the registrant’s internal control over financial reporting.
Item 12. Exhibits.
(a)(1) Code of Ethics. Not applicable.
(a)(2) Certifications pursuant to Section 302 of the Sarbanes-Oxley Act of 2002. Filed herewith.
(b) Certification pursuant to Section 906 of the Sarbanes-Oxley Act of 2002. Filed herewith.
SIGNATURES
Pursuant to the requirements of the Securities Exchange Act of 1934 and the Investment Company Act of 1940, the registrant has duly caused this report to be signed on its behalf by the undersigned, thereunto duly authorized.
| Paradigm Funds |
| By: /s/Candace King Weir Candace King Weir President |
| Date: 9-4-2012 |
Pursuant to the requirements of the Securities Exchange Act of 1934 and the Investment Company Act of 1940, this report has been signed below by the following persons on behalf of the registrant and in the capacities and on the dates indicated.
| By: /s/Candace King Weir Candace King Weir President |
| Date: 9-4-2012 |
| By: /s/Robert A. Benton Robert A. Benton Chief Financial Officer |
| Date: 9-4-2012 |