UNITED STATES
SECURITIES AND EXCHANGE COMMISSION
WASHINGTON, D.C. 20549
FORM N-CSR
CERTIFIED SHAREHOLDER REPORT OF REGISTERED MANAGEMENT
INVESTMENT COMPANIES
Investment Company Act file number 811-21233
PARADIGM FUNDS
(Exact name of registrant as specified in charter)
Nine Elk Street, Albany, NY 12207-1002
(Address of principal executive offices) (Zip code)
Robert A. Benton
Nine Elk Street, Albany, NY 12207-1002
(Name and address of agent for service)
Registrant's telephone number, including area code: (518) 431-3500
Date of fiscal year end: December 31
Date of reporting period: June 30, 2015
Form N-CSR is to be used by management investment companies to file reports with the Commission not later than 10 days after the transmission to stockholders of any report that is required to be transmitted to stockholders under Rule 30e-1 under the Investment Company Act of 1940 (17 CFR 270.30e -1). The Commission may use the information provided on Form N-CSR in its regulatory, disclosure review, inspection and policymaking roles.
A registrant is required to disclose the information specified by Form N-CSR, and the Commission will make this information public. A registrant is not required to respond to the collection of information contained in Form N-CSR unless the Form displays a currently valid Office of Management and Budget ("OMB") control number.
Item 1. Reports to Stockholders.
Paradigm Funds
Paradigm Value Fund
Paradigm Select Fund
Paradigm Opportunity Fund
Paradigm Micro-Cap Fund
For Investors Seeking Long-Term Capital Appreciation
SEMI-ANNUAL REPORT
June 30, 2015
| Table of Contents | |
| PARADIGM FUNDS | |
| Letter to Shareholders | 2 |
| Sector Allocation | 5 |
| Performance Information | 7 |
| Schedules of Investments | 11 |
| Statements of Assets and Liabilities | 21 |
| Statements of Operations | 21 |
| Statements of Changes in Net Assets | 23 |
| Financial Highlights | 25 |
| NOTES TO FINANCIAL STATEMENTS | 27 |
| DISCLOSURE OF EXPENSES | 33 |
| ADDITIONAL INFORMATION | 35 |
2015 Semi-Annual Report 1
Letter to Shareholders
Dear Fellow Shareholders:
The first half of the year was modestly positive for major domestic equity indices, with the flat performance of the second quarter marking a significant change from the precipitous gains and losses of 2014. As active, fundamental investors, we view this development with cautious optimism given the possibility that investors will look beyond broad passive exposure to achieve return targets.
We believe that the U.S. economy continues to eke out its gradual recovery, as evidenced by the most recent employment report. As always, there are gives and takes in the underlying data, such that the latest improvement to a 5.3% unemployment rate was undercut by pockets of weakness in wage growth and labor-force participation. Housing data have also displayed their share of gives and takes, with pending home sales hitting a 9-year high, and homebuilder confidence also hitting new highs, while home price growth has moderated. Nonetheless, ISM (Institute for Supply Management) manufacturing data remain solidly expansionary and US auto sales remain strong.
Importantly for one of our investment themes, construction spending posted extremely encouraging May data on both the residential and non-residential sides, both of which reached their highest levels since the 2008 downturn. Also beneficial to our typically overweight position in the Consumer space is the fact that energy prices remain low, which continues to put more cash back in the consumer's pocket.
Much of the hand-wringing about a contractionary first quarter of 2015 has abated and, as suspected, the initially grim first-quarter data were subsequently revised upward. While the severe winter weather dampened first-quarter economic activity, it was a matter of timing, rather than an absolute slowdown. Thus, as we look ahead to the second half of the year, we remain encouraged. We expect that all eyes will be on the Federal Reserve and its tightening stance but, in our view, there is no new news there.
We are optimistic about the probability of a pickup from both the consumer and manufacturing perspectives in the second half of the year. Regardless of short-term developments, however, we intend to remain diligent in portfolio positioning and maintain our disciplined, fundamental-driven investment process.
Paradigm Value Fund
The Paradigm Value Fund appreciated 5.30% in the first half of 2015, compared to 0.76% for its benchmark, the Russell 2000 Value Index. Since inception (January 1, 2003), on an annualized basis, the Fund returned 13.57%, compared to 10.55% for the benchmark.
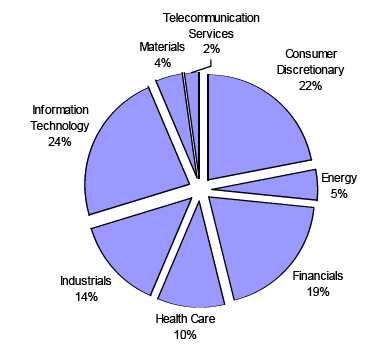
Strong stock selection made the Consumer Discretionary sector the top contributor for the first half of 2015. Portfolio holdings in the sector appreciated 11.91% in the first six months of 2015, well ahead of the benchmark sector's 1.01% return.
The Information Technology sector was also a strong performer in the first half of the year, again driven by stock selection and sector allocation. Portfolio holdings returned 6.10%, compared to 1.84% for the benchmark sector.
2015 Semi-Annual Report 2
The Energy sector was the only major detractor for the benchmark and also the largest detractor for the portfolio due to the portfolio's oil and gas holdings. The portfolio sector declined 20.35%, compared to a decline of 12.46% for the benchmark sector.
Paradigm Select Fund
The Paradigm Select Fund appreciated 5.75% in the first half of 2015, compared to 4.81% for its benchmark, the Russell 2500 Index. Since inception (January 1, 2005), on an annualized basis, the Fund returned 9.20%, compared to 8.77% for the benchmark.
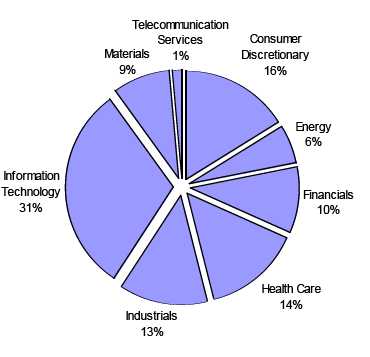
The Financials sector was the portfolio's top relative performer in the first half of the year. Portfolio holdings in the sector appreciated 8.24% in the first six months of 2015, well ahead of the benchmark sector's 2.08% return. Real estate and insurance were the largest contributors to the Fund’s outperformance.
Materials was the second-best relative sector, with portfolio holdings appreciating 9.96% in the first half of the year, compared to 0.21% for the benchmark sector. The portfolio's Metals & Mining holdings performed particularly well.
Health Care was the top-performing benchmark sector by a large margin, but the portfolio sector's 16.89% return lagged the benchmark sector's 20.89% surge, detracting 42 basis points from relative performance.
Paradigm Opportunity Fund
The Paradigm Opportunity Fund appreciated 7.09% in the first half of 2015, compared to 4.75% for its benchmark, the Russell 2000 Index. Since inception (January 1, 2005), on an annualized basis, the Fund returned 7.46%, compared to 7.86% for the benchmark.
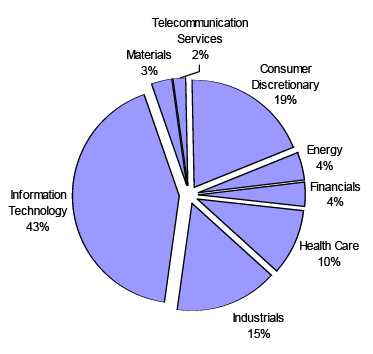
The Information Technology sector was the portfolio's top contributor in the first half of the year. Portfolio holdings in the sector appreciated 10.09%, compared to a gain of 7.67% for the benchmark sector. A significant overweight in the sector also contributed to the outperformance.
Consumer Discretionary holdings also outperformed significantly. Portfolio holdings gained 16.17%, well ahead of the benchmark sector's 4.45% gain. Stock selection in the Specialty Retail industry drove the outperformance.
Energy was the most challenging sector for the benchmark as well as the portfolio, with portfolio performance dragged down by oil & gas holdings. The portfolio sector declined 26.74%, compared to a loss of 5.28% for the benchmark sector.
Paradigm Micro-Cap Fund
The Paradigm Micro-Cap Fund appreciated 0.80% in the first half of 2015, compared to 6.03% for its benchmark, the Russell MicroCap Index. Since inception (January 1, 2008), on an annualized basis, the Fund returned 7.43%, compared to 7.51% for the benchmark.
2015 Semi-Annual Report 3
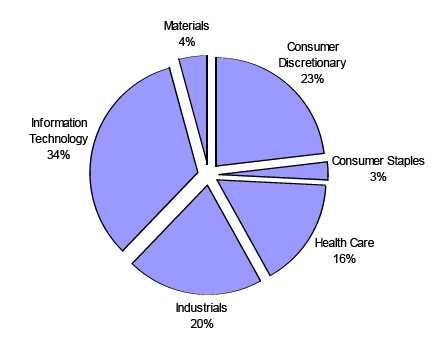
The Consumer Discretionary sector has long been an area of focus for the Fund. Portfolio holdings gained 0.49% in the first half of 2015, compared to a loss of 0.78% for the benchmark sector.
The Health Care sector, also a long-term area of expertise for the portfolio, was the largest contributor in the first half. However, the portfolio's 8.58% gain lagged the biotech-fueled benchmark sector's 20.76% surge.
Sincerely,
 ��
�� Candace King Weir | Amelia F. Weir |
2015 Semi-Annual Report 4
Paradigm Funds (Unaudited)
PARADIGM VALUE FUND
Sector Allocation as of June 30, 2015
(As a Percentage of Equity Securities Held)
PARADIGM SELECT FUND
Sector Allocation as of June 30, 2015
(As a Percentage of Equity Securities Held)
2015 Semi-Annual Report 5
Paradigm Funds (Unaudited)
PARADIGM OPPORTUNITY FUND
Sector Allocation as of June 30, 2015
(As a Percentage of Equity Securities Held)
PARADIGM MICRO-CAP FUND
Sector Allocation as of June 30, 2015
(As a Percentage of Equity Securities Held)
2015 Semi-Annual Report 6
Paradigm Value Fund (Unaudited)
PERFORMANCE INFORMATION
Average Annual Rate of Return (%) for the Periods Ended June 30, 2015.
June 30, 2015 NAV $50.89
| 1 Year(A) | 3 Year(A) | 5 Year(A) | 10 Year(A) | |||||
| Paradigm Value Fund | -0.20% | 11.18% | 12.32% | 7.95% | ||||
| Russell 2000® Value Index(B) | 0.78% | 15.50% | 14.81% | 6.87% |
(A) 1 Year, 3 Year, 5 Year and 10 Year returns include change in share prices and in each case includes reinvestment of any dividends and capital gain distributions. The inception date of the Paradigm Value Fund was January 1, 2003.
(B) The Russell 2000® Value Index (whose composition is different from the Fund) is an unmanaged index of small-capitalization stocks with lower price-to-book ratios and lower forecasted growth values than the total population of small-capitalization stocks.
For purposes of the graph and the accompanying table, it is assumed that all dividends and distributions were reinvested.
Per the Fund’s most recent prospectus, the Fund’s total annual operating expense ratio (before any fee waiver) is 1.97%, and 1.50% post waiver. The Advisor has contractually agreed to waive management fees and reimburse expenses to the extent necessary to maintain total annual operating expenses of the Fund (excluding brokerage fees and commissions, interest and other borrowing expenses, taxes, extraordinary expenses and the indirect costs of investing in Acquired Funds) at 1.50% of its average daily net assets through April 30, 2016.
PAST PERFORMANCE DOES NOT GUARANTEE FUTURE RESULTS. INVESTMENT RETURN AND PRINCIPAL VALUE WILL FLUCTUATE SO THAT SHARES, WHEN REDEEMED, MAY BE WORTH MORE OR LESS THAN THEIR ORIGINAL COST. RETURNS DO NOT REFLECT THE DEDUCTION OF TAXES THAT A SHAREHOLDER WOULD PAY ON FUND DISTRIBUTIONS OR THE REDEMPTION OF FUND SHARES. CURRENT PERFORMANCE MAY BE LOWER OR HIGHER THAT THE PERFORMANCE DATA QUOTED. TO OBTAIN PERFORMANCE DATA CURRENT TO THE MOST RECENT MONTH END, PLEASE CALL 1-800-239-0732 OR VISIT OUR WEBSITE AT www.paradigm-funds.com.
2015 Semi-Annual Report 7
Paradigm Select Fund (Unaudited)
PERFORMANCE INFORMATION
Average Annual Rate of Return (%) for the Periods Ended June 30, 2015.
June 30, 2015 NAV $34.05
| 1 Year(A) | 3 Year(A) | 5 Year(A) | 10 Year(A) | |||||
| Paradigm Select Fund | 6.71% | 15.62% | 15.95% | 9.06% | ||||
| Russell 2500® Index(B) | 5.92% | 18.66% | 17.86% | 9.09% |
(A) 1 Year, 3 Year, 5 Year and 10 Year returns include change in share prices and in each case includes reinvestment of any dividends and capital gain distributions. The inception date of the Paradigm Select Fund was January 1, 2005.
(B) The Russell 2500® Index (whose composition is different from the Fund) measures the performance of the small to mid-cap segment of the U.S. equity universe, commonly referred to as "mid" cap. The Russell 2500 Index is a subset of the Russell 3000® Index. It includes approximately 2,500 of the smallest securities based on a combination of their market cap and current index membership.
For purposes of the graph and the accompanying table, it is assumed that all dividends and distributions were reinvested.
Per the Fund’s most recent prospectus, the Fund’s total annual operating expense ratio (before any fee waiver) is 1.50%, and 1.15% post waiver. The Advisor has contractually agreed to waive management fees and reimburse expenses to the extent necessary to maintain total annual operating expenses of the Fund (excluding brokerage fees and commissions, interest and other borrowing expenses, taxes, extraordinary expenses and the indirect costs of investing in Acquired Funds) at 1.15% of its average daily net assets through April 30, 2016.
PAST PERFORMANCE DOES NOT GUARANTEE FUTURE RESULTS. INVESTMENT RETURN AND PRINCIPAL VALUE WILL FLUCTUATE SO THAT SHARES, WHEN REDEEMED, MAY BE WORTH MORE OR LESS THAN THEIR ORIGINAL COST. RETURNS DO NOT REFLECT THE DEDUCTION OF TAXES THAT A SHAREHOLDER WOULD PAY ON FUND DISTRIBUTIONS OR THE REDEMPTION OF FUND SHARES. CURRENT PERFORMANCE MAY BE LOWER OR HIGHER THAT THE PERFORMANCE DATA QUOTED. TO OBTAIN PERFORMANCE DATA CURRENT TO THE MOST RECENT MONTH END, PLEASE CALL 1-800-239-0732 OR VISIT OUR WEBSITE AT www.paradigm-funds.com.
2015 Semi-Annual Report 8
Paradigm Opportunity Fund (Unaudited)
PERFORMANCE INFORMATION
Average Annual Rate of Return (%) for the Periods Ended June 30, 2015.
June 30, 2015 NAV $35.02
| 1 Year(A) | 3 Year(A) | 5 Year(A) | 10 Year(A) | |||||
| Paradigm Opportunity Fund | 6.30% | 15.12% | 14.94% | 7.73% | ||||
| Russell 2000® Index(B) | 6.49% | 17.81% | 17.08% | 8.40% |
(A) 1 Year, 3 Year, 5 Year and 10 Year returns include change in share prices and in each case includes reinvestment of any dividends and capital gain distributions. The inception date of the Paradigm Opportunity Fund was January 1, 2005.
(B) The Russell 2000® Index (whose composition is different from the Fund) consists of the smallest 2,000 companies in the Russell 3000 Index (which represents approximately 98% of the investable U.S. equity market). The Index is an unmanaged index generally considered as the premier of small capitalization stocks.
For purposes of the graph and the accompanying table, it is assumed that all dividends and distributions were reinvested.
Per the Fund’s most recent prospectus, the Fund’s total annual operating expense ratio (before any fee waiver) is 2.01%, and 1.26% post waiver. The Advisor has contractually agreed to waive management fees and reimburse expenses to the extent necessary to maintain total annual operating expenses of the Fund (excluding brokerage fees and commissions, interest and other borrowing expenses, taxes, extraordinary expenses and the indirect costs of investing in Acquired Funds) at 1.25% of its average daily net assets through April 30, 2016.
PAST PERFORMANCE DOES NOT GUARANTEE FUTURE RESULTS. INVESTMENT RETURN AND PRINCIPAL VALUE WILL FLUCTUATE SO THAT SHARES, WHEN REDEEMED, MAY BE WORTH MORE OR LESS THAN THEIR ORIGINAL COST. RETURNS DO NOT REFLECT THE DEDUCTION OF TAXES THAT A SHAREHOLDER WOULD PAY ON FUND DISTRIBUTIONS OR THE REDEMPTION OF FUND SHARES. CURRENT PERFORMANCE MAY BE LOWER OR HIGHER THAT THE PERFORMANCE DATA QUOTED. TO OBTAIN PERFORMANCE DATA CURRENT TO THE MOST RECENT MONTH END, PLEASE CALL 1-800-239-0732 OR VISIT OUR WEBSITE AT www.paradigm-funds.com.
2015 Semi-Annual Report 9
Paradigm Micro-Cap Fund (Unaudited)
PERFORMANCE INFORMATION
Average Annual Rate of Return (%) for the Periods Ended June 30, 2015.
June 30, 2015 NAV $27.61
| Since | ||||||||
| 1 Year(A) | 3 Year(A) | 5 Year(A) | Inception(A) | |||||
| Paradigm Micro-Cap Fund | 10.73% | 15.78% | 14.88% | 7.43% | ||||
| Russell Microcap® Index(B) | 8.21% | 19.25% | 17.48% | 7.51% |
(A) 1 Year, 3 Year, 5 Year and Since Inception returns include change in share prices and in each case includes reinvestment of any dividends and capital gain distributions. The inception date of the Paradigm Micro-Cap Fund was January 1, 2008. Effective December 27, 2011, the name of the Paradigm Intrinsic Value Fund was changed to the Paradigm Micro-Cap Fund.
(B) The Russell Microcap® Index measures the performance of the microcap segment of the U.S. equity market. Microcap stocks make up less than 3% of the U.S. equity market (by market cap) and consist of the smallest 1,000 securities in the small-cap Russell 2000® Index, plus the next smallest eligible securities by market cap. The Russell Microcap is completely reconstituted annually to ensure larger stocks do not distort performance and characteristics of the true microcap opportunity set. Effective December 27, 2011 the Fund changed its investment strategy. Under normal circumstances, the Micro-Cap Fund invests at least 80% of its net assets in common stocks of U.S. micro-cap companies. Therefore, the primary comparative index was changed from the S&P 500® Index to the Russell Microcap® Index.
For purposes of the graph and the accompanying table, it is assumed that all dividends and distributions were reinvested.
Per the Fund’s most recent prospectus, the Fund’s total annual operating expense ratio is 1.25% .
PAST PERFORMANCE DOES NOT GUARANTEE FUTURE RESULTS. INVESTMENT RETURN AND PRINCIPAL VALUE WILL FLUCTUATE SO THAT SHARES, WHEN REDEEMED, MAY BE WORTH MORE OR LESS THAN THEIR ORIGINAL COST. RETURNS DO NOT REFLECT THE DEDUCTION OF TAXES THAT A SHAREHOLDER WOULD PAY ON FUND DISTRIBUTIONS OR THE REDEMPTION OF FUND SHARES. CURRENT PERFORMANCE MAY BE LOWER OR HIGHER THAT THE PERFORMANCE DATA QUOTED. TO OBTAIN PERFORMANCE DATA CURRENT TO THE MOST RECENT MONTH END, PLEASE CALL 1-800-239-0732 OR VISIT OUR WEBSITE AT www.paradigm-funds.com.
2015 Semi-Annual Report 10
| Paradigm Value Fund | |||||
| Schedule of Investments | |||||
| June 30, 2015 (Unaudited) | |||||
| Shares | Fair Value | % of Net Assets | |||
| COMMON STOCKS | |||||
| Air Courier Services | |||||
| 178,500 | Air Transport Services Group, Inc. * | $ | 1,872,465 | 2.36 | % |
| Computer Communications Equipment | |||||
| 400,000 | Extreme Networks, Inc. * | 1,076,000 | |||
| 65,700 | QLogic Corp. * | 932,283 | |||
| 2,008,283 | 2.54 | % | |||
| Construction - Special Trade Contractors | |||||
| 76,600 | Matrix Service Co. * | 1,400,248 | 1.77 | % | |
| Crude Petroleum & Natural Gas | |||||
| 291,300 | PetroQuest Energy Inc. * | 576,774 | |||
| 48,400 | Stone Energy Corporation * | 609,356 | |||
| 1,186,130 | 1.50 | % | |||
| Deep Sea Foreign Transportation of Freight | |||||
| 123,100 | Ardmore Shipping Corporation (Ireland) | 1,490,741 | 1.88 | % | |
| Electrical Work | |||||
| 41,600 | EMCOR Group Inc. | 1,987,232 | 2.51 | % | |
| Heavy Construction Other Than Building Construction - Contractors | |||||
| 36,500 | Granite Construction Incorporated | 1,296,115 | 1.63 | % | |
| Household Furniture | |||||
| 40,000 | La-Z-Boy Incorporated | 1,053,600 | 1.33 | % | |
| Industrial Organic Chemicals | |||||
| 24,600 | Sensient Technologies Corp. | 1,681,164 | 2.12 | % | |
| Laboratory Analytical Instruments | |||||
| 33,200 | PerkinElmer Inc. | 1,747,648 | 2.20 | % | |
| Metal Forgings & Stampings | |||||
| 12,900 | Park-Ohio Holdings Corp. | 625,134 | 0.79 | % | |
| Miscellaneous Electrical Machinery, Equipment & Supplies | |||||
| 153,200 | Electro Scientific Industries, Inc. | 807,364 | 1.02 | % | |
| Motor Vehicles & Passenger Car Bodies | |||||
| 80,000 | Federal Signal Corporation | 1,192,800 | 1.50 | % | |
| Motor Vehicle Parts & Accessories | |||||
| 52,600 | Tower International, Inc. * | 1,370,230 | |||
| 9,000 | Visteon Corporation * | 944,820 | |||
| 2,315,050 | 2.92 | % | |||
| National Commercial Banks | |||||
| 48,600 | First Merchants Corporation | 1,200,420 | |||
| 64,700 | National Bank Holdings Corporation | 1,347,701 | |||
| 2,548,121 | 3.21 | % | |||
| Photographic Equipment & Supplies | |||||
| 40,000 | Avid Technology, Inc. * | 533,600 | 0.67 | % | |
| Radio & TV Broadcasting & Communications Equipment | |||||
| 120,000 | Mitel Networks Corporation * (Canada) | 1,059,600 | 1.34 | % | |
| Retail - Apparel & Accessory Stores | |||||
| 112,000 | Express Inc. * | 2,028,320 | |||
| 31,400 | The Men's Wearhouse, Inc. | 2,011,798 | |||
| 4,040,118 | 5.09 | % | |||
| Retail - Family Clothing Stores | |||||
| 113,400 | American Eagle Outfitters, Inc. | 1,952,748 | 2.46 | % | |
| Retail - Retail Stores, NEC | |||||
| 26,600 | IAC/InterActiveCorp. | 2,118,956 | |||
| 50,000 | Kirkland's, Inc. * | 1,393,500 | |||
| 3,512,456 | 4.43 | % | |||
| * Non-Income Producing Securities. The accompanying notes are an integral part of these financial statements. |
2015 Semi-Annual Report 11
| Paradigm Value Fund | |||||
| Schedule of Investments | |||||
| June 30, 2015 (Unaudited) | |||||
| Shares | Fair Value | % of Net Assets | |||
| COMMON STOCKS | |||||
| Retail - Shoe Stores | |||||
| 35,000 | Foot Locker, Inc. | $ | 2,345,350 | 2.96 | % |
| Retail - Women's Clothing Stores | |||||
| 340,000 | New York & Company, Inc. * | 911,200 | 1.15 | % | |
| Rubber & Plastics Footwear | |||||
| 12,000 | Deckers Outdoor Corporation * | 863,640 | 1.09 | % | |
| Savings Institution, Federally Chartered | |||||
| 51,800 | LegacyTexas Financial Group, Inc. | 1,564,360 | |||
| 189,242 | United Financial Bancorp | 2,545,305 | |||
| 4,109,665 | 5.18 | % | |||
| Semiconductors & Related Devices | |||||
| 49,300 | Kulicke & Soffa Industries Inc. * (Singapore) | 577,303 | |||
| 61,600 | Microsemi Corporation * | 2,152,920 | |||
| 26,100 | Qorvo, Inc. * | 2,095,047 | |||
| 4,825,270 | 6.08 | % | |||
| Services - Business Services, NEC | |||||
| 169,600 | Premiere Global Services Inc. * | 1,745,184 | |||
| 34,300 | Rightside Group, Ltd. * | 232,211 | |||
| 1,977,395 | 2.49 | % | |||
| Services - Computer Integrated Systems Design | |||||
| 100,000 | Allscripts Healthcare Solutions, Inc. * | 1,368,000 | |||
| 73,500 | Convergys Corp. | 1,873,515 | |||
| 3,241,515 | 4.09 | % | |||
| Services - Computer Processing & Data Preparation | |||||
| 33,800 | Demand Media, Inc. * | 214,968 | 0.27 | % | |
| Services - Help Supply Services | |||||
| 72,300 | Kforce Inc. | 1,653,501 | 2.09 | % | |
| Services - Hospitals | |||||
| 26,500 | Magellan Health Services Inc. * | 1,856,855 | |||
| 28,800 | MEDNAX, Inc. * | 2,134,368 | |||
| 3,991,223 | 5.03 | % | |||
| Services - Management Services | |||||
| 80,000 | Accretive Health, Inc. * | 440,000 | 0.55 | % | |
| Services - Motion Picture Theaters | |||||
| 73,100 | Regal Entertainment Group Class A | 1,528,521 | 1.93 | % | |
| Services - Personal Services | |||||
| 20,000 | Steiner Leisure Limited * (Bahamas) | 1,075,600 | 1.36 | % | |
| Special Industry Machinery, NEC | |||||
| 154,200 | Brooks Automation, Inc. | 1,765,590 | |||
| 100,000 | Mattson Technology, Inc. * | 335,000 | |||
| 2,100,590 | 2.65 | % | |||
| State Commercial Banks | |||||
| 34,900 | Banner Corporation | 1,672,757 | |||
| 40,000 | Renasant Corporation | 1,304,000 | |||
| 2,976,757 | 3.76 | % | |||
| Steel Works, Blast Furnaces & Rolling Mills (Coke Ovens) | |||||
| 70,000 | Commercial Metals Company | 1,125,600 | 1.42 | % | |
| Telegraph & Other Message Communications | |||||
| 32,000 | j2 Global, Inc. | 2,174,080 | 2.74 | % | |
| Telephone & Telegraph Apparatus | |||||
| 41,600 | Polycom, Inc. * | 475,904 | 0.60 | % | |
| Transportation Services | |||||
| 21,500 | GATX Corp. | 1,142,725 | 1.44 | % | |
| * Non-Income Producing Securities. The accompanying notes are an integral part of these financial statements. |
2015 Semi-Annual Report 12
| Paradigm Value Fund | ||||||
| Schedule of Investments | ||||||
| June 30, 2015 (Unaudited) | ||||||
| Shares | Fair Value | % of Net Assets | ||||
| COMMON STOCKS | ||||||
| Trucking (No Local) | ||||||
| 46,323 | Quality Distribution, Inc. * | $ | 716,153 | 0.90 | % | |
| Wholesale - Petroleum & Petroleum Products (No Bulk Stations) | ||||||
| 29,000 | Aegean Marine Petroleum Network Inc. | 358,440 | 0.45 | % | ||
| Total for Common Stocks (Cost 49,987,130) | $ | 72,558,714 | 91.50 | % | ||
| REAL ESTATE INVESTMENT TRUSTS | ||||||
| 54,300 | Blackstone Mortgage Trust, Inc. - Class A | 1,510,626 | ||||
| 53,975 | Gramercy Property Trust Inc. | 1,261,396 | ||||
| 23,500 | Mid-America Apartment Communities Inc. | 1,711,035 | ||||
| 17,000 | PennyMac Mortgage Investment Trust | 296,310 | ||||
| Total for Real Estate Investment Trusts (Cost $3,754,072) | 4,779,367 | 6.03 | % | |||
| MONEY MARKET FUNDS | ||||||
| 1,017,423 | SEI Daily Income Treasury Government CL B 0.02% ** | 1,017,423 | 1.28 | % | ||
| (Cost $1,017,423) | ||||||
| Total Investment Securities | 78,355,504 | 98.81 | % | |||
| (Cost $54,758,625) | ||||||
| Other Assets in Excess of Liabilities | 945,542 | 1.19 | % | |||
| Net Assets | $ | 79,301,046 | 100.00 | % | ||
| * Non-Income Producing Securities. ** Variable Rate Security; the rate shown was the rate at June 30, 2015. The accompanying notes are an integral part of these financial statements. |
2015 Semi-Annual Report 13
| Paradigm Select Fund | |||||
| Schedule of Investments | |||||
| June 30, 2015 (Unaudited) | |||||
| Shares | Fair Value | % of Net Assets | |||
| COMMON STOCKS | |||||
| Aircraft & Parts | |||||
| 1,900 | Triumph Group, Inc. | $ | 125,381 | 2.07 | % |
| Chemical & Allied Products | |||||
| 1,200 | Innospec Inc. | 54,048 | |||
| 1,500 | Olin Corp. | 40,425 | |||
| 94,473 | 1.56 | % | |||
| Computer Communications Equipment | |||||
| 7,700 | Brocade Communications Systems, Inc. | 91,476 | 1.51 | % | |
| Construction - Special Trade Contractors | |||||
| 5,000 | Matrix Service Co. * | 91,400 | 1.51 | % | |
| Crude Petroleum & Natural Gas | |||||
| 2,800 | Approach Resources Inc. * | 19,180 | |||
| 9,900 | PetroQuest Energy Inc. * | 19,602 | |||
| 2,500 | Stone Energy Corporation * | 31,475 | |||
| 700 | Whiting Petroleum Corp. * | 23,520 | |||
| 93,777 | 1.55 | % | |||
| Electrical Work | |||||
| 1,425 | EMCOR Group Inc. | 68,072 | 1.12 | % | |
| Electromedical & Electrotherapeutic Apparatus | |||||
| 4,100 | Masimo Corporation * | 158,834 | 2.62 | % | |
| Electronic Computers | |||||
| 3,000 | Cray Inc. * | 88,530 | 1.46 | % | |
| Fire, Marine & Casualty Insurance | |||||
| 150 | Alleghany Corporation * | 70,314 | |||
| 1,300 | American Financial Group Inc. | 84,552 | |||
| 2,000 | Aspen Insurance Holdings Limited (Bermuda) | 95,800 | |||
| 1,500 | Montpelier Re Holdings Ltd. (Bermuda) | 59,250 | |||
| 309,916 | 5.11 | % | |||
| Footwear (No Rubber) | |||||
| 3,000 | Caleres, Inc. | 95,340 | 1.57 | % | |
| Household Furniture | |||||
| 3,700 | La-Z-Boy Incorporated | 97,458 | 1.61 | % | |
| Industrial Organic Chemicals | |||||
| 1,400 | Sensient Technologies Corporation | 95,676 | |||
| 1,100 | Westlake Chemical Corp. | 75,449 | |||
| 171,125 | 2.82 | % | |||
| Instruments For Measurement & Testing of Electricity & Electric Signals | |||||
| 5,200 | Teradyne, Inc. | 100,308 | 1.65 | % | |
| Laboratory Analytical Instruments | |||||
| 2,700 | PerkinElmer Inc. | 142,128 | 2.34 | % | |
| Miscellaneous Business Credit Institution | |||||
| 1,500 | PHH Corporation * | 39,045 | 0.64 | % | |
| Miscellaneous Manufacturing Industries | |||||
| 2,400 | Hillenbrand, Inc. | 73,680 | 1.21 | % | |
| Mortgage Bankers & Loan Correspondents | |||||
| 2,300 | Walter Investment Management Corp. * | 52,601 | 0.87 | % | |
| Motor Vehicle Parts & Accessories | |||||
| 1,100 | Remy International, Inc. | 24,321 | |||
| 600 | Visteon Corporation * | 62,988 | |||
| 87,309 | 1.44 | % | |||
| Periodicals: Publishing or Publishing & Printing | |||||
| 7,500 | Rovi Corporation * | 119,625 | 1.97 | % | |
| * Non-Income Producing Securities. The accompanying notes are an integral part of these financial statements. |
2015 Semi-Annual Report 14
| Paradigm Select Fund | |||||
| Schedule of Investments | |||||
| June 30, 2015 (Unaudited) | |||||
| Shares | Fair Value | % of Net Assets | |||
| COMMON STOCKS | |||||
| Petroleum Refining | |||||
| 2,200 | Delek US Holdings, Inc. | $ | 81,004 | ||
| 1,800 | Western Refining, Inc. | 78,516 | |||
| 159,520 | 2.63 | % | |||
| Plastics Products | |||||
| 1,300 | AptarGroup Inc. | 82,901 | 1.37 | % | |
| Printed Circuit Boards | |||||
| 3,900 | Jabil Circuit, Inc. | 83,031 | 1.37 | % | |
| Retail - Apparel & Accessory Stores | |||||
| 5,400 | Express Inc. * | 97,794 | |||
| 1,700 | The Men's Wearhouse, Inc. | 108,919 | |||
| 206,713 | 3.41 | % | |||
| Retail - Family Clothing Stores | |||||
| 6,700 | American Eagle Outfitters, Inc. | 115,374 | 1.90 | % | |
| Retail - Radio, TV & Consumer Electronics Stores | |||||
| 2,400 | Best Buy Co., Inc. | 78,264 | 1.29 | % | |
| Retail - Retail Stores, NEC | |||||
| 1,500 | IAC/InterActiveCorp. | 119,490 | 1.97 | % | |
| Retail - Shoe Stores | |||||
| 1,900 | Foot Locker, Inc. | 127,319 | 2.10 | % | |
| Rolling Drawing & Extruding of Nonferrous Metals | |||||
| 4,500 | RTI International Metals, Inc. * | 141,840 | 2.34 | % | |
| Rubber & Plastics Footwear | |||||
| 800 | Deckers Outdoor Corporation * | 57,576 | 0.95 | % | |
| Semiconductors & Related Devices | |||||
| 3,700 | Finisar Corporation * | 66,119 | |||
| 3,900 | Kulicke & Soffa Industries Inc. * (Singapore) | 45,669 | |||
| 5,100 | Marvell Technology Group Ltd. (Bermuda) | 67,243 | |||
| 4,300 | Microsemi Corporation * | 150,285 | |||
| 1,600 | Qorvo, Inc. * | 128,432 | |||
| 1,500 | Skyworks Solutions, Inc. | 156,150 | |||
| 613,898 | 10.12 | % | |||
| Services - Auto Rental & Leasing | |||||
| 800 | Ryder System, Inc. | 69,896 | 1.15 | % | |
| Services - Business Services, NEC | |||||
| 6,100 | Premiere Global Services Inc. * | 62,769 | 1.04 | % | |
| Services - Computer Integrated Systems Design | |||||
| 6,600 | Allscripts Healthcare Solutions, Inc. * | 90,288 | |||
| 3,800 | Convergys Corp. | 96,862 | |||
| 6,100 | Datalink Corporation * | 54,534 | |||
| 241,684 | 3.99 | % | |||
| Services - Help Supply Services | |||||
| 3,600 | Kelly Services, Inc. - Class A | 55,260 | |||
| 4,300 | Kforce Inc. | 98,341 | |||
| 153,601 | 2.53 | % | |||
| Services - Hospitals | |||||
| 1,525 | Magellan Health Services Inc. * | 106,857 | |||
| 1,500 | MEDNAX, Inc. * | 111,165 | |||
| 218,022 | 3.60 | % | |||
| Services - Motion Picture Theaters | |||||
| 4,600 | Regal Entertainment Group Class A | 96,186 | 1.59 | % | |
| Services - Prepackaged Software | |||||
| 2,600 | Progress Software Corporation * | 71,500 | 1.18 | % | |
| * Non-Income Producing Securities. The accompanying notes are an integral part of these financial statements. |
2015 Semi-Annual Report 15
| Paradigm Select Fund | ||||||
| Schedule of Investments | ||||||
| June 30, 2015 (Unaudited) | ||||||
| Shares | Fair Value | % of Net Assets | ||||
| COMMON STOCKS | ||||||
| Steel Pipe & Tubes | ||||||
800 | Allegheny Technologies Incorporated | $ | 24,160 | 0.40 | % | |
| Steel Works, Blast Furnaces & Rolling Mills (Coke Ovens) | ||||||
600 | Carpenter Technology Corporation | 23,208 | ||||
5,000 | Commercial Metals Company | 80,400 | ||||
| 103,608 | 1.71 | % | ||||
| Surgical & Medical Instruments & Apparatus | ||||||
| 5,625 | Globus Medical, Inc. * | 144,394 | ||||
| 2,000 | NuVasive, Inc. * | 94,760 | ||||
| 239,154 | 3.94 | % | ||||
| Telegraph & Other Message Communications | ||||||
1,900 | j2 Global, Inc. | 129,086 | 2.13 | % | ||
| Telephone & Telegraph Apparatus | ||||||
| 4,000 | Fabrinet * (Thailand) | 74,920 | ||||
| 7,300 | Polycom, Inc. * | 83,512 | ||||
| 158,432 | 2.61 | % | ||||
| Title Insurance | ||||||
| 1,900 | Fidelity National Financial, Inc. | 70,281 | ||||
| 700 | Fidelity National Financial Ventures * | 10,766 | ||||
| 81,047 | 1.33 | % | ||||
| Transportation Services | ||||||
1,300 | GATX Corporation | 69,095 | 1.14 | % | ||
| Wholesale - Computers & Peripheral Equipment & Software | ||||||
1,100 | SYNNEX Corporation | 80,509 | 1.33 | % | ||
| Wholesale - Electrical Apparatus & Equipment, Wiring Supplies | ||||||
800 | EnerSys | 56,232 | 0.93 | % | ||
| Wholesale - Lumber & Other Construction Materials | ||||||
1,200 | Boise Cascade Company * | 44,016 | 0.72 | % | ||
| Total for Common Stocks (Cost $3,909,460) | $ | 5,785,401 | 95.40 | % | ||
| REAL ESTATE INVESTMENT TRUSTS | ||||||
1,400 | Mid-America Apartment Communities Inc. | 101,934 | 1.67 | % | ||
| Total for Real Estate Investment Trusts (Cost $73,803) | ||||||
| MONEY MARKET FUNDS | ||||||
| 79,212 | SEI Daily Income Treasury Government CL B 0.02% ** | 79,212 | 1.31 | % | ||
| (Cost $79,212) | ||||||
| Total Investment Securities | 5,966,547 | 98.38 | % | |||
| (Cost $4,062,475) | ||||||
| Other Assets in Excess of Liabilities | 98,027 | 1.62 | % | |||
| Net Assets | $ | 6,064,574 | 100.00 | % | ||
| * Non-Income Producing Securities. ** Variable Rate Security; the rate shown was the rate at June 30, 2015. The accompanying notes are an integral part of these financial statements. |
2015 Semi-Annual Report 16
| Paradigm Opportunity Fund | |||||
| Schedule of Investments | |||||
| June 30, 2015 (Unaudited) | |||||
| Shares | Fair Value | % of Net Assets | |||
| COMMON STOCKS | |||||
| Aircraft & Parts | |||||
| 2,200 | Triumph Group, Inc. | $ | 145,178 | 2.05 | % |
| Construction - Special Trade Contractors | |||||
| 8,600 | Matrix Service Co. * | 157,208 | 2.22 | % | |
| Crude Petroleum & Natural Gas | |||||
| 35,800 | PetroQuest Energy Inc. * | 70,884 | |||
| 5,875 | Stone Energy Corporation * | 73,966 | |||
| 144,850 | 2.05 | % | |||
| Electrical Work | |||||
| 2,825 | EMCOR Group Inc. | 134,950 | 1.91 | % | |
| Gold and Silver Ores | |||||
| 10,275 | First Majestic Silver Corp * (Canada) | 49,628 | 0.70 | % | |
| Industrial Organic Chemicals | |||||
| 2,650 | Sensient Technologies Corporation | 181,101 | 2.56 | % | |
| Instruments For Measurement & Testing of Electricity & Electric Signals | |||||
| 7,075 | Teradyne, Inc. | 136,477 | 1.93 | % | |
| Laboratory Analytical Instruments | |||||
| 2,725 | PerkinElmer Inc. | 143,444 | 2.03 | % | |
| Metal Forgings & Stampings | |||||
| 2,300 | Park-Ohio Holdings Corp. | 111,458 | 1.58 | % | |
| Miscellaneous Electrical Machinery, Equipment & Supplies | |||||
| 27,800 | Electro Scientific Industries, Inc. | 146,506 | 2.07 | % | |
| Miscellaneous Manufacturing Industries | |||||
| 5,500 | Hillenbrand, Inc. | 168,850 | 2.39 | % | |
| Orthopedic, Prosthetic & Surgical Appliances & Supplies | |||||
| 2,950 | Symmetry Medical, Inc. * | 25,724 | 0.36 | % | |
| Periodicals: Publishing or Publishing & Printing | |||||
| 13,400 | Rovi Corporation * | 213,730 | 3.02 | % | |
| Retail - Apparel & Accessory Stores | |||||
| 9,475 | Express Inc. * | 171,593 | |||
| 4,375 | The Men's Wearhouse, Inc. | 280,306 | |||
| 451,899 | 6.38 | % | |||
| Retail - Department Stores | |||||
| 1,400 | Dillard's, Inc. - Class A | 147,266 | 2.08 | % | |
| Retail - Family Clothing Stores | |||||
| 11,700 | American Eagle Outfitters, Inc. | 201,474 | 2.85 | % | |
| Retail - Retail Stores, NEC | |||||
| 3,350 | IAC/InterActiveCorp. | 266,861 | 3.77 | % | |
| Retail - Shoe Stores | |||||
| 4,125 | Foot Locker, Inc. | 276,416 | 3.91 | % | |
| Rolling Drawing & Extruding of Nonferrous Metals | |||||
| 7,475 | RTI International Metals, Inc. * | 235,612 | 3.33 | % | |
| Semiconductors & Related Devices | |||||
| 6,425 | Kulicke & Soffa Industries Inc. * (Singapore) | 75,237 | |||
| 5,700 | Marvell Technology Group Ltd. (Bermuda) | 75,154 | |||
| 9,500 | Microsemi Corporation * | 332,025 | |||
| 4,200 | Qorvo, Inc. * | 337,134 | |||
| 3,300 | Skyworks Solutions, Inc. | 343,530 | |||
| 1,163,080 | 16.43 | % | |||
| Services - Business Services, NEC | |||||
| 13,025 | Premiere Global Services Inc. * | 134,027 | |||
| 2,035 | Rightside Group, Ltd. * | 13,777 | |||
| 147,804 | 2.08 | % | |||
| * Non-Income Producing Securities. The accompanying notes are an integral part of these financial statements. |
2015 Semi-Annual Report 17
| Paradigm Opportunity Fund | ||||||
| Schedule of Investments | ||||||
| June 30, 2015 (Unaudited) | ||||||
| Shares | Fair Value | % of Net Assets | ||||
| COMMON STOCKS | ||||||
| Services - Computer Integrated Systems Design | ||||||
| 8,850 | Convergys Corp. | $ | 225,587 | 3.19 | % | |
| Services - Computer Processing & Data Preparation | ||||||
| 2,035 | Demand Media, Inc. * | 12,943 | 0.18 | % | ||
| Services - Help Supply Services | ||||||
| 7,600 | Kelly Services, Inc. | 116,660 | 1.65 | % | ||
| Services - Hospitals | ||||||
| 3,150 | Magellan Health Services Inc. * | 220,721 | ||||
| 2,050 | MEDNAX, Inc. * | 151,925 | ||||
| 372,646 | 5.27 | % | ||||
| Services - Motion Picture Theaters | ||||||
| 11,475 | Regal Entertainment Group Class A | 239,942 | 3.39 | % | ||
| Services - Prepackaged Software | ||||||
| 6,700 | Progress Software Corporation * | 184,250 | 2.60 | % | ||
| Special Industry Machinery (No Metalworking Machinery) | ||||||
| 2,000 | Kadant Inc. | 94,400 | 1.33 | % | ||
| Special Industry Machinery, NEC | ||||||
| 17,625 | Brooks Automation, Inc. | 201,806 | 2.85 | % | ||
| Surgical & Medical Instruments & Apparatus | ||||||
| 5,125 | AtriCure, Inc. * | 126,280 | 1.78 | % | ||
| Telegraph & Other Message Communications | ||||||
| 4,175 | j2 Global, Inc. | 283,650 | 4.01 | % | ||
| Telephone & Telegraph Apparatus | ||||||
| 12,900 | Polycom, Inc. * | 147,576 | 2.09 | % | ||
| Total for Common Stocks (Cost $4,384,002) | $ | 6,655,256 | 94.04 | % | ||
| REAL ESTATE INVESTMENT TRUSTS | ||||||
| 3,275 | Mid-America Apartment Communities Inc. | 238,453 | ||||
| Total for Real Estate Investment Trusts (Cost $143,671) | 238,453 | 3.37 | % | |||
| MONEY MARKET FUNDS | ||||||
| 178,846 | SEI Daily Income Treasury Government CL B 0.02% ** | 178,846 | 2.53 | % | ||
| (Cost $178,846) | ||||||
| Total Investment Securities | 7,072,555 | 99.94 | % | |||
| (Cost $4,706,519) | ||||||
| Other Assets in Excess of Liabilities | 3,930 | 0.06 | % | |||
| Net Assets | $ | 7,076,485 | 100.00 | % | ||
| * Non-Income Producing Securities. ** Variable Rate Security; the rate shown was the rate at June 30, 2015. The accompanying notes are an integral part of these financial statements. |
2015 Semi-Annual Report 18
| Paradigm Micro-Cap Fund | |||||
| Schedule of Investments | |||||
| June 30, 2015 (Unaudited) | |||||
| Shares | Fair Value | % of Net Assets | |||
| COMMON STOCKS | |||||
| Aircraft Parts & Auxiliary Equipment, NEC | |||||
| 60,000 | Ducommun Incorporated * | $ | 1,540,200 | ||
| 40,000 | LMI Aerospace, Inc. * | 400,400 | |||
| 1,940,600 | 4.60 | % | |||
| Carpets & Rugs | |||||
| 30,000 | The Dixie Group, Inc. * | 315,000 | 0.75 | % | |
| Computer Communications Equipment | |||||
| 250,000 | Extreme Networks, Inc. * | 672,500 | 1.60 | % | |
| Electromedical & Electrotherapeutic Apparatus | |||||
| 120,000 | Synergetics USA, Inc. * | 564,000 | 1.34 | % | |
| Electronic Computers | |||||
| 36,600 | Omnicell, Inc. * | 1,380,186 | |||
| 80,000 | Silicon Graphics International Corp. * | 517,600 | |||
| 1,897,786 | 4.50 | % | |||
| Footwear (No Rubber) | |||||
| 30,000 | Caleres, Inc. | 953,400 | 2.26 | % | |
| Guided Missiles & Space Vehicles & Parts | |||||
| 100,000 | Kratos Defense & Security Solutions, Inc. * | 630,000 | 1.50 | % | |
| Household Furniture | |||||
| 30,000 | La-Z-Boy Incorporated | 790,200 | 1.88 | % | |
| Instruments for Measuring & Testing of Electricity & Electric Signals | |||||
| 130,000 | Xcerra Corporation * | 984,100 | 2.34 | % | |
| Millwood, Veneer, Plywood, & Structural Wood Members | |||||
| 101,400 | Ply Gem Holdings, Inc. * | 1,195,506 | 2.84 | % | |
| Miscellaneous Manufacturing Industries | |||||
| 200,000 | Summer Infant, Inc. * | 404,000 | 0.96 | % | |
| Motor Vehicles & Passenger Car Bodies | |||||
| 80,000 | Federal Signal Corporation | 1,192,800 | 2.83 | % | |
| Orthopedic, Prosthetic & Surgical Appliances & Supplies | |||||
| 140,000 | RTI Surgical, Inc. * | 904,400 | 2.15 | % | |
| Paper Mills | |||||
| 40,000 | KapStone Paper and Packaging Corporation | 924,800 | 2.20 | % | |
| Pharmaceutical Preparations | |||||
| 80,000 | Nature's Sunshine Products | 1,100,000 | 2.61 | % | |
| Photographic Equipment & Supplies | |||||
| 130,900 | Avid Technology, Inc. * | 1,746,206 | 4.15 | % | |
| Printed Circuit Boards | |||||
| 150,000 | TTM Technologies, Inc. * | 1,498,500 | 3.56 | % | |
| Radio & TV Broadcasting & Communications Equipment | |||||
| 120,000 | Mitel Networks Corporation * (Canada) | 1,059,600 | 2.52 | % | |
| Retail - Apparel & Accessory Stores | |||||
| 90,000 | Francesca’s Holdings Corporation * | 1,212,300 | |||
| 260,000 | Pacific Sunwear of California, Inc. * | 296,400 | |||
| 1,508,700 | 3.58 | % | |||
| Retail - Family Clothing Stores | |||||
| 80,000 | Stage Stores, Inc. | 1,402,400 | |||
| 120,000 | Stein Mart, Inc. | 1,256,400 | |||
| 2,658,800 | 6.30 | % | |||
| Retail - Retail Stores, NEC | |||||
| 30,000 | Kirkland's, Inc. * | 836,100 | 1.99 | % | |
| Retail - Women's Clothing Stores | |||||
| 86,800 | Christopher & Banks Corporation * | 348,068 | |||
| 360,000 | New York & Company, Inc. * | 964,800 | |||
| 1,312,868 | 3.12 | % | |||
| * Non-Income Producing Securities. The accompanying notes are an integral part of these financial statements. |
2015 Semi-Annual Report 19
| Paradigm Micro-Cap Fund | |||||||
| Schedule of Investments | |||||||
| June 30, 2015 (Unaudited) | |||||||
| Shares | Fair Value | % of Net Assets | |||||
| COMMON STOCKS | |||||||
| Semiconductors & Related Devices | |||||||
| 100,000 | EMCORE Corporation * | $ | 602,000 | ||||
| 240,000 | Lattice Semiconductors Corporation * | 1,413,600 | |||||
| 120,000 | MaxLinear, Inc. * | 1,452,000 | |||||
| 101,000 | Ultra Clean Holdings, Inc. * | 629,230 | |||||
| 4,096,830 | 9.72 | % | |||||
| Services - Computer Integrated Systems Design | |||||||
| 80,000 | Allscripts Healthcare Solutions, Inc. * | 1,094,400 | |||||
| 100,000 | Datalink Corporation * | 894,000 | |||||
| 1,988,400 | 4.72 | % | |||||
| Services - Equipment Rental & Leasing, NEC | |||||||
| 40,000 | Neff Corporation * | 403,600 | 0.96 | % | |||
| Services - Management Services | |||||||
| 220,000 | Accretive Health, Inc. * | 1,210,000 | 2.87 | % | |||
| Services - Personal Services | |||||||
| 15,000 | Steiner Leisure Limited * (Bahamas) | 806,700 | 1.92 | % | |||
| Services - Prepackaged Software | |||||||
| 30,000 | Imprivata, Inc. * | 490,800 | 1.17 | % | |||
| Special Industry Machinery (No Metalworking Machinery) | |||||||
| 15,000 | Kadant Inc. | 708,000 | 1.68 | % | |||
| Special Industry Machinery, NEC | |||||||
| 300,000 | Mattson Technology, Inc. * | 1,005,000 | 2.39 | % | |||
| Steel Works, Blast Furnaces Rolling Mills (Coke Ovens) | |||||||
| 40,000 | Commercial Metals Company | 643,200 | 1.53 | % | |||
| Steel Works, Blast Furnaces & Rolling & Finishing Materials | |||||||
| 110,000 | Insteel Industries, Inc. | 2,057,000 | 4.88 | % | |||
| Surgical & Medical Instruments & Apparatus | |||||||
| 400,000 | Alphatec Holdings, Inc. * | 552,000 | |||||
| 30,000 | Globus Medical, Inc. - Class A * | 770,100 | |||||
| 1,322,100 | 3.14 | % | |||||
| Telephone & Telegraph Apparatus | |||||||
| 160,000 | Shoretel, Inc. * | 1,084,800 | 2.58 | % | |||
| Women's, Misses', and Juniors Outerwear | |||||||
| 41,200 | bebe stores, inc. | 82,400 | 0.20 | % | |||
| Total for Common Stocks (Cost $39,405,532) | $ | 40,988,696 | 97.34 | % | |||
| MONEY MARKET FUNDS | |||||||
| 1,808,771 | SEI Daily Income Treasury Government CL B 0.02% ** | 1,808,771 | 4.30 | % | |||
| (Cost $1,808,771) | |||||||
| Total Investment Securities | 42,797,467 | 101.64 | % | ||||
| (Cost $41,214,303) | |||||||
| Liabilities in Excess of Other Assets | (690,516 | ) | -1.64 | % | |||
| Net Assets | $ | 42,106,951 | 100.00 | % | |||
| * Non-Income Producing Securities. ** Variable Rate Security; the rate shown was the rate at June 30, 2015. The accompanying notes are an integral part of these financial statements. |
2015 Semi-Annual Report 20
| Paradigm Funds | |||||||
| Statements of Assets and Liabilities (Unaudited) | Value | Select | |||||
| June 30, 2015 | Fund | Fund | |||||
| Assets: | |||||||
| Investment Securities at Fair Value* | $ | 78,355,504 | $ | 5,966,547 | |||
| Cash | - | 320 | |||||
| Receivable for Fund Shares Sold | 949 | - | |||||
| Receivable for Securities Sold | 1,610,179 | 112,519 | |||||
| Dividends Receivable | 57,744 | 1,743 | |||||
| Interest Receivable | 23 | 1 | |||||
| Total Assets | 80,024,399 | 6,081,130 | |||||
| Liabilities: | |||||||
| Payable for Fund Shares Redeemed | 41,340 | - | |||||
| Payable for Securities Purchased | 575,460 | 10,137 | |||||
| Payable to Advisor | 106,553 | 6,419 | |||||
| Total Liabilities | 723,353 | 16,556 | |||||
| Net Assets | $ | 79,301,046 | $ | 6,064,574 | |||
| Net Assets Consist of: | |||||||
| Paid In Capital | $ | 48,645,723 | $ | 3,807,606 | |||
| Accumulated Net Investment Loss | (23,109 | ) | (3,164 | ) | |||
| Accumulated Undistributed Realized Gain on Investments - Net | 7,081,553 | 356,060 | |||||
| Unrealized Appreciation in Value of Investment Securities - Net | 23,596,879 | 1,904,072 | |||||
| Net Assets | $ | 79,301,046 | $ | 6,064,574 | |||
| Net Asset Value and Offering Price (Note 2) | $ | 50.89 | $ | 34.05 | |||
| * Investments at Identified Cost | $ | 54,758,625 | $ | 4,062,475 | |||
| Shares Outstanding (Unlimited number of shares | 1,558,400 | 178,103 | |||||
| authorized without par value) | |||||||
| Statements of Operations (Unaudited) | |||||||
| For the six month period ended June 30, 2015 | |||||||
| Investment Income: | |||||||
| Dividends (Net of foreign withholding taxes** of $0 and $0, respectively) | $ | 606,038 | $ | 33,394 | |||
| Interest | 198 | 20 | |||||
| Total Investment Income | 606,236 | 33,414 | |||||
| Expenses: | |||||||
| Investment Advisor Fees | 839,127 | 47,889 | |||||
| Total Expenses | 839,127 | 47,889 | |||||
| Less: Expenses Waived | (209,782 | ) | (11,174 | ) | |||
| Net Expenses | 629,345 | 36,715 | |||||
| Net Investment Loss | (23,109 | ) | (3,301 | ) | |||
| Realized and Unrealized Gain on Investments: | |||||||
| Net Realized Gain on Investments | 7,706,771 | 392,196 | |||||
| Net Change in Unrealized Appreciation on Investments | (3,649,498 | ) | (21,499 | ) | |||
| Net Realized and Unrealized Gain on Investments | 4,057,273 | 370,697 | |||||
| Net Increase in Net Assets from Operations | $ | 4,034,164 | $ | 367,396 | |||
| ** Foreign withholding taxes on foreign dividends have been provid- ed for in accordance with the Funds’ understanding of the applica- ble country's tax rules and rates. The accompanying notes are an integral part of these financial statements. |
2015 Semi-Annual Report 21
| Paradigm Funds | |||||||
| Statements of Assets and Liabilities (Unaudited) | Opportunity | Micro-Cap | |||||
| June 30, 2015 | Fund | Fund | |||||
| Assets: | |||||||
| Investment Securities at Fair Value* | $ | 7,072,555 | $ | 42,797,467 | |||
| Cash | - | 258,728 | |||||
| Receivable for Securities Sold | 36,400 | - | |||||
| Dividends Receivable | 1,134 | 15,100 | |||||
| Interest Receivable | 5 | 36 | |||||
| Total Assets | 7,110,094 | 43,071,331 | |||||
| Liabilities: | |||||||
| Payable for Fund Shares Redeemed | 3,025 | - | |||||
| Payable for Securities Purchased | 22,526 | 917,871 | |||||
| Payable to Advisor | 8,058 | 46,509 | |||||
| Total Liabilities | 33,609 | 964,380 | |||||
| Net Assets | $ | 7,076,485 | $ | 42,106,951 | |||
| Net Assets Consist of: | |||||||
| Paid In Capital | $ | 4,613,457 | $ | 38,115,775 | |||
| Accumulated Net Investment Loss | (11,212 | ) | (63,596 | ) | |||
| Accumulated Undistributed Realized Gain on Investments - Net | 108,204 | 2,471,608 | |||||
| Unrealized Appreciation in Value of Investment Securities - Net | 2,366,036 | 1,583,164 | |||||
| Net Assets | $ | 7,076,485 | $ | 42,106,951 | |||
| Net Asset Value and Offering Price (Note 2) | $ | 35.02 | $ | 27.61 | |||
| * Investments at Identified Cost | $ | 4,706,519 | $ | 41,214,303 | |||
| Shares Outstanding (Unlimited number of shares | 202,085 | 1,525,179 | |||||
| authorized without par value) | |||||||
| Statements of Operations (Unaudited) | |||||||
| For the six month period ended June 30, 2015 | |||||||
| Investment Income: | |||||||
| Dividends (Net of foreign withholding taxes** of $0 and $0, respectively) | $ | 32,968 | $ | 132,940 | |||
| Interest | 53 | 199 | |||||
| Total Investment Income | 33,021 | 133,139 | |||||
| Expenses: | |||||||
| Investment Advisor Fees | 70,773 | 196,735 | |||||
| Total Expenses | 70,773 | 196,735 | |||||
| Less: Expenses Waived | (26,540 | ) | - | ||||
| Net Expenses | 44,233 | 196,735 | |||||
| Net Investment Loss | (11,212 | ) | (63,596 | ) | |||
| Realized and Unrealized Gain (Loss) on Investments: | |||||||
| Net Realized Gain on Investments | 147,007 | 2,474,460 | |||||
| Net Change in Unrealized Appreciation on Investments | 341,423 | (2,588,415 | ) | ||||
| Net Realized and Unrealized Gain (Loss) on Investments | 488,430 | (113,955 | ) | ||||
| Net Increase (Decrease) in Net Assets from Operations | $ | 477,218 | $ | (177,551 | ) | ||
| ** Foreign withholding taxes on foreign dividends have been provid- ed for in accordance with the Funds’ understanding of the applica- ble country's tax rules and rates. The accompanying notes are an integral part of these financial statements. |
2015 Semi-Annual Report 22
| Paradigm Funds | ||||||||||||||||
| Statements of Changes in Net Assets | Value Fund | Select Fund | ||||||||||||||
| (Unaudited) | (Unaudited) | |||||||||||||||
| 1/1/2015 | 1/1/2014 | 1/1/2015 | 1/1/2014 | |||||||||||||
| to | to | to | to | |||||||||||||
| 6/30/2015 | 12/31/2014 | 6/30/2015 | 12/31/2014 | |||||||||||||
| From Operations: | ||||||||||||||||
| Net Investment Income (Loss) | $ | (23,109 | ) | $ | (107,161 | ) | $ | (3,301 | ) | $ | 137 | |||||
| Net Realized Gain on Investments | 7,706,771 | 18,526,403 | 392,196 | 1,307,264 | ||||||||||||
| Change in Net Unrealized Appreciation | (3,649,498 | ) | (15,116,940 | ) | (21,499 | ) | (774,706 | ) | ||||||||
| Increase in Net Assets from Operations | 4,034,164 | 3,302,302 | 367,396 | 532,695 | ||||||||||||
| From Distributions to Shareholders: | ||||||||||||||||
| Net Investment Income | - | - | - | - | ||||||||||||
| Net Realized Gain from Security Transactions | - | (16,140,005 | ) | - | (1,288,457 | ) | ||||||||||
| Total Distributions to Shareholders | - | (16,140,005 | ) | - | (1,288,457 | ) | ||||||||||
| From Capital Share Transactions: | ||||||||||||||||
| Proceeds From Sale of Shares | 1,656,591 | 5,191,517 | 225,919 | 263,258 | ||||||||||||
| Proceeds from Redemption Fees (Note 2) | 1,976 | 2,317 | 500 | - | ||||||||||||
| Shares Issued on Reinvestment of Dividends | - | 15,495,221 | - | 1,239,535 | ||||||||||||
| Cost of Shares Redeemed | (22,553,333 | ) | (44,803,134 | ) | (1,066,158 | ) | (2,391,358 | ) | ||||||||
| Net Decrease from Shareholder Activity | (20,894,766 | ) | (24,114,079 | ) | (839,739 | ) | (888,565 | ) | ||||||||
| Net Decrease in Net Assets | (16,860,602 | ) | (36,951,782 | ) | (472,343 | ) | (1,644,327 | ) | ||||||||
| Net Assets at Beginning of Period | 96,161,648 | 133,113,430 | 6,536,917 | 8,181,244 | ||||||||||||
| Net Assets at End of Period | $ | 79,301,046 | $ | 96,161,648 | $ | 6,064,574 | $ | 6,536,917 | ||||||||
| Accumulated Undistributed Net Investment Income (Loss) | $ | (23,109 | ) | $ | - | $ | (3,164 | ) | $ | 137 | ||||||
| Share Transactions: | ||||||||||||||||
| Issued | 33,987 | 89,913 | 6,627 | 6,963 | ||||||||||||
| Reinvested | - | 318,308 | - | 38,175 | ||||||||||||
| Redeemed | (465,113 | ) | (780,306 | ) | (31,534 | ) | (62,920 | ) | ||||||||
| Net Decrease in Shares | (431,126 | ) | (372,085 | ) | (24,907 | ) | (17,782 | ) | ||||||||
| Shares Outstanding Beginning of Period | 1,989,526 | 2,361,611 | 203,010 | 220,792 | ||||||||||||
| Shares Outstanding End of Period | 1,558,400 | 1,989,526 | 178,103 | 203,010 | ||||||||||||
| The accompanying notes are an integral part of these financial statements. |
2015 Semi-Annual Report 23
| Paradigm Funds | ||||||||||||||||
| Statements of Changes in Net Assets | Opportunity Fund | Micro-Cap Fund | ||||||||||||||
| (Unaudited) | (Unaudited) | |||||||||||||||
| 1/1/2015 | 1/1/2014 | 1/1/2015 | 1/1/2014 | |||||||||||||
| to | to | to | to | |||||||||||||
| 6/30/2015 | 12/31/2014 | 6/30/2015 | 12/31/2014 | |||||||||||||
| From Operations: | ||||||||||||||||
| Net Investment Loss | $ | (11,212 | ) | $ | (9,308 | ) | $ | (63,596 | ) | $ | (139,881 | ) | ||||
| Net Realized Gain on Investments | 147,007 | 351,681 | 2,474,460 | 3,112,369 | ||||||||||||
| Change in Net Unrealized Appreciation | 341,423 | 269,876 | (2,588,415 | ) | (2,502,304 | ) | ||||||||||
| Increase (Decrease) in Net Assets from Operations | 477,218 | 612,249 | (177,551 | ) | 470,184 | |||||||||||
| From Distributions to Shareholders: | ||||||||||||||||
| Net Investment Income | - | - | - | - | ||||||||||||
| Net Realized Gain from Security Transactions | - | (344,703 | ) | - | (2,982,290 | ) | ||||||||||
| Total Distributions to Shareholders | - | (344,703 | ) | - | (2,982,290 | ) | ||||||||||
| From Capital Share Transactions: | �� | |||||||||||||||
| Proceeds From Sale of Shares | 344,252 | 180,230 | 16,567,100 | 584,411 | ||||||||||||
| Proceeds from Redemption Fees (Note 2) | 461 | 17 | - | - | ||||||||||||
| Shares Issued on Reinvestment of Dividends | - | 344,703 | - | 2,981,619 | ||||||||||||
| Cost of Shares Redeemed | (439,715 | ) | (134,699 | ) | (382,502 | ) | (2,163,948 | ) | ||||||||
| Net Increase (Decrease) from Shareholder Activity | (95,002 | ) | 390,251 | 16,184,598 | 1,402,082 | |||||||||||
| Net Increase (Decrease) in Net Assets | 382,216 | 657,797 | 16,007,047 | (1,110,024 | ) | |||||||||||
| Net Assets at Beginning of Period | 6,694,269 | 6,036,472 | 26,099,904 | 27,209,928 | ||||||||||||
| Net Assets at End of Period | $ | 7,076,485 | $ | 6,694,269 | $ | 42,106,951 | $ | 26,099,904 | ||||||||
| Accumulated Net Investment Loss | $ | (11,212 | ) | $ | - | $ | (63,596 | ) | $ | - | ||||||
| Share Transactions: | ||||||||||||||||
| Issued | 9,774 | 5,362 | 585,821 | 20,394 | ||||||||||||
| Reinvested | - | 10,468 | - | 108,344 | ||||||||||||
| Redeemed | (12,397 | ) | (4,276 | ) | (13,535 | ) | (72,446 | ) | ||||||||
| Net Increase (Decrease) in Shares | (2,623 | ) | 11,554 | 572,286 | 56,292 | |||||||||||
| Shares Outstanding Beginning of Period | 204,708 | 193,154 | 952,893 | 896,601 | ||||||||||||
| Shares Outstanding End of Period | 202,085 | 204,708 | 1,525,179 | 952,893 | ||||||||||||
| The accompanying notes are an integral part of these financial statements. |
2015 Semi-Annual Report 24
| Paradigm Value Fund | ||||||||||||||||||||||||
| Financial Highlights - Paradigm Value Fund | ||||||||||||||||||||||||
| (Unaudited) | ||||||||||||||||||||||||
| Selected data for a share outstanding | 1/1/2015 | 1/1/2014 | 1/1/2013 | 1/1/2012 | 1/1/2011 | 1/1/2010 | ||||||||||||||||||
| throughout the period: | to | to | to | to | to | to | ||||||||||||||||||
| 6/30/2015 | 12/31/2014 | 12/31/2013 | 12/31/2012 | 12/31/2011 | 12/31/2010 | |||||||||||||||||||
| Net Asset Value - Beginning of Period | $ | 48.33 | $ | 56.37 | $ | 56.47 | $ | 52.54 | $ | 55.09 | $ | 42.75 | ||||||||||||
| Net Investment Income (Loss) (a) | (0.01 | ) | (0.05 | ) | (0.19 | ) | 0.15 | (0.15 | ) | (0.07 | ) | |||||||||||||
| Net Gain (Loss) on Securities (Realized and Unrealized) | 2.57 | 1.50 | 12.45 | 4.01 | (1.64 | ) | 12.49 | |||||||||||||||||
| Total from Investment Operations | 2.56 | 1.45 | 12.26 | 4.16 | (1.79 | ) | 12.42 | |||||||||||||||||
| Distributions (From Net Investment Income) | - | - | - | (0.16 | ) | - | (0.09 | ) | ||||||||||||||||
| Distributions (From Capital Gains) | - | (9.49 | ) | (12.37 | ) | - | (0.78 | ) | - | |||||||||||||||
| Distributions (From Return of Capital) | - | - | - | (0.07 | ) | - | - | |||||||||||||||||
| Total Distributions | - | (9.49 | ) | (12.37 | ) | (0.23 | ) | (0.78 | ) | (0.09 | ) | |||||||||||||
| Proceeds from Redemption Fee (Note 2) | - | + | - | + | 0.01 | - | + | 0.02 | 0.01 | |||||||||||||||
| Net Asset Value - End of Period | $ | 50.89 | $ | 48.33 | $ | 56.37 | $ | 56.47 | $ | 52.54 | $ | 55.09 | ||||||||||||
| Total Return (b) | 5.30% | * | 2.44% | 21.82% | 7.93% | (3.22)% | 29.08% | |||||||||||||||||
| Ratios/Supplemental Data | ||||||||||||||||||||||||
| Net Assets - End of Period (Thousands) | $ | 79,301 | $ | 96,162 | $ | 133,113 | $ | 244,606 | $ | 234,849 | $ | 255,499 | ||||||||||||
| Before Reimbursement | ||||||||||||||||||||||||
| Ratio of Expenses to Average Net Assets | 2.00% | ** | 1.97% | 1.91% | 1.84% | 1.83% | 1.89% | |||||||||||||||||
| After Reimbursement | ||||||||||||||||||||||||
| Ratio of Expenses to Average Net Assets ++ | 1.50% | ** | 1.50% | 1.50% | 1.50% | 1.50% | 1.50% | |||||||||||||||||
| Ratio of Net Investment Income (Loss) to Average | ||||||||||||||||||||||||
| Net Assets ++ | (0.06)% | ** | (0.09)% | (0.31)% | 0.26% | (0.26)% | (0.14)% | |||||||||||||||||
| Portfolio Turnover Rate | 4.13% | * | 31.47% | 48.01% | 62.22% | 83.95% | 81.17% | |||||||||||||||||
| Paradigm Select Fund | ||||||||||||||||||||||||
| Financial Highlights - Paradigm Select Fund | ||||||||||||||||||||||||
| (Unaudited) | ||||||||||||||||||||||||
| Selected data for a share outstanding throughout the period: | 1/1/2015 | 1/1/2014 | 1/1/2013 | 1/1/2012 | 1/1/2011 | 1/1/2010 | ||||||||||||||||||
| to | to | to | to | to | to | |||||||||||||||||||
| 6/30/2015 | 12/31/2014 | 12/31/2013 | 12/31/2012 | 12/31/2011 | 12/31/2010 | |||||||||||||||||||
| Net Asset Value - Beginning of Period | $ | 32.20 | $ | 37.05 | $ | 32.50 | $ | 30.24 | $ | 29.71 | $ | 23.82 | ||||||||||||
| Net Investment Income (Loss) (a) | (0.02 | ) | - + | 0.06 | 0.24 | 0.06 | (0.05 | ) | ||||||||||||||||
| Net Gain on Securities (Realized and Unrealized) | 1.87 | 2.98 | 9.29 | 2.49 | 0.52 | 6.01 | ||||||||||||||||||
| Total from Investment Operations | 1.85 | 2.98 | 9.35 | 2.73 | 0.58 | 5.96 | ||||||||||||||||||
| Distributions (From Net Investment Income) | - | - | (0.05 | ) | (0.28 | ) | (0.05 | ) | (0.07 | ) | ||||||||||||||
| Distributions (From Capital Gains) | - | (7.83 | ) | (4.75 | ) | (0.19 | ) | - | - | |||||||||||||||
| Total Distributions | - | (7.83 | ) | (4.80 | ) | (0.47 | ) | (0.05 | ) | (0.07 | ) | |||||||||||||
| Proceeds from Redemption Fee (Note 2) | - | + | - | - | + | - | + | - | + | - | + | |||||||||||||
| Net Asset Value - End of Period | $ | 34.05 | $ | 32.20 | $ | 37.05 | $ | 32.50 | $ | 30.24 | $ | 29.71 | ||||||||||||
| Total Return (b) | 5.75% | * | 7.86% | 28.83% | 9.07% | 1.97% | 25.03% | |||||||||||||||||
| Ratios/Supplemental Data | ||||||||||||||||||||||||
| Net Assets - End of Period (Thousands) | $ | 6,065 | $ | 6,537 | $ | 8,181 | $ | 9,462 | $ | 7,930 | $ | 3,917 | ||||||||||||
| Before Reimbursement | ||||||||||||||||||||||||
| Ratio of Expenses to Average Net Assets | 1.50% | ** | 1.50% | 1.50% | 1.50% | 1.50% | 1.50% | |||||||||||||||||
| After Reimbursement | ||||||||||||||||||||||||
| Ratio of Expenses to Average Net Assets ++ | 1.15% | ** | 1.15% | 1.15% | 1.15% | 1.20% | 1.50% | |||||||||||||||||
| Ratio of Net Investment Income (Loss) to Average | ||||||||||||||||||||||||
| Net Assets ++ | (0.10)% | ** | 0.00% | + | 0.16% | 0.73% | 0.21% | (0.20)% | ||||||||||||||||
| Portfolio Turnover Rate | 9.40% | * | 36.25% | 46.80% | 86.71% | 58.40% | 65.77% | |||||||||||||||||
| * Not Annualized. ** Annualized. (a) Per share amount calculated using the average shares method. (b) Total return in the above table represents the rate that the investor would have earned or lost on an investment in the Fund assuming reinvestment of dividends. Returns do not reflect the deduction of taxes a shareholder would pay on Fund distributions or redemption of Fund shares. + Amount calculated is less than $0.005/0.005%. ++ Such percentages reflect an expense waiver by the Advisor (for Value since 2010 and for Select since 2011). See Note 4. |
| The accompanying notes are an integral part of these financial statements. |
2015 Semi-Annual Report 25
| Paradigm Opportunity Fund | ||||||||||||||||||||||||
| Financial Highlights - Paradigm Opportunity Fund | ||||||||||||||||||||||||
| (Unaudited) | ||||||||||||||||||||||||
| Selected data for a share outstanding throughout the period: | 1/1/2015 | 1/1/2014 | 1/1/2013 | 1/1/2012 | 1/1/2011 | 1/1/2010 | ||||||||||||||||||
| to | to | to | to | to | to | |||||||||||||||||||
| 6/30/2015 | 12/31/2014 | 12/31/2013 | 12/31/2012 | 12/31/2011 | 12/31/2010 | |||||||||||||||||||
| Net Asset Value - Beginning of Period | $ | 32.70 | $ | 31.25 | $ | 26.44 | $ | 25.04 | $ | 25.59 | $ | 20.29 | ||||||||||||
| Net Investment Loss (a) | (0.05 | ) | (0.05 | ) | (0.08 | ) | (0.03 | ) | (0.20 | ) | (0.12 | ) | ||||||||||||
| Net Gain (Loss) on Securities (Realized and Unrealized) | 2.37 | 3.27 | 6.82 | 1.71 | (0.14 | ) | 5.42 | |||||||||||||||||
| Total from Investment Operations | 2.32 | 3.22 | 6.74 | 1.68 | (0.34 | ) | 5.30 | |||||||||||||||||
| Distributions (From Net Investment Income) | - | - | - | - | - | - | ||||||||||||||||||
| Distributions (From Capital Gains) | - | (1.77 | ) | (1.93 | ) | (0.28 | ) | (0.21 | ) | - | ||||||||||||||
| Distributions (From Return of Capital) | - | - | - | - | + | - | - | |||||||||||||||||
| Total Distributions | - | (1.77 | ) | (1.93 | ) | (0.28 | ) | (0.21 | ) | - | ||||||||||||||
| Proceeds from Redemption Fee (Note 2) | - | + | - | + | - | - | - | - | + | |||||||||||||||
| Net Asset Value - End of Period | $ | 35.02 | $ | 32.70 | $ | 31.25 | $ | 26.44 | $ | 25.04 | $ | 25.59 | ||||||||||||
| Total Return (b) | 7.09% | * | 10.28% | 25.54% | 6.72% | (1.34)% | 26.12% | |||||||||||||||||
| Ratios/Supplemental Data | ||||||||||||||||||||||||
| Net Assets - End of Period (Thousands) | $ | 7,076 | $ | 6,694 | $ | 6,036 | $ | 4,807 | $ | 4,491 | $ | 4,939 | ||||||||||||
| Before Reimbursement | ||||||||||||||||||||||||
| Ratio of Expenses to Average Net Assets | 2.00% | ** | 2.00% | 2.00% | 2.00% | 2.00% | 2.00% | |||||||||||||||||
| After Reimbursement | ||||||||||||||||||||||||
| Ratio of Expenses to Average Net Assets (c) | 1.25% | ** | 1.25% | 1.25% | 1.33% | 1.50% | 1.50% | |||||||||||||||||
| Ratio of Net Investment Loss to Average | ||||||||||||||||||||||||
| Net Assets (c) | (0.32)% | ** | (0.15)% | (0.28)% | (0.10)% | (0.76)% | (0.56)% | |||||||||||||||||
| Portfolio Turnover Rate | 7.27% | * | 7.59% | 44.00% | 61.11% | 65.44% | 96.20% | |||||||||||||||||
| Paradigm Micro-Cap Fund | ||||||||||||||||||||||||
| Financial Highlights - Paradigm Micro-Cap Fund | ||||||||||||||||||||||||
| (Unaudited) | ||||||||||||||||||||||||
| Selected data for a share outstanding throughout the period: | 1/1/2015 | 1/1/2014 | 1/1/2013 | 1/1/2012 | 1/1/2011 | 1/1/2010 | ||||||||||||||||||
| to | to | to | to | to | to | |||||||||||||||||||
| 6/30/2015 | 12/31/2014 | 12/31/2013 | 12/31/2012 | 12/31/2011 | 12/31/2010 | |||||||||||||||||||
| Net Asset Value - Beginning of Period | $ | 27.39 | $ | 30.35 | $ | 23.24 | $ | 21.01 | $ | 21.20 | $ | 17.99 | ||||||||||||
| Net Investment Income (Loss) (a) | (0.06 | ) | (0.17 | ) | (0.06 | ) | 0.09 | (0.04 | ) | (0.01 | ) | |||||||||||||
| Net Gain (Loss) on Securities (Realized and Unrealized) | 0.28 | 0.74 | 9.69 | 2.23 | (0.15 | ) | 3.33 | |||||||||||||||||
| Total from Investment Operations | 0.22 | 0.57 | 9.63 | 2.32 | (0.19 | ) | 3.32 | |||||||||||||||||
| Distributions (From Net Investment Income) | - | - | - | (0.09 | ) | - | (0.11 | ) | ||||||||||||||||
| Distributions (From Capital Gains) | - | (3.53 | ) | (2.52 | ) | - | - | - | ||||||||||||||||
| Total Distributions | - | (3.53 | ) | (2.52 | ) | (0.09 | ) | - | (0.11 | ) | ||||||||||||||
| Proceeds from Redemption Fee (Note 2) | - | - | - | - | + | - | - | |||||||||||||||||
| Net Asset Value - End of Period | $ | 27.61 | $ | 27.39 | $ | 30.35 | $ | 23.24 | $ | 21.01 | $ | 21.20 | ||||||||||||
| Total Return (b) | 0.80% | * | 1.81% | 41.41% | 11.06% | (0.90)% | 18.44% | |||||||||||||||||
| Ratios/Supplemental Data | ||||||||||||||||||||||||
| Net Assets - End of Period (Thousands) | $ | 42,107 | $ | 26,100 | $ | 27,210 | $ | 17,598 | $ | 7,026 | $ | 3,448 | ||||||||||||
| Ratio of Expenses to Average Net Assets | 1.25% | ** | 1.25% | 1.25% | 1.25% | 1.25% | 1.25% | |||||||||||||||||
| Ratio of Net Investment Income (Loss) to Average | �� | |||||||||||||||||||||||
| Net Assets | (0.40)% | ** | (0.58)% | (0.21)% | 0.38% | (0.20)% | (0.08)% | |||||||||||||||||
| Portfolio Turnover Rate | 39.93% | * | 101.19% | 70.07% | 60.47% | 126.43% | ++ | 77.78% | ||||||||||||||||
| * Not Annualized. ** Annualized. (a) Per share amount calculated using the average shares method. (b) Total return in the above table represents the rate that the investor would have earned or lost on an investment in the Fund assuming reinvestment of dividends. Returns do not reflect the deduction of taxes a shareholder would pay on Fund distributions or redemption of Fund shares. (c) Such percentages reflect an expense waiver by the Advisor. See Note 4. + Amount calculated is less than $0.005. ++ The Fund's portfolio turnover rate increased due to the change in the Fund's principal investment strategy to invest (under normal circumstances) at least 80% of its net assets in the common stocks of U.S. micro-cap companies effective December 27, 2011. |
| The accompanying notes are an integral part of these financial statements. |
2015 Semi-Annual Report 26
NOTES TO FINANCIAL STATEMENTS
PARADIGM FUNDS
June 30, 2015
(Unaudited)
1.) ORGANIZATION
Paradigm Funds (the "Trust”) is an open-end management investment company that was organized in Ohio as a business trust on September 13, 2002 that may offer shares of beneficial interest in a number of separate series, each series representing a distinct fund with its own investment objectives and policies. The Paradigm Value Fund (“Value”) commenced operations on January 1, 2003. The Paradigm Value Fund's investment objective is long-term capital appreciation. The Paradigm Select Fund (“Select”) and Paradigm Opportunity Fund (“Opportunity”) both commenced operations on January 1, 2005 with long-term capital appreciation as their objective. The Paradigm Micro-Cap Fund (“Micro-Cap”) commenced operations on January 1, 2008. The Paradigm Micro-Cap Fund's investment objective is long-term capital appreciation. Under normal circumstances, the Micro-Cap Fund invests at least 80% of its net assets in the common stocks of U.S. micro-cap companies. Prior to December 27, 2011, the principal investment strategy of the Fund was to invest primarily in the common stocks of small, mid or large capitalization companies that the Advisor believed had the potential for capital appreciation. Value, Select, Opportunity and Micro-Cap are all diversified funds. The advisor to Value, Select, Opportunity and Micro-Cap (each a “Fund” and collectively the “Funds”) is Paradigm Funds Advisor LLC (the “Advisor”).
2.) SIGNIFICANT ACCOUNTING POLICIES
SECURITY VALUATION: All investments in securities are recorded at their estimated fair value, as described in Note 3.
SECURITY TRANSACTIONS AND OTHER: Security transactions are recorded based on a trade date. Dividend income is recognized on the ex-dividend date. Interest income is recognized on an accrual basis. The Funds use the highest cost basis in computing gain or loss on sale of investment securities. Discounts and premiums on fixed income securities purchased are amortized over the lives of the respective securities. Withholding taxes on foreign dividends have been provided for in accordance with the Funds’ understanding of the applicable country’s tax rules and rates. The Funds may invest in real estate investment trusts (“REITs”) that pay distributions to their shareholders based on available funds from operations. It is common for these distributions to exceed the REITs taxable earnings and profits resulting in the excess portion of such distribution to be designated as return of capital. Distributions received from REITs are generally recorded as dividend income and, if necessary, are reclassified annually in accordance with tax information provided by the underlying REITs.
The Funds may hold investments in master limited partnerships (“MLPs”). It is common for distributions from MLPs to exceed taxable earnings and profits resulting in the excess portion of such dividend to be designated as return of capital. Annually, income or loss from MLPs is reclassified upon receipt of the MLPs K-1. For financial reporting purpose management does not estimate the tax character of MLP distributions for which actual information has not been reported.
SHARE VALUATION: The net asset value (the “NAV”) is calculated as of the close of trading on the New York Stock Exchange (normally 4:00 p.m. Eastern time) every day the Exchange is open. The NAV for each Fund is calculated by taking the total value of the Fund’s assets, subtracting its liabilities, and then dividing by the total number of shares outstanding, rounded to the nearest cent. The offering price and redemption price per share is equal to the net asset value per share, except that shares of each Fund are subject to a redemption fee of 2% if redeemed within 90 days of purchase. During the six month period ended June 30, 2015 proceeds from redemption fees were $1,976, $500, $461 and $0 for Value, Select, Opportunity and Micro-Cap, respectively.
SHORT SALES: A Fund may sell a security it does not own in anticipation of a decline in the fair value of the security. When a Fund sells a security short, it must borrow the security sold short and deliver it to the broker-dealer through which it made the short sale. A gain, limited to the price at which a Fund sold the security short, or a loss, unlimited in size, will be recognized upon the termination of a short sale.
INCOME TAXES: The Funds’ policy is to continue to comply with the requirements of the Internal Revenue Code that are applicable to regulated investment companies and to distribute all of their taxable income to shareholders. Therefore, no federal income tax provision is required. It is the Funds’ policy to distribute annually, prior to the end of the calendar year, dividends sufficient to satisfy excise tax requirements of the Internal Revenue Code. This Internal Revenue Code requirement may cause an excess of distributions over the book year-end accumulated income. In addition, it is the Funds’ policy to distribute annually, after the end of the fiscal year, any remaining net investment income and net realized capital gains.
2015 Semi-Annual Report 27
Notes to Financial Statements (Unaudited) - continued
The Funds recognize the tax benefits of certain tax positions only where the position is “more likely than not” to be sustained assuming examination by tax authorities. Management has analyzed the Funds’ tax positions, and has concluded that no liability for unrecognized tax benefits should be recorded related to uncertain tax positions taken on returns filed for open tax years (2012-2014), or expected to be taken on the Funds’ 2015 tax return. The Funds identify their major tax jurisdictions as U.S. Federal and New York State tax authorities; the Funds are not aware of any tax positions for which it is reasonably possible that the total amounts of unrecognized tax benefits will change materially in the next twelve months. The Funds recognize interest and penalties, if any, related to unrecognized tax benefits as income tax expense in the Statements of Operations. During the six month period ended June 30, 2015, the Funds did not incur any interest or penalties.
ESTIMATES: The preparation of financial statements in conformity with accounting principles generally accepted in the United States of America (“GAAP”) requires management to make estimates and assumptions that affect the reported amounts of assets and liabilities and disclosure of contingent assets and liabilities at the date of the financial statements and the reported amounts of increases and decreases in net assets from operations during the reporting period. Actual results could differ from those estimates.
DISTRIBUTIONS TO SHAREHOLDERS: Distributions to shareholders, which are determined in accordance with income tax regulations, are recorded on the ex-dividend date. The Funds may utilize earnings and profits distributed to shareholders on redemptions of shares as part of the dividends paid deduction. The treatment for financial reporting purposes of distributions made to shareholders during the year from net investment income or net realized capital gains may differ from their ultimate treatment for federal income tax purposes. These differences are caused primarily by differences in the timing of recognition of certain components of income, expense or realized capital gain for federal income tax purposes. Where such differences are permanent, they are reclassified in the components of the net assets based on their ultimate characterization for federal income tax purposes. Any such reclassification will have no effect on net assets, results of operations or net asset values per share of any Fund.
3.) SECURITIES VALUATIONS
The Funds utilize various methods to measure the fair value of their investments on a recurring basis. GAAP establishes a hierarchy that prioritizes inputs to valuation methods. The three levels of inputs are:
Level 1 - Unadjusted quoted prices in active markets for identical assets or liabilities.
Level 2 - Observable inputs other than quoted prices included in level 1 that are observable for the asset or liability, either directly or indirectly. These inputs may include quoted prices for the identical instrument on an inactive market, prices for similar instruments, interest rates, prepayment speeds, credit risk, yield curves, default rates and similar data.
Level 3 - Unobservable inputs for the asset or liability, to the extent relevant observable inputs are not available, representing the Funds’ best information about the assumptions a market participant would use in valuing the assets or liabilities.
The availability of inputs can vary from security to security and is affected by a wide variety of factors, including, for example, the type of security, whether the security is new and not yet established in the marketplace, the liquidity of markets, and other characteristics particular to the security. To the extent that valuation is based on models or inputs that are less observable or unobservable in the market, the determination of fair value requires more judgment. Accordingly, the degree of judgment exercised in determining fair value is greatest for instruments categorized in level 3.
The inputs used to measure fair value may fall into different levels of the fair value hierarchy. In such cases, for disclosure purposes, the level in the fair value hierarchy within which the fair value measurement falls in its entirety, is determined based on the lowest level input that is significant to the fair value measurement in its entirety.
FAIR VALUE MEASUREMENTS
A description of the valuation techniques applied to the Funds’ major categories of assets measured at fair value on a recurring basis follows.
Equity securities (common stocks and real estate investment trusts). Equity securities are carried at fair value. The market quotation used for equity securities, including those listed on the NASDAQ National Market System, is the last sale price on the date on which the valuation is made or, in the absence of sales, at the closing bid price. Over-the-counter securities will be valued on the basis of the bid price at the close of each business day. Generally, if the security is traded in an active market and is valued at the last sale price, the security is categorized as a level 1 security. When the security position is not considered to be part
2015 Semi-Annual Report 28
Notes to Financial Statements (Unaudited) - continued
of an active market or when the security is valued at the bid price, the position is generally categorized as level 2. When market quotations are not readily available, when the Advisor determines the last bid price does not accurately reflect the current value or when restricted securities are being valued, such securities are valued as determined in good faith by the Advisor, in conformity with guidelines adopted by and subject to review of the Board of Trustees (the “Trustees”) and are categorized in level 2 or level 3, when appropriate.
Money market funds. Money market funds are valued at net asset value and are classified in level 1 of the fair value hierarchy.
Fixed income securities. Fixed income securities generally are valued by using market quotations, but may be valued on the basis of prices furnished by a pricing service when the Advisor believes such prices accurately reflect the fair value of such securities. A pricing service utilizes electronic data processing techniques based on yield spreads relating to securities with similar characteristics to determine prices for normal institutional-size trading units of debt securities without regard to sale or bid prices. When prices are not readily available from a pricing service, or when restricted or illiquid securities are being valued, securities are valued at fair value as determined in good faith by the Advisor, subject to review of the Trustees. Short-term investments in fixed income securities with maturities of less than 60 days when acquired, or which subsequently are within 60 days of maturity, are valued by using the amortized cost method of valuation. Generally, fixed income securities are categorized as level 2.
In accordance with the Trust's good faith pricing guidelines, the Advisor is required to consider all appropriate factors relevant to the value of securities for which it has determined other pricing sources are not available or reliable as described above. There is no single standard for determining fair value, since fair value depends upon the circumstances of each individual case. As a general principle, the current fair value of an issue of securities being valued by the Advisor would appear to be the amount which the owner might reasonably expect to receive for them upon their current sale. Methods which are in accordance with this principle may, for example, be based on (i) a multiple of earnings; (ii) a discount from market of a similar freely traded security (including a derivative security or a basket of securities traded on other markets, exchanges or among dealers); or (iii) yield to maturity with respect to debt issues, or a combination of these and other methods.
The following tables summarize the inputs used to value the Funds’ assets measured at fair value as of June 30, 2015:
| Value: | |||||
| Valuation Inputs of Assets | Level 1 | Level 2 | Level 3 | Total | |
| Common Stocks | $72,558,714 | $ - | $ - | $72,558,714 | |
| Real Estate Investment Trusts | 4,779,367 | - | - | 4,779,367 | |
| Money Market Funds | 1,017,423 | - | - | 1,017,423 | |
| Total | $78,355,504 | $ - | $ - | $78,355,504 | |
| Select: | |||||
| Valuation Inputs of Assets | Level 1 | Level 2 | Level 3 | Total | |
| Common Stocks | $5,785,401 | $ - | $ - | $5,785,401 | |
| Real Estate Investment Trusts | 101,934 | - | - | 101,934 | |
| Money Market Funds | 79,212 | - | - | 79,212 | |
| Total | $5,966,547 | $ - | $ - | $5,966,547 | |
| Opportunity: | |||||
| Valuation Inputs of Assets | Level 1 | Level 2 | Level 3 | Total | |
| Common Stocks | $6,655,256 | $ - | $ - | $6,655,256 | |
| Real Estate Investment Trusts | 238,453 | - | - | 238,453 | |
| Money Market Funds | 178,846 | - | - | 178,846 | |
| Total | $7,072,555 | $ - | $ - | $7,072,555 | |
| Micro-Cap: | |||||
| Valuation Inputs of Assets | Level 1 | Level 2 | Level 3 | Total | |
| Common Stocks | $40,988,696 | $ - | $ - | $40,988,696 | |
| Money Market Funds | 1,808,771 | - | - | 1,808,771 | |
| Total | $42,797,467 | $ - | $ - | $42,797,467 | |
Refer to each Fund’s Schedule of Investments for a listing of securities by industry. The Funds did not hold any level 3 assets during the six month period ended June 30, 2015. There were no transfers into or out of the levels during the six month period ended June 30, 2015. It is the Funds’ policy to consider transfers into or out of the levels as of the end of the reporting period.
2015 Semi-Annual Report 29
Notes to Financial Statements (Unaudited) - continued
The Funds did not invest in derivative instruments during the six month period ended June 30, 2015.
4.) INVESTMENT ADVISORY AGREEMENTS|
The Trust, with respect to each of the Funds, has an investment advisory agreement (collectively the "Management Agreements") with the Advisor. Under the terms of the Management Agreements, the Advisor manages the investment portfolios of the Funds, subject to policies adopted by the Trustees. Under the Management Agreements, the Advisor, at its own expense and without reimbursement from the Trust, furnishes office space and all necessary office facilities, equipment and executive personnel necessary for managing the assets of the Funds. The Advisor pays all operating expenses of the Funds with the exception of taxes, brokerage fees and commissions, borrowing costs (such as interest and dividend expenses on securities sold short) and such extraordinary or non-recurring expenses as may arise, including litigation to which the Fund may be a party and indemnification of the Trust’s Trustees and officers with respect thereto. The Funds will also pay expenses that they are authorized to pay pursuant to Rule 12b-1 under the Investment Company Act of 1940 (none are currently authorized). The Advisor also pays the salaries and fees of all of its officers and employees that serve as officers and trustees of the Trust. For its services and payment of certain Fund expenses as described below, the Advisor receives an annual investment management fee of 1.50% of the average daily net assets from Select; 2.00% of the average daily net assets from Opportunity; and 1.25% of the average daily net assets from Micro-Cap. Value pays the Advisor an annual investment management fee of 2.00% of the average daily net assets on assets up to and including $100 million and 1.75% of the average daily net assets over $100 million. As a result of the above calculations, for the six month period ended June 30, 2015, the Advisor earned management fees (before the waivers described below) totaling $839,127, $47,889, $70,773 and $196,735 for Value, Select, Opportunity, and Micro-Cap, respectively. At June 30, 2015, $106,553, $6,419, $8,058 and $46,509 was due to the Advisor from Value, Select, Opportunity and Micro-Cap, respectively. The Advisor has contractually agreed to waive management fees and/or reimburse Value, Select and Opportunity to the extent necessary to maintain total annual operating expenses of the Funds (excluding brokerage fees and commissions, interest and other borrowing expenses, taxes, extraordinary expenses and indirect costs of investing in acquired funds) at 1.50%, 1.15% and 1.25%, respectively, of daily net assets through April 30, 2016. The Advisor waived $209,782, $11,174 and $26,540 for the six month period ended June 30, 2015 for Value, Select and Opportunity, respectively. There is no recapture provision to these waivers.
5.) RELATED PARTY TRANSACTIONS
Certain officers and shareholders of the Advisor are also officers and/or a Trustee of the Trust. These individuals may receive benefits from the Advisor resulting from management fees paid to the Advisor from the Funds.
The Trustees who are not interested persons of the Funds were each paid $4,000, for a total of $12,000, in Trustees fees for the six month period ended June 30, 2015 for the Trust. Under the Management Agreements, the Advisor pays these fees.
6.) INVESTMENTS
For the six month period ended June 30, 2015, purchases and sales of investment securities other than U.S. Government obligations and short-term investments were as follows:
| Value | Select | Opportunity | Micro-Cap | |||||
| Purchases | $3,428,018 | $586,733 | $747,038 | $26,859,233 | ||||
| Sales | $26,159,536 | $1,436,341 | $476,295 | $12,294,568 |
There were no purchases or sales of U.S. Government obligations.
7.) CAPITAL SHARES
At June 30, 2015, the Trust was authorized to issue an unlimited number of shares of beneficial interest. The following are the shares issued and paid in capital outstanding for the Funds at June 30, 2015:
| Value | Select | Opportunity | Micro-Cap | |||||
| Shares Issued | ||||||||
| and Outstanding | 1,558,400 | 178,103 | 202,085 | 1,525,179 | ||||
| Paid in Capital | $48,645,723 | $3,807,606 | $4,613,457 | $38,115,775 |
8.) CONTROL OWNERSHIP
The beneficial ownership, either directly or indirectly, of more than 25% of the voting shares of a fund creates a presumption of control of the fund, under section 2(a)(9) of the Investment Company Act of 1940. At June 30, 2015, National Financial Services, LLC, located at 200 Liberty Street, New York, New York, for the benefit of its customers, held, in aggregate, 37.94% of Value, and therefore also may be deemed to control
2015 Semi-Annual Report 30
Notes to Financial Statements (Unaudited) - continued
Value. Candace King Weir, beneficial owner located at 9 Elk Street, Albany, New York 12207, held, in aggregate, 29.06%, of Select, and therefore may be deemed to control Select. Candace King Weir, beneficial owner located at 9 Elk Street, Albany, New York 12207, held, in aggregate, 87.74%, of Opportunity, and therefore may be deemed to control Opportunity. Candace King Weir, beneficial owner located at 9 Elk Street, Albany, New York 12207, held, in aggregate, 57.39% of Micro-Cap, and therefore may be deemed to control Micro-Cap.
9.) TAX MATTERS
For federal income tax purposes, at June 30, 2015 the cost of securities on a tax basis and the composition of gross unrealized appreciation (the excess of value over tax cost) and depreciation (the excess of tax cost over value) were as follows:
| Value | Select | Opportunity | Micro-Cap | ||||||
| Cost of Investments | $54,758,625 | $4,062,475 | $4,706,519 | $41,214,303 | |||||
| Gross Unrealized Appreciation | $28,228,931 | $2,108,278 | $2,744,147 | $4,968,788 | |||||
| Gross Unrealized Depreciation | ($4,632,052) | ($204,206) | ($378,111) | ($3,385,624) | |||||
| Net Unrealized Appreciation | |||||||||
| on Investments | $23,596,879 | $1,904,072 | $2,366,036 | $1,583,164 | |||||
The tax character of distributions paid during the six month period ended June 30, 2015 and fiscal year ended December 31, 2014 were as follows:
| Six Month Period | Fiscal Year Ended | ||
| Ended June 30, 2015 | December 31, 2014 | ||
| PARADIGM VALUE FUND | |||
| Ordinary Income | $ - | $ 55,448 | |
| Long-term Capital Gain | - | 16,084,557 | |
| $ - | $16,140,005 | ||
| PARADIGM SELECT FUND | |||
| Ordinary Income | $ - | $ 62,206 | |
| Long-term Capital Gain | - | 1,226,251 | |
| $ - | $ 1,288,457 | ||
| PARADIGM OPPORTUNITY FUND | |||
| Ordinary Income | $ - | $ 20,137 | |
| Long-term Capital Gain | - | 324,566 | |
| $ - | $ 344,703 | ||
| PARADIGM MICRO-CAP FUND | |||
| Ordinary Income | $ - | $ 14,267 | |
| Long-term Capital Gain | - | 2,968,023 | |
| $ - | $ 2,982,290 | ||
10.) SUBSEQUENT EVENTS
Subsequent events after the date of the Statements of Assets and Liabilities have been evaluated through the date the financial statements were issued. Management has concluded that there is no impact requiring adjustment or disclosure in the financial statements.
2015 Semi-Annual Report 31
This page was intentionally left blank.
2015 Semi-Annual Report 32
DISCLOSURE OF EXPENSES
(Unaudited)
The ongoing costs to shareholders associated with the Paradigm Value Fund, Paradigm Opportunity Fund, Paradigm Select Fund and Paradigm Micro-Cap Fund consist solely of management fees. Although the Funds charge no sales loads or transaction fees, you will be assessed fees for outgoing wire transfers, returned checks and stop payment orders at prevailing rates charged by Mutual Shareholder Services, LLC, the Funds’ transfer agent. IRA accounts will be charged an $8.00 annual maintenance fee. If shares are redeemed within 90 days of purchase from the Funds, the shares are subject to a 2% redemption fee. The following example is intended to help you understand your ongoing costs of investing in the Funds and to compare these costs with similar costs of investing in other mutual funds. The example is based on an investment of $1,000 invested in the Funds on January 1, 2015 and held through June 30, 2015.
The first line of the table below provides information about actual account values and actual expenses. In order to estimate the expenses a shareholder paid during the period covered by this report, shareholders can divide their account value by $1,000 (for example, an $8,600 account value divided by $1,000 = 8.6) and then multiply the result by the number in the first line under the heading entitled "Expenses Paid During the Period."
The second line of the table below provides information about hypothetical account values and hypothetical expenses based on the Funds’ actual expense ratios and an assumed rate of return of 5% per year before expenses, which is not the Funds’ actual return. The hypothetical account values and expenses may not be used to estimate the actual ending account balance or expenses paid by a shareholder for the period. Shareholders may use this information to compare the ongoing costs of investing in the Funds and other funds. In order to do so, compare these 5% hypothetical examples with the 5% hypothetical examples that appear in other funds' shareholder reports.
Please note that the expenses shown in the table are meant to highlight your ongoing costs only and do not reflect any transactional costs, such as the annual maintenance fee charged to IRA accounts, redemption fees, or exchange fees. Therefore, the second line of the table is useful in comparing ongoing costs only, and will not help you determine the relative total costs of owning different funds. In addition, if these transactional costs were included, your costs would have been higher.
| PARADIGM VALUE FUND | ||||||
| Expenses Paid | ||||||
| Beginning | Ending | During the Period* | ||||
| Account Value | Account Value | January 1, 2015 | ||||
| January 1, 2015 | June 30, 2015 | to June 30, 2015 | ||||
| Actual | $1,000.00 | $1,052.97 | $7.64 | |||
| Hypothetical | $1,000.00 | $1,017.36 | $7.50 | |||
| (5% annual return | ||||||
| before expenses) | ||||||
| * Expenses are equal to the Fund’s annualized expense ratio of 1.50%, multiplied by the average account value over the period, multiplied by 181/365 (to reflect the one-half year period). |
| PARADIGM SELECT FUND | ||||||
| Expenses Paid | ||||||
| Beginning | Ending | During the Period* | ||||
| Account Value | Account Value | January 1, 2015 | ||||
| January 1, 2015 | June 30, 2015 | to June 30, 2015 | ||||
| Actual | $1,000.00 | $1,057.45 | $5.87 | |||
| Hypothetical | $1,000.00 | $1,019.09 | $5.76 | |||
| (5% annual return | ||||||
| before expenses) | ||||||
| * Expenses are equal to the Fund’s annualized expense ratio of 1.15%, multiplied by the average account value over the period, multiplied by 181/365 (to reflect the one-half year period). |
2015 Semi-Annual Report 33
| Disclosure of Expenses (Unaudited) - continued | ||||||
| PARADIGM OPPORTUNITY FUND | ||||||
| Expenses Paid | ||||||
| Beginning | Ending | During the Period* | ||||
| Account Value | Account Value | January 1, 2015 | ||||
| January 1, 2015 | June 30, 2015 | to June 30, 2015 | ||||
| Actual | $1,000.00 | $1,070.95 | $6.42 | |||
| Hypothetical | $1,000.00 | $1,018.60 | $6.26 | |||
| (5% annual return | ||||||
| before expenses) | ||||||
| * Expenses are equal to the Fund’s annualized expense ratio of 1.25%, multiplied by the average account value over the period, multiplied by 181/365 (to reflect the one-half year period). |
| PARADIGM MICRO-CAP FUND | ||||||
| Expenses Paid | ||||||
| Beginning | Ending | During the Period* | ||||
| Account Value | Account Value | January 1, 2015 | ||||
| January 1, 2015 | June 30, 2015 | to June 30, 2015 | ||||
| Actual | $1,000.00 | $1,008.03 | $6.22 | |||
| Hypothetical | $1,000.00 | $1,018.60 | $6.26 | |||
| (5% annual return | ||||||
| before expenses) | ||||||
| * Expenses are equal to the Fund’s annualized expense ratio of 1.25%, multiplied by the average account value over the period, multiplied by 181/365 (to reflect the one-half year period). |
2015 Semi-Annual Report 34
ADDITIONAL INFORMATION
June 30, 2015
(Unaudited)
APPROVAL AND RENEWAL OF INVESTMENT ADVISORY AGREEMENTS
At a Meeting of the Board of Trustees held on February 24, 2015 (the “Meeting”) the Board of Trustees (the “Trustees” or the “Board”) considered the continuance of the Management Agreements (the “Agreements”) with Paradigm Funds Advisor LLC (the “Advisor”) for the Paradigm Value Fund (“Value Fund”), the Paradigm Select Fund (“Select Fund”), the Paradigm Opportunity Fund (“Opportunity Fund”), and the Paradigm Micro-Cap Fund (“Micro-Cap Fund”) (each a “Fund”, or collectively, the “Funds”).
In renewing the Agreements, the Board of Trustees received materials from the Advisor (the "Report") addressing the following factors: (i) the investment performance of the Funds and the Advisor; (ii) the nature, extent and quality of the services provided by the Advisor to the Funds; (iii) the cost of the services to be provided and the profits to be realized by the Advisor and its affiliates from the relationship with the Funds; (iv) the extent to which economies of scale will be realized as the Funds grow; and (v) whether the fee levels reflect these economies of scale for the benefit of shareholders.
As to the performance of the Funds, the Report included information regarding the performance of each Fund compared to a group of funds of similar size, style and objective (the "Peer Group"). All performance data was through the period ended December 31, 2014. The report also included comparative performance information for major indexes, each Fund's Morningstar category average, and other accounts managed by the Advisor.
The Report indicated that the Value Fund's ten-year annualized return was higher than its Peer Group average, the Morningstar category average and the comparative index. The Value Fund's one-year, five-year and three-year annualized returns were below its Peer Group average, the comparative index, and the Morningstar category average. Since inception the Value Fund outperformed its comparative index.
The Report indicated that the Select Fund's five-year and three-year annualized returns were below its Peer Group average, the Morningstar category average, and the comparative index. Over the one-year period the Select Fund outperformed the Peer Group average, the Morningstar category average and the comparative index. Since inception the Select Fund outperformed its comparative index.
The Report indicated that the Opportunity Fund's five-year and three-year annualized returns were below its Peer Group average, the Morningstar category average and the comparative index. Over the one-year period the Opportunity Fund outperformed the Peer Group average, the Morningstar category average and the comparative index. Since inception the Opportunity Fund underperformed its comparative index.
The Report indicated that the Micro-Cap Fund's five-year annualized returns were below its Peer Group average, comparative index and Morningstar category average. The Micro-Cap Fund's three-year annualized returns were below the Morningstar category average, and the comparative index, but above the Peer Group average. Over the one-year period the Micro-Cap Fund outperformed the Peer Group average and underperformed the comparative index and the Morningstar category average. Since inception the Micro-Cap Fund outperformed its comparative index.
The Trustees discussed in depth the underperformance in relation to the Peer Group average, the Morningstar category average and the comparative index for certain periods for the Funds. The Advisor addressed some of the factors that have contributed to the Funds' underperformance. In particular, representatives of the Advisor emphasized that the three-year and five-year performance for the Funds (other than Micro-Cap Fund) has been significantly impacted by the significant underperformance of the members of the advisory team that had been replaced in 2013. They pointed out that, under the current advisory team, the Opportunity Fund had achieved outstanding one-year performance and the Select Fund had outperformed over the one-year period and had been upgraded to a "four star" Morningstar ranking.
With respect to the Value Fund, the Advisor indicated that the current advisory team had improved the Fund's relative performance significantly for the one-year period. Representatives of the Advisor also pointed out that nearly all of the comparative index's return was driven by Financials in 2014. They noted that Financials constitute almost 40% of the index's sector weighting, whereas the Fund portfolio managers believe that it is prudent to limit investments in any sector to no more than 25% of the portfolio. In this regard, they pointed out that the Financials sector represented roughly half of the three and five-year return of the index.
With regard to the Micro-Cap Fund, the Advisor pointed out that much of the Fund's underperformance for the one-year period was attributable to the Fund not being invested in Biotech stocks, which significantly
2015 Semi-Annual Report 35
Additional Information (Unaudited) - continued
outperformed in 2014. Representatives of the Advisor indicated that Biotech stocks are more speculative and typically do not meet the Fund's value criteria. Representatives of the Advisor also noted that the three and five-year performance comparisons were not particularly helpful, as the Fund had converted from an "all cap" strategy to a micro-cap strategy and much of the performance over those periods related to the time when the Fund was an "all cap" Fund or in the process of transitioning its portfolio to a micro-cap portfolio.
The Trustees noted the Advisor's explanations for the underperformance of the Funds and concluded, after careful review of the investment process and further discussion with the portfolio managers, that the Advisor was taking appropriate steps to address performance matters. The Trustees indicated that they would closely monitor performance on a going forward basis to determine whether steps the Advisor is taking are improving results. They also noted that the Funds' long-term performance has been successful relative to each Fund's Peer Group, Morningstar category and comparative index.
As to the nature, extent and quality of the services provided by the Advisor, the Trustees analyzed the Advisor's experience and capabilities. The representatives of the Advisor reviewed and discussed with the Board the Advisor's ADV and the Code of Ethics certifications. They summarized the information provided to the Board regarding matters such as the Advisor's research and investment personnel. They also discussed the portfolio managers' backgrounds and investment management experience. Furthermore, they discussed the Advisor's financial information and discussed the firm's ability to meet its obligations under the Agreements. The Board concluded that the nature and extent of the services provided by the Advisor were consistent with their expectations, and that the quality of services, particularly those provided by the portfolio managers, was acceptable. The Trustees also concluded that the Advisor has the resources to provide quality advisory services to the Funds.
As to the costs of the services provided, the Board reviewed the fees under the Agreements compared to the applicable Peer Group and category average. The Trustees noted that each Fund pays a unitary management fee out of which the Advisor pays Fund expenses. As a result, in addition to reviewing the management fees, they agreed that comparison of the total operating expenses is most relevant to the Board deliberations. The Value Fund's expense ratio of 1.50% was found to be higher than the category average of 1.26% and its Peer Group's average expense ratio of 1.18% but within the range of its peers. The Report indicated that the Select Fund's audited expense ratio of 1.15% was lower the category average of 1.26% and its Peer Group's average expense ratio of 1.43%; the Opportunity Fund's audited expense ratio of 1.25% was lower than the category average of 1.26% and its Peer Group's average expense ratio of 1.43%; and that the Micro-Cap Fund's audited expense ratio of 1.25% was lower than its Peer Group's average expense ratio of 1.44% . Additionally, it was noted that while the Advisor's management fees were the highest in the Peer Groups for the Value Fund, the Opportunity Fund, and the Select Fund and near the high end for the Micro-Cap Fund, the Advisor is responsible under the Agreements for paying all but a very small fraction of the Funds' expenses out of the management fees. The Board noted that while the Advisor does not manage any other accounts, Paradigm Capital Management, an affiliate of the Advisor, provides services to: hedge funds (total assets of $308 million at December 31, 2014) for which it receives an annual fee of between 0.75% and 1.00% and a performance fee of 20%; institutional accounts (total assets of $140 million at December 31, 2014) for which it receives fees ranging from 0.55% - 1.00%; and separately managed accounts for high net-worth clients (total assets of $79 million at December 31, 2014) for which it receives fees ranging from 0.75% - 1.50% . The Trustees concluded that the management fees were reasonable. The Trustees reviewed a profit and loss analysis prepared by the Advisor that disclosed the direct and indirect expenses paid by the Advisor on behalf of each Fund, the total revenue derived by the Advisor from each Fund and the pre-tax operating margin of each Fund. The Trustees also reviewed an analysis of mutual fund profitability, which showed the operating margins realized by the Advisor were well within the range on the analysis. The Trustees concluded that the Advisor was not excessively profitable.
As for potential economies of scale, the Trustees discussed and considered information regarding whether economies of scale have been realized with respect to the management of the Funds, whether the Funds have appropriately benefited from any economies of scale, and whether there is potential for realization of any further economies of scale. The Board noted that the Advisor has contractually agreed to waive management fees and reimburse expenses to the extent necessary to maintain total annual operating expenses of the Value Fund (excluding brokerage fees and commissions, interest and other borrowing expenses, taxes, extraordinary expenses and the indirect costs of investing in Acquired Funds) at 1.50% of its average daily net assets through April 30, 2016, thereby benefiting shareholders. The Board noted that the Advisor has contractually agreed to waive management fees and reimburse expenses to the extent necessary to maintain total annual operating expenses of the Select Fund (excluding brokerage fees and commissions, interest and other borrowing expenses, taxes, extraordinary expenses and the indirect costs of investing in Acquired Funds) at 1.15% of its average daily net assets through April 30, 2016, thereby benefiting shareholders. The Board further noted that the Advisor has contractually agreed to waive manage-
2015 Semi-Annual Report 36
Additional Information (Unaudited) - continued
ment fees and reimburse expenses to the extent necessary to maintain total annual operating expenses of the Opportunity Fund (excluding brokerage fees and commissions, interest and other borrowing expenses, taxes, extraordinary expenses and the indirect costs of investing in Acquired Funds) at 1.25% of its average daily net assets through April 30, 2016, thereby benefiting shareholders. As for the Micro-Cap Fund, the Advisor asserted, and the Board agreed, that the current size of the Fund did not warrant any waivers.
In considering the continuance of the management agreements between the Trust and the Advisor, the Independent Trustees did not identify any factor as all-important or all-controlling and instead considered these factors collectively in light of each Fund's surrounding circumstances. Based on the information reviewed, it was the judgment of the Independent Trustees that each Fund's fees were reasonable, the extent and quality of services were acceptable and the Advisor's steps to address performance issues for the Funds were satisfactory. Additionally, as part of its deliberations, the Trustees also considered and relied upon the information about the Funds that had been provided to them throughout the year in connection with their regular Board meetings at which they engage in the ongoing oversight of the Funds and their operations. Next, the independent Trustees met in executive session to discuss the continuation of the Agreements. The officers of the Trust were excused during this discussion.
Upon reconvening the meeting, it was the consensus of the Trustees, including the independent Trustees, that renewal of the Management Agreements would be in the best interests of each Fund and its shareholders.
AVAILABILITY OF QUARTERLY SCHEDULE OF INVESTMENTS
The Funds file their complete schedules of portfolio holdings with the Securities and Exchange Commission ("SEC") for the first and third quarters of each fiscal year on Form N-Q. The Funds’ Forms N-Q are available on the SEC's Web site at http://www.sec.gov. The Funds’ Forms N-Q may also be reviewed and copied at the SEC's Public Reference Room in Washington, DC. Information on the operation of the Public Reference Room may be obtained by calling 1-800-SEC-0330.
PROXY VOTING GUIDELINES
Paradigm Funds Advisor LLC, the Funds’ Advisor, is responsible for exercising the voting rights associated with the securities held by the Funds. A description of the policies and procedures used by the Advisor in fulfilling this responsibility is available without charge on the Funds’ web site at www.paradigm-funds.com. It is also included in the Funds’ Statement of Additional Information, which is available on the Securities and Exchange Commission’s web site at http://www.sec.gov.
Information regarding how the Funds voted proxies, Form N-PX, relating to portfolio securities during the most recent 12-month period ended June 30 is available without charge, upon request, by calling our toll free number(1-800-239-0732). This information is also available on the Securities and Exchange Commission’s web site at http://www.sec.gov.
ADDITIONAL INFORMATION
You will find more information about the Funds at www.paradigm-funds.com. For shareholder inquiries, please call toll-free in the U.S. at 1-800-239-0732.
2015 Semi-Annual Report 37
This page was intentionally left blank.
2015 Semi-Annual Report 38
Board of Trustees
|
| This report is provided for the general information of the shareholders of the Paradigm Funds. This report is not intended for distribution to prospective investors in the Funds, unless preceded or accompanied by an effective prospectus. |
Item 2. Code of Ethics. Not applicable.
Item 3. Audit Committee Financial Expert. Not applicable.
Item 4. Principal Accountant Fees and Services. Not applicable.
Item 5. Audit Committee of Listed Companies. Not applicable.
Item 6. Schedule of Investments. Not applicable. Schedule filed with Item 1.
Item 7. Disclosure of Proxy Voting Policies and Procedures for Closed-End Funds. Not applicable.
Item 8. Portfolio Managers of Closed End Funds. Not applicable.
Item 9. Purchases of Equity Securities by Closed-End Management Investment Companies and Affiliated Purchasers. Not applicable.
Item 10. Submission of Matters to a Vote of Security Holders.
The registrant has not adopted procedures by which shareholders may recommend nominees to the registrant’s board of trustees.
Item 11. Controls and Procedures.
(a) The Registrant’s president and chief financial officer concluded that the disclosure controls and procedures (as defined in Rule 30a-3(c) under the Investment Company Act of 1940 (the “Act”)) were effective as of a date within 90 days of the filing date of this report, based on the evaluation of these controls and procedures required by Rule 30a-3(b) under the Act.
(b) There were no changes in the registrant’s internal control over financial reporting (as defined in Rule 30a-3(d) under the Act) that occurred during the registrant’s second fiscal quarter of the period covered by this report that have materially affected, or are reasonably likely to materially affect, the registrant’s internal control over financial reporting.
Item 12. Exhibits.
(a)(1) Code of Ethics. Not applicable.
(a)(2) Certifications pursuant to Section 302 of the Sarbanes-Oxley Act of 2002. Filed herewith.
(a)(3) Not applicable.
(b) Certification pursuant to Section 906 Certification of the Sarbanes-Oxley Act of 2002. Filed herewith.
SIGNATURES
Pursuant to the requirements of the Securities Exchange Act of 1934 and the Investment Company Act of 1940, the registrant has duly caused this report to be signed on its behalf by the undersigned, thereunto duly authorized.
| Paradigm Funds |
| By: /s/Candace King Weir Candace King Weir President |
| Date: 8-25-2015 |
Pursuant to the requirements of the Securities Exchange Act of 1934 and the Investment Company Act of 1940, this report has been signed below by the following persons on behalf of the registrant and in the capacities and on the dates indicated.
| By: /s/Candace King Weir Candace King Weir President |
| Date: 8-25-2015 |
By: /s/Robert A. Benton |
| Date: 8/25/2015 |