UNITED STATES
SECURITIES AND EXCHANGE COMMISSION
WASHINGTON, D.C. 20549
FORM N-CSR
CERTIFIED SHAREHOLDER REPORT OF REGISTERED MANAGEMENT
INVESTMENT COMPANIES
Investment Company Act file number811-21233
PARADIGM FUNDS
(Exact name of registrant as specified in charter)
Nine Elk Street, Albany, NY 12207-1002
(Address of principal executive offices) (Zip code)
Robert A. Benton
Nine Elk Street, Albany, NY 12207-1002
(Name and address of agent for service)
Registrant's telephone number, including area code:(518) 431-3500
Date of fiscal year end:December 31
Date of reporting period:June 30, 2019
Form N-CSR is to be used by management investment companies to file reports with the Commission not later than 10 days after the transmission to stockholders of any report that is required to be transmitted to stockholders under Rule 30e-1 under the Investment Company Act of 1940 (17 CFR 270.30e -1). The Commission may use the information provided on Form N-CSR in its regulatory, disclosure review, inspection and policymaking roles.
A registrant is required to disclose the information specified by Form N-CSR, and the Commission will make this information public. A registrant is not required to respond to the collection of information contained in Form N-CSR unless the Form displays a currently valid Office of Management and Budget ("OMB") control number.
Item 1. Reports to Stockholders.
Paradigm Funds
Paradigm Value Fund
Paradigm Select Fund
Paradigm Opportunity Fund
Paradigm Micro-Cap Fund
For Investors Seeking Long-Term Capital Appreciation
SEMI-ANNUALREPORT
June 30, 2019
IMPORTANT NOTE:Beginning on January 1, 2021, as permitted by regulations adopted by the Securities
|
| Table of Contents | |
| PARADIGM FUNDS | |
| Letter to Shareholders | 2 |
| Sector Allocation | 5 |
| Performance Information | 7 |
| Schedules of Investments | 11 |
| Statements of Assets and Liabilities | 21 |
| Statements of Operations | 21 |
| Statements of Changes in Net Assets | 23 |
| Financial Highlights | 25 |
| NOTES TO FINANCIAL STATEMENTS | 27 |
| DISCLOSURE OF EXPENSES | 33 |
| ADDITIONAL INFORMATION | 35 |
2019 Semi-Annual Report 1
Letter to Shareholders
Dear Fellow Shareholders:
Our year-end letter for 2018 highlighted the extreme market volatility we had seen in the fourth quarter, and the first half of 2019 has remained an unpredictable ride. While it seemed evident that the extremely strong performance of the first quarter of 2019 was unlikely to be sustainable or replicable, this proved true almost immediately as the second quarter of the year doubled down on that theme. Trade and tariff brinksmanship caused markets to whipsaw, and June’s recovery thankfully moderated May’s pain. While the overall market volatility proved unpredictable, the consistent outperformance of large-cap over small-cap and Growth over Value remained stubbornly intact.
From a macro perspective, the key topic of 2019 has been the US-China trade tension and industry-specific fallout. While many of the macro data points remain stable to positive for the US economy, there have been recent suggestions that some of these data points could be signaling wavering consumer confidence. While it is impossible to draw clear causality, it comes as no surprise that US corporations are facing multiple uncertainties related to tariff impacts, supply chain hurdles, and global partnerships. Thus, we could see corporations slowing or pausing some of their spending as they reevaluate and re-strategize their capital allocation plans and geographic footprints.
Not that the markets seem to be focused on macro fundamentals, but the US economy overall remains on track. In recent economic reports, the most recent jobs data came in strong with the unemployment rate at a still-low 3.7%, coupled with an improvement in the labor participation rate as of June 30, 2019. The Institute for Supply Management (“ISM”) manufacturing index as of June 30, 2019 declined less than expected, to 51.7, while the ISM services index came in slightly below-consensus at 55.1 as of the same date. While both of these indices remain in expansionary territory, it is worth noting that these recent readings have indicated the weakest pace of expansion in the non-manufacturing sector since July 2017.
A year ago, corporate management teams sounded universally upbeat, as they benefited from the corporate tax cut tailwind. Today, however, we are undoubtedly hearing a more cautious tone from management teams, as they are in the midst of evaluating the ramifications of the many cross-currents noted above. While the underlying baseline environment for their businesses may be intact, it is clearly a less predictable landscape for most companies. Moreover, this increased backdrop of uncertainty appears to be amplified for those companies in the small-cap arena.
As we now look to the second half of 2019, we expect that the market will remain volatile over the balance of the year given the lack of resolution to global trade tensions among many variables. Nonetheless, we do take some comfort in our belief that this is a stock picker’s market, where our historical knowledge of certain industries and sectors should allow us to identify opportunities amidst the tumult. That being said, we are taking an even harder look at downside protection. Clearly these markets have proven unforgiving when volatility increases to the downside, and so we have renewed our focus and rigor around balance sheet exposure, as well as operating expense and capital expenditure (capex) discipline. Free cash flow remains key in any scenario as a core tenet of our investment philosophy.
2019 Semi-Annual Report 2
Paradigm Value Fund
The Paradigm Value Fund gained 12.16% in the first half of 2019, compared to a 13.47% gain for its benchmark, the Russell 2000 Value Index. Since inception (January 1, 2003) on an annualized basis, the Fund has returned 12.45%, compared to 9.57% for the benchmark.
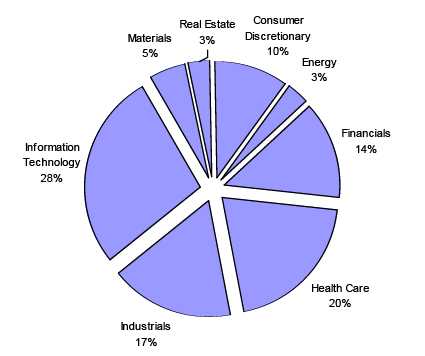
The Information Technology sector was the largest contributor in the first half of 2019, driven primarily by the Semiconductors & Semiconductor Equipment industry.
The Consumer Discretionary sector proved the most challenging in the first half of 2019, reflecting investor concerns about the general retail environment as well as potential Chinese tariff implications for the apparel supply chain.
Paradigm Select Fund
The Paradigm Select Fund gained 19.30% in the first half of 2019, compared to a gain of 19.25% for its benchmark, the Russell 2500 Index. Since inception (January 1, 2005) on an annualized basis, the Fund has returned 8.81% compared to 8.59% for the benchmark.
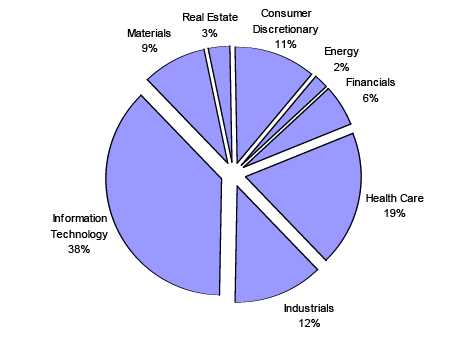
The Information Technology sector was the largest contributor in the first half of 2019, driven primarily by the Semiconductors & Semiconductor Equipment industry.
The Financials sector was an area of relative underperformance despite the portfolio sector’s return of 28.79% over the first half of 2019, compared to 17.94% for the benchmark sector, due to a lower average weighting in the portfolio.
Paradigm Opportunity Fund
The Paradigm Opportunity Fund gained 12.03% in the first half of 2019, compared to the benchmark Russell 2000’s 16.98% return. Since inception (January 1, 2005) on an annualized basis, the Fund has returned 7.10%, compared to 7.68% for the benchmark.
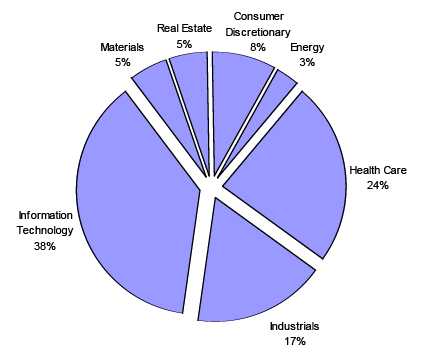
The Information Technology sector was the largest contributor in the first half of 2019, driven primarily by the Semiconductors & Semiconductor Equipment industry.
The Consumer Discretionary sector proved the most challenging in the first half of 2019, reflecting investor concerns about the general retail environment as well as potential Chinese tariff implications for the apparel supply chain.
Paradigm Micro-Cap Fund
The Paradigm Micro-Cap Fund gained 9.22% in the first half of 2019, compared to the benchmark Russell Microcap Index’s 14.15% return. Since inception (January 1, 2008) on an annualized basis, the Fund has returned 7.06%, compared to 6.58% for the benchmark.
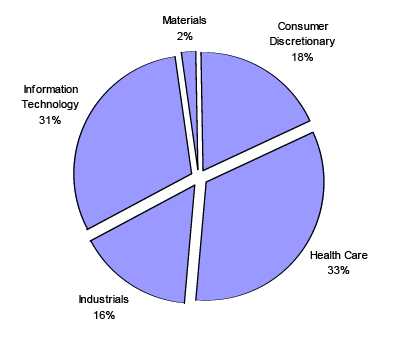
Strong stock selection made the Healthcare sector the top performer in the first half of 2019. The portfolio sector’s 30.09% gain over the period outpaced the benchmark sector’s 18.04% return, driven by holdings in the Health Care Equipment & Services and the Health Care Technology industries.
2019 Semi-Annual Report 3
The Consumer Discretionary sector proved the most challenging in the first half of 2019, reflecting investor concerns about the general retail environment as well as potential Chinese tariff implications for the apparel supply chain.
Sincerely,

Candace King Weir | Amelia F. Weir |
Past performance does not guarantee future results. Investment return and principal value will fluctuate so that shares, when redeemed, may be worth more or less than their original cost. Returns do not reflect the deduction of taxes that a shareholder would pay on fund distributions or the redemption of fund shares. Current performance may be lower or higher that the performance data quoted. To obtain performance data current to the most recent month end, please call 1-800-239-0732 or visit our website at www.paradigm-funds.com.
2019 Semi-Annual Report 4
Paradigm Funds(Unaudited)
PARADIGM VALUE FUND
Sector Allocation as of June 30, 2019
(As a Percentage of Equity Securities Held)
PARADIGM SELECT FUND
Sector Allocation as of June 30, 2019
(As a Percentage of Equity Securities Held)
2019 Semi-Annual Report 5
Paradigm Funds(Unaudited)
PARADIGM OPPORTUNITY FUND
Sector Allocation as of June 30, 2019
(As a Percentage of Equity Securities Held)
PARADIGM MICRO-CAP FUND
Sector Allocation as of June 30, 2019
(As a Percentage of Equity Securities Held)
2019 Semi-Annual Report 6
Paradigm Value Fund(Unaudited)
PERFORMANCE INFORMATION
Average Annualized Rate of Return (%) for the Periods Ended June 30, 2019.
June 30, 2019 NAV $47.04
| 1 Year(A) | 3 Year(A) | 5 Year(A) | 10 Year(A) | |||||
| Paradigm Value Fund | (0.53)% | 14.82% | 7.14% | 11.46% | ||||
| Russell 2000® Value Index(B) | (6.24)% | 9.81% | 5.39% | 12.40% |
(A)1 Year, 3 Year, 5 Year and 10 Year returns include change in share prices and in each case includes reinvestment of any dividends and capital gain distributions. The inception date of the Paradigm Value Fund was January 1, 2003.
(B)The Russell 2000® Value Index (whose composition is different from the Fund) is an unmanaged index of small-capitalization stocks with lower price-to-book ratios and lower forecasted growth values than the total population of small-capitalization stocks.
Per the Fund’s most recent prospectus, the Fund’s Total Annual Operating Expense Ratio is 1.51% . The Total Annual Operating Expense Ratio may not correlate to the expense ratio in the Fund’s financial highlights because the financial highlights only include the direct operating expenses incurred by the Fund, not the indirect costs of investing in acquired funds. Shares redeemed within 90 days of purchase are subject to a 2.00% redemption fee.
PASTPERFORMANCEDOESNOTGUARANTEEFUTURERESULTS. INVESTMENTRETURNANDPRINCIPALVALUEWILLFLUCTUATESOTHATSHARES, WHENREDEEMED, MAYBEWORTHMOREORLESSTHANTHEIRORIGINALCOST. RETURNSDONOTREFLECTTHEDEDUCTIONOFTAXESTHATA SHAREHOLDERWOULDPAYONFUNDDISTRIBUTIONSORTHEREDEMPTIONOFFUNDSHARES. CURRENTPERFORMANCEMAYBELOWERORHIGHERTHATTHEPERFORMANCEDATAQUOTED. TOOBTAINPERFORMANCEDATACURRENTTOTHEMOSTRECENTMONTHEND, PLEASECALL1-800-239-0732ORVISITOURWEBSITEAT www.paradigm-funds.com.
2019 Semi-Annual Report 7
Paradigm Select Fund(Unaudited)
PERFORMANCE INFORMATION
Average Annualized Rate of Return (%) for the Periods Ended June 30, 2019.
June 30, 2019 NAV $39.07
| 1 Year(A) | 3 Year(A) | 5 Year(A) | 10 Year(A) | |||||
| Paradigm Select Fund | 2.39% | 13.43% | 7.59% | 12.72% | ||||
| Russell 2500® Index(B) | 1.77% | 12.34% | 7.66% | 14.44% |
(A)1 Year, 3 Year, 5 Year and 10 Year returns include change in share prices and in each case includes reinvestment of any dividends and capital gain distributions. The inception date of the Paradigm Select Fund was January 1, 2005.
(B)The Russell 2500® Index (whose composition is different from the Fund) measures the performance of the small to mid-cap segment of the U.S. equity universe, commonly referred to as “mid” cap. The Russell 2500 Index is a subset of the Russell 3000® Index. It includes approximately 2,500 of the smallest securities based on a combination of their market cap and current index membership.
Per the Fund’s most recent prospectus, the Fund’s Total Annual Operating Expense Ratio (before any fee waiver) is 1.51%, and 1.16% post waiver. The Advisor has contractually agreed to waive management fees and reimburse expenses to the extent necessary to maintain total annual operating expenses of the Fund (excluding brokerage fees and commissions, interest and other borrowing expenses, taxes, extraordinary expenses and the indirect costs of investing in Acquired Funds) at 1.15% of its average daily net assets through April 30, 2020. The Total Annual Operating Expense Ratio may not correlate to the expense ratio in the Fund’s financial highlights because the financial highlights only include the direct operating expenses incurred by the Fund, not the indirect costs of investing in acquired funds. Shares redeemed within 90 days of purchase are subject to a 2.00% redemption fee.
PASTPERFORMANCEDOESNOTGUARANTEEFUTURERESULTS. INVESTMENTRETURNANDPRINCIPALVALUEWILLFLUCTUATESOTHATSHARES, WHENREDEEMED, MAYBEWORTHMOREORLESSTHANTHEIRORIGINALCOST. RETURNSDONOTREFLECTTHEDEDUCTIONOFTAXESTHATA SHAREHOLDERWOULDPAYONFUNDDISTRIBUTIONSORTHEREDEMPTIONOFFUNDSHARES. CURRENTPERFORMANCEMAYBELOWERORHIGHERTHATTHEPERFORMANCEDATAQUOTED. TOOBTAINPERFORMANCEDATACURRENTTOTHEMOSTRECENTMONTHEND, PLEASECALL1-800-239-0732ORVISITOURWEBSITEAT www.paradigm-funds.com.
2019 Semi-Annual Report 8
Paradigm Opportunity Fund(Unaudited)
PERFORMANCE INFORMATION
Average Annualized Rate of Return (%) for the Periods Ended June 30, 2019.
June 30, 2019 NAV $42.27
| 1 Year(A) | 3 Year(A) | 5 Year(A) | 10 Year(A) | |||||
| Paradigm Opportunity Fund | (3.22)% | 13.10% | 6.18% | 11.61% | ||||
| Russell 2000® Index(B) | (3.31)% | 12.30% | 7.06% | 13.45% |
(A)1 Year, 3 Year, 5 Year and 10 Year returns include change in share prices and in each case includes reinvestment of any dividends, capital gain distributions and return of capital. The inception date of the Paradigm Opportunity Fund was January 1, 2005.
(B)The Russell 2000® Index (whose composition is different from the Fund) consists of the smallest 2,000 companies in the Russell 3000 Index (which represents approximately 98% of the investable U.S. equity market). The Index is an unmanaged index generally considered as the premier of small capitalization stocks.
Per the Fund’s most recent prospectus, the Fund’s Total Annual Operating Expense Ratio (before any fee waiver) is 1.51%, and 1.26% post waiver. The Advisor has contractually agreed to waive management fees and reimburse expenses to the extent necessary to maintain total annual operating expenses of the Fund (excluding brokerage fees and commissions, interest and other borrowing expenses, taxes, extraordinary expenses and the indirect costs of investing in Acquired Funds) at 1.25% of its average daily net assets through April 30, 2020. The Total Annual Operating Expense Ratio may not correlate to the expense ratio in the Fund’s financial highlights because the financial highlights only include the direct operating expenses incurred by the Fund, not the indirect costs of investing in acquired funds. Shares redeemed within 90 days of purchase are subject to a 2.00% redemption fee.
PASTPERFORMANCEDOESNOTGUARANTEEFUTURERESULTS. INVESTMENTRETURNANDPRINCIPALVALUEWILLFLUCTUATESOTHATSHARES, WHENREDEEMED, MAYBEWORTHMOREORLESSTHANTHEIRORIGINALCOST. RETURNSDONOTREFLECTTHEDEDUCTIONOFTAXESTHATA SHAREHOLDERWOULDPAYONFUNDDISTRIBUTIONSORTHEREDEMPTIONOFFUNDSHARES. CURRENTPERFORMANCEMAYBELOWERORHIGHERTHATTHEPERFORMANCEDATAQUOTED. TOOBTAINPERFORMANCEDATACURRENTTOTHEMOSTRECENTMONTHEND, PLEASECALL1-800-239-0732ORVISITOURWEBSITEAT www.paradigm-funds.com.
2019 Semi-Annual Report 9
Paradigm Micro-Cap Fund(Unaudited)
PERFORMANCE INFORMATION
Average Annualized Rate of Return (%) for the Periods Ended June 30, 2019.
June 30, 2019 NAV $27.59
| 1 Year(A) | 3 Year(A) | 5 Year(A) | 10 Year(A) | |||||
| Paradigm Micro-Cap Fund | (14.65)% | 12.98% | 7.22% | 10.98% | ||||
| Russell Microcap® Index(B) | (10.39)% | 11.19% | 5.52% | 12.54% |
(A)1 Year, 3 Year, 5 Year and 10 Year returns include change in share prices and in each case includes reinvestment of any dividends and capital gain distributions. The inception date of the Paradigm Micro-Cap Fund was January 1, 2008.
(B)The Russell Microcap® Index measures the performance of the microcap segment of the U.S. equity market. Microcap stocks make up less than 3% of the U.S. equity market (by market cap) and consist of the smallest 1,000 securities in the small-cap Russell 2000® Index, plus the next smallest eligible securities by market cap. The Russell Microcap is completely reconstituted annually to ensure larger stocks do not distort performance and characteristics of the true microcap opportunity set. Effective December 27, 2011 the Fund changed its investment strategy. Under normal circumstances, the Micro-Cap Fund invests at least 80% of its net assets in common stocks of U.S. micro-cap companies. Therefore, the primary comparative index was changed from the S&P 500® Index to the Russell Microcap® Index.
Per the Fund’s most recent prospectus, the Fund’s Total Annual Operating Expense Ratio is 1.26% . The Total Annual Operating Expense Ratio may not correlate to the expense ratio in the Fund’s financial highlights because the financial highlights only include the direct operating expenses incurred by the Fund, not the indirect costs of investing in acquired funds. Shares redeemed within 90 days of purchase are subject to a 2.00% redemption fee.
PASTPERFORMANCEDOESNOTGUARANTEEFUTURERESULTS. INVESTMENTRETURNANDPRINCIPALVALUEWILLFLUCTUATESOTHATSHARES, WHENREDEEMED, MAYBEWORTHMOREORLESSTHANTHEIRORIGINALCOST. RETURNSDONOTREFLECTTHEDEDUCTIONOFTAXESTHATA SHAREHOLDERWOULDPAYONFUNDDISTRIBUTIONSORTHEREDEMPTIONOFFUNDSHARES. CURRENTPERFORMANCEMAYBELOWERORHIGHERTHATTHEPERFORMANCEDATAQUOTED. TOOBTAINPERFORMANCEDATACURRENTTOTHEMOSTRECENTMONTHEND, PLEASECALL1-800-239-0732ORVISITOURWEBSITEAT www.paradigm-funds.com.
2019 Semi-Annual Report 10
| Paradigm Value Fund | |||||
| Schedule of Investments | |||||
| June 30, 2019 (Unaudited) | |||||
| Shares | Fair Value | % of Net Assets | |||
| COMMON STOCKS | |||||
| Air Courier Services | |||||
| 59,000 | Air Transport Services Group, Inc. * | $ | 1,439,600 | 2.73 | % |
| Aircraft Parts & Auxiliary Equipment, NEC | |||||
| 10,000 | Ducommun Incorporated * | 450,700 | 0.85 | % | |
| Communications Equipment, NEC | |||||
| 10,000 | Lumentum Holdings Inc. * | 534,100 | |||
| 25,000 | Vocera Communications, Inc. * | 798,000 | |||
| 1,332,100 | 2.52 | % | |||
| Communications Services, NEC | |||||
| 80,000 | Calix, Inc. * | 524,800 | 1.00 | % | |
| Computer Communications Equipment | |||||
| 124,300 | A10 Networks, Inc. * | 847,726 | |||
| 110,000 | Extreme Networks, Inc. * | 711,700 | |||
| 1,559,426 | 2.96 | % | |||
| Construction - Special Trade Contractors | |||||
| 76,800 | Matrix Service Co. * | 1,555,968 | 2.95 | % | |
| Electrical Work | |||||
| 19,700 | EMCOR Group Inc. | 1,735,570 | 3.29 | % | |
| Electronic Computers | |||||
| 6,000 | Omnicell, Inc. * | 516,180 | 0.98 | % | |
| Footwear, (No Rubber) | |||||
| 10,000 | Caleres, Inc. | 199,200 | 0.38 | % | |
| Heavy Construction Other Than Building Construction - Contractors | |||||
| 20,000 | Granite Construction Incorporated | 963,600 | 1.83 | % | |
| Industrial Organic Chemicals | |||||
| 21,700 | Sensient Technologies Corporation | 1,594,516 | 3.02 | % | |
| Laboratory Analytical Instruments | |||||
| 19,200 | PerkinElmer Inc. | 1,849,728 | 3.51 | % | |
| Millwood, Veneer, Plywood, & Structural Wood Members | |||||
| 5,000 | American Woodmark Corporation * | 423,100 | 0.80 | % | |
| Mining & Quarrying of Nonmetallic Minerals (No Fuels) | |||||
| 45,000 | Summit Materials, Inc. - Class A * | 866,250 | 1.64 | % | |
| Motor Vehicle Parts & Accessories | |||||
| 53,000 | Tower International, Inc. | 1,033,500 | 1.96 | % | |
| National Commercial Banks | |||||
| 39,500 | First Merchants Corporation | 1,497,050 | |||
| 14,936 | National Bank Holdings Corporation - Class A | 542,177 | |||
| 2,039,227 | 3.87 | % | |||
| Office Machines, NEC | |||||
| 20,000 | Pitney Bowes Inc. | 85,600 | 0.16 | % | |
| Optical Instruments & Lenses | |||||
| 8,000 | II-VI Incorporated * | 292,480 | 0.55 | % | |
| Orthopedic, Prosthetic & Surgical Appliances & Supplies | |||||
| 120,000 | RTI Surgical, Inc. * | 510,000 | 0.97 | % | |
| Printed Circuit Boards | |||||
| 15,000 | Jabil Circuit, Inc. | 474,000 | 0.90 | % | |
| Retail - Apparel & Accessory Stores | |||||
| 20,000 | Citi Trends, Inc. | 292,400 | |||
| 85,400 | Express Inc. * | 233,142 | |||
| 33,400 | Tailored Brands, Inc. | 192,718 | |||
| 718,260 | 1.36 | % | |||
| Retail - Catalog & Mail-Order Houses | |||||
| 5,000 | Insight Enterprises, Inc. * | 291,000 | 0.55 | % | |
| * Non-Income Producing Securities. The accompanying notes are an integral part of these financial statements. |
2019 Semi-Annual Report 11
| Paradigm Value Fund | |||||
| Schedule of Investments | |||||
| June 30, 2019 (Unaudited) | |||||
| Shares | Fair Value | % of Net Assets | |||
| COMMON STOCKS | |||||
| Retail - Family Clothing Stores | |||||
| 67,600 | American Eagle Outfitters, Inc. | $ | 1,142,440 | 2.17 | % |
| Retail - Miscellaneous Shopping Goods Stores | |||||
| 50,000 | Barnes & Noble, Inc. | 334,500 | 0.63 | % | |
| Retail - Retail Stores, NEC | |||||
| 8,200 | IAC/InterActiveCorp. * | 1,783,746 | 3.38 | % | |
| Retail - Shoe Stores | |||||
| 14,500 | Designer Brands Inc. - Class A | 277,965 | |||
| 24,800 | Foot Locker, Inc. | 1,039,616 | |||
| 1,317,581 | 2.50 | % | |||
| Retail - Women's Clothing Stores | |||||
| 80,000 | RTW Retailwinds, Inc. * | 136,000 | 0.26 | % | |
| Savings Institution, Federally Chartered | |||||
| 23,000 | LegacyTexas Financial Group, Inc. | 936,330 | 1.78 | % | |
| Semiconductors & Related Devices | |||||
| 61,600 | Kulicke & Soffa Industries Inc. (Singapore) | 1,389,080 | |||
| 40,000 | NeoPhotonics Corporation * | 167,200 | |||
| 7,588 | Marvell Technology Group Ltd. (Bermuda) | 181,126 | |||
| 20,400 | Qorvo, Inc. * | 1,358,844 | |||
| 3,096,250 | 5.87 | % | |||
| Services - Business Services, NEC | |||||
| 21,400 | Tabula Rasa HealthCare, Inc. * | 1,068,502 | 2.03 | % | |
| Services - Computer Integrated Systems Design | |||||
| 20,000 | Allscripts Healthcare Solutions, Inc. * | 232,600 | |||
| 100,000 | Ribbon Communications Inc. * | 489,000 | |||
| 721,600 | 1.37 | % | |||
| Services - Help Supply Services | |||||
| 44,400 | Kforce Inc. | 1,557,996 | 2.95 | % | |
| Services - Home Health Care Services | |||||
| 24,300 | Addus HomeCare Corporation * | 1,821,285 | 3.45 | % | |
| Services - Hospitals | |||||
| 17,400 | Magellan Health Services Inc. * | 1,291,602 | |||
| 21,650 | MEDNAX, Inc. * | 546,229 | |||
| 1,837,831 | 3.49 | % | |||
| Services - Management Services | |||||
| 60,000 | R1 RCM Inc. * | 754,800 | 1.43 | % | |
| Services - Skilled Nursing Care Facilities | |||||
| 10,000 | The Ensign Group, Inc. | 569,200 | 1.08 | % | |
| Special Industry Machinery (No Metalworking Machinery) | |||||
| 3,500 | Kadant Inc. | 317,835 | 0.60 | % | |
| Special Industry Machinery, NEC | |||||
| 50,800 | Brooks Automation, Inc. | 1,968,500 | 3.73 | % | |
| State Commercial Banks | |||||
| 23,000 | Banner Corporation | 1,245,450 | |||
| 36,000 | Renasant Corporation | 1,293,840 | |||
| 2,539,290 | 4.82 | % | |||
| Telegraph & Other Message Communications | |||||
| 18,900 | j2 Global, Inc. | 1,680,021 | 3.19 | % | |
| Telephone & Telegraph Apparatus | |||||
| 6,000 | Fabrinet (Thailand) * | 298,020 | 0.57 | % | |
| Transportation Services | |||||
| 15,400 | GATX Corp. | 1,221,066 | 2.32 | % | |
| Wholesale - Computers & Peripheral Equipment & Software | |||||
| 10,832 | SYNNEX Corporation | 1,065,869 | 2.02 | % | |
| * Non-Income Producing Securities. The accompanying notes are an integral part of these financial statements. |
2019 Semi-Annual Report 12
| Paradigm Value Fund | |||||||
| Schedule of Investments | |||||||
| June 30, 2019 (Unaudited) | |||||||
| Shares | Fair Value | % of Net Assets | |||||
| COMMON STOCKS | |||||||
| Wholesale - Hardware | |||||||
| 40,000 | Wesco Aircraft Holdings, Inc. * | $ | 444,000 | 0.84 | % | ||
| Total for Common Stocks (Cost $26,961,980) | 47,067,467 | 89.26 | % | ||||
| REAL ESTATE INVESTMENT TRUSTS | |||||||
| 41,500 | Blackstone Mortgage Trust, Inc. - Class A | 1,476,570 | |||||
| 14,750 | Mid-America Apartment Communities Inc. | 1,736,960 | |||||
| 8,000 | TPG RE Finance Trust, Inc. | 154,320 | |||||
| Total for Real Estate Investment Trusts (Cost $1,771,481) | 3,367,850 | 6.38 | % | ||||
| MONEY MARKET FUNDS | |||||||
| 2,334,032 | SEI Daily Income Trust Government Fund CL F 2.12% ** | 2,334,032 | 4.43 | % | |||
| Total for Money Market Funds (Cost $2,334,032) | |||||||
| Total Investment Securities | 52,769,349 | 100.07 | % | ||||
| (Cost $31,067,493) | |||||||
| Liabilities in Excess of Other Assets | (39,389 | ) | -0.07 | % | |||
| Net Assets | $ | 52,729,960 | 100.00 | % | |||
| * Non-Income Producing Securities. ** The Yield Rate shown represents the 7-day yield at June 30, 2019. |
| The accompanying notes are an integral part of these financial statements. |
2019 Semi-Annual Report 13
| Paradigm Select Fund | ||||||
| Schedule of Investments | ||||||
| June 30, 2019 (Unaudited) | ||||||
| Shares | Fair Value | % of Net Assets | ||||
| COMMON STOCKS | ||||||
| Chemical & Allied Products | ||||||
| 1,775 | Innospec Inc. | $ | 161,951 | |||
| 6,725 | Olin Corp. | 147,345 | ||||
| 309,296 | 1.09 | % | ||||
| Communications Equipment, NEC | ||||||
| 9,500 | Lumentum Holdings Inc. * | 507,395 | 1.79 | % | ||
| Construction - Special Trade Contractors | ||||||
| 27,300 | Matrix Service Co. * | 553,098 | 1.96 | % | ||
| Electrical Work | ||||||
| 5,700 | EMCOR Group Inc. | 502,170 | 1.77 | % | ||
| Electromedical & Electrotherapeutic Apparatus | ||||||
| 11,400 | Masimo Corporation * | 1,696,548 | 5.99 | % | ||
| Fire, Marine & Casualty Insurance | ||||||
| 3,950 | American Financial Group Inc. | 404,756 | 1.43 | % | ||
| Footwear (No Rubber) | ||||||
| 15,000 | Caleres, Inc. | 298,800 | 1.06 | % | ||
| General Industrial Machinery & Equipment | ||||||
| 14,900 | Rexnord Corporation * | 450,278 | 1.59 | % | ||
| Industrial Instruments For Measurement, Display, and Control | ||||||
| 8,700 | MKS Instruments, Inc. | 677,643 | 2.39 | % | ||
| Industrial Organic Chemicals | ||||||
| 5,800 | Sensient Technologies Corporation | 426,184 | ||||
| 4,350 | Westlake Chemical Corp. | 302,151 | ||||
| 728,335 | 2.57 | % | ||||
| Instruments For Measurement & Testing of Electricity & Electric Signals | ||||||
| 18,675 | Teradyne, Inc. | 894,719 | 3.16 | % | ||
| Laboratory Analytical Instruments | ||||||
| 9,700 | PerkinElmer Inc. | 934,498 | 3.30 | % | ||
| Millwood, Veneer, Plywood, & Structural Wood Members | ||||||
| 5,400 | American Woodmark Corporation * | 456,948 | 1.62 | % | ||
| Mining & Quarrying of Nonmetallic Minerals (No Fuels) | ||||||
| 15,000 | Summit Materials, Inc. - Class A * | 288,750 | 1.02 | % | ||
| Miscellaneous Manufacturing Industries | ||||||
| 6,600 | Hillenbrand, Inc. | 261,162 | 0.92 | % | ||
| Motor Vehicle Parts & Accessories | ||||||
| 6,700 | Dana Incorporated * | 133,598 | 0.47 | % | ||
| Optical Instruments & Lenses | ||||||
| 7,000 | II-VI Incorporated * | 255,920 | 0.90 | % | ||
| Plastics Products | ||||||
| 13,500 | Entegris, Inc. | 503,820 | 1.78 | % | ||
| Printed Circuit Boards | ||||||
| 26,800 | Jabil Circuit, Inc. | 846,880 | ||||
| 18,000 | TTM Technologies, Inc. * | 183,600 | ||||
| 1,030,480 | 3.64 | % | ||||
| Retail - Apparel & Accessory Stores | ||||||
| 8,950 | Tailored Brands, Inc. | 51,642 | 0.18 | % | ||
| Retail - Catalog & Mail-Order Houses | ||||||
| 5,000 | Insight Enterprises, Inc. * | 291,000 | 1.03 | % | ||
| Retail - Eating & Drinking Places | ||||||
| 6,700 | Cannae Holdings, Inc. * | 194,166 | 0.69 | % | ||
| * Non-Income Producing Securities. The accompanying notes are an integral part of these financial statements. |
2019 Semi-Annual Report 14
| Paradigm Select Fund | |||||
| Schedule of Investments | |||||
| June 30, 2019 (Unaudited) | |||||
| Shares | Fair Value | % of Net Assets | |||
| COMMON STOCKS | |||||
| Retail - Family Clothing Stores | |||||
| 22,900 | American Eagle Outfitters, Inc. | $ | 387,010 | 1.37 | % |
| Retail - Lumber & Other Building Materials Dealers | |||||
| 33,600 | BMC Stock Holdings, Inc. * | 712,320 | 2.52 | % | |
| Retail - Radio, TV & Consumer Electronics Stores | |||||
| 12,400 | Best Buy Co., Inc. | 864,652 | 3.05 | % | |
| Retail - Retail Stores, NEC | |||||
| 6,600 | IAC/InterActiveCorp. * | 1,435,698 | 5.07 | % | |
| Retail - Shoe Stores | |||||
| 13,300 | Foot Locker, Inc. | 557,536 | 1.97 | % | |
| Savings Institution, Federally Chartered | |||||
| 7,800 | Capitol Federal Financial, Inc. | 107,406 | 0.38 | % | |
| Search, Detection, Navigation, Guidance, Aeronautical Systems | |||||
| 6,800 | Garmin Ltd. (Switzerland) | 542,640 | 1.92 | % | |
| Semiconductors & Related Devices | |||||
| 20,500 | Kulicke & Soffa Industries Inc. (Singapore) | 462,275 | |||
| 32,025 | Marvell Technology Group Ltd. (Bermuda) | 764,437 | |||
| 11,200 | Qorvo, Inc. * | 746,032 | |||
| 7,200 | Skyworks Solutions, Inc. | 556,344 | |||
| 2,529,088 | 8.93 | % | |||
| Services - Computer Integrated Systems Design | |||||
| 39,400 | Allscripts Healthcare Solutions, Inc. * | 458,222 | 1.62 | % | |
| Services - Help Supply Services | |||||
| 18,625 | Kelly Services, Inc. - Class A | 487,789 | |||
| 11,350 | Kforce Inc. | 398,271 | |||
| 886,060 | 3.13 | % | |||
| Services - Hospitals | |||||
| 9,000 | Magellan Health Services Inc. * | 668,070 | |||
| 8,000 | MEDNAX, Inc. * | 201,840 | |||
| 869,910 | 3.07 | % | |||
| Services - Prepackaged Software | |||||
| 1,809 | Black Knight, Inc. * | 108,811 | |||
| 8,300 | Progress Software Corporation | 362,046 | |||
| 470,857 | 1.66 | % | |||
| Steel Pipe & Tubes | |||||
| 15,750 | Allegheny Technologies Incorporated * | 396,900 | 1.40 | % | |
| Steel Works, Blast Furnaces & Rolling Mills (Coke Ovens) | |||||
| 6,200 | Carpenter Technology Corporation | 297,476 | 1.05 | % | |
| Surgical & Medical Instruments & Apparatus | |||||
| 26,700 | Globus Medical, Inc. - Class A * | 1,129,410 | 3.99 | % | |
| Telegraph & Other Message Communications | |||||
| 7,300 | j2 Global, Inc. | 648,897 | 2.29 | % | |
| Telephone & Telegraph Apparatus | |||||
| 4,500 | Fabrinet * (Thailand) | 223,515 | 0.79 | % | |
| Title Insurance | |||||
| 5,900 | Fidelity National Financial, Inc. | 237,770 | 0.84 | % | |
| Wholesale - Computers & Peripheral Equipment & Software | |||||
| 8,600 | SYNNEX Corporation | 846,240 | 2.99 | % | |
| Wholesale - Electrical Apparatus & Equipment, Wiring Supplies | |||||
| 8,000 | EnerSys | 548,000 | |||
| 4,500 | WESCO International, Inc. * | 227,925 | |||
| 775,925 | 2.74 | % | |||
| * Non-Income Producing Securities. The accompanying notes are an integral part of these financial statements. |
2019 Semi-Annual Report 15
| Paradigm Select Fund | ||||||
| Schedule of Investments | ||||||
| June30, 2019 (Unaudited) | ||||||
| Shares | Fair Value | % of Net Assets | ||||
| COMMON STOCKS | ||||||
| Wholesale - Lumber & Other Construction Materials | ||||||
| 8,400 Boise Cascade Company | $ | 236,124 | 0.83 | % | ||
| Total for Common Stocks (Cost $19,605,762) | 26,038,678 | 91.96 | % | |||
| REAL ESTATE INVESTMENT TRUSTS | ||||||
| 5,900 Mid-America Apartment Communities Inc. | 694,784 | 2.46 | % | |||
| Total for Real Estate Investment Trusts (Cost $500,280) | ||||||
| MONEY MARKET FUNDS | ||||||
| 2,220,303 SEI Daily Income Trust Government Fund CL F 2.12% ** | 2,220,303 | 7.84 | % | |||
| Total for Money Market Funds (Cost $2,220,303) | ||||||
| Total Investment Securities | 28,953,765 | 102.26 | % | |||
| (Cost $22,326,345) | ||||||
| Liabilities in Excess of Other Assets | (639,004 | ) | -2.26 | % | ||
| Net Assets | $ | 28,314,761 | 100.00 | % | ||
| ** The Yield Rate shown represents the 7-day yield at June 30, 2019. The accompanying notes are an integral part of these financial statements. |
2019 Semi-Annual Report 16
| Paradigm Opportunity Fund | ||||||
| Schedule of Investments | ||||||
| June 30, 2019 (Unaudited) | ||||||
| Shares | Fair Value | % of Net Assets | ||||
| COMMON STOCKS | ||||||
| Construction - Special Trade Contractors | ||||||
| 12,500 | Matrix Service Co. * | $ | 253,250 | 2.72 | % | |
| Electrical Work | ||||||
| 5,400 | EMCOR Group Inc. | 475,740 | 5.10 | % | ||
| Industrial Organic Chemicals | ||||||
| 5,950 | Sensient Technologies Corporation | 437,206 | 4.69 | % | ||
| Instruments For Measurement & Testing of Electricity & Electric Signals | ||||||
| 7,775 | Teradyne, Inc. | 372,500 | 3.99 | % | ||
| Laboratory Analytical Instruments | ||||||
| 4,000 | PerkinElmer Inc. | 385,360 | 4.13 | % | ||
| Miscellaneous Manufacturing Industries | ||||||
| 5,200 | Hillenbrand, Inc. | 205,764 | 2.20 | % | ||
| Retail - Apparel & Accessory Stores | ||||||
| 11,875 | Express Inc. * | 32,419 | ||||
| 4,900 | Tailored Brands, Inc. | 28,273 | ||||
| 60,692 | 0.65 | % | ||||
| Retail - Department Stores | ||||||
| 2,500 | Dillard's, Inc. - Class A | 155,700 | 1.67 | % | ||
| Retail - Family Clothing Stores | ||||||
| 13,300 | American Eagle Outfitters, Inc. | 224,770 | 2.41 | % | ||
| Retail - Retail Stores, NEC | ||||||
| 2,200 | IAC/InterActiveCorp. * | 478,566 | 5.13 | % | ||
| Retail - Shoe Stores | ||||||
| 6,700 | Foot Locker, Inc. | 280,864 | 3.01 | % | ||
| Semiconductors & Related Devices | ||||||
| 18,300 | Kulicke & Soffa Industries Inc. (Singapore) | 412,665 | ||||
| 5,700 | Qorvo, Inc. * | 379,677 | ||||
| 4,700 | Skyworks Solutions, Inc. | 363,169 | ||||
| 1,155,511 | 12.39 | % | ||||
| Services - Business Services, NEC | ||||||
| 6,600 | Tabula Rasa HealthCare, Inc. * | 329,538 | 3.53 | % | ||
| Services - Computer Processing & Data Preparation | ||||||
| 17,900 | Inovalon Holdings, Inc. * | 259,729 | 2.78 | % | ||
| Services - Help Supply Services | ||||||
| 18,500 | Kelly Services, Inc. - Class A | 484,515 | 5.19 | % | ||
| Services - Home Health Care Services | ||||||
| 5,100 | Addus HomeCare Corporation * | 382,245 | 4.10 | % | ||
| Services - Hospitals | ||||||
| 5,900 | Magellan Health Services Inc. * | 437,957 | 4.70 | % | ||
| Services - Prepackaged Software | ||||||
| 5,900 | Progress Software Corporation | 257,358 | 2.76 | % | ||
| Special Industry Machinery (No Metalworking Machinery) | ||||||
| 4,300 | Kadant Inc. | 390,483 | 4.19 | % | ||
| Special Industry Machinery, NEC | ||||||
| 12,600 | Brooks Automation, Inc. | 488,250 | 5.24 | % | ||
| Surgical & Medical Instruments & Apparatus | ||||||
| 13,700 | AtriCure, Inc. * | 408,808 | ||||
| 18,700 | GenMark Diagnostics, Inc. * | 121,363 | ||||
| 4,500 | OrthoPediatrics Corp. * | 175,500 | ||||
| 705,671 | 7.57 | % | ||||
| * Non-Income Producing Securities. The accompanying notes are an integral part of these financial statements. |
2019 Semi-Annual Report 17
| Paradigm Opportunity Fund | |||||
| Schedule of Investments | |||||
| June 30, 2019 (Unaudited) | |||||
| Shares | Fair Value | % of Net Assets | |||
| COMMON STOCKS | |||||
| Telegraph & Other Message Communications | |||||
| 5,000 j2 Global, Inc. | $ | 444,450 | 4.77 | % | |
| Total for Common Stocks (Cost $5,117,559) | 8,666,119 | 92.92 | % | ||
| REAL ESTATE INVESTMENT TRUSTS | |||||
| 3,700 Mid-America Apartment Communities Inc. | 435,712 | 4.67 | % | ||
| Total for Real Estate Investment Trusts (Cost $200,380) | |||||
| MONEY MARKET FUNDS | |||||
| 134,283 SEI Daily Income Trust Government Fund CL F 2.12% ** | 134,283 | 1.44 | % | ||
| Total for Money Market Funds (Cost $134,283) | |||||
| Total Investment Securities | 9,236,114 | 99.03 | % | ||
| (Cost $5,452,222) | |||||
| Other Assets in Excess of Liabilities | 90,279 | 0.97 | % | ||
| Net Assets | $ | 9,326,393 | 100.00 | % | |
| ** The Yield Rate shown represents the 7-day yield at June 30, 2019. The accompanying notes are an integral part of these financial statements. |
2019 Semi-Annual Report 18
| Paradigm Micro-Cap Fund | ||||||
| Schedule of Investments | ||||||
| June 30, 2019 (Unaudited) | ||||||
| Shares | Fair Value | % of Net Assets | ||||
| COMMON STOCKS | ||||||
| Aircraft Parts & Auxiliary Equipment, NEC | ||||||
| 25,000 | Ducommun Incorporated * | $ | 1,126,750 | 2.33 | % | |
| Ball & Roller Bearings | ||||||
| 80,000 | NN, Inc. | 780,800 | 1.62 | % | ||
| Biological Products, (No Diagnostic Substances) | ||||||
| 10,000 | Surface Oncology, Inc. * | 28,200 | 0.06 | % | ||
| Communications Equipment, NEC | ||||||
| 50,000 | Vocera Communications, Inc. * | 1,596,000 | 3.30 | % | ||
| Communications Services, NEC | ||||||
| 200,000 | Calix, Inc. * | 1,312,000 | 2.72 | % | ||
| Computer Communications Equipment | ||||||
| 280,000 | Extreme Networks, Inc. * | 1,811,600 | 3.75 | % | ||
| Computer Peripheral Equipment, NEC | ||||||
| 140,000 | Mitek Systems, Inc. * | 1,391,600 | 2.88 | % | ||
| Concrete Products, Except Block & Brick | ||||||
| 200,000 | Forterra, Inc. * | 994,000 | 2.06 | % | ||
| Electromedical & Electrotherapeutic Apparatus | ||||||
| 110,000 | Cutera, Inc. * | 2,285,800 | 4.73 | % | ||
| Electronic Components & Accessories | ||||||
| 10,000 | KEMET Corporation | 188,100 | 0.39 | % | ||
| Electronic Computers | ||||||
| 20,000 | Omnicell, Inc. * | 1,720,600 | 3.56 | % | ||
| Engines & Turbines | ||||||
| 400,000 | Westport Fuel Systems Inc. * | 1,084,000 | 2.24 | % | ||
| Footwear (No Rubber) | ||||||
| 100,000 | Caleres, Inc. | 1,992,000 | 4.12 | % | ||
| Instruments for Measurement & Testing of Electricity & Electric Signals | ||||||
| 30,000 | Cohu, Inc. | 462,900 | 0.96 | % | ||
| Motor Vehicle Parts & Accessories | ||||||
| 120,000 | Modine Manufacturing Company * | 1,717,200 | 3.55 | % | ||
| Office Machines, NEC | ||||||
| 200,000 | Pitney Bowes Inc. | 856,000 | 1.77 | % | ||
| Orthopedic, Prosthetic & Surgical Appliances & Supplies | ||||||
| 400,000 | RTI Surgical, Inc. * | 1,700,000 | 3.52 | % | ||
| Pharmaceutical Preparations | ||||||
| 20,000 | Catalyst Pharmaceuticals, Inc. * | 76,800 | ||||
| 10,000 | Collegium Pharmaceutical, Inc. * | 131,500 | ||||
| 60,000 | Dermira, Inc. * | 573,600 | ||||
| 10,000 | Flexion Therapeutics, Inc. * | 123,000 | ||||
| 1,851 | Nature's Sunshine Products, Inc. * | 17,196 | ||||
| 10,000 | OptiNose, Inc. | 70,800 | ||||
| 992,896 | 2.06 | % | ||||
| Retail - Apparel & Accessory Stores | ||||||
| 80,000 | Citi Trends, Inc. | 1,169,600 | ||||
| 200,000 | Tilly's, Inc. - Class A * | 1,526,000 | ||||
| 2,695,600 | 5.58 | % | ||||
| Retail - Catalog & Mail-Order Houses | ||||||
| 30,000 | Insight Enterprises, Inc. * | 1,746,000 | 3.61 | % | ||
| Retail - Retail Stores, NEC | ||||||
| 480,000 | Kirkland’s, Inc. * | 1,084,800 | 2.25 | % | ||
| Retail - Women’s Clothing Stores | ||||||
| 20,000 | The Cato Corporation - Class A | 246,400 | ||||
| 400,000 | RTW Retailwinds, Inc. * | 680,000 | ||||
| 926,400 | 1.92 | % | ||||
| * Non-Income Producing Securities. The accompanying notes are an integral part of these financial statements. |
2019 Semi-Annual Report 19
| Paradigm Micro-Cap Fund | ||||||
| Schedule of Investments | ||||||
| June 30, 2019 (Unaudited) | ||||||
| Shares | Fair Value | % of Net Assets | ||||
| COMMON STOCKS | ||||||
| Semiconductors & Related Devices | ||||||
| 50,000 | Finisar Corporation * | $ | 1,143,500 | |||
| 200,000 | NeoPhotonics Corporation * | 836,000 | ||||
| 1,979,500 | 4.10 | % | ||||
| Services - Computer Integrated Systems Design | ||||||
| 400,000 | Aerohive Networks, Inc. * | 1,772,000 | ||||
| 180,000 | Allscripts Healthcare Solutions, Inc. * | 2,093,400 | ||||
| 400,000 | Ribbon Communications Inc. * | 1,956,000 | ||||
| 5,821,400 | 12.05 | % | ||||
| Services - Computer Processing & Data Preparation | ||||||
| 200,000 | Castlight Health, Inc. - Class B * | 646,000 | 1.34 | % | ||
| Services - Management Services | ||||||
| 200,000 | R1 RCM Inc. * | 2,516,000 | 5.21 | % | ||
| Services - Skilled Nursing Care Facilities | ||||||
| 30,000 | The Ensign Group, Inc. | 1,707,600 | 3.53 | % | ||
| Special Industry Machinery (No Metalworking Machinery) | ||||||
| 10,800 | Kadant Inc. | 980,748 | 2.03 | % | ||
| Surgical & Medical Instruments & Apparatus | ||||||
| 20,000 | Cerus Corporation * | 112,400 | ||||
| 30,000 | SeaSpine Holdings Corporation * | 397,500 | ||||
| 509,900 | 1.05 | % | ||||
| Wholesale - Computers & Peripheral Equipment & Software | ||||||
| 22,000 | ScanSource, Inc. * | 716,320 | 1.48 | % | ||
| Wholesale - Hardware | ||||||
| 100,000 | Wesco Aircraft Holdings, Inc. * | 1,110,000 | 2.30 | % | ||
| Wholesale - Lumber & Other Construction Materials | ||||||
| 250,000 | Huttig Building Products, Inc. * | 645,000 | 1.33 | % | ||
| Wholesale - Medical, Dental & Hospital Equipment & Supplies | ||||||
| 50,000 | Owens & Minor, Inc. | 160,000 | 0.33 | % | ||
| Women's, Misses', and Juniors Outerwear | ||||||
| 320,000 | J.Jill, Inc. | 636,800 | 1.32 | % | ||
| Total for Common Stocks (Cost $43,473,598) | 45,922,514 | 95.05 | % | |||
| MONEY MARKET FUNDS | ||||||
| 2,043,391 | SEI Daily Income Trust Government Fund CL F 2.12% ** | 2,043,391 | 4.23 | % | ||
| Total for Money Market Funds (Cost $2,043,391) | ||||||
| Total Investment Securities | 47,965,905 | 99.28 | % | |||
| (Cost $45,516,989) | ||||||
| Other Assets in Excess of Liabilities | 349,064 | 0.72 | % | |||
| Net Assets | $ | 48,314,969 | 100.00 | % | ||
| * Non-Income Producing Securities. ** The Yield Rate shown represents the 7-day yield at June 30, 2019. |
| The accompanying notes are an integral part of these financial statements. |
2019 Semi-Annual Report 20
| Paradigm Funds | ||||||
| Statements of Assets and Liabilities(Unaudited) | Value | Select | ||||
| June 30, 2019 | Fund | Fund | ||||
| Assets: | ||||||
| Investment Securities at Fair Value* | $ | 52,769,349 | $ | 28,953,765 | ||
| Cash | - | 3,876 | ||||
| Receivable for Fund Shares Sold | 16,490 | - | ||||
| Dividends Receivable | 55,286 | 14,926 | ||||
| Total Assets | 52,841,125 | 28,972,567 | ||||
| Liabilities: | ||||||
| Payable for Fund Shares Redeemed | 48,071 | - | ||||
| Payable for Securities Purchased | - | 631,698 | ||||
| Payable to Advisor | 63,094 | 26,108 | ||||
| Total Liabilities | 111,165 | 657,806 | ||||
| Net Assets | $ | 52,729,960 | $ | 28,314,761 | ||
| Net Assets Consist of: | ||||||
| Paid In Capital | $ | 28,831,721 | $ | 21,556,794 | ||
| Total Distributable Earnings | 23,898,239 | 6,757,967 | ||||
| Net Assets | $ | 52,729,960 | $ | 28,314,761 | ||
| Net Asset Value, Offering and Redemption Price (Note 2) | $ | 47.04 | $ | 39.07 | ||
| * Investments at Identified Cost | $ | 31,067,493 | $ | 22,326,345 | ||
| Shares Outstanding (Unlimited number of shares | 1,120,858 | 724,654 | ||||
| authorized without par value) | ||||||
| Statements of Operations(Unaudited) | ||||||
| For the six month period ended June 30, 2019 | ||||||
| Investment Income: | ||||||
| Dividends | $ | 508,687 | $ | 168,552 | ||
| Total Investment Income | 508,687 | 168,552 | ||||
| Expenses: | ||||||
| Investment Advisor Fees | 400,372 | 201,532 | ||||
| Total Expenses | 400,372 | 201,532 | ||||
| Less: Expenses Waived | - | (47,024 | ) | |||
| Net Expenses | 400,372 | 154,508 | ||||
| Net Investment Income | 108,315 | 14,044 | ||||
| Realized and Unrealized Gain on Investments: | ||||||
| Net Realized Gain on Investments | 1,674,000 | 134,304 | ||||
| Net Change in Net Unrealized Appreciation on Investments | 4,417,118 | 4,319,316 | ||||
| Net Realized and Unrealized Gain on Investments | 6,091,118 | 4,453,620 | ||||
| Net Increase in Net Assets from Operations | $ | 6,199,433 | $ | 4,467,664 | ||
| The accompanying notes are an integral part of these financial statements. |
2019 Semi-Annual Report 21
| Paradigm Funds | |||||||
| Statements of Assets and Liabilities (Unaudited) | Opportunity | Micro-Cap | |||||
| June 30, 2019 | Fund | Fund | |||||
| Assets: | |||||||
| Investment Securities at Fair Value* | $ | 9,236,114 | $ | 47,965,905 | |||
| Receivable for Fund Shares Sold | - | 143 | |||||
| Receivable for Securities Sold | 98,030 | 521,269 | |||||
| Dividends Receivable | 2,807 | 10,970 | |||||
| Total Assets | 9,336,951 | 48,498,287 | |||||
| Liabilities: | |||||||
| Payable for Fund Shares Redeemed | - | 3,399 | |||||
| Payable for Securities Purchased | - | 132,421 | |||||
| Payable to Advisor | 10,558 | 47,498 | |||||
| Total Liabilities | 10,558 | 183,318 | |||||
| Net Assets | $ | 9,326,393 | $ | 48,314,969 | |||
| Net Assets Consist of: | |||||||
| Paid In Capital | $ | 5,857,973 | $ | 43,750,635 | |||
| Total Distributable Earnings | 3,468,420 | 4,564,334 | |||||
| Net Assets | $ | 9,326,393 | $ | 48,314,969 | |||
| Net Asset Value, Offering and Redemption Price (Note 2) | $ | 42.27 | $ | 27.59 | |||
| * Investments at Identified Cost | $ | 5,452,222 | $ | 45,516,989 | |||
| Shares Outstanding (Unlimited number of shares | 220,620 | 1,751,273 | |||||
| authorized without par value) | |||||||
| Statements of Operations (Unaudited) | |||||||
| For the six month period ended June 30, 2019 | |||||||
| Investment Income: | |||||||
| Dividends | $ | 61,775 | $ | 509,962 | |||
| Total Investment Income | 61,775 | 509,962 | |||||
| Expenses: | |||||||
| Investment Advisor Fees | 87,738 | 309,846 | |||||
| Total Expenses | 87,738 | 309,846 | |||||
| Less: Expenses Waived | (14,631 | ) | - | ||||
| Net Expenses | 73,107 | 309,846 | |||||
| Net Investment Income (Loss) | (11,332 | ) | 200,116 | ||||
| Realized and Unrealized Gain (Loss) on Investments: | |||||||
| Net Realized Gain (Loss) on Investments | (290,915 | ) | 2,097,712 | ||||
| Net Change in Net Unrealized Appreciation on Investments | 1,550,300 | 1,791,564 | |||||
| Net Realized and Unrealized Gain (Loss) on Investments | 1,259,385 | 3,889,276 | |||||
| Net Increase in Net Assets from Operations | $ | 1,248,053 | $ | 4,089,392 | |||
| The accompanying notes are an integral part of these financial statements. |
2019 Semi-Annual Report 22
| Paradigm Funds | ||||||||||||||||
| Statements of Changes in Net Assets | Value Fund | Select Fund | ||||||||||||||
| (Unaudited) | (Unaudited) | |||||||||||||||
| 1/1/2019 | 1/1/2018 | 1/1/2019 | 1/1/2018 | |||||||||||||
| to | to | to | to | |||||||||||||
| 6/30/2019 | 12/31/2018 | 6/30/2019 | 12/31/2018 | |||||||||||||
| From Operations: | ||||||||||||||||
| Net Investment Income (Loss) | $ | 108,315 | $ | (109,579 | ) | $ | 14,044 | $ | 6,598 | |||||||
| Net Realized Gain on Investments | 1,674,000 | 7,032,203 | 134,304 | 667,245 | ||||||||||||
| Net Change in Unrealized Appreciation on Investments | 4,417,118 | (7,753,631 | ) | 4,319,316 | (3,317,635 | ) | ||||||||||
| Net Increase (Decrease) in Net Assets from Operations | 6,199,433 | (831,007 | ) | 4,467,664 | (2,643,792 | ) | ||||||||||
| From Distributions to Shareholders: | - | (6,505,623 | ) | - | (665,584 | ) | ||||||||||
| From Capital Share Transactions: | ||||||||||||||||
| Proceeds From Sale of Shares | 1,201,417 | 2,635,472 | 1,827,125 | 1,522,264 | ||||||||||||
| Proceeds from Redemption Fees (Note 2) | 245 | 8,891 | 1,324 | - | ||||||||||||
| Shares Issued on Reinvestment of Dividends | - | 6,217,194 | - | 626,197 | ||||||||||||
| Cost of Shares Redeemed | (6,102,525 | ) | (9,266,900 | ) | (1,304,062 | ) | (777,882 | ) | ||||||||
| Net Increase (Decrease) from Shareholder Activity | (4,900,863 | ) | (405,343 | ) | 524,387 | 1,370,579 | ||||||||||
| Net Increase (Decrease) in Net Assets | 1,298,570 | (7,741,973 | ) | 4,992,051 | (1,938,797 | ) | ||||||||||
| Net Assets at Beginning of Period | 51,431,390 | 59,173,363 | 23,322,710 | 25,261,507 | ||||||||||||
| Net Assets at End of Period | $ | 52,729,960 | $ | 51,431,390 | $ | 28,314,761 | $ | 23,322,710 | ||||||||
| Share Transactions: | ||||||||||||||||
| Issued | 26,039 | 49,608 | 47,249 | 37,898 | ||||||||||||
| Reinvested | - | 149,704 | - | 19,315 | ||||||||||||
| Redeemed | (131,482 | ) | (181,659 | ) | (34,732 | ) | (19,869 | ) | ||||||||
| Net Increase (Decrease) in Shares | (105,443 | ) | 17,653 | 12,517 | 37,344 | |||||||||||
| Shares Outstanding Beginning of Period | 1,226,301 | 1,208,648 | 712,137 | 674,793 | ||||||||||||
| Shares Outstanding End of Period | 1,120,858 | 1,226,301 | 724,654 | 712,137 | ||||||||||||
| The accompanying notes are an integral part of these financial statements. |
2019 Semi-Annual Report 23
| Paradigm Funds | ||||||||||||||||
| Statements of Changes in Net Assets | Opportunity Fund | Micro-Cap Fund | ||||||||||||||
| (Unaudited) | (Unaudited) | |||||||||||||||
| 1/1/2019 | 1/1/2018 | 1/1/2019 | 1/1/2018 | |||||||||||||
| to | to | to | to | |||||||||||||
| 6/30/2019 | 12/31/2018 | 6/30/2019 | 12/31/2018 | |||||||||||||
| From Operations: | ||||||||||||||||
| Net Investment Income (Loss) | $ | (11,332 | ) | $ | (18,135 | ) | $ | 200,116 | $ | (359,211 | ) | |||||
| Net Realized Gain (Loss) on Investments | (290,915 | ) | 455,563 | 2,097,712 | 5,479,445 | |||||||||||
| Net Change in Unrealized Appreciation on Investments | 1,550,300 | (1,314,120 | ) | 1,791,564 | (11,021,590 | ) | ||||||||||
| Net Increase (Decrease) in Net Assets from Operations | 1,248,053 | (876,692 | ) | 4,089,392 | (5,901,356 | ) | ||||||||||
| From Distributions to Shareholders: | - | (447,555 | ) | - | (5,495,670 | ) | ||||||||||
| From Capital Share Transactions: | ||||||||||||||||
| Proceeds From Sale of Shares | 425,142 | 5,994,589 | 691,868 | 7,068,123 | ||||||||||||
| Proceeds from Redemption Fees (Note 2) | 5,629 | 565 | - | 449 | ||||||||||||
| Shares Issued on Reinvestment of Dividends | - | 336,275 | - | 5,434,220 | ||||||||||||
| Cost of Shares Redeemed | (3,347,677 | ) | (1,801,022 | ) | (812,039 | ) | (6,183,886 | ) | ||||||||
| Net Increase (Decrease) from Shareholder Activity | (2,916,906 | ) | 4,530,407 | (120,171 | ) | 6,318,906 | ||||||||||
| Net Increase (Decrease) in Net Assets | (1,668,853 | ) | 3,206,160 | 3,969,221 | (5,078,120 | ) | ||||||||||
| Net Assets at Beginning of Period | 10,995,246 | 7,789,086 | 44,345,748 | 49,423,868 | ||||||||||||
| Net Assets at End of Period | $ | 9,326,393 | $ | 10,995,246 | $ | 48,314,969 | $ | 44,345,748 | ||||||||
| Share Transactions: | ||||||||||||||||
| Issued | 10,096 | 130,299 | 24,175 | 193,754 | ||||||||||||
| Reinvested | - | 9,001 | - | 216,935 | ||||||||||||
| Redeemed | (80,859 | ) | (40,349 | ) | (28,618 | ) | (180,493 | ) | ||||||||
| Net Increase (Decrease) in Shares | (70,763 | ) | 98,951 | (4,443 | ) | 230,196 | ||||||||||
| Shares Outstanding Beginning of Period | 291,383 | 192,432 | 1,755,716 | 1,525,520 | ||||||||||||
| Shares Outstanding End of Period | 220,620 | 291,383 | 1,751,273 | 1,755,716 | ||||||||||||
| The accompanying notes are an integral part of these financial statements. |
2019 Semi-Annual Report 24
| Paradigm Value Fund | ||||||||||||||||||||||||
| Financial Highlights - Paradigm Value Fund | ||||||||||||||||||||||||
| (Unaudited) | ||||||||||||||||||||||||
| Selected data for a share outstanding | 1/1/2019 | 1/1/2018 | 1/1/2017 | 1/1/2016 | 1/1/2015 | 1/1/2014 | ||||||||||||||||||
| throughout the period: | to | to | to | to | to | to | ||||||||||||||||||
| 6/30/2019 | 12/31/2018 | 12/31/2017 | 12/31/2016 | 12/31/2015 | 12/31/2014 | |||||||||||||||||||
| Net Asset Value - Beginning of Period | $ | 41.94 | $ | 48.96 | $ | 48.10 | $ | 43.02 | $ | 48.33 | $ | 56.37 | ||||||||||||
| Net Investment Income (Loss) (a) | 0.09 | (0.10 | ) | (0.08 | ) | (0.02 | ) | (0.02 | ) | (0.05 | ) | |||||||||||||
| Net Gain (Loss) on Investments (Realized and Unrealized) | 5.01 | (0.98 | ) | 6.89 | 7.46 | 0.74 | 1.50 | |||||||||||||||||
| Total from Investment Operations | 5.10 | (1.08 | ) | 6.81 | 7.44 | 0.72 | 1.45 | |||||||||||||||||
| Distributions (From Net Investment Income) | - | - | - | - | - | - | ||||||||||||||||||
| Distributions (From Capital Gains) | - | (5.95 | ) | (5.96 | ) | (2.36 | ) | (6.03 | ) | (9.49 | ) | |||||||||||||
| Total Distributions | - | (5.95 | ) | (5.96 | ) | (2.36 | ) | (6.03 | ) | (9.49 | ) | |||||||||||||
| Proceeds from Redemption Fee (Note 2) | - | + | 0.01 | 0.01 | - | + | - | + | - | + | ||||||||||||||
| Net Asset Value - End of Period | $ | 47.04 | $ | 41.94 | $ | 48.96 | $ | 48.10 | $ | 43.02 | $ | 48.33 | ||||||||||||
| Total Return (b) | 12.16% | * | (2.07)% | 14.06% | 17.29% | 1.35% | 2.44% | |||||||||||||||||
| Ratios/Supplemental Data | ||||||||||||||||||||||||
| Net Assets - End of Period (Thousands) | $ | 52,730 | $ | 51,431 | $ | 59,173 | $ | 62,096 | $ | 66,931 | $ | 96,162 | ||||||||||||
| Before Reimbursement | ||||||||||||||||||||||||
| Ratio of Expenses to Average Net Assets | 1.50% | ** | 1.50% | 1.66% | 2.00% | 2.00% | 1.97% | |||||||||||||||||
| After Reimbursement | ||||||||||||||||||||||||
| Ratio of Expenses to Average Net Assets (c) | 1.50% | ** | 1.50% | 1.50% | 1.50% | 1.50% | 1.50% | |||||||||||||||||
| Ratio of Net Investment Income (Loss) to Average | ||||||||||||||||||||||||
| Net Assets (c) | 0.41% | ** | (0.18)% | (0.15)% | (0.06)% | (0.05)% | (0.09)% | |||||||||||||||||
| Portfolio Turnover Rate | 7.42% | * | 20.54% | 24.12% | 12.68% | 14.35% | 31.47% | |||||||||||||||||
| Paradigm Select Fund | ||||||||||||||||||||||||
| Financial Highlights - Paradigm Select Fund | ||||||||||||||||||||||||
| (Unaudited) | ||||||||||||||||||||||||
| Selected data for a share outstanding throughout the period: | 1/1/2019 | 1/1/2018 | 1/1/2017 | 1/1/2016 | 1/1/2015 | 1/1/2014 | ||||||||||||||||||
| to | to | to | to | to | to | |||||||||||||||||||
| 6/30/2019 | 12/31/2018 | 12/31/2017 | 12/31/2016 | 12/31/2015 | 12/31/2014 | |||||||||||||||||||
| Net Asset Value - Beginning of Period | $ | 32.75 | $ | 37.44 | $ | 33.49 | $ | 29.09 | $ | 32.20 | $ | 37.05 | ||||||||||||
| Net Investment Income (Loss) (a) | 0.02 | 0.01 | (0.05 | ) | (0.04 | ) | 0.07 | - | + | |||||||||||||||
| Net Gain (Loss) on Investments (Realized and Unrealized) | 6.30 | (3.74 | ) | 5.42 | 4.69 | (0.45 | ) | 2.98 | ||||||||||||||||
| Total from Investment Operations | 6.32 | (3.73 | ) | 5.37 | 4.65 | (0.38 | ) | 2.98 | ||||||||||||||||
| Distributions (From Net Investment Income) | - | - | - | (0.01 | ) | (0.05 | ) | - | ||||||||||||||||
| Distributions (From Capital Gains) | - | (0.96 | ) | (1.46 | ) | (0.24 | ) | (2.68 | ) | (7.83 | ) | |||||||||||||
| Total Distributions | - | (0.96 | ) | (1.46 | ) | (0.25 | ) | (2.73 | ) | (7.83 | ) | |||||||||||||
| Proceeds from Redemption Fee (Note 2) | - | + | - | 0.04 | - | + | - | + | - | |||||||||||||||
| Net Asset Value - End of Period | $ | 39.07 | $ | 32.75 | $ | 37.44 | $ | 33.49 | $ | 29.09 | $ | 32.20 | ||||||||||||
| Total Return (b) | 19.30% | * | (9.93)% | 16.12% | 15.98% | (1.26)% | 7.86% | |||||||||||||||||
| Ratios/Supplemental Data | ||||||||||||||||||||||||
| Net Assets - End of Period (Thousands) | $ | 28,315 | $ | 23,323 | $ | 25,262 | $ | 22,869 | $ | 5,399 | $ | 6,537 | ||||||||||||
| Before Reimbursement | ||||||||||||||||||||||||
| Ratio of Expenses to Average Net Assets | 1.50% | ** | 1.50% | 1.50% | 1.50% | 1.50% | 1.50% | |||||||||||||||||
| After Reimbursement | ||||||||||||||||||||||||
| Ratio of Expenses to Average Net Assets (c) | 1.15% | ** | 1.15% | 1.15% | 1.15% | 1.15% | 1.15% | |||||||||||||||||
| Ratio of Net Investment Income (Loss) to Average | ||||||||||||||||||||||||
| Net Assets (c) | 0.10% | ** | 0.03% | (0.13)% | (0.14)% | 0.21% | 0.00% | + | ||||||||||||||||
| Portfolio Turnover Rate | 9.32% | * | 20.28% | 21.49% | 31.47% | 19.57% | 36.25% | |||||||||||||||||
| * Not Annualized. ** Annualized. (a) Per share amount calculated using the average shares method. (b) Total return in the above table represents the rate that the investor would have earned or lost on an investment in the Fund assuming reinvestment of dividends. Returns do not reflect the deduction of taxes a shareholder would pay on Fund distributions or redemption of Fund shares. (c) Such percentages reflect an expense waiver by the Advisor. See Note 4. + Amount calculated is less than $0.005/0.005% . |
| The accompanying notes are an integral part of these financial statements. |
2019 Semi-Annual Report 25
| Paradigm Opportunity Fund | ||||||||||||||||||||||||
| Financial Highlights - Paradigm Opportunity Fund | ||||||||||||||||||||||||
| (Unaudited) | ||||||||||||||||||||||||
| Selected data for a share outstanding throughout the period: | 1/1/2019 | 1/1/2018 | 1/1/2017 | 1/1/2016 | 1/1/2015 | 1/1/2014 | ||||||||||||||||||
| to | to | to | to | to | to | |||||||||||||||||||
| 6/30/2019 | 12/31/2018 | 12/31/2017 | 12/31/2016 | 12/31/2015 | 12/31/2014 | |||||||||||||||||||
| Net Asset Value - Beginning of Period | $ | 37.73 | $ | 40.48 | $ | 35.68 | $ | 31.14 | $ | 32.70 | $ | 31.25 | ||||||||||||
| Net Investment Loss (a) | (0.04 | ) | (0.08 | ) | (0.01 | ) | (0.02 | ) | (0.06 | ) | (0.05 | ) | ||||||||||||
| Net Gain (Loss) on Investments (Realized and Unrealized) | 4.56 | (1.09 | ) | 5.18 | 4.56 | (1.50 | ) | 3.27 | ||||||||||||||||
| Total from Investment Operations | 4.52 | (1.17 | ) | 5.17 | 4.54 | (1.56 | ) | 3.22 | ||||||||||||||||
| Distributions (From Net Investment Income) | - | - | - | - | - | - | ||||||||||||||||||
| Distributions (From Capital Gains) | - | (1.58 | ) | (0.37 | ) | - | - | + | (1.77 | ) | ||||||||||||||
| Total Distributions | - | (1.58 | ) | (0.37 | ) | - | - | (1.77 | ) | |||||||||||||||
| Proceeds from Redemption Fee (Note 2) | 0.02 | - | + | - | - | - | + | - | + | |||||||||||||||
| Net Asset Value - End of Period | $ | 42.27 | $ | 37.73 | $ | 40.48 | $ | 35.68 | $ | 31.14 | $ | 32.70 | ||||||||||||
| Total Return (b) | 12.03% | * | (2.84)% | 14.48% | 14.58% | (4.76)% | 10.28% | |||||||||||||||||
| Ratios/Supplemental Data | ||||||||||||||||||||||||
| Net Assets - End of Period (Thousands) | $ | 9,326 | $ | 10,995 | $ | 7,789 | $ | 6,699 | $ | 6,019 | $ | 6,694 | ||||||||||||
| Before Reimbursement | ||||||||||||||||||||||||
| Ratio of Expenses to Average Net Assets | 1.50% | ** | 1.50% | 1.65% | 2.00% | 2.00% | 2.00% | |||||||||||||||||
| After Reimbursement | ||||||||||||||||||||||||
| Ratio of Expenses to Average Net Assets (c) | 1.25% | ** | 1.25% | 1.25% | 1.25% | 1.25% | 1.25% | |||||||||||||||||
| Ratio of Net Investment Loss to Average | ||||||||||||||||||||||||
| Net Assets (c) | (0.19)% | ** | (0.17)% | (0.03)% | (0.08)% | (0.19)% | (0.15)% | |||||||||||||||||
| Portfolio Turnover Rate | 4.21% | * | 19.31% | 14.29% | 10.65% | 16.21% | 7.59% | |||||||||||||||||
| Paradigm Micro-Cap Fund | |||||||||||||||||||||||||
| Financial Highlights - Paradigm Micro-Cap Fund | |||||||||||||||||||||||||
| (Unaudited) | |||||||||||||||||||||||||
| Selected data for a share outstanding throughout the period: | 1/1/2019 | 1/1/2018 | 1/1/2017 | 1/1/2016 | 1/1/2015 | 1/1/2014 | |||||||||||||||||||
| to | to | to | to | to | to | ||||||||||||||||||||
| 6/30/2019 | 12/31/2018 | 12/31/2017 | 12/31/2016 | 12/31/2015 | 12/31/2014 | ||||||||||||||||||||
| Net Asset Value - Beginning of Period | $ | 25.26 | $ | 32.40 | $ | 29.89 | $ | 24.32 | $ | 27.39 | $ | 30.35 | |||||||||||||
| Net Investment Income (Loss) (a) | 0.11 | (0.23 | ) | (0.31 | ) | (0.18 | ) | (0.11 | ) | (0.17 | ) | ||||||||||||||
| Net Gain (Loss) on Investments (Realized and Unrealized) | 2.22 | (3.35 | ) | 5.05 | 6.83 | (2.64 | ) | 0.74 | |||||||||||||||||
| Total from Investment Operations | 2.33 | (3.58 | ) | 4.74 | 6.65 | (2.75 | ) | 0.57 | |||||||||||||||||
| Distributions (From Net Investment Income) | - | - | - | - | - | - | |||||||||||||||||||
| Distributions (From Capital Gains) | - | (3.56 | ) | (2.23 | ) | (1.08 | ) | (0.32 | ) | (3.53 | ) | ||||||||||||||
| Total Distributions | - | (3.56 | ) | (2.23 | ) | (1.08 | ) | (0.32 | ) | (3.53 | ) | ||||||||||||||
| Proceeds from Redemption Fee (Note 2) | - | - | + | - | + | - | + | - | - | ||||||||||||||||
| Net Asset Value - End of Period | $ | 27.59 | $ | 25.26 | $ | 32.40 | $ | 29.89 | $ | 24.32 | $ | 27.39 | |||||||||||||
| Total Return (b) | 9.22% | * | (10.96)% | 15.79% | 27.33% | (10.05)% | 1.81% | ||||||||||||||||||
| Ratios/Supplemental Data | |||||||||||||||||||||||||
| Net Assets - End of Period (Thousands) | $ | 48,315 | $ | 44,346 | $ | 49,424 | $ | 51,670 | $ | 42,395 | $ | 26,100 | |||||||||||||
| Ratio of Expenses to Average Net Assets | 1.25% | ** | 1.25% | 1.25% | 1.25% | 1.25% | 1.25% | ||||||||||||||||||
| Ratio of Net Investment Income (Loss) to Average | |||||||||||||||||||||||||
| Net Assets | 0.81% | ** | (0.67)% | (0.96)% | (0.67)% | (0.41)% | (0.58)% | ||||||||||||||||||
| Portfolio Turnover Rate | 41.64% | * | 111.47% | 125.90% | 88.88% | 70.95% | 101.19% | ||||||||||||||||||
| * Not Annualized. ** Annualized. (a) Per share amount calculated using the average shares method. (b) Total return in the above table represents the rate that the investor would have earned or lost on an investment in the Fund assuming reinvestment of dividends. Returns do not reflect the deduction of taxes a shareholder would pay on Fund distributions or redemption of Fund shares. (c) Such percentages reflect an expense waiver by the Advisor. See Note 4. + Amount calculated is less than $0.005. |
| The accompanying notes are an integral part of these financial statements. |
2019 Semi-Annual Report 26
NOTESTOFINANCIALSTATEMENTS
PARADIGMFUNDS
June 30, 2019
(UNAUDITED)
1.) ORGANIZATION
Paradigm Funds (the “Trust”) is an open-end management investment company that was organized in Ohio as a business trust on September 13, 2002 that offers shares of beneficial interest in a number of separate series, each series representing a distinct fund with its own investment objectives and policies. The Paradigm Value Fund (“Value”) commenced operations on January 1, 2003. Value’s investment objective is long-term capital appreciation. The Paradigm Select Fund (“Select”) and Paradigm Opportunity Fund (“Opportunity”) both commenced operations on January 1, 2005 with long-term capital appreciation as each Fund’s objective. The Paradigm Micro-Cap Fund (“Micro-Cap”) commenced operations on January 1, 2008. Micro-Cap’s investment objective is long-term capital appreciation. Under normal circumstances, Micro-Cap invests at least 80% of its net assets in the common stocks of U.S. micro-cap companies. Prior to December 27, 2011, the principal investment strategy of Micro-Cap was to invest primarily in the common stocks of small, mid or large capitalization companies that the Advisor (defined below) believed had the potential for capital appreciation. Value, Select, Opportunity and Micro-Cap are all diversified funds. The advisor to Value, Select, Opportunity and Micro-Cap (each a “Fund” and collectively the “Funds”) is Paradigm Funds Advisor LLC (the “Advisor”).
2.) SIGNIFICANT ACCOUNTING POLICIES
The Funds are investment companies and accordingly follow the investment company accounting and reporting guidance of the Financial Accounting Standards Board (“FASB”) Accounting Standards Codification Topic 946Financial Services - Investment Companies. The financial statements are prepared in conformity with accounting principles generally accepted in the United States of America (“GAAP”). The Funds follows the significant accounting policies described in this section.
SECURITY VALUATION:All investments in securities are recorded at their estimated fair value, as described in Note 3.
SECURITY TRANSACTIONS AND OTHER:Security transactions are recorded based on the trade date for financial statement reporting purposes. Dividend income is recognized on the ex-dividend date. Interest income, if any, is recognized on an accrual basis. The Funds use the highest cost basis which is a form of specific identification in computing gain or loss on sale of investment securities. Withholding taxes on foreign dividends have been provided for in accordance with the Funds’ understanding of the applicable country’s tax rules and rates. The Funds may invest in real estate investment trusts (“REITs”) that pay distributions to their shareholders based on available funds from operations. It is common for these distributions to exceed the REITs’ taxable earnings and profits resulting in the excess portion of such distribution to be designated as return of capital. Distributions received from REITs are generally recorded as dividend income and, if necessary, are reclassified annually in accordance with tax information provided by the underlying REITs.
SHARE VALUATION:Each Fund’s net asset value (the “NAV”) is calculated as of the close of trading on the New York Stock Exchange (the “Exchange”) (normally 4:00 p.m. Eastern time) every day the Exchange is open. The NAV for each Fund is calculated by taking the total value of the Fund’s assets, subtracting its liabilities, and then dividing by the total number of shares outstanding, rounded to the nearest cent. The offering price and redemption price per share is equal to the net asset value per share, except that shares of each Fund are subject to a redemption fee of 2% if redeemed within 90 days of purchase. During the six month period ended June 30, 2019 proceeds from redemption fees were $245, $1,324, $5,629 and $0 for Value, Select, Opportunity and Micro-Cap, respectively.
INCOME TAXES:The Funds’ policy is to continue to comply with the requirements of the Internal Revenue Code that are applicable to regulated investment companies and to distribute all of their taxable income to shareholders. Therefore, no federal income tax provision is required. It is the Funds’ policy to distribute annually, prior to the end of the calendar year, dividends sufficient to satisfy excise tax requirements of the Internal Revenue Code. This Internal Revenue Code requirement may cause an excess of distributions over the book year-end accumulated income. In addition, it is the Funds’ policy to distribute annually, after the end of the fiscal year, any remaining net investment income and net realized capital gains.
The Funds recognize the tax benefits of certain tax positions only where the position is “more likely than not” to be sustained assuming examination by tax authorities. Management has analyzed the Funds’ tax posi-
2019 Semi-Annual Report 27
Notes to Financial Statements (Unaudited) - continued
tions, and has concluded that no liability for unrecognized tax benefits should be recorded related to uncertain tax positions taken on returns filed for open tax years. The Funds identify their major tax jurisdictions as U.S. Federal and New York State tax authorities; the Funds are not aware of any tax positions for which it is reasonably possible that the total amounts of unrecognized tax benefits will change materially in the next twelve months. The Funds recognize interest and penalties, if any, related to unrecognized tax benefits as income tax expense in the Statements of Operations. During the six month period ended June 30, 2019, the Funds did not incur any interest or penalties.
ESTIMATES:The financial statements are prepared in accordance with GAAP, which requires management to make estimates and assumptions that affect the reported amounts of assets and liabilities and disclosure of contingent assets and liabilities at the date of the financial statements and the reported amounts of increases and decreases in net assets from operations during the reporting period. Actual results could differ from those estimates.
DISTRIBUTIONS TO SHAREHOLDERS:Distributions to shareholders, which are determined in accordance with income tax regulations, are recorded on the ex-dividend date. The Funds may utilize earnings and profits distributed to shareholders on redemptions of shares as part of the dividends paid deduction. The treatment for financial reporting purposes of distributions made to shareholders during the year from net investment income or net realized capital gains may differ from their ultimate treatment for federal income tax purposes. These differences are caused primarily by differences in the timing of recognition of certain components of income, expense or realized capital gain for federal income tax purposes. Where such differences are permanent in nature, they are reclassified in the components of the net assets based on their ultimate characterization for federal income tax purposes. Any such reclassification will have no effect on net assets, results of operations or net asset values per share of any Fund.
3.) SECURITIES VALUATIONS
The Funds utilize various methods to measure the fair value of their investments on a recurring basis. GAAP establishes a hierarchy that prioritizes inputs to valuation methods. The three levels of inputs are:
Level 1 - Unadjusted quoted prices in active markets for identical assets or liabilities.
Level 2 - Observable inputs other than quoted prices included in level 1 that are observable for the asset or liability, either directly or indirectly. These inputs may include quoted prices for the identical instrument on an inactive market, prices for similar instruments, interest rates, prepayment speeds, credit risk, yield curves, default rates and similar data.
Level 3 - Unobservable inputs for the asset or liability, to the extent relevant observable inputs are not available, representing the Funds’ best information about the assumptions a market participant would use in valuing the assets or liabilities.
The availability of inputs can vary from security to security and is affected by a wide variety of factors, including, for example, the type of security, whether the security is new and not yet established in the marketplace, the liquidity of markets, and other characteristics particular to the security. To the extent that valuation is based on models or inputs that are less observable or unobservable in the market, the determination of fair value requires more judgment. Accordingly, the degree of judgment exercised in determining fair value is greatest for instruments categorized in level 3.
The inputs used to measure fair value may fall into different levels of the fair value hierarchy. In such cases, for disclosure purposes, the level in the fair value hierarchy within which the fair value measurement falls in its entirety, is determined based on the lowest level input that is significant to the fair value measurement in its entirety.
FAIR VALUE MEASUREMENTS
A description of the valuation techniques applied to the Funds’ major categories of assets measured at fair value on a recurring basis follows.
Equity securities (common stocks and real estate investment trusts)Equity securities that are traded on any exchange or on the NASDAQ over-the-counter market are valued at the last quoted sale price. Lacking a last sale price, a long security is valued at its last bid price except when, in the Advisor’s opinion, the last bid price does not accurately reflect the fair value of the long security. To the extent these securities are actively traded and valuation adjustments are not applied, they are classified in level 1 of the fair value hierarchy, and if an equity security is valued by the pricing service at its last bid, it is generally categorized in level 2 of the fair value hierarchy. When market quotations are not readily available, when the Advisor determines the last bid price does not accurately reflect the fair value or when restricted securities are being valued, such
2019 Semi-Annual Report 28
Notes to Financial Statements (Unaudited) - continued
securities are valued as determined in good faith by the Advisor, in conformity with guidelines adopted by and subject to review of the Trust’s Board of Trustees (the “Trustees” or the “Board”) and are categorized in level 2 or level 3, when appropriate.
Money market funds.Money market funds are valued at net asset value provided by the funds and are classified in level 1 of the fair value hierarchy.
In accordance with the Trust’s good faith pricing guidelines, the Advisor is required to consider all appropriate factors relevant to the value of securities for which it has determined other pricing sources are not available or reliable as described above. There is no single standard for determining fair value, since fair value depends upon the circumstances of each individual case. As a general principle, the current fair value of an issue of securities being valued by the Advisor would appear to be the amount which the owner might reasonably expect to receive for them upon their current sale. Methods which are in accordance with this principle may, for example, be based on (i) a multiple of earnings; (ii) a discount from market of a similar freely traded security (including a derivative security or a basket of securities traded on other markets, exchanges or among dealers); or (iii) yield to maturity with respect to debt issues, or a combination of these and other methods.
The following tables summarize the inputs used to value each Fund’s assets measured at fair value as of June 30, 2019:
| Value: | ||||||
| Valuation Inputs of Assets | Level 1 | Level 2 | Level 3 | Total | ||
| Common Stocks | $47,067,467 | $ - | $ - | $47,067,467 | ||
| Real Estate Investment Trusts | 3,367,850 | - | - | 3,367,850 | ||
| Money Market Funds | 2,334,032 | - | - | 2,334,032 | ||
| Total | $52,769,349 | $ - | $ - | $52,769,349 | ||
| Select: | ||||||
| Valuation Inputs of Assets | Level 1 | Level 2 | Level 3 | Total | ||
| Common Stocks | $26,038,678 | $ - | $ - | $26,038,678 | ||
| Real Estate Investment Trusts | 694,784 | - | - | 694,784 | ||
| Money Market Funds | 2,220,303 | - | - | 2,220,303 | ||
| Total | $28,953,765 | $ - | $ - | $28,953,765 | ||
| Opportunity: | ||||||
| Valuation Inputs of Assets | Level 1 | Level 2 | Level 3 | Total | ||
| Common Stocks | $8,666,119 | $ - | $ - | $8,666,119 | ||
| Real Estate Investment Trusts | 435,712 | - | - | 435,712 | ||
| Money Market Funds | 134,283 | - | - | 134,283 | ||
| Total | $9,236,114 | $ - | $ - | $9,236,114 | ||
| Micro-Cap: | ||||||
| Valuation Inputs of Assets | Level 1 | Level 2 | Level 3 | Total | ||
| Common Stocks | $45,922,514 | $ - | $ - | $45,922,514 | ||
| Money Market Funds | 2,043,391 | - | - | 2,043,391 | ||
| Total | $47,965,905 | $ - | $ - | $47,965,905 | ||
The Funds did not hold any level 3 assets during the six month period ended June 30, 2019.
The Funds did not invest in derivative instruments during the six month period ended June 30, 2019.
4.) INVESTMENT ADVISORY AGREEMENTS
The Trust, with respect to each of the Funds, has an investment advisory agreement (collectively the “Management Agreements”) with the Advisor. Under the terms of the Management Agreements, the Advisor manages the investment portfolios of the Funds, subject to policies adopted by the Trustees. Under the Management Agreements, the Advisor, at its own expense and without reimbursement from the Trust, furnishes office space and all necessary office facilities, equipment and executive personnel necessary for managing the assets of the Funds. The Advisor pays all operating expenses of the Funds with the exception of taxes, brokerage fees and commissions, borrowing costs (such as interest and dividend expenses on securities sold short) and such extraordinary or non-recurring expenses as may arise, including litigation to which the Fund may be a party and indemnification of the Trustees and Trust officers with respect thereto. The Funds will also pay expenses that they are authorized to pay pursuant to Rule 12b-1 under the Investment Company Act of 1940, as amended (none are currently authorized). The Advisor also pays the
2019 Semi-Annual Report 29
Notes to Financial Statements (Unaudited) - continued
salaries and fees of all of its officers and employees that serve as officers and trustees of the Trust. For its services and payment of certain Fund expenses as described below, the Advisor receives an annual investment management fee of 1.50%, 1.50%, 1.50%, and 1.25% of the average daily net assets from Value, Select, Opportunity and Micro-Cap, respectively. The Advisor’s investment management fee is accrued daily and is typically paid monthly. Prior to May 1, 2017, Value paid the Advisor an annual investment management fee of 2.00% of the average daily net assets on assets up to and including $100 million and 1.75% of the average daily net assets over $100 million. Additionally, prior to May 1, 2017, Opportunity's management fee was 2.00% of the average daily net assets. As a result of the above calculations, for the six month period ended June 30, 2019, the Advisor earned management fees (before the waivers described below) totaling $400,372, $201,532, $87,738 and $309,846 for Value, Select, Opportunity, and Micro-Cap, respectively. At June 30, 2019, $63,094, $26,108, $10,558 and $47,498 was due to the Advisor from Value, Select, Opportunity and Micro-Cap, respectively. The Advisor has contractually agreed to waive management fees and/or reimburse Select and Opportunity to the extent necessary to maintain total annual operating expenses of the Funds (excluding brokerage fees and commissions, interest and other borrowing expenses, taxes, extraordinary expenses and indirect costs of investing in acquired funds) at 1.15% and 1.25%, respectively, of daily net assets through April 30, 2020. The Advisor waived $47,024 and $14,631 for the six month period ended June 30, 2019 for Select and Opportunity, respectively, pursuant to their contractual agreements. There is no recapture provision to these waivers.
5.) RELATED PARTY TRANSACTIONS
Certain officers and shareholders of the Advisor are also officers and/or a Trustee of the Trust. These individuals may receive benefits from the Advisor resulting from management fees paid to the Advisor from the Funds.
The Trustees who are not interested persons of the Funds were each paid $4,000 a total of $16,000, in Trustees fees for the six month period ended June 30, 2019 for the Trust. Under the Management Agreements, the Advisor pays these fees.
6.) INVESTMENTS
For the six month period ended June 30, 2019, purchases and sales of investment securities other than U.S. Government obligations and short-term investments were as follows:
| Value | Select | Opportunity | Micro-Cap | |||||
| Purchases | $3,788,545 | $2,760,056 | $462,831 | $19,561,562 | ||||
| Sales | $8,473,477 | $2,307,582 | $2,968,614 | $20,676,610 |
There were no purchases or sales of U.S. Government obligations.
7.) CONTROL OWNERSHIP
The beneficial ownership, either directly or indirectly, of more than 25% of the voting shares of a fund creates a presumption of control of the fund, under section 2(a)(9) of the Investment Company Act of 1940, as amended. At June 30, 2019, National Financial Services, LLC, located at 200 Liberty Street, New York, New York, for the benefit of its customers, held, in aggregate, 33.78% of Value, and therefore also may be deemed to control Value. Candace King Weir, beneficial owner located at 9 Elk Street, Albany, New York 12207, held, in aggregate, 80.20%, of Select, and therefore may be deemed to control Select. Candace King Weir, beneficial owner located at 9 Elk Street, Albany, New York 12207, held, in aggregate, 89.58%, of Opportunity, and therefore may be deemed to control Opportunity. Candace King Weir, beneficial owner located at 9 Elk Street, Albany, New York 12207, held, in aggregate, 85.77% of Micro-Cap, and therefore may be deemed to control Micro-Cap.
8.) TAX MATTERS
For federal income tax purposes, at June 30, 2019 the cost of securities on a tax basis and the composition of gross unrealized appreciation (the excess of value over tax cost) and depreciation (the excess of tax cost over value) were as follows:
| Value | Select | Opportunity | Micro-Cap | |||||||||
| Cost of Investments | $31,067,493 | $22,326,345 | $5,452,222 | $45,516,989 | ||||||||
| Gross Unrealized Appreciation | $24,297,362 | $7,753,147 | $4,123,144 | $9,628,117 | ||||||||
| Gross Unrealized Depreciation | ($2,595,506 | ) | ($1,125,727 | ) | ($339,252 | ) | ($7,179,201 | ) | ||||
| Net Unrealized Appreciation | ||||||||||||
| (Depreciation) on Investments | $21,701,856 | $6,627,420 | $3,783,892 | $2,448,916 | ||||||||
2019 Semi-Annual Report 30
Notes to Financial Statements (Unaudited) - continued
The tax character of distributions paid during the six month period ended June 30, 2019 and the fiscal year ended December 31, 2018 were as follows:
| Six Months Ended | Fiscal Year Ended | ||
| June 30, 2019 | December 31, 2018 | ||
| PARADIGM VALUE FUND | |||
| Ordinary Income | $ - | $ 157,414 | |
| Long-term Capital Gain | - | 6,348,209 | |
| $ - | $ 6,505,623 | ||
| PARADIGM SELECT FUND | |||
| Ordinary Income | $ - | $ 62,610 | |
| Long-term Capital Gain | - | 602,974 | |
| $ - | $ 665,584 | ||
| PARADIGM OPPORTUNITY FUND | |||
| Ordinary Income | $ - | $ - | |
| Long-term Capital Gain | - | 447,555 | |
| $ - | $ 447,555 | ||
| PARADIGM MICRO-CAP FUND | |||
| Ordinary Income | $ - | $ 45,002 | |
| Long-term Capital Gain | - | 5,450,668 | |
| $ - | $ 5,495,670 | ||
9.) SUBSEQUENT EVENTS
Subsequent events after the date of the Statements of Assets and Liabilities have been evaluated through the date the financial statements were issued. Management has concluded that there is no impact requiring adjustment to or disclosure in the financial statements.
2019 Semi-Annual Report 31
This page was intentionally left blank.
2019 Semi-Annual Report 32
DISCLOSURE OFEXPENSES
(Unaudited)
The ongoing costs to shareholders associated with the Paradigm Value Fund, Paradigm Select Fund, Paradigm Opportunity Fund and Paradigm Micro-Cap Fund consist solely of management fees. Although the Funds charge no sales loads or transaction fees, you will be assessed fees for outgoing wire transfers, returned checks and stop payment orders at prevailing rates charged by Mutual Shareholder Services, LLC, the Funds’ transfer agent. IRA accounts will be charged an $8.00 annual maintenance fee. If shares are redeemed within 90 days of purchase from the Funds, the shares are subject to a 2% redemption fee. The following example is intended to help you understand your ongoing costs of investing in the Funds and to compare these costs with similar costs of investing in other mutual funds. The example is based on an investment of $1,000 invested in the Funds on January 1, 2019 and held through June 30, 2019.
The first line of each table below provides information about actual account values and actual expenses. In order to estimate the expenses a shareholder paid during the period covered by this report, shareholders can divide their account value by $1,000 (for example, an $8,600 account value divided by $1,000 = 8.6) and then multiply the result by the number in the first line under the heading entitled “Expenses Paid During the Period.”
The second line of each table below provides information about hypothetical account values and hypothetical expenses based on the Funds’ actual expense ratios and an assumed rate of return of 5% per year before expenses, which is not the Funds’ actual return. The hypothetical account values and expenses may not be used to estimate the actual ending account balance or expenses paid by a shareholder for the period. Shareholders may use this information to compare the ongoing costs of investing in the Funds and other funds. In order to do so, compare these 5% hypothetical examples with the 5% hypothetical examples that appear in other funds’ shareholder reports.
Please note that the expenses shown in each table are meant to highlight your ongoing costs only and do not reflect any transactional costs, such as the annual maintenance fee charged to IRA accounts, redemption fees, or exchange fees. Therefore, the second line of the table is useful in comparing ongoing costs only, and will not help you determine the relative total costs of owning different funds. In addition, if these transactional costs were included, your costs would have been higher.
| PARADIGM VALUE FUND | ||||||
| Expenses Paid | ||||||
| Beginning | Ending | During the Period* | ||||
| Account Value | Account Value | January 1, 2019 | ||||
| January 1, 2019 | June 30, 2019 | to June 30, 2019 | ||||
| Actual | $1,000.00 | $1,121.60 | $7.89 | |||
| Hypothetical | $1,000.00 | $1,017.36 | $7.50 | |||
| (5% annual return | ||||||
| before expenses) | ||||||
* Expenses are equal to the Fund’s annualized expense ratio of 1.50%, multiplied by the average
account value over the period, multiplied by 181/365 (to reflect the one-half year period).
| PARADIGM SELECT FUND | ||||||
| Expenses Paid | ||||||
| Beginning | Ending | During the Period* | ||||
| Account Value | Account Value | January 1, 2019 | ||||
| January 1, 2019 | June 30, 2019 | to June 30, 2019 | ||||
| Actual | $1,000.00 | $1,192.98 | $6.25 | |||
| Hypothetical | $1,000.00 | $1,019.09 | $5.76 | |||
| (5% annual return | ||||||
| before expenses) | ||||||
* Expenses are equal to the Fund’s annualized expense ratio of 1.15%, multiplied by the average
account value over the period, multiplied by 181/365 (to reflect the one-half year period).
2019 Semi-Annual Report 33
| Disclosure of Expenses (Unaudited) - continued | ||||||
| PARADIGM OPPORTUNITY FUND | ||||||
| Expenses Paid | ||||||
| Beginning | Ending | During the Period* | ||||
| Account Value | Account Value | January 1, 2019 | ||||
| January 1, 2019 | June 30, 2019 | to June 30, 2019 | ||||
| Actual | $1,000.00 | $1,120.33 | $6.57 | |||
| Hypothetical | $1,000.00 | $1,018.60 | $6.26 | |||
| (5% annual return | ||||||
| before expenses) | ||||||
* Expenses are equal to the Fund’s annualized expense ratio of 1.25%, multiplied by the average
account value over the period, multiplied by 181/365 (to reflect the one-half year period).
| PARADIGM MICRO-CAP FUND | ||||||
| Expenses Paid | ||||||
| Beginning | Ending | During the Period* | ||||
| Account Value | Account Value | January 1, 2019 | ||||
| January 1, 2019 | June 30, 2019 | to June 30, 2019 | ||||
| Actual | $1,000.00 | $1,092.24 | $6.48 | |||
| Hypothetical | $1,000.00 | $1,018.60 | $6.26 | |||
| (5% annual return | ||||||
| before expenses) | ||||||
* Expenses are equal to the Fund’s annualized expense ratio of 1.25%, multiplied by the average
account value over the period, multiplied by 181/365 (to reflect the one-half year period).
2019 Semi-Annual Report 34
ADDITIONALINFORMATION
June 30, 2019
(Unaudited)
APPROVAL ANDRENEWAL OFINVESTMENTADVISORYAGREEMENTS
At a meeting of the Board of Trustees held on February 22, 2019 (the “Meeting”) the Board of Trustees (the “Trustees” or the “Board”) considered the continuance of the Management Agreements (the “Agreements” or “Management Agreements”) with Paradigm Funds Advisor LLC (the “Advisor”) for the Paradigm Value Fund (“Value Fund”), the Paradigm Select Fund (“Select Fund”), the Paradigm Opportunity Fund (“Opportunity Fund”), and the Paradigm Micro-Cap Fund (“Micro-Cap Fund”) (each a “Fund”, or collectively, the “Funds”). Legal counsel reviewed the memorandum provided by Thompson Hine LLP outlining the duties of mutual fund trustees with respect to the renewal of investment advisory contracts, and he explained that, in consideration of the continuance of the management agreements, the Board should review information reasonably necessary to evaluate the terms of the contracts and determine whether each was fair to each Fund and its shareholders. Legal counsel also explained that the Advisor had provided information to the Trustees for evaluation of the continuance of the Agreements.
In renewing the Agreements, the Board of Trustees received materials from the Advisor (the “Report”) addressing the following factors: (i) the investment performance of the Funds and the Advisor; (ii) the nature, extent and quality of the services provided by the Advisor to the Funds; (iii) the cost of the services to be provided and the profits to be realized by the Advisor and its affiliates from the relationship with the Funds; (iv) the extent to which economies of scale will be realized as the Funds grow; and (v) whether the fee levels reflect these economies of scale for the benefit of shareholders.
As to the performance of the Funds, the Report included information regarding the performance of each Fund compared to a group of funds of similar size, style and objective (the “Peer Group”). All performance data was through the period ended December 31, 2018. The Report also included comparative performance information for comparable major indexes, each Fund’s Morningstar category average, and other accounts managed by the Advisor.
The Trustees discussed the outperformance and underperformance in relation to the Peer Group average, the Morningstar category average and the comparative index for certain periods for each Fund, as detailed in the Report. The Trustees discussed with representatives of the Advisor the factors underlying the performance of the Funds over various time periods. The Trustees noted that when considering the performance of the Funds, they took into account the importance of the Advisor’s sector allocations. The Trustees stated that they are confident with the Advisor’s investment management process. The Trustees noted the Advisor’s explanations for the performance of the Funds and concluded, after careful review of the investment process and further discussion with the portfolio managers, that each Fund’s performance was either consistent with performance expectations, or that the Advisor was taking appropriate steps to address performance matters where necessary. The Trustees indicated that they would continue to monitor performance on a going forward basis.
As to the nature, extent and quality of the services provided by the Advisor, the Trustees analyzed the Advisor’s experience and capabilities. They discussed the information provided regarding operational matters such as the Advisor’s research and investment personnel. They also discussed the portfolio managers’ backgrounds and investment management experience. They reviewed the Advisor’s financial information and discussed the firm’s ability to meet its obligations under the Agreements. The Board concluded that the nature and extent of the services provided by the Advisor were consistent with the Board’s expectations, and that the quality of services, particularly those provided by the portfolio managers, was acceptable. The Trustees also concluded that the Advisor has the resources to provide quality advisory services to the Funds.
As to the costs of the services provided, the Board reviewed the fees received by the Advisor under the Agreements compared to the applicable Peer Group and category average. The Trustees noted that each Fund pays a unitary management fee under which the Advisor provides advisory services and certain administrative and governance functions and pays Fund expenses. The unitary management fee is 1.50% of average daily net assets for the Paradigm Value Fund, Paradigm Opportunity Fund and Paradigm Select Fund, and 1.25% of average daily net assets for the Paradigm Micro-Cap Fund. As a result, in addition to reviewing the management fees, the Trustees agreed that comparison of each Fund’s expense ratio to the expense ratios of comparable funds was most relevant to the Board deliberations. The Report noted that the Value Fund’s audited expense ratio of 1.50% was found to be higher than the category average of 1.16% and its Peer Group’s average expense ratio of 1.20% but within the
2019 Semi-Annual Report 35
Additional Information (Unaudited) - continued
range of its Peer Group. The Report indicated that the Select Fund’s audited expense ratio of 1.15% was lower than its Morningstar category average of 1.16% and its Peer Group’s average expense ratio of 1.29% . The Report noted that the Opportunity Fund’s audited expense ratio of 1.25% was higher than the category average of 1.16% and lower than its Peer Group’s average expense ratio of 1.42% . The Report indicated that the Micro-Cap Fund’s audited expense ratio of 1.25% was lower than its Peer Group’s average expense ratio of 1.51% and higher than its Morningstar category average of 1.16% . The Trustees noted that, while the fees may be higher, in some cases, than the peer group averages and/or the Morningstar category averages in each case, they appeared reasonable when compared to the benchmarks’ range of fees. The Board noted that while the Advisor does not manage any other accounts, Paradigm Capital Management, Inc., an affiliate of the Advisor, provides services to hedge funds for which it receives an annual fee of between 0.75% and 1.00% plus a performance fee; institutional accounts for which it receives fees ranging from 0.55% to 1.00%; and separately managed accounts for high net-worth clients for which it receives fees ranging from 0.50% to 1.50% . The Trustees concluded that the management fees paid with respect to the Funds were reasonable. The Board noted that the Advisor has contractually agreed to waive management fees and reimburse expenses to the extent necessary to maintain total annual operating expenses of the Select Fund (excluding brokerage fees and commissions, interest and other borrowing expenses, taxes, extraordinary expenses and the indirect costs of investing in acquired funds) at 1.15% of its average daily net assets through April 30, 2020, thereby benefiting shareholders. The Board further noted that the Advisor has contractually agreed to waive management fees and reimburse expenses to the extent necessary to maintain total annual operating expenses of the Opportunity Fund (excluding brokerage fees and commissions, interest and other borrowing expenses, taxes, extraordinary expenses and the indirect costs of investing in acquired funds) at 1.25% of its average daily net assets through April 30, 2020, thereby benefiting shareholders.
As for the profits realized by the Advisor, the Trustees reviewed a profit and loss analysis prepared by the Advisor that disclosed the direct and indirect expenses paid by the Advisor on behalf of each Fund, the total revenue derived by the Advisor from each Fund and the pre-tax operating margin of each Fund for the calendar year ended December 31, 2018. The Trustees also reviewed a broad industry analysis of mutual fund profitability prepared by an independent third party, which showed the operating margins realized by the Advisor were well within the range reported in the analysis. A representative of the Advisor noted no Fund securities were traded through the Advisor’s affiliated broker-dealer and that all trades were made on the basis of best price and execution. The Trustees concluded that the Advisor was not excessively profitable from its relationship with any of the Funds.
As for economies of scale, the Trustees discussed and considered information regarding whether economies of scale have been realized with respect to the management of the Funds, whether the Funds have appropriately benefited from any economies of scale, and whether there is potential for realization of any further economies of scale. The Board noted that the Advisor had contractually agreed to waive management fees and reimburse expenses for certain Funds at specific level, thereby benefiting shareholders. The Trustees agreed that, at current asset levels, further fee concessions were not justified.
In considering the continuance of the Management Agreements between the Trust and the Advisor, the disinterested Trustees did not identify any factor as all-important or all-controlling and instead considered these factors collectively in light of each Fund’s surrounding circumstances. Additionally, as part of its deliberations, the Trustees also considered and relied upon the information about the Funds that had been provided to them throughout the year in connection with their regular Board meetings at which they engage in the ongoing oversight of the Funds and their operations. Next, the disinterested Trustees met in executive session to discuss the continuation of the Agreements. The officers of the Trust were excused during this discussion.
Upon the return of the other Meeting participants, the Trustees conveyed their consensus, including the disinterested Trustees, that renewal of the Management Agreements was in the best interests of each Fund and its shareholders.
AVAILABILITY OF QUARTERLY SCHEDULE OF INVESTMENTS
The Funds file their complete schedules of portfolio holdings with the Securities and Exchange Commission (“SEC”) for the first and third quarters of each fiscal year on Form N-Q. The Funds’ Forms N-Q are available on the SEC’s website at http://www.sec.gov. The Funds’ Forms N-Q may also be reviewed and copied at the SEC’s Public Reference Room in Washington, DC. Information on the operation of the Public Reference Room may be obtained by calling 1-800-SEC-0330.
2019 Semi-Annual Report 36
Additional Information (Unaudited) - continued
PROXYVOTINGGUIDELINES
Paradigm Funds Advisor LLC, the Funds’ Advisor, is responsible for exercising the voting rights associated with the securities held by the Funds. A description of the policies and procedures used by the Advisor in fulfilling this responsibility is availablewithout charge on the Funds’ website at www.paradigm-funds.com. It is also included in the Funds’ Statement of Additional Information, which is available on the SEC’s website at http://www.sec.gov.
Information regarding how the Funds voted proxies, Form N-PX, relating to portfolio securities during the most recent 12-month period ended June 30 is available without charge, upon request, by calling our toll free number(1-800-239-0732). This information is also available on the SEC’s website at http://www.sec.gov.
ADDITIONALINFORMATION
You will find more information about the Funds at www.paradigm-funds.com. For shareholder inquiries, please call toll-free in the U.S. at 1-800-239-0732.
2019 Semi-Annual Report 37
This page was intentionally left blank.
2019 Semi-Annual Report 38
Board of Trustees
|
| This report is provided for the general information of the shareholders of the Paradigm Funds. This report is not intended for distribution to prospective investors in the Funds, unless preceded or accompanied by an effective prospectus. |
Item 2. Code of Ethics.Not applicable.
Item 3. Audit Committee Financial Expert.Not applicable.
Item 4. Principal Accountant Fees and Services.Not applicable.
Item 5. Audit Committee of Listed Companies.Not applicable.
Item 6. Investments.
(a) Not applicable. Schedule filed with Item 1.
(b) Not applicable.
Item 7. Disclosure of Proxy Voting Policies and Procedures for Closed-End Management Investment Companies.Not applicable.
Item 8. Portfolio Managers of Closed End Management Investment Companies.Not applicable.
Item 9. Purchases of Equity Securities by Closed-End Management Investment Companies and Affiliated Purchasers.Not applicable.
Item 10. Submission of Matters to a Vote of Security Holders.
The registrant has not adopted procedures by which shareholders may recommend nominees to the registrant’s board of trustees.
Item 11. Controls and Procedures.
(a) The Registrant’s president and chief financial officer concluded that the disclosure controls and procedures (as defined in Rule 30a-3(c) under the Act (17 CFR 270.30a -3(c))) as of a date within 90 days of the filing date of the report that includes the disclosure required by this paragraph, based on the evaluation of these controls and procedures required by Rule 30a-3(b) under the Act (17 CFR 270.30a -3(b)) and Rules 13a-15(b) or 15d-15(b) under the Exchange Act (17 CFR 240.13a -15(b) or 240.15d -15(b)).
(b) There were no changes in the registrant’s internal control over financial reporting (as defined in Rule 30a-3(d) under the Act (17 CFR 270.30a -3(d)) that occurred during the period covered by this report that has materially affected, or is reasonably likely to materially affect, the registrant’s internal control over financial reporting.
Item 12. Disclosure of Securities Lending Activities for Closed-End Management Investment Companies.
Not applicable.
Item 13. Exhibits.
(a)(1) Code of Ethics. Not applicable.
(a)(2) Certifications pursuant to Section 302 of the Sarbanes-Oxley Act of 2002.Filed herewith.
(a)(3)Not applicable.
(a)(4) Not applicable.
(b)Certification pursuant to Section 906 of the Sarbanes-Oxley Act of 2002.Filed herewith.
| SIGNATURES |
Pursuant to the requirements of the Securities Exchange Act of 1934 and the Investment Company Act of 1940, the registrant has duly caused this report to be signed on its behalf by the undersigned, thereunto duly authorized.
| Paradigm Funds |
| By:/s/Candace King Weir Candace King Weir President |
| Date: 8/22/2019 |
Pursuant to the requirements of the Securities Exchange Act of 1934 and the Investment Company Act of 1940, this report has been signed below by the following persons on behalf of the registrant and in the capacities and on the dates indicated.
| By:/s/Candace King Weir Candace King Weir President |
| Date: 8/22/2019 |
By:/s/Robert A. Benton |
| Date: 8/22/2019 |