UNITED STATES
SECURITIES AND EXCHANGE COMMISSION
WASHINGTON, D.C. 20549
FORM N-CSR
CERTIFIED SHAREHOLDER REPORT OF REGISTERED MANAGEMENT
INVESTMENT COMPANIES
Investment Company Act file number 811-21233
PARADIGM FUNDS
(Exact name of registrant as specified in charter)
| Nine Elk Street, Albany, NY | 12207-1002 |
| (Address of principal executive offices) | (Zip code) |
Robert A. Benton
Nine Elk Street, Albany, NY 12207-1002
(Name and address of agent for service)
Registrant’s telephone number, including area code: (518) 431-3500
Date of fiscal year end: December 31
Date of reporting period: December 31, 2022
Item 1. Report to Stockholders.
Paradigm Funds
Paradigm Value Fund
Paradigm Select Fund
Paradigm Micro-Cap Fund
For Investors Seeking Long-Term Capital Appreciation
ANNUAL REPORT
December 31, 2022
| Table of Contents | |
| PARADIGM FUNDS | |
| Letter to Shareholders | 2 |
| Sector Allocation | 5 |
| Performance Information | 7 |
| Schedules of Investments | 10 |
| Statements of Assets and Liabilities | 17 |
| Statements of Operations | 17 |
| Statements of Changes in Net Assets | 19 |
| Financial Highlights | 21 |
| NOTES TO FINANCIAL STATEMENTS | 23 |
| REPORT OF INDEPENDENT REGISTERED PUBLIC ACCOUNTING FIRM | 29 |
| DISCLOSURE OF EXPENSES | 30 |
| ADDITIONAL INFORMATION | 32 |
| TRUSTEES & OFFICERS | 33 |
2022 Annual Report 1
Letter to Shareholders
Dear Fellow Shareholders:
At this time a year ago, we were still evaluating the many market gyrations over the course of 2020 and 2021. While both years posted strong equity market performance, we also were prepared for the reality that this would not be a sustainable trajectory over the long term. Unfortunately, 2022 was quick to confirm that prediction, as we saw challenging equity market performance early on and throughout the full year period, somewhat alleviated by the positive performance in the fourth quarter. While 2021 perhaps (as we had written a year ago), “surprised to the upside”, 2022 displayed a return to earth for both the fund and equity markets in general.
Clearly 2022 ushered in a very different macro landscape, compared to the stimulus-driven and supply-chain challenged years of 2020 and 2021 for the US economy. In contrast, 2022 embarked upon an aggressive Fed tightening cadence, combined with broad-based inflation, ranging across labor, fuel, and mortgage rates, leaving very little of the US consumer base unscathed. On a positive note, however, tens of billions of dollars have been marked for domestic US investment. For example, the CHIPS Act and the expected onshore investments to come in semiconductor wafer fabrication and the surrounding infrastructure could be transformational for some industries. Moreover, employment data has remained resilient as US employers continue to grapple with hiring and retention across a swath of job roles. The US unemployment rate remains low at 3.5%, as the Fed and corporate America continue to evaluate the employment landscape.
The ISM Manufacturing index has taken a meaningful step down, from 51.7 for September, down to 48.4 as of December, having retreated into contractionary territory. The ISM Services index also retreated in December, coming in well below expectations at 49.6. This was the first tightening of the index since the early-Covid economic slowdown of May 2020, as new order demand again notably slowed amidst the current economic uncertainty. The most recent CPI data on inflation shows that it has slowed for the sixth consecutive month. While it is still running at elevated annualized level of 6.5%, the recent deceleration provides some reassurance for the 2023 cadence of Fed rate increases. Lastly, the state of the housing market remains another unknown, in terms of prices and affordability. Mortgage rates have approximately doubled from a year ago, currently hovering around 7.0% compared to 3.45% at this time a year ago.
As we embark upon a new year, there are many unknowns for 2023. To state the obvious, we are in uncharted waters economically and from an equity market perspective. No recession follows the same playbook, and the year ahead is impossible to predict. While the most recent CPI reading was reassuring as it pointed to a deceleration in inflation, there are still many gives and takes in the economic data still to come. Labor markets remain exceptionally tight, and the ultimate impact of the Fed’s actions remain to be seen. While we are thankfully entering the endemic stage of Covid (rather than the acute pandemic stage) providing a measure of relief, recent circulation of variants leaves it a very real consideration and possible disruption for the foreseeable future.
Valuations are still in flux as investors struggle to ascertain if the worst is behind the US economy, or if there is still potential further downside. Add to that the perennial question if markets are forward-looking, then how much is already discounted or priced in for the current economic malaise versus where the US economy could be a year from now. As a result, while many companies’ share prices appear discounted, we continue to evaluate them amidst a larger peer group and equity market landscape. That being said, many small-cap names are far cheaper than they were a year ago, and so we are proactively scouring the small-cap universe for quality new ideas and investments.
While it is not a new initiative on our part, as we always have, we will continue to focus on very strong management teams when considering our portfolio. Over a variety of market
2022 Annual Report 2
cycles we have seen companies with top quality management teams consistently fare better over the longer term. Whether the financial crisis of 2008-2009, or the early days of Covid in 2020, the ability to navigate through tumultuous times is critical. Companies with strong balance sheets, steady and meaningful free cash flows, helmed by seasoned leaders will be able to invest in their own capabilities even amidst challenging periods. Consequently, these are the companies that can emerge from down cycles both stronger internally and more competitively advantaged. We have conviction in these companies’ ability to navigate uncharted waters as we all endeavor to gauge the future.
Paradigm Value Fund
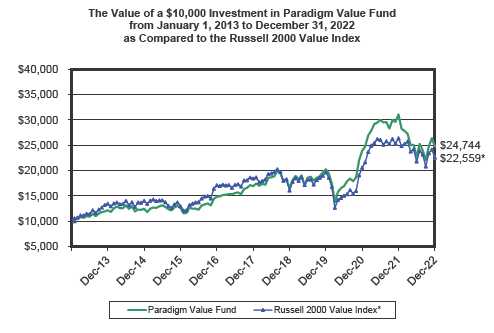
The Paradigm Value Fund decreased 20.42% for the calendar year 2022, compared to a 14.48% decrease for its benchmark, the Russell 2000 Value Index. Since inception (January 1, 2003) on an annualized basis, the Fund has returned 11.75%, compared to 8.99% for the benchmark.
The Financials sector, in which we have been historically underweight, was a nominal contributor to absolute portfolio performance in 2022.
The Information Technology sector was the greatest detractor to performance in 2022. Portfolio holdings in the Semiconductors and Semiconductor Equipment industry detracted reflecting decreased consumer electronics demand and limited production due to continued supply chain constraints.
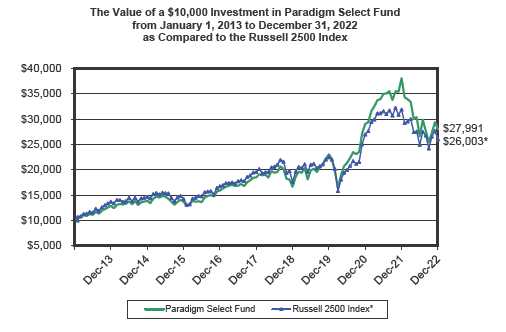
Paradigm Select Fund
The Paradigm Select Fund decreased 26.44% for the calendar year 2022, compared to a decrease of 18.37% for its benchmark, the Russell 2500 Index. Since inception (January 1, 2005) on an annualized basis, the Fund has returned 9.10%, compared to 8.15% for the benchmark.
The Information Technology sector was the greatest detractor to performance in 2022. Portfolio holdings in the Semiconductors and Semiconductor Equipment industry underperformed over the course of 2022 as the industry prepared for decreased customer spending following a record year for wafer fabrication equipment shipments. This more subdued outlook for industry capital expenditures led to unfavorable investor sentiment for the group as a whole.
Given the overall weakness of the equity markets, there were no sector contributors to performance in 2022. For comparison, the only positively performing sector in the Russell 2500 benchmark index was Energy, a sector in which the Select Fund does not typically invest.
Paradigm Micro-Cap Fund
The Paradigm Micro-Cap Fund decreased 20.62% for the calendar year 2022, compared to a decrease of 21.96% for its benchmark, the Russell Microcap Index. Since inception (January 1, 2008) on an annualized basis, the Fund has returned 9.04%, compared to 6.34% for the benchmark.
The Information Technology sector was the greatest detractor to performance in 2022. Portfolio holdings in the Semiconductors and Semiconductor Equipment industry were the
2022 Annual Report 3
greatest detractor. The Health Care sector was also a meaningful detractor to full-year performance, reflecting weakness in the Health Care Equipment & Supplies industry due to consumer concerns over inflation, supply chain disruptions, labor shortages and geopolitical volatility.
The Industrials sector was a nominal contributor to portfolio performance in 2022, driven by strong stock selection.
Sincerely,

Candace King Weir | Amelia F. Weir |
Past performance does not guarantee future results. Investment return and principal value will fluctuate so that shares, when redeemed, may be worth more or less than their original cost. Returns assume that all dividends and distributions were reinvested and do not reflect the deduction of taxes that a shareholder would pay on fund distributions or the redemption of fund shares. Current performance may be lower or higher that the performance data quoted. Statements concerning financial market trends are based on current market conditions, which will fluctuate. Any statements of opinion constitute only current opinions of Paradigm Funds Advisor LLC which are subject to change. Investment in the Funds involves a risk of loss. The Russell 2000 Value Index, Russell 2500 Index and Russell Microcap Index are U.S. equity indices. These indices are included for informational purposes only and may not be representative of the type of investments made by the Funds. Investors cannot invest directly in an index. References made to these indices are for comparative purposes only. To obtain performance data current to the most recent month end, please call 1-800-239-0732 or visit our website at www.paradigm-funds.com. The prospectus should be read carefully before investing.
2022 Annual Report 4
Paradigm Funds (Unaudited)
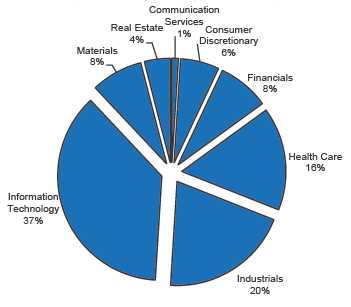
PARADIGM VALUE FUND
Sector Allocation as of December 31, 2022
(As a Percentage of Equity Securities Held)
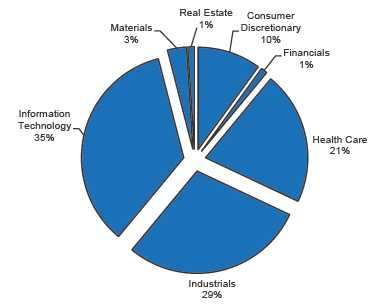
PARADIGM SELECT FUND
Sector Allocation as of December 31, 2022
(As a Percentage of Equity Securities Held)
2022 Annual Report 5
Paradigm Funds (Unaudited)
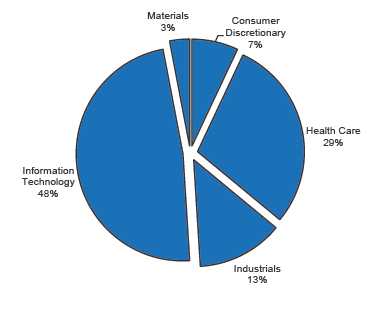
| PARADIGM MICRO-CAP FUND Sector Allocation as of December 31, 2022 (As a Percentage of Equity Securities Held) |
2022 Annual Report 6
Paradigm Value Fund (Unaudited)
PERFORMANCE INFORMATION
Average Annual Rate of Return (%) for the Periods Ended December 31, 2022.
December 31, 2022 NAV $52.32
| 1 Year(A) | 3 Year(A) | 5 Year(A) | 10 Year(A) | |||||
| Paradigm Value Fund | (20.42)% | 6.89% | 7.90% | 9.48% | ||||
| Russell 2000® Value Index(B) | (14.48)% | 4.70% | 4.13% | 8.48% |
(A) 1 Year, 3 Year, 5 Year and 10 Year returns include change in share prices and in each case includes reinvestment of any dividends and capital gain distributions. The inception date of the Paradigm Value Fund was January 1, 2003.
(B) The Russell 2000® Value Index (whose composition is different from the Fund) is an unmanaged index of small-capitalization stocks with lower price-to-book ratios and lower forecasted growth values than the total population of small-capitalization stocks. Investors cannot invest directly in an index.
For purposes of the graph and the accompanying table, it is assumed that all dividends and distributions were reinvested.
Per the Fund’s most recent prospectus, the Fund’s Total Annual Operating Expense Ratio is 1.50% . The Total Annual Operating Expense Ratio may not correlate to the expense ratio in the Fund’s financial highlights because the financial highlights only include the direct operating expenses incurred by the Fund, not the indirect costs of investing in acquired funds. Shares redeemed within 90 days of purchase are subject to a 2.00% redemption fee.
PAST PERFORMANCE DOES NOT GUARANTEE FUTURE RESULTS. INVESTMENT RETURN AND PRINCIPAL VALUE WILL FLUCTUATE SO THAT SHARES, WHEN REDEEMED, MAY BE WORTH MORE OR LESS THAN THEIR ORIGINAL COST. RETURNS DO NOT REFLECT THE DEDUCTION OF TAXES THAT A SHAREHOLDER WOULD PAY ON FUND DISTRIBUTIONS OR THE REDEMPTION OF FUND SHARES. CURRENT PERFORMANCE MAY BE LOWER OR HIGHER THAT THE PERFORMANCE DATA QUOTED. TO OBTAIN PERFORMANCE DATA CURRENT TO THE MOST RECENT MONTH END, PLEASE CALL 1-800-239-0732 OR VISIT OUR WEBSITE AT www.paradigm-funds.com.
2022 Annual Report 7
Paradigm Select Fund (Unaudited)
PERFORMANCE INFORMATION
Average Annual Rate of Return (%) for the Periods Ended December 31, 2022.
December 31, 2022 NAV $54.61
| 1 Year(A) | 3 Year(A) | 5 Year(A) | 10 Year(A) | |||||
| Paradigm Select Fund | (26.44)% | 6.74% | 8.66% | 10.84% | ||||
| Russell 2500® Index(B) | (18.37)% | 5.00% | 5.89% | 10.03% |
(A) 1 Year, 3 Year, 5 Year and 10 Year returns include change in share prices and in each case includes reinvestment of any dividends and capital gain distributions. The inception date of the Paradigm Select Fund was January 1, 2005.
(B) The Russell 2500® Index (whose composition is different from the Fund) measures the performance of the small to mid-cap segment of the U.S. equity universe, commonly referred to as “mid” cap. The Russell 2500® Index is a subset of the Russell 3000® Index. It includes approximately 2,500 of the smallest securities based on a combination of their market cap and current index membership. Investors cannot invest directly in an index.
For purposes of the graph and the accompanying table, it is assumed that all dividends and distributions were reinvested.
Per the Fund’s most recent prospectus, the Fund’s Total Annual Operating Expense Ratio (before any fee waiver) is 1.51%, and 1.16% post waiver. The Advisor has contractually agreed to waive management fees and reimburse expenses to the extent necessary to maintain total annual operating expenses of the Fund (excluding brokerage fees and commissions, interest and other borrowing expenses, taxes, extraordinary expenses and the indirect costs of investing in Acquired Funds) at 1.15% of its average daily net assets through April 30, 2023. The Total Annual Operating Expense Ratio may not correlate to the expense ratio in the Fund’s financial highlights because the financial highlights only include the direct operating expenses incurred by the Fund, not the indirect costs of investing in acquired funds. Shares redeemed within 90 days of purchase are subject to a 2.00% redemption fee.
PAST PERFORMANCE DOES NOT GUARANTEE FUTURE RESULTS. INVESTMENT RETURN AND PRINCIPAL VALUE WILL FLUCTUATE SO THAT SHARES, WHEN REDEEMED, MAY BE WORTH MORE OR LESS THAN THEIR ORIGINAL COST. RETURNS DO NOT REFLECT THE DEDUCTION OF TAXES THAT A SHAREHOLDER WOULD PAY ON FUND DISTRIBUTIONS OR THE REDEMPTION OF FUND SHARES. CURRENT PERFORMANCE MAY BE LOWER OR HIGHER THAT THE PERFORMANCE DATA QUOTED. TO OBTAIN PERFORMANCE DATA CURRENT TO THE MOST RECENT MONTH END, PLEASE CALL 1-800-239-0732 OR VISIT OUR WEBSITE AT www.paradigm-funds.com.
2022 Annual Report 8
Paradigm Micro-Cap Fund (Unaudited)
PERFORMANCE INFORMATION
Average Annual Rate of Return (%) for the Period Ended December 31, 2022.
December 31, 2022 NAV $43.32
| 1 Year(A) | 3 Year(A) | 5 Year(A) | 10 Year(A) | |||||
| Paradigm Micro-Cap Fund | (20.62)% | 14.25% | 10.20% | 11.99% | ||||
| Russell Microcap® Index(B) | (21.96)% | 4.05% | 3.69% | 8.86% |
(A) 1 Year, 3 Year, 5 Year and 10 Year returns include change in share prices and in each case includes reinvestment of any dividends and capital gain distributions. The inception date of the Paradigm Micro-Cap Fund was January 1, 2008.
(B) The Russell Microcap® Index measures the performance of the microcap segment of the U.S. equity market. Microcap stocks make up less than 3% of the U.S. equity market (by market cap) and consist of the smallest 1,000 securities in the small-cap Russell 2000® Index, plus the next smallest eligible securities by market cap. The Russell Microcap® Index is completely reconstituted annually to ensure larger stocks do not distort performance and characteristics of the true microcap opportunity set. Investors cannot invest directly in an index. Under normal circumstances, the Micro-Cap Fund invests at least 80% of its net assets in common stocks of U.S. micro-cap companies.
For purposes of the graph and the accompanying table, it is assumed that all dividends and distributions were reinvested.
Per the Fund’s most recent prospectus, the Fund’s Total Annual Operating Expense Ratio is 1.25% . The Total Annual Operating Expense Ratio may not correlate to the expense ratio in the Fund’s financial highlights because the financial highlights only include the direct operating expenses incurred by the Fund, not the indirect costs of investing in acquired funds. Shares redeemed within 90 days of purchase are subject to a 2.00% redemption fee.
PAST PERFORMANCE DOES NOT GUARANTEE FUTURE RESULTS. INVESTMENT RETURN AND PRINCIPAL VALUE WILL FLUCTUATE SO THAT SHARES, WHEN REDEEMED, MAY BE WORTH MORE OR LESS THAN THEIR ORIGINAL COST. RETURNS DO NOT REFLECT THE DEDUCTION OF TAXES THAT A SHAREHOLDER WOULD PAY ON FUND DISTRIBUTIONS OR THE REDEMPTION OF FUND SHARES. CURRENT PERFORMANCE MAY BE LOWER OR HIGHER THAT THE PERFORMANCE DATA QUOTED. TO OBTAIN PERFORMANCE DATA CURRENT TO THE MOST RECENT MONTH END, PLEASE CALL 1-800-239-0732 OR VISIT OUR WEBSITE AT www.paradigm-funds.com.
2022 Annual Report 9
| Paradigm Value Fund | |||||
| Schedule of Investments | |||||
| December 31, 2022 | |||||
| Shares | Fair Value | % of Net Assets | |||
| COMMON STOCKS | |||||
| Air Courier Services | |||||
| 37,000 | Air Transport Services Group, Inc. * | $ | 961,260 | 1.98 | % |
| Aircraft Parts & Auxiliary Equipment, NEC | |||||
| 10,000 | Ducommun Incorporated * | 499,600 | 1.03 | % | |
| Communications Services, NEC | |||||
| 30,000 | Calix, Inc. * | 2,052,900 | 4.23 | % | |
| Computer Communications Equipment | |||||
| 124,300 | A10 Networks, Inc. | 2,067,109 | |||
| 100,000 | Extreme Networks, Inc. * | 1,831,000 | |||
| 3,898,109 | 8.03 | % | |||
| Electrical Work | |||||
| 17,900 | EMCOR Group Inc. | 2,651,169 | 5.46 | % | |
| Electronic Computers | |||||
| 6,000 | Omnicell, Inc. * | 302,520 | 0.62 | % | |
| Footwear, (No Rubber) | |||||
| 20,000 | Caleres, Inc. | 445,600 | 0.92 | % | |
| Industrial Organic Chemicals | |||||
| 21,700 | Sensient Technologies Corporation | 1,582,364 | 3.26 | % | |
| Laboratory Analytical Instruments | |||||
| 12,500 | PerkinElmer Inc. | 1,752,750 | 3.61 | % | |
| Measuring & Controlling Devices, NEC | |||||
| 10,000 | Onto Innovation Inc. * | 680,900 | 1.40 | % | |
| Mining & Quarrying of Nonmetallic Minerals (No Fuels) | |||||
| 79,326 | Summit Materials, Inc. - Class A * | 2,252,065 | 4.64 | % | |
| Motor Vehicle Parts & Accessories | |||||
| 60,000 | Modine Manufacturing Company * | 1,191,600 | 2.46 | % | |
| National Commercial Banks | |||||
| 34,000 | First Merchants Corporation | 1,397,740 | |||
| 17,000 | National Bank Holdings Corporation - Class A | 715,190 | |||
| 2,112,930 | 4.36 | % | |||
| Optical Instruments & Lenses | |||||
| 18,000 | Coherent Corp. * | 631,800 | 1.30 | % | |
| Printed Circuit Boards | |||||
| 15,000 | Jabil, Inc. | 1,023,000 | 2.11 | % | |
| Retail - Catalog & Mail-Order Houses | |||||
| 7,000 | Insight Enterprises, Inc. * | 701,890 | 1.45 | % | |
| Retail - Family Clothing Stores | |||||
| 67,600 | American Eagle Outfitters, Inc. | 943,696 | 1.95 | % | |
| Retail - Retail Stores, NEC | |||||
| 6,000 | IAC/InterActiveCorp. * | 266,400 | 0.55 | % | |
| Retail - Shoe Stores | |||||
| 51,000 | Designer Brands Inc. - Class A | 498,780 | |||
| 29,800 | Foot Locker, Inc. | 1,126,142 | |||
| 1,624,922 | 3.35 | % | |||
| Semiconductors & Related Devices | |||||
| 53,600 | Kulicke & Soffa Industries Inc. (Singapore) | 2,372,336 | |||
| 20,000 | MaxLinear, Inc. * | 679,000 | |||
| 11,700 | Qorvo, Inc. * | 1,060,488 | |||
| 4,111,824 | 8.47 | % | |||
| Services - Business Services, NEC | |||||
| 5,900 | Concentrix Corporation | 785,644 | |||
| 140,000 | Conduent Incorporated * | 567,000 | |||
| 1,352,644 | 2.79 | % | |||
| * Non-Income Producing Securities. The accompanying notes are an integral part of these financial statements. |
2022 Annual Report 10
| Paradigm Value Fund | ||||||
| Schedule of Investments | ||||||
| December 31, 2022 | ||||||
| Shares | Fair Value | % of Net Assets | ||||
| COMMON STOCKS | ||||||
| Services - Help Supply Services | ||||||
| 41,900 | Kforce Inc. | $ | 2,297,377 | 4.74 | % | |
| Services - Home Health Care Services | ||||||
| 18,900 | Addus HomeCare Corporation * | 1,880,361 | 3.88 | % | ||
| Services - Management Services | ||||||
| 30,000 | R1 RCM Inc. * | 328,500 | 0.68 | % | ||
| Services - Medical Laboratories | ||||||
| 33,300 | RadNet, Inc. * | 627,039 | 1.29 | % | ||
| Services - Prepackaged software | ||||||
| 40,000 | Absolute Software Corp. (Canada) | 417,600 | ||||
| 6,666 | Consensus Cloud Solutions Inc. * | 358,364 | ||||
| 775,964 | 1.60 | % | ||||
| Services - Skilled Nursing Care Facilities | ||||||
| 10,000 | The Ensign Group, Inc. | 946,100 | 1.95 | % | ||
| Special Industry Machinery (No Metalworking Machinery) | ||||||
| 3,500 | Kadant Inc. | 621,705 | 1.28 | % | ||
| Special Industry Machinery, NEC | ||||||
| 28,100 | Azenta, Inc. * | 1,635,982 | ||||
| 20,000 | Veeco Instruments Inc. * | 371,600 | ||||
| 2,007,582 | 4.14 | % | ||||
| State Commercial Banks | ||||||
| 10,000 | Banner Corporation | 632,000 | ||||
| 28,000 | Renasant Corporation | 1,052,520 | ||||
| 1,684,520 | 3.47 | % | ||||
| Telegraph & Other Message Communications | ||||||
| 7,200 | Ziff Davis, Inc. * | 569,520 | 1.17 | % | ||
| Telephone & Telegraph Apparatus | ||||||
| 6,000 | Fabrinet (Thailand) * | 769,320 | 1.59 | % | ||
| Transportation Services | ||||||
| 9,900 | GATX Corp. | 1,052,766 | 2.17 | % | ||
| Water, Sewer, Pipeline, Comm & Power Line Construction | ||||||
| 23,000 | Primoris Services Corporation | 504,620 | 1.04 | % | ||
| Wholesale - Computers & Peripheral Equipment & Software | ||||||
| 10,832 | TD SYNNEX Corporation | 1,025,899 | 2.11 | % | ||
| Total for Common Stocks (Cost $18,556,193) | 46,131,216 | 95.08 | % | |||
| REAL ESTATE INVESTMENT TRUSTS | ||||||
| 10,950 | Mid-America Apartment Communities Inc. | 1,719,040 | ||||
| Total for Real Estate Investment Trusts (Cost $306,603) | 1,719,040 | 3.54 | % | |||
| MONEY MARKET FUNDS | ||||||
| 650,797 | SEI Daily Income Trust Government Fund CL F 3.74% ** | 650,797 | 1.34 | % | ||
| Total for Money Market Funds (Cost $650,797) | ||||||
| Total Investment Securities | 48,501,053 | 99.96 | % | |||
| (Cost $19,513,593) | ||||||
| Other Assets in Excess of Liabilities | 19,218 | 0.04 | % | |||
| Net Assets | $ | 48,520,271 | 100.00 | % | ||
| * Non-Income Producing Securities. ** The Yield Rate shown represents the 7-day yield at December 31, 2022. |
| The accompanying notes are an integral part of these financial statements. |
2022 Annual Report 11
| Paradigm Select Fund | ||||||
| Schedule of Investments | ||||||
| December 31, 2022 | ||||||
| Shares | Fair Value | % of Net Assets | ||||
| COMMON STOCKS | ||||||
| Aircraft Parts & Auxiliary Equipment, NEC | ||||||
| 31,300 | Ducommun Incorporated * | $ | 1,563,748 | 1.67 | % | |
| Communications Equipment, NEC | ||||||
| 24,600 | Lumentum Holdings Inc. * | 1,283,382 | 1.37 | % | ||
| Electrical Work | ||||||
| 35,100 | EMCOR Group Inc. | 5,198,661 | 5.56 | % | ||
| Electromedical & Electrotherapeutic Apparatus | ||||||
| 10,200 | Masimo Corporation * | 1,509,090 | 1.61 | % | ||
| Electronic Computers | ||||||
| 30,000 | Omnicell, Inc. * | 1,512,600 | 1.62 | % | ||
| Fire, Marine & Casualty Insurance | ||||||
| 6,450 | American Financial Group Inc. | 885,456 | 0.95 | % | ||
| General Industrial Machinery & Equipment | ||||||
| 12,200 | Regal Rexnord Corporation | 1,463,756 | ||||
| 82,400 | Zurn Elkay Water Solutions Corp. | 1,742,760 | ||||
| 3,206,516 | 3.43 | % | ||||
| Industrial Instruments For Measurement, Display, and Control | ||||||
| 22,900 | MKS Instruments, Inc. | 1,940,317 | 2.07 | % | ||
| Industrial Organic Chemicals | ||||||
| 25,700 | Sensient Technologies Corporation | 1,874,044 | 2.00 | % | ||
| Instruments for Measurement & Testing of Electricity & Electric Signals | ||||||
| 35,600 | Teradyne, Inc. | 3,109,660 | 3.33 | % | ||
| Laboratory Analytical Instruments | ||||||
| 33,300 | PerkinElmer Inc. | 4,669,326 | 4.99 | % | ||
| Life Insurance | ||||||
| 401 | F&G Annuities & Life, Inc. * | 8,028 | 0.01 | % | ||
| Measuring & Controlling Devices, NEC | ||||||
| 18,300 | Onto Innovation Inc. * | 1,246,047 | 1.33 | % | ||
| Mining & Quarrying of Nonmetallic Minerals (No Fuels) | ||||||
| 551 | Summit Materials, Inc. - Class A * | 15,637 | 0.02 | % | ||
| Miscellaneous Manufacturing Industries | ||||||
| 14,600 | Hillenbrand, Inc. | 622,982 | 0.67 | % | ||
| Optical Instruments & Lenses | ||||||
| 50,000 | Coherent Corp. * | 1,755,000 | 1.88 | % | ||
| Plastics Products | ||||||
| 20,000 | Entegris, Inc. | 1,311,800 | 1.40 | % | ||
| Printed Circuit Boards | ||||||
| 31,800 | Jabil, Inc. | 2,168,760 | 2.32 | % | ||
| Retail - Catalog & Mail-Order Houses | ||||||
| 11,700 | Insight Enterprises, Inc. * | 1,173,159 | 1.25 | % | ||
| Retail - Eating & Drinking Places | ||||||
| 6,700 | Cannae Holdings, Inc. * | 138,355 | 0.15 | % | ||
| Retail - Family Clothing Stores | ||||||
| 68,000 | American Eagle Outfitters, Inc. | 949,280 | 1.02 | % | ||
| Retail - Lumber & Other Building Materials Dealers | ||||||
| 78,600 | Builders FirstSource, Inc. * | 5,099,568 | 5.45 | % | ||
| Retail - Radio, TV & Consumer Electronics Stores | ||||||
| 40,700 | Best Buy Co., Inc. | 3,264,547 | 3.49 | % | ||
| Retail - Retail Stores, NEC | ||||||
| 14,900 | IAC/InterActiveCorp. * | 661,560 | 0.71 | % | ||
| Retail - Shoe Stores | ||||||
| 74,800 | Foot Locker, Inc. | 2,826,692 | 3.02 | % | ||
| Search, Detection, Navigation, Guidance, Aeronautical Systems | ||||||
| 18,100 | Garmin Ltd. (Switzerland) | 1,670,449 | 1.79 | % | ||
| * Non-Income Producing Securities. The accompanying notes are an integral part of these financial statements. |
2022 Annual Report 12
| Paradigm Select Fund | |||||||
| Schedule of Investments | |||||||
| December 31, 2022 | |||||||
| Shares | Fair Value | % of Net Assets | |||||
| COMMON STOCKS | |||||||
| Semiconductors & Related Devices | |||||||
| 95,400 | Kulicke & Soffa Industries Inc. (Singapore) | $ | 4,222,404 | ||||
| 75,700 | Marvell Technology, Inc. | 2,803,928 | |||||
| 48,400 | MaxLinear, Inc. * | 1,643,180 | |||||
| 12,800 | Qorvo, Inc. * | 1,160,192 | |||||
| 10,000 | Silicon Motion Technology Corporation ADR | 649,900 | |||||
| 25,000 | Skyworks Solutions, Inc. | 2,278,250 | |||||
| 12,757,854 | 13.65 | % | |||||
| Services - Help Supply Services | |||||||
| 98,825 | Kelly Services, Inc. - Class A | 1,670,143 | |||||
| 75,200 | Kforce Inc. | 4,123,216 | |||||
| 5,793,359 | 6.20 | % | |||||
| Services - Medical Laboratories | |||||||
| 62,600 | Natera, Inc. * | 2,514,642 | 2.69 | % | |||
| Services - Prepackaged Software | |||||||
| 1,809 | Black Knight, Inc. * | 111,706 | |||||
| 11,100 | Consensus Cloud Solutions Inc. * | 596,736 | |||||
| 32,100 | Progress Software Corporation | 1,619,445 | |||||
| 2,327,887 | 2.49 | % | |||||
| Services - Skilled Nursing Care Facilities | |||||||
| 17,100 | The Ensign Group, Inc. | 1,617,831 | 1.73 | % | |||
| Steel Pipe & Tubes | |||||||
| 15,750 | ATI Inc. * | 470,295 | 0.50 | % | |||
| Steel Works, Blast Furnaces & Rolling Mills (Coke Ovens) | |||||||
| 13,800 | Carpenter Technology Corporation | 509,772 | 0.55 | % | |||
| Surgical & Medical Instruments & Apparatus | |||||||
| 91,100 | Globus Medical, Inc. - Class A * | 6,765,997 | 7.24 | % | |||
| Title Insurance | |||||||
| 5,900 | Fidelity National Financial, Inc. | 221,958 | 0.24 | % | |||
| Wholesale - Computers & Peripheral Equipment & Software | |||||||
| 23,100 | TD SYNNEX Corporation | 2,187,801 | 2.34 | % | |||
| Wholesale - Electrical Apparatus & Equipment, Wiring Supplies | |||||||
| 22,000 | EnerSys | 1,624,480 | 1.74 | % | |||
| Wholesale - Lumber & Other Construction Materials | �� | ||||||
| 43,300 | Boise Cascade Company | 2,973,411 | 3.18 | % | |||
| Total for Common Stocks (Cost $78,559,748) | 89,429,951 | 95.66 | % | ||||
| REAL ESTATE INVESTMENT TRUSTS | |||||||
| 8,400 | Mid-America Apartment Communities Inc. | 1,318,716 | 1.41 | % | |||
| Total for Real Estate Investment Trusts (Cost $924,583) | |||||||
| MONEY MARKET FUNDS | |||||||
| 2,897,055 | SEI Daily Income Trust Government Fund CL F 3.74% ** | 2,897,055 | 3.10 | % | |||
| Total for Money Market Funds (Cost $2,897,055) | |||||||
| Total Investment Securities | 93,645,722 | 100.17 | % | ||||
| (Cost $82,381,386) | |||||||
| Liabilities in Excess of Other Assets | (154,997 | ) | -0.17 | % | |||
| Net Assets | $ | 93,490,725 | 100.00 | % | |||
| * Non-Income Producing Securities. The Yield Rate shown represents the 7-day yield at December 31, 2022. |
| The accompanying notes are an integral part of these financial statements. |
2022 Annual Report 13
| Paradigm Micro-Cap Fund | ||||||
| Schedule of Investments | ||||||
| December 31, 2022 | ||||||
| Shares | Fair Value | % of Net Assets | ||||
| COMMON STOCKS | ||||||
| Aircraft Parts & Auxiliary Equipment, NEC | ||||||
| 60,000 | Ducommun Incorporated * | $ | 2,997,600 | 2.65 | % | |
| Communications Services, NEC | ||||||
| 60,000 | Calix, Inc. * | 4,105,800 | 3.62 | % | ||
| Computer Communications Equipment | ||||||
| 200,000 | A10 Networks, Inc. | 3,326,000 | ||||
| 320,000 | Extreme Networks, Inc. * | 5,859,200 | ||||
| 40,000 | Lantronix, Inc. * | 172,800 | ||||
| 9,358,000 | 8.26 | % | ||||
| Electromedical & Electrotherapeutic Apparatus | ||||||
| 100,000 | Cutera, Inc. * | 4,422,000 | 3.90 | % | ||
| Electronic Computers | ||||||
| 20,000 | Omnicell, Inc. * | 1,008,400 | 0.89 | % | ||
| Footwear (No Rubber) | ||||||
| 160,000 | Caleres, Inc. | 3,564,800 | 3.15 | % | ||
| Household Furniture | ||||||
| 70,000 | Hooker Furnishings Corporation | 1,309,000 | 1.16 | % | ||
| Industrial Organic Chemicals | ||||||
| 5,950 | Sensient Technologies Corporation | 433,874 | 0.38 | % | ||
| Instruments For Measurement & Testing of Electricity & Electric Signals | ||||||
| 32,650 | Cohu, Inc. * | 1,046,433 | 0.92 | % | ||
| Measuring & Controlling Devices, NEC | ||||||
| 50,000 | Onto Innovation Inc. * | 3,404,500 | 3.00 | % | ||
| Mining & Quarrying of Nonmetallic Minerals (No Fuels) | ||||||
| 101,700 | Summit Materials, Inc. - Class A * | 2,887,263 | 2.55 | % | ||
| Miscellaneous Manufacturing Industries | ||||||
| 5,200 | Hillenbrand, Inc. | 221,884 | 0.20 | % | ||
| Motor Vehicle Parts & Accessories | ||||||
| 250,000 | Modine Manufacturing Company * | 4,965,000 | 4.38 | % | ||
| Office Machines, NEC | ||||||
| 100,000 | Pitney Bowes Inc. | 380,000 | 0.34 | % | ||
| Pharmaceutical Preparations | ||||||
| 300,000 | Eton Pharmaceuticals, Inc. * | 846,000 | ||||
| 40,000 | Nature's Sunshine Products, Inc. * | 332,800 | ||||
| 40,000 | Ocular Therapeutix, Inc. * | 112,400 | ||||
| 1,291,200 | 1.14 | % | ||||
| Radio & TV Broadcasting & Communications Equipment | ||||||
| 50,000 | Aviat Networks, Inc. * | 1,559,500 | ||||
| 300,000 | CalAmp Corp. * | 1,344,000 | ||||
| 2,903,500 | 2.56 | % | ||||
| Retail - Apparel & Accessory Stores | ||||||
| 60,000 | Citi Trends, Inc. * | 1,588,800 | 1.40 | % | ||
| Retail - Catalog & Mail-Order Houses | ||||||
| 40,000 | Insight Enterprises, Inc. * | 4,010,800 | ||||
| 62,555 | Lulu’s Fashion Lounge Holdings, Inc. * | 157,013 | ||||
| 4,167,813 | 3.68 | % | ||||
| Retail - Family Clothing Stores | ||||||
| 13,300 | American Eagle Outfitters, Inc. | 185,668 | 0.16 | % | ||
| Semiconductors & Related Devices | ||||||
| 33,700 | Kulicke & Soffa Industries Inc. (Singapore) | 1,491,562 | ||||
| 120,000 | MaxLinear, Inc. * | 4,074,000 | ||||
| 120,000 | Ultra Clean Holdings, Inc. * | 3,978,000 | ||||
| 9,543,562 | 8.42 | % | ||||
| * Non-Income Producing Securities. The accompanying notes are an integral part of these financial statements. |
2022 Annual Report 14
| Paradigm Micro-Cap Fund | ||||||
| Schedule of Investments | ||||||
| December 31, 2022 | ||||||
| Shares | Fair Value | % of Net Assets | ||||
| COMMON STOCKS | ||||||
| Services - Business Services, NEC | ||||||
| 138,100 | Tabula Rasa HealthCare, Inc. * | $ | 683,595 | 0.60 | % | |
| Services - Computer Integrated Systems Design | ||||||
| 100,000 | NextGen Healthcare, Inc. * | 1,878,000 | ||||
| 640,000 | Ribbon Communications Inc. * | 1,785,600 | ||||
| 3,663,600 | 3.23 | % | ||||
| Services - Computer Programing Services | ||||||
| 80,000 | Computer Programs & Systems, Inc. * | 2,177,600 | 1.92 | % | ||
| Services - Health Services | ||||||
| 100,000 | The Pennant Group, Inc. * | 1,098,000 | 0.97 | % | ||
| Services - Help Supply Services | ||||||
| 55,000 | Cross Country Healthcare, Inc. * | 1,461,350 | ||||
| 130,500 | Kelly Services, Inc. - Class A | 2,205,450 | ||||
| 3,666,800 | 3.24 | % | ||||
| Services - Home Health Care Services | ||||||
| 19,700 | Addus HomeCare Corporation * | 1,959,953 | 1.73 | % | ||
| Services - Management Services | ||||||
| 160,000 | R1 RCM Inc. * | 1,752,000 | 1.55 | % | ||
| Services - Miscellaneous Health & Allied Services, NEC | ||||||
| 300,000 | Viemed Healthcare, Inc. * | 2,268,000 | 2.00 | % | ||
| Services - Prepackaged Software | ||||||
| 70,395 | Absolute Software Corp. (Canada) | 734,924 | ||||
| 10,900 | Progress Software Corporation | 549,905 | ||||
| 1,284,829 | 1.13 | % | ||||
| Services - Services, NEC | ||||||
| 200,000 | Harsco Corporation * | 1,258,000 | 1.11 | % | ||
| Services - Skilled Nursing Care Facilities | ||||||
| 40,000 | The Ensign Group, Inc. | 3,784,400 | 3.34 | % | ||
| Special Industry Machinery (No Metalworking Machinery) | ||||||
| 15,100 | Kadant Inc. | 2,682,213 | 2.37 | % | ||
| Special Industry Machinery, NEC | ||||||
| 50,000 | Axcelis Technologies, Inc. * | 3,968,000 | ||||
| 9,800 | Azenta, Inc. * | 570,556 | ||||
| 200,000 | Veeco Instruments Inc. * | 3,716,000 | ||||
| 8,254,556 | 7.28 | % | ||||
| Surgical & Medical Instruments & Apparatus | ||||||
| 110,000 | AngioDynamics, Inc. * | 1,514,700 | ||||
| 53,700 | AtriCure, Inc. * | 2,383,206 | ||||
| 400,000 | MiMedx Group, Inc. * | 1,112,000 | ||||
| 19,600 | OrthoPediatrics Corp. * | 778,708 | ||||
| 80,000 | SI-BONE, Inc. * | 1,088,000 | ||||
| 50,000 | Tactile Systems Technology, Inc. * | 574,000 | ||||
| 7,450,614 | 6.57 | % | ||||
| Telephone & Telegraph Apparatus | ||||||
| 700,000 | Infinera Corporation * | 4,718,000 | 4.16 | % | ||
| Watches, Clocks, Clockwork Operated Devices/Parts | ||||||
| 34,900 | Fossil Group, Inc. * | 150,419 | 0.13 | % | ||
| Wholesale - Computers & Peripheral Equipment & Software | ||||||
| 80,000 | ScanSource, Inc. * | 2,337,600 | 2.06 | % | ||
| Women's, Misses', and Juniors Outerwear | ||||||
| 40,000 | J.Jill, Inc. * | 992,000 | 0.88 | % | ||
| Total for Common Stocks (Cost $70,429,376) | 109,967,276 | 97.03 | % | |||
| * Non-Income Producing Securities. The accompanying notes are an integral part of these financial statements. |
2022 Annual Report 15
| Paradigm Micro-Cap Fund | ||||||
| Schedule of Investments | ||||||
| December 31, 2022 | ||||||
| Shares | Fair Value | % of Net Assets | ||||
| CONTINGENT VALUE RIGHTS | ||||||
| 300,000 Flexion Therapeutics Contingent Value Right * + | $ | 186,000 | ||||
| Total for Contingent Value Rights (Cost $186,000) | 186,000 | 0.16 | % | |||
| MONEY MARKET FUNDS | ||||||
| 3,284,532 SEI Daily Income Trust Government Fund CL F 3.74% ** | $ | 3,284,532 | 2.90 | % | ||
| Total for Money Market Funds (Cost $3,284,532) | ||||||
| Total Investment Securities | 113,437,808 | 100.09 | % | |||
| (Cost $73,899,908) | ||||||
| Liabilities in Excess of Other Assets | (108,110 | ) | -0.09 | % | ||
| Net Assets | $ | 113,329,698 | 100.00 | % | ||
| * Non-Income Producing Securities. ** The Yield Rate shown represents the 7-day yield at December 31, 2022. + Level 3 and illiquid security. |
| The accompanying notes are an integral part of these financial statements. |
2022 Annual Report 16
| Paradigm Funds | ||||||||
| Statements of Assets and Liabilities | Value | Select | ||||||
| December 31, 2022 | Fund | Fund | ||||||
| Assets: | ||||||||
| Investment Securities at Fair Value* | $ | 48,501,053 | $ | 93,645,722 | ||||
| Receivable for Fund Shares Sold | 60,306 | 7,699 | ||||||
| Dividends Receivable | 28,284 | 67,730 | ||||||
| Total Assets | 48,589,643 | 93,721,151 | ||||||
| Liabilities: | ||||||||
| Payable for Fund Shares Redeemed | 6,011 | 137,021 | ||||||
| Payable to Advisor | 63,361 | 93,405 | ||||||
| Total Liabilities | 69,372 | 230,426 | ||||||
| Net Assets | $ | 48,520,271 | $ | 93,490,725 | ||||
| Net Assets Consist of: | ||||||||
| Paid In Capital | $ | 19,547,703 | $ | 85,567,725 | ||||
| Total Distributable Earnings | 28,972,568 | 7,923,000 | ||||||
| Net Assets | $ | 48,520,271 | $ | 93,490,725 | ||||
| Net Asset Value, Offering and Redemption Price (Note 2) | $ | 52.32 | $ | 54.61 | ||||
| * Investments at Identified Cost | $ | 19,513,593 | $ | 82,381,386 | ||||
| Shares Outstanding (Unlimited number of shares | 927,346 | 1,712,100 | ||||||
| authorized without par value) | ||||||||
| Statements of Operations | ||||||||
| For the fiscal year ended December 31, 2022 | ||||||||
| Investment Income: | ||||||||
| Dividends (Net of foreign taxes of $2,461 and $0, respectively) | $ | 536,487 | $ | 1,296,782 | ||||
| Total Investment Income | 536,487 | 1,296,782 | ||||||
| Expenses: | ||||||||
| Investment Advisor Fees | 801,755 | 1,746,908 | ||||||
| Total Expenses | 801,755 | 1,746,908 | ||||||
| Less: Expenses Waived | - | (407,612 | ) | |||||
| Net Expenses | 801,755 | 1,339,296 | ||||||
| Net Investment Loss | (265,268 | ) | (42,514 | ) | ||||
| Realized and Unrealized Gain (Loss) on Investments: | ||||||||
| Capital Gain Distributions from Real Estate Investment Trusts | 2,581 | 1,951 | ||||||
| Net Realized Gain (Loss) on Investments | 4,162,466 | (3,314,366 | ) | |||||
| Net Change in Net Unrealized Appreciation on Investments | (18,827,720 | ) | (38,898,756 | ) | ||||
| Net Realized and Unrealized Loss on Investments | (14,662,673 | ) | (42,211,171 | ) | ||||
| Net Decrease in Net Assets from Operations | $ | (14,927,941 | ) | $ | (42,253,685 | ) | ||
| The accompanying notes are an integral part of these financial statements. |
2022 Annual Report 17
| Paradigm Funds | ||||
| Statement of Assets and Liabilities | Micro-Cap | |||
| December 31, 2022 | Fund | |||
| Assets: | ||||
| Investment Securities at Fair Value* | $ | 113,437,808 | ||
| Receivable for Fund Shares Sold | 29,272 | |||
| Dividends Receivable | 29,972 | |||
| Total Assets | 113,497,052 | |||
| Liabilities: | ||||
| Payable for Fund Shares Redeemed | 44,624 | |||
| Payable to Advisor | 122,730 | |||
| Total Liabilities | 167,354 | |||
| Net Assets | $ | 113,329,698 | ||
| Net Assets Consist of: | ||||
| Paid In Capital | $ | 74,572,236 | ||
| Total Distributable Earnings | 38,757,462 | |||
| Net Assets | $ | 113,329,698 | ||
| Net Asset Value, Offering and Redemption Price (Note 2) | $ | 43.32 | ||
| * Investments at Identified Cost | $ | 73,899,908 | ||
| Shares Outstanding (Unlimited number of shares | 2,616,114 | |||
| authorized without par value) | ||||
| Statement of Operations | ||||
| For the fiscal year ended December 31, 2022 | ||||
| Investment Income: | ||||
| Dividends (Net of foreign taxes $6,039) | $ | 388,961 | ||
| Total Investment Income | 388,961 | |||
| Expenses: | ||||
| Investment Advisor Fees | 1,492,744 | |||
| Total Expenses | 1,492,744 | |||
| Net Investment Loss | (1,103,783 | ) | ||
| Realized and Unrealized Gain (Loss) on Investments: | ||||
| Net Realized Loss on Investments | (700,208 | ) | ||
| Net Change in Net Unrealized Appreciation on Investments | (30,629,145 | ) | ||
| Net Realized and Unrealized Loss on Investments | (31,329,353 | ) | ||
| Net Decrease in Net Assets from Operations | $ | (32,433,136 | ) | |
| The accompanying notes are an integral part of these financial statements. |
2022 Annual Report 18
| Paradigm Funds | ||||||||||||||||
| Statements of Changes in Net Assets | Value Fund | Select Fund | ||||||||||||||
| 1/1/2022 | 1/1/2021 | 1/1/2022 | 1/1/2021 | |||||||||||||
| to | to | to | to | |||||||||||||
| 12/31/2022 | 12/31/2021 | 12/31/2022 | 12/31/2021 | |||||||||||||
| From Operations: | ||||||||||||||||
| Net Investment Loss | $ | (265,268 | ) | $ | (549,259 | ) | $ | (42,514 | ) | $ | (297,140 | ) | ||||
| Capital Gain Distributions from Real Estate Investment | ||||||||||||||||
| Trusts | 2,581 | 19,498 | 1,951 | 11,967 | ||||||||||||
| Net Realized Gain (Loss) on Investments | 4,162,466 | 1,951,025 | (3,314,366 | ) | 311,567 | |||||||||||
| Net Change in Unrealized Appreciation on Investments | (18,827,720 | ) | 16,038,986 | (38,898,756 | ) | 26,530,742 | ||||||||||
| Net Increase (Decrease) in Net Assets from Operations | (14,927,941 | ) | 17,460,250 | (42,253,685 | ) | 26,557,136 | ||||||||||
| From Distributions to Shareholders: | (3,896,762 | ) | (1,985,254 | ) | (8,963 | ) | (251,191 | ) | ||||||||
| From Capital Share Transactions: | ||||||||||||||||
| Proceeds From Sale of Shares | 4,062,987 | 8,890,788 | 48,509,238 | 79,522,478 | ||||||||||||
| Proceeds from Redemption Fees (Note 2) | 7,270 | 18,588 | 51,067 | 123,567 | ||||||||||||
| Shares Issued on Reinvestment of Dividends | 3,820,161 | 1,953,933 | 8,741 | 247,665 | ||||||||||||
| Cost of Shares Redeemed | (16,745,478 | ) | (7,831,154 | ) | (61,342,509 | ) | (22,643,318 | ) | ||||||||
| Net Increase (Decrease) from Shareholder Activity | (8,855,060 | ) | 3,032,155 | (12,773,463 | ) | 57,250,392 | ||||||||||
| Net Increase (Decrease) in Net Assets | (27,679,763 | ) | 18,507,151 | (55,036,111 | ) | 83,556,337 | ||||||||||
| Net Assets at Beginning of Year | 76,200,034 | 57,692,883 | 148,526,836 | 64,970,499 | ||||||||||||
| Net Assets at End of Year | $ | 48,520,271 | $ | 76,200,034 | $ | 93,490,725 | $ | 148,526,836 | ||||||||
| Share Transactions: | �� | |||||||||||||||
| Issued | 65,621 | 131,164 | 748,194 | 1,186,647 | ||||||||||||
| Reinvested | 72,599 | 27,420 | 159 | 3,340 | ||||||||||||
| Redeemed | (277,652 | ) | (116,795 | ) | (1,036,528 | ) | (335,343 | ) | ||||||||
| Net Increase (Decrease) in Shares | (139,432 | ) | 41,789 | (288,175 | ) | 854,644 | ||||||||||
| Shares Outstanding Beginning of Year | 1,066,778 | 1,024,989 | 2,000,275 | 1,145,631 | ||||||||||||
| Shares Outstanding End of Year | 927,346 | 1,066,778 | 1,712,100 | 2,000,275 | ||||||||||||
| The accompanying notes are an integral part of these financial statements. |
2022 Annual Report 19
| Paradigm Funds | ||||||||
| Statements of Changes in Net Assets | Micro-Cap Fund | |||||||
| 1/1/2022 | 1/1/2021 | |||||||
| to | to | |||||||
| 12/31/2022 | 12/31/2021 | |||||||
| From Operations: | ||||||||
| Net Investment Loss | $ | (1,103,783 | ) | $ | (1,317,034 | ) | ||
| Net Realized Gain (Loss) on Investments | (700,208 | ) | 1,749,125 | |||||
| Net Change in Unrealized Appreciation on Investments | (30,629,145 | ) | 29,915,883 | |||||
| Net Increase (Decrease) in Net Assets from Operations | (32,433,136 | ) | 30,347,974 | |||||
| From Distributions to Shareholders: | - | (1,767,793 | ) | |||||
| From Capital Share Transactions: | ||||||||
| Proceeds From Sale of Shares | 8,191,171 | 56,094,404 | ||||||
| Proceeds from Redemption Fees (Note 2) | 35,061 | 42,134 | ||||||
| Shares Issued on Reinvestment of Dividends | - | 1,737,987 | ||||||
| Cost of Shares Redeemed | (22,509,702 | ) | (24,813,741 | ) | ||||
| Net Increase (Decrease) from Shareholder Activity | (14,283,470 | ) | 33,060,784 | |||||
| Net Increase (Decrease) in Net Assets | (46,716,606 | ) | 61,640,965 | |||||
| Net Assets at Beginning of Year | 160,046,304 | 98,405,339 | ||||||
| Net Assets at End of Year | $ | 113,329,698 | $ | 160,046,304 | ||||
| Share Transactions: | ||||||||
| Issued | 174,760 | 1,099,311 | ||||||
| Reinvested | - | 31,954 | ||||||
| Redeemed | (491,471 | ) | (480,051 | ) | ||||
| Net Increase (Decrease) in Shares | (316,711 | ) | 651,214 | |||||
| Shares Outstanding Beginning of Year | 2,932,825 | 2,281,611 | ||||||
| Shares Outstanding End of Year | 2,616,114 | 2,932,825 | ||||||
| The accompanying notes are an integral part of these financial statements. |
2022 Annual Report 20
| Paradigm Value Fund | ||||||||||||||||||||
| Financial Highlights | ||||||||||||||||||||
| Selected data for a share outstanding | 1/1/2022 | 1/1/2021 | 1/1/2020 | 1/1/2019 | 1/1/2018 | |||||||||||||||
| throughout the period: | to | to | to | to | to | |||||||||||||||
| 12/31/2022 | 12/31/2021 | 12/31/2020 | 12/31/2019 | 12/31/2018 | ||||||||||||||||
| Net Asset Value - Beginning of Year | $ | 71.43 | $ | 56.29 | $ | 48.83 | $ | 41.94 | $ | 48.96 | ||||||||||
| Net Investment Income (Loss) (a) | (0.29 | ) | (0.53 | ) | (0.14 | ) | 0.05 | (0.10 | ) | |||||||||||
| Net Gain (Loss) on Investments (Realized and Unrealized) | (14.28 | ) | 17.56 | 8.81 | 9.29 | (0.98 | ) | |||||||||||||
| Total from Investment Operations | (14.57 | ) | 17.03 | 8.67 | 9.34 | (1.08 | ) | |||||||||||||
| Distributions (From Net Investment Income) | - | - | (0.04 | ) | (0.02 | ) | - | |||||||||||||
| Distributions (From Capital Gains) | (4.55 | ) | (1.91 | ) | (1.18 | ) | (2.43 | ) | (5.95 | ) | ||||||||||
| Total Distributions | (4.55 | ) | (1.91 | ) | (1.22 | ) | (2.45 | ) | (5.95 | ) | ||||||||||
| Proceeds from Redemption Fees (Note 2) | 0.01 | 0.02 | 0.01 | - | + | 0.01 | ||||||||||||||
| Net Asset Value - End of Year | $ | 52.32 | $ | 71.43 | $ | 56.29 | $ | 48.83 | $ | 41.94 | ||||||||||
| Total Return (b) | (20.42 | )% | 30.30 | % | 17.78 | % | 22.27 | % | (2.07 | )% | ||||||||||
| Ratios/Supplemental Data | ||||||||||||||||||||
| Net Assets - End of Year (Thousands) | $ | 48,520 | $ | 76,200 | $ | 57,693 | $ | 54,889 | $ | 51,431 | ||||||||||
| Before Reimbursement | ||||||||||||||||||||
| Ratio of Expenses to Average Net Assets | 1.50 | % | 1.50 | % | 1.50 | % | 1.50 | % | 1.50 | % | ||||||||||
| After Reimbursement | ||||||||||||||||||||
| Ratio of Expenses to Average Net Assets | 1.50 | % | 1.50 | % | 1.50 | % | 1.50 | % | 1.50 | % | ||||||||||
| Ratio of Net Investment Income (Loss) to Average | ||||||||||||||||||||
| Net Assets | (0.50 | )% | (0.78 | )% | (0.32 | )% | 0.12 | % | (0.18 | )% | ||||||||||
| Portfolio Turnover Rate | 1.87 | % | 10.61 | % | 11.64 | % | 12.31 | % | 20.54 | % | ||||||||||
| Paradigm Select Fund | ||||||||||||||||||||
| Financial Highlights | ||||||||||||||||||||
| Selected data for a share outstanding throughout the period: | 1/1/2022 | 1/1/2021 | 1/1/2020 | 1/1/2019 | 1/1/2018 | |||||||||||||||
| to | to | to | to | to | ||||||||||||||||
| 12/31/2022 | 12/31/2021 | 12/31/2020 | 12/31/2019 | 12/31/2018 | ||||||||||||||||
| Net Asset Value - Beginning of Year | $ | 74.25 | $ | 56.71 | $ | 45.04 | $ | 32.75 | $ | 37.44 | ||||||||||
| Net Investment Income (Loss) (a) | (0.02 | ) | (0.19 | ) | (0.11 | ) | 0.01 | 0.01 | ||||||||||||
| Net Gain (Loss) on Investments (Realized and Unrealized) | (19.64 | ) | 17.78 | 11.83 | 12.54 | (3.74 | ) | |||||||||||||
| Total from Investment Operations | (19.66 | ) | 17.59 | 11.72 | 12.55 | (3.73 | ) | |||||||||||||
| Distributions (From Net Investment Income) | - | - | - | + | (0.01 | ) | - | |||||||||||||
| Distributions (From Capital Gains) | (0.01 | ) | (0.13 | ) | (0.06 | ) | (0.25 | ) | (0.96 | ) | ||||||||||
| Total Distributions | (0.01 | ) | (0.13 | ) | (0.06 | ) | (0.26 | ) | (0.96 | ) | ||||||||||
| Proceeds from Redemption Fees (Note 2) | 0.03 | 0.08 | 0.01 | - | + | - | ||||||||||||||
| Net Asset Value - End of Year | $ | 54.61 | $ | 74.25 | $ | 56.71 | $ | 45.04 | $ | 32.75 | ||||||||||
| Total Return (b) | (26.44 | )% | 31.16 | % | 26.05 | % | 38.32 | % | (9.93 | )% | ||||||||||
| Ratios/Supplemental Data | ||||||||||||||||||||
| Net Assets - End of Year (Thousands) | $ | 93,491 | $ | 148,527 | $ | 64,970 | $ | 36,744 | $ | 23,323 | ||||||||||
| Before Reimbursement | ||||||||||||||||||||
| Ratio of Expenses to Average Net Assets | 1.50 | % | 1.50 | % | 1.50 | % | 1.50 | % | 1.50 | % | ||||||||||
| After Reimbursement | ||||||||||||||||||||
| Ratio of Expenses to Average Net Assets (c) | 1.15 | % | 1.15 | % | 1.15 | % | 1.15 | % | 1.15 | % | ||||||||||
| Ratio of Net Investment Income (Loss) to Average | ||||||||||||||||||||
| Net Assets (c) | (0.04 | )% | (0.28 | )% | (0.26 | )% | 0.03 | % | 0.03 | % | ||||||||||
| Portfolio Turnover Rate | 29.45 | % | 8.64 | % | 11.10 | % | 15.27 | % | 20.28 | % | ||||||||||
| (a) Per share amount calculated using the average shares method. (b) Total return represents the rate that the investor would have earned or lost on an investment in the Fund assuming reinvestment of dividends. Returns do not reflect the deduction of taxes a shareholder would pay on Fund distributions or redemption of Fund shares. (c) Such percentages reflect an expense waiver by the Advisor. See Note 4. + Amount calculated is less than $0.005. |
| The accompanying notes are an integral part of these financial statements. |
2022 Annual Report 21
| Paradigm Micro-Cap Fund | ||||||||||||||||||||
| Financial Highlights | ||||||||||||||||||||
| Selected data for a share outstanding throughout the period: | 1/1/2022 | 1/1/2021 | 1/1/2020 | 1/1/2019 | 1/1/2018 | |||||||||||||||
| to | to | to | to | to | ||||||||||||||||
| 12/31/2022 | 12/31/2021 | 12/31/2020 | 12/31/2019 | 12/31/2018 | ||||||||||||||||
| Net Asset Value - Beginning of Year | $ | 54.57 | 43.13 | $ | 30.91 | $ | 25.26 | $ | 32.40 | |||||||||||
| Net Investment Loss (a) | (0.41 | ) | (0.47 | ) | (0.15 | ) | (0.02 | ) | (0.23 | ) | ||||||||||
| Net Gain (Loss) on Investments (Realized and Unrealized) | (10.85 | ) | 12.51 | 14.63 | 5.67 | (3.35 | ) | |||||||||||||
| Total from Investment Operations | (11.26 | ) | 12.04 | 14.48 | 5.65 | (3.58 | ) | |||||||||||||
| Distributions (From Net Investment Income) | - | - | - | - | - | |||||||||||||||
| Distributions (From Capital Gains) | - | (0.61 | ) | (2.26 | ) | - | + | (3.56 | ) | |||||||||||
| Total Distributions | - | (0.61 | ) | (2.26 | ) | - | (3.56 | ) | ||||||||||||
| Proceeds from Redemption Fees (Note 2) | 0.01 | 0.01 | - | + | - | - | + | |||||||||||||
| Net Asset Value - End of Year | $ | 43.32 | $ | 54.57 | $ | 43.13 | $ | 30.91 | $ | 25.26 | ||||||||||
| Total Return (b) | (20.62 | )% | 27.94 | % | 46.85 | % | 22.38 | % | (10.96 | )% | ||||||||||
| Ratios/Supplemental Data | ||||||||||||||||||||
| Net Assets - End of Year (Thousands) | $ | 113,330 | $ | 160,046 | $ | 98,405 | $ | 63,506 | $ | 44,346 | ||||||||||
| Ratio of Expenses to Average Net Assets | 1.25 | % | 1.25 | % | 1.25 | % | 1.25 | % | 1.25 | % | ||||||||||
| Ratio of Net Investment Loss to Average | ||||||||||||||||||||
| Net Assets | (0.92 | )% | (0.91 | )% | (0.48 | )% | (0.06 | )% | (0.67 | )% | ||||||||||
| Portfolio Turnover Rate | 34.91 | % | 46.02 | % | 81.04 | % | 86.09 | % | 111.47 | % | ||||||||||
| (a) Per share amount calculated using the average shares method. (b) Total return represents the rate that the investor would have earned or lost on an investment in the Fund assuming reinvestment of dividends. Returns do not reflect the deduction of taxes a shareholder would pay on Fund distributions or redemption of Fund shares. + Amount calculated is less than $0.005. |
| The accompanying notes are an integral part of these financial statements. |
2022 Annual Report 22
| NOTES TO FINANCIAL STATEMENTS PARADIGM FUNDS December 31, 2022 |
1.) ORGANIZATION
Paradigm Funds (the “Trust”) is an open-end management investment company that was organized in Ohio as a business trust on September 13, 2002, that offers shares of beneficial interest in a number of separate series, each series representing a distinct fund with its own investment objectives and policies. The Paradigm Value Fund (“Value”) commenced operations on January 1, 2003. Value’s investment objective is long-term capital appreciation. The Paradigm Select Fund (“Select”) commenced operations on January 1, 2005. Select’s investment objective is long-term capital appreciation. The Paradigm Micro-Cap Fund (“Micro-Cap”) commenced operations on January 1, 2008. Micro-Cap’s investment objective is long-term capital appreciation. Under normal circumstances, Micro-Cap invests at least 80% of its net assets in the common stocks of U.S. micro-cap companies. Value, Select and Micro-Cap are all diversified funds. The advisor to Value, Select and Micro-Cap (each a “Fund” and collectively the “Funds”) is Paradigm Funds Advisor LLC (the “Advisor”).
2.) SIGNIFICANT ACCOUNTING POLICIES
The Funds are investment companies and accordingly follow the investment company accounting and reporting guidance of the Financial Accounting Standards Board (“FASB”) Accounting Standards Codification Topic 946 Financial Services - Investment Companies. The financial statements are prepared in conformity with accounting principles generally accepted in the United States of America (“GAAP”). The Funds follow the significant accounting policies described in this section.
SECURITY VALUATION: All investments in securities are recorded at their estimated fair value, as described in Note 3.
SECURITY TRANSACTIONS AND OTHER: Security transactions are recorded based on the trade date for financial statement reporting purposes. Dividend income is recognized on the ex-dividend date. Interest income, if any, is recognized on an accrual basis. The Funds use the highest cost basis which is a form of specific identification in computing gain or loss on sale of investment securities. Withholding taxes on foreign dividends have been provided for in accordance with the Funds’ understanding of the applicable country’s tax rules and rates. The Funds may invest in real estate investment trusts (“REITs”) that pay distributions to their shareholders based on available funds from operations. It is common for these distributions to exceed the REITs’ taxable earnings and profits resulting in the excess portion of such distribution to be designated as return of capital. Distributions received from REITs are generally recorded as dividend income and, if necessary, are reclassified annually in accordance with tax information provided by the underlying REITs.
SHARE VALUATION: Each Fund’s net asset value (the “NAV”) is calculated as of the close of trading on the New York Stock Exchange (the “Exchange”) (normally 4:00 p.m. Eastern time) every day the Exchange is open. The NAV for each Fund is calculated by taking the total value of the Fund’s assets, subtracting its liabilities, and then dividing by the total number of shares outstanding, rounded to the nearest cent. The offering price and redemption price per share is equal to the net asset value per share, except that shares of each Fund are subject to a redemption fee of 2% if redeemed within 90 days or less of purchase. During the fiscal year ended December 31, 2022, proceeds from redemption fees were $7,270, $51,067 and $35,061 for Value, Select and Micro-Cap, respectively.
INCOME TAXES: The Funds’ policy is to comply with the requirements of the Internal Revenue Code that are applicable to regulated investment companies and to distribute all of their taxable income to shareholders. Therefore, no federal income tax provision is required. It is the Funds’ policy to distribute annually, prior to the end of the calendar year, dividends sufficient to satisfy excise tax requirements of the Internal Revenue Code. This Internal Revenue Code requirement may cause an excess of distributions over the book year-end accumulated income. In addition, it is the Funds’ policy to distribute annually, after the end of the fiscal year, any remaining net investment income and net realized capital gains.
The Funds recognize the tax benefits of certain tax positions only where the position is “more likely than not” to be sustained assuming examination by tax authorities. Management has analyzed the Funds’ tax positions, and has concluded that no liability for unrecognized tax benefits should be recorded related to uncertain tax positions taken on returns filed for open tax years. The Funds identify their major tax jurisdictions as U.S. federal and New York State tax authorities; the Funds are not aware of any tax positions for which it is
2022 Annual Report 23
Notes to Financial Statements - continued
reasonably possible that the total amounts of unrecognized tax benefits will change materially in the next twelve months. The Funds recognize interest and penalties, if any, related to unrecognized tax benefits as income tax expense in the Statements of Operations. During the fiscal year ended December 31, 2022, the Funds did not incur any interest or penalties.
ESTIMATES: The financial statements are prepared in accordance with GAAP, which requires management to make estimates and assumptions that affect the reported amounts of assets and liabilities and disclosure of contingent assets and liabilities at the date of the financial statements and the reported amounts of increases and decreases in net assets from operations during the reporting period. Actual results could differ from those estimates.
DISTRIBUTIONS TO SHAREHOLDERS: Distributions to shareholders, which are determined in accordance with income tax regulations, are recorded on the ex-dividend date. The Funds may utilize earnings and profits distributed to shareholders on redemptions of shares as part of the dividends paid deduction. The treatment for financial reporting purposes of distributions made to shareholders during the year from net investment income or net realized capital gains may differ from their ultimate treatment for federal income tax purposes. These differences are caused primarily by differences in the timing of recognition of certain components of income, expense or realized capital gain for federal income tax purposes. Where such differences are permanent in nature, they are reclassified in the components of the net assets based on their ultimate characterization for federal income tax purposes. Any such reclassification will have no effect on net assets, results of operations or net asset values per share of any Fund. These adjustments were primarily attributed to the reclassification of net operating loss and the use of equalization for tax purposes.
| Value | |||
| Paid In Capital | ($17,907 | ) | |
| Total Distributable Earnings | $17,907 | ||
| Select | |||
| Paid In Capital | ($42,514 | ) | |
| Total Distributable Earnings | $42,514 | ||
| Micro-Cap | |||
| Paid In Capital | ($1,103,783 | ) | |
| Total Distributable Earnings | $1,103,783 | ||
3.) SECURITIES VALUATIONS
The Funds utilize various methods to measure the fair value of their investments on a recurring basis. GAAP establishes a hierarchy that prioritizes inputs to valuation methods. The three levels of inputs are:
Level 1 - Unadjusted quoted prices in active markets for identical assets or liabilities that the Funds have the ability to access.
Level 2 - Observable inputs other than quoted prices included in level 1 that are observable for the asset or liability, either directly or indirectly. These inputs may include quoted prices for the identical instrument on an inactive market, prices for similar instruments, interest rates, prepayment speeds, credit risk, yield curves, default rates and similar data.
Level 3 - Unobservable inputs for the asset or liability, to the extent relevant observable inputs are not available, representing the Funds’ own assumptions about the assumptions a market participant would use in valuing the assets or liabilities, and would be based on the best information available.
The availability of inputs can vary from security to security and is affected by a wide variety of factors, including, for example, the type of security, whether the security is new and not yet established in the marketplace, the liquidity of markets, and other characteristics particular to the security. To the extent that valuation is based on models or inputs that are less observable or unobservable in the market, the determination of fair value requires more judgment. Accordingly, the degree of judgment exercised in determining fair value is greatest for instruments categorized in level 3.
The inputs used to measure fair value may fall into different levels of the fair value hierarchy. In such cases, for disclosure purposes, the level in the fair value hierarchy within which the fair value measurement falls in
2022 Annual Report 24
Notes to Financial Statements - continued
its entirety, is determined based on the lowest level input that is significant to the fair value measurement in its entirety.
FAIR VALUE MEASUREMENTS
A description of the valuation techniques applied to the Funds’ major categories of assets measured at fair value on a recurring basis follows.
Equity securities (common stocks and real estate investment trusts). Equity securities generally are valued by using market quotations, but may be valued on the basis of prices furnished by a pricing service when the Valuation Committee believes such prices accurately reflect the fair value of such securities. Securities that are traded on any stock exchange or on the NASDAQ over-the-counter market are generally valued by the pricing service at the last quoted sale price. Lacking a last sale price, an equity security is generally valued by the pricing service at its last bid price. Generally, if the security is traded in an active market and is valued at the last sale price, the security is categorized as a level 1 security, and if an equity security is valued by the pricing service at its last bid, it is generally categorized as a level 2 security. When market quotations are not readily available, when the Valuation Committee determines that the market quotation or the price provided by the pricing service does not accurately reflect the current fair value, or when restricted securities are being valued, such securities are valued as determined in good faith by the Valuation Committee, subject to review of the Board of Trustees (the “Trustees” or the “Board”) and are categorized in level 2 or level 3, when appropriate.
Money market funds. Money market funds are valued at net asset value provided by the underlying funds and are classified in level 1 of the fair value hierarchy.
In accordance with the Trust’s good faith pricing guidelines, the Valuation Committee is required to consider all appropriate factors relevant to the value of securities for which it has determined other pricing sources are not available or reliable as described above. There is no single standard for determining fair value, since fair value depends upon the circumstances of each individual case. As a general principle, the current fair value of an issue of securities being valued by the Valuation Committee would appear to be the amount which the owner might reasonably expect to receive for them upon their current sale. Methods which are in accordance with this principle may, for example, be based on (i) a multiple of earnings; (ii) a discount from market of a similar freely traded security (including a derivative security or a basket of securities traded on other markets, exchanges or among dealers); or (iii) yield to maturity with respect to debt issues, or a combination of these and other methods. The Board maintains responsibilities for the fair value determinations under Rule 2a-5 under the Investment Company Act of 1940 and oversees the Valuation Committee.
The following tables summarize the inputs used to value each Fund’s assets measured at fair value as of December 31, 2022:
| Value: | ||||||||
| Valuation Inputs of Assets | Level 1 | Level 2 | Level 3 | Total | ||||
| Common Stocks | $46,131,216 | $- | $- | $46,131,216 | ||||
| Real Estate Investment Trusts | 1,719,040 | - | - | 1,719,040 | ||||
| Money Market Funds | 650,797 | - | - | 650,797 | ||||
| Total | $48,501,053 | $- | $- | $48,501,053 | ||||
| Select: | ||||||||
| Valuation Inputs of Assets | Level 1 | Level 2 | Level 3 | Total | ||||
| Common Stocks | $89,429,951 | $- | $- | $89,429,951 | ||||
| Real Estate Investment Trusts | 1,318,716 | - | - | 1,318,716 | ||||
| Money Market Funds | 2,897,055 | - | - | 2,897,055 | ||||
| Total | $93,645,722 | $- | $- | $93,645,722 | ||||
| Micro-Cap: | ||||||||
| Valuation Inputs of Assets | Level 1 | Level 2 | Level 3 | Total | ||||
| Common Stocks | $109,967,276 | $ – | $ – | $109,967,276 | ||||
| Contingent Value Rights | – | – | 186,000 | 186,000 | ||||
| Money Market Funds | 3,284,532 | – | – | 3,284,532 | ||||
| Total | $113,251,808 | $ – | $186,000 | $113,437,808 | ||||
2022 Annual Report 25
Notes to Financial Statements - continued
The Funds did not hold any material level 3 assets during the fiscal year ended December 31, 2022. As of December 31, 2022, level 3 contingent value rights held in Micro-Cap represented 0.16% of the Fund's net assets. A reconciliation of level 3 investments, including certain disclosures related to significant inputs used in valuing level 3 investments, is therefore excluded.
The Funds did not invest in derivative instruments during the fiscal year ended December 31, 2022.
4.) INVESTMENT ADVISORY AGREEMENTS
The Trust, with respect to each of the Funds, has an investment advisory agreement (collectively the “Management Agreements”) with the Advisor. Under the terms of the Management Agreements, the Advisor manages the investment portfolios of the Funds, subject to policies adopted by the Trustees. Under the Management Agreements, the Advisor, at its own expense and without reimbursement from the Trust, furnishes office space and all necessary office facilities, equipment and executive personnel necessary for managing the assets of the Funds. The Advisor pays all operating expenses of the Funds with the exception of taxes, brokerage fees and commissions, borrowing costs (such as interest and dividend expenses on securities sold short) and such extraordinary or non-recurring expenses as may arise, including litigation to which the Funds may be a party and indemnification of the Trustees and Trust officers with respect thereto. The Funds will also pay expenses that they are authorized to pay pursuant to Rule 12b-1 under the Investment Company Act of 1940, as amended (none are currently authorized). The Advisor also pays the salaries and fees of all of its officers and employees that serve as Trustees and Trust Officers. For its services and payment of certain Fund expenses as described above, the Advisor receives an annual investment management fee of 1.50%, 1.50% and 1.25% of the average daily net assets from Value, Select and Micro-Cap, respectively. The Advisor’s investment management fee is accrued daily and is typically paid monthly. As a result of the above calculations, for the fiscal year ended December 31, 2022, the Advisor earned management fees (before the waivers described below) totaling $801,755, $1,746,908 and $1,492,744 for Value, Select and Micro-Cap, respectively. At December 31, 2022, $63,361, $93,405 and $122,730 was due to the Advisor from Value, Select and Micro-Cap, respectively. The Advisor has contractually agreed to waive management fees and/or reimburse Select to the extent necessary to maintain total annual operating expenses of the Fund (excluding brokerage fees and commissions, interest and other borrowing expenses, taxes, extraordinary expenses and indirect costs of investing in acquired funds) at 1.15% of daily net assets through April 30, 2023. The Advisor waived $407,612 for the fiscal year ended December 31, 2022, for Select, pursuant to its contractual agreement. There is no recapture provision to this waiver.
5.) RELATED PARTY TRANSACTIONS
Certain officers and shareholders of the Advisor are also officers and/or a Trustee of the Trust. These individuals may receive benefits from the Advisor resulting from management fees paid to the Advisor from the Funds.
The Trustees who are not interested persons of the Funds were each paid $8,000, for a total of $32,000, in Trustees fees for the fiscal year ended December 31, 2022, for the Trust. Under the Management Agreements, the Advisor pays these fees.
6.) INVESTMENTS
For the fiscal year ended December 31, 2022, purchases and sales of investment securities other than U.S. government obligations and short-term investments were as follows:
| Value | Select | Micro-Cap | ||||
| Purchases | $995,606 | $33,112,024 | $40,541,084 | |||
| Sales | $11,810,744 | $34,461,271 | $52,677,884 |
There were no purchases or sales of U.S. government obligations.
7.) CONTROL OWNERSHIP
The beneficial ownership, either directly or indirectly, of more than 25% of the voting shares of a fund creates a presumption of control of the fund, under section 2(a)(9) of the Investment Company Act of 1940, as amended. At December 31, 2022, National Financial Services, LLC, located at 200 Liberty Street, New York, New York, for the benefit of its customers, held, in aggregate, 28.71% of Value, and therefore also may be deemed to control Value. Candace King Weir, beneficial owner located at 9 Elk Street, Albany, New York 12207, held, in aggregate, 34.37%, of Select, and therefore may be deemed to control Select. Candace King Weir, beneficial owner located at 9 Elk Street, Albany, New York 12207, held, in aggregate, 73.91% of Micro-Cap, and therefore may be deemed to control Micro-Cap.
2022 Annual Report 26
Notes to Financial Statements - continued
8.) TAX MATTERS
For federal income tax purposes, at December 31, 2022, the cost of securities on a tax basis and the composition of gross unrealized appreciation (the excess of value over tax cost) and depreciation (the excess of tax cost over value) were as follows:
| Value | Select | Micro-Cap | |||||||
| Cost of Investments | $19,528,485 | $82,522,826 | $74,041,970 | ||||||
| Gross Unrealized Appreciation | $29,659,492 | $21,676,760 | $42,345,392 | ||||||
| Gross Unrealized Depreciation | (686,924 | ) | (10,553,864 | ) | (2,949,554 | ) | |||
| Net Unrealized Appreciation | |||||||||
| (Depreciation) on Investments | $28,972,568 | $11,122,896 | $39,395,838 | ||||||
The tax character of distributions paid during the fiscal years ended December 31, 2022 and 2021 were as follows:
| Fiscal Year Ended | Fiscal Year Ended | |||
| December 31, 2022 | December 31, 2021 | |||
| Value | ||||
| Ordinary Income | $ – | $ 50,868 | ||
| Long-term Capital Gain | 3,896,762 | 1,934,386 | ||
| $ 3,896,762 | $ 1,985,254 | |||
| Select | ||||
| Ordinary Income | $ – | $ – | ||
| Long-term Capital Gain | 8,963 | 251,191 | ||
| $ 8,963 | $ 251,191 | |||
| Micro-Cap | ||||
| Ordinary Income | $ – | $ 37,607 | ||
| Long-term Capital Gain | – | 1,730,186 | ||
| $ – | $ 1,767,793 | |||
As of December 31, 2022, the components of distributable earnings on a tax basis were as follows:
| Value | Select | |||||
| Short-Term Capital Loss Carryforward | $ – | $ (3,199,896 | ) | |||
| Net Unrealized Appreciation | 28,972,568 | 11,122,896 | ||||
| $ 28,972,568 | $ 7,923,000 | |||||
| Micro-Cap | ||||||
| Short-Term Capital Loss Carryforward | $ (638,376 | ) | ||||
| Net Unrealized Appreciation | 39,395,838 | |||||
| $ 38,757,462 | ||||||
The difference between book basis and tax basis unrealized appreciation (depreciation) is attributable to the tax deferral of losses on wash sales and temporary tax basis adjustments resulting from underlying investment mergers. All capital loss carryforwards are characterized as short-term and have no expiration.
9.) CONCENTRATION OF SECTOR RISK
If a Fund has significant investments in the securities of issuers in industries within a particular sector, any development affecting that sector will have a greater impact on the value of the net assets of the Fund than would be the case if the Fund did not have significant investments in that sector. In addition, this may increase the risk of loss of an investment in the Fund and increase the volatility of the Fund’s NAV per share. From time to time, circumstances may affect a particular sector and the companies within such sector. For instance, economic or market factors, regulation or deregulation, and technological or other developments may negatively impact all companies in a particular sector and therefore the value of a Fund’s portfolio will be adversely affected. As of December 31, 2022, Value had 37% of its equity securities held invested in stocks within the Information Technology sector; Select had 35% and 29% of its equity securities held invested in stocks within the Information Technology sector and the Industrials sector, respectively; and Micro-Cap
2022 Annual Report 27
Notes to Financial Statements - continued had 48% and 29% of its equity securities held invested in stocks within the Information Technology sector and the Health Care sector, respectively.
10.) COVID-19 RISK
Unexpected local, regional or global events, such as war; acts of terrorism; financial, political or social disruptions; natural, environmental or man-made disasters; climate-change and climate-related events; the spread of infectious illnesses or other public health issues; and recessions and depressions could have a significant impact on the Funds and their investments and may impair market liquidity. Such events can cause investor fear, which can adversely affect the economies of nations, regions and the market in general, in ways that cannot necessarily be foreseen. The impact of COVID-19 has adversely affected, and other infectious illness outbreaks that may arise in the future could adversely affect, the economies of many nations and the entire global economy, individual issuers and capital markets in ways that cannot necessarily be foreseen. Public health crises caused by the COVID-19 outbreak may exacerbate other pre-existing political, social and economic risks in certain countries or globally. The duration of the COVID-19 outbreak and its effects cannot be determined with certainty.
11.) SUBSEQUENT EVENTS
Subsequent events after the date of the Statements of Assets and Liabilities have been evaluated through the date the financial statements were issued. Management has concluded that there is no impact requiring adjustment to or disclosure in the financial statements.
2022 Annual Report 28
REPORT OF INDEPENDENT REGISTERED PUBLIC ACCOUNTING FIRM
To the Shareholders and Board of Trustees of
Paradigm Funds
Opinion on the Financial Statements
We have audited the accompanying statements of assets and liabilities, including the schedules of investments, of Paradigm Funds comprising Paradigm Value Fund, Paradigm Select Fund, and Paradigm Micro-Cap Fund (the “Funds”) as of December 31, 2022, the related statements of operations for the year then ended, the statements of changes in net assets for each of the two years in the period then ended, the related notes, and the financial highlights for each of the five years in the period then ended (collectively referred to as the “financial statements”). In our opinion, the financial statements present fairly, in all material respects, the financial position of each of the Funds as of December 31, 2022, the results of their operations for the year then ended, the changes in net assets for each of the two years in the period then ended, and the financial highlights for each of the five years in the period then ended, in conformity with accounting principles generally accepted in the United States of America.
Basis for Opinion
These financial statements are the responsibility of the Funds’ management. Our responsibility is to express an opinion on the Funds’ financial statements based on our audits. We are a public accounting firm registered with the Public Company Accounting Oversight Board (United States) (“PCAOB”) and are required to be independent with respect to the Funds in accordance with the U.S. federal securities laws and the applicable rules and regulations of the Securities and Exchange Commission and the PCAOB.
We conducted our audits in accordance with the standards of the PCAOB. Those standards require that we plan and perform the audit to obtain reasonable assurance about whether the financial statements are free of material misstatement whether due to error or fraud.
Our audits included performing procedures to assess the risks of material misstatement of the financial statements, whether due to error or fraud, and performing procedures that respond to those risks. Such procedures included examining, on a test basis, evidence regarding the amounts and disclosures in the financial statements. Our procedures included confirmation of securities owned as of December 31, 2022, by correspondence with the custodian. Our audits also included evaluating the accounting principles used and significant estimates made by management, as well as evaluating the overall presentation of the financial statements. We believe that our audits provide a reasonable basis for our opinion.
We have served as the Funds’ auditor since 2004.
COHEN & COMPANY, LTD.
Milwaukee, Wisconsin
February 23, 2023
2022 Annual Report 29
| DISCLOSURE OF EXPENSES (Unaudited) |
The ongoing costs to shareholders associated with the Paradigm Value Fund, Paradigm Select Fund and Paradigm Micro-Cap Fund consist solely of management fees. Although the Funds charge no sales loads or transaction fees, you will be assessed fees for outgoing wire transfers, returned checks and stop payment orders at prevailing rates charged by Mutual Shareholder Services, LLC, the Funds’ transfer agent. IRA accounts will be charged an $8.00 annual maintenance fee. If shares are redeemed within 90 days of purchase from the Funds, the shares are subject to a 2% redemption fee. The following example is intended to help you understand your ongoing costs of investing in the Funds and to compare these costs with similar costs of investing in other mutual funds. The example is based on an investment of $1,000 invested in the Funds on July 1, 2022, and held through December 31, 2022.
The first line of each table below provides information about actual account values and actual expenses. In order to estimate the expenses a shareholder paid during the period covered by this report, shareholders can divide their account value by $1,000 (for example, an $8,600 account value divided by $1,000 = 8.6) and then multiply the result by the number in the first line under the heading entitled “Expenses Paid During the Period.”
The second line of each table below provides information about hypothetical account values and hypothetical expenses based on the Funds’ actual expense ratios and an assumed rate of return of 5% per year before expenses, which is not the Funds’ actual return. The hypothetical account values and expenses may not be used to estimate the actual ending account balance or expenses paid by a shareholder for the period. Shareholders may use this information to compare the ongoing costs of investing in the Funds and other funds. In order to do so, compare these 5% hypothetical examples with the 5% hypothetical examples that appear in other funds’ shareholder reports.
Please note that the expenses shown in the table are meant to highlight your ongoing costs only and do not reflect any transactional costs, such as the annual maintenance fee charged to IRA accounts, redemption fees, or exchange fees, or the expenses of any underlying funds. Therefore, the second line of the table is useful in comparing ongoing costs only, and will not help you determine the relative total costs of owning different funds. In addition, if these transactional costs were included, your costs would have been higher.
| PARADIGM VALUE FUND | ||||||
| Expenses Paid | ||||||
| Beginning | Ending | During the Period* | ||||
| Account Value | Account Value | July 1, 2022 to | ||||
| July 1, 2022 | December 31, 2022 | December 31, 2022 | ||||
| Actual | $1,000.00 | $1,089.17 | $7.90 | |||
| Hypothetical | $1,000.00 | $1,017.64 | $7.63 | |||
| (5% annual return | ||||||
| before expenses) | ||||||
* Expenses are equal to the Fund’s annualized expense ratio of 1.50%, multiplied by the average
account value over the period, multiplied by 184/365 (to reflect the one-half year period).
| PARADIGM SELECT FUND | ||||||
| Expenses Paid | ||||||
| Beginning | Ending | During the Period* | ||||
| Account Value | Account Value | July 1, 2022 to | ||||
| July 1, 2022 | December 31, 2022 | December 31, 2022 | ||||
| Actual | $1,000.00 | $1,052.11 | $5.95 | |||
| Hypothetical | $1,000.00 | $1,019.41 | $5.85 | |||
| (5% annual return | ||||||
| before expenses) | ||||||
* Expenses are equal to the Fund’s annualized expense ratio of 1.15%, multiplied by the average
account value over the period, multiplied by 184/365 (to reflect the one-half year period).
2022 Annual Report 30
| Disclosure of Expenses (Unaudited) - continued | ||||||
| PARADIGM MICRO-CAP FUND | ||||||
| Expenses Paid | ||||||
| Beginning | Ending | During the Period* | ||||
| Account Value | Account Value | July 1, 2022 to | ||||
| July 1, 2022 | December 31, 2022 | December 31, 2022 | ||||
| Actual | $1,000.00 | $1,121.41 | $6.68 | |||
| Hypothetical | $1,000.00 | $1,018.90 | $6.36 | |||
| (5% annual return | ||||||
| before expenses) | ||||||
* Expenses are equal to the Fund’s annualized expense ratio of 1.25%, multiplied by the average
account value over the period, multiplied by 184/365 (to reflect the one-half year period).
2022 Annual Report 31
ADDITIONAL INFORMATION
December 31, 2022
(Unaudited)
AVAILABILITY OF QUARTERLY SCHEDULE OF INVESTMENTS
The Funds publicly file their complete schedules of portfolio holdings with the Securities and Exchange Commission (“SEC”) for the first and third quarters of each fiscal year on Form N-PORT. The Funds’ Forms N-PORT are available on the SEC’s website at http://www.sec.gov.
| PROXY VOTING GUIDELINES |
Paradigm Funds Advisor LLC, is responsible for exercising the voting rights associated with the securities held by the Funds. A description of the policies and procedures used by the Advisor in fulfilling this responsibility is available without charge on the Funds’ website at www.paradigm-funds.com. It is also included in the Funds’ Statement of Additional Information, which is available on the SEC’s website at http://www.sec.gov.
Form N-PX provides information regarding how the Funds voted proxies with regards to portfolio securities held during the most recent 12-month period ended June 30 and is available without charge, upon request, by calling our toll free number(1-800-239-0732). This information is also available on the SEC’s website at http://www.sec.gov.
| ADDITIONAL INFORMATION |
You will find more information about the Funds at www.paradigm-funds.com. For shareholder inquiries, please call toll-free in the U.S. at 1-800-239-0732.
.
2022 Annual Report 32
| TRUSTEES AND OFFICERS (Unaudited) |
The Board of Trustees supervises the business activities of the Trust. Each Trustee serves as a trustee until the termination of the Trust unless the Trustee dies, resigns, retires or is removed.
The following table provides information regarding each Trustee who is an “interested person” of the Trust, as defined in the Investment Company Act of 1940, and each officer of the Trust as of December 31, 2022.
Interested Trustees and Officers
| Number of | Other | ||||
| Name, | Position(s) | Term of | Principal | Portfolios | Directorships |
| Address1, | Held with | Office and | Occupation(s) | Overseen | Held by Trustee |
| and Year of Birth | the Trust | Length of | During the | By | During the |
| Time Served | Past 5 Years | Trustee | Past 5 Years | ||
| Candace King | President | Indefinite Term, | Co-Portfolio Manager of Paradigm Micro-Cap Fund since | 3 | None |
| Weir2 | and Trustee | Since 2002 | 2011, Paradigm Value Fund and Paradigm Select Fund | ||
| (1944) | since Feb. 2013; Co-Portfolio Manager of Paradigm | ||||
| Opportunity Fund from Feb. 2013 to Dec. 2019. Director, | |||||
| President, Chief Investment Officer, and Portfolio Manager | |||||
| of Paradigm Capital Management, Inc. since 1994; | |||||
| Director and President of C.L. King & Associates, Inc. | |||||
| since 1972; Managing Member of PCM Ventures, LLC | |||||
| since 1996, PCM Ventures International LLC since 2001, | |||||
| PCM Ventures II, LLC since 2003, and PCM Ventures III, | |||||
| LLC since 2010; Paradigm Funds Advisors LLC since | |||||
| 2005. | |||||
| Amelia F. Weir | Secretary | Indefinite Term, | Co-Portfolio Manager of Paradigm Micro-Cap Fund since | N/A | N/A |
| (1975) | Since 2009 | 2011, Paradigm Value Fund and Paradigm Select Fund | |||
| since Feb. 2013; Co-Portfolio Manager of Paradigm | |||||
| Opportunity Fund from Feb. 2013 to Dec. 2019. Portfolio | |||||
| Manager and Director of Research Paradigm Capital | |||||
| Management (2008 - current). | |||||
| Carl A. Florio, | Trustee | Indefinite Term, | Director and Vice Chairman of Paradigm Funds Advisor | 3 | N/A |
| CPA3 | Since 2005 | LLC and affiliated entities (2008 - current). | |||
| (1948) | |||||
| Robert A. Benton | Treasurer and | Indefinite Term, | SVP and CFO of Paradigm Funds Advisor LLC and affiliat- | N/A | N/A |
| (1954) | Chief | Treasurer and | ed advisors (May 2006 - current), SVP and CFO of C.L. | ||
| Financial | Chief Financial | King & Associates, a registered broker dealer (February | |||
| Officer | Officer Since | 2001 - current); CCO of Paradigm Funds Advisor LLC an | |||
| 2002, Chief | affiliated advisor (June 2016 - Oct. 2019). | ||||
| Compliance | |||||
| Officer (June | |||||
| 2016 - Oct. | |||||
| 2019) | |||||
| Gregg A. Miller | Chief | Indefinite Term, | CCO of Paradigm Funds Advisor LLC and affiliated advi- | N/A | N/A |
| (1975 | Compliance | Since Dec. | sors (Dec. 2022 - current); SVP, Compliance of C.L. King & | ||
| Officer | 2022 | Associates, Inc. (Mar. 2000 - Dec. 2022). | |||
Independent Trustees
| Term of | Principal | Number of | Other | ||
| Name, | Position(s) | Office and | Occupation(s) | Portfolios | Directorships |
| Address1, | Held with | Length of | During | Overseen | During the |
| and Year of Birth | the Trust | Time Served | Past 5 Years | By Trustee | Past 5 Years |
| Gary | Trustee | Indefinite Term, | Founder and President, Dr. Woods Products (a con- | 3 | None |
| Greenhouse4 | Since 2016 | sumer products company) (2006 - current); Founder and | |||
| (1943) | Managing Partner, Sylvia Woods Food Company (2000 - | ||||
| current). | |||||
| Peter H. | Trustee | Indefinite Term, | Peter H. Heerwagen, Attorney at Law (2009 - current). | 3 | None |
| Heerwagen | Since 2009 | ||||
| (1945) | |||||
| William P. | Trustee | Indefinite Term, | Chief Executive Officer of Bright Hub, Inc. (2006 - cur- | 3 | Director, MTI |
| Phelan5, CPA | Since 2007 | rent). | Micro | ||
| (1956) | |||||
| George M. Philip | Trustee | Indefinite Term, | Retired (2013 - current); President, University of Albany, | 3 | Director, First |
| (1947) | Since 2016 | State University of New York (2007 - 2013). | Niagara | ||
| Financial | |||||
| Group, iPic | |||||
| Entertainment | |||||
| Inc., US Airways | |||||
| 1 The address of each trustee and officer is c/o Paradigm Funds, Nine Elk Street, Albany, NY 12207. 2 Candace King Weir is considered an “interested person” as defined in Section 2(a)(19) of the Investment Company Act of 1940, as amended, by virtue of her affiliation with the Trust’s investment advisor, Paradigm Funds Advisor LLC. Candace King Weir is a Director and the President of Paradigm Capital Management, Inc.; and an interested Trustee of the Trust; and CEO of the Trust’s investment advisor, Paradigm Funds Advisor LLC. 3 Carl A. Florio is considered an “interested person” as defined in Section 2(a)(19) of the Investment Company Act of 1940, as amended, because he is an officer of the Trust’s investment advisor, Paradigm Funds Advisor LLC. Carl A. Florio is a member of the Board of Directors of a non-profit foun- dation that retains Paradigm Capital Management, Inc. to manage a portion of the foundation’s assets. 4 Gary Greenhouse is a limited partner in PCM Partners, LP II. As of December 31, 2022 he owned 0.27% of the PCM Partners, LP II partnership, the value of which was approximately $0.98 million. Candace King Weir is the general partner of PCM Partners, LP II an interested Trustee of the Trust and CEO of the Trust's investment advisor, Paradigm Funds Advisor LLC. 5 William P. Phelan is a limited partner in PCM Partners, LP II. As of December 31, 2022 he owned 0.92% of the PCM Partners, LP II partnership, the value of which was $3.37 million. Candace King Weir is the general partner of PCM Partners, LP II; an interested Trustee of the Trust; and CEO of the Trust’s investment advisor, Paradigm Funds Advisor LLC. The Statement of Additional Information includes additional information about the Funds’ Trustees and may be obtained without charge by calling 1-800-239-0732. |
2022 Annual Report 33
This page intentionally left blank.
2022 Annual Report 34
Board of Trustees
|
| This report is provided for the general information of the shareholders of the Paradigm Funds. This report is not intended for distribution to prospective investors in the Funds, unless preceded or accompanied by an effective prospectus. |
Item 2. Code of Ethics.
The registrant has adopted a code of ethics that applies to the registrant’s principal executive officer and the principal financial officer. The registrant has not made any amendments to its code of ethics during the covered period. The registrant has not granted any waivers from any provisions of the code of ethics during the covered period. A copy of the registrant’s Code of Ethics is filed herewith.
Item 3. Audit Committee Financial Expert.
The registrant’s Board of Trustees has determined that William P. Phalen is an audit committee financial expert. Mr. Phalen is independent for purposes of this Item 3.
Item 4. Principal Accountant Fees and Services.
(a-d) The following table details the aggregate fees billed for each of the last two fiscal years for audit fees, audit-related fees, tax fees and other fees by the principal accountant to the registrant. The principal accountant has provided no services to the adviser or any entity controlled by, or under common control with the adviser that provides ongoing services to the registrant.
| FYE 12/31/2022 | FYE 12/31/2021 | |||
| Audit Fees | $33,000 | $30,400 | ||
| Audit-Related Fees | $0 | $0 | ||
| Tax Fees | $9,000 | $9,000 | ||
| All Other Fees | $1,000 | $1,000 |
Nature of Tax Fees: preparation of Excise Tax Statement and 1120 RIC.
All Other Fees: Semi-Annual Report Review and N-14 filing review (2021).
(e) (1) The audit committee approves all audit and non-audit related services and, therefore, has not adopted pre-approval policies and procedures described in paragraph (c)(7) of Rule 2-01 of Regulation S-X.
(e) (2) None of the services described in paragraph (b) through (d) of this Item were approved by the audit committee pursuant to paragraph (c)(7)(i)(C) of Rule 2-01 of Regulation S-X.
(f) All of the principal accountant’s hours spent on auditing the registrant’s financial statements were attributed to work performed by full-time permanent employees of the principal accountant.
(g) The following table indicates the aggregate non-audit fees billed by the registrant’s principal accountant for services to the registrant , the registrant’s investment adviser (not sub-adviser), and any entity controlling, controlled by, or under common control with the adviser that provides ongoing services to the registrant, for the last two years.
| Non-Audit Fees | FYE 12/31/2022 | FYE 12/31/2021 | ||
| Registrant | $10,000 | $10,000 | ||
| Registrant’s Investment Adviser | $0 | $0 |
(h) The principal accountant provided no services to the investment adviser or any entity controlling, controlled by, or under common control with the adviser that provides ongoing services to the registrant.
Item 5. Audit Committee of Listed Companies. Not applicable.
Item 6. Investments.
(a) Not applicable. Schedule filed with Item 1.
(b) Not applicable.
Item 7. Disclosure of Proxy Voting Policies and Procedures for Closed-End Management Investment Companies. Not applicable.
Item 8. Portfolio Managers of Closed End Management Investment Companies. Not applicable.
Item 9. Purchases of Equity Securities by Closed-End Management Investment Companies and Affiliated Purchasers. Not applicable.
Item 10. Submission of Matters to a Vote of Security Holders.
The registrant has not adopted procedures by which shareholders may recommend nominees to the registrant’s board of trustees.
Item 11. Controls and Procedures.
(a) The Registrant’s president and chief financial officer concluded that the disclosure controls and procedures (as defined in Rule 30a-3(c) under the Act (17 CFR 270.30a -3(c))) as of a date within 90 days of the filing date of the report that includes the disclosure required by this paragraph, based on the evaluation of these controls and procedures required by Rule 30a-3(b) under the Act (17 CFR 270.30a-3(b)) and Rules 13a-15(b) or 15d-15(b) under the Exchange Act (17 CFR 240.13a -15(b) or 240.15d -15(b)).
(b) There were no changes in the registrant’s internal control over financial reporting (as defined in Rule 30a-3(d) under the Act (17 CFR 270.30a-3(d)) that occurred during the period covered by this report that has materially affected, or is reasonably likely to materially affect, the registrant’s internal control over financial reporting.
Item 12. Disclosure of Securities Lending Activities for Closed-End Management Investment Companies.
Not applicable.
Item 13. Exhibits.
(a)(1) Code of Ethics. Filed herewith.
(a)(2) Certifications pursuant to Section 302 of the Sarbanes-Oxley Act of 2002. Filed herewith.
(a)(3) Not applicable.
(a)(4) Not applicable.
(b) Certification pursuant to Section 906 of the Sarbanes-Oxley Act of 2002. Filed herewith.
| SIGNATURES |
Pursuant to the requirements of the Securities Exchange Act of 1934 and the Investment Company Act of 1940, the registrant has duly caused this report to be signed on its behalf by the undersigned, thereunto duly authorized.
| Paradigm Funds |
| By: /s/Candace King Weir Candace King Weir President |
| Date: 3/1/23 |
Pursuant to the requirements of the Securities Exchange Act of 1934 and the Investment Company Act of 1940, this report has been signed below by the following persons on behalf of the registrant and in the capacities and on the dates indicated.
| By: /s/Candace King Weir Candace King Weir President |
| Date: 3/1/23 |
By: /s/Robert A. Benton Robert A. Benton Chief Financial Officer |
| Date: 3/2/2023 |