| UNITED STATES SECURITIES AND EXCHANGE COMMISSION WASHINGTON, D.C. 20549 |
| FORM N-CSR |
CERTIFIED SHAREHOLDER REPORT OF REGISTERED MANAGEMENT
INVESTMENT COMPANIES
| Investment Company Act file number 811-21233 |
| PARADIGM FUNDS (Exact name of registrant as specified in charter) |
Nine Elk Street, Albany, NY 12207-1002
(Address of principal executive offices) (Zip code)
| Robert A. Benton Nine Elk Street, Albany, NY 12207-1002 (Name and address of agent for service) |
Registrant's telephone number, including area code: (518) 431-3500
Date of fiscal year end: December 31
Date of reporting period: June 30, 2023
Form N-CSR is to be used by management investment companies to file reports with the Commission not later than 10 days after the transmission to stockholders of any report that is required to be transmitted to stockholders under Rule 30e-1 under the Investment Company Act of 1940 (17 CFR 270.30e -1). The Commission may use the information provided on Form N-CSR in its regulatory, disclosure review, inspection and policymaking roles.
A registrant is required to disclose the information specified by Form N-CSR, and the Commission will make this information public. A registrant is not required to respond to the collection of information contained in Form N-CSR unless the Form displays a currently valid Office of Management and Budget ("OMB") control number.
Item 1. Report to Stockholders.
Paradigm Funds
Paradigm Value Fund
Paradigm Select Fund
Paradigm Micro-Cap Fund
For Investors Seeking Long-Term Capital Appreciation
SEMI-ANNUAL REPORT
June 30, 2023
| Table of Contents | |
| PARADIGM FUNDS | |
| Letter to Shareholders | 2 |
| Sector Allocation | 4 |
| Performance Information | 6 |
| Schedules of Investments | 9 |
| Statements of Assets and Liabilities | 16 |
| Statements of Operations | 16 |
| Statements of Changes in Net Assets | 18 |
| Financial Highlights | 20 |
| NOTES TO FINANCIAL STATEMENTS | 22 |
| DISCLOSURE OF EXPENSES | 27 |
| ADDITIONAL INFORMATION | 29 |
2023 Semi-Annual Report 1
Letter to Shareholders
Dear Fellow Shareholders:
Thus far, 2023 has been as unpredictable as any other year, but somehow it has seemed more eventful than wished for or anticipated. The month of June was exceptionally strong across equity markets, in some cases returning more for the month than for the second quarter in its entirety. As was the case in the first quarter of 2023, Growth continued to significantly outpace Value across market capitalizations. As one example, the Russell 2000 Growth index returned 7.05% for the second quarter, versus 3.18% for the Value index. Year to date, the Russell 2000 Growth index has returned 13.55% versus 2.50% for the Value index.
From a geopolitical perspective, many of the global uncertainties we witnessed in 2022 have persisted, including the ongoing Russia-Ukraine war, and elevated inflation across much of the world. While the US appears to have navigated the precipitous failures of several banks, the recent debt ceiling impasse was a reminder of the many wild cards surrounding the US economy. In terms of what is better than it was a year ago at this time, fuel prices are lower, Covid cases are significantly reduced, and supply chain snarls have abated. As another data point for the foundational strength of the US economy, the Commerce Department revised its first quarter GDP growth rate higher, to 2%, versus its previous estimate of 1.3% .
The US ISM index came in at 46.0 for June, remaining in contractionary territory from its May level of 46.9, continuing concerns about a US manufacturing slump and potential recession. Despite eight consecutive months of contraction, a silver lining is that pricing pressures appear to be moderating. The ISM Services report for 2023 was a surprise to the upside, coming in at 53.9, its strongest growth in four months and up over May. Equally important, the CPI rate as a measure of inflation in the US economy is running significantly lower than a year ago, at 3.0% versus approximately 9.0% at this time a year ago.
Clearly the key question on most people’s minds is the Fed’s next steps after it has raised interest rates by 500 basis points in just over a year (starting in March of 2022). US unemployment remains resilient, with the most recent rate at 3.6%, flat with where it was a year ago. With the labor market running hotter for longer than many expected this will clearly remain a key focus. A secondary area of focus and concern for us is the upcoming resumption of student loan repayments in October of 2023. Given inflation and the absence of any government household stimulus payments, this could add significant pressure to consumer spending patterns.
While 2023 thus far has rebounded significantly to offset the very challenging performance of 2022, the year is only halfway through. With corporate America on the verge of reporting second-quarter earnings results, there will likely be intense scrutiny of any shifts in messaging or outlooks for the back half of the year. 2023 was a year that started off with many companies expecting a softer first half, to be made up for by a meaningfully stronger second half. Should that not materialize, we could see an unwelcome market reaction.
Should this potential scenario materialize, we find conviction in our long-term outlook. Not being complacent, we continue to examine our portfolio holdings for vulnerability to a more muted second half in the US economy and in turn the impact to their own customer demand and financial results. We also continue to evaluate balance sheet quality, particularly in a higher interest rate environment, for any companies with higher leverage, or upcoming debt maturities. Strong free cash flows remain an evergreen hallmark of our belief in companies’ ability to invest in their future growth and earnings power, regardless of their immediate share price performance.
Paradigm Value Fund
The Paradigm Value Fund increased 5.47% in the first half of 2023, compared to a 2.50% increase for its benchmark, the Russell 2000 Value Index. Since inception (January 1, 2003) on an annualized basis, the Fund has returned 11.74%, compared to 8.89% for the benchmark.
2023 Semi-Annual Report 2
While in 2022 the Information Technology sector was an exceptionally large detractor to performance in both the Fund as well as in the Russell 2000 Value, the opposite has been the case in 2023. For the first half of 2023, Information Technology was the greatest contributor, driven by our overweight position.
Given the strength across equity market indices, there were no material detractors from a sector perspective.
Paradigm Select Fund
The Paradigm Select Fund appreciated 18.66% in the first half of 2023, compared to an increase of 8.79% for its benchmark, the Russell 2500 Index. Since inception (January 1, 2005) on an annualized basis, the Fund has returned 9.86% compared to 8.41% for the benchmark.
The Information Technology sector was the largest contributor in the first half of 2023, driven by absolute performance as well as our overweight position in the portfolio. The Industrials sector was also a meaningful contributor to absolute performance in the first half of this year.
There were no material detractors to performance year to date, given the overall strength across equity markets.
Paradigm Micro-Cap Fund
The Paradigm Micro-Cap Fund gained 15.47% in the first half of 2023, compared to a gain of 2.32% for its benchmark, the Russell Microcap Index. Since inception (January 1, 2008) on an annualized basis, the Fund has returned 9.75%, compared to 6.28% for the benchmark.
The Information Technology sector was the top contributor in the first half of 2023, driven by absolute performance and our overweight in the portfolio. The Industrials and Health Care sectors were also strong contributors to the portfolio’s absolute return.
Due to the overall strength of equities in the first half of 2023, there were no material detracting sectors in the portfolio.
Sincerely,

Candace King Weir | Amelia F. Weir |
Past performance does not guarantee future results. Investment return and principal value will fluctuate so that shares, when redeemed, may be worth more or less than their original cost. Returns assume that all dividends and distributions were reinvested and do not reflect the deduction of taxes that a shareholder would pay on fund distributions or the redemption of fund shares. Current performance may be lower or higher that the performance data quoted. Statements concerning financial market trends are based on current market conditions, which will fluctuate. Any statements of opinion constitute only current opinions of Paradigm Funds Advisor LLC which are subject to change. Investment in the Fund involves a risk of loss. The Russell 2000 Value Index, Russell 2500 Index and Russell Microcap Index are U.S. equity indices. These indices are included for informational purposes only and may not be representative of the type of investments made by the Funds. References made to these indices are for comparative purposes only. To obtain performance data current to the most recent month end, please call 1-800-239-0732 or visit our website at www.paradigm-funds.com. The prospectus should be read carefully before investing.
2023 Semi-Annual Report 3
Paradigm Funds (Unaudited)
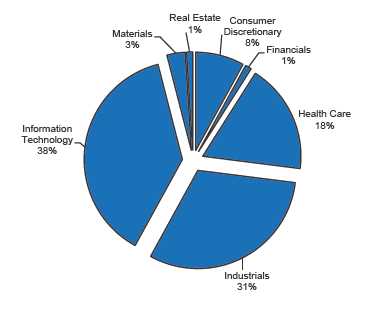
PARADIGM VALUE FUND
Sector Allocation as of June 30, 2023
(As a Percentage of Equity Securities Held)

PARADIGM SELECT FUND
Sector Allocation as of June 30, 2023
(As a Percentage of Equity Securities Held)
2023 Semi-Annual Report 4
Paradigm Funds (Unaudited)
PARADIGM MICRO-CAP FUND
Sector Allocation as of June 30, 2023
(As a Percentage of Equity Securities Held)

2023 Semi-Annual Report 5
Paradigm Value Fund (Unaudited)
PERFORMANCE INFORMATION
Average Annual Rate of Return (%) for the Periods Ended June 30, 2023.
June 30, 2023 NAV $55.18
| 1 Year(A) | 3 Year(A) | 5 Year(A) | 10 Year(A) | |||||
| Paradigm Value Fund | 14.87% | 15.53% | 6.91% | 9.13% | ||||
| Russell 2000® Value Index(B) | 6.01% | 15.43% | 3.54% | 7.29% |
(A) 1 Year, 3 Year, 5 Year and 10 Year returns include change in share prices and in each case includes reinvestment of any dividends and capital gain distributions. The inception date of the Paradigm Value Fund was January 1, 2003.
(B) The Russell 2000® Value Index (whose composition is different from the Fund) is an unmanaged index of small-capitalization stocks with lower price-to-book ratios and lower forecasted growth values than the total population of small-capitalization stocks. Investors cannot invest directly in an index.
For purposes of the graph and the accompanying table, it is assumed that all dividends and distributions were reinvested.
Per the Fund’s most recent prospectus, the Fund’s Total Annual Operating Expense Ratio is 1.50% . The Total Annual Operating Expense Ratio may not correlate to the expense ratio in the Fund’s financial highlights because the financial highlights only include the direct operating expenses incurred by the Fund, not the indirect costs of investing in acquired funds. Shares redeemed within 90 days of purchase are subject to a 2.00% redemption fee.
PAST PERFORMANCE DOES NOT GUARANTEE FUTURE RESULTS. INVESTMENT RETURN AND PRINCIPAL VALUE WILL FLUCTUATE SO THAT SHARES, WHEN REDEEMED, MAY BE WORTH MORE OR LESS THAN THEIR ORIGINAL COST. RETURNS DO NOT REFLECT THE DEDUCTION OF TAXES THAT A SHAREHOLDER WOULD PAY ON FUND DISTRIBUTIONS OR THE REDEMPTION OF FUND SHARES. CURRENT PERFORMANCE MAY BE LOWER OR HIGHER THAT THE PERFORMANCE DATA QUOTED. TO OBTAIN PERFORMANCE DATA CURRENT TO THE MOST RECENT MONTH END, PLEASE CALL 1-800-239-0732 OR VISIT OUR WEBSITE AT www.paradigm-funds.com.
2023 Semi-Annual Report 6
Paradigm Select Fund (Unaudited)
PERFORMANCE INFORMATION
Average Annual Rate of Return (%) for the Periods Ended June 30, 2023.
June 30, 2023 NAV $64.80
| 1 Year(A) | 3 Year(A) | 5 Year(A) | 10 Year(A) | |||||
| Paradigm Select Fund | 24.84% | 15.86% | 11.36% | 11.60% | ||||
| Russell 2500® Index(B) | 13.58% | 12.29% | 6.55% | 9.38% |
(A) 1 Year, 3 Year, 5 Year and 10 Year returns include change in share prices and in each case includes reinvestment of any dividends and capital gain distributions. The inception date of the Paradigm Select Fund was January 1, 2005.
(B) The Russell 2500® Index (whose composition is different from the Fund) measures the performance of the small to mid-cap segment of the U.S. equity universe, commonly referred to as “mid” cap. The Russell 2500® Index is a subset of the Russell 3000® Index. It includes approximately 2,500 of the smallest securities based on a combination of their market cap and current index membership. Investors cannot invest directly in an index. For purposes of the graph and the accompanying table, it is assumed that all dividends and distributions were reinvested.
Per the Fund’s most recent prospectus, the Fund’s Total Annual Operating Expense Ratio (before any fee waiver) is 1.50%, and 1.15% post waiver. The Advisor has contractually agreed to waive management fees and reimburse expenses to the extent necessary to maintain total annual operating expenses of the Fund (excluding brokerage fees and commissions, interest and other borrowing expenses, taxes, extraordinary expenses and the indirect costs of investing in Acquired Funds) at 1.15% of its average daily net assets through April 30, 2024. The Total Annual Operating Expense Ratio may not correlate to the expense ratio in the Fund’s financial highlights because the financial highlights only include the direct operating expenses incurred by the Fund, not the indirect costs of investing in acquired funds. Shares redeemed within 90 days of purchase are subject to a 2.00% redemption fee.
PAST PERFORMANCE DOES NOT GUARANTEE FUTURE RESULTS. INVESTMENT RETURN AND PRINCIPAL VALUE WILL FLUCTUATE SO THAT SHARES, WHEN REDEEMED, MAY BE WORTH MORE OR LESS THAN THEIR ORIGINAL COST. RETURNS DO NOT REFLECT THE DEDUCTION OF TAXES THAT A SHAREHOLDER WOULD PAY ON FUND DISTRIBUTIONS OR THE REDEMPTION OF FUND SHARES. CURRENT PERFORMANCE MAY BE LOWER OR HIGHER THAT THE PERFORMANCE DATA QUOTED. TO OBTAIN PERFORMANCE DATA CURRENT TO THE MOST RECENT MONTH END, PLEASE CALL 1-800-239-0732 OR VISIT OUR WEBSITE AT www.paradigm-funds.com.
2023 Semi-Annual Report 7
Paradigm Micro-Cap Fund (Unaudited)
PERFORMANCE INFORMATION
Average Annual Rate of Return (%) for the Period Ended June 30, 2023.
June 30, 2023 NAV $50.02
| 1 Year(A) | 3 Year(A) | 5 Year(A) | 10 Year(A) | |||||
| Paradigm Micro-Cap Fund | 29.48% | 21.62% | 10.49% | 11.48% | ||||
| Russell Microcap® Index(B) | 6.63% | 9.09% | 2.07% | 7.29% |
(A) 1 Year, 3 Year, 5 Year and 10 Year returns include change in share prices and in each case includes reinvestment of any dividends and capital gain distributions. The inception date of the Paradigm Micro-Cap Fund was January 1, 2008.
(B) The Russell Microcap® Index measures the performance of the microcap segment of the U.S. equity market. Microcap stocks make up less than 3% of the U.S. equity market (by market cap) and consist of the smallest 1,000 securities in the small-cap Russell 2000® Index, plus the next smallest eligible securities by market cap. The Russell Microcap® Index is completely reconstituted annually to ensure larger stocks do not distort performance and characteristics of the true microcap opportunity set. Investors cannot invest directly in an index. Under normal circumstances, the Micro-Cap Fund invests at least 80% of its net assets in common stocks of U.S. micro-cap companies.
For purposes of the graph and the accompanying table, it is assumed that all dividends and distributions were reinvested.
Per the Fund’s most recent prospectus, the Fund’s Total Annual Operating Expense Ratio is 1.25% . The Total Annual Operating Expense Ratio may not correlate to the expense ratio in the Fund’s financial highlights because the financial highlights only include the direct operating expenses incurred by the Fund, not the indirect costs of investing in acquired funds. Shares redeemed within 90 days of purchase are subject to a 2.00% redemption fee.
PAST PERFORMANCE DOES NOT GUARANTEE FUTURE RESULTS. INVESTMENT RETURN AND PRINCIPAL VALUE WILL FLUCTUATE SO THAT SHARES, WHEN REDEEMED, MAY BE WORTH MORE OR LESS THAN THEIR ORIGINAL COST. RETURNS DO NOT REFLECT THE DEDUCTION OF TAXES THAT A SHAREHOLDER WOULD PAY ON FUND DISTRIBUTIONS OR THE REDEMPTION OF FUND SHARES. CURRENT PERFORMANCE MAY BE LOWER OR HIGHER THAT THE PERFORMANCE DATA QUOTED. TO OBTAIN PERFORMANCE DATA CURRENT TO THE MOST RECENT MONTH END, PLEASE CALL 1-800-239-0732 OR VISIT OUR WEBSITE AT www.paradigm-funds.com.
2023 Semi-Annual Report 8
| Paradigm Value Fund | |||||
| Schedule of Investments | |||||
| June 30, 2023 (Unaudited) | |||||
| Shares | Fair Value | % of Net Assets | |||
| COMMON STOCKS | |||||
| Air Courier Services | |||||
| 37,000 | Air Transport Services Group, Inc. * | $ | 698,190 | 1.43 | % |
| Aircraft Parts & Auxiliary Equipment, NEC | |||||
| 10,000 | Ducommun Incorporated * | 435,700 | 0.89 | % | |
| Communications Services, NEC | |||||
| 30,000 | Calix, Inc. * | 1,497,300 | 3.07 | % | |
| Computer Communications Equipment | |||||
| 124,300 | A10 Networks, Inc. | 1,813,537 | |||
| 50,000 | Extreme Networks, Inc. * | 1,302,500 | |||
| 3,116,037 | 6.39 | % | |||
| Electrical Work | |||||
| 15,600 | EMCOR Group Inc. | 2,882,568 | 5.91 | % | |
| Electronic Computers | |||||
| 6,000 | Omnicell, Inc. * | 442,020 | 0.91 | % | |
| Footwear, (No Rubber) | |||||
| 20,000 | Caleres, Inc. | 478,600 | 0.98 | % | |
| Industrial Organic Chemicals | |||||
| 21,700 | Sensient Technologies Corporation | 1,543,521 | 3.16 | % | |
| Laboratory Analytical Instruments | |||||
| 12,500 | Revvity, Inc. | 1,484,875 | 3.04 | % | |
| Measuring & Controlling Devices, NEC | |||||
| 10,000 | Onto Innovation Inc. * | 1,164,700 | 2.39 | % | |
| Mining & Quarrying of Nonmetallic Minerals (No Fuels) | |||||
| 70,510 | Summit Materials, Inc. - Class A * | 2,668,803 | 5.47 | % | |
| Motor Vehicle Parts & Accessories | |||||
| 40,000 | Modine Manufacturing Company * | 1,320,800 | 2.71 | % | |
| National Commercial Banks | |||||
| 32,000 | First Merchants Corporation | 903,360 | |||
| 15,000 | National Bank Holdings Corporation - Class A | 435,600 | |||
| 1,338,960 | 2.74 | % | |||
| Printed Circuit Boards | |||||
| 15,000 | Jabil, Inc. | 1,618,950 | 3.32 | % | |
| Radio & TV Broadcasting & Communications Equipment | |||||
| 10,000 | Aviat Networks, Inc. * | 333,700 | 0.68 | % | |
| Retail - Catalog & Mail-Order Houses | |||||
| 7,000 | Insight Enterprises, Inc. * | 1,024,380 | 2.10 | % | |
| Retail - Family Clothing Stores | |||||
| 67,600 | American Eagle Outfitters, Inc. | 797,680 | 1.64 | % | |
| Retail - Retail Stores, NEC | |||||
| 6,000 | IAC Inc. * | 376,800 | 0.77 | % | |
| Retail - Shoe Stores | |||||
| 51,000 | Designer Brands Inc. - Class A | 515,100 | |||
| 29,800 | Foot Locker, Inc. | 807,878 | |||
| 1,322,978 | 2.71 | % | |||
| Semiconductors & Related Devices | |||||
| 47,100 | Kulicke & Soffa Industries Inc. (Singapore) | 2,800,095 | |||
| 20,000 | MaxLinear, Inc. * | 631,200 | |||
| 11,700 | Qorvo, Inc. * | 1,193,751 | |||
| 4,625,046 | 9.48 | % | |||
| Services - Business Services, NEC | |||||
| 5,900 | Concentrix Corporation | 476,425 | |||
| 150,000 | Conduent Incorporated * | 510,000 | |||
| 986,425 | 2.02 | % | |||
| * Non-Income Producing Securities. The accompanying notes are an integral part of these financial statements. |
2023 Semi-Annual Report 9
| Paradigm Value Fund | |||||||
| Schedule of Investments | |||||||
| June 30, 2023 (Unaudited) | |||||||
| Shares | Fair Value | % of Net Assets | |||||
| COMMON STOCKS | |||||||
| Services - Computer Integrated Systems Design | |||||||
| 20,000 | NextGen Healthcare, Inc. * | $ | 324,400 | 0.67 | % | ||
| Services - Help Supply Services | |||||||
| 36,500 | Kforce Inc. | 2,287,090 | 4.69 | % | |||
| Services - Home Health Care Services | |||||||
| 18,900 | Addus HomeCare Corporation * | 1,752,030 | 3.59 | % | |||
| Services - Management Services | |||||||
| 30,000 | R1 RCM Inc. * | 553,500 | 1.13 | % | |||
| Services - Medical Laboratories | |||||||
| 33,300 | RadNet, Inc. * | 1,086,246 | 2.23 | % | |||
| Services - Prepackaged software | |||||||
| 40,000 | Absolute Software Corp. (Canada) | 458,400 | |||||
| 6,666 | Consensus Cloud Solutions Inc. * | 206,646 | |||||
| 665,046 | 1.36 | % | |||||
| Services - Skilled Nursing Care Facilities | |||||||
| 10,000 | The Ensign Group, Inc. | 954,600 | 1.96 | % | |||
| Special Industry Machinery (No Metalworking Machinery) | |||||||
| 3,500 | Kadant Inc. | 777,350 | 1.59 | % | |||
| Special Industry Machinery, NEC | |||||||
| 28,100 | Azenta, Inc. * | 1,311,708 | |||||
| 20,000 | Veeco Instruments Inc. * | 513,600 | |||||
| 1,825,308 | 3.74 | % | |||||
| State Commercial Banks | |||||||
| 9,000 | Banner Corporation | 393,030 | |||||
| 25,000 | Renasant Corporation | 653,250 | |||||
| 1,046,280 | 2.14 | % | |||||
| Telegraph & Other Message Communications | |||||||
| 7,200 | Ziff Davis, Inc. * | 504,432 | 1.03 | % | |||
| Telephone & Telegraph Apparatus | |||||||
| 5,000 | ADTRAN Holdings, Inc. | 52,650 | |||||
| 6,000 | Fabrinet (Thailand) * | 779,280 | |||||
| 200,000 | Infinera Corporation * | 966,000 | |||||
| 1,797,930 | 3.68 | % | |||||
| Transportation Services | |||||||
| 9,900 | GATX Corp. | 1,274,526 | 2.61 | % | |||
| Water, Sewer, Pipeline, Comm & Power Line Construction | |||||||
| 22,000 | Primoris Services Corporation | 670,340 | 1.37 | % | |||
| Wholesale - Computers & Peripheral Equipment & Software | |||||||
| 10,832 | TD SYNNEX Corporation | 1,018,208 | 2.09 | % | |||
| Total for Common Stocks (Cost $18,203,240) | 46,695,319 | 95.69 | % | ||||
| REAL ESTATE INVESTMENT TRUSTS | |||||||
| 10,950 | Mid-America Apartment Communities Inc. | 1,662,867 | |||||
| Total for Real Estate Investment Trusts (Cost $306,603) | 1,662,867 | 3.41 | % | ||||
| MONEY MARKET FUNDS | |||||||
| 442,187 | SEI Daily Income Trust Government Fund Institutional | ||||||
| Class 4.76% ** | 442,187 | 0.91 | % | ||||
| Total for Money Market Funds (Cost $442,187) | |||||||
| Total Investment Securities | 48,800,373 | 100.01 | % | ||||
| (Cost $18,952,030) | |||||||
| Liabilities in Excess of Other Assets | (3,821 | ) | -0.01 | % | |||
| Net Assets | $ | 48,796,552 | 100.00 | % | |||
| * Non-Income Producing Securities. ** The Yield Rate shown represents the 7-day yield at June 30, 2023. The accompanying notes are an integral part of these financial statements. |
2023 Semi-Annual Report 10
| Paradigm Select Fund | ||||||
| Schedule of Investments | ||||||
| June 30, 2023 (Unaudited) | ||||||
| Shares | Fair Value | % of Net Assets | ||||
| COMMON STOCKS | ||||||
| Aircraft Parts & Auxiliary Equipment, NEC | ||||||
| 40,000 | Ducommun Incorporated * | $ | 1,742,800 | 1.62 | % | |
| Communications Equipment, NEC | ||||||
| 24,600 | Lumentum Holdings Inc. * | 1,395,558 | 1.30 | % | ||
| Electrical Work | ||||||
| 28,850 | EMCOR Group Inc. | 5,330,903 | 4.97 | % | ||
| Electromedical & Electrotherapeutic Apparatus | ||||||
| 10,200 | Masimo Corporation * | 1,678,410 | 1.56 | % | ||
| Fire, Marine & Casualty Insurance | ||||||
| 6,450 | American Financial Group Inc. | 765,938 | 0.71 | % | ||
| General Industrial Machinery & Equipment | ||||||
| 12,200 | Regal Rexnord Corporation | 1,877,580 | ||||
| 82,400 | Zurn Elkay Water Solutions Corp. | 2,215,736 | ||||
| 4,093,316 | 3.81 | % | ||||
| In Vitro & In Vivo Diagnostic Substances | ||||||
| 40,400 | Neogen Corporation * | 878,700 | 0.82 | % | ||
| Industrial Organic Chemicals | ||||||
| 25,700 | Sensient Technologies Corporation | 1,828,041 | 1.70 | % | ||
| Instruments for Measurement & Testing of Electricity & Electric Signals | ||||||
| 33,650 | Teradyne, Inc. | 3,746,254 | 3.49 | % | ||
| Laboratory Analytical Instruments | ||||||
| 31,800 | Revvity, Inc. | 3,777,522 | 3.52 | % | ||
| Measuring & Controlling Devices, NEC | ||||||
| 18,300 | Onto Innovation Inc. * | 2,131,401 | 1.99 | % | ||
| Miscellaneous Manufacturing Industries | ||||||
| 14,600 | Hillenbrand, Inc. | 748,688 | 0.70 | % | ||
| Optical Instruments & Lenses | ||||||
| 50,000 | Coherent Corp. * | 2,549,000 | 2.37 | % | ||
| Plastics Products | ||||||
| 16,000 | Entegris, Inc. | 1,773,120 | 1.65 | % | ||
| Printed Circuit Boards | ||||||
| 25,400 | Jabil, Inc. | 2,741,422 | 2.55 | % | ||
| Radio & TV Broadcasting & Communications Equipment | ||||||
| 32,866 | Aviat Networks, Inc. * | 1,096,738 | 1.02 | % | ||
| Retail - Catalog & Mail-Order Houses | ||||||
| 11,700 | Insight Enterprises, Inc. * | 1,712,178 | 1.60 | % | ||
| Retail - Family Clothing Stores | ||||||
| 62,000 | American Eagle Outfitters, Inc. | 731,600 | 0.68 | % | ||
| Retail - Lumber & Other Building Materials Dealers | ||||||
| 51,025 | Builders FirstSource, Inc. * | 6,939,400 | 6.46 | % | ||
| Retail - Radio, TV & Consumer Electronics Stores | ||||||
| 40,700 | Best Buy Co., Inc. | 3,335,365 | 3.11 | % | ||
| Retail - Retail Stores, NEC | ||||||
| 14,900 | IAC Inc. * | 935,720 | 0.87 | % | ||
| Retail - Shoe Stores | ||||||
| 68,300 | Foot Locker, Inc. | 1,851,613 | 1.72 | % | ||
| Search, Detection, Navigation, Guidance, Aeronautical Systems | ||||||
| 18,100 | Garmin Ltd. (Switzerland) | 1,887,649 | 1.76 | % | ||
| Semiconductors & Related Devices | ||||||
| 80,175 | Kulicke & Soffa Industries Inc. (Singapore) | 4,766,404 | ||||
| 75,700 | Marvell Technology, Inc. | 4,525,346 | ||||
| 40,000 | MaxLinear, Inc. * | 1,262,400 | ||||
| 12,800 | Qorvo, Inc. * | 1,305,984 | ||||
| 25,000 | Skyworks Solutions, Inc. | 2,767,250 | ||||
| 14,627,384 | 13.63 | % | ||||
| * Non-Income Producing Securities. The accompanying notes are an integral part of these financial statements. |
2023 Semi-Annual Report 11
| Paradigm Select Fund | ||||||
| Schedule of Investments | ||||||
| June 30, 2023 (Unaudited) | ||||||
| Shares | Fair Value | % of Net Assets | ||||
| COMMON STOCKS | ||||||
| Services - Computer Integrated Systems Design | ||||||
| 50,000 | NextGen Healthcare, Inc. * | $ | 811,000 | 0.76 | % | |
| Services - Help Supply Services | ||||||
| 77,625 | Kelly Services, Inc. - Class A | 1,366,976 | ||||
| 68,325 | Kforce Inc. | 4,281,245 | ||||
| 5,648,221 | 5.26 | % | ||||
| Services - Medical Laboratories | ||||||
| 62,600 | Natera, Inc. * | 3,046,116 | 2.84 | % | ||
| Services - Prepackaged Software | ||||||
| 11,100 | Consensus Cloud Solutions Inc. * | 344,100 | ||||
| 32,100 | Progress Software Corporation | 1,865,010 | ||||
| 2,209,110 | 2.06 | % | ||||
| Services - Skilled Nursing Care Facilities | ||||||
| 17,100 | The Ensign Group, Inc. | 1,632,366 | 1.52 | % | ||
| Steel Pipe & Tubes | ||||||
| 15,750 | ATI Inc. * | 696,623 | 0.65 | % | ||
| Steel Works, Blast Furnaces & Rolling Mills (Coke Ovens) | ||||||
| 13,800 | Carpenter Technology Corporation | 774,594 | 0.72 | % | ||
| Surgical & Medical Instruments & Apparatus | ||||||
| 93,000 | Globus Medical, Inc. - Class A * | 5,537,220 | 5.16 | % | ||
| Telephone & Telegraph Apparatus | ||||||
| 20,000 | Ciena Corporation * | 849,800 | 0.79 | % | ||
| Title Insurance | ||||||
| 5,900 | Fidelity National Financial, Inc. | 212,400 | 0.20 | % | ||
| Wholesale - Computers & Peripheral Equipment & Software | ||||||
| 18,000 | TD SYNNEX Corporation | 1,692,000 | 1.58 | % | ||
| Wholesale - Electrical Apparatus & Equipment, Wiring Supplies | ||||||
| 18,000 | EnerSys | 1,953,360 | 1.82 | % | ||
| Wholesale - Lumber & Other Construction Materials | ||||||
| 42,000 | Boise Cascade Company | 3,794,700 | 3.54 | % | ||
| Total for Common Stocks (Cost $69,985,804) | 97,156,230 | 90.51 | % | |||
| REAL ESTATE INVESTMENT TRUSTS | ||||||
| 8,400 | Mid-America Apartment Communities Inc. | 1,275,624 | 1.19 | % | ||
| Total for Real Estate Investment Trusts (Cost $924,583) | ||||||
| MONEY MARKET FUNDS | ||||||
| 6,443,591 | SEI Daily Income Trust Government Fund Institutional | |||||
| Class 4.76% ** | 6,443,591 | 6.00 | % | |||
| Total for Money Market Funds (Cost $6,443,591) | ||||||
| Total Investment Securities | 104,875,445 | 97.70 | % | |||
| (Cost $77,353,978) | ||||||
| Other Assets in Excess of Liabilities | 2,470,609 | 2.30 | % | |||
| Net Assets | $ | 107,346,054 | 100.00 | % | ||
| * Non-Income Producing Securities. ** The Yield Rate shown represents the 7-day yield at June 30, 2023. The accompanying notes are an integral part of these financial statements. |
2023 Semi-Annual Report 12
| Paradigm Micro-Cap Fund | ||||||
| Schedule of Investments | ||||||
| June 30, 2023 (Unaudited) | ||||||
| Shares | Fair Value | %of Net Assets | ||||
| COMMON STOCKS | ||||||
| Aircraft Parts & Auxiliary Equipment, NEC | ||||||
| 60,000 | Ducommun Incorporated * | $ | 2,614,200 | 1.95 | % | |
| Communications Services, NEC | ||||||
| 60,000 | Calix, Inc. * | 2,994,600 | 2.23 | % | ||
| Computer Communications Equipment | ||||||
| 200,000 | A10 Networks, Inc. | 2,918,000 | ||||
| 250,000 | Extreme Networks, Inc. * | 6,512,500 | ||||
| 77,425 | Lantronix, Inc. * | 325,959 | ||||
| 9,756,459 | 7.27 | % | ||||
| Electronic Computers | ||||||
| 20,000 | Omnicell, Inc. * | 1,473,400 | 1.10 | % | ||
| Footwear (No Rubber) | ||||||
| 160,000 | Caleres, Inc. | 3,828,800 | 2.85 | % | ||
| Industrial Organic Chemicals | ||||||
| 200,000 | Codexis, Inc. * | 560,000 | ||||
| 5,950 | Sensient Technologies Corporation | 423,223 | ||||
| 983,223 | 0.73 | % | ||||
| Instruments For Measurement & Testing of Electricity & Electric Signals | ||||||
| 32,650 | Cohu, Inc. * | 1,356,934 | 1.01 | % | ||
| Measuring & Controlling Devices, NEC | ||||||
| 50,000 | Onto Innovation Inc. * | 5,823,500 | 4.34 | % | ||
| Mining & Quarrying of Nonmetallic Minerals (No Fuels) | ||||||
| 110,000 | Summit Materials, Inc. - Class A * | 4,163,500 | 3.10 | % | ||
| Miscellaneous Manufacturing Industries | ||||||
| 5,200 | Hillenbrand, Inc. | 266,656 | 0.20 | % | ||
| Motor Vehicle Parts & Accessories | ||||||
| 80,000 | Garrett Motion Inc. * (Switzerland) | 605,600 | ||||
| 200,000 | Modine Manufacturing Company * | 6,604,000 | ||||
| 7,209,600 | 5.37 | % | ||||
| Pharmaceutical Preparations | ||||||
| 300,000 | Eton Pharmaceuticals, Inc. * | 1,047,000 | ||||
| 40,000 | Ocular Therapeutix, Inc. * | 206,400 | ||||
| 1,253,400 | 0.93 | % | ||||
| Radio & TV Broadcasting & Communications Equipment | ||||||
| 50,000 | Aviat Networks, Inc. * | 1,668,500 | ||||
| 400,000 | CalAmp Corp. * | 424,000 | ||||
| 2,092,500 | 1.56 | % | ||||
| Retail - Apparel & Accessory Stores | ||||||
| 120,000 | Citi Trends, Inc. * | 2,119,200 | ||||
| 10,000 | Zumiez Inc. * | 166,600 | ||||
| 2,285,800 | 1.70 | % | ||||
| Retail - Catalog & Mail-Order Houses | ||||||
| 40,000 | Insight Enterprises, Inc. * | 5,853,600 | ||||
| 80,000 | Lulu’s Fashion Lounge Holdings, Inc. * | 202,400 | ||||
| 6,056,000 | 4.51 | % | ||||
| Retail - Family Clothing Stores | ||||||
| 13,300 | American Eagle Outfitters, Inc. | 156,940 | 0.12 | % | ||
| Semiconductors & Related Devices | ||||||
| 40,000 | Ichor Holdings, Ltd. * | 1,500,000 | ||||
| 33,700 | Kulicke & Soffa Industries Inc. (Singapore) | 2,003,465 | ||||
| 120,000 | MaxLinear, Inc. * | 3,787,200 | ||||
| 20,000 | Semtech Corporation * | 509,200 | ||||
| 120,000 | Ultra Clean Holdings, Inc. * | 4,615,200 | ||||
| 12,415,065 | 9.25 | % | ||||
| * Non-Income Producing Securities. The accompanying notes are an integral part of these financial statements. |
2023 Semi-Annual Report 13
| Paradigm Micro-Cap Fund | ||||||
| Schedule of Investments | ||||||
| June 30, 2023 (Unaudited) | ||||||
| Shares | Fair Value | %of Net Assets | ||||
| COMMON STOCKS | ||||||
| Services - Business Services, NEC | ||||||
| 188,100 | Tabula Rasa HealthCare, Inc. * | $ | 1,551,825 | 1.16 | % | |
| Services - Computer Integrated Systems Design | ||||||
| 100,000 | NextGen Healthcare, Inc. * | 1,622,000 | ||||
| 1,000,000 | Ribbon Communications Inc. * | 2,790,000 | ||||
| 4,412,000 | 3.29 | % | ||||
| Services - Computer Programing Services | ||||||
| 147,490 | Computer Programs & Systems, Inc. * | 3,641,528 | 2.71 | % | ||
| Services - Health Services | ||||||
| 149,000 | The Pennant Group, Inc. * | 1,829,720 | 1.36 | % | ||
| Services - Help Supply Services | ||||||
| 55,000 | Cross Country Healthcare, Inc. * | 1,544,400 | ||||
| 130,500 | Kelly Services, Inc. - Class A | 2,298,105 | ||||
| 3,842,505 | 2.86 | % | ||||
| Services - Home Health Care Services | ||||||
| 19,700 | Addus HomeCare Corporation * | 1,826,190 | 1.36 | % | ||
| Services - Management Services | ||||||
| 160,000 | R1 RCM Inc. * | 2,952,000 | 2.20 | % | ||
| Services - Miscellaneous Health & Allied Services, NEC | ||||||
| 300,000 | Viemed Healthcare, Inc. * | 2,934,000 | 2.19 | % | ||
| Services - Prepackaged Software | ||||||
| 100,000 | Absolute Software Corp. (Canada) | 1,146,000 | ||||
| 10,900 | Progress Software Corporation | 633,290 | ||||
| 1,779,290 | 1.33 | % | ||||
| Services - Services, NEC | ||||||
| 250,000 | Enviri Corp. * | 2,467,500 | 1.84 | % | ||
| Services - Skilled Nursing Care Facilities | ||||||
| 40,000 | The Ensign Group, Inc. | 3,818,400 | 2.86 | % | ||
| Special Industry Machinery (No Metalworking Machinery) | ||||||
| 15,100 | Kadant Inc. | 3,353,710 | 2.50 | % | ||
| Special Industry Machinery, NEC | ||||||
| 40,000 | Axcelis Technologies, Inc. * | 7,333,200 | ||||
| 9,800 | Azenta, Inc. * | 457,464 | ||||
| 150,000 | Veeco Instruments Inc. * | 3,852,000 | ||||
| 11,642,664 | 8.68 | % | ||||
| Surgical & Medical Instruments & Apparatus | ||||||
| 150,000 | AngioDynamics, Inc. * | 1,564,500 | ||||
| 53,700 | AtriCure, Inc. * | 2,650,632 | ||||
| 500,000 | MiMedx Group, Inc. * | 3,305,000 | ||||
| 19,600 | OrthoPediatrics Corp. * | 859,460 | ||||
| 8,379,592 | 6.24 | % | ||||
| Telephone & Telegraph Apparatus | ||||||
| 60,000 | ADTRAN Holdings, Inc. | 631,800 | ||||
| 31,200 | DZS Inc. * | 123,864 | ||||
| 600,000 | Infinera Corporation * | 2,898,000 | ||||
| 3,653,664 | 2.72 | % | ||||
| Watches, Clocks, Clockwork Operated Devices/Parts | ||||||
| 207,673 | Fossil Group, Inc. * | 533,720 | 0.40 | % | ||
| Wholesale - Computers & Peripheral Equipment & Software | ||||||
| 49,925 | ScanSource, Inc. * | 1,475,783 | 1.10 | % | ||
| Women's, Misses', and Juniors Outerwear | ||||||
| 40,000 | J.Jill, Inc. * | 857,200 | 0.64 | % | ||
| Total for Common Stocks (Cost $71,746,914) | 125,681,868 | 93.66 | % | |||
| * Non-Income Producing Securities. The accompanying notes are an integral part of these financial statements. |
2023 Semi-Annual Report 14
| Paradigm Micro-Cap Fund | ||||||
| Schedule of Investments | ||||||
| June 30, 2023 (Unaudited) | ||||||
| Shares | Fair Value | %of Net Assets | ||||
| CONTINGENT VALUE RIGHTS | ||||||
| 300,000 Flexion Therapeutics Contingent Value Right * + | $ | 165,000 | ||||
| Total for Contingent Value Rights (Cost $186,000) | 165,000 | 0.12 | % | |||
| MONEY MARKET FUNDS | ||||||
| 8,498,258 SEI Daily Income Trust Government Fund Institutional | ||||||
| Class 4.76% ** | 8,498,258 | 6.33 | % | |||
| Total for Money Market Funds (Cost $8,498,258) | ||||||
| Total Investment Securities | 134,345,126 | 100.11 | % | |||
| (Cost $80,431,172) | ||||||
| Liabilities in Excess of Other Assets | (144,486 | ) | -0.11 | % | ||
| Net Assets | $ | 134,200,640 | 100.00 | % | ||
| * Non-Income Producing Securities. + Level 3 and illiquid security. ** The Yield Rate shown represents the 7-day yield at June 30, 2023. The accompanying notes are an integral part of these financial statements. |
2023 Semi-Annual Report 15
| Paradigm Funds | ||||||||
| Statements of Assets and Liabilities (Unaudited) | Value | Select | ||||||
| June 30, 2023 | Fund | Fund | ||||||
| Assets: | ||||||||
| Investment Securities at Fair Value* | $ | 48,800,373 | $ | 104,875,445 | ||||
| Receivable for Fund Shares Sold | 46 | 2,496,096 | ||||||
| Receivable for Securities Sold | 37,517 | - | ||||||
| Dividends Receivable | 17,416 | 74,383 | ||||||
| Total Assets | 48,855,352 | 107,445,924 | ||||||
| Liabilities: | ||||||||
| Payable for Fund Shares Redeemed | 184 | 7,051 | ||||||
| Payable to Advisor | 58,616 | 92,819 | ||||||
| Total Liabilities | 58,800 | 99,870 | ||||||
| Net Assets | $ | 48,796,552 | $ | 107,346,054 | ||||
| Net Assets Consist of: | ||||||||
| Paid In Capital | $ | 17,240,239 | $ | 82,380,112 | ||||
| Total Distributable Earnings | 31,556,313 | 24,965,942 | ||||||
| Net Assets | $ | 48,796,552 | $ | 107,346,054 | ||||
| Net Asset Value, Offering and Redemption Price (Note 2) | $ | 55.18 | $ | 64.80 | ||||
| * Investments at Identified Cost | $ | 18,952,030 | $ | 77,353,978 | ||||
| Shares Outstanding (Unlimited number of shares | 884,363 | 1,656,673 | ||||||
| authorized without par value) | ||||||||
| Statements of Operations (Unaudited) | ||||||||
| For the six month period ended June 30, 2023 | ||||||||
| Investment Income: | ||||||||
| Dividends (Net of foreign taxes of $1,177 and $0, respectively) | $ | 263,867 | $ | 689,732 | ||||
| Total Investment Income | 263,867 | 689,732 | ||||||
| Expenses: | ||||||||
| Investment Advisor Fees | 355,508 | 700,373 | ||||||
| Total Expenses | 355,508 | 700,373 | ||||||
| Less: Expenses Waived | - | (163,420 | ) | |||||
| Net Expenses | 355,508 | 536,953 | ||||||
| Net Investment Gain (Loss) | (91,641 | ) | 152,779 | |||||
| Realized and Unrealized Gain on Investments: | ||||||||
| Net Realized Gain on Investments | 1,814,503 | 633,032 | ||||||
| Net Change in Net Unrealized Appreciation on Investments | 860,883 | 16,257,131 | ||||||
| Net Realized and Unrealized Gain on Investments | 2,675,386 | 16,890,163 | ||||||
| Net Increase in Net Assets from Operations | $ | 2,583,745 | $ | 17,042,942 | ||||
| The accompanying notes are an integral part of these financial statements. |
2023 Semi-Annual Report 16
| Paradigm Funds | ||||
| Statement of Assets and Liabilities (Unaudited) | Micro-Cap | |||
| June 30, 2023 | Fund | |||
| Assets: | ||||
| Investment Securities at Fair Value* | $ | 134,345,126 | ||
| Receivable for Fund Shares Sold | 538,133 | |||
| Receivable for Securities Sold | 168,028 | |||
| Dividends Receivable | 32,951 | |||
| Total Assets | 135,084,238 | |||
| Liabilities: | ||||
| Payable for Fund Shares Redeemed | 8,665 | |||
| Payable for Securities Purchased | 743,102 | |||
| Payable to Advisor | 131,831 | |||
| Total Liabilities | 883,598 | |||
| Net Assets | $ | 134,200,640 | ||
| Net Assets Consist of: | ||||
| Paid In Capital | $ | 77,713,419 | ||
| Total Distributable Earnings | 56,487,221 | |||
| Net Assets | $ | 134,200,640 | ||
| Net Asset Value, Offering and Redemption Price (Note 2) | $ | 50.02 | ||
| * Investments at Identified Cost | $ | 80,431,172 | ||
| Shares Outstanding (Unlimited number of shares | 2,682,812 | |||
| authorized without par value) | ||||
| Statement of Operations (Unaudited) | ||||
| For the six month period ended June 30, 2023 | ||||
| Investment Income: | ||||
| Dividends (Net of foreign taxes $882) | $ | 231,901 | ||
| Total Investment Income | 231,901 | |||
| Expenses: | ||||
| Investment Advisor Fees | 752,826 | |||
| Total Expenses | 752,826 | |||
| Net Investment Loss | (520,925 | ) | ||
| Realized and Unrealized Gain on Investments: | ||||
| Net Realized Gain on Investments | 3,874,630 | |||
| Net Change in Net Unrealized Appreciation on Investments | 14,376,054 | |||
| Net Realized and Unrealized Gain on Investments | 18,250,684 | |||
| Net Increase in Net Assets from Operations | $ | 17,729,759 | ||
The accompanying notes are an integral part of these
financial statements.
2023 Semi-Annual Report 17
| Paradigm Funds | ||||||||||||||||
| Statements of Changes in Net Assets | Value Fund | Select Fund | ||||||||||||||
| (Unaudited) | (Unaudited) | |||||||||||||||
| 1/1/2023 | 1/1/2022 | 1/1/2023 | 1/1/2022 | |||||||||||||
| to | to | to | to | |||||||||||||
| 6/30/2023 | 12/31/2022 | 6/30/2023 | 12/31/2022 | |||||||||||||
| From Operations: | ||||||||||||||||
| Net Investment Gain (Loss) | $ | (91,641 | ) | $ | (265,268 | ) | $ | 152,779 | $ | (42,514 | ) | |||||
| Capital Gain Distributions from Real Estate Investment | ||||||||||||||||
| Trusts | - | 2,581 | - | 1,951 | ||||||||||||
| Net Realized Gain (Loss) on Investments | 1,814,503 | 4,162,466 | 633,032 | (3,314,366 | ) | |||||||||||
| Net Change in Unrealized Appreciation on Investments | 860,883 | (18,827,720 | ) | 16,257,131 | (38,898,756 | ) | ||||||||||
| Net Increase (Decrease) in Net Assets from Operations | 2,583,745 | (14,927,941 | ) | 17,042,942 | (42,253,685 | ) | ||||||||||
| From Distributions to Shareholders: | - | (3,896,762 | ) | - | (8,963 | ) | ||||||||||
| From Capital Share Transactions: | ||||||||||||||||
| Proceeds From Sale of Shares | 655,154 | 4,062,987 | 13,068,317 | 48,509,238 | ||||||||||||
| Proceeds from Redemption Fees (Note 2) | 570 | 7,270 | 1,684 | 51,067 | ||||||||||||
| Shares Issued on Reinvestment of Dividends | - | 3,820,161 | - | 8,741 | ||||||||||||
| Cost of Shares Redeemed | (2,963,188 | ) | (16,745,478 | ) | (16,257,614 | ) | (61,342,509 | ) | ||||||||
| Net Decrease from Shareholder Activity | (2,307,464 | ) | (8,855,060 | ) | (3,187,613 | ) | (12,773,463 | ) | ||||||||
| Net Increase (Decrease) in Net Assets | 276,281 | (27,679,763 | ) | 13,855,329 | (55,036,111 | ) | ||||||||||
| Net Assets at Beginning of Period | 48,520,271 | 76,200,034 | 93,490,725 | 148,526,836 | ||||||||||||
| Net Assets at End of Period | $ | 48,796,552 | $ | 48,520,271 | $ | 107,346,054 | $ | 93,490,725 | ||||||||
| Share Transactions: | ||||||||||||||||
| Issued | 12,460 | 65,621 | 213,462 | 748,194 | ||||||||||||
| Reinvested | - | 72,599 | - | 159 | ||||||||||||
| Redeemed | (55,443 | ) | (277,652 | ) | (268,889 | ) | (1,036,528 | ) | ||||||||
| Net Decrease in Shares | (42,983 | ) | (139,432 | ) | (55,427 | ) | (288,175 | ) | ||||||||
| Shares Outstanding Beginning of Period | 927,346 | 1,066,778 | 1,712,100 | 2,000,275 | ||||||||||||
| Shares Outstanding End of Period | 884,363 | 927,346 | 1,656,673 | 1,712,100 | ||||||||||||
The accompanying notes are an integral part of these |
2023 Semi-Annual Report 18
| Paradigm Funds | ||||||||
| Statements of Changes in Net Assets | Micro-Cap Fund | |||||||
| (Unaudited) | ||||||||
| 1/1/2023 | 1/1/2022 | |||||||
| to | to | |||||||
| 6/30/2023 | 12/31/2022 | |||||||
| From Operations: | ||||||||
| Net Investment Loss | $ | (520,925 | ) | $ | (1,103,783 | ) | ||
| Net Realized Gain (Loss) on Investments | 3,874,630 | (700,208 | ) | |||||
| Net Change in Unrealized Appreciation on Investments | 14,376,054 | (30,629,145 | ) | |||||
| Net Increase (Decrease) in Net Assets from Operations | 17,729,759 | (32,433,136 | ) | |||||
| From Distributions to Shareholders: | - | - | ||||||
| From Capital Share Transactions: | ||||||||
| Proceeds From Sale of Shares | 5,972,453 | 8,191,171 | ||||||
| Proceeds from Redemption Fees (Note 2) | 1,989 | 35,061 | ||||||
| Shares Issued on Reinvestment of Dividends | - | - | ||||||
| Cost of Shares Redeemed | (2,833,259 | ) | (22,509,702 | ) | ||||
| Net Increase (Decrease) from Shareholder Activity | 3,141,183 | (14,283,470 | ) | |||||
| Net Increase (Decrease) in Net Assets | 20,870,942 | (46,716,606 | ) | |||||
| Net Assets at Beginning of Period | 113,329,698 | 160,046,304 | ||||||
| Net Assets at End of Period | $ | 134,200,640 | $ | 113,329,698 | ||||
| Share Transactions: | ||||||||
| Issued | 128,061 | 174,760 | ||||||
| Reinvested | - | - | ||||||
| Redeemed | (61,363 | ) | (491,471 | ) | ||||
| Net Increase (Decrease) in Shares | 66,698 | (316,711 | ) | |||||
| Shares Outstanding Beginning of Period | 2,616,114 | 2,932,825 | ||||||
| Shares Outstanding End of Period | 2,682,812 | 2,616,114 | ||||||
| The accompanying notes are an integral part of these financial statements. |
2023 Semi-Annual Report 19
| Paradigm Value Fund | ||||||||||||||||||||||||
| Financial Highlights | ||||||||||||||||||||||||
| (Unaudited) | ||||||||||||||||||||||||
| Selected data for a share outstanding | 1/1/2023 | 1/1/2022 | 1/1/2021 | 1/1/2020 | 1/1/2019 | 1/1/2018 | ||||||||||||||||||
| throughout the period: | to | to | to | to | to | to | ||||||||||||||||||
| 6/30/2023 | 12/31/2022 | 12/31/2021 | 12/31/2020 | 12/31/2019 | 12/31/2018 | |||||||||||||||||||
| Net Asset Value - Beginning of Period | $ | 52.32 | $ | 71.43 | $ | 56.29 | $ | 48.83 | $ | 41.94 | $ | 48.96 | ||||||||||||
| Net Investment Income (Loss) (a) | (0.10 | ) | (0.29 | ) | (0.53 | ) | (0.14 | ) | 0.05 | (0.10 | ) | |||||||||||||
| Net Gain (Loss) on Investments (Realized and Unrealized) | 2.96 | (14.28 | ) | 17.56 | 8.81 | 9.29 | (0.98 | ) | ||||||||||||||||
| Total from Investment Operations | 2.86 | (14.57 | ) | 17.03 | 8.67 | 9.34 | (1.08 | ) | ||||||||||||||||
| Distributions (From Net Investment Income) | - | - | - | (0.04 | ) | (0.02 | ) | - | ||||||||||||||||
| Distributions (From Capital Gains) | - | (4.55 | ) | (1.91 | ) | (1.18 | ) | (2.43 | ) | (5.95 | ) | |||||||||||||
| Total Distributions | - | (4.55 | ) | (1.91 | ) | (1.22 | ) | (2.45 | ) | (5.95 | ) | |||||||||||||
| Proceeds from Redemption Fees (Note 2) | - | + | 0.01 | 0.02 | 0.01 | - | + | 0.01 | ||||||||||||||||
| Net Asset Value - End of Period | $ | 55.18 | $ | 52.32 | $ | 71.43 | $ | 56.29 | $ | 48.83 | $ | 41.94 | ||||||||||||
| Total Return (b) | 5.47 | % | * | (20.42 | )% | 30.30 | % | 17.78 | % | 22.27 | % | (2.07 | )% | |||||||||||
| Ratios/Supplemental Data | ||||||||||||||||||||||||
| Net Assets - End of Period (Thousands) | $ | 48,797 | $ | 48,520 | $ | 76,200 | $ | 57,693 | $ | 54,889 | $ | 51,431 | ||||||||||||
| Ratio of Expenses to Average Net Assets | 1.50 | % | ** | 1.50 | % | 1.50 | % | 1.50 | % | 1.50 | % | 1.50 | % | |||||||||||
| Ratio of Net Investment Income (Loss) to Average | ||||||||||||||||||||||||
| Net Assets | (0.39 | )% | ** | (0.50 | )% | (0.78 | )% | (0.32 | )% | 0.12 | % | (0.18 | )% | |||||||||||
| Portfolio Turnover Rate | 3.46 | % | * | 1.87 | % | 10.61 | % | 11.64 | % | 12.31 | % | 20.54 | % | |||||||||||
| Paradigm Select Fund | ||||||||||||||||||||||||
| Financial Highlights | ||||||||||||||||||||||||
| (Unaudited) | ||||||||||||||||||||||||
| Selected data for a share outstanding throughout the period: | 1/1/2023 | 1/1/2022 | 1/1/2021 | 1/1/2020 | 1/1/2019 | 1/1/2018 | ||||||||||||||||||
| to | to | to | to | to | to | |||||||||||||||||||
| 6/30/2023 | 12/31/2022 | 12/31/2021 | 12/31/2020 | 12/31/2019 | 12/31/2018 | |||||||||||||||||||
| Net Asset Value - Beginning of Period | $ | 54.61 | $ | 74.25 | $ | 56.71 | $ | 45.04 | $ | 32.75 | $ | 37.44 | ||||||||||||
| Net Investment Income (Loss) (a) | 0.10 | (0.02 | ) | (0.19 | ) | (0.11 | ) | 0.01 | 0.01 | |||||||||||||||
| Net Gain (Loss) on Investments (Realized and Unrealized) | 10.09 | (19.64 | ) | 17.78 | 11.83 | 12.54 | (3.74 | ) | ||||||||||||||||
| Total from Investment Operations | 10.19 | (19.66 | ) | 17.59 | 11.72 | 12.55 | (3.73 | ) | ||||||||||||||||
| Distributions (From Net Investment Income) | - | - | - | - | + | (0.01 | ) | - | ||||||||||||||||
| Distributions (From Capital Gains) | - | (0.01 | ) | (0.13 | ) | (0.06 | ) | (0.25 | ) | (0.96 | ) | |||||||||||||
| Total Distributions | - | (0.01 | ) | (0.13 | ) | (0.06 | ) | (0.26 | ) | (0.96 | ) | |||||||||||||
| Proceeds from Redemption Fees (Note 2) | - | + | 0.03 | 0.08 | 0.01 | - | + | - | ||||||||||||||||
| Net Asset Value - End of Period | $ | 64.80 | $ | 54.61 | $ | 74.25 | $ | 56.71 | $ | 45.04 | $ | 32.75 | ||||||||||||
| Total Return (b) | 18.66 | % | * | (26.44 | )% | 31.16 | % | 26.05 | % | 38.32 | % | (9.93 | )% | |||||||||||
| Ratios/Supplemental Data | ||||||||||||||||||||||||
| Net Assets - End of Period (Thousands) | $ | 107,346 | $ | 93,491 | $ | 148,527 | $ | 64,970 | $ | 36,744 | $ | 23,323 | ||||||||||||
| Before Reimbursement | ||||||||||||||||||||||||
| Ratio of Expenses to Average Net Assets | 1.50 | % | ** | 1.50 | % | 1.50 | % | 1.50 | % | 1.50 | % | 1.50 | % | |||||||||||
| After Reimbursement | ||||||||||||||||||||||||
| Ratio of Expenses to Average Net Assets (c) | 1.15 | % | ** | 1.15 | % | 1.15 | % | 1.15 | % | 1.15 | % | 1.15 | % | |||||||||||
| Ratio of Net Investment Income (Loss) to Average | ||||||||||||||||||||||||
| Net Assets (c) | 0.33 | % | ** | (0.04 | )% | (0.28 | )% | (0.26 | )% | 0.03 | % | 0.03 | % | |||||||||||
| Portfolio Turnover Rate | 5.87 | % | * | 29.45 | % | 8.64 | % | 11.10 | % | 15.27 | % | 20.28 | % | |||||||||||
| * Not Annualized. ** Annualized. (a) Per share amount calculated using the average shares method. (b) Total return represents the rate that the investor would have earned or lost on an investment in the Fund assuming reinvestment of dividends. Returns do not reflect the deduction of taxes a shareholder would pay on Fund distributions or redemption of Fund shares. (c) Such percentages reflect an expense waiver by the Advisor. See Note 4. + Amount calculated is less than $0.005. |
| The accompanying notes are an integral part of these financial statements. |
2023 Semi-Annual Report 20
| Paradigm Micro-Cap Fund | ||||||||||||||||||||||||
| Financial Highlights | ||||||||||||||||||||||||
| (Unaudited) | ||||||||||||||||||||||||
| Selected data for a share outstanding throughout the period: | 1/1/2023 | 1/1/2022 | 1/1/2021 | 1/1/2020 | 1/1/2019 | 1/1/2018 | ||||||||||||||||||
| to | to | to | to | to | to | |||||||||||||||||||
| 6/30/2023 | 12/31/2022 | 12/31/2021 | 12/31/2020 | 12/31/2019 | 12/31/2018 | |||||||||||||||||||
| Net Asset Value - Beginning of Period | $ | 43.32 | 54.57 | 43.13 | $ | 30.91 | $ | 25.26 | $ | 32.40 | ||||||||||||||
| Net Investment Loss (a) | (0.20 | ) | (0.41 | ) | (0.47 | ) | (0.15 | ) | (0.02 | ) | (0.23 | ) | ||||||||||||
| Net Gain (Loss) on Investments (Realized and Unrealized) | 6.90 | (10.85 | ) | 12.51 | 14.63 | 5.67 | (3.35 | ) | ||||||||||||||||
| Total from Investment Operations | 6.70 | (11.26 | ) | 12.04 | 14.48 | 5.65 | (3.58 | ) | ||||||||||||||||
| Distributions (From Net Investment Income) | - | - | - | - | - | - | ||||||||||||||||||
| Distributions (From Capital Gains) | - | - | (0.61 | ) | (2.26 | ) | - | + | (3.56 | ) | ||||||||||||||
| Total Distributions | - | - | (0.61 | ) | (2.26 | ) | - | (3.56 | ) | |||||||||||||||
| Proceeds from Redemption Fees (Note 2) | - | + | 0.01 | 0.01 | - | + | - | - | ||||||||||||||||
| Net Asset Value - End of Period | $ | 50.02 | $ | 43.32 | $ | 54.57 | $ | 43.13 | $ | 30.91 | $ | 25.26 | ||||||||||||
| Total Return (b) | 15.47 | % | * | (20.62 | )% | 27.94 | % | 46.85 | % | 22.38 | % | (10.96 | )% | |||||||||||
| Ratios/Supplemental Data | ||||||||||||||||||||||||
| Net Assets - End of Period (Thousands) | $ | 134,201 | $ | 113,330 | $ | 160,046 | $ | 98,405 | $ | 63,506 | $ | 44,346 | ||||||||||||
| Ratio of Expenses to Average Net Assets | 1.25 | % | ** | 1.25 | % | 1.25 | % | 1.25 | % | 1.25 | % | 1.25 | % | |||||||||||
| Ratio of Net Investment Loss to Average | ||||||||||||||||||||||||
| Net Assets | (0.86 | )% | ** | (0.92 | )% | (0.91 | )% | (0.48 | )% | (0.06 | )% | (0.67 | )% | |||||||||||
| Portfolio Turnover Rate | 14.58 | % | * | 34.91 | % | 46.02 | % | 81.04 | % | 86.09 | % | 111.47 | % | |||||||||||
| * Not Annualized. ** Annualized. (a) Per share amount calculated using the average shares method. (b) Total return represents the rate that the investor would have earned or lost on an investment in the Fund assuming reinvestment of dividends. Returns do not reflect the deduction of taxes a shareholder would pay on Fund distributions or redemption of Fund shares. + Amount calculated is less than $0.005. |
| The accompanying notes are an integral part of these financial statements. |
2023 Semi-Annual Report 21
| NOTES TO FINANCIAL STATEMENTS PARADIGM FUNDS June 30, 2023 (Unaudited) |
1.) ORGANIZATION
Paradigm Funds (the “Trust”) is an open-end management investment company that was organized in Ohio as a business trust on September 13, 2002, that offers shares of beneficial interest in a number of separate series, each series representing a distinct fund with its own investment objectives and policies. The Paradigm Value Fund (“Value”) commenced operations on January 1, 2003. Value’s investment objective is long-term capital appreciation. The Paradigm Select Fund (“Select”) commenced operations on January 1, 2005. Select’s investment objective is long-term capital appreciation. The Paradigm Micro-Cap Fund (“Micro-Cap”) commenced operations on January 1, 2008. Micro-Cap’s investment objective is long-term capital appreciation. Under normal circumstances, Micro-Cap invests at least 80% of its net assets in the common stocks of U.S. micro-cap companies. Value, Select and Micro-Cap are all diversified funds. The advisor to Value, Select and Micro-Cap (each a “Fund” and collectively the “Funds”) is Paradigm Funds Advisor LLC (the “Advisor”).
2.) SIGNIFICANT ACCOUNTING POLICIES
The Funds are investment companies and accordingly follow the investment company accounting and reporting guidance of the Financial Accounting Standards Board (“FASB”) Accounting Standards Codification Topic 946 Financial Services - Investment Companies. The financial statements are prepared in conformity with accounting principles generally accepted in the United States of America (“GAAP”). The Funds follow the significant accounting policies described in this section.
SECURITY VALUATION: All investments in securities are recorded at their estimated fair value, as described in Note 3.
SECURITY TRANSACTIONS AND OTHER: Security transactions are recorded based on the trade date for financial statement reporting purposes. Dividend income is recognized on the ex-dividend date. Interest income, if any, is recognized on an accrual basis. The Funds use the highest cost basis which is a form of specific identification in computing gain or loss on sale of investment securities. Withholding taxes on foreign dividends have been provided for in accordance with the Funds’ understanding of the applicable country’s tax rules and rates. The Funds may invest in real estate investment trusts (“REITs”) that pay distributions to their shareholders based on available funds from operations. It is common for these distributions to exceed the REITs’ taxable earnings and profits resulting in the excess portion of such distribution to be designated as return of capital. Distributions received from REITs are generally recorded as dividend income and, if necessary, are reclassified annually in accordance with tax information provided by the underlying REITs.
SHARE VALUATION: Each Fund’s net asset value (the “NAV”) is calculated as of the close of trading on the New York Stock Exchange (the “Exchange”) (normally 4:00 p.m. Eastern time) every day the Exchange is open. The NAV for each Fund is calculated by taking the total value of the Fund’s assets, subtracting its liabilities, and then dividing by the total number of shares outstanding, rounded to the nearest cent. The offering price and redemption price per share is equal to the net asset value per share, except that shares of each Fund are subject to a redemption fee of 2% if redeemed within 90 days or less of purchase. During the six month period ended June 30, 2023, proceeds from redemption fees were $570, $1,684 and $1,989 for Value, Select and Micro-Cap, respectively.
INCOME TAXES: The Funds’ policy is to comply with the requirements of the Internal Revenue Code that are applicable to regulated investment companies and to distribute all of their taxable income to shareholders. Therefore, no federal income tax provision is required. It is the Funds’ policy to distribute annually, prior to the end of the calendar year, dividends sufficient to satisfy excise tax requirements of the Internal Revenue Code. This Internal Revenue Code requirement may cause an excess of distributions over the book year-end accumulated income. In addition, it is the Funds’ policy to distribute annually, after the end of the fiscal year, any remaining net investment income and net realized capital gains.
The Funds recognize the tax benefits of certain tax positions only where the position is “more likely than not” to be sustained assuming examination by tax authorities. Management has analyzed the Funds’ tax positions, and has concluded that no liability for unrecognized tax benefits should be recorded related to uncertain tax positions taken on returns filed for open tax years. The Funds identify their major tax jurisdictions as U.S. Federal and New York State tax authorities; the Funds are not aware of any tax positions for which it is
2023 Semi-Annual Report 22
Notes to Financial Statements (Unaudited) - continued
reasonably possible that the total amounts of unrecognized tax benefits will change materially in the next twelve months. The Funds recognize interest and penalties, if any, related to unrecognized tax benefits as income tax expense in the Statements of Operations. During the six month period ended June 30, 2023, the Funds did not incur any interest or penalties.
ESTIMATES: The financial statements are prepared in accordance with GAAP, which requires management to make estimates and assumptions that affect the reported amounts of assets and liabilities and disclosure of contingent assets and liabilities at the date of the financial statements and the reported amounts of increases and decreases in net assets from operations during the reporting period. Actual results could differ from those estimates.
DISTRIBUTIONS TO SHAREHOLDERS: Distributions to shareholders, which are determined in accordance with income tax regulations, are recorded on the ex-dividend date. The Funds may utilize earnings and profits distributed to shareholders on redemptions of shares as part of the dividends paid deduction. The treatment for financial reporting purposes of distributions made to shareholders during the year from net investment income or net realized capital gains may differ from their ultimate treatment for federal income tax purposes. These differences are caused primarily by differences in the timing of recognition of certain components of income, expense or realized capital gain for federal income tax purposes. Where such differences are permanent in nature, they are reclassified in the components of the net assets based on their ultimate characterization for federal income tax purposes. Any such reclassification will have no effect on net assets, results of operations or net asset values per share of any Fund.
3.) SECURITIES VALUATIONS
The Funds utilize various methods to measure the fair value of their investments on a recurring basis. GAAP establishes a hierarchy that prioritizes inputs to valuation methods. The three levels of inputs are:
Level 1 - Unadjusted quoted prices in active markets for identical assets or liabilities.
Level 2 - Observable inputs other than quoted prices included in level 1 that are observable for the asset or liability, either directly or indirectly. These inputs may include quoted prices for the identical instrument on an inactive market, prices for similar instruments, interest rates, prepayment speeds, credit risk, yield curves, default rates and similar data.
Level 3 - Unobservable inputs for the asset or liability, to the extent relevant observable inputs are not available, representing the Funds’ own assumptions about the assumptions a market participant would use in valuing the assets or liabilities, and would be based on the best information available.
The availability of inputs can vary from security to security and is affected by a wide variety of factors, including, for example, the type of security, whether the security is new and not yet established in the marketplace, the liquidity of markets, and other characteristics particular to the security. To the extent that valuation is based on models or inputs that are less observable or unobservable in the market, the determination of fair value requires more judgment. Accordingly, the degree of judgment exercised in determining fair value is greatest for instruments categorized in level 3.
The inputs used to measure fair value may fall into different levels of the fair value hierarchy. In such cases, for disclosure purposes, the level in the fair value hierarchy within which the fair value measurement falls in its entirety, is determined based on the lowest level input that is significant to the fair value measurement in its entirety.
FAIR VALUE MEASUREMENTS:
A description of the valuation techniques applied to the Funds’ major categories of assets measured at fair value on a recurring basis follows.
Equity securities (common stocks and REITs). Equity securities generally are valued by using market quotations, but may be valued on the basis of prices furnished by a pricing service when the Valuation Committee believes such prices accurately reflect the fair value of such securities. Securities that are traded on any stock exchange or on the NASDAQ over-the-counter market are generally valued by the pricing service at the last quoted sale price. Lacking a last sale price, an equity security is generally valued by the pricing service at its last bid price. Generally, if the security is traded in an active market and is valued at the last sale price, the security is categorized as a level 1 security, and if an equity security is valued by the pricing service at its last bid, it is generally categorized as a level 2 security. When market quotations are not readily
2023 Semi-Annual Report 23
Notes to Financial Statements (Unaudited) - continued
available, when the Valuation Committee determines that the market quotation or the price provided by the pricing service does not accurately reflect the current fair value, or when restricted securities are being valued, such securities are valued as determined in good faith by the Valuation Committee, subject to review of the Board of Trustees (the “Trustees” or the “Board”) and are categorized in level 2 or level 3, when appropriate.
Money market funds. Money market funds are valued at net asset value provided by the underlying funds and are classified in level 1 of the fair value hierarchy.
In accordance with the Trust’s Valuation and Fair Value Pricing Policies and Procedures, the Valuation Committee is required to consider all appropriate factors relevant to the value of securities for which it has determined other pricing sources are not available or reliable as described above. There is no single standard for determining fair value, since fair value depends upon the circumstances of each individual case. As a general principle, the current fair value of an issue of securities being valued by the Valuation Committee would appear to be the amount which the owner might reasonably expect to receive for them upon their current sale. Methods which are in accordance with this principle may, for example, be based on (i) a multiple of earnings; (ii) a discount from market of a similar freely traded security (including a derivative security or a basket of securities traded on other markets, exchanges or among dealers); or (iii) yield to maturity with respect to debt issues, or a combination of these and other methods. The Board maintains responsibilities for the fair value determinations under Rule 2a-5 under the Investment Company Act of 1940 (the "1940 Act") and oversees the Valuation Committee.
The following tables summarize the inputs used to value each Fund’s assets measured at fair value as of June 30, 2023:
| Value: | ||||||||
| Valuation Inputs of Assets | Level 1 | Level 2 | Level 3 | Total | ||||
| Common Stocks | $46,695,319 | $- | $- | $46,695,319 | ||||
| Real Estate Investment Trusts | 1,662,867 | - | - | 1,662,867 | ||||
| Money Market Funds | 442,187 | - | - | 442,187 | ||||
| Total | $48,800,373 | $- | $- | $48,800,373 | ||||
| Select: | ||||||||
| Valuation Inputs of Assets | Level 1 | Level 2 | Level 3 | Total | ||||
| Common Stocks | $97,156,230 | $- | $- | $97,156,230 | ||||
| Real Estate Investment Trusts | 1,275,624 | - | - | 1,275,624 | ||||
| Money Market Funds | 6,443,591 | - | - | 6,443,591 | ||||
| Total | $104,875,445 | $- | $- | $104,875,445 | ||||
| Micro-Cap: | ||||||||
| Valuation Inputs of Assets | Level 1 | Level 2 | Level 3 | Total | ||||
| Common Stocks | $125,681,868 | $ – | $ – | $125,681,868 | ||||
| Contingent Value Rights | – | – | 165,000 | 165,000 | ||||
| Money Market Funds | 8,498,258 | – | – | 8,498,258 | ||||
| Total | $134,180,126 | $ – | $165,000 | $134,345,126 | ||||
The Funds did not hold any material level 3 assets during the six month period ended June 30, 2023. As of June 30, 2023, level 3 contingent value rights held in Micro-Cap represented 0.12% of the Fund's net assets. A reconciliation of level 3 investments, including certain disclosures related to significant inputs used in valuing level 3 investments, is therefore excluded.
The Funds did not invest in derivative instruments during the six month period ended June 30, 2023.
4.) INVESTMENT ADVISORY AGREEMENTS
The Trust, with respect to each of the Funds, has an investment advisory agreement (collectively the “Management Agreements”) with the Advisor. Under the terms of the Management Agreements, the Advisor manages the investment portfolios of the Funds, subject to policies adopted by the Trustees. Under the Management Agreements, the Advisor, at its own expense and without reimbursement from the Trust, furnishes office space and all necessary office facilities, equipment and executive personnel necessary for managing the assets of the Funds. The Advisor pays all operating expenses of the Funds with the exception of taxes, brokerage fees and commissions, borrowing costs (such as interest and dividend expenses on
2023 Semi-Annual Report 24
Notes to Financial Statements (Unaudited) - continued
securities sold short) and such extraordinary or non-recurring expenses as may arise, including litigation to which the Fund may be a party and indemnification of the Trustees and Trust officers with respect thereto. The Funds will also pay expenses that they are authorized to pay pursuant to Rule 12b-1 under the 1940 Act, as amended (none are currently authorized). The Advisor also pays the salaries and fees of all of its officers and employees that serve as Trustees and Trust Officers. For its services and payment of certain Fund expenses as described below, the Advisor receives an annual investment management fee of 1.50%, 1.50% and 1.25% of the average daily net assets from Value, Select and Micro-Cap, respectively. The Advisor’s investment management fee is accrued daily and is typically paid monthly. As a result of the above calculations, for the six month period ended June 30, 2023, the Advisor earned management fees (before the waivers described below) totaling $355,508, $700,373 and $752,826 for Value, Select and Micro-Cap, respectively. At June 30, 2023, $58,616, $92,819 and $131,831 was due to the Advisor from Value, Select and Micro-Cap, respectively. The Advisor has contractually agreed to waive management fees and/or reimburse Select to the extent necessary to maintain total annual operating expenses of the Fund (excluding brokerage fees and commissions, interest and other borrowing expenses, taxes, extraordinary expenses and indirect costs of investing in acquired funds) at 1.15% of daily net assets through April 30, 2024. The Advisor waived $163,420 for the six month period ended June 30, 2023, for Select, pursuant to its contractual agreement. There is no recapture provision to this waiver.
5.) RELATED PARTY TRANSACTIONS
Certain officers and shareholders of the Advisor are also officers and/or a Trustee of the Trust. These individuals may receive benefits from the Advisor resulting from management fees paid to the Advisor from the Funds.
The Trustees who are not interested persons of the Funds were each paid $4,000, for a total of $16,000, in Trustees fees for the six month period ended June 30, 2023, for the Trust. Under the Management Agreements, the Advisor pays these fees.
6.) INVESTMENTS
For the six month period ended June 30, 2023, purchases and sales of investment securities other than U.S. government obligations and short-term investments were as follows:
| Value | Select | Micro-Cap | ||||
| Purchases | $1,627,223 | $5,430,375 | $16,966,214 | |||
| Sales | $3,784,659 | $14,637,347 | $19,523,306 |
There were no purchases or sales of U.S. government obligations.
7.) CONTROL OWNERSHIP
The beneficial ownership, either directly or indirectly, of more than 25% of the voting shares of a fund creates a presumption of control of the fund, under section 2(a)(9) of the 1940 Act. At June 30, 2023, National Financial Services, LLC, located at 200 Liberty Street, New York, New York, for the benefit of its customers, held, in aggregate, 28.03% of Value, and therefore also may be deemed to control Value. Candace King Weir, beneficial owner located at 9 Elk Street, Albany, New York 12207, held, in aggregate, 35.52%, of Select, and therefore may be deemed to control Select. Candace King Weir, beneficial owner located at 9 Elk Street, Albany, New York 12207, held, in aggregate, 72.07% of Micro-Cap, and therefore may be deemed to control Micro-Cap.
8.) TAX MATTERS
For federal income tax purposes, at June 30, 2023, the cost of securities on a tax basis and the composition of gross unrealized appreciation (the excess of value over tax cost) and depreciation (the excess of tax cost over value) were as follows:
| Value | Select | Micro-Cap | |||||||
| Cost of Investments | $18,952,030 | $77,353,978 | $80,431,172 | ||||||
| Gross Unrealized Appreciation | $30,348,859 | $34,589,341 | $58,757,843 | ||||||
| Gross Unrealized Depreciation | (500,516 | ) | (7,067,874 | ) | (4,843,889 | ) | |||
| Net Unrealized Appreciation | |||||||||
| (Depreciation) on Investments | $29,848,343 | $27,521,467 | $53,913,954 | ||||||
2023 Semi-Annual Report 25
Notes to Financial Statements (Unaudited) - continued
The tax character of distributions paid during the six month period ended June 30, 2023, and the fiscal year ended December 31, 2022 were as follows:
| Six Months Ended | Fiscal Year Ended | ||
| June 30, 2023 | December 31, 2022 | ||
| Value | |||
| Ordinary Income | $ – | $ – | |
| Long-term Capital Gain | – | 3,896,762 | |
| $ – | $3,896,762 | ||
| Select | |||
| Ordinary Income | $ – | $ – | |
| Long-term Capital Gain | – | 8,963 | |
| $ – | $ 8,963 | ||
| Micro-Cap | |||
| Ordinary Income | $ – | $ – | |
| Long-term Capital Gain | – | – | |
| $ – | $ – | ||
9.) SECTOR CONCENTRATION RISK
If a Fund has significant investments in the securities of issuers in industries within a particular sector, any development affecting that sector will have a greater impact on the value of the net assets of the Fund than would be the case if the Fund did not have significant investments in that sector. In addition, this may increase the risk of loss of an investment in the Fund and increase the volatility of the Fund’s NAV per share. From time to time, circumstances may affect a particular sector and the companies within such sector. For instance, economic or market factors, regulation or deregulation, and technological or other developments may negatively impact all companies in a particular sector and therefore the value of a Fund’s portfolio will be adversely affected. As of June 30, 2023, Value had 38% of its equity securities held invested in stocks within the Information Technology sector; Select had had 38% and 31% of its equity securities held invested in stocks within the Information Technology sector and the Industrials sector, respectively; and Micro-Cap had 49% and 27% of its equity securities held invested in stocks within the Information Technology sector and the Health Care sector, respectively.
10.) SUBSEQUENT EVENTS
Subsequent events after the date of the Statements of Assets and Liabilities have been evaluated through the date the financial statements were issued. Management has concluded that there is no impact requiring adjustment to or disclosure in the financial statements.
2023 Semi-Annual Report 26
| DISCLOSURE OF EXPENSES (Unaudited) |
The ongoing costs to shareholders associated with the Paradigm Value Fund, Paradigm Select Fund and Paradigm Micro-Cap Fund consist solely of management fees. Although the Funds charge no sales loads or transaction fees, you will be assessed fees for outgoing wire transfers, returned checks and stop payment orders at prevailing rates charged by Mutual Shareholder Services, LLC, the Funds’ transfer agent. IRA accounts will be charged an $8.00 annual maintenance fee. If shares are redeemed within 90 days of purchase from the Funds, the shares are subject to a 2% redemption fee. Additionally, your account will be indirectly subject to the expenses of any underlying funds, if any. The following example is intended to help you understand your ongoing costs of investing in the Funds and to compare these costs with similar costs of investing in other mutual funds. The example is based on an investment of $1,000 invested in the Funds on January 1, 2023, and held through June 30, 2023.
The first line of each table below provides information about actual account values and actual expenses. In order to estimate the expenses a shareholder paid during the period covered by this report, shareholders can divide their account value by $1,000 (for example, an $8,600 account value divided by $1,000 = 8.6) and then multiply the result by the number in the first line under the heading entitled “Expenses Paid During the Period.”
The second line of each table below provides information about hypothetical account values and hypothetical expenses based on the Funds’ actual expense ratios and an assumed rate of return of 5% per year before expenses, which is not the Funds’ actual return. The hypothetical account values and expenses may not be used to estimate the actual ending account balance or expenses paid by a shareholder for the period. Shareholders may use this information to compare the ongoing costs of investing in the Funds and other funds. In order to do so, compare these 5% hypothetical examples with the 5% hypothetical examples that appear in other funds’ shareholder reports.
Please note that the expenses shown in the table are meant to highlight your ongoing costs only and do not reflect any indirect expenses from underlying funds or transactional costs, such as the annual maintenance fee charged to IRA accounts, redemption fees, or exchange fees. Therefore, the second line of the table is useful in comparing ongoing costs only, and will not help you determine the relative total costs of owning different funds. In addition, if these transactional costs were included, your costs would have been higher.
| PARADIGM VALUE FUND | ||||||
| Expenses Paid | ||||||
| Beginning | Ending | During the Period* | ||||
| Account Value | Account Value | January 1, 2023 | ||||
| January 1, 2023 | June 30, 2023 | to June 30, 2023 | ||||
| Actual | $1,000.00 | $1,054.66 | $7.64 | |||
| Hypothetical | $1,000.00 | $1,017.36 | $7.50 | |||
| (5% annual return | ||||||
| before expenses) | ||||||
* Expenses are equal to the Fund’s annualized expense ratio of 1.50%, multiplied by the average
account value over the period, multiplied by 181/365 (to reflect the one-half year period).
| PARADIGM SELECT FUND | ||||||
| Expenses Paid | ||||||
| Beginning | Ending | During the Period* | ||||
| Account Value | Account Value | January 1, 2023 | ||||
| January 1, 2023 | June 30, 2023 | to June 30, 2023 | ||||
| Actual | $1,000.00 | $1,186.60 | $6.23 | |||
| Hypothetical | $1,000.00 | $1,019.09 | $5.76 | |||
| (5% annual return | ||||||
| before expenses) | ||||||
* Expenses are equal to the Fund’s annualized expense ratio of 1.15%, multiplied by the average
account value over the period, multiplied by 181/365 (to reflect the one-half year period).
2023 Semi-Annual Report 27
| Disclosure of Expenses (Unaudited) - continued | ||||||
| PARADIGM MICRO-CAP FUND | ||||||
| Expenses Paid | ||||||
| Beginning | Ending | During the Period* | ||||
| Account Value | Account Value | January 1, 2023 | ||||
| January 1, 2023 | June 30, 2023 | to June 30, 2023 | ||||
| Actual | $1,000.00 | $1,154.66 | $6.68 | |||
| Hypothetical | $1,000.00 | $1,018.60 | $6.26 | |||
| (5% annual return | ||||||
| before expenses) | ||||||
| * Expenses are equal to the Fund’s annualized expense ratio of 1.25%, multiplied by the average account value over the period, multiplied by 181/365 (to reflect the one-half year period). |
2023 Semi-Annual Report 28
ADDITIONAL INFORMATION
June 30, 2023
(Unaudited)
APPROVAL AND RENEWAL OF INVESTMENT ADVISORY AGREEMENTS
At a meeting of the Board of Trustees held on February 14, 2023, (the “Meeting”) the Board of Trustees (the “Trustees” or the “Board”) considered the continuance of the Management Agreements (the “Agreements” or “Management Agreements”) with Paradigm Funds Advisor LLC (the “Advisor”) for the Paradigm Value Fund (“Value Fund”), the Paradigm Select Fund (“Select Fund”), and the Paradigm Micro-Cap Fund (“Micro-Cap Fund”) (each a “Fund”, or collectively, the “Funds”).
Legal Counsel reviewed a memorandum outlining the duties of mutual fund trustees with respect to the renewal of investment advisory contracts, and he explained that, in consideration of the continuance of the management agreements, the Board should review information reasonably necessary to evaluate the terms of the Agreements and determine whether each was fair to each Fund and its shareholders. Legal Counsel also explained that the Advisor provided information to the Trustees for evaluation of the continuance of the Agreements.
In renewing the Agreements, the Board of Trustees received materials from the Advisor (the “Report”) addressing the following factors: (i) the investment performance of the Funds and the Advisor; (ii) the nature, extent and quality of the services provided by the Advisor to the Funds; (iii) the cost of the services to be provided and the profits to be realized by the Advisor and its affiliates from the relationship with the Funds; (iv) the extent to which economies of scale will be realized as the Funds grow; and (v) whether the fee levels reflect these economies of scale for the benefit of shareholders.
The Trustees discussed each Fund’s performance in relation to the applicable Fund’s Peer Group average, the Morningstar category average and the comparative index for certain periods for each Fund, as detailed in the Report. The Trustees discussed with representatives of the Advisor the factors underlying the performance of the Funds over various time periods, noting that the relative performance of the Value Fund and Select Fund over the short-term was below that of their benchmark index. The Trustees noted that the short-term underperformance was not unreasonable in light of recent market volatility. Micro-Cap Fund’s relative performance over the short-term was above that of its benchmark index. The Trustees noted that each Fund outperformed its benchmark index over the long-term (periods in the report in excess of the one-year period ended December 31, 2022). The Trustees further noted the importance of the Advisor’s sector allocations and stock selection process. The Trustees noted the Advisor’s explanations for the recent performance of each Fund and concluded, after careful review of the investment process and further discussion with the portfolio managers, that each Fund’s performance was consistent with performance expectations.
As to the nature, extent and quality of the services provided by the Advisor, the Trustees analyzed the Advisor’s experience and capabilities. They discussed the information provided regarding operational matters such as the Advisor’s research and investment personnel. They also discussed the portfolio managers’ backgrounds and investment management experience. They reviewed the Advisor’s financial information and discussed the firm’s ability to meet its obligations under the Agreements. The Board concluded that the nature and extent of the services provided by the Advisor were consistent with the Board’s expectations, and that the quality of services, particularly those provided by the portfolio managers, was more than satisfactory. The Trustees also concluded that the Advisor had the resources to provide quality advisory services to the Funds.
As to the costs of the services provided, the Board reviewed the fees received by the Advisor under the Agreements compared to the applicable Peer Group and category average. The Trustees noted that each Fund paid a unitary management fee under which the Advisor provided advisory services and certain administrative and governance functions and paid Fund expenses. The reviewed the unitary management fee of 1.50% of average daily net assets for the Value Fund and Select Fund, and 1.25% of average daily net assets of the Micro-Cap Fund. As a result of the unitary fee structure, the Trustees agreed that comparison of each Fund’s advisory fee to the expense ratios of comparable funds was most relevant to the Board deliberations. They discussed that the Report noted that the Value Fund’s audited expense ratio of 1.50% was found to be higher than the category average of 1.05% and its Peer Group’s average expense ratio of 1.09% but within the range of its Peer Group; that the Select Fund’s audited expense ratio of 1.15% was higher than its Morningstar category average of 1.04% and its Peer Group’s average expense ratio of 1.04% but within the range of its Peer Group; and that the Micro-Cap Fund’s audited expense ratio of 1.25% was higher than its Morningstar category average expense ratio of 1.05% and higher than its Peer Group’s average of 1.16% . The Trustees noted that, while the fees may be higher, in some cases, than the peer group
2023 Semi-Annual Report 29
Additional Information (Unaudited) - continued
averages and/or the Morningstar category averages in each case, they appeared reasonable when compared to the benchmarks’ range of fees. The Board noted that while the Advisor did not manage any other accounts, Paradigm Capital Management, Inc., an affiliate of the Advisor, provided services to hedge funds for which it received an annual fee of 0.75% plus a performance fee; institutional accounts for which it received fees ranging from 0.55% to 1.00%; and separately managed accounts for high net-worth clients for which it received fees ranging from 0.50% to 1.00% . After a discussion, the Trustees concluded that the management fees paid with respect to each Fund were not unreasonable. The Board noted that the Advisor had contractually agreed to waive management fees and reimburse expenses to the extent necessary to maintain total annual operating expenses of the Select Fund (excluding brokerage fees and commissions, interest and other borrowing expenses, taxes, extraordinary expenses and the indirect costs of investing in acquired funds) at 1.15% of its average daily net assets through April 30, 2023, thereby benefiting shareholders.
As for the profits realized by the Advisor, the Trustees reviewed a profit and loss analysis prepared by the Advisor that disclosed the direct and indirect expenses paid by the Advisor on behalf of each Fund, the total revenue derived by the Advisor from each Fund and the pre-tax operating margin of the Advisor with respect to each Fund for the calendar year ended December 31, 2022. The Trustees also reviewed a broad industry analysis of mutual fund profitability prepared by an independent third party, noting the operating margins realized by the Advisor were well within the range reported in the analysis. The Funds’ chief compliance officer confirmed to the Trustees that no Fund portfolio securities were traded through the Advisor’s affiliated broker-dealer and that all trades were made on the basis of best price and execution. The Trustees concluded that the Advisor was not excessively profitable from its relationship with any of the Funds.
As for economies of scale, the Trustees discussed and considered information regarding whether economies of scale had been realized with respect to the management of the Funds, whether the Funds had appropriately benefited from any economies of scale, and whether there is potential for realization of any further economies of scale. The Board considered that the Funds’ shareholders experienced benefits from the fact that the Advisor was obligated to pay certain of the Funds’ operating expenses, which had the effect of limiting the overall fees paid by the Funds. The Board also noted that the Advisor had contractually agreed to waive management fees and reimburse expenses for the Select Fund, thereby benefiting shareholders. The Trustees agreed that, at current asset levels, further fee concessions were not justified and the unitary fee structure indirectly provided the benefits of economies of scale to shareholders despite the relatively small size of the Funds.
In considering the continuance of the Management Agreements between the Trust and the Advisor, the disinterested Trustees did not identify any factor as all-important or all-controlling and instead considered these factors collectively in light of each Fund’s surrounding circumstances. Additionally, as part of its deliberations, the Trustees also considered and relied upon the information about the Funds that had been provided to them throughout the year in connection with their regular Board meetings at which they engage in the ongoing oversight of the Funds and their operations. Next, the disinterested Trustees met in executive session with Fund counsel to discuss the continuation of the Agreements. The other meeting participants were excused during this discussion.
Upon the return of the other meeting participants, the Trustees conveyed their consensus, including the disinterested Trustees, that renewal of the Management Agreements was in the best interests of each Fund and its shareholders.
AVAILABILITY OF QUARTERLY SCHEDULE OF INVESTMENTS
The Funds publicly file their complete schedules of portfolio holdings with the Securities and Exchange Commission (“SEC”) for the first and third quarters of each fiscal year on Form N-PORT. The Funds’ Forms N-PORT are available on the SEC’s website at http://www.sec.gov.
| PROXY VOTING GUIDELINES |
Paradigm Funds Advisor LLC, is responsible for exercising the voting rights associated with the securities held by the Funds. A description of the policies and procedures used by the Advisor in fulfilling this responsibility is available without charge on the Funds’ website at www.paradigm-funds.com. It is also included in the Funds’ Statement of Additional Information, which is available on the SEC’s website at http://www.sec.gov.
Form N-PX provides information regarding how the Funds voted proxies with regards to portfolio securities held during the most recent 12-month period ended June 30 and is available without charge, upon request, by calling our toll free number(1-800-239-0732). This information is also available on the SEC’s website at http://www.sec.gov.
2023 Semi-Annual Report 30
Additional Information (Unaudited) - continued
ADDITIONAL INFORMATION
You will find more information about the Funds at www.paradigm-funds.com. For shareholder inquiries, please call toll-free in the U.S. at 1-800-239-0732.
| LIQUIDITY RISK MANAGEMENT PROGRAM |
During the six-month period ended June 30, 2023, the Board reviewed the Funds’ liquidity risk management program, adopted pursuant to Rule 22e-4 under the 1940 Act. The program is overseen by the Advisor, who has delegated certain responsibilities for managing the program to a liquidity program administrator (the “LPA”). The LPA reported that it had assessed, managed and reviewed the program for the Funds taking into consideration several factors including the liquidity of each Fund’s portfolio investments and the market, trading or investment specific considerations that may reasonably affect a security’s classification as a liquid investment. The LPA certified that the program was adequate, effectively implemented and needed no changes at that time.
2023 Semi-Annual Report 31
Board of Trustees
|
| This report is provided for the general information of the shareholders of the Paradigm Funds. This report is not intended for distribution to prospective investors in the Funds, unless preceded or accompanied by an effective prospectus. |
Item 2. Code of Ethics. Not applicable.
Item 3. Audit Committee Financial Expert. Not applicable.
Item 4. Principal Accountant Fees and Services. Not applicable.
Item 5. Audit Committee of Listed Companies. Not applicable.
Item 6. Investments.
(a) Not applicable. Schedule filed with Item 1.
(b) Not applicable.
Item 7. Disclosure of Proxy Voting Policies and Procedures for Closed-End Management Investment Companies. Not applicable.
Item 8. Portfolio Managers of Closed End Management Investment Companies. Not applicable.
Item 9. Purchases of Equity Securities by Closed-End Management Investment Companies and Affiliated Purchasers. Not applicable.
Item 10. Submission of Matters to a Vote of Security Holders.
The registrant has not adopted procedures by which shareholders may recommend nominees to the registrant’s board of trustees.
Item 11. Controls and Procedures.
(a) The Registrant’s president and chief financial officer concluded that the disclosure controls and procedures (as defined in Rule 30a-3(c) under the Act (17 CFR 270.30a -3(c))) as of a date within 90 days of the filing date of the report that includes the disclosure required by this paragraph, based on the evaluation of these controls and procedures required by Rule 30a-3(b) under the Act (17 CFR 270.30a -3(b)) and Rules 13a-15(b) or 15d-15(b) under the Exchange Act (17 CFR 240.13a -15(b) or 240.15d -15(b)).
(b) There were no changes in the registrant’s internal control over financial reporting (as defined in Rule 30a-3(d) under the Act (17 CFR 270.30a -3(d)) that occurred during the period covered by this report that has materially affected, or is reasonably likely to materially affect, the registrant’s internal control over financial reporting.
Item 12. Disclosure of Securities Lending Activities for Closed-End Management Investment Companies.
Not applicable.
Item 13. Exhibits.
(a)(1) Code of Ethics. Not applicable.
(a)(2) Certifications pursuant to Section 302 of the Sarbanes-Oxley Act of 2002. Filed herewith.
(a)(3) Not applicable.
(a)(4) Not applicable.
(b) Certification pursuant to Section 906 of the Sarbanes-Oxley Act of 2002. Filed herewith.
| SIGNATURES |
Pursuant to the requirements of the Securities Exchange Act of 1934 and the Investment Company Act of 1940, the registrant has duly caused this report to be signed on its behalf by the undersigned, thereunto duly authorized.
| Paradigm Funds |
| By: /s/Candace King Weir Candace King Weir President |
| Date: 8/25/2023 |
Pursuant to the requirements of the Securities Exchange Act of 1934 and the Investment Company Act of 1940, this report has been signed below by the following persons on behalf of the registrant and in the capacities and on the dates indicated.
| By: /s/Candace King Weir Candace King Weir President |
| Date: 8/25/2023 |
By: /s/Robert A. Benton |
Date: 8/24/2023
|