UNITED STATES
SECURITIES AND EXCHANGE COMMISSION
WASHINGTON, D.C. 20549
FORM N-CSR
CERTIFIED SHAREHOLDER REPORT OF REGISTERED MANAGEMENT
INVESTMENT COMPANIES
Investment Company Act file number | 811-21237 |
Unified Series Trust |
431 North Pennsylvania, Indianapolis, IN 46204
J. Michael Landis |
Unified Fund Services, Inc.
431 N. Pennsylvania St.
Indianapolis, IN 46204 |
(Name and address of agent for service)
Registrant's telephone number, including area code: 317-917-7000
Date of fiscal year end: | 03/31 |
Date of reporting period: | 03/31/07 |
Form N-CSR is to be used by management investment companies to file reports with the Commission not later than 10 days after the transmission to stockholders of any report that is required to be transmitted to stockholders under Rule 30e-1 under the Investment Company Act of 1940 (17 CFR 270.30e-1). The Commission may use the information provided on Form N-CSR in its regulatory, disclosure review, inspection and policymaking roles.
A registrant is required to disclose the information specified by Form N-CSR, and the Commission will make this information public. A registrant is not required to respond to the collection of information contained in Form N-CSR unless the Form displays a currently valid Office of Management and Budget ("OMB") control number. Please direct comments concerning the accuracy of the information collection burden estimate and any suggestions for reducing the burden to Secretary, Securities and Exchange Commission, 450 Fifth Street, NW, Washington, DC 20549-0609. The OMB has reviewed this collection of information under the clearance requirements of 44 U.S.C. § 3507.
Item 1. Reports to Stockholders.

Large Cap Value Fund
Small Cap Value Fund
International Fund
Annual Report
March 31, 2007
Fund Adviser:
Dean Investment Associates LLC
2480 Kettering Tower
Dayton, OH 45423
Toll Free 1-888-899-8343
DEAN LARGE CAP VALUE FUND
Performance Review
The year ended March 31, 2007 was a challenging period for the Dean Large Cap Value Fund. The Fund’s total return was a nominally solid 9.85% (or 4.10% after the deduction of the maximum sales charge of 5.25%). However, the portfolio lagged the Russell 1000 Index and Russell 1000 Value Index which had returns of 11.84% and 16.83%, respectively.
Mid cap members of the Russell 1000 Index slightly outpaced the large cap index as a whole with the smaller 800 members of the index returning 12.0% for the year vs. 11.4% for the largest 200 companies. This contrasts sharply with the prior several years. The average annual return for the mid cap 800 (smallest 800 companies in the Russell 1000 Index) during the three year period preceding this past year was 27.4% vs. 14.3% for the largest 200 members of the Russell 1000 Index.
The best performing groups during the year ended March 31, 2007 were Utilities, Telecommunications Services, Consumer Staples and Materials. Each of these economic sectors was up greater than 20%, with Utilities up over 30%. Utilities improved from its position as the worst performing sector on average over the prior 4 years. The Fund was under-weighted in the Utilities and Energy economic sectors, contributing meaningfully to the Fund’s under-performance.
A lower beta theme also played out with the Consumer Staples and lower volatility Materials industries (containers & packaging, chemicals, industrial gases) outperforming other groups during the year.
The Dean Large Cap Value Fund was positioned for most of the year with a significant over-weight position in Information Technology holdings. This also contributed to the Fund’s underperformance as technology was the worst performing sector in the Russell benchmarks.
Outlook
Exhaustive financial and fundamental research leads us to believe there are many pockets of opportunity within this fifth year of the bull market. These pockets can be characterized by market capitalization and industry exposure.
We also believe, four years of mid cap outperformance may be coming to an end. As a result of the variance in total returns, we are seeing the best opportunities at the high end of the large cap spectrum. Also, several extremely high quality businesses appear to be trading at tremendous discounts to an appropriate valuation within the Information Technology sector.
Diversified Financials is currently the single largest industry group in our benchmark, the Russell 1000 Value Index. Companies with the greatest operating leverage to the capital markets (investment banks, brokers, asset managers) are trading at premium multiples based on abnormally high profitability. We believe it is as unlikely that these businesses will continue to generate such excess return in the next few years as it is that they will be awarded such premium multiples. As such, we have found what we believe to be much better risk/reward opportunities elsewhere.
New portfolio management at the end of the third quarter employs a classic value investment process. We use a bottom-up approach, investing in quality businesses that, in our opinion, are trading below fair value for transitory reasons. We believe our diligent research and ability to separate transitory from secular change will enable us to generate excess returns with less volatility than our benchmark and peers.
Past performance is no guarantee of future results. The views expressed are those of the investment advisor as of March 31, 2007, and are not intended as a forecast or investment recommendations. The indexes mentioned are not available for investment; however, an individual can invest in exchange traded funds or other investment vehicles that attempt to track the performance of a benchmark index.
Performance Summary

The performance quoted represents past performance, which does not guarantee future results. The investment return and principal value of an investment will fluctuate so that an investor’s shares, when redeemed, may be worth more or less than their original cost. The returns shown do not reflect deduction of taxes that a shareholder would pay on Fund distributions or the redemption of Fund shares. Current performance of the Fund may be lower or higher than the performance quoted. The Fund’s investment objectives, risks, charges and expenses must be considered carefully before investing. Performance data current to the most recent month end may be obtained by calling 1-888-899-8343.
* | Return figures reflect any change in price per share and assume the reinvestment of all distributions. |
** In compliance with SEC guidelines, these returns reflect the deduction of maximum sales charges and other recurring fees. Shares have a maximum up-front sales charge of 5.25% that you pay when you buy your shares. The front-end sales charge for the Shares decreases with the amount you invest and is included in the offering price. The sales charge does not apply to purchases over $500,000. A contingent deferred sales charge (“CDSC”) of 1.00% may be charged on shares redeemed within 12 months of purchase if the front-end sales charge was not paid. The fee is not applied to shares acquired through reinvestment of dividends or capital gains.
***The Indices are unmanaged benchmarks that assume reinvestment of all distributions and exclude the effect of taxes and fees. The Russell 1000 Index and the Russell 1000 Value Index are widely recognized unmanaged indices of equity prices and are representative of a broader market and range of securities than are found in the Fund’s portfolio. Individuals cannot invest directly in the Index; however, an individual can invest in exchange traded funds or other investment vehicles that attempt to track the performance of a benchmark index.

This graph shows the value of a hypothetical initial investment of $10,000 in the Fund, the Russell 1000 Index and the Russell 1000 Value Index on May 28, 1997 (inception date of the Fund) and held through March 31, 2007. In compliance with SEC guidelines, the Fund’s returns reflect the deduction of maximum sales charges and other recurring fees. Shares have a maximum up-front sales charge of 5.25% that you pay when you buy your shares.
The Russell 1000 Index and the Russell 1000 Value Index are widely recognized unmanaged indices of common stock prices and are representative of a broader market and range of securities than are found in the Fund’s portfolio. Individuals cannot invest directly in the Index; however, an individual can invest in exchange traded funds or other investment vehicles that attempt to track the performance of a benchmark index. The Index returns do not include expenses, which have been deducted from the Fund’s return. These performance figures include the change in value of the stocks in the index plus the reinvestment of dividends and are not annualized. The returns shown do not reflect deduction of taxes that a shareholder would pay on Fund distributions or the redemption of Fund shares. THE FUND’S RETURN REPRESENTS PAST PERFORMANCE AND DOES NOT GUARANTEE OR PREDICT FUTURE RESULTS. Investment returns and principal values will fluctuate so that an investor’s shares, when redeemed, may be worth more or less than their original cost. Current performance may be lower or higher than the performance data quoted. For more information on the Dean Large Cap Value Fund, and to obtain performance data current to the most recent month-end, or to request a prospectus, please call 1-888-899-8343. You should carefully consider the investment objectives, potential risks, management fees, and charges and expenses of the Fund before investing. The Fund’s prospectus contains this and other information about the Fund, and should be read carefully before investing.
DEAN SMALL CAP VALUE FUND
Performance Review
The year ended March 31, 2007 was a challenging period for Dean Small Cap Value Fund as the portfolio lagged the Russell 2000 Index and the Russell 2000 Value Index benchmarks. The Fund’s return was 2.95% (or -2.47% after the deduction of the maximum sales charge of 5.25%) while the Russell 2000 Index was up 5.91% and the Russell 2000 Value Index was up 10.38%.
There was little in terms of themes or biases that drove the portfolio’s performance during the year. The larger market capitalization companies within the small cap universe outpaced the group as a whole. The traditional value sectors including Consumer Staples, Materials and Utilities led the way, each with sector returns greater than 20%. The Fund’s under-weighting in Utilities and absence of Real Estate Investment Trust holdings were significant factors contributing to the Fund’s under-performance.
Recent years’ weaknesses continued in Information Technology, and Financials and Energy finally cooled off after several years of outperformance. Each of these groups was up less than 5%. A significant over-weight in Information Technology contributed to the Fund’s lower than benchmark returns.
The Fund was strong in the fourth quarter, outperforming the benchmark and peers. New portfolio management at the end of the third quarter refocused the portfolio on high quality companies trading below what we deem to be fair value. The new manager employs a traditional value investment style as described in the Fund’s prospectus. A combination of qualitative and quantitative in-depth research is conducted to determine the appropriate market value for potential investments. A strict buy and sell price-driven philosophy helps to manage the risk and reap the rewards of holdings. There will not be any significant changes in the overall value investment style. Instead, there is a refining of the research and portfolio management process.
Outlook
Exhaustive financial and fundamental research leads us to believe there are many pockets of opportunity within this fifth year of the bull market. The Russell 2000 Value Index is up an average annual total return of 25.5% from 3/31/03 through 3/31/07. We feel that perhaps, a reminder is in order. The S&P 500 was up 25.4% for the 4 years prior to the March 2000 large cap market peak. It is important to note that the same can be said of the four year period leading up to March of 1999 and 1998 as well.
Many of the leading industry groups in the last several years have reached or exceeded prior peak levels of valuation. In our opinion, the same trends that put these groups on a pedestal continue today. However, opportunity awaits the investor that can avoid the siren’s song. Base metals, oil, gas and consumable fuels, related heavy equipment, construction materials, and real estate are just some of the groups that have benefited tremendously in recent years. Going forward, we believe, it is unlikely that the same market enthusiasm will support them despite the inviting, although transitory, fundamental case.
Regardless of where we find investment opportunity, our investment policy remains constant. We will invest in businesses with solid long-term returns on invested capital, relatively little debt, strong internal cash generation and modest growth expectations that are currently and temporarily trading below appropriate market valuations.
Past performance is no guarantee of future results. The views expressed are those of the investment advisor as of March 31, 2007, and are not intended as a forecast or investment recommendations. The indexes mentioned are not available for investment; however, an individual can invest in exchange traded funds or other investment vehicles that attempt to track the performance of a benchmark index.
Performance Summary

The performance quoted represents past performance, which does not guarantee future results. The investment return and principal value of an investment will fluctuate so that an investor’s shares, when redeemed, may be worth more or less than their original cost. The returns shown do not reflect deduction of taxes that a shareholder would pay on Fund distributions or the redemption of Fund shares. Current performance of the Fund may be lower or higher than the performance quoted. The Fund’s investment objectives, risks, charges and expenses must be considered carefully before investing. Performance data current to the most recent month end may be obtained by calling 1-888-899-8343.
* | Return figures reflect any change in price per share and assume the reinvestment of all distributions. |
** In compliance with SEC guidelines, these returns reflect the deduction of maximum sales charges and other recurring fees. Shares have a maximum up-front sales charge of 5.25% that you pay when you buy your shares. The front-end sales charge for the Shares decreases with the amount you invest and is included in the offering price. The sales charge does not apply to purchases over $500,000. A contingent deferred sales charge (“CDSC”) of 1.00% may be charged on shares redeemed within 12 months of purchase if the front-end sales charge was not paid. The fee is not applied to shares acquired through reinvestment of dividends or capital gains.
***The Indices are unmanaged benchmarks that assume reinvestment of all distributions and exclude the effect of taxes and fees. The Russell 2000 Index and the Russell 2000 Value Index are widely recognized unmanaged indices of equity prices and are representative of a broader market and range of securities than are found in the Fund’s portfolio. Individuals cannot invest directly in the Index; however, an individual can invest in exchange traded funds or other investment vehicles that attempt to track the performance of a benchmark index.
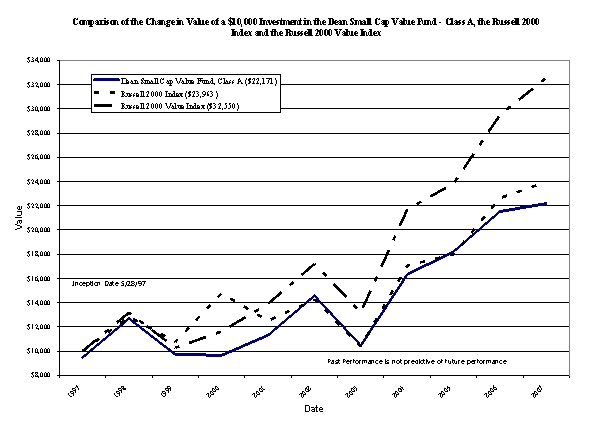
This graph shows the value of a hypothetical initial investment of $10,000 in the Fund, the Russell 2000 Index and the Russell 2000 Value Index on May 28, 1997 (inception date of the Fund) and held through March 31, 2007. In compliance with SEC guidelines, the Fund’s returns reflect the deduction of maximum sales charges and other recurring fees. Shares have a maximum up-front sales charge of 5.25% that you pay when you buy your shares.
The Russell 2000 Index and the Russell 2000 Value Index are widely recognized unmanaged indices of common stock prices and are representative of a broader market and range of securities than are found in the Fund’s portfolio. Individuals cannot invest directly in the Index; however, an individual can invest in exchange traded funds or other investment vehicles that attempt to track the performance of a benchmark index. The Index returns do not include expenses, which have been deducted from the Fund’s return. These performance figures include the change in value of the stocks in the index plus the reinvestment of dividends and are not annualized. The returns shown do not reflect deduction of taxes that a shareholder would pay on Fund distributions or the redemption of Fund shares. THE FUND’S RETURN REPRESENTS PAST PERFORMANCE AND DOES NOT GUARANTEE OR PREDICT FUTURE RESULTS. Investment returns and principal values will fluctuate so that an investor’s shares, when redeemed, may be worth more or less than their original cost. Current performance may be lower or higher than the performance data quoted. For more information on the Dean Small Cap Value Fund, and to obtain performance data current to the most recent month-end, or to request a prospectus, please call 1-888-899-8343. You should carefully consider the investment objectives, potential risks, management fees, and charges and expenses of the Fund before investing. The Fund’s prospectus contains this and other information about the Fund, and should be read carefully before investing.
DEAN INTERNATIONAL FUND
The last twelve months have been challenging for the Newton Global Equity team (the sub-advisor to the Dean International Fund) and this was reflected in the Fund, which underperformed its benchmark for the year ended March 31, 2007. The Fund had a total return of 8.11% (or 2.41% after the deduction of the maximum sales charge of 5.25%) and its benchmark, the Morgan Stanley EAFE Index, had a total return of 20.80% for the year ended March 31, 2007.
It was the May global sell-off that instigated some underperformance. This sell-off affected Asia and the emerging markets – sectors upon which we have a positive long-term view. A good deal of the underperformance can be attributed to the effect of this correction, and the subsequent four-month period, which unfortunately resulted in the Dean International Fund being behind for the year ended March 31, 2007.
Asia and emerging markets
Our over-weighted positions in Brazil and Thailand, along with over-weighted positions in sectors such as healthcare and telecoms, took their toll in a stuttering global market. Markets such as these were especially hard hit by the change in investor risk tolerance.
While the global sell-off can be pointed to as the reason behind the poor performance of emerging market stocks in the second and third quarters, the back end of the year was dominated by the news of Thailand’s military coup. We had some positions in the Thai Banks when Thailand’s military junta imposed capital controls, which, although reversed a day later, halted all local equity trading and led to a sharp decline in the local market.
Our allocation to Japanese financial holdings also had a negative effect on returns and Japan proved to be a fragile market, although we were under-weighted in this area. Looking forward, we believe prospects for the domestic economy are still slow and valuations do not look particularly attractive and so we maintain this underweight position.
Drilling down
Our stock selection in the oil and gas sector also proved hard hit by the sell-off, despite exposure being reduced. Elsewhere, our over-weighted position in Canada was also negative, as the commodity-driven nature of its markets saw it participate in the sell-off.
Newton’s ‘global realignment’ theme has placed an emphasis on former debtor countries becoming creditors, with positive impacts on capital flows and consumption. Emerging markets have tended to hold these opportunities as attractive levels of GDP and rising domestic demand encourage the rebalance of global wealth into these ‘producer’ nations.
Ailing health
The allocation into, and subsequent over-weighted position in healthcare companies was a drag on performance as holdings suffered to some extent at the hands of the US Food and Drug Administration’s (FDA) restrictive approval approach. The fourth quarter also saw poor performances resulting from the Democrats’ US mid-term election win, and the history of Hillary Clinton’s botched attempt to provide universal healthcare coverage back in 1993, which brought uncertainty to the sector following price concerns.
Even so, there are numerous worldwide issues that support our long-term confidence in the healthcare sector. The western world has an aging population and the US has a growing obesity problem; with these issues comes the need for improved medical technology, better treatments and the requirement for cheaper overall healthcare. We believe there is huge growth potential in proactive, preventative approaches within the healthcare sector.
We believe our holdings in both global large cap, and emerging market companies in this sector, means we are well placed to benefit from what we anticipate to be a strong growth area. The market seems to have taken an overly negative view of the sector recently and this has been reflected in its poor performance. However, we have continued to take a long-term view; we bought holdings at a stage when we believe they showed good long-term value, but also when the sector remains relatively unloved.
Ringing the changes
Our movement into the mobile telecoms sector was initiated by the themes of ‘old economy’ and ‘low return world’. Newton’s interpretation of this trend has seen it stringently avoid highly leveraged consumers, instead seeking exposure to markets such as those in Asia and other developing economies where average levels of borrowing are much lower. Within the Telecoms sector, where we have found companies with strong cashflows and high dividend yields, we have taken positions to expose us to, what we believe to be, some of the major opportunities for expansion and distribution of telecom services in the developing world.
Looking forward
Our thematic overlay sees the Fund maintaining a strong bias towards the growth potential of Asia and other developing economies. The view here is based on a raft of positive factors such as the attractive levels of GDP growth and rising domestic demand seen in such markets as well as the likelihood of an increasing rebalance of global wealth towards these ‘producer’ nations. The theme of global realignment will, we believe, play a big part in the global markets in the future.
Our current overweighting in selected Brazilian and German companies fits well with our themes, (Developing Economies, Economic Laggards), and we believe, the current stage of the interest rate cycle should be very positive for Germany, where there appear to be good opportunities for structural reform.
Emerging markets have outperformed for the last five years, and we believe that the convergence with their developed peers will continue, although we may not see double-figure returns. Although the risks in the system are rising, so profitable is the credit creation and leveraged investing machine, that if economic and financial conditions do remain just right, the momentum could drive assets much higher from here.
Stepping back from the financial markets, the impression is not one of a particularly low risk world. In addition to the economic uncertainties, we believe geopolitics, energy supply, climate change and terrorism are all wild cards that could trip up markets. Our policy against this backdrop needs to be a balance between heeding the risks discussed above and the realities of today’s liquidity-driven market place. In this volatile environment, stock picking will be of paramount importance and we expect to see individual stocks within markets and sectors diverging. We believe this de-coupling of investment classes should leave us well positioned to outperform. We will continue to focus on stock selection, seeking stocks that fit into our matrix of thematic suitability, strong fundamentals and attractive valuations.
Past performance is no guarantee of future results. The views expressed are those of the investment advisor as of March 31, 2007, and are not intended as a forecast or investment recommendations. The indexes mentioned are not available for investment; however, an individual can invest in exchange traded funds or other investment vehicles that attempt to track the performance of a benchmark index.
Performance Summary

The performance quoted represents past performance, which does not guarantee future results. The investment return and principal value of an investment will fluctuate so that an investor’s shares, when redeemed, may be worth more or less than their original cost. The returns shown do not reflect deduction of taxes that a shareholder would pay on Fund distributions or the redemption of Fund shares. Current performance of the Fund may be lower or higher than the performance quoted. The Fund’s investment objectives, risks, charges and expenses must be considered carefully before investing. Performance data current to the most recent month end may be obtained by calling 1-888-899-8343.
* Return figures reflect any change in price per share and assume the reinvestment of all distributions.
** In compliance with SEC guidelines, these returns reflect the deduction of maximum sales charges and other recurring fees. Shares have a maximum up-front sales charge of 5.25% that you pay when you buy your shares. The front-end sales charge for the Shares decreases with the amount you invest and is included in the offering price. The sales charge does not apply to purchases over $500,000. A contingent deferred sales charge (“CDSC”) of 1.00% may be charged on shares redeemed within 12 months of purchase if the front-end sales charge was not paid. The fee is not applied to shares acquired through reinvestment of dividends or capital gains.
*** The Index is an unmanaged benchmark that assumes reinvestment of all distributions and excludes the effect of taxes and fees. The Morgan Stanley EAFE Index is a widely recognized unmanaged index of equity prices and is representative of a broader market and range of securities than are found in the Fund’s portfolio. Individuals cannot invest directly in the Index; however, an individual can invest in exchange traded funds or other investment vehicles that attempt to track the performance of a benchmark index.
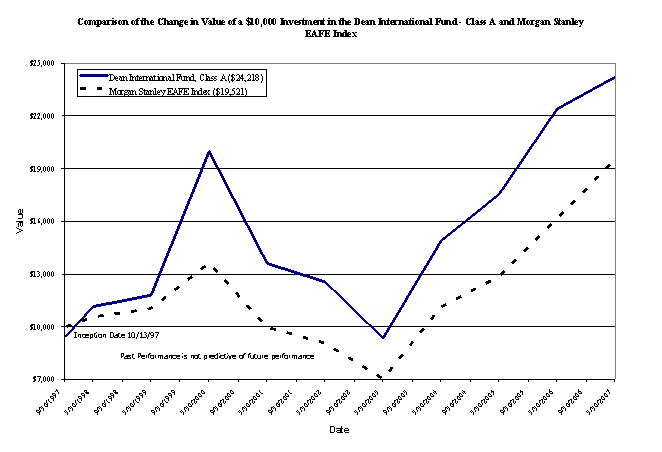
This graph shows the value of a hypothetical initial investment of $10,000 in the Fund and the Morgan Stanley EAFE Index on October 13, 1997 (inception date of the Fund) and held through March 31, 2007. In compliance with SEC guidelines, the Fund’s returns reflect the deduction of maximum sales charges and other recurring fees. Shares have a maximum up-front sales charge of 5.25% that you pay when you buy your shares.
The Morgan Stanley EAFE Index is a widely recognized unmanaged index of common stock prices and is representative of a broader market and range of securities than is found in the Fund’s portfolio. Individuals cannot invest directly in the Index; however, an individual can invest in exchange traded funds or other investment vehicles that attempt to track the performance of a benchmark index. The Index returns do not include expenses, which have been deducted from the Fund’s return. These performance figures include the change in value of the stocks in the index plus the reinvestment of dividends and are not annualized. The returns shown do not reflect deduction of taxes that a shareholder would pay on Fund distributions or the redemption of Fund shares. THE FUND’S RETURN REPRESENTS PAST PERFORMANCE AND DOES NOT GUARANTEE OR PREDICT FUTURE RESULTS. Investment returns and principal values will fluctuate so that an investor’s shares, when redeemed, may be worth more or less than their original cost. Current performance may be lower or higher than the performance data quoted. For more information on the Dean International Fund, and to obtain performance data current to the most recent month-end, or to request a prospectus, please call 1-888-899-8343. You should carefully consider the investment objectives, potential risks, management fees, and charges and expenses of the Fund before investing. The Fund’s prospectus contains this and other information about the Fund, and should be read carefully before investing.
DEAN LARGE CAP VALUE FUND HOLDINGS
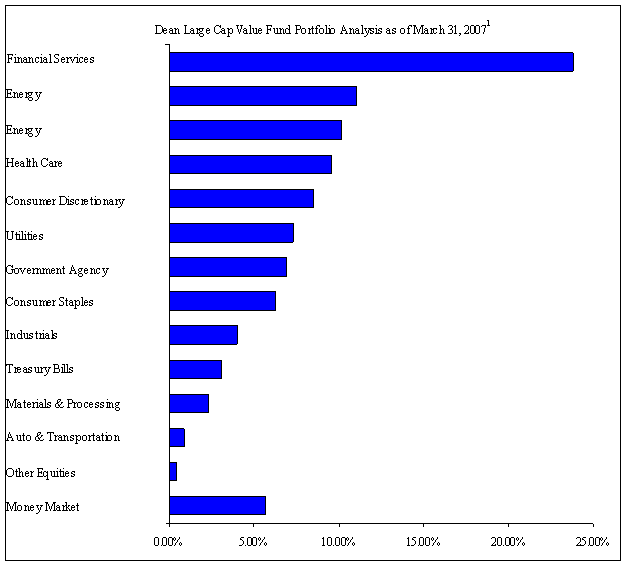
1As a percent of total investments.
DEAN SMALL CAP VALUE FUND HOLDINGS
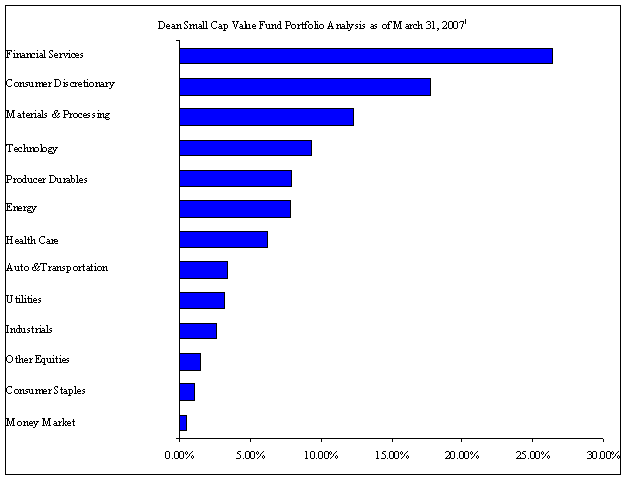
1As a percent of total investments.
DEAN INTERNATIONAL FUND HOLDINGS
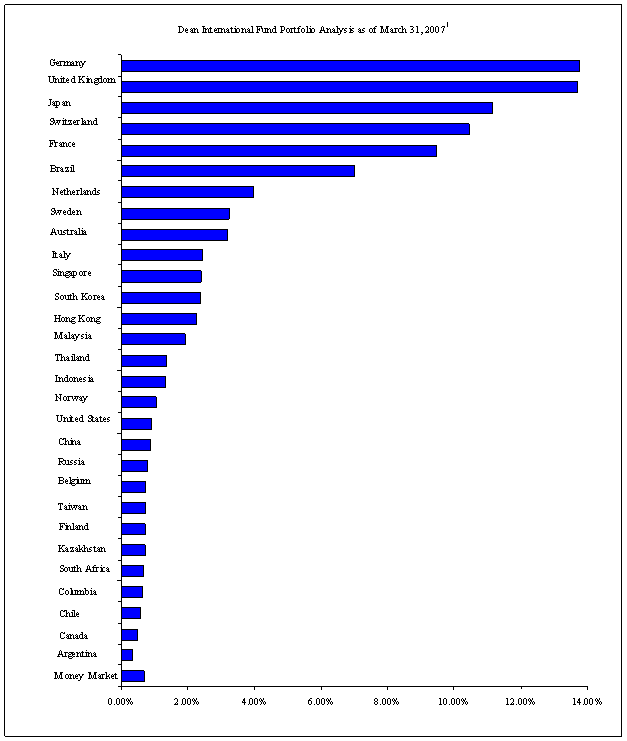
1As a percent of total investments.
PORTFOLIO HOLDINGS
The Funds file a complete schedule of portfolio holdings with the U.S. Securities and Exchange Commission (the SEC) for the first and third quarters of each fiscal year on Form N-Q. The Funds’ Forms N-Q are available on the SEC’s website at http://www.sec.gov. In addition, the Funds’ Forms N-Q may be reviewed and copied at the Commission’s Public Reference Room in Washington, DC. Information on the operation of the Public Reference Room may be obtained by calling 1-800-SEC-0330.
ABOUT THE FUNDS’ EXPENSES
As a shareholder of each Fund, you incur two types of costs: (1) transaction costs, including sales charges (loads) on purchase payments and (2) ongoing costs, including management fees, distribution and/or service (12b-1) fees, and other Fund expenses. This Example is intended to help you understand your ongoing costs (in dollars) of investing in each Fund and to compare these costs with the ongoing costs of investing in other mutual funds.
The Example is based on an investment of $1,000 invested at the beginning and held for the six month period, October 1, 2006 to March 31, 2007.
Actual Expenses
The first line of the table below provides information about actual account values and actual expenses. You may use the information in this line, together with the amount you invested, to estimate the expenses that you paid over the period. Simply divide your account value by $1,000 (for example, an $8,600 account value divided by $1,000 = 8.6), then multiply the result by the number in the first line under the heading entitled “Expenses Paid During Period” to estimate the expenses you paid on your account during this period.
Hypothetical Example for Comparison Purposes
The second line of the table below provides information about hypothetical account values and hypothetical expenses based on the Fund’s actual expense ratio and an assumed rate of return of 5% per year before expenses, which is not the Fund’s actual return. The hypothetical account values and expenses may not be used to estimate the actual ending account balance or expenses you paid for the period. You may use this information to compare the ongoing costs of investing in the Fund and other funds. To do so, compare this 5% hypothetical example with the 5% hypothetical examples that appear in the shareholder reports of the other funds.
Please note that the expenses shown in the table are meant to highlight your ongoing costs only and do not reflect any transactional costs, such as sales charges (loads). Therefore, the second line of the table is useful in comparing ongoing costs only, and will not help you determine the relative total costs of owning different funds. In addition, if these transactional costs were included, your costs would have been higher.
Dean Large Cap Value Fund - Class A | Beginning Account Value October 1, 2006 | Ending Account Value March 31, 2007 | Expenses Paid During Period October 1, 2006 - March 31, 2007 |
Actual* | $1,000.00 | $1,053.87 | $9.47 |
Hypothetical** | $1,000.00 | $1,015.71 | $9.29 |
*Expenses are equal to the Fund’s annualized expense ratio of 1.85% for Class A, multiplied by the average account value over the period, multiplied by 182/365 (to reflect the partial year period). The following table shows what returns and expenses would have been had the Fund’s new annualized expense ratio, effective April 1, 2007, of 1.50% for Class A, been in effect during the period shown.
Dean Large Cap Value Fund - Class A | Beginning Account Value October 1, 2006 | Ending Account Value March 31, 2007 | Expenses Paid During Period October 1, 2006 - March 31, 2007 |
Actual | $1,000.00 | $1,053.87 | $7.68 |
** Assumes a 5% return before expenses. Expenses are equal to the Fund’s annualized expense ratio of 1.85% for Class A, multiplied by the average account value over the period, multiplied by 182/365 (to reflect the partial year period). The following table, which assumes a 5% return before expenses, shows what returns and expenses would have been had the Fund’s new annualized expense ratio, effective April 1, 2007, of 1.50% for Class A, been in effect during the period shown.
Dean Large Cap Value Fund - Class A | Beginning Account Value October 1, 2006 | Ending Account Value March 31, 2007 | Expenses Paid During Period October 1, 2006 - March 31, 2007 |
Hypothetical | $1,000.00 | $1,017.45 | $7.54 |
Dean Small Cap Value Fund – Class A | Beginning Account Value October 1, 2006 | Ending Account Value March 31, 2007 | Expenses Paid During Period October 1, 2006 - March 31, 2007 |
Actual* | $1,000.00 | $1,101.76 | $9.53 |
Hypothetical** | $1,000.00 | $1,015.86 | $9.14 |
*Expenses are equal to the Fund’s annualized expense ratio of 1.85% for Class A, multiplied by the average account value over the period, multiplied by 182/365 (to reflect the partial year period). The following table shows what returns and expenses would have been had the Fund’s new annualized expense ratio, effective April 1, 2007, of 1.50% for Class A, been in effect during the period shown.
Dean Small Cap Value Fund – Class A | Beginning Account Value October 1, 2006 | Ending Account Value March 31, 2007 | Expenses Paid During Period October 1, 2006 - March 31, 2007 |
Actual | $1,000.00 | $1,101.76 | $7.86 |
** Assumes a 5% return before expenses. Expenses are equal to the Fund’s annualized expense ratio of 1.85% for Class A, multiplied by the average account value over the period, multiplied by 182/365 (to reflect the partial year period). The following table, which assumes a 5% return before expenses, shows what returns and expenses would have been had the Fund’s new annualized expense ratio, effective April 1, 2007, of 1.50% for Class A, been in effect during the period shown.
Dean Small Cap Value Fund – Class A | Beginning Account Value October 1, 2006 | Ending Account Value March 31, 2007 | Expenses Paid During Period October 1, 2006 - March 31, 2007 |
Hypothetical | $1,000.00 | $1,017.45 | $7.54 |
Dean International Fund – Class A | Beginning Account Value October 1, 2006 | Ending Account Value March 31, 2007 | Expenses Paid During Period October 1, 2006 - March 31, 2007 |
Actual* | $1,000.00 | $1,110.52 | $11.04 |
Hypothetical** | $1,000.00 | $1,014.47 | $10.54 |
*Expenses are equal to the Fund’s annualized expense ratio of 2.10% for Class A, multiplied by the average account value over the period, multiplied by 182/365 (to reflect the partial year period). The following table shows what returns and expenses would have been had the Fund’s new annualized expense ratio, effective April 1, 2007, of 1.85% for Class A, been in effect during the period shown.
Dean International Fund – Class A | Beginning Account Value October 1, 2006 | Ending Account Value March 31, 2007 | Expenses Paid During Period October 1, 2006 - March 31, 2007 |
Actual | $1,000.00 | $1,110.52 | $9.73 |
** Assumes a 5% return before expenses. Expenses are equal to the Fund’s annualized expense ratio of 2.10% for Class A, multiplied by the average account value over the period, multiplied by 182/365 (to reflect the partial year period). The following table, which assumes a 5% return before expenses, shows what returns and expenses would have been had the Fund’s new annualized expense ratio, effective April 1, 2007, of 1.85% for Class A, been in effect during the period shown.
Dean International Fund – Class A | Beginning Account Value October 1, 2006 | Ending Account Value March 31, 2007 | Expenses Paid During Period October 1, 2006 - March 31, 2007 |
Hypothetical | $1,000.00 | $1,015.71 | $9.30 |
DEAN FUNDS | |||||||||
DEAN LARGE CAP VALUE FUND | |||||||||
SCHEDULE OF INVESTMENTS | |||||||||
March 31, 2007 | |||||||||
|
|
|
|
|
|
|
|
|
|
|
|
|
|
|
|
|
|
|
|
Shares |
| COMMON STOCKS - 82.92% |
| Value | |||||
|
|
|
|
|
|
|
|
|
|
|
| Auto Controls For Regulating Residential & Commercial Environments - 0.44% |
| ||||||
1,600 |
| Honeywell International, Inc. |
|
|
|
|
| $ 73,696 | |
|
|
|
|
|
|
|
|
|
|
|
| Bottled & Canned Soft Drinks & Carbonated Waters - 2.31% |
|
|
| ||||
4,800 |
| Cadbury Schweppes plc (b) |
|
|
|
|
| 246,576 | |
7,100 |
| Coca-Cola Enterprises, Inc. |
|
|
|
|
| 143,775 | |
|
|
|
|
|
|
|
|
| 390,351 |
|
|
|
|
|
|
|
|
|
|
|
| Cable & Other Pay Television Services - 0.46% |
|
|
|
| |||
3,000 |
| Comcast Corp. - Class A (a) |
|
|
|
|
| 77,850 | |
|
|
|
|
|
|
|
|
|
|
|
| Commercial Printing - 0.93% |
|
| |||||
4,300 |
| R.R. Donnelley & Sons Co. |
|
|
|
|
| 157,337 | |
|
|
|
|
|
|
|
|
|
|
|
| Converted Paper & Paperboard Products - 1.14% |
|
|
|
| |||
2,800 |
| Kimberly-Clark Corp. |
|
|
|
|
| 191,772 | |
|
|
|
|
|
|
|
|
|
|
|
| Crude Petroleum & Natural Gas - 2.19% |
|
| |||||
3,400 |
| Anadarko Petroleum Corp. |
|
|
|
|
| 146,132 | |
1,000 |
| Apache Corp. |
|
|
|
|
|
| 70,700 |
3,100 |
| Occidental Petroleum Corp. |
|
|
|
|
| 152,861 | |
|
|
|
|
|
|
|
|
| 369,693 |
|
|
|
|
|
|
|
|
|
|
|
| Electric & Other Services Combined - 1.28% |
|
|
|
| |||
2,800 |
| Consolidated Edison, Inc. |
|
|
|
|
| 142,968 | |
1,500 |
| PG&E Corp. |
|
|
|
|
|
| 72,405 |
|
|
|
|
|
|
|
|
| 215,373 |
|
|
|
|
|
|
|
|
|
|
|
| Electric Services - 0.90% |
|
|
|
|
|
| |
3,000 |
| Progress Energy, Inc. |
|
|
|
|
| 151,320 | |
|
|
|
|
|
|
|
|
|
|
|
| Electronic Computers - 0.84% |
|
| |||||
6,100 |
| Dell, Inc. (a) |
|
|
|
|
|
| 141,581 |
|
|
|
|
|
|
|
|
|
|
|
| Electronic Connectors - 0.82% |
|
| |||||
4,900 |
| Molex, Inc. |
|
|
|
|
|
| 138,180 |
|
|
|
|
|
|
|
|
|
|
|
| Finance Services - 0.94% |
|
|
|
|
|
| |
5,900 |
| First Data Corp. |
|
|
|
|
|
| 158,710 |
|
|
|
|
|
|
|
|
|
|
|
| Fire, Marine & Casualty Insurance - 1.59% |
|
| |||||
2,100 |
| American International Group, Inc. |
|
|
|
| 141,162 | ||
5,800 |
| The Progressive Corp. |
|
|
|
|
| 126,556 | |
|
|
|
|
|
|
|
|
| 267,718 |
|
|
|
|
|
|
|
|
|
|
|
| Food and Kindred Products - 3.52% |
|
|
|
|
| ||
10,600 |
| Groupe Danone (b) |
|
|
|
|
| 378,632 | |
12,700 |
| Sara Lee Corp. |
|
|
|
|
|
| 214,884 |
|
|
|
|
|
|
|
|
| 593,516 |
|
|
|
|
|
|
|
|
|
|
|
| Insurance Agents, Brokers & Services - 0.99% |
|
|
|
| |||
5,700 |
| Marsh & McLennan Companies, Inc. |
|
|
|
| 166,953 | ||
|
|
|
|
|
|
|
|
|
|
|
| Malt Beverages - 0.87% |
|
|
|
|
|
| |
2,900 |
| Anheuser - Busch Companies, Inc. |
|
|
|
| 146,334 | ||
|
|
|
|
|
|
|
|
|
|
*See accompanying notes which are an integral part of these financial statements.
DEAN FUNDS | |||||||||
DEAN LARGE CAP VALUE FUND | |||||||||
SCHEDULE OF INVESTMENTS - continued | |||||||||
March 31, 2007 | |||||||||
|
|
|
|
|
|
|
|
|
|
|
|
|
|
|
|
|
|
|
|
Shares |
| COMMON STOCKS - 82.92% - continued | Value | ||||||
|
|
|
|
|
|
|
|
|
|
|
| Millwood, Veneer, Plywood, & Structural Wood Members - 0.71% |
|
| |||||
4,400 |
| Masco Corp. |
|
|
|
|
|
| $ 120,560 |
|
|
|
|
|
|
|
|
|
|
|
| Miscellaneous Fabricated Metal Products - 0.92% |
|
|
|
| |||
1,800 |
| Parker Hannifin Corp. |
|
|
|
|
| 155,358 | |
|
|
|
|
|
|
|
|
|
|
|
| National Commercial Banks - 12.02% |
|
|
|
|
| ||
6,400 |
| Bank of America Corp. |
|
|
|
|
| 326,528 | |
3,400 |
| BB&T Corp. |
|
|
|
|
|
| 139,468 |
5,700 |
| Citigroup, Inc. |
|
|
|
|
|
| 292,638 |
4,300 |
| Comerica, Inc. |
|
|
|
|
|
| 254,216 |
3,100 |
| Marshall & Ilsley Corp. |
|
|
|
|
| 143,561 | |
4,100 |
| National City Corp. |
|
|
|
|
| 152,725 | |
1,950 |
| PNC Financial Services Group, Inc. |
|
|
|
| 140,341 | ||
1,800 |
| SunTrust Banks, Inc. |
|
|
|
|
| 149,472 | |
4,300 |
| Synovus Financial Corp. |
|
|
|
|
| 139,062 | |
2,600 |
| Wachovia Corp. |
|
|
|
|
|
| 143,130 |
4,300 |
| Wells Fargo & Co. |
|
|
|
|
| 148,049 | |
|
|
|
|
|
|
|
|
| 2,029,190 |
|
|
|
|
|
|
|
|
|
|
|
| Newspapers: Publishing or Publishing & Printing - 1.83% |
|
|
| ||||
2,800 |
| Gannett Co., Inc. |
| 157,612 | |||||
4,700 |
| Tribune Co. |
|
|
|
|
|
| 150,917 |
|
|
|
|
|
|
|
|
| 308,529 |
|
|
|
|
|
|
|
|
|
|
|
| Paints, Varnishes, Lacquers, Enamels & Allied Products - 1.17% |
|
| |||||
2,800 |
| PPG Industries, Inc. |
|
|
|
|
| 196,868 | |
|
|
|
|
|
|
|
|
|
|
|
| Petroleum Refining - 8.67% |
| ||||||
2,800 |
| BP plc (b) |
|
|
|
|
|
| 181,300 |
4,300 |
| Chevron Corp. |
|
|
|
|
|
| 318,028 |
4,700 |
| ConocoPhillips |
|
|
|
|
|
| 321,245 |
5,700 |
| Exxon Mobil Corp. | 430,065 | ||||||
2,400 |
| Murphy Oil Corp. | 128,160 | ||||||
1,300 |
| Valero Energy Corp. |
|
|
|
|
| 83,837 | |
|
|
|
|
|
|
|
|
| 1,462,635 |
|
|
|
|
|
|
|
|
|
|
|
| Pharmaceutical Preparations - 8.05% |
|
|
|
|
| ||
2,800 |
| Abbott Laboratories |
|
|
|
|
| 156,240 | |
5,100 |
| Bristol-Myers Squibb Co. |
|
|
|
|
| 141,576 | |
5,700 |
| Eli Lilly & Co. |
|
|
|
|
|
| 306,147 |
2,150 |
| Johnson & Johnson |
|
|
|
|
| 129,559 | |
3,200 |
| Merck & Co., Inc. | 141,344 | ||||||
3,600 |
| Novartis AG (b) |
|
|
|
|
|
| 196,668 |
11,400 |
| Pfizer, Inc. |
|
|
|
|
|
| 287,964 |
|
|
|
|
|
|
|
|
| 1,359,498 |
|
|
|
|
|
|
|
|
|
|
|
| Plastic Material, Synthetic Resins & Nonvulcan Elastomers - 1.14% |
|
| |||||
4,200 |
| The Dow Chemical Co. |
|
|
|
|
| 192,612 | |
|
|
|
|
|
|
|
|
|
|
|
| Printed Circuit Boards - 0.76% |
|
| |||||
6,000 |
| Jabil Circuit, Inc. |
| 128,460 | |||||
|
|
|
|
|
|
|
|
|
|
|
| Radio & TV Broadcasting & Communication Equipment - 2.49% |
| ||||||
2,700 |
| L-3 Communications Holdings, Inc. |
|
|
|
| 236,169 | ||
4,300 |
| QUALCOMM, Inc. |
|
|
|
|
| 183,438 | |
|
|
|
|
|
|
|
|
| 419,607 |
*See accompanying notes which are an integral part of these financial statements.
DEAN FUNDS | ||||||||
DEAN LARGE CAP VALUE FUND | ||||||||
SCHEDULE OF INVESTMENTS - continued | ||||||||
March 31, 2007 | ||||||||
|
|
|
|
|
|
|
|
|
|
|
|
|
|
|
|
|
|
Shares |
| COMMON STOCKS - 82.92% - continued | Value | |||||
|
|
|
|
|
|
|
|
|
|
| Radiotelephone Communications - 0.84% |
|
|
| |||
2,300 |
| ALLTEL Corp. |
|
|
|
|
| $ 142,600 |
|
|
|
|
|
|
|
|
|
|
| Retail - Family Clothing Stores - 1.65% |
|
|
|
| ||
7,100 |
| The Gap, Inc. |
|
|
|
|
| 122,191 |
5,800 |
| The TJX Companies, Inc. |
|
|
|
| 156,368 | |
|
|
|
|
|
|
|
| 278,559 |
|
|
|
|
|
|
|
|
|
|
| Retail - Lumber & Other Material Dealers - 0.94% |
|
|
| |||
4,300 |
| The Home Depot, Inc. |
|
|
|
| 157,982 | |
|
|
|
|
|
|
|
|
|
|
| Retail - Radio, TV & Consumer Electronics Stores - 0.81% |
|
| ||||
2,800 |
| Best Buy Co., Inc. |
| 136,416 | ||||
|
|
|
|
|
|
|
|
|
|
| Savings Institution, Federally Chartered - 0.79% |
|
|
| |||
3,300 |
| Washington Mutual, Inc. |
|
|
|
| 133,254 | |
|
|
|
|
|
|
|
|
|
|
| Semiconductors & Related Devices - 3.32% |
|
|
| |||
7,200 |
| Altera Corp. (a) |
|
|
|
|
| 143,928 |
6,800 |
| Intel Corp. |
|
|
|
|
| 130,084 |
4,700 |
| Linear Technology Corp. |
|
|
|
| 148,473 | |
4,700 |
| Maxim Integrated Products, Inc. |
|
|
| 138,180 | ||
|
|
|
|
|
|
|
| 560,665 |
|
|
|
|
|
|
|
|
|
|
| Services - Computer Integrated Systems Design - 0.86% |
|
| ||||
2,800 |
| Computer Sciences Corp. (a) |
|
|
|
| 145,964 | |
|
|
|
|
|
|
|
|
|
|
| Services - Computer Processing & Data Preparation - 1.01% |
|
| ||||
2,900 |
| Affiliated Computer Services, Inc. - Class A (a) |
|
| 170,752 | |||
|
|
|
|
|
|
|
|
|
|
| Soaps, Detergents, Cleaning Preparations, Perfumes, Cosmetics - 1.05% | ||||||
2,800 |
| The Procter & Gamble Co. |
|
|
|
| 176,848 | |
|
|
|
|
|
|
|
|
|
|
| Specialty Cleaning, Polishing and Sanitation Preparations - 0.81% |
| |||||
2,150 |
| The Clorox Co. |
|
|
|
|
| 136,934 |
|
|
|
|
|
|
|
|
|
|
| State Commercial Banks - 7.06% |
|
|
|
| ||
4,300 |
| Capital One Financial Corp. |
|
|
|
| 324,478 | |
4,300 |
| Fifth Third Bancorp |
|
|
|
| 166,367 | |
1,400 |
| M&T Bank Corp. | 162,162 | |||||
3,800 |
| Northern Trust Corp. |
|
|
|
| 228,532 | |
2,100 |
| State Street Corp. | 135,975 | |||||
4,300 |
| The Bank of New York Co., Inc. |
|
|
| 174,365 | ||
|
|
|
|
|
|
|
| 1,191,879 |
|
|
|
|
|
|
|
|
|
|
| Sugar & Confectionary Products - 0.91% |
| |||||
2,800 |
| The Hershey Co. | 153,048 | |||||
|
|
|
|
|
|
|
|
|
|
| Telephone Communications (No Radiotelephone) - 3.68% |
|
| ||||
4,200 |
| AT&T, Inc. |
|
|
|
|
| 165,606 |
3,200 |
| CenturyTel, Inc. |
|
|
|
|
| 144,608 |
9,900 |
| Citizens Communications Co. | 148,005 | |||||
4,300 |
| Verizon Communications, Inc. | 163,056 | |||||
|
|
|
|
|
|
|
| 621,275 |
*See accompanying notes which are an integral part of these financial statements.
DEAN FUNDS | ||||||||
DEAN LARGE CAP VALUE FUND | ||||||||
SCHEDULE OF INVESTMENTS - continued | ||||||||
March 31, 2007 | ||||||||
|
|
|
|
|
|
|
|
|
Shares |
| COMMON STOCKS - 82.92% - continued |
| Value | ||||
|
|
|
|
|
|
|
|
|
|
| Trucking & Courier Services (No Air) - 0.83% |
|
|
| |||
2,000 |
| United Parcel Service, Inc. - Class B |
|
|
| $ 140,200 | ||
|
|
|
|
|
|
|
|
|
|
| Wholesale - Drugs, Proprietaries & Druggist' Sundries - 1.38% |
|
| ||||
1,300 |
| AmerisourceBergen Corp. |
|
|
|
| 68,575 | |
2,800 |
| McKesson Corp. |
| 163,912 | ||||
|
|
|
|
|
|
|
| 232,487 |
|
|
|
|
|
|
|
|
|
|
|
|
|
|
|
|
|
|
|
| TOTAL COMMON STOCKS (Cost $13,713,053) |
|
| $ 13,992,564 | |||
|
|
|
|
|
|
|
|
|
Principal |
|
|
|
|
|
|
|
|
Value |
| FIXED INCOME OBLIGATIONS - 9.84% | ||||||
|
|
|
|
|
|
|
|
|
$ 170,000 |
| Fannie Mae, 4.250%, 08/15/10 |
|
|
| 167,217 | ||
280,000 |
| Fannie Mae, 6.000%, 05/15/08 | 283,026 | |||||
600,000 |
| Freddie Mac, 4.750%, 01/18/11 | 598,861 | |||||
100,000 |
| Freddie Mac, 5.750%, 01/15/12 | 103,912 | |||||
200,000 |
| U.S. Treasury Notes, 6.000%, 08/15/09 |
|
|
| 206,305 | ||
300,000 |
| U.S. Treasury Notes, 6.125%, 08/15/07 |
|
|
| 301,266 | ||
|
|
|
|
|
|
|
|
|
|
| TOTAL FIXED INCOME OBLIGATIONS (Cost $1,666,258) |
| $ 1,660,587 | ||||
Shares |
|
|
|
|
|
|
|
|
|
| MONEY MARKET SECURITIES - 5.58% | ||||||
|
|
|
|
|
|
|
|
|
552,319 |
| AIM STIT-STIC Prime Portfolio - Class I, 5.26% (c) |
|
| 552,319 | |||
389,001 |
| AIM STIT-LIQUID Assets Portfolio - Class I, 5.26% (c) |
| 389,001 | ||||
|
|
|
|
|
|
|
|
|
|
| TOTAL MONEY MARKET SECURITIES (Cost $941,320) |
| $ 941,320 | ||||
|
|
|
|
|
|
|
|
|
|
| TOTAL INVESTMENTS (Cost $16,320,631) - 98.34% |
| $ 16,594,471 | ||||
|
|
|
|
|
|
|
|
|
|
| Cash and other assets less liabilities - 1.66% |
|
| 281,054 | |||
|
|
|
|
|
|
|
|
|
|
| TOTAL NET ASSETS - 100.00% |
|
|
| $ 16,875,525 | ||
|
|
|
|
|
|
|
|
|
(a) Non-income producing securities. |
|
|
|
|
|
| ||
(b) American Depositary Receipt - A negotiable certificate issued by a U.S. bank representing a specific number of shares of a foreign stock traded on a U.S. exchange. | ||||||||
(c) Variable rate security; the money market rate shown represents the rate at March 31, 2007. | ||||||||
*See accompanying notes which are an integral part of these financial statements.
DEAN FUNDS | ||||||||
DEAN SMALL CAP VALUE FUND | ||||||||
SCHEDULE OF INVESTMENTS | ||||||||
March 31, 2007 | ||||||||
|
|
|
|
|
|
|
|
|
Shares |
| COMMON STOCKS - 96.61% |
|
|
|
| Value | |
|
|
|
|
|
|
|
|
|
|
| Abrasive, Asbestos & Miscellaneous Nonmetallic Mineral Products - 0.56% |
| |||||
2,500 |
| CARBO Ceramics, Inc. |
|
|
|
| $ 116,375 | |
|
|
|
|
|
|
|
|
|
|
| Air Transportation - 1.01% |
|
|
|
|
| |
28,000 |
| Mesa Air Group, Inc. (a) |
|
|
|
| 210,840 | |
|
|
|
|
|
|
|
|
|
|
| Ball & Roller Bearings - 1.02% |
| |||||
17,000 |
| NN, Inc. |
|
|
|
|
| 212,330 |
|
|
|
|
|
|
|
|
|
|
| Biological Products - 1.07% |
|
|
|
|
| |
3,500 |
| Invitrogen Corp. (a) |
|
|
|
| 222,775 | |
|
|
|
|
|
|
|
|
|
|
| Bottled & Canned Soft Drinks & Carbonated Waters - 1.07% |
|
| ||||
10,000 |
| PepsiAmericas, Inc. |
|
|
|
| 223,200 | |
|
|
|
|
|
|
|
|
|
|
| Broadwoven Fabric Mills - 1.12% |
|
|
|
| ||
6,500 |
| Albany International Corp. - Class A |
|
|
| 233,610 | ||
|
|
|
|
|
|
|
|
|
|
| Canned Fruits, Vegetables, Preserves, Jams & Jellies - 1.15% |
|
| ||||
4,500 |
| The J.M. Smucker Co. |
|
|
|
| 239,940 | |
|
|
|
|
|
|
|
|
|
|
| Communications Equipment - 1.09% |
|
|
|
| ||
12,000 |
| LoJack Corp. (a) |
|
|
|
|
| 227,760 |
|
|
|
|
|
|
|
|
|
|
| Computer Communications Equipment - 0.93% |
|
|
| |||
5,300 |
| Black Box Corp. |
|
|
|
|
| 193,662 |
|
|
|
|
|
|
|
|
|
|
| Crude Petroleum & Natural Gas - 1.81% |
| |||||
4,600 |
| Newfield Exploration Co. (a) |
|
|
|
| 191,866 | |
6,300 |
| Stone Energy Corp. (a) |
|
|
|
| 187,047 | |
|
|
|
|
|
|
|
| 378,913 |
|
|
|
|
|
|
|
|
|
|
| Dental Equipment & Supplies - 0.91% |
|
|
|
| ||
7,000 |
| Young Innovations, Inc. |
|
|
|
| 190,540 | |
|
|
|
|
|
|
|
|
|
|
| Electric & Other Services Combined - 1.03% |
|
|
| |||
5,000 |
| SCANA Corp. |
|
|
|
|
| 215,850 |
|
|
|
|
|
|
|
|
|
|
| Electric Lighting & Wiring Equipment - 0.99% |
|
|
| |||
4,300 |
| Hubbell, Inc. - Class B |
|
|
|
| 207,432 | |
|
|
|
|
|
|
|
|
|
|
| Electric Services - 2.61% |
|
|
|
|
| |
3,000 |
| Black Hills Corp. |
| 110,310 | ||||
7,000 |
| Great Plains Energy, Inc. |
|
|
|
| 227,150 | |
8,500 |
| Energy East Corp. |
| 207,060 | ||||
|
|
|
|
|
|
|
| 544,520 |
|
|
|
|
|
|
|
|
|
|
| Electronic Components & Accessories - 2.42% |
|
|
| |||
26,000 |
| KMET Corp. (a) |
|
|
|
|
| 198,900 |
22,000 |
| Vishay Intertechnology, Inc. (a) |
|
|
| 307,560 | ||
|
|
|
|
|
|
|
| 506,460 |
|
|
|
|
|
|
|
|
|
|
| Electronic Connectors - 1.41% |
|
| ||||
20,000 |
| Methode Electronics, Inc. - Class A |
|
|
| 295,400 | ||
|
|
|
|
|
|
|
|
|
*See accompanying notes which are an integral part of these financial statements.
DEAN FUNDS | ||||||||
DEAN SMALL CAP VALUE FUND | ||||||||
SCHEDULE OF INVESTMENTS - continued | ||||||||
March 31, 2007 | ||||||||
|
|
|
|
|
|
|
|
|
Shares |
| COMMON STOCKS - 96.61% - continued |
|
|
| Value | ||
|
|
|
|
|
|
|
|
|
|
| Engines & Turbines - 2.86% |
| |||||
7,000 |
| Briggs & Straton Corp. |
|
|
|
| $ 215,950 | |
12,000 |
| Brunswick Corp. |
| 382,200 | ||||
|
|
|
|
|
|
|
| 598,150 |
|
| . |
|
|
|
|
|
|
|
| Fire, Marine & Casualty Insurance - 3.03% |
|
| ||||
10,000 |
| Horace Mann Educators Corp. | 205,500 | |||||
3,300 |
| Transatlantic Holdings, Inc. |
|
|
|
| 214,896 | |
4,000 |
| Mercury General Corp. |
|
|
|
| 212,160 | |
|
|
|
|
|
|
|
| 632,556 |
|
|
|
|
|
|
|
|
|
|
| Footwear - 1.11% |
| |||||
9,000 |
| Kenneth Cole Productions, Inc. - Class A |
|
|
| 231,030 | ||
|
|
|
|
|
|
|
|
|
|
| Household Furniture - 1.89% |
| |||||
25,000 |
| Furniture Brands International, Inc. |
|
|
| 394,500 | ||
|
|
|
|
|
|
|
|
|
|
| Industrial Inorganic Chemicals - 0.78% |
|
|
|
| ||
10,000 |
| Georgia Gulf Corp. |
| 162,100 | ||||
|
|
|
|
|
|
|
|
|
|
| Industrial Instruments For Measurement - 1.04% |
|
|
| |||
10,000 |
| Cognex Corp. |
|
|
|
|
| 216,700 |
|
|
|
|
|
|
|
|
|
|
| Life Insurance - 0.89% |
|
|
|
|
| |
4,200 |
| Protective Life Corp. |
|
|
|
| 184,968 | |
|
|
|
|
|
|
|
|
|
|
| Metal Doors, Sash, Frames, Moldings & Trim - 1.07% |
| |||||
9,000 |
| Griffon Corp. (a) |
| 222,750 | ||||
|
|
|
|
|
|
|
|
|
|
| Miscellaneous Business Credit - 0.95% |
|
|
|
| ||
7,500 |
| Financial Federal Corp. |
|
|
|
| 197,400 | |
|
|
|
|
|
|
|
|
|
|
| Miscellaneous Chemical Products - 1.44% |
|
| ||||
9,500 |
| WD-40 Co. |
|
|
|
|
| 301,245 |
|
|
|
|
|
|
|
|
|
|
| Miscellaneous Electrical Machinery, Equipment & Supplies - 0.52% |
| |||||
4,000 |
| Excel Technology, Inc. (a) |
|
|
|
| 109,320 | |
|
|
|
|
|
|
|
|
|
|
| Miscellaneous Fabricated Metal Products - 1.06% |
|
|
| |||
5,500 |
| Crane Co. |
|
|
|
|
| 222,310 |
|
|
|
|
|
|
|
|
|
|
| Miscellaneous Plastic Products - 1.12% |
|
|
|
| ||
8,000 |
| Spartech Corp. |
|
|
|
|
| 234,720 |
|
|
|
|
|
|
|
|
|
|
| Miscellaneous Publishing - 0.78% |
|
|
|
| ||
18,000 |
| ProQuest Co. (a) |
|
|
|
|
| 162,000 |
|
|
|
|
|
|
|
|
|
|
| Motor Vehicle Parts & Accessories - 1.35% |
|
|
| |||
4,000 |
| Modine Manufacturing Co. |
|
|
|
| 91,600 | |
12,000 |
| Monaco Coach Corp. |
|
|
|
| 191,160 | |
|
|
|
|
|
|
|
| 282,760 |
*See accompanying notes which are an integral part of these financial statements.
DEAN FUNDS | ||||||||
DEAN SMALL CAP VALUE FUND | ||||||||
SCHEDULE OF INVESTMENTS - continued | ||||||||
March 31, 2007 | ||||||||
|
|
|
|
|
|
|
|
|
Shares |
| COMMON STOCKS - 96.61% - continued |
|
|
| Value | ||
|
|
|
|
|
|
|
|
|
|
| National Commercial Banks - 8.82% |
|
|
|
| ||
13,500 |
| Citizens Banking Corp. |
|
|
|
| $ 299,160 | |
14,000 |
| Corus Bankshares, Inc. |
|
|
|
| 238,840 | |
6,500 |
| Farmers Capital Bank Corp. |
|
|
|
| 190,970 | |
10,000 |
| FirstMerit Corp. |
|
|
|
|
| 211,100 |
13,000 |
| Fulton Financial Corp. |
|
|
|
| 188,890 | |
3,200 |
| Park National Corp. |
|
|
|
| 302,336 | |
8,000 |
| TCF Financial Corp. |
|
|
|
| 210,880 | |
11,000 |
| Old National Bancorp |
|
|
|
| 199,980 | |
|
|
|
|
|
|
|
| 1,842,156 |
|
|
|
|
|
|
|
|
|
|
| Natural Gas Distribution - 1.46% |
|
|
|
| ||
6,500 |
| The Laclede Group, Inc. |
|
|
|
| 202,020 | |
3,200 |
| WGL Holdings, Inc. |
|
|
|
| 102,336 | |
|
|
|
|
|
|
|
| 304,356 |
|
|
|
|
|
|
|
|
|
|
| Oil & Gas Field Machinery & Equipment - 0.84% |
|
|
| |||
25,000 |
| Newpark Resources, Inc. (a) |
|
|
|
| 176,250 | |
|
|
|
|
|
|
|
|
|
|
| Operative Builders - 0.46% |
|
|
|
|
| |
2,000 |
| M.D.C. Holdings, Inc. |
|
|
|
| 96,140 | |
|
|
|
|
|
|
|
|
|
|
| Perfumes, Cosmetics & Other Toilet Preparations - 0.52% |
|
| ||||
5,000 |
| Elizabeth Arden, Inc. (a) |
|
|
|
| 109,100 | |
|
|
|
|
|
|
|
|
|
|
| Pharmaceutical Preparations - 1.46% |
|
|
|
| ||
11,500 |
| Watson Pharmaceuticals, Inc. (a) |
|
|
| 303,945 | ||
|
|
|
|
|
|
|
|
|
|
| Printed Circuit Boards - 0.87% |
| |||||
8,500 |
| Jabil Circuit, Inc. |
| 181,985 | ||||
|
|
|
|
|
|
|
|
|
|
| Radio Broadcasting Stations - 1.01% |
|
|
|
| ||
25,000 |
| Emmis Communications Corp. - Class A |
|
|
| 211,000 | ||
|
|
|
|
|
|
|
|
|
|
| Real Estate Agents & Managers - 0.92% |
| |||||
17,000 |
| Bluegreen Corp. (a) |
|
|
|
| 191,930 | |
|
|
|
|
|
|
|
|
|
|
| Retail - Auto Dealers & Gasoline Stations - 1.28% |
|
|
| |||
20,000 |
| America's Car-Mart, Inc. (a) |
|
|
|
| 267,200 | |
|
|
|
|
|
|
|
|
|
|
| Retail - Drug Stores and Proprietary Stores - 1.01% |
|
|
| |||
5,300 |
| Omnicare, Inc. |
|
|
|
|
| 210,781 |
|
|
|
|
|
|
|
|
|
|
| Retail - Variety Stores - 1.49% |
|
| ||||
8,000 |
| Fred's, Inc. |
|
|
|
|
| 117,600 |
13,000 |
| Tuesday Morning Corp. |
|
|
|
| 192,920 | |
|
|
|
|
|
|
|
| 310,520 |
|
|
|
|
|
|
|
|
|
|
| Rolling, Drawing & Extruding of Nonferrous Metals - 2.64% |
|
| ||||
11,000 |
| Mueller Industries, Inc. |
|
|
|
| 331,100 | |
13,000 |
| Olin Corp. |
|
|
|
|
| 220,220 |
|
|
|
|
|
|
|
| 551,320 |
|
|
|
|
|
|
|
|
|
|
| Savings Institution, Federally Chartered - 1.09% |
|
|
| |||
13,000 |
| New York Community Bancorp, Inc. |
|
|
| 228,670 | ||
|
|
|
|
|
|
|
|
|
*See accompanying notes which are an integral part of these financial statements.
DEAN FUNDS | ||||||||
DEAN SMALL CAP VALUE FUND | ||||||||
SCHEDULE OF INVESTMENTS - continued | ||||||||
March 31, 2007 | ||||||||
|
|
|
|
|
|
|
|
|
Shares |
| COMMON STOCKS - 96.61% - continued |
|
|
| Value | ||
|
|
|
|
|
|
|
|
|
|
| Search, Detection, Navigation, Guidance, Aeronautical Systems - 1.50% |
| |||||
20,000 |
| Herley Industries, Inc. (a) |
|
|
|
| $ 312,400 | |
|
|
|
|
|
|
|
|
|
|
| Semiconductors & Related Devices - 2.18% |
|
|
| |||
14,000 |
| Photronics, Inc. (a) |
|
|
|
| 217,700 | |
14,000 |
| Zoran Corp. (a) |
|
|
|
|
| 238,280 |
|
|
|
|
|
|
|
| 455,980 |
|
|
|
|
|
|
|
|
|
|
| Services - Advertising - 0.99% |
| |||||
12,000 |
| Valassis Communications, Inc. (a) |
|
|
| 206,280 | ||
|
|
|
|
|
|
|
|
|
|
| Services - Amusement & Recreation - 2.16% |
|
|
| |||
20,000 |
| Multimedia Games, Inc. (a) |
|
|
|
| 238,000 | |
31,000 |
| Westwood One, Inc. |
|
|
|
| 212,970 | |
|
|
|
|
|
|
|
| 450,970 |
|
|
|
|
|
|
|
|
|
|
| Services - Business Services - 0.94% |
|
|
|
| ||
20,000 |
| StarTek, Inc. |
|
|
|
|
| 195,800 |
|
|
|
|
|
|
|
|
|
|
| Services - Computer Integrated Systems Design - 1.56% |
|
| ||||
13,500 |
| Integral Systems, Inc. |
|
|
|
| 326,295 | |
|
|
|
|
|
|
|
|
|
|
| Services - Computer Processing & Data Preparation - 1.69% |
|
| ||||
6,000 |
| Affiliated Computer Services, Inc. - Class A (a) |
|
| 353,280 | |||
|
|
|
|
|
|
|
|
|
|
| Services - Computer Programming Services - 0.58% |
| |||||
8,000 |
| JDA Software Group, Inc. (a) |
|
|
|
| 120,240 | |
|
|
|
|
|
|
|
|
|
|
| Services - Direct Mail Advertising - 1.93% |
| |||||
21,000 |
| InfoUSA, Inc. |
|
|
|
|
| 202,020 |
30,000 |
| Source Interlink Companies, Inc. (a) |
|
|
| 201,300 | ||
|
|
|
|
|
|
|
| 403,320 |
|
|
|
|
|
|
|
|
|
|
| Services - Hospitals - 0.53% |
|
|
|
|
| |
7,000 |
| RehabCare Group, Inc. (a) |
|
|
|
| 111,090 | |
|
|
|
|
|
|
|
|
|
|
| Services - Industries For The Printing Trade - 1.47% |
| |||||
17,000 |
| Schawk, Inc. |
|
|
|
|
| 307,870 |
|
|
|
|
|
|
|
|
|
|
| Services - Offices & Clinics of Doctors of Medicine - 1.17% |
|
| ||||
10,000 |
| AmSurg Corp. (a) |
| 244,900 | ||||
|
|
|
|
|
|
|
|
|
|
| State Commercial Bank - 5.50% |
|
|
|
| ||
38,000 |
| W Holding Co., Inc. |
|
|
|
| 190,000 | |
22,000 |
| CVB Financial Corp. |
|
|
|
| 261,800 | |
18,000 |
| Popular, Inc. |
|
|
|
|
| 298,080 |
8,500 |
| Royal Bancshares of Pennsylvania, Inc. - Class A |
|
| 201,875 | |||
8,000 |
| The South Financial Group, Inc. |
|
|
| 197,760 | ||
|
|
|
|
|
|
|
| 1,149,515 |
|
|
|
|
|
|
|
|
|
|
| Steel Works, Blast Furnaces & Rolling & Finishing Mills - 2.88% |
| |||||
12,000 |
| Steel Technologies, Inc. |
|
|
|
| 354,960 | |
12,000 |
| Worthington Industries, Inc. |
|
|
|
| 246,960 | |
|
|
|
|
|
|
|
| 601,920 |
|
|
|
|
|
|
|
|
|
|
| Surety Insurance - 0.83% |
|
|
|
|
| |
4,200 |
| Triad Guaranty, Inc. (a) |
|
|
|
| 173,922 | |
|
|
|
|
|
|
|
|
|
*See accompanying notes which are an integral part of these financial statements.
DEAN FUNDS | ||||||||
DEAN SMALL CAP VALUE FUND | ||||||||
SCHEDULE OF INVESTMENTS - continued | ||||||||
March 31, 2007 | ||||||||
|
|
|
|
|
|
|
|
|
Shares |
| COMMON STOCKS - 96.61% - continued | Value | |||||
|
|
|
|
|
|
|
|
|
|
| Surgical & Medical Instruments & Apparatus - 1.07% |
| |||||
3,300 |
| Teleflex, Inc. |
|
|
|
|
| $ 224,631 |
|
|
|
|
|
|
|
|
|
|
| Telephone Communications - 1.11% |
|
|
|
| ||
2,500 |
| CentruryTel, Inc. |
| 112,975 | ||||
8,000 |
| Citizens Communications Co. |
| 119,600 | ||||
|
|
|
|
|
|
|
| 232,575 |
|
|
|
|
|
|
|
|
|
|
| Title Insurance - 1.24% |
|
|
|
|
| |
3,500 |
| LandAmerica Financial Group, Inc. |
|
|
| 258,685 | ||
|
|
|
|
|
|
|
|
|
|
| Trucking - 1.04% |
|
| ||||
7,000 |
| Heartland Express, Inc. |
|
|
|
| 111,160 | |
3,000 |
| Arkansas Best Corp. |
|
|
|
| 106,650 | |
|
|
|
|
|
|
|
| 217,810 |
|
|
|
|
|
|
|
|
|
|
| Wholesale - Electronic Parts & Equipment - 1.08% |
|
|
| |||
6,000 |
| Arrow Electronics, Inc. (a) |
|
|
|
| 226,500 | |
|
|
|
|
|
|
|
|
|
|
| Wholesale - Paper and Paper Products - 1.20% |
|
|
| |||
4,200 |
| United Stationers, Inc. (a) |
|
|
|
| 251,664 | |
|
|
|
|
|
|
|
|
|
|
| TOTAL COMMON STOCKS (Cost $20,345,460) |
|
| $ 20,183,116 | |||
|
|
|
|
|
|
|
|
|
|
| REAL ESTATE INVESTMENT TRUSTS - 3.22% |
|
|
| |||
|
|
|
|
|
|
|
|
|
8,500 |
| Colonial Properties Trust |
|
|
|
| 388,195 | |
5,000 |
| Healthcare Realty Trust, Inc. |
|
|
|
| 186,500 | |
8,000 |
| HRPT Properties Trust |
|
|
|
| 98,400 | |
|
|
|
|
|
|
|
|
|
|
| TOTAL REAL ESTATE INVESTMENT TRUSTS (Cost $745,519) | $ 673,095 | |||||
|
|
|
|
|
|
|
|
|
|
| MONEY MARKET SECURITIES - 0.45% |
| |||||
|
|
|
|
|
|
|
|
|
93,804 |
| AIM STIT-STIC Prime Portfolio - Class I, 5.26% (b) |
|
| $ 93,804 | |||
|
|
|
|
|
|
|
|
|
|
| TOTAL MONEY MARKET SECURITIES (Cost $93,804) |
| $ 93,804 | ||||
|
|
|
|
|
|
|
|
|
|
| TOTAL INVESTMENTS (Cost $21,184,783) - 100.28% | $ 20,950,015 | |||||
|
|
|
|
|
|
|
|
|
|
| Liabilities in excess of other assets - (0.28)% |
|
| (59,201) | |||
|
|
|
|
|
|
|
|
|
|
| TOTAL NET ASSETS - 100.00% |
|
|
| $ 20,890,814 | ||
(a) Non-income producing securities. |
|
|
|
|
|
| ||
(b) Variable rate security; the money market rate shown represents the rate at March 31, 2007. |
| |||||||
*See accompanying notes which are an integral part of these financial statements.
DEAN FUNDS | ||||||||
DEAN INTERNATIONAL FUND | ||||||||
SCHEDULE OF INVESTMENTS | ||||||||
March 31, 2007 | ||||||||
|
|
|
|
|
|
|
|
|
|
|
|
|
|
|
|
|
|
Shares |
| COMMON STOCKS - 99.07% |
|
|
| Value | ||
|
|
|
|
|
|
|
|
|
|
| Argentina - 0.32% |
|
|
|
|
| |
2,938 |
| Pampa Holding SA (a) (c) |
| $ 55,411 | ||||
|
|
|
|
|
|
|
|
|
|
| Australia - 3.19% |
|
|
|
|
| |
17,815 |
| A.B.C. Learning Centres Ltd. |
|
|
| 104,769 | ||
57,724 |
| Telstra Corp. Ltd. |
|
|
|
| 217,299 | |
27,452 |
| Telstra Corp. Ltd. - Installment Receipt |
| 71,186 | ||||
25,411 |
| Transurban Group |
|
|
|
| 159,293 | |
|
|
|
|
|
|
|
| 552,547 |
|
|
|
|
|
|
|
|
|
|
| Belgium - 0.75% |
|
|
|
|
| |
1,042 |
| KBC GROEP NV |
|
|
|
| 129,154 | |
|
|
|
|
|
|
|
|
|
|
| Brazil - 7.00% |
|
| ||||
18,715 |
| All America Latina Logistica |
|
|
| 228,495 | ||
3,430 |
| Companhia de Bebidas das Americas (b) |
|
| 188,513 | |||
8,817 |
| Diagnosticos da America (a) |
|
|
| 196,077 | ||
9,692 |
| Gafisa SA |
|
|
|
|
| 123,163 |
10,000 |
| Natura Cosmeticos SA |
|
|
|
| 113,392 | |
2,532 |
| Petroleo Brasileiros SA (b) |
| 226,234 | ||||
4,100 |
| Porto Seguro SA |
|
|
|
| 136,266 | |
|
|
|
|
|
|
|
| 1,212,140 |
|
|
|
|
|
|
|
|
|
|
| Canada - 0.49% |
|
| ||||
47,021 |
| Oncolytics Biotech, Inc. (a) |
| 85,589 | ||||
|
|
|
|
|
|
|
|
|
|
| Chile - 0.57% |
|
| ||||
6,914 |
| Empresa Nacional de Telecomunicaciones SA |
|
| 99,440 | |||
|
|
|
|
|
|
|
|
|
|
| China - 0.87% |
|
| ||||
192,000 |
| Jiangsu Expressway Co. Ltd. |
|
|
| 149,879 | ||
|
|
|
|
|
|
|
|
|
|
| Columbia - 0.64% |
|
|
|
|
| |
13,117 |
| Suramericana de Inversiones SA |
|
|
| 110,513 | ||
|
|
|
|
|
|
|
|
|
|
| Finland - 0.72% |
|
| ||||
4,301 |
| Elisa Oyj |
|
|
|
|
| 124,186 |
|
|
|
|
|
|
|
|
|
|
| France - 9.45% |
|
| ||||
17,095 |
| Alcatel-Lucent |
| 200,488 | ||||
3,428 |
| Axa |
|
|
|
|
| 144,841 |
1,340 |
| L'Oreal SA |
|
|
|
|
| 145,791 |
2,293 |
| Sanofi-Aventis |
| 198,714 | ||||
1,249 |
| Societe Generale |
|
|
|
| 215,100 | |
2,911 |
| Thales SA |
|
|
|
|
| 168,413 |
3,159 |
| Total SA |
|
|
|
|
| 220,566 |
1,949 |
| Veolia Environnment |
|
|
|
| 144,411 | |
4,923 |
| Vivendi |
|
|
|
|
| 199,358 |
|
|
|
|
|
|
|
| 1,637,682 |
|
|
|
|
|
|
|
|
|
|
| Germany - 13.74% |
|
|
|
|
| |
997 |
| Allianz SE |
|
|
|
|
| 204,390 |
11,803 |
| comdirect bank AG |
|
|
|
| 187,289 | |
1,298 |
| Deutsche Boerse AG |
|
|
|
| 297,130 | |
5,590 |
| Deutsche Post AG |
|
|
|
| 168,474 | |
2,053 |
| Deutsche Postbank AG |
|
|
|
| 177,642 | |
2,814 |
| Deutsche Wohnen AG |
|
|
|
| 148,529 | |
2,704 |
| E.ON AG |
|
|
|
|
| 364,349 |
1,023 |
| Fresenius Medical Care AG & Co. KGaA |
|
| 148,030 | |||
1,220 |
| Henkel KGaA |
|
| 179,833 | |||
*See accompanying notes which are an integral part of these financial statements.
DEAN INTERNATIONAL FUND | ||||||||
SCHEDULE OF INVESTMENTS - continued | ||||||||
March 31, 2007 | ||||||||
|
|
|
|
|
|
|
|
|
|
|
|
|
|
|
|
|
|
Shares |
| COMMON STOCKS - 99.07% - continued |
|
| Value | |||
|
|
|
|
|
|
|
|
|
|
| Germany - 13.74% - continued |
|
|
|
| ||
980 |
| K+S AG |
|
|
|
|
| $ 107,367 |
5,276 |
| Praktiker Bau-und Heimwerkermaerkte Holding AG |
| 185,559 | ||||
8,176 |
| Symrise AG (a) |
| 211,039 | ||||
|
|
|
|
|
|
|
| 2,379,631 |
|
|
|
|
|
|
|
|
|
|
| Hong Kong - 2.25% |
|
|
|
|
| |
19,500 |
| Esprit Holdings Ltd. |
|
|
|
| 228,706 | |
646,000 |
| Shanghai Real Estates Ltd. |
| 161,204 | ||||
|
|
|
|
|
|
|
| 389,910 |
|
|
|
|
|
|
|
|
|
|
| Indonesia - 1.32% |
|
|
|
|
| |
68,500 |
| PT Astra International Tbk |
| 99,090 | ||||
232,500 |
| PT Bank Central Asia Tbk |
| 129,945 | ||||
|
|
|
|
|
|
|
| 229,035 |
|
|
|
|
|
|
|
|
|
|
| Italy - 2.45% |
|
| ||||
49,434 |
| Compagnia Assicuratrice Unipol SpA |
|
|
| 179,981 | ||
25,729 |
| UniCredito Italiano SpA |
|
|
|
| 244,035 | |
|
|
|
|
|
|
|
| 424,016 |
|
|
|
|
|
|
|
|
|
|
| Japan - 11.11% |
|
| ||||
3,600 |
| Canon, Inc. |
|
|
|
|
| 192,996 |
12,000 |
| The Daimaru, Inc. |
|
|
|
| 155,190 | |
42 |
| Japan Tobacco, Inc. |
|
|
|
| 205,954 | |
5,000 |
| Kao Corp. |
|
|
|
|
| 146,094 |
11 |
| Mitsubishi UFJ Financial Group, Inc. |
|
|
| 123,904 | ||
30 |
| Mizuho Financial Group, Inc. |
|
|
| 192,844 | ||
7,200 |
| NSD Co., Ltd. |
|
| 111,224 | |||
25 |
| NTT Data Corp. |
|
|
|
| 126,826 | |
6,300 |
| Toyota Motor Corp. |
|
|
|
| 402,837 | |
2,880 |
| Yamada Denki Co. Ltd. |
|
|
|
| 267,816 | |
|
|
|
|
|
|
|
| 1,925,685 |
|
|
|
|
|
|
|
|
|
|
| Kazakhstan - 0.72% |
|
|
|
|
| |
6,449 |
| Kazkommertsbank (a) (c) |
|
|
|
| 125,111 | |
|
|
|
|
|
|
|
|
|
|
| Malaysia - 1.91% |
|
|
|
|
| |
109,600 |
| AMMB Holdings Berhad |
|
|
|
| 119,189 | |
65,900 |
| Bursa Malaysia Bhd |
|
|
|
| 211,566 | |
|
|
|
|
|
|
|
| 330,755 |
|
|
|
|
|
|
|
|
|
|
| Norway - 1.04% |
|
|
|
|
| |
6,676 |
| Statoil ASA |
|
|
|
|
| 181,006 |
|
|
|
|
|
|
|
|
|
|
| Netherlands - 3.97% |
|
|
|
|
| |
4,937 |
| Koninklijke Numico NV |
|
|
|
| 253,751 | |
6,850 |
| Koninklijke Philips Electronics NV |
|
|
| 260,705 | ||
9,794 |
| Reed Elsevier NV |
|
|
|
| 172,621 | |
|
|
|
|
|
|
|
| 687,077 |
|
|
|
|
|
|
|
|
|
|
| Russia - 0.80% |
|
|
| |||
4,867 |
| Sistema JSFC (c) |
|
|
|
| 138,223 | |
|
|
|
|
|
|
|
|
|
|
| Singapore - 2.38% |
|
|
|
|
| |
13,000 |
| DBS Group Holdings Ltd. |
|
| 183,219 | |||
21,000 |
| Singapore Airlines Ltd. |
|
|
|
| 229,584 | |
|
|
|
|
|
|
|
| 412,803 |
*See accompanying notes which are an integral part of these financial statements.
DEAN FUNDS | ||||||||
DEAN INTERNATIONAL FUND | ||||||||
SCHEDULE OF INVESTMENTS - continued | ||||||||
March 31, 2007 | ||||||||
|
|
|
|
|
|
|
|
|
|
|
|
|
|
|
|
|
|
Shares |
| COMMON STOCKS - 99.07% - continued |
|
| Value | |||
|
|
|
|
|
|
|
|
|
|
| South Korea - 2.37% |
|
|
|
|
| |
2,610 |
| Hana Financial Group, Inc. |
| $ 135,134 | ||||
12,032 |
| LG Telecom Ltd. (a) |
|
|
|
| 136,873 | |
830 |
| Samsung Fire & Marine Insurance Co., Ltd. |
|
| 138,980 | |||
|
|
|
|
|
|
|
| 410,987 |
|
|
|
|
|
|
|
|
|
|
| South Africa - 0.66% |
|
|
|
|
| |
8,443 |
| MTN Group Ltd. |
|
|
|
| 114,669 | |
|
|
|
|
|
|
|
|
|
|
| Sweden - 3.23% |
|
|
|
|
| |
46,928 |
| Telefonaktiebolaget LM Ericsson - Class B |
|
| 171,897 | |||
8,707 |
| Nordea Bank AB |
|
|
|
| 138,372 | |
4,000 |
| Skandinaviska Enskilda Banken AB |
|
|
| 127,421 | ||
7,456 |
| Tele2 AB - Class B |
|
|
|
| 121,679 | |
|
|
|
|
|
|
|
| 559,369 |
|
| Switzerland - 10.41% |
|
|
|
|
| |
2,975 |
| Compagnie Financiere Richemont SA |
| 165,589 | ||||
1,154 |
| Nestlé SA |
|
|
|
|
| 447,355 |
530 |
| Nobel Biocare Holding AG |
| 192,325 | ||||
8,096 |
| Novartis AG |
|
|
|
|
| 462,231 |
2,050 |
| Roche Holding AG |
|
|
|
| 361,034 | |
920 |
| Syngenta AG |
| 175,213 | ||||
|
|
|
|
|
|
|
| 1,803,747 |
|
|
|
|
|
|
|
|
|
|
| Thailand - 1.36% |
|
|
|
|
| |
36,500 |
| Bangkok Bank plc |
|
|
|
| 117,809 | |
60,500 |
| Siam Commercial Bank plc |
| 117,509 | ||||
|
|
|
|
|
|
|
| 235,318 |
|
|
|
|
|
|
|
|
|
|
| Taiwan - 0.73% |
|
| ||||
14,012 |
| Fubon Financial Holding Co., Ltd. (c) |
|
|
| 126,108 | ||
|
|
|
|
|
|
|
|
|
|
| United Kingdom - 13.68% |
|
| ||||
5,263 |
| Anglo American plc |
|
|
|
| 276,310 | |
24,338 |
| BP plc |
|
|
|
|
| 263,475 |
9,275 |
| British American Tobacco plc |
|
|
| 289,037 | ||
13,683 |
| GlaxoSmithKline plc |
|
|
|
| 374,880 | |
30,866 |
| ICAP plc |
|
|
|
|
| 321,130 |
14,785 |
| Smith & Nephew plc |
|
|
|
| 187,313 | |
9,891 |
| Standard Chartered plc |
|
|
|
| 283,986 | |
84,621 |
| Vodafone Group plc |
|
|
|
| 224,871 | |
2,903 |
| Xstrata plc |
|
|
|
|
| 148,708 |
|
|
|
|
|
|
|
| 2,369,710 |
|
|
|
|
|
|
|
|
|
|
| United States - 0.94% |
|
|
|
|
| |
1,329 |
| Synthes Inc. |
|
|
|
|
| 163,295 |
|
|
|
|
|
|
|
|
|
|
| TOTAL COMMON STOCKS (Cost $14,662,325) |
| $ 17,162,996 | ||||
|
|
|
|
|
|
|
|
|
*See accompanying notes which are an integral part of these financial statements.
DEAN FUNDS | ||||||||
DEAN INTERNATIONAL FUND | ||||||||
SCHEDULE OF INVESTMENTS - continued | ||||||||
March 31, 2007 | ||||||||
|
|
|
|
|
|
|
|
|
|
|
|
|
|
|
|
|
|
Shares |
| MONEY MARKET SECURITIES - 0.68% |
|
| Value | |||
|
|
|
|
|
|
|
|
|
118,462 |
| Dreyfus Cash Management , 5.16% (d) |
| 118,462 | ||||
|
|
|
|
|
|
|
|
|
|
| TOTAL MONEY MARKET SECURITIES (Cost $118,462) |
| $ 118,462 | ||||
|
|
|
|
|
|
|
|
|
|
| TOTAL INVESTMENTS (Cost $14,780,787) - 99.75% |
| $ 17,281,458 | ||||
|
|
|
|
|
|
|
|
|
|
| Cash & other assets less liabilities - 0.25% |
|
| 43,076 | |||
|
|
|
|
|
|
|
|
|
|
| TOTAL NET ASSETS - 100.00% |
|
|
| $ 17,324,534 | ||
|
|
|
|
|
|
|
|
|
(a) Non-income producing securities.
(b) American Depositary Receipt - A negotiable certificate issued by a U.S. bank representing a specific number of shares of a foreign stock traded on a U.S. exchange.
(c) Global Depositary Receipt - A negotiable certificate held in the bank of one country representing a specific number of shares of a stock traded on an exchange of another country.
(d) Variable rate security; the money market rate shown represents the rate at March 31, 2007.
*See accompanying notes which are an integral part of these financial statements.
DEAN FUNDS | ||||||||
DEAN INTERNATIONAL FUND | ||||||||
SCHEDULE OF INVESTMENTS - continued | ||||||||
March 31, 2007 | ||||||||
|
|
|
|
|
|
|
|
|
|
|
|
|
|
|
|
|
|
DIVERSIFICATION OF ASSETS: |
| Percentage of | ||||||
|
|
|
|
|
|
|
| Net Assets |
Banking |
|
|
|
|
|
|
| 14.08% |
Pharmaceutical |
|
|
|
|
|
|
| 10.54% |
Communications |
| 10.09% | ||||||
Financial Services |
|
|
|
|
|
| 8.26% | |
Transportation |
|
|
|
|
|
|
| 5.40% |
Oil & Natural Gas |
|
|
|
|
|
| 5.15% | |
Food & Beverages |
|
|
|
|
|
| 5.14% | |
Insurance |
|
|
|
|
|
|
| 4.64% |
Electronics |
|
|
|
|
|
|
| 4.02% |
Personal Care |
|
|
|
|
|
|
| 3.75% |
Motor Vehicles |
|
|
|
|
|
|
| 2.90% |
Tobacco Products |
|
|
|
|
|
| 2.86% | |
Mining and Metals |
|
|
|
|
|
| 2.45% | |
Retail |
|
|
|
|
|
|
| 1.85% |
Media |
|
|
|
|
|
|
| 1.15% |
Building Materials |
|
|
|
|
|
| 1.07% | |
Computers |
|
|
|
|
|
|
| 0.64% |
Other |
|
|
|
|
|
|
| 15.08% |
Total |
|
|
|
|
|
|
| 99.07% |
Money Market |
|
|
|
|
|
|
| 0.68% |
Cash and other assets less liabilities |
|
|
|
|
| 0.25% | ||
Grand Total |
|
|
|
|
|
|
| 100.00% |
|
|
|
|
|
|
|
|
|
*See accompanying notes which are an integral part of these financial statements.
DEAN FUNDS |
|
|
|
|
|
STATEMENTS OF ASSETS & LIABILITIES |
|
|
|
|
|
March 31, 2007 |
|
|
|
|
|
|
|
|
|
|
|
| Large Cap |
| Small Cap |
| International |
| Value Fund |
| Value Fund |
| Fund |
|
|
|
|
|
|
ASSETS |
|
|
|
|
|
Investment in securities: |
|
|
|
|
|
At cost | $ 16,320,631 |
| $ 21,184,783 |
| $ 14,780,787 |
At value | $ 16,594,471 |
| $ 20,950,015 |
| $ 17,281,458 |
|
|
|
|
|
|
Cash | 309,088 |
| - |
| 7 |
Foreign cash translated into U.S. dollars (Cost $20,744) | - |
| - |
| 20,737 |
Dividends receivable | 18,774 |
| 22,908 |
| 43,864 |
Interest receivable | 20,282 |
| 424 |
| 1,148 |
Receivable for SEC settlement | - |
| - |
| 69,748 |
Tax reclaims receivable | - |
| - |
| 12,019 |
Unrealized appreciation on forward foreign currency exchange contracts (a) | - |
| - |
| 3,556 |
Receivable due from administrator (b) | - |
| 63,000 |
| - |
Receivable for securities sold | - |
| - |
| 110,850 |
Receivable for capital shares sold | - |
| 318 |
| 529 |
Prepaid Expenses | 10,085 |
| 10,086 |
| 10,032 |
TOTAL ASSETS | 16,952,700 |
| 21,046,751 |
| 17,553,948 |
|
|
|
|
|
|
LIABILITIES |
|
|
|
|
|
Payable to Adviser (c) | 28,917 |
| 58,819 |
| 27,412 |
Accrued tax penalty and interest (b) | - |
| 63,000 |
| - |
Payable for securities purchased | - |
| - |
| 132,066 |
Unrealized depreciation on forward foreign currency exchange contracts (a) | - |
| - |
| 614 |
Payable to administrator, fund accountant and transfer agent | 4,114 |
| 5,513 |
| 19,442 |
Payable to trustees | 1,710 |
| 5,562 |
| 4,752 |
Other liabilities | 42,434 |
| 23,043 |
| 45,128 |
TOTAL LIABILITIES | 77,175 |
| 155,937 |
| 229,414 |
|
|
|
|
|
|
NET ASSETS | $ 16,875,525 |
| $ 20,890,814 |
| $ 17,324,534 |
|
|
|
|
|
|
Net assets consist of: |
|
|
|
|
|
Paid in capital | $ 18,271,011 |
| $ 16,158,402 |
| $ 13,365,068 |
Accumulated undistributed net investment income (loss) | - |
| 21,000 |
| 132,316 |
Accumulated net realized gains (losses) from security transactions | (1,669,326) |
| 4,946,180 |
| 1,322,824 |
Net unrealized appreciation on investments | 273,840 |
| (234,768) |
| 2,500,671 |
Net unrealized depreciation on translation of assets and liabilities in foreign currencies | - |
| - |
| 3,655 |
NET ASSETS | $ 16,875,525 |
| $ 20,890,814 |
| $ 17,324,534 |
|
|
|
|
|
|
Shares of beneficial interest outstanding (unlimited numbers of shares authorized) | 1,347,534 |
| 1,329,669 |
| 1,038,639 |
|
|
|
|
|
|
Net asset value and redemption price per share (d) | $ 12.52 |
| $ 15.71 |
| $ 16.68 |
|
|
|
|
|
|
Maximum offering price per share (e) | $ 13.21 |
| $ 16.58 |
| $ 17.60 |
|
|
|
|
|
|
|
|
|
|
|
|
(a) See Note 5 in the Notes to the Financial Statements. |
| ||
(b) See Note 12 in the Notes to the Financial Statements. |
| ||
(c) See Note 3 in the Notes to the Financial Statements. |
| ||
(d) A contingent deferred sales charge ("CDSC") of 1% may be charged on shares redeemed within 1 year of purchase if a front-end sales load was not charged. | |||
(e) Reflects a maximum sales charge of 5.25% that may be charged on purchases of less than $500,000. |
| ||
*See accompanying notes which are an integral part of these financial statements.
DEAN FUNDS |
|
|
|
|
|
STATEMENTS OF OPERATIONS* |
|
|
|
|
|
For the Fiscal Year Ended March 31, 2007 |
|
|
|
|
|
|
|
|
|
|
|
|
|
|
|
|
|
| Large Cap |
| Small Cap |
| International |
| Value Fund |
| Value Fund |
| Fund |
INVESTMENT INCOME |
|
|
|
|
|
Dividends (net of foreign withholding taxes of $2,560 & $49,880 for the Large Cap Value |
|
|
|
|
|
Fund and International Fund, respectively) | $ 142,523 |
| $ 248,456 |
| $ 358,200 |
Interest | 7,192 |
| 19,597 |
| 8,397 |
Miscellaneous Income (a) | - |
| - |
| 69,748 |
TOTAL INCOME | 149,715 |
| 268,053 |
| 436,345 |
|
|
|
|
|
|
EXPENSES |
|
|
|
|
|
Investment advisory fees (b) | 85,723 |
| 194,521 |
| 213,439 |
Fund accounting expenses | 23,500 |
| 23,500 |
| 23,500 |
Transfer agent expenses | 22,846 |
| 30,613 |
| 27,676 |
Registration fees, Class A | 19,991 |
| 19,880 |
| 19,048 |
Administration expenses | 12,917 |
| 17,516 |
| 15,496 |
Audit expenses | 12,413 |
| 14,513 |
| 17,359 |
Custody expenses | 8,594 |
| 16,364 |
| 57,807 |
Legal expenses | 7,863 |
| 14,776 |
| 13,761 |
Pricing expenses | 5,336 |
| 5,729 |
| 17,611 |
Registration fees, Class C | 4,481 |
| 4,547 |
| 4,832 |
Trustees expenses | 3,314 |
| 8,804 |
| 8,051 |
Printing expenses | 3,187 |
| 5,166 |
| 5,056 |
Insurance expenses | 1,737 |
| 3,971 |
| 3,468 |
Miscellaneous expenses | 1,550 |
| 64,550 |
| 2,697 |
TOTAL EXPENSES | 213,452 |
| 424,450 |
| 429,801 |
Fees waived by Adviser (b) | (53,743) |
| (3,413) |
| (67,602) |
Expense paid by administrator (c) | - |
| (63,000) |
| - |
NET EXPENSES | 159,709 |
| 358,037 |
| 362,199 |
|
|
|
|
|
|
NET INVESTMENT INCOME (LOSS) | $ (9,994) |
| $ (89,984) |
| $ 74,146 |
|
|
|
|
|
|
REALIZED & UNREALIZED GAINS (LOSSES) |
|
|
|
|
|
Net realized gains from: |
|
|
|
|
|
Security transactions | $ 1,249,998 |
| $ 4,419,955 |
| $ 2,491,890 |
Foreign currency transactions (d) | - |
| - |
| 12,609 |
Change in unrealized appreciation (depreciation) on: |
|
|
|
|
|
Investments | (432,601) |
| (3,601,868) |
| (1,256,019) |
Foreign currency translation (d) | - |
| - |
| 20,745 |
|
|
|
|
|
|
NET REALIZED & UNREALIZED GAINS |
|
|
|
|
|
ON INVESTMENTS & FOREIGN CURRENCIES | 817,397 |
| 818,087 |
| 1,269,225 |
|
|
|
|
|
|
|
|
|
|
|
|
NET INCREASE IN NET ASSETS FROM OPERATIONS | $ 807,403 |
| $ 728,103 |
| $ 1,343,371 |
|
|
|
|
|
|
|
|
|
|
|
|
*Includes income and expenses for Class C shares through the merger into Class A on October 27, 2006. See Note 1 in the Notes to the Financial Statements. | |||||
|
|
|
|
|
|
(a) Income as a result of an SEC litigation settlement. |
|
|
|
|
|
(b) See Note 3 in the Notes to the Financial Statements. |
|
|
|
|
|
(c) See Note 12 in the Notes to the Financial Statements. |
|
|
|
|
|
(d) See Note 5 in the Notes to the Financial Statements. |
|
|
|
|
|
*See accompanying notes which are an integral part of these financial statements.
DEAN FUNDS |
|
|
|
|
|
|
STATEMENTS OF CHANGES IN NET ASSETS |
|
|
|
|
| |
|
|
|
| Large Cap Value Fund | ||
|
|
|
|
|
|
|
|
|
|
| Year Ended |
| Year Ended |
|
|
|
| March 31, 2007 |
| March 31, 2006 |
|
|
|
|
|
|
|
FROM OPERATIONS: |
|
|
|
|
|
|
Net investment loss |
|
|
| $ (9,994) |
| $ (8,677) |
Net realized gains from security transactions |
|
| 1,249,998 |
| 894,600 | |
Change in net unrealized appreciation (depreciation) on investments |
| (432,601) |
| 24,035 | ||
Net increase in net assets from operations |
|
| 807,403 |
| 909,958 | |
|
|
|
|
|
|
|
FROM CAPITAL SHARE TRANSACTIONS: |
|
|
|
|
| |
Class A |
|
|
|
|
|
|
Proceeds from shares sold |
|
|
| 85,361 |
| 349,674 |
Cost of shares issued in exchange for Class C shares |
| 219,811 |
| - | ||
Assets acquired from Balanced Fund merger |
|
| 8,149,355 |
| - | |
Reinvestment of distributions |
|
|
| - |
| - |
Amounts paid for shares redeemed |
|
|
| (537,010) |
| (451,568) |
Net increase (decrease) in net assets from Class A share transactions |
| 7,917,517 |
| (101,894) | ||
|
|
|
|
|
|
|
Class C |
|
|
|
|
|
|
Proceeds from shares sold |
|
|
| 5,346 |
| 28,814 |
Reinvestment of distributions |
|
|
| - |
| - |
Cost of shares sold in exchange for Class A shares |
| (219,811) |
|
| ||
Payments for shares redeemed |
|
|
| (94,930) |
| (345,786) |
Net decrease in net assets from Class C share transactions |
| (309,395) |
| (316,972) | ||
|
|
|
|
|
|
|
Net increase (decrease) in net assets from capital share transactions |
| 7,608,122 |
| (418,866) | ||
|
|
|
|
|
|
|
TOTAL INCREASE IN NET ASSETS |
|
|
| 8,415,525 |
| 491,092 |
|
|
|
|
|
|
|
NET ASSETS: |
|
|
|
|
|
|
Beginning of year |
|
|
| 8,460,000 |
| 7,968,908 |
|
|
|
|
|
|
|
End of year |
|
|
| $ 16,875,525 |
| $ 8,460,000 |
|
|
|
|
|
|
|
ACCUMULATED UNDISTRIBUTED |
|
|
|
|
|
|
NET INVESTMENT INCOME |
|
|
| $ - |
| $ - |
|
|
|
|
|
|
|
CAPITAL SHARE ACTIVITY: |
|
|
|
|
|
|
Class A |
|
|
|
|
|
|
Shares sold |
|
|
| 7,140 |
| 32,323 |
Shares issued in exchange for Class C shares |
|
| 18,026 |
| - | |
Shares received in Balanced Fund merger |
|
| 650,737 |
| - | |
Shares redeemed |
|
|
| (45,003) |
| (42,001) |
Net increase (decrease) in shares outstanding |
|
| 630,900 |
| (9,678) | |
|
|
|
|
|
|
|
Class C |
|
|
|
|
|
|
Shares sold |
|
|
| 491 |
| 2,943 |
Shares redeemed in exchange for Class A shares |
| (19,562) |
|
| ||
Shares redeemed |
|
|
| (8,641) |
| (35,967) |
Net decrease in shares outstanding |
|
|
| (27,712) |
| (33,024) |
|
|
|
|
|
|
|
*See accompanying notes which are an integral part of these financial statements.
DEAN FUNDS |
|
|
|
|
|
|
STATEMENTS OF CHANGES IN NET ASSETS - continued |
|
|
|
| ||
|
|
|
|
|
|
|
|
|
|
| Small Cap Value Fund | ||
|
|
|
|
|
|
|
|
|
|
| Year Ended |
| Year Ended |
|
|
|
| March 31, 2007 |
| March 31, 2006 |
|
|
|
|
|
|
|
FROM OPERATIONS: |
|
|
|
|
|
|
Net investment loss |
|
|
| $ (89,984) |
| $ (135,227) |
Net realized gains from security transactions |
|
| 4,419,955 |
| 1,762,178 | |
Change in net unrealized appreciation (depreciation) on investments |
| (3,601,868) |
| 1,422,794 | ||
Net increase in net assets from operations |
|
| 728,103 |
| 3,049,745 | |
|
|
|
|
|
|
|
DISTRIBUTIONS TO SHAREHOLDERS: |
|
|
|
|
| |
From net investment income, Class A |
|
| - |
| (967,385) | |
From capital gains, Class A |
|
|
| (995,346) |
| (19,333) |
Decrease in net assets from distributions to shareholders |
| (995,346) |
| (986,718) | ||
|
|
|
|
|
|
|
FROM CAPITAL SHARE TRANSACTIONS: |
|
|
|
|
| |
Class A |
|
|
|
|
|
|
Proceeds from shares sold |
|
|
| 2,200,932 |
| 292,609 |
Cost of shares issued in exchange for Class C shares |
| 321,805 |
| - | ||
Reinvestment of distributions |
|
|
| 944,102 |
| 914,114 |
Amounts paid for shares redeemed |
|
|
| (1,325,901) |
| (762,552) |
Net increase (decrease) in net assets from Class A share transactions |
| 2,140,938 |
| 444,171 | ||
|
|
|
|
|
|
|
Class C |
|
|
|
|
|
|
Proceeds from shares sold |
|
|
| 1,813 |
| 88,946 |
Reinvestment of distributions |
|
|
| - |
| 6,184 |
Cost of shares sold in exchange for Class A shares |
| (321,805) |
|
| ||
Payments for shares redeemed |
|
|
| (7,510) |
| (186,018) |
|
|
|
|
|
|
|
Net decrease in net assets from Class C share transactions |
| (327,502) |
| (90,888) | ||
|
|
|
|
|
|
|
Net increase (decrease) in net assets from capital share transactions |
| 1,813,436 |
| 353,283 | ||
|
|
|
|
|
|
|
TOTAL INCREASE IN NET ASSETS |
|
|
| 1,546,193 |
| 2,416,310 |
|
|
|
|
|
|
|
NET ASSETS: |
|
|
|
|
|
|
Beginning of year |
|
|
| 19,344,621 |
| 16,928,311 |
|
|
|
|
|
|
|
End of year |
|
|
| $ 20,890,814 |
| $ 19,344,621 |
|
|
|
|
|
|
|
ACCUMULATED UNDISTRIBUTED |
|
|
|
|
|
|
NET INVESTMENT INCOME |
|
|
| $ - |
| $ - |
|
|
|
|
|
|
|
CAPITAL SHARE ACTIVITY: |
|
|
|
|
|
|
Class A |
|
|
|
|
|
|
Shares sold |
|
|
| 145,754 |
| 19,722 |
Shares issued in exchange for Class C shares |
|
| 20,604 |
| - | |
Shares issued in reinvestment of distributions |
|
| 61,305 |
| 62,826 | |
Shares redeemed |
|
|
| (85,218) |
| (49,720) |
Net increase in shares outstanding |
|
|
| 142,445 |
| 32,828 |
|
|
|
|
|
|
|
Class C |
|
|
|
|
|
|
Shares sold |
|
|
| 122 |
| 6,328 |
Shares issued in reinvestment of distributions |
|
| - |
| 444 | |
Shares redeemed in exchange for Class A shares |
| (21,716) |
|
| ||
Shares redeemed |
|
|
| (521) |
| (12,980) |
Net decrease in shares outstanding |
|
|
| (22,115) |
| (6,208) |
*See accompanying notes which are an integral part of these financial statements.
DEAN FUNDS |
|
|
|
|
|
|
STATEMENTS OF CHANGES IN NET ASSETS - continued |
|
|
|
| ||
|
|
|
|
|
|
|
|
|
|
| International Fund | ||
|
|
|
|
|
|
|
|
|
|
| Year Ended |
| Year Ended |
|
|
|
| March 31, 2007 |
| March 31, 2006 |
|
|
|
|
|
|
|
FROM OPERATIONS: |
|
|
|
|
|
|
Net investment income |
|
|
| $ 74,146 |
| $ 100,936 |
Net realized gains (losses) from: |
|
|
|
|
|
|
Security transactions |
|
|
| 2,491,890 |
| 2,155,255 |
Foreign currency transactions |
|
|
| 12,609 |
| (38,379) |
Net change in net unrealized appreciation (depreciation) on: |
|
|
|
| ||
Investments |
|
|
| (1,256,019) |
| 1,498,326 |
Foreign currency translation |
|
|
| 20,745 |
| (21,753) |
Net increase in net assets from operations |
|
| 1,343,371 |
| 3,694,385 | |
|
|
|
|
|
|
|
DISTRIBUTIONS TO SHAREHOLDERS: |
|
|
|
|
| |
From net investment income, Class A |
|
| (35,720) |
| (40,453) | |
From net investment income, Class C |
|
| - |
| (3,493) | |
Decrease in net assets from distributions to shareholders |
| (35,720) |
| (43,946) | ||
|
|
|
|
|
|
|
FROM CAPITAL SHARE TRANSACTIONS: |
|
|
|
|
| |
Class A |
|
|
|
|
|
|
Proceeds from shares sold |
|
|
| 494,678 |
| 109,369 |
Cost of shares issued in exchange for Class C shares |
| 791,838 |
| - | ||
Reinvestment of distributions |
|
|
| 29,298 |
| 34,333 |
Amounts paid for shares redeemed |
|
|
| (1,375,162) |
| (618,851) |
Net decrease in net assets from Class A share transactions |
| (59,348) |
| (475,149) | ||
|
|
|
|
|
|
|
Class C |
|
|
|
|
|
|
Proceeds from shares sold |
|
|
| 141,934 |
| 69,179 |
Reinvestment of distributions |
|
|
| - |
| 1,272 |
Cost of shares sold in exchange for Class A shares |
| (791,838) |
|
| ||
Payments for shares redeemed |
|
|
| (167,107) |
| (435,557) |
Net decrease in net assets from Class C share transactions |
| (817,011) |
| (365,106) | ||
|
|
|
|
|
|
|
Net decrease in net assets from capital share transactions |
| (876,359) |
| (840,255) | ||
|
|
|
|
|
|
|
TOTAL INCREASE IN NET ASSETS |
| 431,292 |
| 2,810,184 | ||
|
|
|
|
|
|
|
NET ASSETS: |
|
|
|
|
|
|
Beginning of year |
|
|
| 16,893,242 |
| 14,083,058 |
|
|
|
|
|
|
|
End of year |
|
|
| $ 17,324,534 |
| $ 16,893,242 |
|
|
|
|
|
|
|
ACCUMULATED UNDISTRIBUTED |
|
|
|
|
|
|
NET INVESTMENT INCOME |
|
|
| $ 132,316 |
| $ 93,889 |
|
|
|
|
|
|
|
CAPITAL SHARE ACTIVITY: |
|
|
|
|
|
|
Class A |
|
|
|
|
|
|
Shares sold |
|
|
| 30,936 |
| 8,162 |
Shares issued in exchange for Class C shares |
|
| 50,969 |
|
| |
Shares issued in reinvestment of distributions |
|
| 1,801 |
| 2,479 | |
Shares redeemed |
|
|
| (84,745) |
| (47,459) |
Net decrease in shares outstanding |
| (1,039) |
| (36,818) | ||
|
|
|
|
|
|
|
Class C |
|
|
|
|
|
|
Shares sold |
|
|
| 9,290 |
| 5,476 |
Shares issued in reinvestment of distributions |
|
| - |
| 95 | |
Shares redeemed in exchange for Class A shares |
| (53,010) |
|
| ||
Shares redeemed |
|
|
| (11,517) |
| (35,611) |
Net decrease in shares outstanding |
| (55,237) |
| (30,040) | ||
*See accompanying notes which are an integral part of these financial statements.
DEAN FUNDS | ||||||||||||
LARGE CAP VALUE FUND - CLASS A | ||||||||||||
FINANCIAL HIGHLIGHTS | ||||||||||||
Per Share Data for a Share Outstanding Throughout Each Period | ||||||||||||
|
|
|
|
|
|
|
|
|
|
|
|
|
|
|
|
|
|
|
|
|
|
|
|
|
|
|
|
|
|
|
|
|
|
|
|
|
|
|
|
|
|
| Year Ended |
| Year Ended |
| Year Ended |
| Year Ended |
| Year Ended |
|
|
|
| March |
| March |
| March |
| March |
| March |
|
|
|
| 31, 2007 |
| 31, 2006 |
| 31, 2005 |
| 31, 2004 |
| 31, 2003 |
|
|
|
|
|
|
|
|
|
|
|
|
|
Net asset value, beginning of period | $ 11.40 |
| $ 10.18 |
| $ 9.46 |
| $ 6.40 |
| $ 10.75 | |||
Income (loss) from investment operations: |
|
|
|
|
|
|
|
|
| |||
Net investment loss |
|
| (0.01) |
| (0.01) |
| (0.01) |
| (0.04) |
| (0.03) | |
Net realized and unrealized gains (losses) |
|
|
|
|
|
|
|
|
| |||
on investments |
|
| 1.13 |
| 1.23 |
| 0.73 |
| 3.10 |
| (4.08) | |
Total income (loss) from investment operations | 1.12 |
| 1.22 |
| 0.72 |
| 3.06 |
| (4.11) | |||
|
|
|
|
|
|
|
|
|
|
|
|
|
Less distributions: |
|
|
|
|
|
|
|
|
|
|
| |
From net investment income |
| - |
| - |
| - |
| - |
| - | ||
From net realized gains | - |
| - |
| - |
| - |
| (0.24) | |||
Total distributions |
|
| - |
| - |
| - |
| - |
| (0.24) | |
|
|
|
|
|
|
|
|
|
|
|
|
|
Net asset value, end of period |
| $ 12.52 |
| $ 11.40 |
| $ 10.18 |
| $ 9.46 |
| $ 6.40 | ||
|
|
|
|
|
|
|
|
|
|
|
|
|
Total Return (a) (b) |
|
| 9.85% |
| 11.98% |
| 7.61% |
| 47.81% |
| -38.49% | |
|
|
|
|
|
|
|
|
|
|
|
|
|
Net assets, end of period | $ 16,875,525 |
| $ 8,167,690 |
| $ 7,392,623 |
| $ 7,459,239 |
| $ 6,725,313 | |||
|
|
|
|
|
|
|
|
|
|
|
|
|
Ratio of expenses to average net assets: |
|
|
|
|
|
|
|
|
|
| ||
After fee waivers and/or expense |
|
|
|
|
|
|
|
|
|
| ||
reimbursement by Adviser |
|
|
|
|
|
|
|
|
|
| ||
and Accounting Services Agent |
| 1.85% |
| 1.85% |
| 1.85% |
| 1.85% |
| 1.85% | ||
Before fee waivers and/or expense |
|
|
|
|
|
|
|
|
|
| ||
reimbursement by Adviser |
|
|
|
|
|
|
|
|
|
| ||
and Accounting Services Agent |
| 2.44% |
| 2.73% |
| 2.75% |
| 2.58% |
| 2.31% | ||
Ratio of net investment loss |
|
|
|
|
|
|
|
|
|
| ||
to average net assets |
|
| (0.69)% |
| (0.07)% |
| (0.10)% |
| (0.37)% |
| (0.32)% | |
Portfolio turnover rate |
|
| 124% |
| 62% |
| 43% |
| 42% |
| 55% | |
|
|
|
|
|
|
|
|
|
|
|
|
|
(a) Total return represents the rate that the investor would have earned or lost on an investment in the Fund, assuming reinvestment of dividends. |
|
| ||||||||||
(b) Total returns shown exclude the effect of applicable sales loads. |
|
|
|
|
|
|
|
| ||||
*See accompanying notes which are an integral part of these financial statements.
DEAN FUNDS | ||||||||||||
SMALL CAP VALUE FUND - CLASS A | ||||||||||||
FINANCIAL HIGHLIGHTS (Continued) | ||||||||||||
Per Share Data for a Share Outstanding Throughout Each Period | ||||||||||||
|
|
|
|
|
|
|
|
|
|
|
|
|
|
|
|
|
|
|
|
|
|
|
|
|
|
|
|
|
|
|
|
|
|
|
|
|
|
|
|
|
|
| Year Ended |
| Year Ended |
| Year Ended |
| Year Ended |
| Year Ended |
|
|
|
| March 31, |
| March 31, |
| March 31, |
| March 31, |
| March 31, |
|
|
|
| 2007 |
| 2006 |
| 2005 |
| 2004 |
| 2003 |
|
|
|
|
|
|
|
|
|
|
|
|
|
Net asset value, beginning of period | $ 16.01 |
| $ 14.33 |
| $ 14.91 |
| $ 9.55 |
| $ 13.37 | |||
Income (loss) from investment operations: |
|
|
|
|
|
|
|
|
| |||
Net investment income (loss) |
| (0.07) |
| (0.11) |
| (0.08) |
| (0.14) |
| (0.08) | ||
Net realized and unrealized gains (losses) |
|
|
|
|
|
|
|
|
| |||
on investments |
|
| 0.53 |
| 2.64 |
| 1.81 |
| 5.50 |
| (3.69) | |
Total income (loss) from investment operations | 0.46 |
| 2.53 |
| 1.73 |
| 5.36 |
| (3.77) | |||
|
|
|
|
|
|
|
|
|
|
|
|
|
Less distributions: |
|
|
|
|
|
|
|
|
|
|
| |
From net investment income |
| - |
| - |
| - |
| - |
| - | ||
From net realized gains | (0.76) |
| (0.85) |
| (2.31) |
| - |
| (0.05) | |||
Total distributions |
|
| (0.76) |
| (0.85) |
| (2.31) |
| - |
| (0.05) | |
|
|
|
|
|
|
|
|
|
|
|
|
|
Net asset value, end of period |
| $ 15.71 |
| $ 16.01 |
| $ 14.33 |
| $ 14.91 |
| $ 9.55 | ||
|
|
|
|
|
|
|
|
|
|
|
|
|
Total Return (a) (b) |
|
| 2.95% |
| 18.22% |
| 11.56% |
| 56.13% |
| -28.24% | |
|
|
|
|
|
|
|
|
|
|
|
|
|
Net assets, end of period | $ 20,890,814 |
| $ 19,007,165 |
| $ 16,537,565 |
| $ 16,435,083 |
| $ 12,078,397 | |||
|
|
|
|
|
|
|
|
|
|
|
|
|
Ratio of expenses to average net assets: |
|
|
|
|
|
|
|
|
|
| ||
After fee waivers and/or expense |
|
|
|
|
|
|
|
|
|
| ||
reimbursement by Adviser, |
|
|
|
|
|
|
|
|
|
| ||
Accounting Services Agent and |
|
|
|
|
|
|
|
|
|
| ||
Administrator |
|
| 1.83% |
| 1.85% |
| 1.85% |
| 1.85% |
| 1.85% | |
Before fee waivers and/or expense |
|
|
|
|
|
|
|
|
|
| ||
reimbursement by Adviser, |
|
|
|
|
|
|
|
|
|
| ||
Accounting Services Agent and |
|
|
|
|
|
|
|
|
|
| ||
Administrator |
|
| 2.16% |
| 2.15% |
| 2.23% |
| 2.08% |
| 2.01% | |
Ratio of net investment income (loss) |
|
|
|
|
|
|
|
|
|
| ||
to average net assets |
|
| (0.45)% |
| (0.75)% |
| (0.55)% |
| (0.99)% |
| (0.65)% | |
Portfolio turnover rate |
|
| 149% |
| 48% |
| 72% |
| 82% |
| 82% | |
|
|
|
|
|
|
|
|
|
|
|
|
|
(a) Total return represents the rate that the investor would have earned or lost on an investment in the Fund, assuming reinvestment of dividends. |
|
| ||||||||||
(b) Total returns shown exclude the effect of applicable sales loads. |
|
|
|
|
|
|
|
| ||||
*See accompanying notes which are an integral part of these financial statements.
DEAN FUNDS | ||||||||||||
INTERNATIONAL FUND - CLASS A | ||||||||||||
FINANCIAL HIGHLIGHTS (Continued) | ||||||||||||
Per Share Data for a Share Outstanding Throughout Each Period | ||||||||||||
|
|
|
|
|
|
|
|
|
|
|
|
|
|
|
|
|
|
|
|
|
|
|
|
|
|
|
|
|
|
|
|
|
|
|
|
|
|
|
|
|
|
| Year Ended |
| Year Ended |
| Year Ended |
| Year Ended |
| Year Ended |
|
|
|
| March 31, |
| March 31, |
| March 31, |
| March 31, |
| March 31, |
|
|
|
| 2007 |
| 2006 |
| 2005 |
| 2004 |
| 2003 |
|
|
|
|
|
|
|
|
|
|
|
|
|
Net asset value, beginning of period | $ 15.46 |
| $ 12.14 |
| $ 10.45 |
| $ 6.84 |
| $ 9.18 | |||
Income (loss) from investment operations: |
|
|
|
|
|
|
|
|
| |||
Net investment income (loss) |
| 0.01 |
| 0.10 |
| 0.11 |
| 0.04 |
| - | ||
Net realized and unrealized gains (losses) |
|
|
|
|
|
|
|
|
| |||
on investments |
|
| 1.24 |
| 3.26 |
| 1.75 |
| 3.98 |
| (2.34) | |
Total income (loss) from investment operations | 1.25 |
| 3.36 |
| 1.86 |
| 4.02 |
| (2.34) | |||
|
|
|
|
|
|
|
|
|
|
|
|
|
Less distributions: |
|
|
|
|
|
|
|
|
|
|
| |
From net investment income |
| (0.03) |
| (0.04) |
| (0.17) |
| (0.37) |
| - | ||
From return of capital | - |
| - |
| - |
| (0.04) |
| - | |||
Total distributions |
|
| (0.03) |
| (0.04) |
| (0.17) |
| (0.41) |
| - | |
|
|
|
|
|
|
|
|
|
|
|
|
|
Net asset value, end of period |
| $ 16.68 |
| $ 15.46 |
| $ 12.14 |
| $ 10.45 |
| $ 6.84 | ||
|
|
|
|
|
|
|
|
|
|
|
|
|
Total Return (a) (b) |
|
| 8.11% |
| 27.70% |
| 17.82% |
| 59.23% |
| -25.49% | |
|
|
|
|
|
|
|
|
|
|
|
|
|
Net assets, end of period | $ 17,324,534 |
| $ 16,068,877 |
| $ 13,073,914 |
| $ 10,842,350 |
| $ 7,041,919 | |||
|
|
|
|
|
|
|
|
|
|
|
|
|
Ratio of expenses to average net assets: |
|
|
|
|
|
|
|
|
|
| ||
After fee waivers and/or expense |
|
|
|
|
|
|
|
|
|
| ||
reimbursement by Adviser |
|
|
|
|
|
|
|
|
|
| ||
and Accounting Services Agent |
| 2.10% |
| 2.10% |
| 2.10% |
| 2.10% |
| 2.10% | ||
Before fee waivers and/or expense |
|
|
|
|
|
|
|
|
|
| ||
reimbursement by Adviser |
|
|
|
|
|
|
|
|
|
| ||
and Accounting Services Agent |
| 2.49% |
| 2.78% |
| 2.91% |
| 3.34% |
| 3.07% | ||
Ratio of net investment income (loss) |
|
|
|
|
|
|
|
|
|
| ||
to average net assets |
|
| 0.07% |
| 0.71% |
| 0.99% |
| 0.33% |
| (0.05)% | |
Portfolio turnover rate |
|
| 112% |
| 87% |
| 94% |
| 131% |
| 143% | |
|
|
|
|
|
|
|
|
|
|
|
|
|
(a) Total return represents the rate that the investor would have earned or lost on an investment in the Fund, assuming reinvestment of dividends. |
|
| ||||||||||
(b) Total returns shown exclude the effect of applicable sales loads. |
|
|
|
|
|
|
|
| ||||
*See accompanying notes which are an integral part of these financial statements.
DEAN FUNDS
NOTES TO THE FINANCIAL STATEMENTS
March 31, 2007
1. Organization
The Dean Large Cap Value Fund (the “Large Cap Value Fund”), the Dean Small Cap Value Fund (the “Small Cap Value Fund”) and the Dean International Fund (the “International Fund”) (each a “Fund” and, collectively the “Funds”) were organized as diversified series of Unified Series Trust (the “Trust”) on November 13, 2006. The Trust is an open-end investment company established under the laws of Ohio by an Agreement and Declaration of Trust dated October 17, 2002 (the “Trust Agreement”).
The Large Cap Value Fund, a newly created series of the Trust, acquired all of the assets and liabilities of each of the Dean Large Cap Value Fund and the Dean Balanced Fund, each a series of the Dean Family of Funds, in a tax-free reorganization at the close of business on March 30, 2007. In connection with this acquisition, Class A shares of the acquired funds were exchanged for shares of the Large Cap Value Fund. In the same reorganization, the Small Cap Value Fund and the International Fund, each a newly created series of the Trust, acquired all of the assets and liabilities of the Dean Small Cap Value Fund and Dean International Fund, respectively, each a series of Dean Family of Funds, and Class A shares of the acquired funds were exchanged for shares of the identically named Fund. The International Fund’s predecessor commenced operations on October 13, 1997, and the Large Cap Fund’s and Small Cap Fund’s predecessor each commenced operations on May 28, 1997. The financial information included herein or incorporated by reference into these Financial Statements, including the Notes to the Financial Statements, is that of the predecessor Dean Large Cap Value, Dean Small Cap Value and Dean International Funds’ Class A shares. Prior to October 28, 2006, each of the Funds’ Predecessors offered Class C shares for purchase. On October 27, 2006, the Class C shares of each Predecessor Fund were reclassified to the Class A shares of each respective Predecessor Fund.
The Trust Agreement permits the Trustees to issue an unlimited number of shares of beneficial interest of separate series. The Funds are series of funds currently authorized by the Trustees. The investment adviser to each Fund is Dean Investment Associates, LLC (“Dean Investment Associates”). In addition, Dean Investment Associates has retained Newton Capital Management, a Mellon Financial CompanySM, (“Newton”) to serve as sub-adviser to the International Fund. The investment objective of the Large Cap Value Fund and the Small Cap Value Fund is long-term capital appreciation and, secondarily, dividend income. The investment objective of the International Fund is long-term capital appreciation.
2. Significant Accounting Policies
The following is a summary of the Funds’ significant accounting policies:
Security valuation – Portfolio securities are valued as follows: (1) securities that are traded on stock exchanges are valued at the last reported sale price as of the close of the regular session of trading on the New York Stock Exchange on the day the securities are being valued, or, if not traded on a particular day, at the closing bid price; (2) securities traded in the NASDAQ over-the-counter market are generally valued at the NASDAQ Official Closing Price; (3) securities traded in the over-the-counter market that are not quoted by NASDAQ, are valued at the last sale price as of the close of the regular session of trading on the New York Stock Exchange on the day the securities are being valued or, if the last sale price is not readily available, at the last bid price as quoted by brokers that make markets in the securities; (4) securities that are traded both in the over-the-counter market and on a stock exchange are valued according to the broadest and most representative market; (5) U.S. Government obligations are valued at their most recent bid prices as obtained from one or more of the major market makers for such securities; (6) securities mainly traded on a non-U.S. exchange are generally valued according to the preceding closing values on that exchange; (7) short-term investments with remaining maturities of 60 days or less at the time of purchase are valued at amortized cost; and (8) securities (and other assets) for which market quotations are not readily available are valued at their fair value as determined in good faith in accordance with consistently applied procedures established by and under the general supervision of the Board of Trustees.
If trading in a stock is halted and does not resume before a Fund calculates its net asset value, the Fund may value the security at its fair value. Fair valuation of the Fund’s portfolio securities can serve to reduce arbitrage opportunities available to short-term traders, but there is no assurance that fair value pricing policies will prevent dilution of the Fund’s net asset value by short-term traders. If an event that may change the value of a security held in a Fund’s portfolio occurs after the closing of the applicable market, the Board of Trustees might decide to value the security based on fair value. This may cause the value of the security on the books of the Fund to be significantly different from the market quotation and may affect the calculation of the Fund’s net asset value.
DEAN FUNDS
NOTES TO THE FINANCIAL STATEMENTS
March 31, 2007
2. Significant Accounting Policies - continued
In accordance with the Trust’s good faith pricing guidelines, the Adviser is required to consider all appropriate factors relevant to the value of securities for which it has determined other pricing sources are not available or reliable as described above. No single standard for determining fair value controls exists, since fair value depends upon the circumstances of each individual case. As a general principle, the current fair value of an issue of securities being valued by the adviser would appear to be the amount which the owner might reasonably expect to receive for them upon their current sale. Methods which are in accord with this principle may, for example, be based on (i) a multiple of earnings; (ii) a discount from market of a similar freely traded security (including a derivative security or a basket of securities traded on other markets, exchanges or among dealers); or (iii) yield to maturity with respect to debt issues, or a combination of these and other methods.
CDSC - A contingent deferred sales load is imposed upon certain redemptions of shares that were purchased at net asset value if a commission was paid by 2480 Securities, LLC (the Underwriter) to a participating unaffiliated dealer at the time of the purchase and the shares are redeemed within one year from the date of purchase. The contingent deferred sales load will equal the commission percentage paid at the time of purchase (up to 1.00%) applied to the lesser of the net asset value of the shares at the time of purchase or the net asset value of the shares at the time of redemption.
Security Transactions and Related Income - The Funds follow industry practice and record security transactions on the trade date. The specific identification method is used for determining gains or losses for financial statements and income tax purposes. Dividend income is recorded on the ex-dividend date and interest income is recorded on an accrual basis. Discounts and premiums on securities purchased are amortized over the life of the respective securities using the effective interest method. Withholding taxes on foreign dividends have been provided for in accordance with each Fund’s understanding of the applicable country’s tax rules and rates.
Distributions to shareholders –Each of the Large Cap Value Fund, Small Cap Value Fund and International Fund distribute substantially all of its net investment income, if any, on an annual basis. In addition, each Fund distributes any net realized long-term capital gains at least once each year. Management will determine the timing and frequency of the distributions of any net realized short-term capital gains. The treatment for financial reporting purposes of distributions made to shareholders from net investment income or net realized capital gains may differ from their ultimate treatment for federal income tax purposes. These differences are caused by differences in the timing of the recognition of certain components of income, expense or realized capital gain for federal income tax purposes. Where such differences are permanent in nature, they are reclassified in the components of the net assets based on their ultimate characterization for federal income tax purposes. Any such reclassifications will have no effect on net assets, results of operations or net asset values per share of the Fund. For the fiscal year ended March 31, 2007, net investment loss of $9,994 was reclassified to paid in capital for the Large Cap Value Fund. For the Small Cap Value Fund, $89,984 of net investment loss was reclassified to accumulated net realized gains and $21,000 of penalties which are non deductible for tax purposes was reclassified to paid in capital.
Expenses – Expenses incurred by the Trust that do not relate to a specific fund of the Trust are allocated to the individual funds based on each Fund’s relative net assets or other appropriate basis (as determined by the Board).
Federal income tax – It is the policy of each Fund to continue to qualify as a regulated investment company by complying with the provisions available to certain investment companies, as defined in subchapter M of the Internal Revenue Code of 1986, as amended and to make distributions of net investment income and net realized capital gains sufficient to relieve it from all, or substantially all, federal income taxes. If the required amount of net investment income is not distributed, the Fund could incur a tax expense.
Accounting for Uncertainty in Income Taxes - In June 2006, the Financial Accounting Standards Board (FASB) issued FASB Interpretation No. 48 – Accounting for Uncertainty in Income Taxes that requires the tax effects of certain tax positions to be recognized. These tax positions must meet a “more likely than not” standard that, based on their technical merits, have a more than 50 percent likelihood of being sustained upon examination. FASB Interpretation No. 48 is effective for fiscal periods beginning after December 15, 2006. At adoption, the financial statements must be adjusted to reflect only those tax positions that are more likely than not of being sustained. Management of the Funds is currently evaluating the impact that FASB Interpretation No. 48 will have on the Funds’ financial statements.
Fair Value Measurements – In September 2006, FASB issued Statement on Financial Accounting Standards (SFAS) No. 157 “Fair Value Measurements.” This standard establishes a single authoritative definition of fair value, sets out a framework for measuring fair value and requires additional disclosure about fair value measurements. SFAS No. 157 applies to fair value
DEAN FUNDS
NOTES TO THE FINANCIAL STATEMENTS
March 31, 2007
2. Significant Accounting Policies - continued
measurements already required or permitted by existing standards. SFAS No. 157 is effective for financial statements issued for fiscal years beginning after November 15, 2007 and interim periods within those fiscal years. The changes to current generally accepted accounting principles from the application of this Statement relate to the definition of fair value, the methods used to measure fair value, and the expanded disclosures about fair value measurements. As of March 31, 2007, the Funds do not believe that the adoption of SFAS No. 157 will impact the amounts reported in the financial statements; however, additional disclosures may be required about the inputs used to develop the measurements and the effect of certain measurements reported on the statement of changes in net assets for a fiscal period.
Foreign Currency Translation - With respect to the International Fund, amounts denominated in or expected to settle in foreign currencies are translated into U.S. dollars based on exchange rates on the following basis: a) the market values of investment securities and other assets and liabilities are translated at the closing rate of exchange each day and b) purchases and sales of investment securities and income and expenses are translated at the rate of exchange prevailing on the respective dates of such transactions. The International Fund isolates the portion of the results of operations from changes in foreign exchange rates on investments from those resulting from changes in market prices of securities held. Such fluctuations are included with the net realized and unrealized gains and losses from investments. Reported net realized foreign exchange gains or losses arise from 1) sales of foreign currencies, 2) currency gains or losses realized between the trade and settlement dates on securities transactions, and 3) the difference between the amounts of dividends, interest, and foreign withholding taxes recorded on the International Fund’s books, and the U.S. dollar equivalent to the amounts actually received or paid. Reported net unrealized foreign exchange gains or losses arise from changes in the value of assets and liabilities, other than investments, resulting from changes in exchange rates.
3. Transactions with Affiliates and Related Parties
The Funds’ investments are managed by the Adviser pursuant to the terms of an advisory agreement. In accordance with the advisory agreement, the Adviser is entitled to an investment management fee, computed and accrued daily and paid monthly, at an annual rate of 1.00% of the average daily net assets of the Large Cap Value Fund and the Small Cap Value Fund and 1.25% of the average daily net assets of the International Fund. For the fiscal year ended March 31, 2007, the Adviser earned fees, before the waiver described below, of $85,723, $194,521, and $213,439 from the Large Cap Value Fund, the Small Cap Value Fund, and the International Fund, respectively. As of March 31, 2007, the Funds owed the Adviser $28,917, $58,819 and $27,412 from the Large Cap Value Fund, the Small Cap Value Fund, and the International Fund, respectively.
Pursuant to an Expense Limitation Agreement between the Adviser and the Trust, the Adviser waived a portion of its advisory fees for each Fund to the extent that the Fund’s operating expenses exceeded the applicable operating expense limit amount during the fiscal year ended March 31, 2007. There is no obligation for the Trust to repay the amounts of the advisory fees waived. The Adviser waived fees of $53,743 for the Large Cap Value Fund, $3,413 for the Small Cap Value Fund, and $67,602 for the International Fund during the fiscal year ended March 31, 2007. The operating expense limit with respect to Class A shares of each Fund is based on a percentage of the average daily net assets of the Class A shares of each Fund. The limits are as follows:

Under the terms of a Mutual Fund Services Agreement, Unified Fund Services, Inc. (“UFS”) serves as administrative services agent for the Funds. UFS supplies non-investment related administrative and compliance services for the Funds. UFS supervises the preparation of tax returns, reports to shareholders, reports to and filings with the Securities and Exchange Commission and state securities commissions, and materials for meetings of the Board of Trustees. For the fiscal year ended March 31, 2007, UFS earned administrative fees of $12,917, $17,516 and $15,496 from the Large Cap Value Fund, the Small Cap Value Fund, and the International Fund, respectively. As of March 31, 2007, the Funds owed UFS $833, $1,582 and $5,270 from the Large Cap Value Fund, the Small Cap Value Fund, and the International Fund, respectively.
DEAN FUNDS
NOTES TO THE FINANCIAL STATEMENTS
March 31, 2007
3. Transactions with Affiliates and Related Parties - continued
Under the terms of the Mutual Fund Services Agreement, UFS serves as transfer and shareholder servicing agent for the Trust. UFS maintains the records of each shareholder’s account, answers shareholder inquires concerning accounts, processes purchases and redemptions of the Funds’ shares, acts as dividend and distribution disbursing agent and performs other shareholder servicing functions. For the fiscal year ended March 31, 2007, UFS earned transfer agent fees of $16,633, $19,846 and $18,251 from the Large Cap Value Fund, the Small Cap Value Fund, and the International Fund, respectively and was reimbursed for out-of-pocket expenses of $6,213, $10,767 and $9,425 from the Large Cap Value Fund, the Small Cap Value Fund, and the International Fund, respectively. As of March 31, 2007, the Funds owed UFS $1,114, $1,447 and $4,698 from the Large Cap Value Fund, the Small Cap Value Fund, and the International Fund, respectively for transfer agent fees and $500, $817 and $2,807 from the Large Cap Value Fund, the Small Cap Value Fund, and the International Fund, respectively, for reimbursement of out-of-pocket expenses.
Under the terms of the Mutual Fund Services Agreement, UFS serves as accounting services agent for the Trust. UFS calculates the daily net asset value per share and maintains the financial books and records of the Funds. For the fiscal year ended March 31, 2007, the UFS earned fund accounting fees of $23,500, $23,500 and $23,500 from the Large Cap Value Fund, the Small Cap Value Fund, and the International Fund, respectively. As of March 31, 2007, the Funds owed UFS $1,667, $1,667 and $6,667 from the Large Cap Value Fund, the Small Cap Value Fund, and the International Fund, respectively.
2480 Securities, LLC, an affiliate of the Adviser, served as principal underwriter for the Funds and, as such, was the exclusive agent for the distribution of shares of the Funds. Under the terms of the Underwriting Agreement between the Trust and the Underwriter, the Underwriter earned $111 from the Large Cap Value Fund and $81 from Small Cap Value Fund from underwriting and broker commissions on the sale of shares of the Large Cap Value Fund, the Small Cap Value Fund, and the International Fund, respectively, during the fiscal year ended March 31, 2007.
The Trust has a Plan of Distribution under which the Funds may directly incur or reimburse the Underwriter for expenses related to the distribution and promotion of a Fund’s shares. The annual limitation for payment of such expenses under the Plan is 0.25% of each Fund’s average daily net assets attributable to such shares. For the fiscal year ended March 31, 2007, the Funds did not incur any distribution expenses.
4. Investments
For the fiscal year ended March 31, 2007, purchases and sales of investment securities, other than short-term investments and short-term U.S. government obligations were as follows:

DEAN FUNDS
NOTES TO THE FINANCIAL STATEMENTS
March 31, 2007
4. Investments - continued
As of March 31, 2007, the net unrealized appreciation (depreciation) of investments for tax purposes was as follows:

5. Forward Foreign Currency Exchange Contracts
The International Fund may enter into forward foreign currency exchange contracts as a way of managing foreign exchange rate risk. The Fund may enter into these contracts for the purchase or sale of a specific foreign currency at a fixed price on a future date as a hedge or cross-hedge against either specific transactions or portfolio positions (a cross-hedge occurs when forward foreign currency contracts are executed for a currency that has a high correlation with the currency that is being hedged). The objective of the Fund’s foreign currency hedging transactions is to reduce the risk that the U.S. dollar value of the Fund’s securities denominated in foreign currency will decline in value due to changes in foreign currency exchange rates. These contracts are valued daily, and the Fund’s net equity therein, representing unrealized gain or loss on the contracts as measured by the difference between the forward foreign exchange rates at the dates of entry into the contracts and the forward foreign exchange rates at the reporting date, is included in the Statement of Assets and Liabilities. Realized and unrealized gains or losses are included in the Fund’s Statement of Operations. Risks may arise upon entering into these contracts from the potential inability of counterparties to meet the terms of their contracts and from unanticipated movements in the value of a foreign currency relative to the U.S. dollar. These contracts may involve market or credit risk in excess of the amounts reflected on the Fund’s statement of assets and liabilities.
As of March 31, 2007, the International Fund had forward foreign currency exchange contracts outstanding as follows:

USD – U.S. Dollar GBP – Great Britain Pound SGD – Singapore Dollar JPY – Japanese Yen SEK – Swedish Krona
EUR – European Union Euro | AUD – Australian Dollar |
6. Estimates
The preparation of financial statements in conformity with accounting principles generally accepted in the United States of America requires management to make estimates and assumptions that affect the reported amounts of assets and liabilities and disclosure of contingent assets and liabilities at the date of the financial statements and the reported amounts of increases and decreases in net assets from operations during the reporting period. Actual results could differ from those estimates.
DEAN FUNDS
NOTES TO THE FINANCIAL STATEMENTS
March 31, 2007
7. Beneficial Ownership
The beneficial ownership, either directly or indirectly, of more than 25% of the voting securities of a fund creates a presumption of control of the fund, under Section 2(a)(9) of the Investment Company Act of 1940. As of March 31, 2007, Dean Wealth Management, LP owned 70.82%, 56.79% and 47.05% of the Large Cap Value Fund, the Small Cap Value Fund, and the International Fund, respectively. As a result, Dean Wealth Management, LP, an affiliate of the Advisor, may be deemed to control the Funds.
8. Distributions to Shareholders
Large Cap Value Fund. There were no distributions for the Large Cap Value Fund for the fiscal years ended March 31, 2007 and March 31, 2006.
Small Cap Value Fund. On December 26, 2006, the Fund paid long and short-term capital gains distributions totaling $0.7571 per share to shareholders of record on December 22, 2006.
The tax character of distributions paid during the fiscal years ended March 31, 2007 and 2006 was as follows:

International Fund. On December 26, 2006, an income distribution of $0.0325 per share was paid to shareholders of record on December 22, 2006.
The tax character of distributions paid during the fiscal years ended March 31, 2007 and 2006 was as follows:

As of March 31, 2007, the components of distributable earnings (accumulated losses) on a tax basis are as follows:

As of March 31, 2007, the difference between book basis and tax basis unrealized appreciation is attributable to the deferral of losses on wash sales and the mark-to-market of certain investments held by the Funds.
DEAN FUNDS
NOTES TO THE FINANCIAL STATEMENTS
March 31, 2007
9. Capital Loss Carryforwards
As of March 31, 2007, for federal income tax purposes, the Funds have capital loss carryforwards available to offset future capital gains, if any, in the following amounts:

During the year ended March 31, 2007, the Large Cap Value Fund utilized capital loss carryforwards of $1,250,810 and the International Fund utilized capital loss carryforwards of $1,111,735.
10. Merger of the Large Cap Value Fund and Balanced Fund
The Large Cap Value Fund acquired all of the assets and liabilities of each of the Dean Large Cap Value Fund and the Dean Balanced Fund, each a series of the Dean Family of Funds, in a tax-free reorganization at the close of business on March 30, 2007 pursuant to an Agreement and Plan of Reorganization approved by the shareholders of the Dean Balanced Fund and the Dean Large Cap Value Fund on March 30, 2007. The acquisition was accomplished by a tax-free exchange of 719,737 Class A shares of the Dean Balanced Fund (valued at $11.32 per share) for 650,737 Class A shares of the Large Cap Value Fund (valued at $12.52 per share). The shares of the Dean Large Cap Value Fund were exchanged on a one-for-one basis.
The Balanced Fund’s net assets on the date of the reorganization amounted to $8,149,356, including $84,068 of unrealized appreciation and capital loss carryforwards of $18,574 and were combined with the Large Cap Value Fund’s net assets. The aggregate net assets of the Balanced and Large Cap Value Fund immediately before the acquisition were $8,149,356 and $8,726,169, respectively. The combined net assets immediately after the acquisition amounted to $16,875,525 for 1,347,534 shares outstanding.
11. Reorganization to Unified Series Trust
As of the close of business March 30, 2007, the assets and liabilities of the Dean Family of Funds, including the Dean Large Cap Value Fund, the Dean Small Cap Value Fund, the Dean Balanced Fund, and the Dean International Fund, were acquired by the Dean Large Cap Value Fund, the Dean Small Cap Value Fund and the Dean International Fund, each a series of Unified Series Trust. The fees and expenses of the Funds were accrued and paid according to the contracts and policies in effect with the Dean Family of Funds through March 31, 2007. As of April 1, 2007, the fees and expenses of the Funds will be accrued and paid according to the contracts and policies in effect for the Dean Funds in the Unified Series Trust.
For the Funds in Unified Series Trust, the Funds’ adviser, Dean Investment Associates, has contractually agreed to waive its management fee and/or to reimburse certain operating expenses to the extent necessary to maintain each Fund’s Net Operating Expenses, excluding brokerage fees and commissions, borrowing costs (such as interest and dividend expenses on securities sold short), taxes, extraordinary expenses and any indirect expenses (such as expenses incurred by other investment companies in which a Fund may invest), at the following percentage of each Fund’s average daily net assets through March 23, 2009: 1.50% for each of the Large Cap Value Fund and the Small Cap Value Fund, and 1.85% for the International Fund. Each fee waiver and expense reimbursement by the adviser for a Fund is subject to repayment by the Fund within the three fiscal years following the fiscal year in which the expense was incurred, provided that the Fund is able to make the repayment without exceeding the applicable expense limitation.
The Unified Series Trust retains Unified Fund Services, Inc. (“Unified”) to manage each Fund’s business affairs and to provide each Fund with administrative services, including all regulatory reporting and necessary office equipment and personnel. The Trust also retains Unified to act as each Fund’s transfer agent and to provide each Fund with fund accounting services. Certain officers of Unified Series Trust are members of management and/or employees of Unified.
DEAN FUNDS
NOTES TO THE FINANCIAL STATEMENTS
March 31, 2007
11. Reorganization to Unified Series Trust - continued
Unified Financial Securities, Inc. (the “Distributor”) acts as the principal distributor of the Funds. Each Fund has adopted a Distribution Plan pursuant to Rule 12b-1 under the 1940 Act. Each Fund’s Plan provides that the Fund will pay to Dean Investment Associates, the Distributor and/or any registered securities dealer, financial institution or any other person (the “Recipient”) a shareholder servicing fee of up to 0.25% of the average daily net assets of the Fund in connection with the promotion and distribution of such Fund’s shares or the provision of personal services to shareholders, including, but not necessarily limited to, advertising, compensation to underwriters, dealers and selling personnel, the printing and mailing of prospectuses to other than current shareholders of the Fund, the printing and mailing of sales literature and servicing shareholder accounts (“12b-1 Expenses”). Each Fund may pay all or a portion of these fees to any Recipient who renders assistance in distributing or promoting the sale of shares, or who provides certain shareholder services, pursuant to a written agreement. Each Fund’s Plan is a compensation plan, which means that compensation is provided regardless of 12b-1 Expenses actually incurred. It is anticipated that each Fund’s Plan will benefit shareholders because an effective sales program typically is necessary in order for a Fund to reach and maintain a sufficient size to achieve efficiently its investment objectives and to realize economies of scale.
12. Deficiency Dividends
On June 12, 2007 the Board of Trustees declared a deficiency dividend of $0.4754 per share, of which $0.4638 per share was designated as a Capital Gains Dividend, to shareholders of record of the Small Cap Value Fund as of June 12, 2007 and ordered the payment of a related compliance fee of approximately $63,000 to the Internal Revenue Service to satisfy a spillback dividend election taken by the Small Cap Value Fund for the tax year ended March 31, 2006 and maintain the Small Cap Value Fund's status as a regulated investment company under subchapter M of the Internal Revenue Code. The Small Cap Value Fund filed the forms necessary to claim the deficiency dividend as a dividend paid deduction with the IRS on June 14, 2007. The related compliance fee will be paid to the IRS by the Small Cap Value Fund’s administrator.
On June 12, 2007 the Board of Trustees declared a deficiency dividend of $0.0428 per share to shareholders of record of the International Fund as of June 12, 2007 to satisfy a spillback dividend election taken by the International Fund for the tax year ended March 31, 2006 and maintain the International Fund's status as a regulated investment company under subchapter M of the Internal Revenue Code. The International Fund filed the forms necessary to claim the deficiency dividend as a dividend paid deduction with the IRS on June 14, 2007.
REPORT OF INDEPENDENT REGISTERED PUBLIC ACCOUNTING FIRM
To The Shareholders and Board of Trustees of the
Dean Funds
(Unified Series Trust)
We have audited the accompanying statements of assets and liabilities, including the schedules of investments, of the Dean Funds (the “Funds”), comprising the Dean Large Cap Value Fund, the Dean Small Cap Value Fund, and the Dean International Fund, each a series of the Unified Series Trust, as of March 31, 2007, and the related statements of operations and changes in net assets and the financial highlights for the year then ended. These financial statements and financial highlights are the responsibility of the Funds’ management. Our responsibility is to express an opinion on these financial statements and financial highlights based on our audit. The financial statements and financial highlights for the periods indicated prior to March 31, 2007 were audited by another independent accounting firm which expressed unqualified opinions on those financial statements and highlights.
We conducted our audit in accordance with the standards of the Public Company Accounting Oversight Board (United States). Those standards require that we plan and perform the audit to obtain reasonable assurance about whether the financial statements and financial highlights are free of material misstatement. An audit includes examining, on a test basis, evidence supporting the amounts and disclosures in the financial statements. Our procedures included confirmation of securities owned as of March 31, 2007, by correspondence with the Funds’ custodians and brokers, or by other appropriate auditing procedures where replies from brokers were not received. An audit also includes assessing the accounting principles used and significant estimates made by management, as well as evaluating the overall financial statement presentation. We believe that our audit provides a reasonable basis for our opinion.
In our opinion, the financial statements and financial highlights referred to above present fairly, in all material respects, the financial position of each of the funds constituting the Dean Funds, each of a series of the Unified Series Trust, as of March 31, 2007, the results of their operations, changes in their net assets, and the financial highlights for the year then ended in conformity with accounting principles generally accepted in the United States of America.
Cohen Fund Audit Services, Ltd.
Westlake, Ohio
June 12, 2007
Shareholder Votes (Unaudited)
At a special meeting held on March 30, 2007, shareholders were asked to approve agreements and plans of reorganization, each dated as of January 15, 2007, by and between the Dean Family of Funds and the Trust on behalf of the Dean Large Cap Value Fund, Dean Small Cap Value Fund, the Dean Balanced Fund and Dean International Fund. Please see Note 1 in the Notes to the Financial Statements for additional detail regarding these reorganizations. Below are the shareholder vote results:

TRUSTEES AND OFFICERS - (Unaudited)
The Board of Trustees supervises the business activities of the Trust. Each Trustee serves as a trustee until termination of the Trust unless the Trustee sooner dies, resigns, retires or is removed.
The following tables provide information regarding the Trustees and officers. Prior to March 31, 2007, the Funds were governed by the Dean Family of Funds Board of Trustees.
Independent Trustees
Name, Address*, (Date of Birth), Position with Trust**, Term of Position with Trust | Principal Occupation During Past 5 Years and Other Directorships |
Gary E. Hippenstiel (Age 59)
Independent Trustee, December 2002 to present | Director, Vice President and Chief Investment Officer of Legacy Trust Company, N.A. since 1992; Chairman of the investment committee for W.H. Donner Foundation and Donner Canadian Foundation, since June 2005; Trustee of AmeriPrime Advisors Trust from July 2002 to September 2005; Trustee of Access Variable Insurance Trust from April 2003 to August 2005; Trustee of AmeriPrime Funds from 1995 to July 2005; Trustee of CCMI Funds from June 2003 to March 2005. |
Stephen A. Little (Age 61)
Chairman, December 2004 to present; Independent Trustee, December 2002 to present | President and founder of The Rose, Inc., a registered investment advisor, since April 1993; Trustee of AmeriPrime Advisors Trust from November 2002 to September 2005; Trustee of AmeriPrime Funds from December 2002 to July 2005; Trustee of CCMI Funds from June 2003 to March 2005. |
Daniel J. Condon (Age 56)
Independent Trustee, December 2002 to present | President of International Crankshaft Inc., an automotive equipment manufacturing company, since 2004, Vice President and General Manager from 1990 to 2003; Trustee of AmeriPrime Advisors Trust from November 2002 to September 2005; Trustee of The Unified Funds from 1994 to 2002; Trustee of Firstar Select Funds, a REIT mutual fund, from 1997 to 2000; Trustee of AmeriPrime Funds from December 2002 to July 2005; Trustee of CCMI Funds from June 2003 to March 2005. |
Ronald C. Tritschler (Age 55)
Trustee, December 2002 to present | Chief Executive Officer, Director and Legal Counsel of The Webb Companies, a national real estate company, since 2001, Executive Vice President and Director from 1990 to 2000; Director of First State Financial since 1998; Director, Vice President and Legal Counsel of The Traxx Companies, an owner and operator of convenience stores, since 1989; Trustee of AmeriPrime Advisors Trust from November 2002 to September 2005; Trustee of AmeriPrime Funds from December 2002 to July 2005; Trustee of CCMI Funds from June 2003 to March 2005. |
Principal Officers
Name, Address*, (Date of Birth), Position with Trust,** Term of Position with Trust | Principal Occupation During Past 5 Years and Other Directorships |
Anthony J. Ghoston (Age 48)
President, July 2004 to present | President of Unified Fund Services, Inc., the Trust’s administrator, since June 2005, Executive Vice President from June 2004 to June 2005, Senior Vice President from April 2003 to June 2004; Senior Vice President and Chief Information Officer of Unified Financial Services, Inc., the parent company of the Trust’s administrator and distributor, from 1997 to November 2004; President of AmeriPrime Advisors Trust from July 2004 to September 2005; President of AmeriPrime Funds from July 2004 to July 2005; President of CCMI Funds from July 2004 to March 2005. |
J. Michael Landis (Age 36)
Interim Chief Financial Officer and Treasurer, March 2007 to present
| Vice President Fund Accounting and Fund Administration for Unified Fund Services, since October, 2006; Director of Fund Accounting and Fund Administration for PFPC July 2006 - October 2006; Manager Fund Accounting for Unified Fund Services November 2004 – July 2006; Manager Fund Accounting for Mellon Financial Corporation November 1998 – November 2004. |
Lynn E. Wood (Age 60)
Chief Compliance Officer, October 2004 to present | Chief Compliance Officer of AmeriPrime Advisors Trust from October 2004 to September 2005; Chief Compliance Officer of AmeriPrime Funds from October 2004 to July 2005; Chief Compliance Officer of CCMI Funds from October 2004 to March 2005; Chief Compliance Officer of Unified Financial Securities, Inc., the Trust’s distributor, from December 2004 to October 2005 and from 1997 to 2000, Chairman from 1997 to December 2004, President from 1997 to 2000; Director of Compliance of Unified Fund Services, Inc., the Trust’s administrator, from October 2003 to September 2004; Chief Compliance Officer of Unified Financial Services, Inc., the parent company of the Trust’s administrator and distributor, from 2000 to 2004. |
Heather Bonds (Age 31) Secretary, July 2005 to present; Assistant Secretary, September 2004 to June 2005 | Employed by Unified Fund Services, Inc., the Trust’s administrator, since January 2004 and from December 1999 to January 2002; Student at Indiana University School of Law – Indianapolis, J.D. Candidate in December 2007; Assistant Secretary of Dean Family of Funds since August 2004; Regional Administrative Assistant of The Standard Register Company from February 2003 to January 2004; Full time student at Indiana University from January 2002 to June 2002; Secretary of AmeriPrime Advisors Trust from July 2005 to September 2005, Assistant Secretary from September 2004 to June 2005; Assistant Secretary of AmeriPrime Funds from September 2004 to July 2005; Assistant Secretary of CCMI Funds from September 2004 to March 2005. |
* The address for each of the trustees and officers is 431 N. Pennsylvania St., Indianapolis, IN 46204.
** The Trust currently consists of 39 series.
OTHER INFORMATION
The Fund’s Statement of Additional Information (“SAI”) includes information about the trustees and is available, without charge, upon request. You may call toll-free (888) 912-4562 to request a copy of the SAI or to make shareholder inquiries.
Management Approval (Unaudited)
The management agreements between the Trust and Dean Investment Associates on behalf of each of the Large Cap Value Fund, the Small Cap Value Fund and the International Fund were considered by the Board, including a majority of the Trustees who are not interested persons of the Trust or interested parties to the Agreement (collectively, the “Independent Trustees” and each, an “Independent Trustee”), at an in-person meeting on September 11, 2006, and approved at an in-person meeting on November 13, 2006. The sub-advisory agreement between Dean Investment Associates and Newton on behalf of the International Fund was considered by the Board, including a majority of the Independent Trustees, at in-person meetings on September 11, 2006 and November 13, 2006, and approved at an in-person meeting held on February 12, 2007.
In determining whether to approve each of the management agreements, the Trustees referred to their discussions with Dean Investment Associates’ management regarding its background and experience and its plans for managing the Funds’ portfolios. The Trustees also reviewed drafts of each Fund’s prospectus, SAI, Expense Cap Agreement and Management Agreement and the International Fund’s Sub-Advisory Agreement. The Trustees met with executives of Dean Investment Associates and interviewed the executives regarding the firm’s investment strategies, financial capabilities to cap expenses, personnel and other information of the type required by Section 15(c) of the 1940 Act. In addition, the Trust’s Chief Compliance Officer summarized his review of the compliance policies and procedures of Dean Investment Associates and stated that the policies and procedures appeared to be reasonably designed to prevent violations of federal securities laws. The Trustees considered that Dean Investment Associates has over thirty years’ experience of managing value equity portfolios since 1972 and that Dean Investment Associates currently manages several value equity products, which include multi-cap and mid-cap products. In addition, the Board recalled that Dean Investment Associates currently manages three domestic funds and one international fund (the “Predecessor Funds”), that the Predecessor Funds commenced operations in 1997 and that Dean Investment Associates has been working with Unified since 1999.
The Board discussed Dean Investment Associates’ investment philosophy. The Trustees noted one of the portfolio manager’s statements that Dean Investment Associates has a strong commitment to the principles of value investing and that the advisory firm believes that buying companies below their intrinsic values as determined by Dean Investment Associates with margins of safety is essential to investing success. The Board then considered Dean Investment Associates’ buy and sell disciplines, including diversification and limits/controls as explained by the portfolio manager. The Trustees discussed Dean Investment Associates’ statement that it looks for strong balance sheets, industry leaders and a catalyst that will ignite potential investors.
Large Cap Value Fund
In considering whether to approve the management agreement between the Trust and Dean Investment Associates on behalf of the Large Cap Value Fund, the Trustees primarily considered, (1) Dean Investment Associates contractually has agreed to waive its management fee and/or reimburse certain operating expenses through the end of the Fund’s first two fiscal years; (2) Dean Investment Associates may direct the Fund’s brokerage to broker-dealers who provide research services that assist Dean Investment Associates in managing the Fund’s portfolio; (3) Dean Investment Associates’ current financial statements indicate that it has sufficient revenues to meet its obligation to cap the Fund’s expenses under the expense cap agreement, even if the management agreement is not profitable in the first two years; and (4) although the Large Cap Fund’s predecessor underperformed relative to the S&P 500 Index in 2002 and 2005, the Fund outperformed the Index in 2003, 2004 and year-to-date. As a result of their considerations, the Trustees, including the Independent Trustees, unanimously determined that the proposed management agreement was in the best interests of the Large Cap Fund and its shareholders.
Small Cap Value Fund
In considering whether to approve the management agreement between the Trust and Dean Investment Associates on behalf of the Small Cap Value Fund, the Trustees primarily considered, (1) Dean Investment Associates contractually has agreed to waive its management fee and/or reimburse certain operating expenses through the end of the Fund’s first two fiscal years; (2) Dean Investment Associates may direct the Fund’s brokerage to broker-dealers who provide research services that assist Dean Investment Associates in managing the Fund’s portfolio; (3) Dean Investment Associates’ current financial statements indicate that it has sufficient revenues to meet its obligation to cap the Fund’s expenses under the expense cap agreement, even if the management agreement is not profitable in the first two years; and (4) while the Small Cap Fund’s predecessor underperformed the Russell 2000 Value Index in 2002, 2003 and 2004, it outperformed its benchmark in 2005 and had positive returns for the one-year, five-year and since inception periods ended December 31, 2005. As a result of their considerations, the Trustees, including the Independent Trustees, unanimously determined that the proposed management agreement was in the best interests of the Small Cap Fund and its shareholders.
Dean International Fund
In considering whether to approve the management agreement between the Trust and Dean Investment Associates on behalf of the International Fund, the Trustees primarily considered, (1) Dean Investment Associates contractually has agreed to waive its management fee and/or reimburse certain operating expenses through the end of the Fund’s first two fiscal years; (2) Dean Investment Associates may direct the Fund’s brokerage to broker-dealers who provide research services that assist Dean Investment Associates in managing the Fund’s portfolio; (3) Dean Investment Associates’ current financial statements indicate that it has sufficient revenues to meet its obligation to cap the Fund’s expenses under the expense cap agreement, even if the management agreement is not profitable in the first two years; and (4) the International Fund’s predecessor substantially outperformed the MSCI EAFE Index since its inception through December 31, 2005. As a result of their considerations, the Trustees, including the Independent Trustees, unanimously determined that the proposed management agreement was in the best interests of the International Fund and its shareholders.
In their consideration of the sub-advisory agreement, the Board met with executives of Newton and interviewed the executives regarding the materials requested and reviewed materials furnished by Newton in advance of the meeting, including Newton’s financial statements, an investment personnel update describing its investment strategy, and Form ADV Part II, which included a description of its business and personnel, information about its policies and practices regarding best execution, trade allocation, soft dollars, and insider trading. The Trust’s Chief Compliance Officer summarized his review of the compliance policies and procedures of Newton and stated that the policies and procedures appeared to be reasonably designed to prevent violations of federal securities laws.
In determining whether to approve the sub-advisory agreement between the Dean Investment Associates and Newton the Trustees primarily considered, (1) Sub-Adviser has provided sub-advisory services to the International Fund’s predecessor since its inception; (2) Newton has a team of research analysts consisting of 19 global sector analysts responsible for communicating with fund managers regarding their respective sectors; (3) four individuals in Newton’s firm focus on EAFE accounts, working together with the analysts to put together the EAFE portfolio; (4) Dean Investment Associates has a staff of 330 individuals, and currently has $60 billion in assets under management; (5) Newton has managed an institutional mutual fund since late 2005; (6) Newton manages a variable annuity international fund; (7) Newton’s current financial statements indicate that it has financial wherewithal; (8) Dean Investment Associates will be paying Newton’s management fees; (9) Newton may direct the Fund’s brokerage to broker-dealers who provide research services that assist Newton in managing the Fund’s portfolio; and (10) the International Fund’s predecessor substantially outperformed the MSCI EAFE Index since its inception through December 31, 2005. As a result of their considerations, the Trustees, including the Independent Trustees, determined that the proposed sub-advisory agreement was in the best interests of the International Fund and its shareholders.
Proxy Voting
A description of the policies and procedures that the Funds use to determine how to vote proxies relating to portfolio securities and information regarding how the Funds voted those proxies during the most recent twelve month period ended June 30 are available, without charge, upon request by calling 1-800-327-3656 or on the SEC’s website at http://www.sec.gov.
TRUSTEES
Stephen A. Little
Gary E. Hippenstiel
Daniel J. Condon
Ronald C. Tritschler
Timothy Ashburn
OFFICERS
Anthony J. Ghoston, President
J. Michael Landis, Treasurer
Lynn E. Wood, Chief Compliance Officer
Heather Bonds, Secretary
INVESTMENT ADVISOR
DEAN INVESTMENT ASSOCIATES LLC
2480 Kettering Tower
Dayton, Ohio 45423
UNDERWRITER & DISTRIBUTOR
Unified Financial Securities, Inc.
431 N. Pennsylvania Street
Indianapolis, Indiana 46204
INDEPENDENT REGISTERED PUBLIC ACCOUNTING FIRM
Cohen Fund Audit Services, Ltd.
800 Westpoint Pkwy., Suite 1100
Westlake, Ohio 44145
LEGAL COUNSEL
Thompson Coburn LLP
One U.S. Bank Plaza
St. Louis, Missouri 63101
CUSTODIAN
U.S. Bank, N.A.
425 Walnut St.
Cincinnati, OH 45202
Mellon Financial Corporation
P.O. Box 371791
Pittsburg, PA 14251-7791
ADMINISTRATOR, TRANSFER AGENT
AND FUND ACCOUNTANT
Unified Fund Services, Inc.
431 N. Pennsylvania Street
Indianapolis, Indiana 46204
SHAREHOLDER SERVICE
Nationwide: (Toll-Free) 888-899-8343
This report is intended only for the information of shareholders or those who have received the Funds’ prospectus which contains information about the Funds’ management fee and expenses. Please read the prospectus carefully before investing.
Item 2. Code of Ethics.
(a) As of the end of the period covered by this report, the registrant has adopted a code of ethics that applies to the registrant's principal executive officer, principal financial officer, principal accounting officer or controller, or persons performing similar functions, regardless of whether these individuals are employed by the registrant or a third party.
(b) For purposes of this item, “code of ethics” means written standards that are reasonably designed to deter wrongdoing and to promote:
(1) | Honest and ethical conduct, including the ethical handling of actual or apparent conflicts of interest between personal and professional relationships; |
(2) | Full, fair, accurate, timely, and understandable disclosure in reports and documents that a registrant files with, or submits to, the Commission and in other public communications made by the registrant; |
(3) | Compliance with applicable governmental laws, rules, and regulations; |
(4) | The prompt internal reporting of violations of the code to an appropriate person or persons identified in the code; and |
(5) | Accountability for adherence to the code. |
(c) Amendments: During the period covered by the report, there have not been any amendments to the provisions of the code of ethics.
(d) Waivers: During the period covered by the report, the registrant has not granted any express or implicit waivers from the provisions of the code of ethics.
(e) Posting: We do not intend to post the Code of Ethics for the Officers or any amendments or waivers on a website.
(f) Availability: The Code of Ethics for the Officers can be obtained, free of charge by calling the toll free number for the appropriate Fund.
Item 3. Audit Committee Financial Expert.
(a) The registrant’s board of trustees has determined that the registrant does not have an audit committee financial expert. The committee members and the full Board considered a possibility of adding a member that would qualify as an expert. The audit committee determined that, although none of its members meet the technical definition of an audit committee expert, the committee has sufficient financial expertise to adequately perform its duties under the Audit Committee Charter without the addition of a qualified expert.
Item 4. Principal Accountant Fees and Services.
(a) | Audit Fees |
Dean Family of Funds
FY 2007 | $ 34,000 | |
FY 2006 | $ N/A |
|
(b) | Audit-Related Fees |
Dean Family of Funds | Registrant | Adviser | |||
FY 2007 | $ 0 | $ 0 |
| ||
FY 2006 | $ N/A | $ 0 |
Nature of the fees:
(c) | Tax Fees |
Dean Family of Funds |
| ||
FY 2007 | $ 4,000 | ||
FY 2006 | $ N/A |
| |
Nature of the fees: | preparation of the 1120 RIC |
(d) | All Other Fees |
Dean Family of Funds |
| ||||
| Registrant | Adviser | |||
FY 2007 | $ 0 |
| |||
FY 2006 | $ N/A |
| |||
Nature of the fees: |
(e) | (1) | Audit Committee’s Pre-Approval Policies |
The Audit Committee Charter requires the Audit Committee to be responsible for the selection, retention or termination of auditors and, in connection therewith, to (i) evaluate the proposed fees and other compensation, if any, to be paid to the auditors, (ii) evaluate the independence of the auditors, (iii) pre-approve all audit services and, when appropriate, any non-audit services provided by the independent auditors to the Trust, (iv) pre-approve, when appropriate, any non-audit services provided by the independent auditors to the Trust's investment adviser, or any entity controlling, controlled by, or under common control with the investment adviser and that provides ongoing services to the Trust if the engagement relates directly to the operations and financial reporting of the Trust, and (v) receive the auditors’ specific representations as to their independence;
(2) | Percentages of Services Approved by the Audit Committee |
Registrant |
Audit-Related Fees: | 100 | % |
Tax Fees: | 100 | % |
All Other Fees: | 100 | % |
(f) During audit of registrant's financial statements for the most recent fiscal year, less than 50 percent of the hours expended on the principal accountant's engagement were attributed to work performed by persons other than the principal accountant's full-time, permanent employees.
(g) The aggregate non-audit fees billed by the registrant's accountant for services rendered to the registrant, and rendered to the registrant's investment adviser (not including any sub-adviser whose role is primarily portfolio management and is subcontracted with or overseen by another investment adviser), and any entity controlling, controlled by, or under common control with the adviser that provides ongoing services to the registrant:
| Registrant | Adviser | |
FY 2007 | $ 0 | $0 |
|
FY 2006 | $ N/A | $0 |
|
(h) Not applicable. The auditor performed no services for the registrant’s investment adviser or any entity controlling, controlled by, or under common control with the investment adviser that provides ongoing services to the registrant.
Item 5. Audit Committee of Listed Companies. Not applicable.
Item 6. Schedule of Investments. | Not applicable – schedule filed with Item 1. |
Item 7. Disclosure of Proxy Voting Policies and Procedures for Closed-End Funds. Not applicable.
Item 8. Portfolio Managers of Closed-End Management Investment Companies. Not applicable.
Item 9. Purchases of Equity Securities by Closed-End Management Investment Company and Affiliated Purchasers. Not applicable.
Item 10. Submission of Matters to a Vote of Security Holders
The registrant has not adopted procedures by which shareholders may recommend nominees to the registrant’s board of trustees.
Item 11. Controls and Procedures.
(a) Based on an evaluation of the registrant’s disclosure controls and procedures as of April 2, 2007, the disclosure controls and procedures are reasonably designed to ensure that the information required in filings on Forms N-CSR is recorded, processed, summarized, and reported on a timely basis.
(b) There were no significant changes in the registrant’s internal control over financial reporting that occurred during the registrant’s second fiscal quarter of the period covered by this report that has materially affected, or is reasonably likely to materially affect, the registrant’s internal control over financial reporting.
Item 12. Exhibits.
(a)(1) | Code is filed herewith |
(a)(2) | Certifications by the registrant's principal executive officer and principal financial officer, pursuant to Section 302 of the Sarbanes- Oxley Act of 2002 and required by Rule 30a-2under the |
Investment Company Act of 1940 are filed herewith. |
(a)(3) | Not Applicable |
(b) | Certification pursuant to 18 U.S.C. Section 1350, as adopted pursuant to Section 906 of the Sarbanes-Oxley Act of 2002 is filed herewith. |
SIGNATURES
Pursuant to the requirements of the Securities Exchange Act of 1934 and the Investment Company Act of 1940, the registrant has duly caused this report to be signed on its behalf by the undersigned, thereunto duly authorized.
(Registrant) |
| Unified Series Trust |
|
|
|
By |
| */s/ Anthony Ghoston |
| Anthony Ghoston, President | |
|
|
|
Date: 06/26/2007 | ||
Pursuant to the requirements of the Securities Exchange Act of 1934 and the Investment Company Act of 1940, this report has been signed below by the following persons on behalf of the registrant and in the capacities and on the dates indicated.
By |
| */s/ Anthony Ghoston |
| Anthony Ghoston, President | |
|
|
|
Date: |
| 6/26/2007 |
By |
| */s/ J. Michael Landis |
| J. Michael Landis, Treasurer | |
|
|
|
Date: |
| 6/26/2007 |