UNITED STATES
SECURITIES AND EXCHANGE COMMISSION
WASHINGTON, D.C. 20549
FORM N-CSR
CERTIFIED SHAREHOLDER REPORT OF REGISTERED MANAGEMENT
INVESTMENT COMPANIES
Investment Company Act file number | 811-21237 |
Unified Series Trust |
2960 N. Meridian Street, Ste.300, Indianapolis, In 46208 |
J. Michael Landis |
Unified Fund Services, Inc.
2960 N. Meridian Street, Ste. 300
Indianapolis, IN 46208 |
(Name and address of agent for service)
Registrant's telephone number, including area code: 317-917-7000
Date of fiscal year end: | 11/30 |
Date of reporting period: | 11/30/07 |
Form N-CSR is to be used by management investment companies to file reports with the Commission not later than 10 days after the transmission to stockholders of any report that is required to be transmitted to stockholders under Rule 30e-1 under the Investment Company Act of 1940 (17 CFR 270.30e-1). The Commission may use the information provided on Form N-CSR in its regulatory, disclosure review, inspection and policymaking roles.
A registrant is required to disclose the information specified by Form N-CSR, and the Commission will make this information public. A registrant is not required to respond to the collection of information contained in Form N-CSR unless the Form displays a currently valid Office of Management and Budget ("OMB") control number. Please direct comments concerning the accuracy of the information collection burden estimate and any suggestions for reducing the burden to Secretary, Securities and Exchange Commission, 450 Fifth Street, NW, Washington, DC 20549-0609. The OMB has reviewed this collection of information under the clearance requirements of 44 U.S.C. § 3507.
Item 1. Reports to Stockholders.

Annual Report
November 30, 2007
Fund Adviser:
Leeb Capital Management, Inc.
500 Fifth Ave, 57th Floor
New York, New York 10110
Phone (866) 400-5332
To the Leeb Focus Fund Shareholders
Dear Shareholder:
We are happy with our performance for the fiscal period from December 26, 2006 to November 30, 2007. The Leeb Focus Fund comfortably outperformed the S&P 500 Index for the fiscal period returning 19.16% for the Class I and returning 19.30% for the Class R. The S&P 500 Index, the Fund’s benchmark, had a total return of 6.36% during this period.
Year in Review
The first quarter of 2007 was relatively quiet, with the stocks closing out the first three months of the year gaining just slightly more than half a percent. However, even during that period many indications of the months ahead were already apparent. For instance, nine out of 10 of the S&P 500 Index’s sectors were positive for the quarter, led by Materials, Utilities and Energy shares. The lone sector in the negative column for the period was the Financials, which also happens to carry the greatest weight in the Index and therefore held back the market’s overall return.
Energy performance during the quarter set the stage for what was to be a dramatic year for black gold. After dipping to 20-month lows in the first few weeks of January, prices of crude oil reversed. Needless to say oil was a big story of the year, with the price of oil posting the second biggest annual gain on record. For the first quarter, oil ended the quarter north of $65 a barrel. The real reason for the jump in oil had to do with continued strong demand, as the world economy continued to grow.
The first calendar quarter was also marked by a steep one-day sell-off in Chinese stocks that quickly spread across the globe; however, that was merely the excuse needed to set off a healthy, much needed correction As it became clear to investors that China (which remained a powerful factor in driving the world economy and another investment story of the year) wasn’t headed for a slow down, stocks worldwide recovered.
In the second calendar quarter, renewed optimism among investors prevailed. Stocks leveraged to growth, including energy and alternative energy, materials and industrials, continued to be market leaders. One of the biggest stories of the period, and an indication of worse things to come, was the collapse of the sub-prime lending market, as falling home prices led to a sharp fall in debt tied to sub-prime lending. Suddenly there was virtually no market for risky loans. The mortgage market was the biggest casualty. Its meltdown forced numerous lenders to shut their doors and took a toll even on those that were only tangentially exposed to the segment.
We entered the year underweighted in financial service stocks as compared to the Index and have maintained that underexposure throughout, holding just a few of the top-tier firms, such as Berkshire Hathaway (BRK/B), American Express (AXP) and Wells Fargo (WFC). Fortunately, our holdings were relatively unscathed in the sub-prime debacle during the period.
The crisis that securities markets experienced during the months of summer paved the way for a strong September rally. Commodities, including but not limited to oil, had one of their best months on record in September as well. For the calendar quarter, the strongest performers were, not surprisingly, our energy and materials holdings, as well as selected industrials and technology stocks. Overall, the third calendar quarter was a very good period for the Focus Fund as it significantly outperformed the market.
Sub-prime debt, which has created the current crisis, is just a small fraction of housing debt and a miniscule fraction of total U.S. debt. Yet, it was repackaged and leveraged so many times, that uncertainty about the level of exposure to it created a liquidity crisis that could potentially cripple our debt-laden economy. The Fed acted by not only cutting rates, but also by injecting extra liquidity into the system, the scenario in which the biggest winners included commodities, especially gold. Other stocks in the Focus Fund portfolio, leveraged to both growth and inflation, also benefited from this market and economic environment.
We are ending 2007 with inflation at levels rarely seen since the 1980s. As such, we are likely to see more gains in commodities, including gold and energy, in 2008. And with the Fed keeping the U.S. economy afloat by cutting rates and pumping more cash into the system – we are more likely to see an acceleration of these trends than deceleration.
Performance Review
During the period, the Fund strived to be fully invested. Credit for the outperformance of the Fund during 2007 goes to our overweighting in energy (including a fair dose of alternative energy plays), materials, and industrials. During the big part of the year the Fund has also been significantly underweighted in financials, the market’s biggest laggard. We were also underweight in consumer discretionary shares.
We were opportunistic in our investment process, and when we felt that the market sold off certain high growth and high quality financial stocks, we added to our exposure to the sector by buying shares “on sale.” We find certain comfort in the fact that no other than Warren Buffett has added to his positions in financials. While investing in the downtrodden seems like a risky strategy, the losses here may turn out to be temporary – and a necessary step on the way to outperform in the future.
Among stocks contributing the most to the performance for the year were First Solar (FSLR), an alternative energy leader; National Oilwell Varco (NOV), a leading oil and gas equipment and systems manufacturer; Deere &Co. (DE), a leader in agricultural machinery; Hess (HES), an integrated oil company; Google (GOOG), an undisputed leader in online services; Exelon (EXC) and FPL (FPL), two leading utility companies with the strongest growth profiles, in our opinion, in the industry; and StreetTRACKS Gold ETF (GLD).
Outlook and Strategy
We expect the upcoming period to be challenging as inflation is likely to remain high, if not accelerate, and economic growth is likely to slow. Look for us to continue to focus on stocks benefiting from inflation, including energy, materials (including precious metals plays) and industrials. International investments, and the shares of large companies benefiting from overseas growth, will remain a big part of our strategy
We don’t think this economy would allow for a smooth and easy ride. However, we will work on your side, day in and day out, to attempt to recognize trends early and take advantage of opportunities as they arise.
Performance Results

The performance quoted represents past performance, which does not guarantee future results. The investment return and principal value of an investment will fluctuate so that an investor’s shares, when redeemed, may be worth more or less than their original cost. The returns shown do not reflect deduction of taxes that a shareholder would pay on Fund distributions or the redemption of Fund shares. Current performance of the Fund may be lower or higher than the performance quoted. The Fund’s investment objectives, risks, charges and expenses must be considered carefully before investing. Performance data current to the most recent month end may be obtained by calling 1-866-400-5332.
* Return figures reflect any change in price per share and assume the reinvestment of all distributions.
** The indices are unmanaged benchmarks that assume reinvestment of all distributions and exclude the effect of taxes and fees. The S&P 500 Index and Russell 1000 Growth Index are widely recognized unmanaged indices of equity prices and are representative of a broader market and range of securities than is found in the Fund’s portfolio. Individuals cannot invest directly in the indices; however, an individual can invest in exchange traded funds or other investment vehicles that attempt to track the performance of a benchmark index.

The chart above assumes an initial investment of $100,000 made on December 26, 2006 (commencement of Class I shares) and held through November 30, 2007. The S&P 500 Index and Russell 1000 Growth Index are widely recognized unmanaged indices of equity prices and are representative of a broader market and range of securities than is found in the Fund’s portfolio. Individuals cannot invest directly in the indices; however, an individual can invest in ETFs or other investment vehicles that attempt to tract the performance of a benchmark index. THE FUND’S RETURN REPRESENTS PAST PERFORMANCE AND DOES NOT GUARANTEE FUTURE RESULTS. The returns shown do not reflect deduction of taxes that a shareholder would pay on Fund distributions or the redemption of Fund shares. Investment returns and principal values will fluctuate so that your shares, when redeemed, may be worth more or less than their original purchase price.
Current performance may be lower or higher than the performance data quoted. For more information on the Fund and to obtain performance data current to the most recent month end, please call 1-866-400-5332. Investing in the Fund involves certain risks that are discussed in the Fund’s prospectus. Please read the prospectus carefully before you invest or send money.
The Fund is distributed by Unified Financial Securities, Inc., member FINRA.

The chart above assumes an initial investment of $10,000 made on December 26, 2006 (commencement of Class R shares) and held through November 30, 2007. The S&P 500 Index and Russell 1000 Growth Index are widely recognized unmanaged indices of equity prices and are representative of a broader market and range of securities than is found in the Fund’s portfolio. Individuals cannot invest directly in the indices; however, an individual can invest in ETF’s or other investment vehicles that attempt to tract the performance of a benchmark index. THE FUND’S RETURN REPRESENTS PAST PERFORMANCE AND DOES NOT GUARANTEE FUTURE RESULTS. The returns shown do not reflect deduction of taxes that a shareholder would pay on Fund distributions or the redemption of Fund shares. Investment returns and principal values will fluctuate so that your shares, when redeemed, may be worth more or less than their original purchase price.
Current performance may be lower or higher than the performance data quoted. For more information on the Fund and to obtain performance data current to the most recent month end, please call 1-866-400-5332. Investing in the Fund involves certain risks that are discussed in the Fund’s prospectus. Please read the prospectus carefully before you invest or send money.
The Fund is distributed by Unified Financial Securities, Inc., member FINRA.
FUND HOLDINGS – | Unaudited |
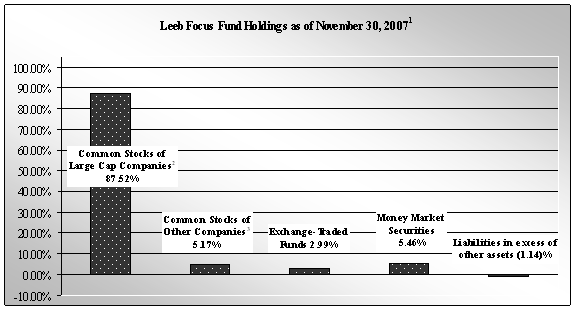
1As a percent of net assets.
2US Companies with market caps exceeding $8 billion. |
3US Companies with market caps less than $8 billion. |
The Leeb Focus Fund invests primarily in equity securities of large-capitalization U.S. companies (generally those with market capitalizations exceeding $8 billion).
Availability of Portfolio Schedule – (Unaudited)
The Fund files its complete schedule of portfolio holdings with the Securities and Exchange Commission (“SEC”) for the first and third quarters of each fiscal year on Form N-Q. The Fund’s Forms N-Q are available at the SEC’s website at www.sec.gov. The Fund’s Forms N-Q may be reviewed and copied at the Public Reference Room in Washington DC. Information on the operation of the Public Reference Room may be obtained by calling 1-800-SEC-0330.
Summary of Fund’s Expenses – (Unaudited)
As a shareholder of the Fund, you incur two types of costs: (1) transaction costs, such as redemption fees; and (2) ongoing costs, including management fees and other Fund expenses. This example is intended to help you understand your ongoing costs (in dollars) of investing in the Fund and to compare these costs with the ongoing costs of investing in other mutual funds. The example is based on an investment of $1,000 invested at the beginning of the period June 1, 2007 and held for the entire period through November 30, 2007.
Actual Expenses
The first line of the table below provides information about actual account values and actual expenses. You may use the information in this line, together with the amount you invested, to estimate the expenses that you paid over the period. Simply divide your account value by $1,000 (for example, an $8,600 account value divided by $1,000 = 8.60), then multiply the result by the number in the first line under the heading entitled “Expenses Paid During Period” to estimate the expenses you paid on your account during this period.
Hypothetical Example for Comparison Purposes
The second line of the table below provides information about hypothetical account values and hypothetical expenses based on the Fund’s actual expense ratio and an assumed rate of return of 5% per year before expenses, which is not the Fund’s actual return. The hypothetical account values and expenses may not be used to estimate the actual ending account balance or expenses you paid for the period. You may use this information to compare the ongoing costs of investing in the Fund and other funds. To do so, compare this 5% hypothetical example with the 5% hypothetical examples that appear in the shareholder reports of the other funds.
Please note that the expenses shown in the table are meant to highlight your ongoing costs only and do not reflect any transactional costs, such as sales charges (loads), redemption fees, or exchange fees. Therefore, the second line of the table is useful in comparing ongoing costs only, and will not help you determine the relative total costs of owning different funds. In addition, if these transactional costs were included, your costs would have been higher.
The Leeb Focus Fund Class I | Beginning Account Value June 1, 2007 | Ending Account Value November 30, 2007 | Expenses Paid During the Period Ended November 30, 2007 |
Actual * | $1,000.00 | $1,100.83 | $7.88 |
Hypothetical ** | $1,000.00 | $1,017.56 | $7.57 |
*Expenses are equal to the Fund’s annualized expense ratio of 1.50%, multiplied by the average account value over the period, multiplied by 183/365 (to reflect the partial year period).
**Assumes a 5% return before expenses.
The Leeb Focus Fund Class R | Beginning Account Value June 1, 2007 | Ending Account Value November 30, 2007 | Expenses Paid During the Period Ended November 30, 2007 |
Actual * | $1,000.00 | $1,102.59 | $9.24 |
Hypothetical ** | $1,000.00 | $1,016.28 | $8.86 |
*Expenses are equal to the Fund’s annualized expense ratio of 1.75%, multiplied by the average account value over the period, multiplied by 183/365 (to reflect the partial year period).
** Assumes a 5% return before expenses.
Leeb Focus Fund |
|
|
|
|
|
|
|
Schedule of Investments |
|
|
|
|
|
|
|
November 30, 2007 |
|
|
|
|
|
|
|
|
|
|
|
|
|
|
|
Common Stocks - 92.69% |
|
|
|
| Shares |
| Value |
|
|
|
|
|
|
|
|
Beverages - 2.89% |
|
|
|
|
|
|
|
The Coca-Cola Co. |
|
|
|
| 5,300 |
| $ 329,130 |
|
|
|
|
|
|
|
|
Computer Communications Equipment - 2.09% |
|
|
|
|
| ||
Cisco Systems, Inc. (a) |
|
|
|
| 8,500 |
| 238,170 |
|
|
|
|
|
|
|
|
Crude Petroleum & Natural Gas - 3.08% |
|
|
|
|
|
| |
Apache Corp. |
|
|
|
| 1,700 |
| 164,543 |
Denbury Resources, Inc. (a) |
|
|
|
| 3,500 |
| 186,620 |
|
|
|
|
|
|
| 351,163 |
|
|
|
|
|
|
|
|
Drawing & Insulating of Nonferrous Wire - 2.56% |
|
|
|
|
| ||
Corning, Inc. |
|
|
|
| 12,000 |
| 291,480 |
|
|
|
|
|
|
|
|
Drilling Oil & Gas Wells - 4.37% |
|
|
|
|
|
| |
Nabors Industries, Ltd. (a) |
|
|
|
| 3,400 |
| 91,460 |
Transocean, Inc. (a) |
|
|
|
| 2,958 |
| 406,170 |
|
|
|
|
|
|
| 497,630 |
|
|
|
|
|
|
|
|
Electric Services - 4.41% |
|
|
|
|
|
|
|
FPL Group, Inc. |
|
|
|
| 7,200 |
| 502,272 |
|
|
|
|
|
|
|
|
Electric & Other Services Combined - 1.99% |
|
|
|
|
| ||
Exelon Corp. |
|
|
|
| 2,800 |
| 226,996 |
|
|
|
|
|
|
|
|
Electronic & Other Electrical Equipment - 3.53% |
|
|
|
|
| ||
General Electric Co. |
|
|
|
| 10,500 |
| 402,045 |
|
|
|
|
|
|
|
|
Farm Machinery & Equipment - 2.71% |
|
|
|
|
|
| |
Deere & Co. |
|
|
|
| 1,800 |
| 309,240 |
|
|
|
|
|
|
|
|
Finance Services - 1.66% |
|
|
|
|
|
|
|
American Express Co. |
|
|
|
| 3,200 |
| 188,736 |
|
|
|
|
|
|
|
|
Fire, Marine & Casualty Insurance - 4.12% |
|
|
|
|
| ||
Berkshire Hathaway, Inc. - Class B (a) |
|
|
| 100 |
| 469,000 | |
|
|
|
|
|
|
|
|
Gold and Silver Ores - 1.96% |
|
|
|
|
| ||
Barrick Gold Corp. |
|
|
|
| 5,500 |
| 222,805 |
|
|
|
|
|
|
|
|
Industrial Inorganic Chemicals - 2.00% |
|
|
|
|
|
| |
Air Products and Chemicals, Inc. |
|
|
| 2,300 |
| 227,792 | |
|
|
|
|
|
|
|
|
Industrial Instruments For Measurement, Display, and Control - 2.59% |
|
|
| ||||
Danaher Corp. |
|
|
|
| 3,400 |
| 295,188 |
*See accompanying notes which are an integral part of these financial statements.
|
|
| |||||
Leeb Focus Fund |
|
|
|
|
|
|
|
Schedule of Investments - continued |
|
|
|
|
|
| |
November 30, 2007 |
|
|
|
|
|
|
|
|
|
|
|
|
|
|
|
Common Stocks - 92.69% - continued |
|
|
| Shares |
| Value | |
|
|
|
|
|
|
|
|
Metal Mining - 1.60% |
|
|
|
|
|
|
|
BHP Billiton, Ltd. (b) |
|
|
|
| 2,400 |
| $ 181,992 |
|
|
|
|
|
|
|
|
Miscellaneous Electrical Machinery, Equipment & Supplies - 0.82% |
|
|
|
| |||
Energy Conversion Devices, Inc. (a) |
|
|
| 3,600 |
| 93,132 | |
|
|
|
|
|
|
|
|
Motor Vehicles & Passenger Car Bodies - 1.48% |
|
|
|
|
| ||
Toyota Motor Corp. (b) |
|
|
|
| 1,500 |
| 168,975 |
|
|
|
|
|
|
|
|
National Commercial Banks - 6.32% |
|
|
|
|
|
| |
U.S. Bancorp. |
|
|
|
| 10,200 |
| 337,518 |
Wells Fargo & Co. |
|
|
|
| 11,800 |
| 382,674 |
|
|
|
|
|
|
| 720,192 |
|
|
|
|
|
|
|
|
Oil & Gas Field Machinery & Equipment - 3.89% |
|
|
|
|
| ||
Baker Hughes, Inc. |
|
|
|
| 2,200 |
| 176,594 |
National-Oilwell Varco, Inc. (a) |
|
|
| 3,900 |
| 265,785 | |
|
|
|
|
|
|
| 442,379 |
|
|
|
|
|
|
|
|
Oil, Gas Field Services - 4.35% |
|
|
|
|
|
| |
Schlumberger, Ltd. |
|
|
|
| 5,300 |
| 495,285 |
|
|
|
|
|
|
|
|
Petroleum Refining - 2.38% |
|
|
|
|
|
|
|
Hess Corp. |
|
|
|
| 3,800 |
| 270,636 |
|
|
|
|
|
|
|
|
Pharmaceutical Preparations - 7.57% |
|
|
|
|
|
| |
Amylin Pharmaceuticals, Inc. (a) |
|
|
| 5,700 |
| 217,683 | |
Johnson & Johnson |
|
|
|
| 5,100 |
| 345,474 |
Novartis AG (b) |
|
|
|
| 5,300 |
| 299,556 |
|
|
|
|
|
|
| 862,713 |
|
|
|
|
|
|
|
|
Pumps & Pumping Equipment - 1.58% |
|
|
|
|
|
| |
ITT Corp. |
|
|
|
| 2,800 |
| 180,432 |
|
|
|
|
|
|
|
|
Retail - Drug Stores & Proprietary Stores - 2.85% |
|
|
|
|
| ||
CVS Caremark Corp. |
|
|
|
| 8,100 |
| 324,729 |
|
|
|
|
|
|
|
|
Search, Detection, Navigation, Guidance, & Aeronautical Systems - 3.27% |
|
|
| ||||
Northrop Grumman Corp. |
|
|
|
| 2,300 |
| 181,217 |
Raytheon Co. |
|
|
|
| 3,100 |
| 191,735 |
|
|
|
|
|
|
| 372,952 |
|
|
|
|
|
|
|
|
Security Brokers, Dealers & Floatation Companies - 2.98% |
|
|
|
| |||
The Goldman Sachs Group, Inc. |
|
|
| 1,500 |
| 339,960 | |
|
|
|
|
|
|
|
|
Semiconductors & Related Devices - 4.65% |
|
|
|
| |||
First Solar, Inc. (a) |
|
|
|
| 1,300 |
| 308,295 |
Intel Corp. |
|
|
|
| 8,500 |
| 221,680 |
|
|
|
|
|
|
| 529,975 |
*See accompanying notes which are an integral part of these financial statements.
Leeb Focus Fund |
|
|
|
|
|
|
| ||
Schedule of Investments |
|
|
|
|
|
|
| ||
November 30, 2007 |
|
|
|
|
|
|
| ||
|
|
|
|
|
|
|
| ||
Common Stocks - 92.69% - continued |
|
|
| Shares |
| Value | |||
|
|
|
|
|
|
|
| ||
Services - Computer Programming, Data Processing, Etc. - 2.62% |
|
|
|
| |||||
Google Inc. - Class A (a) |
|
|
|
| 430 |
| $ 297,990 | ||
|
|
|
|
|
|
|
| ||
Services - Consumer Credit Reporting, Collection Agencies - 1.59% |
|
|
| ||||||
Moody's Corp. |
|
|
|
| 4,800 |
| 180,768 | ||
|
|
|
|
|
|
|
| ||
Services - Management Consulting - 1.60% |
|
|
|
|
| ||||
ABB, Ltd. (b) |
|
|
|
| 6,200 |
| 182,156 | ||
|
|
|
|
|
|
|
| ||
Soap, Detergents, Cleaning Preparations, Perfumes, Cosmetics - 3.18% |
|
|
| ||||||
The Procter & Gamble Co. |
|
|
|
| 4,900 |
| 362,600 | ||
|
|
|
|
|
|
|
| ||
TOTAL COMMON STOCKS (Cost $9,318,069) |
|
|
|
| 10,558,513 | ||||
|
|
|
|
|
|
|
| ||
Exchange-Traded Funds - 2.99% |
|
|
|
|
|
| |||
streetTRACKS Gold Trust (a) |
|
|
| 4,400 |
| 340,164 | |||
|
|
|
|
|
|
|
| ||
TOTAL EXCHANGE-TRADED FUNDS (Cost $284,204) |
|
|
| 340,164 | |||||
|
|
|
|
|
|
|
| ||
Money Market Securities - 5.46% |
|
|
|
|
|
| |||
Fidelity Institutional Money Market Portfolio - Class I - 4.96% (c) |
| 621,614 |
| 621,614 | |||||
|
|
|
|
|
|
|
| ||
TOTAL MONEY MARKET SECURITIES (Cost $621,614) |
|
|
| 621,614 | |||||
|
|
|
|
|
|
|
| ||
TOTAL INVESTMENTS (Cost $10,223,887) - 101.14% |
|
|
| $ 11,520,291 | |||||
|
|
|
|
|
|
|
| ||
Liabilities in excess of other assets - (1.14)% |
|
|
|
| (129,369) | ||||
|
|
|
|
|
|
|
| ||
TOTAL NET ASSETS - 100.00% |
|
|
|
|
| $ 11,390,922 | |||
|
|
|
|
|
|
|
| ||
|
|
|
|
|
|
|
| ||
| (a) Non-income producing. |
| |||||||
| (b) American Depositary Receipt. |
| |||||||
| (c) Variable rate security; the money market rate shown represents the rate at November 30, 2007. |
| |||||||
*See accompanying notes which are an integral part of these financial statements.
Leeb Focus Fund |
|
|
Statement of Assets and Liabilities |
|
|
November 30, 2007 |
|
|
|
|
|
|
|
|
Assets |
|
|
Investments in securities: |
|
|
At cost |
| $ 10,223,887 |
At market value |
| $ 11,520,291 |
|
|
|
Receivable due from Adviser (a) |
| 34,260 |
Receivable for fund shares sold |
| 27,000 |
Dividends receivable |
| 18,620 |
Prepaid expenses |
| 17,728 |
Interest receivable |
| 2,109 |
Total assets |
| 11,620,008 |
|
|
|
Liabilities |
|
|
Payable for investments purchased |
| 190,423 |
Payable to administrator, fund accountant, and transfer agent | 19,095 | |
Accrued trustee and officer expenses |
| 1,904 |
Payable to custodian |
| 1,152 |
Accrued 12b-1 fees, Class R |
| 275 |
Other accrued expenses |
| 16,237 |
Total liabilities |
| 229,086 |
|
|
|
Net Assets |
| $ 11,390,922 |
|
|
|
Net Assets consist of: |
|
|
Paid in capital |
| $ 9,951,729 |
Accumulated undistributed net investment income | 140,348 | |
Accumulated undistributed net realized gain from investment transactions | 2,441 | |
Net unrealized appreciation on investments |
| 1,296,404 |
|
|
|
Net Asset Value |
| $ 11,390,922 |
|
|
|
Class I: |
|
|
|
|
|
Net Assets |
| $ 10,001,638 |
|
|
|
Shares outstanding (unlimited number of shares authorized) | 840,150 | |
|
|
|
Net asset value, offering and redemption price per share | $ 11.90 | |
|
|
|
Class R: |
|
|
|
|
|
Net Assets |
| $ 1,389,284 |
|
|
|
Shares outstanding (unlimited number of shares authorized) | 116,492 | |
|
|
|
Net asset value and offering price per share |
| $ 11.93 |
|
|
|
Redemption price per share ($11.93 * 0.98) (b) |
| $ 11.69 |
|
|
|
|
|
|
|
|
|
(a) See Note 3 in the Notes to the Financial Statements. | ||
(b) The Fund charges a 2.00% redemption fee on Class R shares redeemed within 60 calendar days after they | ||
are purchased. Shares are redeemed at the Net Asset Value if held longer than 60 calendar days. | ||
*See accompanying notes which are an integral part of these financial statements.
Leeb Focus Fund |
|
|
|
|
| |
Statement of Operations |
|
|
|
|
| |
For the period ended November 30, 2007 (a) |
|
|
| |||
|
|
|
|
|
|
|
|
|
|
|
|
|
|
Investment Income |
|
|
|
|
| |
Dividend income (Net of foreign withholding tax of $3,419) |
| $ 228,931 | ||||
Interest income |
|
|
|
| 24,495 | |
Total Income |
|
|
|
|
| 253,426 |
|
|
|
|
|
|
|
Expenses |
|
|
|
|
|
|
Investment adviser fees (b) |
|
|
| 60,792 | ||
12b-1 fees, Class R (b) |
|
|
|
| 1,363 | |
Transfer agent expenses |
|
|
|
| 64,631 | |
Administration expenses |
|
|
|
| 38,287 | |
Registration expenses |
|
|
|
| 35,618 | |
Fund accounting expenses |
|
|
|
| 33,017 | |
Auditing expenses |
|
|
|
| 12,450 | |
Legal expenses |
|
|
|
| 7,918 | |
Custodian expenses |
|
|
|
| 6,521 | |
CCO expenses |
|
|
|
|
| 5,039 |
Trustee expenses |
|
|
|
| 4,471 | |
Pricing expenses |
|
|
|
| 4,099 | |
Miscellaneous expenses |
|
|
|
| 2,701 | |
Printing expenses |
|
|
|
| 2,197 | |
24f-2 expenses |
|
|
|
|
| 305 |
Total Expenses |
|
|
|
| 279,409 | |
Fees waived and expenses reimbursed by Adviser (b) |
| (170,887) | ||||
Net operating expenses |
|
|
|
| 108,522 | |
Net Investment Income |
|
|
|
| 144,904 | |
|
|
|
|
|
|
|
|
|
|
|
|
|
|
Realized & Unrealized Gain (Loss) |
|
|
|
| ||
Net realized gain on investment securities |
|
| 2,441 | |||
Change in unrealized appreciation (depreciation) on investment securities | 1,296,404 | |||||
Net realized and unrealized gain on investment securities |
| 1,298,845 | ||||
Net increase in net assets resulting from operations |
| $ 1,443,749 | ||||
(a) For the period December 26, 2006 (Commencement of Fund operations) through November 30, 2007.
(b) See Note 3 in the Notes to the Financial Statements.
*See accompanying notes which are an integral part of these financial statements.
Leeb Focus Fund |
|
|
|
|
|
|
| |
Statement of Changes In Net Assets |
|
|
|
|
| |||
|
|
|
|
|
|
|
|
|
|
|
|
|
|
|
|
|
|
|
|
|
|
|
|
|
|
|
|
|
|
|
|
|
| Period ended |
|
Increase (Decrease) in Net Assets Due To: |
|
|
| November 30, 2007 | (a) | |||
Operations: |
|
|
|
|
|
|
| |
Net investment income |
|
|
|
| $ 144,904 |
| ||
Net realized gain on investment securities |
|
|
| 2,441 |
| |||
Change in unrealized appreciation (depreciation) on investment securities | 1,296,404 |
| ||||||
Net increase in net assets resulting from operations |
|
| 1,443,749 |
| ||||
|
|
|
|
|
|
|
|
|
Distributions to shareholders: |
|
|
|
|
|
| ||
From net investment income, Class I |
|
|
| (4,556) |
| |||
Total distributions |
|
|
|
|
| (4,556) |
| |
|
|
|
|
|
|
|
|
|
Capital Share Transactions - Class I |
|
|
|
|
|
| ||
Proceeds from shares sold |
|
|
|
| 9,635,974 |
| ||
Reinvestment of distributions |
|
|
|
| 4,556 |
| ||
Amount paid for shares repurchased |
|
|
| (969,915) |
| |||
Net increase in net assets resulting |
|
|
|
|
|
| ||
from Class I share transactions |
|
|
|
| 8,670,615 |
| ||
|
|
|
|
|
|
|
|
|
Capital Share Transactions - Class R |
|
|
|
|
| |||
Proceeds from shares sold |
|
|
|
| 1,620,939 |
| ||
Amount paid for shares repurchased |
|
|
| (339,825) |
| |||
Net increase in net assets resulting |
|
|
|
|
|
| ||
from Class R share transactions |
|
|
|
| 1,281,114 |
| ||
|
|
|
|
|
|
|
|
|
Net increase in net assets resulting |
|
|
|
|
|
| ||
from share transactions |
|
|
|
| 9,951,729 |
| ||
|
|
|
|
|
|
|
|
|
Total increase in Net Assets |
|
|
|
| 11,390,922 |
| ||
|
|
|
|
|
|
|
|
|
Net Assets |
|
|
|
|
|
|
|
|
Beginning of period |
|
|
|
|
| - |
| |
|
|
|
|
|
|
|
|
|
End of period |
|
|
|
|
| $ 11,390,922 |
| |
|
|
|
|
|
|
|
|
|
Accumulated undistributed net investment income |
|
|
|
| ||||
included in net assets at the end of each period |
|
| $ 140,348 |
| ||||
|
|
|
|
|
|
|
|
|
Capital Share Transactions - I Shares |
|
|
|
|
| |||
Shares sold |
|
|
|
|
| 930,639 |
| |
Shares issued in reinvestment of distributions |
|
|
| 454 |
| |||
Shares repurchased |
|
|
|
|
| (90,943) |
| |
|
|
|
|
|
|
|
|
|
Net increase from capital share transactions |
|
|
| 840,150 |
| |||
|
|
|
|
|
|
|
|
|
Capital Share Transactions - R Shares |
|
|
|
|
| |||
Shares sold |
|
|
|
|
| 147,803 |
| |
Shares issued in reinvestment of distributions |
|
|
| - |
| |||
Shares repurchased |
|
|
|
|
| (31,311) |
| |
|
|
|
|
|
|
|
|
|
Net increase from capital share transactions |
|
|
| 116,492 |
| |||
(a) For the period December 26, 2006 (Commencement of Operations) to November 30, 2007.
*See accompanying notes which are an integral part of these financial statements.
Leeb Focus Fund - Class I |
|
|
|
|
Financial Highlights |
|
|
|
|
(For a share outstanding during the period) |
|
|
|
|
|
|
|
|
|
|
|
| Period ended |
|
|
|
| November 30, 2007 | (a) |
|
|
|
|
|
Selected Per Share Data |
|
|
|
|
Net asset value, beginning of period |
|
| $ 10.00 |
|
Income from investment operations: |
|
|
|
|
Net investment income |
|
| 0.16 |
|
Net realized and unrealized gain (loss) |
|
| 1.75 |
|
Total from investment operations |
|
| 1.91 |
|
|
|
|
|
|
Less Distributions to shareholders: |
|
|
|
|
From net investment income |
|
| (0.01) |
|
From net realized gain |
|
| - |
|
Total distributions |
|
| (0.01) |
|
|
|
|
|
|
Net asset value, end of period |
|
| $ 11.90 |
|
|
|
|
|
|
Total Return (b) |
|
| 19.16% | (c) |
|
|
|
|
|
Ratios and Supplemental Data |
|
|
|
|
Net assets, end of period (000) |
|
| $ 10,002 |
|
Ratio of expenses to average net assets |
|
| 1.50% | (d) |
Ratio of expenses to average net assets |
|
|
|
|
before waiver & reimbursement |
|
| 3.89% | (d) |
Ratio of net investment income to |
|
|
|
|
average net assets |
|
| 1.97% | (d) |
Ratio of net investment income (loss) to |
|
|
|
|
average net assets before waiver & reimbursement |
|
| (0.42)% | (d) |
Portfolio turnover rate |
|
| 54.69% |
|
|
|
|
|
|
|
|
|
|
|
(a) For the period December 26, 2006 (Commencement of Operations) to November 30, 2007. | ||||
(b) Total return in the above table represents the rate that the investor would have earned or lost on | ||||
an investment in the Fund, assuming reinvestment of dividends. | ||||
(c) Not annualized. | ||||
(d) Annualized. | ||||
*See accompanying notes which are an integral part of these financial statements.
Leeb Focus Fund - Class R |
|
|
|
|
Financial Highlights |
|
|
|
|
(For a share outstanding during the period) |
|
|
|
|
|
|
|
|
|
|
|
| Period ended |
|
|
|
| November 30, 2007 | (a) |
|
|
|
|
|
Selected Per Share Data |
|
|
|
|
Net asset value, beginning of period |
|
| $ 10.00 |
|
Income from investment operations: |
|
|
|
|
Net investment income |
|
| 0.13 |
|
Net realized and unrealized gain (loss) |
|
| 1.78 |
|
Total from investment operations |
|
| 1.91 |
|
|
|
|
|
|
Paid in capital from redemption fees |
|
| 0.02 |
|
|
|
|
|
|
Net asset value, end of period |
|
| $ 11.93 |
|
|
|
|
|
|
Total Return (b) |
|
| 19.30% | (c) |
|
|
|
|
|
Ratios and Supplemental Data |
|
|
|
|
Net assets, end of period (000) |
|
| $ 1,389 |
|
Ratio of expenses to average net assets |
|
| 1.75% | (d) |
Ratio of expenses to average net assets |
|
|
|
|
before waiver & reimbursement |
|
| 4.13% | (d) |
Ratio of net investment income to |
|
|
|
|
average net assets |
|
| 2.67% | (d) |
Ratio of net investment income to |
|
|
|
|
average net assets before waiver & reimbursement |
|
| 0.29% | (d) |
Portfolio turnover rate |
|
| 54.69% |
|
|
|
|
|
|
|
|
|
|
|
|
|
|
|
|
|
|
|
|
|
(a) For the period December 26, 2006 (Commencement of Operations) to November 30, 2007. | ||||
(b) Total return in the above table represents the rate that the investor would have earned or lost on | ||||
an investment in the Fund, assuming reinvestment of dividends. | ||||
(c) Not annualized. | ||||
(d) Annualized. | ||||
*See accompanying notes which are an integral part of these financial statements.
Leeb Focus Fund
Notes to the Financial Statements
November 30, 2007
NOTE 1. ORGANIZATION |
The Leeb Focus Fund (the “Fund”) was organized as a diversified series of Unified Series Trust (the “Trust”) on August 14, 2006. The Trust is an open-end investment company established under the laws of Ohio by an Agreement and Declaration of Trust dated October 17, 2002 (the “Trust Agreement”). The Trust Agreement permits the Board of Trustees (the “Board”) to issue an unlimited number of shares of beneficial interest of separate series. The Board has authorized two classes of shares: Class R and Class I. Each class is subject to different expenses and a different sales charge structure. The Fund is one of a series of funds currently authorized by the Board. The Fund commenced operations on December 26, 2006. The Fund’s investment objective is to provide long-term capital appreciation consistent with the preservation of capital. The Fund’s investment adviser is Leeb Capital Management, Inc. (the “Adviser”).
NOTE 2. SIGNIFICANT ACCOUNTING POLICIES
The following is a summary of significant accounting policies followed by the Fund in the preparation of its financial statements.
Securities Valuation - Equity securities are valued by using market quotations, but may be valued on the basis of prices furnished by a pricing service when the Adviser believes such prices more accurately reflect the fair market value of such securities. Securities that are traded on any stock exchange are generally valued by the pricing service at the last quoted sale price. Lacking a last sale price, an exchange traded security is generally valued by the pricing service at its last bid price. Securities traded in the NASDAQ over-the-counter market are generally valued by the pricing service at the NASDAQ Official Closing Price. When market quotations are not readily available, when the Adviser determines that the market quotation or the price provided by the pricing service does not accurately reflect the current market value or when restricted or illiquid securities are being valued, such securities are valued as determined in good faith by the Adviser, in conformity with guidelines adopted by and subject to review of the Board.
Fixed income securities are valued by using market quotations, but may be valued on the basis of prices furnished by a pricing service when the Adviser believes such prices accurately reflect the fair market value of such securities. A pricing service utilizes electronic data processing techniques based on yield spreads relating to securities with similar characteristics to determine prices for normal institutional-size trading units of debt securities without regard to sale or bid prices. If the Adviser decides that a price provided by the pricing service does not accurately reflect the fair market value of the securities, when prices are not readily available from a pricing service, or when restricted or illiquid securities are being valued, securities are valued at fair value as determined in good faith by the Adviser, subject to review of the Board. Short term investments in fixed income securities with maturities of less than 60 days when acquired, or which subsequently are within 60 days of maturity, are valued by using the amortized cost method of valuation, which the Board has determined will represent fair value. The ability of issuers of debt securities held by the Fund to meet their obligations may be affected by economic and political developments in a specific country or region.
In accordance with the Trust’s good faith pricing guidelines, the Adviser is required to consider all appropriate factors relevant to the value of securities for which it has determined other pricing sources are not available or reliable as described above. No single standard exists for determining fair value controls, since fair value depends upon the circumstances of each individual case. As a general principle, the current fair value of an issue of securities being valued by the Adviser would appear to be the amount which the owner might reasonably expect to receive for them upon their current sale. Methods which are in accordance with this principle may, for example, be based on (i) a multiple of earnings; (ii) a discount from market of a similar freely traded security (including a derivative security or a basket of securities traded on other markets, exchanges or among dealers); or (iii) yield to maturity with respect to debt issues, or a combination of these and other methods.
Leeb Focus Fund
Notes to the Financial Statements - continued
November 30, 2007
NOTE 2. SIGNIFICANT ACCOUNTING POLICIES – continued
Good faith pricing is permitted if, in the Adviser’s opinion, the validity of market quotations appears to be questionable based on factors such as evidence of a thin market in the security based on a small number of quotations, a significant event occurs after the close of a market but before the Fund’s NAV calculation that may affect a security’s value, or the advisor is aware of any other data that calls into question the reliability of market quotations. Investments in foreign securities, junk bonds or other thinly traded securities are more likely to trigger fair valuation than other securities.
Federal Income Taxes – The Fund makes no provision for federal income tax. The Fund intends to qualify each year as a “regulated investment company” under subchapter M of the Internal Revenue Code of 1986, as amended, by distributing all of its net investment income and net realized capital gains. If the required amount of net investment income is not distributed, the Fund could incur a tax expense.
Security Transactions and Related Income – The Fund follows industry practice and records security transactions on the trade date. The specific identification method is used for determining gains or losses for financial statements and income tax purposes. Dividend income is recorded on the ex-dividend date and interest income is recorded on an accrual basis. Discounts and premiums on securities purchased are amortized or accreted using the effective interest method. Withholding taxes on foreign dividends have been provided for in accordance with the Fund’s understanding of the applicable country’s tax rules and rates.
Expenses – Expenses incurred by the Trust that do not relate to a specific fund of the Trust are allocated to the individual funds based on each fund’s relative net assets or other appropriate basis (as determined by the Board).
Accounting for Uncertainty in Income Taxes – The Fund adopted the provisions of Financial Accounting Standards Board (FASB) Interpretation No. 48 (“FIN 48”), Accounting for Uncertainty in Income Taxes on June 29, 2007. The implementation of FIN 48 resulted in no material liability for unrecognized tax benefits and no material change to the beginning net asset value of the Fund.
As of and during the period ended November 30, 2007, the Fund did not have a liability for any unrecognized tax benefits. The Fund recognizes interest and penalties, if any, related to unrecognized tax benefits as income tax expense in the statement of operations. During the period, the Fund did not incur any interest or penalties.
Fair Value Measurements – In September 2006, FASB issued Statement on Financial Accounting Standards (SFAS) No. 157 “Fair Value Measurements.” This standard establishes a single authoritative definition of fair value, sets out a framework for measuring fair value and requires additional disclosure about fair value measurements. SFAS No. 157 applies to fair value measurements already required or permitted by existing standards. SFAS No. 157 is effective for financial statements issued for fiscal years beginning after November 15, 2007 and interim periods within those fiscal years. The changes to current generally accepted accounting principles from the application of this Statement relate to the definition of fair value, the methods used to measure fair value, and the expanded disclosures about fair value measurements. As of November 30, 2007, the Fund does not believe the adoption of SFAS No. 157 will impact the amounts reported in the financial statements; however, additional disclosures may be required about the inputs used to develop the measurements and the effect of certain measurements reported on the statement of changes in net assets for a fiscal period.
Redemption Fees – With respect to Class R Shares, there is no initial sales charge on purchases; however, the Fund charges a 2.00% redemption fee on Class R shares redeemed within 60 calendar days after they are purchased. Shares are redeemed at the NAV if held longer than 60 calendar days.
Dividends and Distributions – Distributions to shareholders, which are determined in accordance with income tax regulations, are recorded on the ex-dividend date. The Fund intends to distribute its net realized long-term capital gains and its net realized short-term capital gains at least once a year.
Leeb Focus Fund
Notes to the Financial Statements - continued
November 30, 2007
NOTE 2. SIGNIFICANT ACCOUNTING POLICIES – continued
The treatment for financial reporting purposes of distributions made to shareholders during the year from net investment income or net realized capital gains may differ from their ultimate treatment for federal income tax purposes. These differences are caused primarily by differences in the timing of the recognition of certain components of income, expenses or realized capital gain for federal income tax purposes. Where such differences are permanent in nature, they are reclassified in the components of the net assets based on their ultimate characterization for federal income tax purposes. Any such reclassifications will have no effect on net assets, results of operations or net asset values per share of each Fund.
Allocation of Income and Expenses, Realized and Unrealized Gains and Losses – Income, realized gains and losses, unrealized appreciation and depreciation, and fund-wide expenses are allocated to each class based on the net assets of that class in relation to the net assets of the fund (“relative net assets method”).
NOTE 3. FEES AND OTHER TRANSACTIONS WITH AFFILIATES
The Adviser, under the terms of the management agreement (the “Agreement”), manages the Fund’s investments subject to approval of the Board of Trustees. As compensation for its management services, the Fund is obligated to pay the Adviser a fee computed and accrued daily and paid monthly at an annual rate of 0.85% of the daily net assets of the Fund. For the period December 26, 2006 (commencement of operations) through November 30, 2007, before the waivers disclosed below, the Adviser earned a fee of $60,792 from the Fund.
The Adviser has contractually agreed through November 30, 2008 to waive its management fee and/or reimburse certain Fund operating expenses so that the total annual Fund operating expenses, excluding brokerage fees and commissions, taxes, borrowing costs (such as interest and dividend expense on securities sold short), extraordinary expenses, and any indirect expenses (such as expenses incurred by other investment companies in where the Fund may invest) do not exceed 1.50% of the average daily net assets of Class I shares and 1.75% of the average daily net assets of the Class R shares. For the period December 26, 2006 (commencement of operations) through November 30, 2007, the Adviser waived fees and reimbursed expenses of $170,887. At November 30, 2007, the Fund was owed $34,260 by the Advisor. Each waiver or reimbursement of an expense by the Adviser is subject to repayment by the Fund within the three fiscal years following the fiscal year in which the expense occurred, provided the Fund is able to make the repayment without exceeding the above stated expense limitations. As of November 30, 2007, $170,887 is subject to repayment by the Fund to the Adviser no later than November 30, 2010.
The Trust retains Unified Fund Services, Inc. (“Unified”), to manage the Fund’s business affairs and to provide the Fund with administrative services, including all regulatory reporting and necessary office equipment and personnel. For the period December 26, 2006 (commencement of operations) through November 30, 2007, Unified earned fees of $38,287 for administrative services provided to the Fund. At November 30, 2007, $6,751 was owed to Unified from the Fund for administrative services. Certain officers of the Trust are members of management and/or employees of Unified. Unified operates as a wholly-owned subsidiary of Huntington Bancshares, Inc., the parent company of the Distributor and Huntington National Bank, the custodian of the Fund’s investments (the “Custodian”). For the period December 26, 2006 (commencement of operations) through November 30, 2007, The Custodian earned fees of $6,521 for custody services provided to the Fund. At November 30, 2007, the Custodian was owed $1,152 from the Fund for custody services.
The Trust retains Unified to act as the Fund’s transfer agent and to provide the Fund with fund accounting services. For the period December 26, 2006 (commencement of operations) through November 30, 2007, Unified earned fees of $32,261 from the Fund for transfer agent services and $32,370 in reimbursement for out-of-pocket expenses incurred in providing transfer agent services. At November 30, 2007, Unified was owed $4,681 from the Fund for transfer agent services and $2,244 in reimbursement of out-of-pocket expenses.
Leeb Focus Fund
Notes to the Financial Statements - continued
November 30, 2007
NOTE 3. FEES AND OTHER TRANSACTIONS WITH AFFILIATES - continued
For the period December 26, 2006 (commencement of operations) through November 30, 2007, Unified earned fees of $33,017 from the Fund for fund accounting services. At November 30, 2007, Unified was owed $5,419 from the Fund for fund accounting services.
Unified Financial Securities, Inc. (the “Distributor”) acts as the principal distributor of shares of the Fund. The Fund has adopted a Distribution Plan (a “Plan”) pursuant to Rule 12b-1 under the 1940 Act for the Class R shares. The Fund’s Plan provides that the Fund will pay its Adviser and/or any registered securities dealer, financial institution or any other person (a “Recipient”) a shareholder servicing fee aggregating 0.25% of the average daily net assets of the Fund’s Class R shares in connection with the promotion and distribution of Fund shares or the provision of personal services to shareholders, including, but not necessarily limited to, advertising, compensation to underwriters, dealers and selling personnel, the printing and mailing of prospectuses to other than current Fund shareholders, the printing and mailing of sales literature and servicing shareholder accounts (“12b-1 Expenses”). The Fund and/or its Adviser may pay all or a portion of these fees to any recipient who renders assistance in distributing or promoting the sale of shares, or who provides certain shareholder services, pursuant to a written agreement. The Fund’s plan is a compensation plan, which means that compensation is provided regardless of 12b-1 expenses actually incurred. For the period December 26, 2006 (commencement of operations) through November 30, 2007, the Adviser earned fees of $1,363 from the Fund, of which $275 is unpaid at November 30, 2007.
Unified Financial Securities, Inc. (the “Distributor”) acts as the principal distributor of the Fund. There were no payments made to the Distributor by the Fund for the period December 26, 2006 (commencement of operations) through November 30, 2007. The Distributor, Unified and the Custodian are controlled by Huntington Bancshares, Inc.
NOTE 4. INVESTMENTS
For the period ended through November 30, 2007, purchases and sales of investment securities, other than short-term investments and call options written were as follows:

At November 30, 2007, the appreciation (depreciation) of investments for tax purposes, was as follows:
At November 30, 2007, the aggregate cost of securities for federal income tax purposes, was $10,264,710.
Leeb Focus Fund
Notes to the Financial Statements - continued
November 30, 2007
NOTE 5. ESTIMATES
The preparation of financial statements in conformity with accounting principles generally accepted in the United States of America requires management to make estimates and assumptions that affect the reported amounts of assets and liabilities and disclosure of contingent assets and liabilities at the date of the financial statements and the reported amounts of increases and decreases in net assets from operations during the reporting period. Actual results could differ from those estimates.
NOTE 6. BENEFICIAL OWNERSHIP
The beneficial ownership, either directly or indirectly, of more than 25% of the voting securities of a fund (or class) creates a presumption of control of the fund (or class), under Section 2(a)(9) of the Investment Company Act of 1940. As of November 30, 2007, Charles Schwab & Company, Inc. (“Schwab”), for the benefit of its customers, owned 74.54% of Class I shares and owned 27.81% of Class R shares of the Fund. As a result, Schwab may be deemed to control both Class I shares and Class R shares of the Fund.
NOTE 7. DISTRIBUTIONS TO SHAREHOLDERS
On December 28, 2006, Class I shares paid an income distribution of $0.0138 per share to shareholders of record on December 27, 2006.
The tax characterization of distributions for the period ended November 30, 2007 is as follows:

On December 18, 2007, Class I shares paid an income distribution of $0.1445 and a short term capital gain distribution of $0.0446 per share to shareholders of record on December 17, 2007.
On December 18, 2007, Class R shares paid an income distribution of $0.1336 per share and a short term capital gain distribution of $0.0446 per share to shareholders of record on December 17, 2007
As of November 30, 2007, the components of distributable earnings on a tax basis were as follows:

As of November 30, 2007, the difference between book basis and tax basis unrealized appreciation is attributable to the tax deferral of post-October losses in the amount of $40,823.
Leeb Focus Fund
Notes to the Financial Statements - continued
November 30, 2007
NOTE 8. SUBSEQUENT EVENT
Effective January 31, 2008, the Fund will no longer offer Retail Class shares for sale to the public. The Fund will offer Institutional Class shares only. Retail Class shares on the Fund’s books as of January 31, 2008 will be exchanged for Institutional Class shares. Institutional Class shares of the Fund are not subject to 12b-1 fees and, as a result, have a lower expense ratio. Beginning January 31, 2008, the Fund will impose an early redemption fee of 2.00% on all Institutional Class shares redeemed within 60 calendar days of purchase. In addition, the Fund will lower the minimum investment amounts for the Institutional Class as follows: initial investments will be subject to a minimum of $2,500 ($1,000 for retirement accounts), and $250 for subsequent investments. All Institutional Class shares shall be described as shares of the Fund, and will have no class designation.
REPORT OF INDEPENDENT REGISTERED PUBLIC ACCOUNTING FIRM
To The Shareholders and Board of Trustees
Leeb Focus Fund
(Unified Series Trust)
We have audited the accompanying statement of assets and liabilities, including the schedule of investments, of the Leeb Focus Fund (the “Fund”), a series of the Unified Series Trust, as of November 30, 2007, and the related statements of operations and changes in net assets, and the financial highlights for the period December 26, 2006 (commencement of operations) through November 30, 2007. These financial statements and financial highlights are the responsibility of Fund management. Our responsibility is to express an opinion on these financial statements and financial highlights based on our audit.
We conducted our audit in accordance with the standards of the Public Company Accounting Oversight Board (United States). Those standards require that we plan and perform the audit to obtain reasonable assurance about whether the financial statements and financial highlights are free of material misstatement. An audit includes examining, on a test basis, evidence supporting the amounts and disclosures in the financial statements. Our procedures included confirmation of securities owned as of November 30, 2007 by correspondence with the Fund’s custodian and brokers. An audit also includes assessing the accounting principles used and significant estimates made by management, as well as evaluating the overall financial statement presentation. We believe that our audit provides a reasonable basis for our opinion.
In our opinion, the financial statements and financial highlights referred to above present fairly, in all material respects, the financial position of the Leeb Focus Fund as of November 30, 2007 and the results of its operations, changes in its net assets, and the financial highlights for the period then ended, in conformity with accounting principles generally accepted in the United States of America.

COHEN FUND AUDIT SERVICES, LTD.
Westlake, Ohio
January 28, 2008
TRUSTEES AND OFFICERS
The Board of Trustees supervises the business activities of the Trust. Each Trustee serves as a trustee until termination of the Trust unless the Trustee dies, resigns, retires or is removed.
The following tables provide information regarding the Trustees and officers.
Independent Trustees
Name, Address*, (Age), Position with Trust**, Term of Position with Trust | Principal Occupation During Past 5 Years and Other Directorships |
Gary E. Hippenstiel (Age 60)
Independent Trustee, December 2002 to present | Director, Vice President and Chief Investment Officer of Legacy Trust Company, N.A. since 1992; Chairman of the investment committee for W.H. Donner Foundation and Donner Canadian Foundation, since June 2005; Trustee of AmeriPrime Advisors Trust from July 2002 to September 2005; Trustee of Access Variable Insurance Trust from April 2003 to August 2005; Trustee of AmeriPrime Funds from 1995 to July 2005; Trustee of CCMI Funds from June 2003 to March 2005. |
Stephen A. Little (Age 61)
Chairman, December 2004 to present; Independent Trustee, December 2002 to present | President and founder of The Rose, Inc., a registered investment advisor, since April 1993; Trustee of AmeriPrime Advisors Trust from November 2002 to September 2005; Trustee of AmeriPrime Funds from December 2002 to July 2005; Trustee of CCMI Funds from June 2003 to March 2005. |
Daniel J. Condon (Age 57)
Independent Trustee, December 2002 to present | President of International Crankshaft Inc., an automotive equipment manufacturing company, since 2004, Vice President and General Manager from 1990 to 2003; Trustee of AmeriPrime Advisors Trust from November 2002 to September 2005; Trustee of The Unified Funds from 1994 to 2002; Trustee of Firstar Select Funds, a REIT mutual fund, from 1997 to 2000; Trustee of AmeriPrime Funds from December 2002 to July 2005; Trustee of CCMI Funds from June 2003 to March 2005. |
Ronald C. Tritschler (Age 55)
Independent Trustee, December 2002 to present | Chief Executive Officer, Director and Legal Counsel of The Webb Companies, a national real estate company, since 2001, Executive Vice President and Director from 1990 to 2000; Director of First State Financial since 1998; Director, Vice President and Legal Counsel of The Traxx Companies, an owner and operator of convenience stores, since 1989; Trustee of AmeriPrime Advisors Trust from November 2002 to September 2005; Trustee of AmeriPrime Funds from December 2002 to July 2005; Trustee of CCMI Funds from June 2003 to March 2005. |
Principal Officers
Name, Address*, (Age), Position with Trust,** Term of Position with Trust | Principal Occupation During Past 5 Years and Other Directorships |
Anthony J. Ghoston (Age 48)
President, July 2004 to present | President of Unified Fund Services, Inc., the Trust’s administrator, since June 2005, Executive Vice President from June 2004 to June 2005, Senior Vice President from April 2003 to June 2004; Senior Vice President and Chief Information Officer of Unified Financial Services, Inc., the parent company of the Trust’s administrator and distributor, from 1997 to November 2004; President of AmeriPrime Advisors Trust from July 2004 to September 2005; President of AmeriPrime Funds from July 2004 to July 2005; President of CCMI Funds from July 2004 to March 2005. |
John C. Swhear (Age 46)
Senior Vice President, May 2007 to present | Vice President of Legal Administration and Compliance for Unified Fund Services, Inc., the Trust’s administrator, since April, 2007; Chief Compliance Officer of Unified Financial Securities, Inc., the Trust’s distributor, since May 2007; Employed in various positions with American United Life Insurance Company from 1983 to April 2007, including: Associate General Counsel, April 2007, Investment Adviser Chief Compliance Officer, June 2004 to April 2007, Assistant Secretary to the Board of Directors, December 2002 to April 2007, Chief Compliance Officer of OneAmerica Funds, Inc., June 2004 to April 2007, Chief Counsel and Secretary, OneAmerica Securities, Inc., December 2002 to April 2007. |
James M. Landis (Age 36)
Interim Chief Financial Officer and Treasurer, March 2007 to present
| Vice President Fund Accounting and Fund Administration for Unified Fund Services, since October, 2006; Director of Fund Accounting and Fund Administration for PFPC July 2006 - October 2006; Manager Fund Accounting for Unified Fund Services November 2004 – July 2006; Manager Fund Accounting for Mellon Financial Corporation November 1998 – November 2004. |
Lynn E. Wood (Age 61)
Chief Compliance Officer, October 2004 to present | Chief Compliance Officer of AmeriPrime Advisors Trust from October 2004 to September 2005; Chief Compliance Officer of AmeriPrime Funds from October 2004 to July 2005; Chief Compliance Officer of CCMI Funds from October 2004 to March 2005; Chief Compliance Officer of Unified Financial Securities, Inc., the Trust’s distributor, from December 2004 to October 2005 and from 1997 to 2000, Chairman from 1997 to December 2004, President from 1997 to 2000; Director of Compliance of Unified Fund Services, Inc., the Trust’s administrator, from October 2003 to September 2004; Chief Compliance Officer of Unified Financial Services, Inc., the parent company of the Trust’s administrator and distributor, from 2000 to 2004. |
Heather Bonds (Age 31)
Secretary, July 2005 to present; Assistant Secretary, September 2004 to June 2005 | Employed by Unified Fund Services, Inc., the Trust’s administrator, since January 2004 and from December 1999 to January 2002; Student at Indiana University School of Law – Indianapolis, J.D. Candidate in December 2007; Assistant Secretary of Dean Family of Funds since August 2004; Regional Administrative Assistant of The Standard Register Company from February 2003 to January 2004; Full time student at Indiana University from January 2002 to June 2002; Secretary of AmeriPrime Advisors Trust from July 2005 to September 2005, Assistant Secretary from September 2004 to June 2005; Assistant Secretary of AmeriPrime Funds from September 2004 to July 2005; Assistant Secretary of CCMI Funds from September 2004 to March 2005. |
* The address for each officer is 2960 North Meridian Street, Suite 300, Indianapolis, IN 46208.
** The Trust currently consists of 37 series.
OTHER INFORMATION
The Fund’s Statement of Additional Information (“SAI”) includes additional information about the trustees and is available without charge, upon request. You may call toll-free at (877) 764-3863 to request a copy of the SAI or to make shareholder inquiries.
PROXY VOTING
A description of the policies and procedures that the Fund use to determine how to vote proxies relating to portfolio securities and information regarding how the Fund voted those proxies during the most recent twelve month period ended June 30 is available without charge upon request by (1) calling the Funds at (877) 764-3863 and (2) from Fund documents filed with the Securities and Exchange Commission (“SEC”) on the SEC’s website at www.sec.gov.
TRUSTEES
Stephen A. Little, Chairman
Gary E. Hippenstiel
Daniel J. Condon
Ronald C. Tritschler
OFFICERS
Anthony J. Ghoston, President
John Swhear, Senior Vice-President
James M. Landis, Interim Chief Financial Officer and Treasurer
Heather A. Bonds, Secretary
Lynn Wood, Chief Compliance Officer
INVESTMENT ADVISOR
Leeb Capital Management, Inc.
500 Fifth Ave, 57th Floor
New York, NY 10110
DISTRIBUTOR
Unified Financial Securities, Inc.
2960 North Meridian Street, Suite 300
Indianapolis, IN 46208
INDEPENDENT REGISTERED PUBLIC ACCOUNTING FIRM
Cohen Fund Audit Services Ltd.
800 Westpoint Parkway, Suite 1100
Westlake, OH 44145
LEGAL COUNSEL
Thompson Coburn LLP
One US Bank Plaza
St. Louis, MO 63101
LEGAL COUNSEL TO THE INDEPENDENT TRUSTEES
Thompson Hine LLP
312 Walnut St., 14th Floor
Cincinnati, OH 45202
CUSTODIAN
Huntington National Bank
41 South Street
Columbus, OH 43125
ADMINISTRATOR, TRANSFER AGENT
AND FUND ACCOUNTANT
Unified Fund Services, Inc.
2960 North Meridian Street, Suite 300
Indianapolis, IN 46208
This report is intended only for the information of shareholders or those who have received the Fund’s prospectus which contains information about the Fund’s management fee and expenses. Please read the prospectus carefully before investing.
Distributed by Unified Financial Securities, Inc.
Member FINRA/SIPC

Annual Report
November 30, 2007
Fund Advisor:
Marco Investment Management, LLC
300 Atlanta Financial Center
3343 Peachtree Road, NE
Atlanta, GA 30326
Toll Free 1-800-440-9341
Management’s Discussion & Analysis
The Marco Targeted Return Fund strives to provide a consistent, positive return to our shareholders during various market conditions. For the year ending November 30, 2007, The Marco Targeted Return Fund gained 6.04% which was ahead of the BXM Index* return of 5.54%. This was also in line with the Lehman Brothers Aggregate Bond Index return of 6.05%, but a bit less than the Fund’s benchmark, the S&P 500 Index’s return of 7.71% for the same time period.
By writing in-the-money call options against the equity positions owned in the Fund, we are able to greatly reduce the daily volatility while earning an income stream from the premiums the Fund receives from selling the calls. Even though the stock market was very volatile over the last year, it made little progress for investors. As such, our strategy served our investors well as we were able to deliver an income stream with much less risk than the overall equity market.
Many of our shareholders utilize the Fund as a surrogate for their fixed income investments. Particularly with interest rates at very low levels, using call options to generate income is a very attractive way to create an income stream. In terms of performance, this has been an excellent strategy, as the Fund has outperformed the Lehman Aggregate Bond Index since the Fund’s inception.
We have been cautious on the equity markets since July, when the Dow Jones Industrial Average approached 14,200, and have kept our options relatively deep in the money to protect the assets of the Fund. With energy prices continuing to reach new highs and credit concerns filtering throughout the markets, we remain concerned that consumer spending is likely to slow down.
Currently the stock market is fixated on the possibility of a 2008 recession. It is true that economic growth is showing signs of slowing and could be flat to down for a quarter or two; however, we believe that we will see a gradual pick-up in economic activity over the course of the year, and that for the full year economic growth will be respectable. Housing remains a negative, but eventually the inventory glut will be worked off. Exports continue as a bright spot and global growth, especially in developing countries, should provide ongoing opportunities for many U.S. companies.
We continue to choose a basket of large capitalization stocks for purchase in the Fund and write options against each of these individual holdings with the expectation that the position will get called away at expiration. The Fund remains broadly diversified with representation in each major sector of the S&P 500. Some examples of these stocks include Goldman Sachs in the Financial sector and Caterpillar Inc. in the Industrials sector. We have also focused on some higher yielding stocks such as Pfizer and Duke Energy.
Overall, we remain optimistic for 2008 and believe we will be able to meet out investment objectives by managing a well diversified, hedged equity portfolio.
* Chicago Board Options Exchange S&P 500 Buy/Write Index
Investment Results (Unaudited)

The performance quoted represents past performance, which does not guarantee future results. The investment return and principal value of an investment will fluctuate so that an investor’s shares, when redeemed, may be worth more or less than their original cost. The returns shown do not reflect deduction of taxes that a shareholder would pay on Fund distributions or the redemption of Fund shares. Current performance of the Fund may be lower or higher than the performance quoted. The Fund’s investment objectives, risks, charges and expenses must be considered carefully before investing. Performance data current to the most recent month end may be obtained by calling 1-800-440-9341.
* Return figures reflect any change in price per share and assume the reinvestment of all distributions.
** The Indices are unmanaged benchmarks that assume reinvestment of all distributions and exclude the effect of taxes and fees. The S&P 500 Index and Lehman Brothers Aggregate Bond Index are widely recognized unmanaged indices of equity and fixed income prices and are representative of a broader market and range of securities than are found in the Fund’s portfolio. Individuals cannot invest directly in these Indices, however, an individual can invest in exchange traded funds or other investment vehicles that attempt to track the performance of a benchmark index.
*** The CBOE BXM Index is an unmanaged index based on writing covered call options on the S&P 500 Index, and is representative of a broader market and range of securities than are found in the Fund’s portfolio.
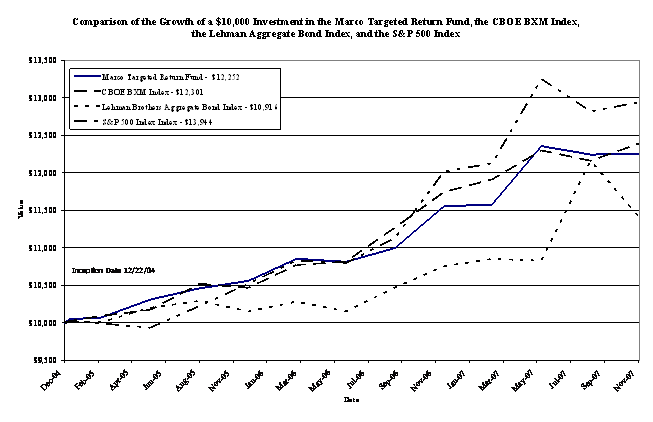
The chart above assumes an initial investment of $10,000 made on December 22, 2004 (commencement of Fund operations) and held through November 30, 2007. The S&P 500 Index and Lehman Brothers Aggregate Bond Index are widely recognized unmanaged indices of equity and fixed income prices and are representative of a broader market and range of securities than are found in the Fund’s portfolio. The CBOE BXM Index is an unmanaged index based on writing covered call options on the S&P 500 Index, and is representative of a broader market and range of securities than are found in the Fund’s portfolio. Individuals cannot invest directly in the indices; however, an individual can invest in ETF’s or other investment vehicles that attempt to track the performance of a benchmark indices. THE FUND’S RETURN REPRESENTS PAST PERFORMANCE AND DOES NOT GUARANTEE FUTURE RESULTS. The returns shown do not reflect deduction of taxes that a shareholder would pay on Fund distributions or the redemption of Fund shares. Investment returns and principal values will fluctuate so that your shares, when redeemed, may be worth more or less than their original purchase price.
Current performance may be lower or higher than the performance data quoted. For more information on the Marco Targeted Return Fund, and to obtain performance data current to the most recent month end, please call 1-800-440-9341. Investing in the Fund involves certain risks that are discussed in the Fund’s prospectus. Please read the prospectus carefully before you invest or send money.
The Fund is distributed by Unified Financial Securities, Inc., member FINRA.
FUND HOLDINGS – (Unaudited)
Marco Targeted Return Fund Portfolio Analysis as of November 30, 20071

1As a percent of net assets.
2US Companies with market caps exceeding $3 billion. |
3US Companies with market caps less than $3 billion. |
The Fund invests primarily in equity securities of large-capitalization U.S. companies (generally those with market capitalizations exceeding $3 billion). The Fund typically sells covered call options on equity securities held in the Fund's portfolio in an attempt to target a consistent rate of return.
Availability of Portfolio Schedule – (Unaudited)
The Fund files its complete schedule of portfolio holdings with the Securities and Exchange Commission (“SEC”) for the first and third quarters of each fiscal year on Form N-Q. The Fund’s Forms N-Q are available at the SEC’s website at www.sec.gov. The Fund’s Forms N-Q may be reviewed and copied at the Public Reference Room in Washington DC. Information on the operation of the Public Reference Room may be obtained by calling 1-800-SEC-0330.
Summary of Fund’s Expenses – (Unaudited)
As a shareholder of the Fund, you incur two types of costs: (1) transaction costs, such as redemption fees; and (2) ongoing costs, including management fees and other Fund expenses. This example is intended to help you understand your ongoing costs (in dollars) of investing in the Fund and to compare these costs with the ongoing costs of investing in other mutual funds. The example is based on an investment of $1,000 invested at the beginning of the period June 1, 2007 and held for the entire period through November 30, 2007.
Actual Expenses
The first line of the table below provides information about actual account values and actual expenses. You may use the information in this line, together with the amount you invested, to estimate the expenses that you paid over the period. Simply divide your account value by $1,000 (for example, an $8,600 account value divided by $1,000 = 8.60), then multiply the result by the number in the first line under the heading entitled “Expenses Paid During Period” to estimate the expenses you paid on your account during this period.
Hypothetical Example for Comparison Purposes
The second line of the table below provides information about hypothetical account values and hypothetical expenses based on the Fund’s actual expense ratio and an assumed rate of return of 5% per year before expenses, which is not the Fund’s actual return. The hypothetical account values and expenses may not be used to estimate the actual ending account balance or expenses you paid for the period. You may use this information to compare the ongoing costs of investing in the Fund and other funds. To do so, compare this 5% hypothetical example with the 5% hypothetical examples that appear in the shareholder reports of the other funds.
Please note that the expenses shown in the table are meant to highlight your ongoing costs only and do not reflect any transactional costs, such as sales charges (loads), redemption fees, or exchange fees. Therefore, the second line of the table is useful in comparing ongoing costs only, and will not help you determine the relative total costs of owning different funds. In addition, if these transactional costs were included, your costs would have been higher.
Marco Targeted Return Fund | Beginning Account Value June 1, 2007 | Ending Account Value November 30, 2007 | Expenses Paid during the Period June 1, 2007 – November 30, 2007* |
Actual
| $1,000.00 | $993.33 | $7.49 |
Hypothetical
| $1,000.00 | $1,017.56 | $7.58 |
*Expenses are equal to the Fund’s annualized expense ratio of 1.50%, multiplied by the average account value over the period, multiplied by 183/365 (to reflect the partial year period).
Marco Targeted Return Fund |
|
|
|
|
|
|
|
Schedule of Investments |
|
|
|
|
|
|
|
November 30, 2007 |
|
|
|
|
|
|
|
|
|
|
|
|
|
|
|
Common Stocks - 98.42% |
|
|
|
| Shares |
| Value |
|
|
|
|
|
|
|
|
Beverages - 3.70% |
|
|
|
|
|
|
|
Constellation Brands, Inc. - Class A (a) (b) |
|
|
| 12,000 |
| $ 282,600 | |
|
|
|
|
|
|
|
|
Biological Products, (No Diagnostic Substances) - 2.89% |
|
|
|
| |||
Amgen, Inc. (a) (b) |
|
|
|
| 4,000 |
| 221,000 |
|
|
|
|
|
|
|
|
Computer Communications Equipment - 4.77% |
|
|
|
|
| ||
Cisco Systems, Inc. (a) (b) |
|
|
|
| 13,000 |
| 364,260 |
|
|
|
|
|
|
|
|
Construction Machinery & Equipment - 3.77% |
|
|
|
|
| ||
Caterpillar, Inc. (b) |
|
|
|
| 4,000 |
| 287,600 |
|
|
|
|
|
|
|
|
Electric & Other Services Combined - 3.63% |
|
|
|
|
| ||
Duke Energy Corp. (b) |
|
|
|
| 14,000 |
| 277,060 |
|
|
|
|
|
|
|
|
Electromedical & Electrotherapeutic Apparatus - 3.99% |
|
|
|
|
| ||
Medtronic, Inc. (b) |
|
|
|
| 6,000 |
| 305,100 |
|
|
|
|
|
|
|
|
Electronic Computers - 3.21% |
|
|
|
|
|
|
|
Dell, Inc. (a) |
|
|
|
| 10,000 |
| 245,400 |
|
|
|
|
|
|
|
|
Finance Services - 3.86% |
|
|
|
|
|
|
|
American Express Co. (b) |
|
|
|
| 5,000 |
| 294,900 |
|
|
|
|
|
|
|
|
Fire, Marine & Casualty Insurance - 3.43% |
|
|
|
|
|
| |
American International Group, Inc. |
|
|
| 4,500 |
| 261,585 | |
|
|
|
|
|
|
|
|
General Industrial Machinery & Equipment - 4.04% |
|
|
|
|
| ||
Zebra Technologies Corp. - Class A (a) (b) |
|
|
| 8,000 |
| 308,560 | |
|
|
|
|
|
|
|
|
Motorcycles, Bicycles & Parts - 3.77% |
|
|
|
|
|
| |
Harley-Davidson, Inc. (b) |
|
|
|
| 6,000 |
| 288,120 |
|
|
|
|
|
|
|
|
National Commercial Banks - 12.89% |
|
|
|
|
|
| |
JPMorgan Chase & Co. (b) |
|
|
|
| 6,000 |
| 273,720 |
SunTrust Banks, Inc. (b) |
|
|
|
| 4,000 |
| 280,440 |
Wachovia Corp. (b) |
|
|
|
| 10,000 |
| 430,000 |
|
|
|
|
|
|
| 984,160 |
|
|
|
|
|
|
|
|
Pharmaceutical Preparations - 3.11% |
|
|
|
|
|
| |
Pfizer, Inc. (b) |
|
|
|
| 10,000 |
| 237,600 |
|
|
|
|
|
|
|
|
Radio & TV Broadcasting & Communications Equipment - 3.20% |
|
|
|
| |||
QUALCOMM, Inc. (b) |
|
|
|
| 6,000 |
| 244,680 |
|
|
|
|
|
|
|
|
Retail - Eating Places - 2.63% |
|
|
|
|
|
|
|
CBRL Group, Inc. (b) |
|
|
|
| 6,000 |
| 200,760 |
|
|
|
|
|
|
|
|
Retail - Lumber & Other Building Materials Dealers - 3.52% |
|
|
|
| |||
Lowe's Companies, Inc. (b) |
|
|
|
| 11,000 |
| 268,510 |
|
|
|
|
|
|
|
|
Retail - Retail Stores - 2.55% |
|
|
|
|
|
|
|
IAC / InterActiveCorp (a) (b) |
|
|
|
| 7,000 |
| 194,810 |
|
|
|
|
|
|
|
|
Retail - Variety Stores - 3.14% |
|
|
|
|
|
| |
Wal-Mart Stores, Inc. (b) |
|
|
|
| 5,000 |
| 239,500 |
|
|
|
|
|
|
|
|
Security Brokers, Dealers & Flotation Companies - 5.93% |
|
|
|
| |||
The Goldman Sachs Group, Inc. (b) |
|
|
| 2,000 |
| 453,280 | |
|
|
|
|
|
|
|
|
*See accompanying notes which are an integral part of these financial statements.
Marco Targeted Return Fund |
|
|
|
|
|
| |
Schedule of Investments - continued |
|
|
|
|
| ||
November 30, 2007 |
|
|
|
|
|
|
|
|
|
|
|
|
|
|
|
Common Stocks - 98.42% - continued |
|
| Shares |
| Value | ||
|
|
|
|
|
|
|
|
Semiconductors & Related Devices - 4.44% |
|
|
|
|
| ||
Intel Corp. (b) |
|
|
|
| 13,000 |
| $ 339,040 |
|
|
|
|
|
|
|
|
Services - Commercial Physical & Biological Research - 2.44% |
|
|
|
| |||
Crucell NV (a) (b) (c) |
|
|
|
| 10,000 |
| 186,400 |
|
|
|
|
|
|
|
|
Services - Computer Processing & Data Preparation - 2.75% |
|
|
|
| |||
Affiliated Computer Services, Inc. - Class A (a) (b) |
|
| 5,000 |
| 209,800 | ||
|
|
|
|
|
|
|
|
Services - Miscellaneous Amusement & Recreation - 4.34% |
|
|
|
| |||
The Walt Disney Co. (b) |
|
|
|
| 10,000 |
| 331,500 |
|
|
|
|
|
|
|
|
Services - Prepackaged Software - 2.56% |
|
|
|
|
|
| |
Symantec Corp. (a) (b) |
|
|
|
| 11,000 |
| 195,800 |
|
|
|
|
|
|
|
|
Trucking & Courier Services (No Air) - 3.86% |
|
|
|
|
| ||
United Parcel Service, Inc. - Class B (b) |
|
|
| 4,000 |
| 294,720 | |
|
|
|
|
|
|
|
|
TOTAL COMMON STOCKS (Cost $7,811,547) |
|
|
|
| 7,516,745 | ||
|
|
|
|
|
|
|
|
Money Market Securities - 5.60% |
|
|
|
|
|
| |
Fidelity Institutional Money Market Portfolio - Class I - 4.96% (d) |
| 427,549 |
| 427,549 | |||
|
|
|
|
|
|
|
|
TOTAL MONEY MARKET SECURITIES (Cost $427,549) |
|
|
| 427,549 | |||
|
|
|
|
|
|
|
|
TOTAL INVESTMENTS (Cost $8,239,096) - 104.02% |
|
|
|
| $ 7,944,294 | ||
|
|
|
|
|
|
|
|
Liabilities in excess of other assets - (4.02)% |
|
|
|
| (307,031) | ||
|
|
|
|
|
|
|
|
TOTAL NET ASSETS - 100.00% |
|
|
|
|
| $ 7,637,263 | |
|
|
|
|
|
|
|
|
(a) Non-income producing. |
(b) Portion of the security is pledged as collateral for call options written. |
(c) American Depositary Receipt. |
(d) Variable rate security; the money market rate shown represents the rate at November 30, 2007. |
*See accompanying notes which are an integral part of these financial statements.
Marco Targeted Return Fund |
|
|
|
|
|
|
|
|
|
|
Schedule of Investments - continued |
|
|
|
|
|
|
|
|
| |
November 30, 2007 |
|
|
|
|
|
|
|
|
|
|
|
|
|
|
|
|
| Shares Subject |
|
|
|
Call Options Written / Expiration Date @ Exercise Price |
|
|
|
| to Call |
|
| Value | ||
|
|
|
|
|
|
|
|
|
|
|
Affiliated Computer Services, Inc. - Class A / January 2008 @ $55.00 |
|
| 5,000 |
|
| $ 750 | ||||
American Express Co. / December 2007 @ $60.00 |
|
|
|
| 5,000 |
|
| 6,750 | ||
Amgen, Inc. / April 2008 @ $65.00 |
|
|
|
|
| 4,000 |
|
| 3,800 | |
Caterpillar, Inc. / February 2008 @ $72.50 |
|
|
|
|
| 4,000 |
|
| 14,800 | |
CBRL Group, Inc. / December 2007 @ $40.00 |
|
|
|
| 6,000 |
|
| 300 | ||
Cisco Systems, Inc. / January 2008 @ $32.50 |
|
|
|
| 13,000 |
|
| 2,860 | ||
Constellation Brands, Inc. - Class A / December 2007 @ $25.00 |
|
|
| 12,000 |
|
| 1,800 | |||
Crucell NV / December 2007 @ $22.50 |
|
|
|
|
| 10,000 |
|
| 1,000 | |
Duke Energy Corp. / January 2008 @ $20.00 |
|
|
|
| 14,000 |
|
| 7,000 | ||
The Goldman Sachs Group, Inc. / April 2008 @ $210.00 |
|
|
|
| 2,000 |
|
| 72,000 | ||
Harley-Davidson, Inc. / January 2008 @ $50.00 |
|
|
|
| 6,000 |
|
| 9,000 | ||
IAC / InterActiveCorp / December 2007 @ $30.00 |
|
|
|
| 7,000 |
|
| 1,750 | ||
Intel Corp. / January 2008 @ $25.00 |
|
|
|
|
| 13,000 |
|
| 24,180 | |
JPMorgan Chase & Co. / December 2007 @ $45.00 |
|
|
|
| 6,000 |
|
| 11,700 | ||
Lowe's Companies, Inc. / January 2008 @ $25.00 |
|
|
|
| 11,000 |
|
| 12,100 | ||
Medtronic, Inc. / February 2008 @ $55.00 |
|
|
|
|
| 6,000 |
|
| 4,800 | |
Pfizer, Inc. / January 2008 @ $25.00 |
|
|
|
|
| 10,000 |
|
| 4,000 | |
QUALCOMM, Inc. / January 2008 @ $42.50 |
|
|
|
| 6,000 |
|
| 7,020 | ||
SunTrust Banks, Inc. / December 2007 @ $75.00 |
|
|
|
| 4,000 |
|
| 3,600 | ||
Symantec Corp. / January 2008 @ $20.00 |
|
|
|
|
| 11,000 |
|
| 2,200 | |
United Parcel Service, Inc. - Class B / January 2008 @ $75.00 |
|
|
| 4,000 |
|
| 5,400 | |||
Wachovia Corp. / December 2007 @ $37.50 |
|
|
|
| 10,000 |
|
| 58,100 | ||
Wal-Mart Stores, Inc. / December 2007 @ $45.00 |
|
|
|
| 5,000 |
|
| 15,000 | ||
The Walt Disney Co. / December 2007 @ $35.00 |
|
|
|
| 10,000 |
|
| 1,100 | ||
Zebra Technologies Corp. - Class A / February 2008 @ $35.00 |
|
|
| 8,000 |
|
| 38,400 | |||
|
|
|
|
|
|
|
|
|
|
|
Total (Premiums received $382,319) |
|
|
|
|
| 192,000 |
|
| $ 309,410 | |
|
|
|
|
|
|
|
|
|
|
|
*See accompanying notes which are an integral part of these financial statements.
Marco Targeted Return Fund |
|
|
|
| |
Statement of Assets and Liabilities |
|
|
|
| |
November 30, 2007 |
|
|
|
| |
|
|
|
|
| |
|
|
|
|
| |
|
|
|
|
| |
Assets |
|
|
|
| |
Investments in securities: |
|
|
|
| |
At cost |
|
| $ 8,239,096 |
| |
At market value |
|
| $ 7,944,294 |
| |
|
|
|
|
| |
Receivable for fund shares sold |
|
| 5,000 |
| |
Receivable due from advisor (a) |
|
| 3,001 |
| |
Prepaid expense |
|
| 8,987 |
| |
Dividends receivable |
|
| 18,442 |
| |
Interest receivable |
|
| 2,208 |
| |
Total assets |
|
| 7,981,932 |
| |
|
|
|
|
| |
Liabilities |
|
|
|
| |
Covered call options written, at value (premiums received $382,319) |
|
| 309,410 |
| |
Payable to custodian |
|
| 1,939 |
| |
Accrued trustee & officer expenses |
|
| 2,026 |
| |
Payable to administrator, fund accountant, and transfer agent |
|
| 12,165 |
| |
Other accrued expenses |
|
| 19,129 |
| |
Total liabilities |
|
| 344,669 |
| |
|
|
|
|
| |
Net Assets |
|
| $ 7,637,263 |
| |
|
|
|
|
| |
Net Assets consist of: |
|
|
|
| |
Paid in capital |
|
| $ 7,230,909 |
| |
Accumulated undistributed net investment income |
|
| 19,503 |
| |
Accumulated net realized gain on investments |
|
| 608,744 |
| |
Net unrealized appreciation (depreciation) on: |
|
|
|
| |
Investment securities |
|
| (294,802) |
| |
Call options written |
|
| 72,909 |
| |
|
|
|
|
| |
Net Assets |
|
| $ 7,637,263 |
| |
|
|
|
|
| |
Shares outstanding (unlimited number of shares authorized) |
|
| 705,578 |
| |
|
|
|
|
| |
|
|
|
|
| |
Net Asset Value and Offering price per share |
|
| $ 10.82 |
| |
|
|
|
|
| |
Redemption price per share ($10.82 * 0.99) (b) |
|
| $ 10.71 |
| |
|
|
|
|
| |
(a) See Note 3 in the Notes to the Financial Statements.
(b) The Fund charges a 1.00% redemption fee on shares redeemed within 30 calendar days of purchase.
*See accompanying notes which are an integral part of these financial statements.
Marco Targeted Return Fund |
|
|
|
|
|
| ||
Statement of Operations |
|
|
|
|
|
| ||
For the fiscal year ended November 30, 2007 |
|
|
|
|
| |||
|
|
|
|
|
|
|
|
|
|
|
|
|
|
|
|
|
|
|
|
|
|
|
|
|
|
|
Investment Income |
|
|
|
|
|
|
| |
Dividend income |
|
|
|
|
|
| $ 100,860 | |
Interest income |
|
|
|
|
|
| 34,595 | |
Total Income |
|
|
|
|
|
| 135,455 | |
|
|
|
|
|
|
|
|
|
Expenses |
|
|
|
|
|
|
|
|
Investment advisor fees (a) |
|
|
|
|
| 77,313 | ||
Administration expenses |
|
|
|
|
| 31,500 | ||
Transfer agent expenses |
|
|
|
|
| 20,543 | ||
Fund accounting expenses |
|
|
|
|
| 17,952 | ||
Registration expenses |
|
|
|
|
|
| 15,335 | |
Auditing expenses |
|
|
|
|
|
| 14,850 | |
Legal expenses |
|
|
|
|
|
| 13,495 | |
Custodian expenses |
|
|
|
|
|
| 8,089 | |
CCO expenses |
|
|
|
|
|
| 5,080 | |
Trustee expenses |
|
|
|
|
|
| 4,646 | |
Pricing expenses |
|
|
|
|
|
| 4,311 | |
Printing expenses |
|
|
|
|
|
| 4,282 | |
Insurance expenses |
|
|
|
|
|
| 1,272 | |
Miscellaneous expenses |
|
|
|
|
| 797 | ||
Total Expenses |
|
|
|
|
|
| 219,465 | |
Fees waived and expenses reimbursed by advisor (a) |
|
|
| (103,543) | ||||
Net operating expenses |
|
|
|
|
|
| 115,922 | |
Net Investment Income |
|
|
|
|
|
| 19,533 | |
|
|
|
|
|
|
|
|
|
|
|
|
|
|
|
|
|
|
Realized & Unrealized Gain (Loss) on Investments |
|
|
|
| ||||
Net realized gain/loss on: |
|
|
|
|
|
| ||
Investment securities |
|
|
|
|
| (81,625) | ||
Call options written |
|
|
|
|
|
| 724,476 | |
Change in unrealized appreciation (depreciation) on: |
|
|
|
| ||||
Investment securities |
|
|
|
|
| (328,380) | ||
Call options written |
|
|
|
|
|
| 103,713 | |
Net realized and unrealized gain on investment securities and call options written |
| 418,184 | ||||||
Net increase in net assets resulting from operations |
|
|
| $ 437,717 | ||||
|
|
|
|
|
|
|
|
|
|
|
|
|
|
|
|
|
|
(a) See Note 3 in the Notes to the Financial Statements. |
|
|
|
| ||||
*See accompanying notes which are an integral part of these financial statements.
Marco Targeted Return Fund |
|
|
|
|
|
|
| ||
Statements of Changes In Net Assets |
|
|
|
|
|
| |||
|
|
|
|
|
|
|
|
|
|
|
|
|
|
|
|
|
|
|
|
|
|
|
|
|
|
| Year ended |
| Year ended |
|
|
|
|
|
|
| November 30, 2007 |
| November 30, 2006 |
Operations |
|
|
|
|
|
| |||
Net investment income (loss) |
|
|
|
| $ 19,533 |
| $ (15,155) | ||
Net realized gain on investment security and call |
|
|
|
|
| ||||
option transactions |
|
|
|
| 642,851 |
| 763,487 | ||
Change in unrealized appreciation (depreciation) on |
|
|
|
|
| ||||
investment securities and call options written |
|
| (224,667) |
| (14,702) | ||||
Net increase in net assets resulting from operations |
|
| 437,717 |
| 733,630 | ||||
|
|
|
|
|
|
|
|
|
|
Distributions |
|
|
|
|
|
|
|
| |
From net investment income |
|
|
|
| (30) |
| (4,420) | ||
From net realized gain |
|
|
|
|
| (767,364) |
| (219,919) | |
Total distributions |
|
|
|
|
| (767,394) |
| (224,339) | |
|
|
|
|
|
|
|
|
|
|
Capital Share Transactions |
|
|
|
|
|
|
| ||
Proceeds from shares sold |
|
|
|
| 852,988 |
| 3,657,711 | ||
Reinvestment of distributions |
|
|
|
| 756,712 |
| 224,339 | ||
Amount paid for shares repurchased |
|
|
| (2,052,505) |
| (3,803,686) | |||
Net increase (decrease) in net assets resulting |
|
|
|
|
|
| |||
from share transactions |
|
|
|
| (442,805) |
| 78,364 | ||
|
|
|
|
|
|
|
|
|
|
Total Increase (Decrease) in Net Assets |
|
|
| (772,482) |
| 587,655 | |||
|
|
|
|
|
|
|
|
|
|
Net Assets |
|
|
|
|
|
|
|
|
|
Beginning of year |
|
|
|
|
| 8,409,745 |
| 7,822,090 | |
|
|
|
|
|
|
|
|
|
|
End of year |
|
|
|
|
| $ 7,637,263 |
| $ 8,409,745 | |
|
|
|
|
|
|
|
|
|
|
Accumulated undistributed net investment income included |
|
|
|
| |||||
in net assets |
|
|
|
|
| $ 19,503 |
| $ - | |
|
|
|
|
|
|
|
|
|
|
Capital Share Transactions |
|
|
|
|
|
|
| ||
Shares sold |
|
|
|
|
| 78,147 |
| 348,975 | |
Shares issued in reinvestment of distributions |
|
|
| 74,012 |
| 21,570 | |||
Shares repurchased |
|
|
|
|
| (195,603) |
| (361,957) | |
|
|
|
|
|
|
|
|
|
|
Net increase (decrease) from capital share transactions |
|
| (43,444) |
| 8,588 | ||||
*See accompanying notes which are an integral part of these financial statements.
Marco Targeted Return Fund |
|
|
|
|
|
|
|
| ||
Financial Highlights |
|
|
|
|
|
|
|
|
| |
(For a share held during the period) |
|
|
|
|
|
|
| |||
|
|
|
|
| Year ended |
| Year ended |
| Period ended |
|
|
|
|
|
| November |
| November |
| November |
|
|
|
|
|
| 30, 2007 |
| 30, 2006 |
| 30, 2005 | (a) |
|
|
|
|
|
|
|
|
|
|
|
Selected Per Share Data |
|
|
|
|
|
|
|
| ||
Net asset value, beginning of period |
| $ 11.23 |
| $ 10.56 |
| $ 10.00 |
| |||
|
|
|
|
|
|
|
|
|
|
|
Income from investment operations |
|
|
|
|
|
|
| |||
Net investment income (loss) |
|
| 0.03 |
| (0.01) |
| 0.01 |
| ||
Net realized and unrealized gain |
|
| 0.59 |
| 0.98 |
| 0.55 |
| ||
Total from investment operations |
|
| 0.62 |
| 0.97 |
| 0.56 |
| ||
|
|
|
|
|
|
|
|
|
|
|
Less Distributions to Shareholders: |
|
|
|
|
|
|
|
| ||
From net investment income |
|
| - | (b) | (0.01) |
| - |
| ||
From net realized gain |
|
|
| (1.03) |
| (0.29) |
| - |
| |
Total distributions |
|
|
| (1.03) |
| (0.30) |
| - |
| |
|
|
|
|
|
|
|
|
|
|
|
Net asset value, end of period |
|
| $ 10.82 |
| $ 11.23 |
| $ 10.56 |
| ||
|
|
|
|
|
|
|
|
|
|
|
Total Return (c) |
|
|
| 6.04% | (d) | 9.42% |
| 5.60% | (d) | |
|
|
|
|
|
|
|
|
|
|
|
Ratios and Supplemental Data |
|
|
|
|
|
|
|
| ||
Net assets, end of period (000) |
|
| $ 7,637 |
| $ 8,410 |
| $ 7,822 |
| ||
Ratio of expenses to average net assets |
| 1.50% |
| 1.50% |
| 1.50% | (e) | |||
Ratio of expenses to average net assets |
|
|
|
|
|
|
| |||
before waiver & reimbursement |
|
| 2.84% |
| 2.92% |
| 5.07% | (e) | ||
Ratio of net investment income (loss) to |
|
|
|
|
|
|
| |||
average net assets |
|
|
| 0.25% |
| (0.20)% |
| 0.13% | (e) | |
Ratio of net investment income (loss) to |
|
|
|
|
|
|
| |||
average net assets before waiver & reimbursement | (1.09)% |
| (1.62)% |
| (3.45)% | (e) | ||||
Portfolio turnover rate |
|
|
| 133.02% |
| 203.84% |
| 281.74% |
| |
|
|
|
|
|
|
|
|
|
|
|
|
|
|
|
|
|
|
|
|
|
|
(a) For the period December 22, 2004 (commencement of operations) to November 30, 2005.
(b) Income distribution amounted to less than $ 0.005 per share.
(c) Total return in the above table represents the rate the investor would have earned or lost on an investment in the Fund, assuming reinvestment of dividends.
(d) Not annualized
(e) Annualized.
*See accompanying notes which are an integral part of these financial statements.
Marco Targeted Return Fund
Notes to the Financial Statements
November 30, 2007
NOTE 1. ORGANIZATION |
Marco Targeted Return Fund (the “Fund”) was organized as a diversified series of Unified Series Trust (the “Trust”) on December 13, 2004. The Trust is an open-end investment company established under the laws of Ohio by an Agreement and Declaration of Trust dated October 17, 2002 (the “Trust Agreement”). The Trust Agreement permits the Board of Trustees (the “Board”) to issue an unlimited number of shares of beneficial interest of separate series. The Fund is one of a series of funds currently authorized by the Board. The Fund commenced operations on December 22, 2004. The Fund investment objective is total return. The investment advisor to the Fund is Marco Investment Management, LLC (the “Advisor”).
NOTE 2. SIGNIFICANT ACCOUNTING POLICIES
The following is a summary of significant accounting policies followed by the Fund in the preparation of its financial statements.
Securities Valuation - Equity securities are valued by using market quotations, but may be valued on the basis of prices furnished by a pricing service when the Advisor believes such prices more accurately reflect the fair market value of such securities. Securities that are traded on any stock exchange are generally valued by the pricing service at the last quoted sale price. Lacking a last sale price, an exchange traded security is generally valued by the pricing service at its last bid price. Securities traded in the NASDAQ over-the-counter market are generally valued by the pricing service at the NASDAQ Official Closing Price. Options traded on major exchanges are valued at the last quoted sales price on their primary exchange or, if there is no sale on the applicable exchange on such day, then the last quoted bid price as of the close of such exchange will be used. When market quotations are not readily available, when the Advisor determines that the market quotation or the price provided by the pricing service does not accurately reflect the current market value or when restricted or illiquid securities are being valued, such securities are valued as determined in good faith by the Advisor, in conformity with guidelines adopted by and subject to review of the Board.
Fixed income securities are valued by using market quotations, but may be valued on the basis of prices furnished by a pricing service when the Advisor believes such prices accurately reflect the fair market value of such securities. A pricing service utilizes electronic data processing techniques based on yield spreads relating to securities with similar characteristics to determine prices for normal institutional-size trading units of debt securities without regard to sale or bid prices. If the Advisor decides that a price provided by the pricing service does not accurately reflect the fair market value of the securities, when prices are not readily available from a pricing service, or when restricted or illiquid securities are being valued, securities are valued at fair value as determined in good faith by the Advisor, subject to review of the Board. Short term investments in fixed income securities with maturities of less than 60 days when acquired, or which subsequently are within 60 days of maturity, are valued by using the amortized cost method of valuation, which the Board has determined will represent fair value. The ability of issuers of debt securities held by the Fund to meet their obligations may be affected by economic and political developments in a specific country or region.
In accordance with the Trust’s good faith pricing guidelines, the Advisor is required to consider all appropriate factors relevant to the value of securities for which it has determined other pricing sources are not available or reliable as described above. No single standard exists for determining fair value controls, since fair value depends upon the circumstances of each individual case. As a general principle, the current fair value of an issue of securities being valued by the Advisor would appear to be the amount which the owner might reasonably expect to receive for them upon their current sale. Methods which are in accord with this principle may, for example, be based on (i) a multiple of earnings; (ii) a discount from market of a similar freely traded security (including a derivative security or a basket of securities traded on other markets, exchanges or among dealers); or (iii) yield to maturity with respect to debt issues, or a combination of these and other methods.
Marco Targeted Return Fund
Notes to the Financial Statements
November 30, 2007 - continued
NOTE 2. SIGNIFICANT ACCOUNTING POLICIES – continued
Good faith pricing is permitted if, in the Advisor’s opinion, the validity of market quotations appears to be questionable based on factors such as evidence of a thin market in the security based on a small number of quotations, a significant event occurs after the close of a market but before a Fund’s NAV calculation that may affect a security’s value, or the Advisor is aware of any other data that calls into question the reliability of market quotations. Good faith pricing may also be used if the options the Fund has written cease to have market quotations readily available due to low volume or imminent expiration. Investments in foreign securities, junk bonds or other thinly traded securities are more likely to trigger fair valuation than other securities.
Option writing - When the Fund writes an option, an amount equal to the premium received by the Fund is recorded as a liability and is subsequently adjusted to the current market value of the option written. Premiums received from writing options that expire unexercised are treated by the Fund on the expiration date as realized
gains from investments. The difference between the premium and the amount paid on effecting a closing purchase transaction, including brokerage commissions, is also treated as a realized gain, or if the premium is less than the amount paid for the closing purchase transaction, as a realized loss. If a call option is exercised, the premium is added to the proceeds from the sale of the underlying security or currency in determining whether the Fund has realized a gain or loss. The Fund, as writer of an option, bears the market risk of an unfavorable change in the price of the security underlying the written option.
Federal Income Taxes – The Fund makes no provision for federal income tax. The Fund intends to qualify each year as a “regulated investment company” under subchapter M of the Internal Revenue Code of 1986, as amended, by distributing all of its net investment income and net realized capital gains. If the required amount of net investment income is not distributed, the Fund could incur a tax expense.
Security Transactions and Related Income - The Fund follows industry practice and records security transactions on the trade date. The specific identification method is used for determining gains or losses for financial statements and income tax purposes. Dividend income is recorded on the ex-dividend date and interest income is recorded on an accrual basis. Discounts and premiums on securities purchased are amortized or accreted using the effective interest method. Withholding taxes on foreign dividends have been provided for in accordance with the Fund’s understanding of the applicable country’s tax rules and rates.
Expenses – Expenses incurred by the Trust that do not relate to a specific fund of the Trust are allocated to the individual funds based on each fund’s relative net assets or other appropriate basis (as determined by the Board).
Dividends and Distributions – The Fund intends to distribute substantially all of its net investment income as dividends on at least an annual basis.. The Fund intends to distribute its net realized long-term capital gains and its net realized short-term capital gains at least once a year. Distributions to shareholders, which are determined in accordance with income tax regulations, are recorded on the ex-dividend date. The treatment for financial reporting purposes of distributions made to shareholders during the year from net investment income or net realized capital gains may differ from their ultimate treatment for federal income tax purposes. These differences are caused primarily by differences in the timing of the recognition of certain components of income, expenses or realized capital gain for federal income tax purposes. Where such differences are permanent in nature, they are reclassified in the components of the net assets based on their ultimate characterization for federal income tax purposes. Any such reclassifications will have no effect on net assets, results of operations or net asset values per share of each Fund. There were no such reclassifications for the year ended November 30, 2007.
Accounting for Uncertainty in Income Taxes - In June 2006, the Financial Accounting Standards Board (FASB) issued FASB Interpretation No. 48 – Accounting for Uncertainty in Income Taxes that requires the tax effects of certain tax positions to be recognized. These tax positions must meet a “more likely than not” standard that, based on their technical merits, have a more than 50 percent likelihood of being sustained upon examination. FASB Interpretation No. 48 is effective for fiscal periods beginning after December 15, 2006.
Marco Targeted Return Fund
Notes to the Financial Statements
November 30, 2007 - continued
NOTE 2. SIGNIFICANT ACCOUNTING POLICIES – continued
At adoption, the financial statements must be adjusted to reflect only those tax positions that are more likely than not of being sustained. Management of the Fund is currently evaluating the impact that FASB Interpretation No. 48 will have on the Fund’s financial statements.
Fair Value Measurements - In September 2006, FASB issued Statement on Financial Accounting Standards (SFAS) No. 157 “Fair Value Measurements.” This standard establishes a single authoritative definition of fair value, sets out a framework for measuring fair value and requires additional disclosure about fair value measurements. SFAS No. 157 applies to fair value measurements already required or permitted by existing standards. SFAS No. 157 is effective for financial statements issued for fiscal years beginning after November 15, 2007 and interim periods within those fiscal years. The changes to current generally accepted accounting principles from the application of this Statement relate to the definition of fair value, the methods used to measure fair value, and the expanded disclosures about fair value measurements. As of November 30, 2007, the Trust does not believe the adoption of SFAS No. 157 will impact the amounts reported in the financial statements; however, additional disclosures may be required about the inputs used to develop the measurements and the effect of certain measurements reported on the statement of changes in net assets for a fiscal period.
NOTE 3. FEES AND OTHER TRANSACTIONS WITH AFFILIATES
The Advisor, under the terms of the management agreement (the “Agreement”), manages the Fund’s investments subject to approval of the Board of Trustees. As compensation for its management services, the Fund is obligated to pay the Advisor a fee computed and accrued daily and paid monthly at an annual rate of 1.00% of the Fund’s average net assets. For the fiscal year ended November 30, 2007, before the waivers disclosed below, the Advisor earned a fee of $77,313 from the Fund.
The Advisor has contractually agreed to waive its management fee and/or reimburse certain Fund operating expenses so that the total annual Fund operating expenses, excluding brokerage fees and commissions, any 12b-1 fees, taxes, borrowing costs (such as interest and dividend expense on securities sold short), extraordinary expenses, and any indirect expenses (such as expenses incurred by other investment companies in where the Fund may invest) do not exceed 1.50% of the Fund’s average daily net assets. This agreement has been extended through November 30, 2008. For the fiscal year ended November 30, 2007, the Advisor waived fees and reimbursed Fund expenses of $103,543. At November 30, 2007, there was a net receivable due from the Advisor in the amount of $3,001.
Each waiver or reimbursement by the Advisor is subject to repayment by the Fund within the three fiscal years following the fiscal year in which the particular expense was incurred, provided that the Fund is able to make the repayment without exceeding the 1.50% expense limitation. At November 30, 2007, the amounts subject to recoupment are as follows:

The Trust retains Unified Fund Services, Inc. (“Unified”), to manage the Fund’s business affairs and to provide the Fund with administrative services, including all regulatory reporting and necessary office equipment and personnel. For the fiscal year ended November 30, 2007, Unified earned fees of $31,500 for administrative services provided to the Fund. At November 30, 2007, the Fund owed Unified $5,500 for administrative services. Certain officers of the Trust are members of management and/or employees of Unified. Unified operates as a wholly-owned subsidiary of Huntington Bancshares, Inc., the parent company of the Distributor
Marco Targeted Return Fund
Notes to the Financial Statements
November 30, 2007 - continued
NOTE 3. FEES AND OTHER TRANSACTIONS WITH AFFILIATES - continued
and Huntington National Bank, the custodian of the Fund’s investments (the “Custodian”). For the fiscal year ended November 30, 2007, the Custodian earned fees of $8,089 for custody services provided to the Fund. At November 30, 2007, the Fund owed the Custodian $1,939 for custody services.
The Trust retains Unified to act as the Fund’s transfer agent and to provide the Fund with fund accounting services. For the fiscal year ended November 30, 2007, Unified earned fees of $13,529 from the Fund for transfer agent services and $7,014 in reimbursement for out-of-pocket expenses incurred in providing transfer agent services. For the fiscal year ended November 30, 2007, Unified earned fees of $17,952 from the Fund for fund accounting services. As of November 30, 2007, the Fund owed Unified $2,257 for transfer agent services, $1,455 in reimbursement for out-of-pocket expenses and $2,953 for fund accounting services.
Unified Financial Securities, Inc. (the “Distributor”) acts as the principal distributor of the Fund. There were no payments made to the Distributor by the Fund for the fiscal year ended November 30, 2007. The Distributor, Unified and the Custodian are controlled by Huntington Bancshares, Inc.
NOTE 4. INVESTMENTS
For the fiscal year ended November 30, 2007, purchases and sales of investment securities, other than short-term investments and call options written were as follows:

At November 30, 2007, the appreciation (depreciation) of investments for tax purposes, net of premiums received for call options written, was as follows:

At November 30, 2007, the aggregate cost of securities for federal income tax purposes, net of premiums received for call options written, was $7,869,581.
NOTE 5. ESTIMATES
The preparation of financial statements in conformity with accounting principles generally accepted in the United States of America requires management to make estimates and assumptions that affect the reported amounts of assets and liabilities and disclosure of contingent assets and liabilities at the date of the financial statements and the reported amounts of increases and decreases in net assets from operations during the reporting period. Actual results could differ from those estimates.
Marco Targeted Return Fund
Notes to the Financial Statements
November 30, 2007 - continued
NOTE 6. BENEFICIAL OWNERSHIP
The beneficial ownership, either directly or indirectly, of more than 25% of the voting securities of a fund creates a presumption of control of the fund, under Section 2(a)(9) of the Investment Company Act of 1940. As of November 30, 2007, Charles Schwab and Northern Trust Co., for the benefit of others, owned 56.61% and 31.09% of the Fund, respectively, and thus each may be deemed to control the Fund. Steven Marco, owner of the Advisor to the Fund, owns 4.81% of the Fund’s outstanding shares.
NOTE 7. CALL OPTIONS WRITTEN
As of November 30, 2007, portfolio securities valued at $7,009,760 were held by the custodian as collateral for call options written by the Fund. For the fiscal year ended November 30, 2007, transactions in options written were as follows (100 shares of common stock underly each option contract):

NOTE 8. DISTRIBUTIONS TO SHAREHOLDERS
On December 23, 2006, an income distribution of $0.00004 per share and a short term capital gain distribution of $0.999 per share to shareholders of record on December 22, 2006 were made. On November 28, 2007, a short term capital gain distribution of $0.027 per share to shareholders of record on November 27, 2007 was made.
The tax characterization of distributions for the fiscal years ended 2007 and 2006 was as follows:

On December 17, 2007, an income distribution of $0.03 per share and a short term capital gain distribution of $0.78 per share to shareholders of record on December 14, 2007 were made.
Marco Targeted Return Fund
Notes to the Financial Statements
November 30, 2007 - continued
NOTE 8. DISTRIBUTIONS TO SHAREHOLDERS - continued
As of November 30, 2007, the components of distributable earnings (accumulated losses) on a tax basis were as follows:

The difference between book basis and tax basis unrealized appreciation is attributable to the tax deferral of losses on wash sales in the amount of $12,804.
REPORT OF INDEPENDENT REGISTERED PUBLIC ACCOUNTING FIRM
To The Shareholders and Board of Trustees
Marco Targeted Return Fund
(Unified Series Trust)
We have audited the accompanying statement of assets and liabilities, including the schedule of investments, of Marco Targeted Return Fund (the “Fund”), a series of the Unified Series Trust, as of November 30, 2007, and the related statement of operations for the year then ended, the statements of changes in net assets for each of the two years in the period then ended, and financial highlights for each of the three years in the period then ended. These financial statements and financial highlights are the responsibility of Fund management. Our responsibility is to express an opinion on these financial statements and financial highlights based on our audits.
We conducted our audits in accordance with the standards of the Public Company Accounting Oversight Board (United States). Those standards require that we plan and perform the audits to obtain reasonable assurance about whether the financial statements and financial highlights are free of material misstatement. An audit includes examining, on a test basis, evidence supporting the amounts and disclosures in the financial statements. Our procedures included confirmation of securities owned as of November 30, 2007 by correspondence with the Fund’s custodian. An audit also includes assessing the accounting principles used and significant estimates made by management, as well as evaluating the overall financial statement presentation. We believe that our audits provide a reasonable basis for our opinion.
In our opinion, the financial statements and financial highlights referred to above present fairly, in all material respects, the financial position of Marco Targeted Return Fund as of November 30, 2007, the results of its operations for the year then ended, the changes in its net assets for each of the two years in the period then ended, and the financial highlights for each of the three years in the period then ended, in conformity with accounting principles generally accepted in the United States of America.

COHEN FUND AUDIT SERVICES, LTD.
Westlake, Ohio
January 22, 2008
TRUSTEES AND OFFICERS
The Board of Trustees supervises the business activities of the Trust. Each Trustee serves as a trustee until termination of the Trust unless the Trustee dies, resigns, retires or is removed.
The following tables provide information regarding the Trustees and officers.
Independent Trustees
Name, Address*, (Age), Position with Trust**, Term of Position with Trust | Principal Occupation During Past 5 Years and Other Directorships |
Gary E. Hippenstiel (Age 60)
Independent Trustee, December 2002 to present | Director, Vice President and Chief Investment Officer of Legacy Trust Company, N.A. since 1992; Chairman of the investment committee for W.H. Donner Foundation and Donner Canadian Foundation, since June 2005; Trustee of AmeriPrime Advisors Trust from July 2002 to September 2005; Trustee of Access Variable Insurance Trust from April 2003 to August 2005; Trustee of AmeriPrime Funds from 1995 to July 2005; Trustee of CCMI Funds from June 2003 to March 2005. |
Stephen A. Little (Age 61)
Chairman, December 2004 to present; Independent Trustee, December 2002 to present | President and founder of The Rose, Inc., a registered investment advisor, since April 1993; Trustee of AmeriPrime Advisors Trust from November 2002 to September 2005; Trustee of AmeriPrime Funds from December 2002 to July 2005; Trustee of CCMI Funds from June 2003 to March 2005. |
Daniel J. Condon (Age 57)
Independent Trustee, December 2002 to present | President of International Crankshaft Inc., an automotive equipment manufacturing company, since 2004, Vice President and General Manager from 1990 to 2003; Trustee of AmeriPrime Advisors Trust from November 2002 to September 2005; Trustee of The Unified Funds from 1994 to 2002; Trustee of Firstar Select Funds, a REIT mutual fund, from 1997 to 2000; Trustee of AmeriPrime Funds from December 2002 to July 2005; Trustee of CCMI Funds from June 2003 to March 2005. |
Ronald C. Tritschler (Age 55)
Independent Trustee, December 2002 to present | Chief Executive Officer, Director and Legal Counsel of The Webb Companies, a national real estate company, since 2001, Executive Vice President and Director from 1990 to 2000; Director of First State Financial since 1998; Director, Vice President and Legal Counsel of The Traxx Companies, an owner and operator of convenience stores, since 1989; Trustee of AmeriPrime Advisors Trust from November 2002 to September 2005; Trustee of AmeriPrime Funds from December 2002 to July 2005; Trustee of CCMI Funds from June 2003 to March 2005. |
Principal Officers
Name, Address*, (Age), Position with Trust,** Term of Position with Trust | Principal Occupation During Past 5 Years and Other Directorships |
Anthony J. Ghoston (Age 48)
President, July 2004 to present | President of Unified Fund Services, Inc., the Trust’s administrator, since June 2005, Executive Vice President from June 2004 to June 2005, Senior Vice President from April 2003 to June 2004; Senior Vice President and Chief Information Officer of Unified Financial Services, Inc., the parent company of the Trust’s administrator and distributor, from 1997 to November 2004; President of AmeriPrime Advisors Trust from July 2004 to September 2005; President of AmeriPrime Funds from July 2004 to July 2005; President of CCMI Funds from July 2004 to March 2005. |
John C. Swhear (Age 46)
Senior Vice President, May 2007 to present | Vice President of Legal Administration and Compliance for Unified Fund Services, Inc., the Trust’s administrator, since April, 2007; Chief Compliance Officer of Unified Financial Securities, Inc., the Trust’s distributor, since May 2007; Employed in various positions with American United Life Insurance Company from 1983 to April 2007, including: Associate General Counsel, April 2007, Investment Adviser Chief Compliance Officer, June 2004 to April 2007, Assistant Secretary to the Board of Directors, December 2002 to April 2007, Chief Compliance Officer of OneAmerica Funds, Inc., June 2004 to April 2007, Chief Counsel and Secretary, OneAmerica Securities, Inc., December 2002 to April 2007. |
James M. Landis (Age 36)
Interim Chief Financial Officer and Treasurer, March 2007 to present
| Vice President Fund Accounting and Fund Administration for Unified Fund Services, since October, 2006; Director of Fund Accounting and Fund Administration for PFPC July 2006 - October 2006; Manager Fund Accounting for Unified Fund Services November 2004 – July 2006; Manager Fund Accounting for Mellon Financial Corporation November 1998 – November 2004. |
Lynn E. Wood (Age 61)
Chief Compliance Officer, October 2004 to present | Chief Compliance Officer of AmeriPrime Advisors Trust from October 2004 to September 2005; Chief Compliance Officer of AmeriPrime Funds from October 2004 to July 2005; Chief Compliance Officer of CCMI Funds from October 2004 to March 2005; Chief Compliance Officer of Unified Financial Securities, Inc., the Trust’s distributor, from December 2004 to October 2005 and from 1997 to 2000, Chairman from 1997 to December 2004, President from 1997 to 2000; Director of Compliance of Unified Fund Services, Inc., the Trust’s administrator, from October 2003 to September 2004; Chief Compliance Officer of Unified Financial Services, Inc., the parent company of the Trust’s administrator and distributor, from 2000 to 2004. |
Heather Bonds (Age 31)
Secretary, July 2005 to present; Assistant Secretary, September 2004 to June 2005 | Employed by Unified Fund Services, Inc., the Trust’s administrator, since January 2004 and from December 1999 to January 2002; Student at Indiana University School of Law – Indianapolis, J.D. Candidate in December 2007; Assistant Secretary of Dean Family of Funds since August 2004; Regional Administrative Assistant of The Standard Register Company from February 2003 to January 2004; Full time student at Indiana University from January 2002 to June 2002; Secretary of AmeriPrime Advisors Trust from July 2005 to September 2005, Assistant Secretary from September 2004 to June 2005; Assistant Secretary of AmeriPrime Funds from September 2004 to July 2005; Assistant Secretary of CCMI Funds from September 2004 to March 2005. |
* The address for each officer is 2960 North Meridian Street, Suite 300, Indianapolis, IN 46208.
** The Trust currently consists of 37 series.
OTHER INFORMATION
The Fund’s Statement of Additional Information (“SAI”) includes additional information about the trustees and is available without charge, upon request. You may call toll-free at (877) 764-3863 to request a copy of the SAI or to make shareholder inquiries.
RENEWAL OF MANAGEMENT AGREEMENT (Unaudited)
The continuation of the Management Agreement of the Marco Targeted Return Fund (the “Fund”) with Marco Investment Management, LLC (the “Advisor”) was recommended to the Board by the Advisor Contract Renewal Committee (the “Committee”) and approved by the full Board, including a majority of Trustees who are not interested persons of the Trust or interested parties to the Agreement (collectively, the “Independent Trustees” and each an “Independent Trustee”) at an in-person meeting held on November 11, 2007. The Chairman noted that no changes had been proposed to the Fund’s management agreement and the Advisor had agreed to extend its obligation to cap Fund expenses through November 30, 2008. Materials provided to the Committee included: (i) executed copies of the Fund’s management agreement and current expense cap side letter, (ii) a letter from the Administrator to the Advisor setting forth, and the Advisor’s response to, a detailed series of questions regarding, among other things, the Advisor’s services to the Fund, its profitability from managing the Fund and ideas for future growth for the Fund, (iii) a certification from the Advisor that it had adopted a compliance program that is reasonably designed to prevent violations of federal securities laws by the Fund, (iv) a summary of a 2006 SEC staff examination of the Fund or the Advisor, (v) the Advisor’s Form ADV II, (vi) reports provided by the Administrator regarding the Fund’s performance for the past 1- and 3-year periods, as well as its year-to-date performance, and comparisons of the same to the Fund’s benchmark(s) and peer group for the same periods, and (vii) reports provided by the Administrator comparing the Fund’s advisory fee and total expenses (after fee waivers and reimbursements) to the Fund’s peer group as determined by the Administrator. The Committee also interviewed the President of the Advisor, who also acts as a portfolio manager, with respect to these and other issues.
The Committee members reported that they had received and evaluated such information as they deemed necessary to make their recommendation. The Committee also noted that it had taken into account a number of factors that they believed to be relevant, using their own business judgment. They noted that this included information regarding the Advisor that had been provided to the Board throughout the year at regular meetings of the Board, as well as information that was specifically furnished to the Committee in connection with its review of the Fund’s management arrangement.
As to the nature, extent, and quality of the services provided by the Advisor to the Fund, the Committee reviewed the responses from the Advisor as to the resources provided to the Fund, and considered the adequacy of such resources in light of the expected growth in the level of Fund assets, and whether the resources are sufficient to sustain positive performance, compliance and other needs. The Committee determined that the Advisor’s resources appear adequate, and specifically noted that the Advisor provides three portfolio managers to manage the Fund, each of whom appears to have the necessary experience to manage the Fund. It noted that the Advisor also provides the support of various administrative staff, including two traders, and a compliance officer who monitor the Fund’s portfolio on a regular basis.
The Committee noted that the Fund’s portfolio managers also manage other accounts in addition to the Fund. The Committee sought and received assurances from the Advisor’s President that the portfolio managers’ current work load allows sufficient time to devote to Fund matters. The Committee noted that the Advisor was not proposing any changes to the level of services provided to the Fund. The Committee then reviewed various compliance reports provided by the Advisor and the Fund’s Administrator to the Board throughout the year, and noted, based on such reports, that the Fund’s investment policies and restrictions were consistently complied with during the last year. The Committee discussed the comment letter from the SEC staff, dated September 29, 2006, and the Advisor’s response to the SEC staff’s comments. The Advisor presented to the SEC staff that changes had been made to the Advisor’s compliance policies and procedures as a result of the SEC staff examination, and that the Trust’s Chief Compliance Officer had discussed these changes with the Board as part of his annual review of compliance matters. In addition, the Committee noted that, based on the Chief Compliance Officer’s summary, the Board previously had approved the Advisor’s compliance policies and procedures.
The Committee then discussed the Fund’s performance with the Advisor’s President and reviewed other materials provided by the Advisor and the Administrator with respect to such performance. The Committee noted that the Fund had two benchmarks, the S&P 500 Index and the CBOE S&P 500 BuyWrite (BXM) Index, and its peer group as determined by the Administrator was the “Large Value Equity Funds” Morningstar category. The Committee noted that the Fund had outperformed its peer group during the year-to-date period (8.14% versus 6.70%), but that its performance was slightly lower than the S&P 500 Index’s return of 16.44% and its peer group average return of 14.81%, but higher than BXM’s 7.8% return. Overall, the Committee noted that the Fund had good long-term performance and had consistently provided a positive stable return to investors.
The Committee then discussed the Advisor’s fee rates and profitability. The Committee noted that, at 1.00%, the Fund’s management fee was higher than its peer group average 0.70%, but significantly lower than the maximum at 1.51%. The Committee then sought and received assurances from the Advisor’s President that the Advisor will agree to continue capping certain operating expenses of the Fund at 1.50% through December 2008.
The Administrator reported that, after fee waiver and reimbursement, the Fund’s total expense ratio was in line with the average for its peer group (1.64% compared to 1.47%). The Committee noted that the Advisor reported that it does not engage in soft dollar arrangements with respect to the Fund’s brokerage transactions, and that the Fund does not have a Rule 12b-1 plan.
The Committee also noted the President of the Advisor’s statement that he had not provided financial statements because he is the sole owner of his firm and no publicly-available statements were audited. He noted that his firm had met its obligations to cap Fund expenses since its inception, and that the Advisor would continue to cap expenses for the coming fiscal year. The Trustees requested, and the President of the Advisor agreed to provide, his personal guaranty of the Advisor’s obligation to pay Fund expenses. He stated that his firm realized a net loss from managing the Fund during the calendar year 2006 due to the Fund’s small size. The Committee noted that the Advisor was obligated to waive all of its advisory fees from the Fund during its last fiscal year, and also had reimbursed the Fund for approximately $32,000 in expenses.
In determining the reasonableness of the advisory fees, the Committee also considered whether economies of scale will be realized as the Fund grows larger, and the extent to which this is reflected in the advisory fees. The Committee noted that although the Fund’s assets are growing, it did not appear that the Advisor has yet realized any economies of scale from managing the Fund and, so far, has experienced a net loss from managing the Fund.
After reviewing all the foregoing, the Committees determined that the Fund’s advisory fees were reasonable, based on the quality of services provided to the Fund, and then unanimously voted to recommend that the Board approve the continuation of the Fund’s management agreement. Upon such recommendation, the Board, which is comprised solely of trustees who are not “interested” persons (within the meaning of the Investment Company Act of 1940, as amended) of the Trust or Marco Investment Management, LLC, followed the Committee’s recommendation and renewed the management agreement of the Fund.
PROXY VOTING
A description of the policies and procedures that the Fund uses to determine how to vote proxies relating to portfolio securities and information regarding how the Fund voted those proxies during the most recent twelve month period ended June 30 is available without charge upon request by (1) calling the Funds at (877) 764-3863 and (2) from Fund documents filed with the Securities and Exchange Commission (“SEC”) on the SEC’s website at www.sec.gov.
TRUSTEES
Stephen A. Little, Chairman
Gary E. Hippenstiel
Daniel J. Condon
Ronald C. Tritschler
OFFICERS
Anthony J. Ghoston, President
John Swhear, Senior Vice-President
James M. Landis, Interim Chief Financial Officer and Treasurer
Heather A. Bonds, Secretary
Lynn Wood, Chief Compliance Officer
INVESTMENT ADVISOR
Marco Investment Management LLC
300 Atlanta Financial Center
3343 Peachtree Road NE
Atlanta, GA 30326
DISTRIBUTOR
Unified Financial Securities, Inc.
2960 North Meridian Street, Suite 300
Indianapolis, IN 46208
INDEPENDENT REGISTERED PUBLIC ACCOUNTING FIRM
Cohen Fund Audit Services Ltd.
800 Westpoint Parkway, Suite 1100
Westlake, OH 44145
LEGAL COUNSEL
Thompson Coburn LLP
One US Bank Plaza
St. Louis, MO 63101
LEGAL COUNSEL TO THE INDEPENDENT TRUSTEES
Thompson Hine LLP
312 Walnut St., 14th Floor
Cincinnati, OH 45202
CUSTODIAN
Huntington National Bank
41 South Street
Columbus, OH 43125
ADMINISTRATOR, TRANSFER AGENT AND FUND ACCOUNTANT
Unified Fund Services, Inc.
2960 North Meridian Street, Suite 300
Indianapolis, IN 46208
This report is intended only for the information of shareholders or those who have received the Fund’s prospectus which contains information about the Fund’s management fee and expenses. Please read the prospectus carefully before investing.
Distributed by Unified Financial Securities, Inc.
Member FINRA/SIPC

Annual Report
November 30, 2007
Fund Adviser:
Pekin Singer Strauss Asset Management, Inc.
21 S. Clark Street, Suite 3325
Chicago, IL 60603
Toll Free (800) 470-1029

Dear Shareholder:
“Growth stocks are the new retro chic.” — The Economist, December, 2007
After a strong first half of the year, the stock market turned choppy in July, due to the housing recession and significant turbulence in the credit markets. In addition, value stocks have significantly underperformed growth stocks, to the detriment of the Fund’s short-term performance. Since inception on December 8, 2006, the Appleseed Fund generated a total return of (1.33%). The S&P 500 Index, which is the Fund’s principal benchmark, has generated a return of 6.98% during that same period. We are disappointed by the Fund’s relative performance, but this is not the first time, nor will it be the last time that value stocks underperform the market. Our goal with the Appleseed Fund is not to beat the S&P 500 Index in every market environment; it is to beat the S&P 500 Index over the long-term.
Our investing strategy is to patiently search for buying opportunities created by the current investing environment. We have been adding shares to many of our existing positions, including Powerwave, Radio One, John B. Sanfilippo, and AIG, and we have added two new positions, Invacare and StreetTracks Gold Shares.
We have been bearish on the housing market since the summer of 2005 when it was clear that Home Price/Income ratios in many local markets were deviating significantly from historical norms. As a result of our bearish stance, we have tried to avoid investments with significant exposure to a downturn in housing. For example, thus far we have shied away from investing in any home builders or mortgage brokers.
We sold our Citigroup (C) position at a modest loss soon after the company reported its 3rd quarter results, when the extent of Citibank’s exposure to housing became clearer. Between the bank’s exposure to illiquid sub-prime loans and its off-balance sheet liabilities in the form of SIVs (Structured Investment Vehicles), we felt that the company’s capital could become permanently impaired. Since we sold our Citigroup holding, the company’s balance sheet and stock price have deteriorated considerably, and we expect that management will eventually make the decision to cut the company’s dividend.
The Appleseed Fund also owns a position in American International Group (AIG), which has manageable exposure to the mortgage market through its investment portfolio and through several of its insurance businesses. AIG is well-capitalized, highly diversified, and conservative in its investment philosophy and in its underwriting. We believe that AIG management has taken a conservative approach with respect to both insuring and investing in mortgage loans, and we expect that the company’s mortgage related losses will be minimal in relation to its capital base and earnings power. We have taken advantage of the short-term decline in the company’s stock price by adding to our position.

The Appleseed Fund’s largest position, Annaly Capital Management (NLY), represents a significant hedge on the U.S. economy. If the economy continues to slow or even contract as a result of weakness in housing and contracting credit, we expect the Federal Reserve will continue to stimulate the economy by further decreasing the federal funds rate. A declining federal funds rate should contribute to strong earnings growth and strong dividend growth for Annaly in 2008, just as in 2007.
During the past six months, the most significant contributor to the Fund’s performance was Apollo Group (APOL). Apollo’s management is building the company’s value through initiatives which should improve recruiting, boost student retention rates, and increase tuitions at the company’s flagship school, the University of Phoenix. In addition, investor sentiment towards for-profit secondary education companies has improved substantially in recent months. We think the Apollo Group is a great company with terrific fundamentals, although its stock price is beginning to approach our estimate of full value.
During the summer we purchased Invacare (IVC), which was also a significant positive contributor to the Fund’s performance during the past six months. Invacare is a leading manufacturer and distributor of home health products such as wheelchairs, home care beds, and oxygen therapy machines. In recent years, Invacare’s domestic profits have been pressured by competition from Chinese imports and reduced Medicare/Medicaid reimbursement rates. In response to these pressures, management has developed a strong plan to reduce its cost structure, which it is now executing, and we expect that the company’s value will increase greatly in the coming few years as free cash flow continues to re-accelerate.
The largest detractor to the Fund’s performance over the past six months was Powerwave (PWAV), a leading provider of infrastructure equipment to the wireless industry. Powerwave’s stock price has declined because of weaker than expected gross margins during the past few quarters. However, management has taken aggressive actions to reduce the company’s cost structure, and we expect a substantial increase in demand for the company’s products during the next several years. We are also encouraged that the CEO and CFO purchased a quarter million dollars worth of Powerwave stock on the open market this Spring, at prices 20% above the current price. In recent months we have added to our position and reduced the Fund’s average cost basis.
Another significant detractor to the Fund’s performance was Radio One (ROIAK), a radio broadcaster and media company which targets African-American consumers. Radio One’s stock price has declined along with the rest of the radio industry over the past few months, due to increased fears that radio revenues and profits will weaken in a recession. While radio advertising revenues would likely weaken in a recession, we believe that Radio One’s stock price more than discounts this economic risk. In addition, the company’s radio station in Los Angeles, which was re-launched in December 2006, should be a strong contributor to the

company’s revenue and profit growth during the next few years. Finally, the company owns a 36% stake in TV One, an increasingly valuable cable network, and we expect this business to show strong revenue and EBITDA (Earnings Before Interest, Depreciation, and Amortization) growth as well, even in a weak economic environment.
We exited from three positions since our last letter to shareholders. As mentioned above, we sold our Citigroup position once the magnitude of their mortgage-related risks became clear to us. In addition, we liquidated our Bausch & Lomb (BOL) and our Nokia (NOK) positions, as their stock prices became, in our view, fully valued.
During the past year, our intrinsic value estimates for our holdings have generally been increasing at a healthy rate, which should increase the long-term appreciation potential of the Fund’s portfolio. At the same time, we are continuing to see attractive stock prices. As a result, we believe the Fund’s portfolio is well-positioned for strong future returns. We appreciate your patience, your continued trust, and your investment in the Appleseed Fund.
Sincerely,
|
|
|


Ronald Strauss, CFA | Richard Singer, CFA | Adam Strauss, CFA |
|
|


William Pekin, CFA | Joshua Strauss, CFA |
Investment Results – (Unaudited)


The performance quoted represents past performance, which does not guarantee future results. The investment return and principal value of an investment will fluctuate so that an investor’s shares, when redeemed, may be worth more or less than their original cost. The returns shown do not reflect deduction of taxes that a shareholder would pay on Fund distributions or the redemption of Fund shares. Current performance of the Fund may be lower or higher than the performance quoted. The Fund’s investment objectives, risks, charges and expenses must be considered carefully before investing. Performance data current to the most recent month end may be obtained by calling 1-800-470-1029.
* Return figures reflect any change in price per share and assume the reinvestment of all distributions.
** The Index is an unmanaged benchmark that assumes reinvestment of all distributions and excludes the effect of taxes and fees. The S&P 500 Index is a widely recognized unmanaged index of equity prices and is representative of a broader market and range of securities than is found in the Fund’s portfolio. Individuals cannot invest directly in the Index; however, an individual can invest in exchange traded funds or other investment vehicles that attempt to track the performance of a benchmark index.

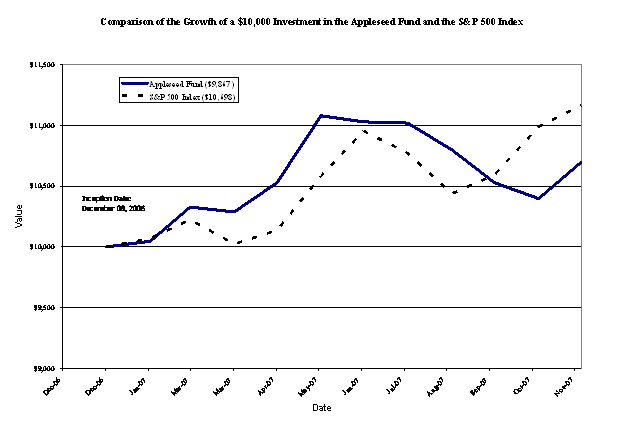
The chart above assumes an initial investment of $10,000 made on December 8, 2006 (commencement of Fund operations) and held through November 30, 2007. The S&P 500 Index is a widely recognized unmanaged index of equity prices and is representative of a broader market and range of securities than is found in the Fund’s portfolio. Individuals cannot invest directly in the Index; however, an individual can invest in exchange traded funds or other investment vehicles that attempt to track the performance of a benchmark index. THE FUND’S RETURN REPRESENTS PAST PERFORMANCE AND DOES NOT GUARANTEE FUTURE RESULTS. The returns shown do not reflect deduction of taxes that a shareholder would pay on Fund distributions or the redemption of Fund shares. Investment returns and principal values will fluctuate so that your shares, when redeemed, may be worth more or less than their original purchase price.
Current performance may be lower or higher than the performance data quoted. For more information on the Fund, and to obtain performance data current to the most recent month end, please call 1-800-470-1029. Investing in the Fund involves certain risks that are discussed in the Fund’s prospectus. Please read the prospectus carefully before you invest or send money.
The Fund is distributed by Unified Financial Securities, Inc., member FINRA.
Fund Holdings – (Unaudited)
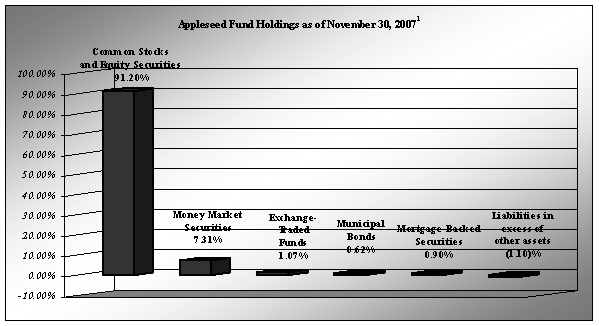
1As a percentage of net assets. |
The Appleseed Fund invests primarily in a portfolio of equity securities of companies that are undervalued in the opinion of the Fund’s adviser, Pekin Singer Strauss Asset Management.
Availability of Portfolio Schedule – (Unaudited)
The Fund files its complete schedule of portfolio holdings with the Securities and Exchange Commission (“SEC”) for the first and third quarters of each fiscal year on Form N-Q. The Fund’s Forms N-Q are available at the SEC’s website at www.sec.gov. The Fund’s Forms N-Q may be reviewed and copied at the Public Reference Room in Washington DC. Information on the operation of the Public Reference Room may be obtained by calling 1-800-SEC-0330.
Summary of Fund’s Expenses – (Unaudited)
As a shareholder of the Fund, you incur two types of costs: (1) transaction costs (such as short-term redemption fees); and (2) ongoing costs, including management fees and other Fund expenses. This Example is intended to help you understand your ongoing costs (in dollars) of investing in the Fund and to compare these costs with the ongoing costs of investing in other mutual funds.
The Example is based on an investment of $1,000 invested at the beginning of the period (June 1, 2007) and held for the entire period (through November 30, 2007).
Actual Expenses
The first line of the table below provides information about actual account values and actual expenses. You may use the information in this line, together with the amount you invested, to estimate the expenses that you paid over the period. Simply divide your account value by $1,000 (for example, an $8,600 account value divided by $1,000 = 8.60), then multiply the result by the number in the first line under the heading entitled “Expenses Paid During Period” to estimate the expenses you paid on your account during this period.
Hypothetical Example for Comparison Purposes
The second line of the table below provides information about hypothetical account values and hypothetical expenses based on the Fund’s actual expense ratio and an assumed rate of return of 5% per year before expenses, which is not the Fund’s actual return. The hypothetical account values and expenses may not be used to estimate the actual ending account balance or expenses you paid for the period. You may use this information to compare the ongoing costs of investing in the Fund and other funds. To do so, compare this 5% hypothetical example with the 5% hypothetical examples that appear in the shareholder reports of the other funds.
Expenses shown are meant to highlight your ongoing costs only and do not reflect any transactional costs such as the redemption fee imposed on short-term redemptions. The second line of the table below is useful in comparing ongoing costs only and will not help you determine the relative costs of owning different funds. If incurred, the short-term redemption fee imposed by the Fund would increase your expenses.
Appleseed Fund | Beginning Account Value June 1, 2007 | Ending Account Value November 30, 2007 | Expenses Paid During the Period* June 1, 2007 - November 30, 2007 |
Actual
| $1,000.00 | $894.64 | $4.28 |
Hypothetical **
| $1,000.00 | $1,020.55 | $4.56 |
*Expenses are equal to the Fund’s annualized expense ratio of 0.90%, multiplied by the average account value over the period, multiplied by 183/365 (to reflect the partial year period).
** Assumes a 5% return before expenses.
Appleseed Fund | ||||
Schedule of Investments | ||||
November 30, 2007 | ||||
|
|
|
|
|
|
|
|
|
|
|
|
|
|
|
Common Stocks - 76.06% | Shares |
| Value | |
|
|
|
|
|
Blankbooks, Looseleaf Binders & Bookbinding & Related Work - 4.73% |
|
| ||
Acco Brands Corp. (a) | 18,403 |
| $ 307,514 | |
|
|
|
|
|
Broadcasting & Communications Equipment - 11.87% |
|
|
| |
Powerwave Technologies, Inc. (a) | 186,300 |
| 771,282 | |
|
|
|
|
|
Cable & Other Pay Television Services - 5.08% |
|
|
| |
Liberty Media Corp. - Interactive - Class A (a) | 16,400 |
| 330,460 | |
|
|
|
|
|
Electronic Computers - 1.43% |
|
|
| |
Dell, Inc. (a) |
| 3,800 |
| 93,252 |
|
|
|
|
|
Fabricated Rubber Products - 0.08% |
|
|
| |
The Female Health Co. (a) | 2,000 |
| 5,120 | |
|
|
|
|
|
Fire, Marine & Casualty Insurance - 5.23% |
|
|
| |
American International Group, Inc. | 5,850 |
| 340,061 | |
|
|
|
|
|
Food & Beverage - 12.69% |
|
|
| |
John B. Sanfilippo & Son, Inc. (a) | 97,279 |
| 824,926 | |
|
|
|
|
|
Orthopedic, Prosthetic, & Surgical Appliances & Supplies - 3.26% |
|
|
| |
Invacare Corp. |
| 8,150 |
| 211,900 |
|
|
|
|
|
Pharmaceutical Preparations - 5.26% |
|
|
| |
Pfizer, Inc. |
| 14,400 |
| 342,144 |
|
|
|
|
|
Radio Broadcasting Stations - 2.76% |
|
|
| |
Radio One, Inc. - Class D (a) | 87,903 |
| 179,322 | |
|
|
|
|
|
Retail - Apparel and Accessory Stores - 4.74% |
|
|
| |
Hanesbrands, Inc. (a) | 10,905 |
| 307,848 | |
|
|
|
|
|
Retail - Department Stores - 4.49% |
|
|
| |
Wal-Mart Stores, Inc. | 6,100 |
| 292,190 | |
|
|
|
|
|
Services - Educational Services -8.71% |
|
|
| |
Apollo Group, Inc. - Class A (a) | 7,400 |
| 566,248 | |
|
|
|
|
|
Wholesale - Medical & Dental Equipment & Supplies - 5.73% |
|
|
| |
Johnson & Johnson | 5,500 |
| 372,570 | |
|
|
|
|
|
TOTAL COMMON STOCKS (Cost $5,594,711) |
|
| 4,944,837 | |
*See accompanying notes which are an integral part of these financial statements.
Appleseed Fund |
|
|
|
|
Schedule of Investments - continued |
|
|
| |
November 30, 2007 |
|
|
| |
|
|
|
|
|
|
|
|
|
|
|
|
|
|
|
Real Estate Investment Trust - 15.14% | Shares |
| Value | |
|
|
|
|
|
Annaly Capital Management, Inc. | 57,200 |
| $ 984,412 | |
|
|
|
|
|
TOTAL REAL ESTATE INVESTMENT TRUST (Cost $796,159) |
| 984,412 | ||
|
| Principal |
|
|
Mortgage-Backed Securities - 0.90% | Amount |
|
| |
|
|
|
|
|
Federal Home Loan Mortgage Corp., 5.50%, 05/01/2037 | $ 58,219 |
| 58,234 | |
|
|
|
|
|
TOTAL MORTGAGE-BACKED SECURITIES (Cost $57,867) |
|
| 58,234 | |
|
|
|
|
|
Municipal Bonds - 0.62% |
|
|
| |
|
|
|
|
|
Kentucky HSG Corp., 5.286%, 07/01/2009 | 40,000 |
| 40,580 | |
|
|
|
|
|
TOTAL MUNICIPAL BONDS (Cost $40,021) |
|
| 40,580 | |
|
|
|
|
|
Exchange-Traded Funds - 1.07% | Shares |
|
| |
|
|
|
|
|
streetTRACKS Gold Trust (a) | 900 |
| 69,579 | |
|
|
|
|
|
TOTAL EXCHANGE-TRADED FUNDS (Cost $66,610) |
|
| 69,579 | |
|
|
|
|
|
Money Market Securities - 7.31% |
|
|
| |
|
|
|
|
|
Huntington Money Market Fund, 3.83% (b) | 475,229 |
| 475,229 | |
|
|
|
|
|
TOTAL MONEY MARKET SECURITIES (Cost $475,229) |
|
| 475,229 | |
|
|
|
|
|
TOTAL INVESTMENTS (Cost $7,030,597) - 101.10% |
|
| $ 6,572,871 | |
|
|
|
|
|
Liabilities in excess of other assets - (1.10)% |
|
| (71,772) | |
|
|
|
|
|
TOTAL NET ASSETS - 100.00% |
|
| $ 6,501,099 | |
|
|
|
|
|
|
|
|
|
|
(a) Non-income producing. |
|
|
| |
(b) Variable Rate Security; the money market rate shown represents the rate at November 30, 2007. | ||||
*See accompanying notes which are an integral part of these financial statements.
Appleseed Fund |
|
|
|
|
Statement of Assets and Liabilities |
|
|
|
|
November 30, 2007 |
|
|
|
|
|
|
|
|
|
|
|
|
|
|
|
|
|
|
|
Assets |
|
|
|
|
Investments in securities, at market value (cost $7,030,597) |
|
| $ 6,572,871 | |
Dividends receivable |
|
|
| 6,458 |
Interest receivable |
|
|
| 2,824 |
Receivable for Fund shares sold |
|
|
| 150 |
Prepaid expenses |
|
|
| 860 |
Receivable due from Adviser (a) |
|
|
| 4,106 |
Other receivable |
|
|
| 4,500 |
Total assets |
|
|
| 6,591,769 |
|
|
|
|
|
Liabilities |
|
|
|
|
Payable for investments purchased |
|
|
| 55,696 |
Payable to trustees and officers |
|
|
| 1,974 |
Payable to administrator, fund accountant, and transfer agent |
|
| 11,069 | |
Payable to custodian |
|
|
| 1,574 |
Federal taxes payable |
|
|
| 4,500 |
Other accrued expenses |
|
|
| 15,857 |
Total liabilities |
|
|
| 90,670 |
|
|
|
|
|
Net Assets |
|
|
| $ 6,501,099 |
|
|
|
|
|
Net Assets consist of: |
|
|
|
|
Paid in capital |
|
|
| $ 6,891,510 |
Accumulated undistributed net investment income |
|
| 69,277 | |
Accumulated undistributed net realized (loss) from investment transactions |
| (1,962) | ||
Net unrealized (depreciation) on investments |
|
| (457,726) | |
|
|
|
|
|
Net Assets |
|
|
| $ 6,501,099 |
|
|
|
|
|
Shares outstanding (unlimited number of shares authorized) |
|
| 659,959 | |
|
|
|
|
|
Net Asset Value and offering price per share |
|
| $ 9.85 | |
|
|
|
|
|
Redemption price per share ($9.85 * 98%) (b) |
|
| $ 9.65 | |
(a) See Note 3 in the Notes to the Financial Statements. |
(b) The Fund charges a 2.00% redemption fee on shares redeemed within 90 calendar days of purchase. Shares are redeemed at the Net Asset Value if held longer than 90 calendar days.
*See accompanying notes which are an integral part of these financial statements.
Appleseed Fund |
|
|
|
|
Statement of Operations |
|
|
|
|
For the period ended November 30, 2007 (a) |
|
|
| |
|
|
|
|
|
|
|
|
|
|
Investment Income |
|
|
|
|
Dividend income (net of withholding tax of $616) |
|
| $ 97,064 | |
Interest income |
|
|
| 20,761 |
Total Investment Income |
|
|
| 117,825 |
|
|
|
|
|
Expenses |
|
|
|
|
Investment Adviser fee (b) |
|
|
| 51,014 |
Administration expenses |
|
|
| 26,664 |
Transfer agent expenses |
|
|
| 24,785 |
Fund accounting expenses |
|
|
| 20,735 |
Auditing expenses |
|
|
| 12,450 |
Legal expenses |
|
|
| 9,318 |
Registration expenses |
|
|
| 7,528 |
Custodian expenses |
|
|
| 6,473 |
CCO expenses |
|
|
| 5,051 |
Trustee expenses |
|
|
| 4,904 |
Pricing expenses |
|
|
| 3,065 |
Miscellaneous expenses |
|
|
| 1,869 |
Printing expenses |
|
|
| 1,340 |
24f-2 expenses |
|
|
| 210 |
Total Expenses |
|
|
| 175,406 |
Less: Fees waived & expenses reimbursed by Adviser (b) |
| (129,303) | ||
Net operating expenses before federal income taxes |
| 46,103 | ||
Federal income tax expense |
|
|
| 4,500 |
Less: Voluntary federal tax expense reimbursement |
| (4,500) | ||
Net operating expenses after federal income taxes |
| 46,103 | ||
Net investment income |
|
|
| 71,722 |
|
|
|
|
|
|
|
|
|
|
Realized & Unrealized Gain (Loss) on Investments |
|
|
| |
Net realized (loss) on investment securities |
|
| (1,962) | |
Change in unrealized appreciation/(depreciation) |
|
|
| |
on investment securities |
|
|
| (457,726) |
Net realized and unrealized (loss) on investment securities |
| (459,688) | ||
Net decrease in net assets resulting from operations |
| $ (387,966) | ||
(a) For the period December 8, 2006 (the date the Fund commenced operations) through November 30, 2007. |
(b) See Note 3 in the Notes to the Financial Statements. |
*See accompanying notes which are an integral part of these financial statements.
Appleseed Fund |
|
|
|
|
|
|
Statement of Changes In Net Assets |
|
|
|
| ||
|
|
|
|
| Period |
|
|
|
|
|
| ended |
|
|
|
|
|
| November |
|
|
|
|
|
| 30, 2007 | (a) |
Operations |
|
|
|
|
|
|
Net investment income |
|
|
| $ 71,722 |
| |
Net realized (loss) on investment securities |
|
| (1,962) |
| ||
Change in unrealized appreciation/(depreciation) on investment securities | (457,726) |
| ||||
Net decrease in net assets resulting from operations |
|
| (387,966) |
| ||
|
|
|
|
|
|
|
Distributions |
|
|
|
|
|
|
From net investment income |
|
|
| (2,445) |
| |
Total distributions |
|
|
| (2,445) |
| |
|
|
|
|
|
|
|
Capital Share Transactions |
|
|
|
|
| |
Proceeds from Fund shares sold |
|
|
| 7,336,240 |
| |
Reinvestment of distributions |
|
|
| 2,445 |
| |
Amount paid for Fund shares repurchased |
|
| (447,175) |
| ||
Net increase in net assets resulting |
|
|
|
|
| |
from capital share transactions |
|
|
| 6,891,510 |
| |
|
|
|
|
|
|
|
Total Increase in Net Assets |
|
|
| 6,501,099 |
| |
|
|
|
|
|
|
|
Net Assets |
|
|
|
|
|
|
Beginning of period |
|
|
| - |
| |
|
|
|
|
|
|
|
End of period |
|
|
|
| $ 6,501,099 |
|
|
|
|
|
|
|
|
Accumulated undistributed net investment income |
|
|
|
| ||
included in net assets at end of period |
|
| $ 69,277 |
| ||
|
|
|
|
|
|
|
Capital Share Transactions |
|
|
|
|
| |
Shares sold |
|
|
|
| 701,710 |
|
Shares issued in reinvestment of distributions |
|
| 243 |
| ||
Shares repurchased |
|
|
| (41,994) |
| |
|
|
|
|
|
|
|
Net increase from capital share transactions |
|
| 659,959 |
| ||
(a) For the period December 8, 2006 (the date the Fund commenced operations) through November 30, 2007. |
*See accompanying notes which are an integral part of these financial statements.
Appleseed Fund |
|
| ||||
Financial Highlights |
|
|
|
|
| |
(For a share outstanding during the period) |
|
|
|
| ||
|
|
|
|
| Period |
|
|
|
|
|
| ended |
|
|
|
|
|
| November |
|
|
|
|
|
| 30, 2007 | (a) |
|
|
|
|
|
|
|
Selected Per Share Data: |
|
|
|
|
| |
Net asset value, beginning of period |
|
| $ 10.00 |
| ||
|
|
|
|
|
|
|
Income from investment operations: |
|
|
|
|
| |
Net investment income |
|
|
| 0.12 |
| |
Net realized and unrealized (loss) on investments |
|
| (0.26) |
| ||
Total from investment operations |
|
|
| (0.14) |
| |
|
|
|
|
|
|
|
Less Distributions to shareholders: |
|
|
|
|
| |
From net investment income |
|
|
| (0.02) |
| |
Total distributions |
|
|
| (0.02) |
| |
|
|
|
|
|
|
|
Paid in capital from redemption fees |
|
| 0.01 |
| ||
|
|
|
|
|
|
|
Net asset value, end of period |
|
|
| $ 9.85 |
| |
|
|
|
|
|
|
|
Total Return (b) |
|
| (1.33)% | (c) | ||
|
|
|
|
|
|
|
Ratios and Supplemental Data: |
|
|
|
|
| |
Net assets, end of period (000) |
|
|
| $ 6,501 |
| |
Ratio of expenses to average net assets |
|
| 0.90% | (d) | ||
Ratio of expenses to average net assets |
|
|
|
| ||
before reimbursement & federal income taxes |
|
| 3.52% | (d) (e) | ||
Ratio of net investment income to |
|
|
|
|
| |
average net assets |
|
|
| 1.40% | (d) | |
Ratio of net investment income (loss) to |
|
|
|
| ||
average net assets before reimbursement & federal income taxes |
| (1.22)% | (d) (f) | |||
Portfolio turnover rate |
|
|
| 27.07% |
| |
(a) For the period December 8, 2006 (the date the Fund commenced operations) through November 30, 2007.
(b) Total return in the above table represents the rate that the investor would have earned or lost on an investment in the Fund, assuming reinvestment of dividends.
(c) Not annualized.
(d) Annualized.
(e) The expense ratio before reimbursements includes income taxes of .09% which was voluntarily reimbursed by the Adviser and Fund Administrator.
(f) The net investment income (loss) ratio includes income tax expense of (.09)% which was voluntarily reimbursed by the Adviser and Fund Administrator.
*See accompanying notes which are an integral part of these financial statements.
Appleseed Fund
Notes to the Financial Statements
November 30, 2007
NOTE 1. | ORGANIZATION |
The Appleseed Fund (the “Fund”) was organized as a non-diversified series of Unified Series Trust (the “Trust”) on September 11, 2006. The Trust is an open-end investment company established under the laws of Ohio by an Agreement and Declaration of Trust dated October 17, 2002 (the “Trust Agreement”). The Trust Agreement permits the Board of Trustees of the Trust (the “Board”) to issue an unlimited number of shares of beneficial interest of separate series. The Fund is one of a series of funds currently authorized by the Board. The Fund commenced operations on December 8, 2006. The Fund’s investment adviser is Pekin Singer Strauss Asset Management, Inc. (the “Adviser”). The investment objective of the Fund is to provide long-term capital appreciation.
NOTE 2. | SIGNIFICANT ACCOUNTING POLICIES |
The following is a summary of significant accounting policies followed by the Fund in the preparation of its financial statements.
Securities Valuations - Equity securities are valued by using market quotations, but may be valued on the basis of prices furnished by a pricing service when the Adviser believes such prices more accurately reflect the fair market value of such securities. Securities that are traded on any stock exchange are valued by the pricing service at the last quoted sale price. Lacking a last sale price, an exchange traded security is valued by the pricing service at its last bid price. Securities traded in the NASDAQ over-the-counter market are valued by the pricing service at the NASDAQ Official Closing Price. When market quotations are not readily available, when the Adviser determines that the market quotation or the price provided by the pricing service does not accurately reflect the current market value or when restricted or illiquid securities are being valued, such securities are valued as determined in good faith by the Adviser, in conformity with guidelines adopted by and subject to review by the Pricing Committee of the Board.
Fixed income securities are valued by using market quotations, but may be valued on the basis of prices furnished by a pricing service when the Adviser believes such prices more accurately reflect the fair market value of such securities. A pricing service utilizes electronic data processing techniques based on yield spreads relating to securities with similar characteristics to determine prices for normal institutional-size trading units of debt securities without regard to sale or bid prices. If the Adviser decides that a price provided by the pricing service does not accurately reflect the fair market value of the securities, when prices are not readily available from a pricing service or when restricted or illiquid securities are being valued, securities are valued at fair value as determined in good faith by the Adviser, in conformity with guidelines adopted by and subject to review of the Pricing Committee of the Board. Short-term investments in fixed income securities with maturities of less than 60 days when acquired, or which subsequently are within 60 days of maturity, are valued by using the amortized cost method of valuation, which the Board has determined will represent fair value. The ability of issuers of debt securities held by the Fund to meet their obligations may be affected by economic and political developments in a specific country or region.
In accordance with the Trust’s good faith pricing guidelines, the Adviser is required to consider all appropriate factors relevant to the value of securities for which it has determined other pricing sources are not available or reliable as described above. No single standard exists for determining fair value controls, since fair value depends upon the circumstances of each individual case. As a general principle, the current fair value of an issue of securities being valued by the Adviser would appear to be the amount which the owner might reasonably expect to receive for them upon their current sale. Methods which are in accord with this principle may, for example, be based on (i) a multiple of earnings; (ii) a discount from market of a similar freely traded security (including a derivative security or a basket of securities traded on other markets, exchanges or among dealers); or (iii) yield to maturity with respect to debt issues, or a combination of these and other methods.
Appleseed Fund
Notes to the Financial Statements - continued
November 30, 2007
NOTE 2. | SIGNIFICANT ACCOUNTING POLICIES – continued |
Good faith pricing is permitted if, in the Adviser’s opinion, the validity of market quotations appears to be questionable based on factors such as evidence of a thin market in the security based on a small number of quotations, a significant event occurs after the close of a market but before a Fund’s net asset value (“NAV”) calculation that may affect a security’s value, or the Adviser is aware of any other data that calls into question the reliability of market quotations.
Federal Income Taxes – The Fund intends to qualify each year as a “regulated investment company” under subchapter M of the Internal Revenue Code of 1986, as amended, by distributing all of its net investment income and net realized capital gains. For the period December 8, 2006 (commencement of operations) to November 30, 2007, the Fund did not qualify as a regulated investment company and accordingly is subject to federal income taxes. The Fund’s tax expense or benefit is included in the Statement of Operations based on the component of income or gains/(losses) to which the expense or benefit relates. The Fund’s Adviser and fund administrator have voluntarily agreed to reimburse the Fund for any income taxes it incurs as a result of the Fund failing to qualify as a regulated investment company. The voluntary reimbursement of income taxes is also shown in the Statement of Operations. Deferred taxes reflect (i) taxes computed on unrealized gains/(losses) on investments and (ii) the net tax effects of temporary differences between the carrying amounts of assets and liabilities for financial reporting purposes and the corresponding amounts used for income tax purposes. To the extent the Fund has a net deferred tax asset, a valuation allowance is recognized if, based on the weight of available evidence, it is more likely than not that some portion or all of the deferred tax asset will not be realized.
Expenses – Expenses incurred by the Trust that do not relate to a specific fund of the Trust are allocated to the individual funds based on each fund’s relative net assets or another appropriate basis (as determined by the Board).
Security Transactions and Related Income - The Fund follows industry practice and records security transactions on the trade date. The specific identification method is used for determining gains or losses for financial statements and income tax purposes. Dividend income is recorded on the ex-dividend date and interest income is recorded on an accrual basis. Discounts and premiums on securities purchased are amortized or accreted using the effective interest method. Withholding taxes on foreign dividends have been provided for in accordance with the Fund’s understanding of the applicable country’s tax rules and rates.
Dividends and Distributions - Distributions to shareholders, which are determined in accordance with income tax regulations, are recorded on the ex-dividend date. The Fund intends to distribute substantially all of its net investment income as dividends to its shareholders on at least an annual basis. The Fund intends to distribute its net realized long-term capital gains and its net realized short-term capital gains at least once a year. The treatment for financial reporting purposes of distributions made to shareholders during the year from net investment income or net realized capital gains may differ from their ultimate treatment for federal income tax purposes. These differences are caused primarily by differences in the timing of the recognition of certain components of income, expense or realized capital gain for federal income tax purposes. Where such differences are permanent in nature, they are reclassified in the components of the net assets based on their ultimate characterization for federal income tax purposes. Any such reclassifications will have no effect on net assets, results of operations or net asset values per share of the Fund. For the year ended November 30, 2007, there were no such reclassifications.
Accounting for Uncertainty in Income Taxes - In June 2006, the Financial Accounting Standards Board (FASB) issued FASB Interpretation No. 48 – Accounting for Uncertainty in Income Taxes that requires the tax effects of certain tax positions to be recognized. These tax positions must meet a “more likely than not” standard that, based on their technical merits, have a more than 50 percent likelihood of being sustained upon examination. FASB Interpretation No. 48 is effective for fiscal periods beginning after December 15, 2006. At adoption, the financial statements must be adjusted to reflect only those tax positions that are more likely than not of being sustained. Management of the Fund is currently evaluating the impact that FASB Interpretation No. 48 will have on the Fund’s financial statements.
Fair Value Measurements - In September 2006, FASB issued Statement on Financial Accounting Standards (SFAS) No. 157 “Fair Value Measurements.” This standard establishes a single authoritative definition of fair value, sets out a framework for measuring fair value and requires additional disclosure about fair value measurements. SFAS No. 157 applies to fair value
Appleseed Fund
Notes to the Financial Statements - continued
November 30, 2007
NOTE 2. | SIGNIFICANT ACCOUNTING POLICIES – continued |
measurements already required or permitted by existing standards. SFAS No. 157 is effective for financial statements issued for fiscal years beginning after November 15, 2007 and interim periods within those fiscal years. The changes to current generally accepted accounting principles from the application of this Statement relate to the definition of fair value, the methods used to measure fair value, and the expanded disclosures about fair value measurements. As of November 30, 2007, the Fund does not believe that the adoption of SFAS No. 157 will impact the amounts reported in the financial statements, however, additional disclosures may be required about the inputs used to develop the measurements and the effect of certain of the measurements reported on the statement of changes in net assets for a fiscal period.
NOTE 3. | FEES AND OTHER TRANSACTIONS WITH AFFILIATES |
The Adviser of the Fund, under the terms of the management agreement (the “Agreement”), manages the Fund’s investments subject to approval of the Board. As compensation for its management services, the Fund is obligated to pay the Adviser a fee computed and accrued daily and paid monthly at an annual rate of 1.00% of the average daily net assets of the Fund. For the period December 8, 2006 (commencement of operations) through November 30, 2007, the Adviser earned a fee of $51,014 from the Fund before waiving a portion of those fees, as described below.
The Adviser has contractually agreed through November 30, 2008 to waive all or a portion of its management fees and/or reimburse the Fund for certain fees and expenses, but only to the extent necessary to maintain the Fund’s net operating expenses, excluding brokerage fees and commissions, borrowing costs (such as interest and dividends on securities sold short), taxes and extraordinary expenses and any indirect expenses (such as expense incurred by other investment companies in which the Fund may invest) at 0.90% of average daily net assets. For the period December 8, 2006 (commencement of operations) through November 30, 2007, the Adviser waived fees and reimbursed expenses of $129,303. At November 30, 2007 the Adviser owed $4,106 to the Fund.
Each waiver or reimbursement by the Adviser is subject to repayment by the Fund within the three fiscal years following the fiscal year in which the particular waiver or reimbursement occurred; provided that the Fund is able to make the repayment without exceeding the 0.90% expense limitation. Consequently, as of November 30, 2007, $129,303 is subject to repayment by the Fund to the Adviser no later than November 30, 2010.
The Trust retains Unified Fund Services, Inc. (“Unified”) to manage the Fund’s business affairs and provide the Fund with administrative services, including all regulatory reporting and necessary office equipment and personnel. For the period December 8, 2006 (commencement of operations) through November 30, 2007, Unified earned fees of $26,664 for administrative services provided to the Fund. As of November 30, 2007 the Fund owed Unified $4,667 for administrative services. Certain officers of the Trust are members of management and/or employees of Unified. Unified operates as a wholly-owned subsidiary of Huntington Bancshares, Inc., the parent company of the principal distributor of the Fund and Huntington National Bank, the custodian of the Fund’s investments (the “Custodian”). For the period December 8, 2006 (commencement of operations) through November 30, 2007, the Custodian earned fees of $6,473 for custody services provided to the Fund. At November 30, 2007, the Fund owed the Custodian $1,574.
The Trust retains Unified to act as the Fund’s transfer agent and to provide fund accounting services. For the period December 8, 2006 (commencement of operations) through November 30, 2007, Unified earned fees of $14,928 from the Fund for transfer agent services provided to the Fund and $9,857 in reimbursement for out-of-pocket expenses incurred in providing transfer agent services to the Fund. For the period December 8, 2006 (commencement of operations) through November 30, 2007 Unified earned fees of $20,735 from the Fund for fund accounting services provided to the Fund. As of November 30, 2007 the Fund owed Unified $2,027 for transfer agent services, $1,038 in reimbursement of out-of-pocket expenses and $3,337 for fund accounting services.
The Fund has adopted a Distribution Plan (the “Plan”) pursuant to Rule 12b-1 under the Investment Company Act of 1940, which is currently inactive. The Plan provides that the Fund will pay the Adviser and/or any registered securities dealer, financial institution or any other person (the “Recipient”) a shareholder servicing fee of 0.25% of the average daily net assets
Appleseed Fund
Notes to the Financial Statements - continued
November 30, 2007
NOTE 3. | FEES AND OTHER TRANSACTIONS WITH AFFILIATES - continued |
of the class in connection with the promotion and distribution of the Fund’s shares or the provision of personal services to shareholders, including, but not necessarily limited to, advertising, compensation to underwriters, dealers and selling personnel, the printing and mailing of prospectuses to other than current Fund shareholders, the printing and mailing of sales literature and servicing shareholder accounts (“12b-1 Expenses”). The Fund or Adviser may pay all or a portion of these fees to any Recipient who renders assistance in distributing or promoting the sale of shares, or who provides certain shareholder services, pursuant to a written agreement. The Plan is a compensation plan, which means that compensation is provided regardless of 12b-1 Expenses actually incurred. It is anticipated that the Plan will benefit shareholders because an effective sales program typically is necessary in order for the Fund to reach and maintain a sufficient size to achieve efficiently its investment objectives and to realize economies of scale. The Adviser does not currently intend to activate the Plan but may do so at any time.
The Fund retains Unified Financial Securities, Inc. (the “Distributor”) to act as the principal distributor of the Fund’s shares. There were no payments made by the Fund to the Distributor during the period December 8, 2006 (commencement of operations) through November 30, 2007. The Distributor, Unified and the Custodian are controlled by Huntington Bancshares, Inc.
NOTE 4. | INVESTMENT TRANSACTIONS |
For the period ended November 30, 2007, purchases and sales of investment securities, other than short-term investments and short-term U.S. government obligations, were as follows:

As of November 30, 2007, the net unrealized appreciation of investments for tax purposes was as follows:

At November 30, 2007, the aggregate cost of securities for federal income tax purposes was $7,034,239.
NOTE 5. | ESTIMATES |
The preparation of financial statements in conformity with accounting principles generally accepted in the United States of America requires management to make estimates and assumptions that affect the reported amounts of assets and liabilities and disclosure of contingent assets and liabilities at the date of the financial statements and the reported amounts of increases and decreases in net assets from operations during the reporting period. Actual results could differ from those estimates.
Appleseed Fund
Notes to the Financial Statements - continued
November 30, 2007
NOTE 6. | BENEFICIAL OWNERSHIP |
The beneficial ownership, either directly or indirectly, of more than 25% of the voting securities of a fund (or class) creates a presumption of control of the fund (or class), under Section 2(a)(9) of the Investment Company Act of 1940. As of November 30, 2007, Pershing LLC owned, for the benefit of its customers, 80.24% of the Fund. As a result, Pershing LLC may be deemed to control the Fund. Ronald L. Strauss and Richard Singer, portfolio managers and part owners of the Adviser to the Fund, own 6.07% and 4.55%, of the Fund’s outstanding shares, respectively.
NOTE 7. | DISTRIBUTIONS TO SHAREHOLDERS |
On December 28, 2006, the Fund paid an income distribution of $0.0175 per share to shareholders of record on December 27, 2006.
The tax characterization of distributions for the fiscal period ended November 30, 2007 was as follows:

On December 21, 2007, the Fund paid an income distribution of $0.1053 per share and a short-term capital gain distribution of $0.0028 to shareholders of record on December 20, 2007.
NOTE 8. | FEDERAL INCOME TAXES |
Deferred taxes reflect (i) taxes computed on unrealized gains/(losses) on investments and (ii) the net tax effects of temporary differences between carrying amounts of assets and liabilities for financial reporting purposes and the corresponding amounts used for income tax purposes. As of November 30, 2007, the Fund had a deferred tax asset of $160,000 which represents the future tax benefits associated with net unrealized losses on investments. The Fund has made a determination that it is more likely than not that it will qualify as a regulated investment company in future years and distribute all of its future net taxable income and net capital gains to shareholders, so as not to be subject to federal income or excise taxes. Accordingly, the Fund has recorded a valuation allowance against its entire deferred tax asset. The Fund has recorded federal income taxes payable of $4,500, which is reflected as a liability in the Statement of Assets and Liabilities. The Adviser and fund administrator have voluntarily agreed to reimburse the Fund for any income taxes it incurs as a result of failing to qualify as a regulated investment company. This amount due from the Adviser and fund administrator is reported as other receivable of $4,500 in the Statement of Assets and Liabilities.
As of November 30, 2007, the components of distributable earnings (accumulated losses) on a tax basis were as follows:

As of November 30, 2007, the difference between book basis and tax basis unrealized (depreciation) is attributable to the tax deferral of losses on wash sales in the amount of $3,642.
REPORT OF INDEPENDENT REGISTERED PUBLIC ACCOUNTING FIRM
To The Shareholders and Board of Trustees
Appleseed Fund
(Unified Series Trust)
We have audited the accompanying statement of assets and liabilities, including the schedule of investments, of Appleseed Fund (the “Fund”), a series of the Unified Series Trust, as of November 30, 2007, and the related statements of operations and changes in net assets, and the financial highlights for the period December 8, 2006 (commencement of operations) through November 30, 2007. These financial statements and financial highlights are the responsibility of Fund management. Our responsibility is to express an opinion on these financial statements and financial highlights based on our audit.
We conducted our audit in accordance with the standards of the Public Company Accounting Oversight Board (United States). Those standards require that we plan and perform the audit to obtain reasonable assurance about whether the financial statements and financial highlights are free of material misstatement. An audit includes examining, on a test basis, evidence supporting the amounts and disclosures in the financial statements. Our procedures included confirmation of securities owned as of November 30, 2007, by correspondence with the Fund’s custodian and brokers. An audit also includes assessing the accounting principles used and significant estimates made by management, as well as evaluating the overall financial statement presentation. We believe that our audit provides a reasonable basis for our opinion.
In our opinion, the financial statements and financial highlights referred to above present fairly, in all material respects, the financial position of Appleseed Fund as of November 30, 2007 and the results of its operations, changes in its net assets, and the financial highlights for the period then ended, in conformity with accounting principles generally accepted in the United States of America.
COHEN FUND AUDIT SERVICES, LTD.
Westlake, Ohio
January 28, 2008
TRUSTEES AND OFFICERS - (Unaudited)
The Board of Trustees supervises the business activities of the Trust. Each Trustee serves as a trustee until termination of the Trust unless the Trustee dies, resigns, retires or is removed.
The following tables provide information regarding the Trustees and officers.
Independent Trustees
Name, Address*, (Age), Position with Trust**, Term of Position with Trust | Principal Occupation During Past 5 Years and Other Directorships |
Gary E. Hippenstiel (Age 60)
Independent Trustee, December 2002 to present | Director, Vice President and Chief Investment Officer of Legacy Trust Company, N.A. since 1992; Chairman of the investment committee for W.H. Donner Foundation and Donner Canadian Foundation, since June 2005; Trustee of AmeriPrime Advisors Trust from July 2002 to September 2005; Trustee of Access Variable Insurance Trust from April 2003 to August 2005; Trustee of AmeriPrime Funds from 1995 to July 2005; Trustee of CCMI Funds from June 2003 to March 2005. |
Stephen A. Little (Age 61)
Chairman, December 2004 to present; Independent Trustee, December 2002 to present | President and founder of The Rose, Inc., a registered investment advisor, since April 1993; Trustee of AmeriPrime Advisors Trust from November 2002 to September 2005; Trustee of AmeriPrime Funds from December 2002 to July 2005; Trustee of CCMI Funds from June 2003 to March 2005. |
Daniel J. Condon (Age 57)
Independent Trustee, December 2002 to present | President of International Crankshaft Inc., an automotive equipment manufacturing company, since 2004, Vice President and General Manager from 1990 to 2003; Trustee of AmeriPrime Advisors Trust from November 2002 to September 2005; Trustee of The Unified Funds from 1994 to 2002; Trustee of Firstar Select Funds, a REIT mutual fund, from 1997 to 2000; Trustee of AmeriPrime Funds from December 2002 to July 2005; Trustee of CCMI Funds from June 2003 to March 2005. |
Ronald C. Tritschler (Age 55)
Independent Trustee, December 2002 to present | Chief Executive Officer, Director and Legal Counsel of The Webb Companies, a national real estate company, since 2001, Executive Vice President and Director from 1990 to 2000; Director of First State Financial since 1998; Director, Vice President and Legal Counsel of The Traxx Companies, an owner and operator of convenience stores, since 1989; Trustee of AmeriPrime Advisors Trust from November 2002 to September 2005; Trustee of AmeriPrime Funds from December 2002 to July 2005; Trustee of CCMI Funds from June 2003 to March 2005. |
Principal Officers
Name, Address*, (Age), Position with Trust,** Term of Position with Trust | Principal Occupation During Past 5 Years and Other Directorships |
Anthony J. Ghoston (Age 48)
President, July 2004 to present | President of Unified Fund Services, Inc., the Trust’s administrator, since June 2005, Executive Vice President from June 2004 to June 2005, Senior Vice President from April 2003 to June 2004; Senior Vice President and Chief Information Officer of Unified Financial Services, Inc., the parent company of the Trust’s administrator and distributor, from 1997 to November 2004; President of AmeriPrime Advisors Trust from July 2004 to September 2005; President of AmeriPrime Funds from July 2004 to July 2005; President of CCMI Funds from July 2004 to March 2005. |
John C. Swhear (Age 46)
Senior Vice President, May 2007 to present | Vice President of Legal Administration and Compliance for Unified Fund Services, Inc., the Trust’s administrator, since April, 2007; Chief Compliance Officer of Unified Financial Securities, Inc., the Trust’s distributor, since May 2007; Employed in various positions with American United Life Insurance Company from 1983 to April 2007, including: Associate General Counsel, April 2007, Investment Adviser Chief Compliance Officer, June 2004 to April 2007, Assistant Secretary to the Board of Directors, December 2002 to April 2007, Chief Compliance Officer of OneAmerica Funds, Inc., June 2004 to April 2007, Chief Counsel and Secretary, OneAmerica Securities, Inc., December 2002 to April 2007. |
J. Michael Landis (Age 36)
Interim Chief Financial Officer and Treasurer, March 2007 to present
| Vice President Fund Accounting and Fund Administration for Unified Fund Services, since October, 2006; Director of Fund Accounting and Fund Administration for PFPC July 2006 - October 2006; Manager Fund Accounting for Unified Fund Services November 2004 – July 2006; Manager Fund Accounting for Mellon Financial Corporation November 1998 – November 2004. |
Lynn E. Wood (Age 61)
Chief Compliance Officer, October 2004 to present | Chief Compliance Officer of AmeriPrime Advisors Trust from October 2004 to September 2005; Chief Compliance Officer of AmeriPrime Funds from October 2004 to July 2005; Chief Compliance Officer of CCMI Funds from October 2004 to March 2005; Chief Compliance Officer of Unified Financial Securities, Inc., the Trust’s distributor, from December 2004 to October 2005 and from 1997 to 2000, Chairman from 1997 to December 2004, President from 1997 to 2000; Director of Compliance of Unified Fund Services, Inc., the Trust’s administrator, from October 2003 to September 2004; Chief Compliance Officer of Unified Financial Services, Inc., the parent company of the Trust’s administrator and distributor, from 2000 to 2004. |
Heather Bonds (Age 31)
Secretary, July 2005 to present; Assistant Secretary, September 2004 to June 2005 | Employed by Unified Fund Services, Inc., the Trust’s administrator, since January 2004 and from December 1999 to January 2002; Student at Indiana University School of Law – Indianapolis, J.D. Candidate in December 2007; Assistant Secretary of Dean Family of Funds since August 2004; Regional Administrative Assistant of The Standard Register Company from February 2003 to January 2004; Full time student at Indiana University from January 2002 to June 2002; Secretary of AmeriPrime Advisors Trust from July 2005 to September 2005, Assistant Secretary from September 2004 to June 2005; Assistant Secretary of AmeriPrime Funds from September 2004 to July 2005; Assistant Secretary of CCMI Funds from September 2004 to March 2005. |
* The address for each officer is 2960 N. Meridian St. Suite 300, Indianapolis, IN 46208.
** The Trust currently consists of 37 series.
OTHER INFORMATION
The Fund’s Statement of Additional Information (“SAI”) includes information about the trustees and is available, without charge, upon request. You may call toll-free (800) 470-1029 to request a copy of the SAI or to make shareholder inquiries.
PROXY VOTING
A description of the policies and procedures that the Fund uses to determine how to vote proxies relating to portfolio securities and information regarding how the Fund voted those proxies during the most recent twelve month period ended June 30, is available without charge upon request by (1) calling the Funds at (800) 470-1029 and (2) from Fund documents filed with the Securities and Exchange Commission (“SEC”) on the SEC’s website at www.sec.gov.
TRUSTEES
Stephen A. Little, Chairman
Gary E. Hippenstiel
Daniel J. Condon
Ronald C. Tritschler
OFFICERS
Anthony J. Ghoston, President
John Swhear, Senior Vice President
J. Michael Landis, Interim Chief Financial Officer and Treasurer
Heather A. Bonds, Secretary
Lynn Wood, Chief Compliance Officer
INVESTMENT ADVISER
Pekin Singer Strauss Asset Management, Inc.
21 S. Clark Street
Suite 3325
Chicago, IL 60603
DISTRIBUTOR
Unified Financial Securities, Inc.
2960 North Meridian Street, Suite 300
Indianapolis, IN 46208
INDEPENDENT REGISTERED PUBLIC ACCOUNTING FIRM
Cohen Fund Audit Services, Ltd.
800 Westpoint Parkway, Suite 1100
Westlake, OH 44145
LEGAL COUNSEL
Thompson Coburn LLP
One US Bank Plaza
St. Louis, MO 63101
LEGAL COUNSEL TO THE INDEPENDENT TRUSTEES
Thompson Hine, LLP
312 Walnut Street, 14th Floor
Cincinnati, OH 45202
CUSTODIAN
Huntington National Bank
41 South Street
Columbus, OH 43125
ADMINISTRATOR, TRANSFER AGENT AND FUND ACCOUNTANT
Unified Fund Services, Inc.
2960 North Meridian Street, Suite 300
Indianapolis, IN 46208
This report is intended only for the information of shareholders or those who have received the Fund’s prospectus which contains information about the Fund’s management fee and expenses. Please read the prospectus carefully before investing.
Distributed by Unified Financial Securities, Inc.
Member FINRA/SIPC

Annual Report
November 30, 2007
Fund Adviser:
Symons Capital Management, Inc.
650 Washington Road, Suite 800
Pittsburgh, PA 15228
Toll Free (877) 679-6667
www.symonsfunds.com
November 30th, 2007
Letter to Shareholders
We want to thank all of our shareholders for their support and loyalty over the past year. Symons Capital Management constantly strives both to produce superior long-term returns and to provide excellent service and accessibility.
Symons Capital Management is happy to announce that effective January 1st, 2008 we will be inactivating our 12b-1 plan, thus lowering expenses in the funds, which ultimately benefits our shareholders. We view this action as a positive step in continuing to work hard for our shareholders as we seek superior long-term performance.
Our Symons Alpha Growth (SAGIX) and Symons Alpha Value (SAVIX) Institutional Funds had a challenging but positive period of performance for the period ended November 30th, 2007. The Symons Alpha Growth Institutional Fund was up 2.16% since inception (December 22, 2006) through November 30th, 2007 versus the Russell 3000 Growth Index return of 12.24%. The Symons Alpha Value Institutional Fund was up 4.22% since inception (December 22, 2006) through November 30th, 2007 versus the Russell 3000 Value Index return of 0.69%.
As fears of the economy slowing have increased, investors have taken action. This has generally happened in two ways. First, people have reached for safety stocks, such as Pepsi (PEP). This has generally helped our investments, as one of our areas of focus has been safety stocks. Second, people have invested in stocks that they think can create strong earnings growth even in a slowing economy, such as Apple (AAPL). We haven’t participated as much in those stocks. In general, we emphasize temporarily beaten down stocks. That works well for us over long periods of time, but can make us underperform when people bid up high quality, expensive stocks. There’s nothing wrong with investing in those stocks, it’s just not an area where we tend to have great participation, as we often view the risks as too high.
Over the past several quarters we have increased our holdings of safety stocks - particularly food, beverage and drug stocks - that historically perform well in a slowing economy. While this has protected us from some of the worst areas, such as many financials, it has kept us from some of the high-P/E big growers. We view this as a reasonable tradeoff, as, especially in a high risk environment, opportunity is easier to make up than losses.
Portfolio Management
The big question these days concerns credit markets. While institutions have tried to insist that the problems only involve subprime mortgages, that looks increasingly unlikely, as more leaks appear. While we expect that we haven’t come close to hearing the end of these credit market problems, we also have to note that regulators are working very hard to allay these problems. While it wouldn’t be surprising to see a short term rally in financials, we still don’t think it’s time to broadly embrace financials.
The combination of patience and a lack of leverage has rewarded us over the long-term. With our five to ten year investment horizon, we don't get too excited about one quarter or even one year - whether times are good or bad. Investors with a long investment horizon have a real advantage, because investment decisions can be based on long-term business fundamentals.
We have continued to emphasize risk-averse portfolio management. People have been investing in riskier and more leveraged assets since 2003. Only in the third quarter did people embracing that risk finally start to suffer losses. The tight commercial paper market continues, resulting in continuing liquidity pressures, notwithstanding the Fed's action to reduce those pressures. We have what appears to be the biggest bank failure (Netbank (NTBK.PK)) since the savings and loan crisis in the early 1990s. Financial companies are beginning to report losses on assets, to reluctantly make loans to replace customers' un-sellable commercial paper, and to adjust some earnings estimates to the downside. In our view, risk hasn't gone away. It will take time for the desire to invest in risky assets to abate. It is hard for some investors to admit that risk still exists, and to give up the false hope that the problems are solved. There are a host of factors that concern us, which we view as issues to analyze and adjust to: high energy prices, high food prices, a falling dollar that creates a greater risk of inflation, and a weak housing market. These factors can hit consumers' pocketbooks, which have been the primary engine behind our economic growth for several years.
As we have said before, we prefer to be fully invested. But we are constantly balancing the opportunity lost by being too cautious and holding cash, with the risk of price declines if we are too optimistic about individual stock valuations. Perhaps we can call this dilemma opportunistic patience or being opportunistically defensive. We held a fair amount of cash through much of this decline, which has enabled us to pick up some strong companies at a discount. While it is too early to determine the result of our action, in the past such discipline has served investors well.
Portfolio Holdings
In the Symons Alpha Value Institutional Fund, we sold Eastman Kodak (EK). While EK has some interesting businesses, it is in crowded fields and we concluded its future competitive risks are too great. We sold Devon Energy (DVN) because we viewed the stock price as a bit too high at this point. We bought Dean Foods (DF), a large dairy company that has been hurt by high milk prices. We bought UST (UST), a producer of wine and smokeless tobacco products. The purchase of Estee Lauder (EL) is a fairly boring pick, which strikes us as perfect for the current environment. The stock has been in its current general price range since 1999, while its financial statements have been slowly improving. EL increasingly generates revenue worldwide, including China, and thus should benefit from a weakening dollar. We bought Wendy's (WEN), which consistently scores well for taste versus competitors, but has operated poorly. If it can get its operating margins anywhere close to its competitors, we feel WEN should be a much better received company.
In the Symons Alpha Growth Institutional Fund, we sold Chesapeake Energy (CHK) for reasons similar to Devon, cited above. We sold Citrix Systems (CTXS) after holding it less than a year. Like Kodak, Citrix has some interesting network solutions, but it is are in crowded fields with big challenges. We sold Allstate (ALL) a few weeks after we bought it, which may be a record turnaround for us. The stock sold off (and we bought it) when the credit markets first seized up, and then it rebounded without any additional information on the value of its credit-based assets. Finally, we bought Cameco (CCJ), a uranium mining company. Recent troubles caused the stock to drop by about a third, but we like the long-term potential of uranium as a power plant fuel. Similar to Allstate, the stock rebounded without any notable information and so we sold it after 3 months.
Our safety stocks didn't look too safe
It goes without saying that we had a challenging few quarters, specifically in the Symons Alpha Growth Institutional Fund. Across all of the Symons Institutional Funds we had a barbell approach -- having a good portion of stocks (largely energy) to participate aggressively in upside potential, and a basket of stocks designed to deal with the potential for a slowing economy. In this case, however, the worry wasn't about a slowing economy at all. It was about a liquidity event. This was a liquidity event, where investors suddenly put a much bigger premium on liquidity versus anything else, including quality of stocks. Thus, the stocks that really outperformed during the 4th quarter were the mega-cap stocks that could handle all of the investors and hedge-funds rushing for the exit doors and then immediately back in. In addition to the momentum stocks, which we do not participate.
What could we have done differently? Not much, unless we want to accept far higher turnover than we currently have and stray from our long-term investment horizon. Liquidity events are generally measured in weeks and months, and while they can help create some underperforming quarterly comparisons, it doesn't make sense to us to create a portfolio on the basis of marginal liquidity.
Risk exists!
The embracement of risk has been on the rise since 2003. In general, the end of a bull market is the time we will tend to do worst. What tends to happen is that investors flock to stocks that they feel are immune to the slowdown, whatever the price. Thus, you get somewhat bizarre moves in things like solar stocks, Chinese stocks, and transaction based financials. Since we tend to be very sensitive to price, we tend to not participate. The same thing happened in 2000 with the tech boom, and while we looked bad for a while, in the end it was a good decision for the long-term. Our general attraction to ugly companies does us no favors in a beauty pageant market like we have seen in the 4th quarter, but in the long-term such a discipline has served us well.
In the end, our long-term performance is what we are focused on. We always try to remind our clients not to get too excited over one good or bad quarter, or even one good or bad year. There is a tendency for investors to get pretty excited during good times, and pretty depressed during bad times. Just as we try to get people to look at the broader context in good times, we would urge people to consider the broader theme here. Our cautious embracing of risk since 2003 has allowed us to enjoy excess returns since then. The 4th quarter just takes away a small portion of that long-term performance.
Future Considerations
For the long-term future, we are quite comfortable with the United States equity markets, which are the most liquid, diverse equity markets in the world. We have a remarkable economy. It is not simply due to our natural resources, our normally liquid capital markets, and our diverse, sophisticated manufacturing base. Even more important is the culture of the United States. Our cultural heritage gives us great intangible wealth in the form of both well-educated human capital and highly stable social institutions - property rights, civil rights and the general "rule of law." This cultural heritage is a critical component of the "Wealth of Our Nation."
And finally, thank you for your business and support as we continue to steadily focus on doing the best job we can for you, our shareholders.
Sincerely,
Michael P. Czajka | Colin E. Symons, CFA |
President & CEO | Chief Investment Officer |
Investment Results

The performance quoted represents past performance, which does not guarantee future results. The investment return and principal value of an investment will fluctuate so that an investor’s shares, when redeemed, may be worth more or less than their original cost. The returns shown do not reflect deduction of taxes that a shareholder would pay on Fund distributions or the redemption of Fund shares. Current performance of the Fund may be lower or higher than the performance quoted. The Fund’s investment objectives, risks, charges and expenses must be considered carefully before investing. Performance data current to the most recent month end may be obtained by calling 1-877-679-6667.
* Return figures reflect any change in price per share and assume the reinvestment of all distributions.
** The Index is an unmanaged benchmark that assumes reinvestment of all distributions and excludes the effect of taxes and fees. The Russell 3000 Growth Index is a widely recognized unmanaged index of equity prices and is representative of a broader market and range of securities than is found in the Fund’s portfolio. Individuals cannot invest directly in this Index; however, an individual can invest in exchange traded funds or other investment vehicles that attempt to track the performance of a benchmark index.

The chart above assumes an initial investment of $10,000 made on December 22, 2006 (commencement of Fund operations) and held through November 30, 2007. THE FUND’S RETURN REPRESENTS PAST PERFORMANCE AND DOES NOT GUARANTEE FUTURE RESULTS. The returns shown do not reflect deduction of taxes that a shareholder would pay on Fund distributions or the redemption of Fund shares. Investment returns and principal values will fluctuate so that your shares, when redeemed, may be worth more or less than their original purchase price.
The Russell 3000 Growth Index is a widely recognized unmanaged index of common stock prices and is representative of a broader market and range of securities than is found in the Fund’s portfolio. Individuals cannot invest directly in the Index; however, an individual can invest in exchange-traded funds or other investment vehicles that attempt to track the performance of a benchmark index. The Index returns do not include expenses, which have been deducted from the Fund’s return. These performance figures include the change in value of the stocks in the Index plus the reinvestment of dividends and are not annualized. Current performance may be lower or higher than the performance data quoted. For more information on the Fund, and to obtain performance data current to the most recent month-end, or to request a prospectus, please call 1-877-679-6667. You should carefully consider the investment objectives, potential risks, management fees, and charges and expenses of the Fund before investing. The Fund’s prospectus contains this and other information about the Fund, and should be read carefully before investing.
The Fund is distributed by Unified Financial Securities, Inc., member FINRA.
Investment Results

The performance quoted represents past performance, which does not guarantee future results. The investment return and principal value of an investment will fluctuate so that an investor’s shares, when redeemed, may be worth more or less than their original cost. The returns shown do not reflect deduction of taxes that a shareholder would pay on Fund distributions or the redemption of Fund shares. Current performance of the Fund may be lower or higher than the performance quoted. The Fund’s investment objectives, risks, charges and expenses must be considered carefully before investing. Performance data current to the most recent month end may be obtained by calling 1-877-679-6667.
* Return figures reflect any change in price per share and assume the reinvestment of all distributions.
** The Index is an unmanaged benchmark that assumes reinvestment of all distributions and excludes the effect of taxes and fees. The Russell 3000 Value Index is a widely recognized unmanaged index of equity prices and is representative of a broader market and range of securities than is found in the Fund’s portfolio. Individuals cannot invest directly in this Index; however, an individual can invest in exchange traded funds or other investment vehicles that attempt to track the performance of a benchmark index.

The chart above assumes an initial investment of $10,000 made on December 22, 2006 (commencement of Fund operations) and held through November 30, 2007. THE FUND’S RETURN REPRESENTS PAST PERFORMANCE AND DOES NOT GUARANTEE FUTURE RESULTS. The returns shown do not reflect deduction of taxes that a shareholder would pay on Fund distributions or the redemption of Fund shares. Investment returns and principal values will fluctuate so that your shares, when redeemed, may be worth more or less than their original purchase price.
The Russell 3000 Value Index is a widely recognized unmanaged index of common stock prices and is representative of a broader market and range of securities than is found in the Fund’s portfolio. Individuals cannot invest directly in the Index; however, an individual can invest in exchange-traded funds or other investment vehicles that attempt to track the performance of a benchmark index. The Index returns do not include expenses, which have been deducted from the Fund’s return. These performance figures include the change in value of the stocks in the Index plus the reinvestment of dividends and are not annualized. Current performance may be lower or higher than the performance data quoted. For more information on the Fund, and to obtain performance data current to the most recent month-end, or to request a prospectus, please call 1-877-679-6667. You should carefully consider the investment objectives, potential risks, management fees, and charges and expenses of the Fund before investing. The Fund’s prospectus contains this and other information about the Fund, and should be read carefully before investing.
The Fund is distributed by Unified Financial Securities, Inc., member FINRA.
FUND HOLDINGS – (Unaudited)
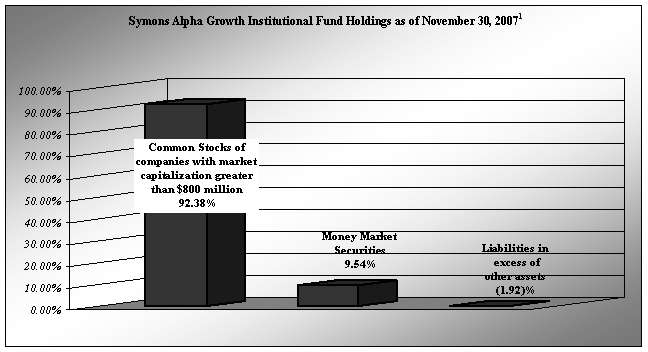
1As a percent of net assets.
The Alpha Growth Fund seeks to achieve its objective by investing in a diversified portfolio of companies with market capitalizations above approximately $800 million that are trading at attractive prices, and that appear to have strong potential for capital appreciation over the long-term.
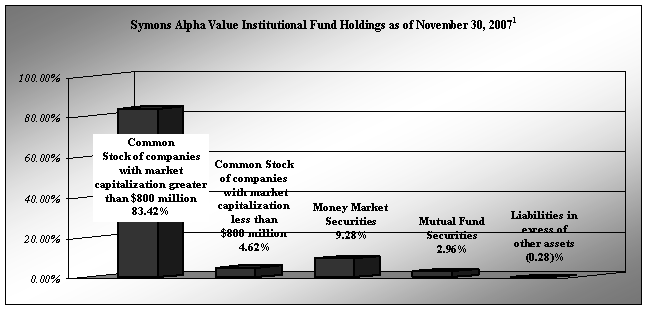
1As a percent of net assets.
The Alpha Value Fund seeks to achieve its objective by investing in a diversified portfolio of companies with market capitalizations above approximately $800 million that are trading at attractive prices, and that appear to have limited downside price risk over the long-term.
Availability of Portfolio Schedule – (Unaudited)
The Funds each file a complete schedule of portfolio holdings with the Securities and Exchange Commission (“SEC”) for the first and third quarters of each fiscal year on Form N-Q. The Funds’ Forms N-Q are available at the SEC’s website at www.sec.gov. The Funds’ Forms N-Q may be reviewed and copied at the Public Reference Room in Washington DC. Information on the operation of the Public Reference Room may be obtained by calling 1-800-SEC-0330.
Summary of Funds’ Expenses – (Unaudited)
As a shareholder of one of the Funds, you incur two types of costs: (1) transaction costs, including short-term redemption fees; and (2) ongoing costs, including management fees and other Fund expenses. This example is intended to help you understand your ongoing costs (in dollars) of investing in each Fund and to compare these costs with the ongoing costs of investing in other mutual funds. The example is based on an investment of $1,000 invested at the beginning of the period (June 1, 2007) and held for the entire period (through November 30, 2007).
Actual Expenses
The first line of each table below provides information about actual account values and actual expenses. You may use the information in this line, together with the amount you invested, to estimate the expenses that you paid over the period. Simply divide your account value by $1,000 (for example, an $8,600 account value divided by $1,000 = 8.60), then multiply the result by the number in the first line under the heading entitled “Expenses Paid During Period” to estimate the expenses you paid on your account during this period.
Hypothetical Example for Comparison Purposes
The second line of each table below provides information about hypothetical account values and hypothetical expenses based on the Funds’ actual expense ratios and an assumed rate of return of 5% per year before expenses, which is not either of the Fund’s actual returns. The hypothetical account values and expenses may not be used to estimate the actual ending account balance or expenses you paid for the period. You may use this information to compare the ongoing costs of investing in each Fund and other funds. To do so, compare this 5% hypothetical example with the 5% hypothetical examples that appear in the shareholder reports of the other funds.
Please note that the expenses shown in the table are meant only to highlight your ongoing costs and do not reflect any transactional costs, such as short-term redemption fees. Therefore, the second line is useful in comparing ongoing costs only and will not help you determine the relative costs of owning different funds. In addition, if these transactions costs were included, your costs would have been higher.
Symons Alpha Growth Institutional Fund | Beginning Account Value June 1, 2007 | Ending Account Value November 30, 2007 | Expenses Paid During the Period* June 1, 2007 - November 30, 2007 |
Actual | $1,000.00 | $924.82 | $7.21 |
Hypothetical ** | $1,000.00 | $1,017.58 | $7.55 |
*Expenses are equal to the Fund’s annualized expense ratio of 1.49%, multiplied by the average account value over the period, multiplied by 183/365 (to reflect the partial year period).
** Assumes a 5% return before expenses.
Symons Alpha Value Institutional Fund | Beginning Account Value June 1, 2007 | Ending Account Value November 30, 2007 | Expenses Paid During the Period* June 1, 2007 - November 30, 2007 |
Actual | $1,000.00 | $955.05 | $7.30 |
Hypothetical ** | $1,000.00 | $1,017.60 | $7.54 |
*Expenses are equal to the Fund’s annualized expense ratio of 1.49%, multiplied by the average account value over the period, multiplied by 183/365 (to reflect the partial year period).
** Assumes a 5% return before expenses.
Symons Institutional Funds | ||||||
Symons Alpha Growth Institutional Fund | ||||||
Schedule of Investments | ||||||
November 30, 2007 | ||||||
|
|
|
|
|
|
|
|
|
|
|
|
|
|
|
|
|
|
|
|
|
Common Stocks - 92.38% |
|
| Shares |
| Value | |
|
|
|
|
|
|
|
Beverages - 8.61% |
|
|
|
|
| |
Constellation Brands, Inc. - Class A (a) |
|
| 31,420 |
| $ 739,941 | |
PepsiCo, Inc. |
|
|
| 12,910 |
| 996,394 |
|
|
|
|
|
| 1,736,335 |
|
|
|
|
|
|
|
Books: Publishing or Publishing & Printing - 4.45% |
|
|
|
|
| |
Scholastic Corp. (a) |
|
| 25,470 |
| 897,563 | |
|
|
|
|
|
|
|
Bottled & Canned Soft Drinks & Carbonated Waters - 4.37% |
|
|
|
| ||
Cadbury Schweppes plc (b) |
|
| 17,100 |
| 881,847 | |
|
|
|
|
|
|
|
Dolls & Stuffed Toys - 3.56% |
|
|
|
|
| |
Mattel, Inc. |
|
|
| 35,990 |
| 719,080 |
|
|
|
|
|
|
|
Drilling Oil & Gas Wells - 3.73% |
|
|
|
|
| |
Nabors Industries, Ltd. (a) |
|
| 27,950 |
| 751,855 | |
|
|
|
|
|
|
|
Electromedical & Electrotherapeutic Apparatus - 1.99% |
|
|
|
|
| |
Advanced Medical Optics, Inc. (a) |
|
| 15,950 |
| 402,259 | |
|
|
|
|
|
|
|
Fats & Oils - 4.58% |
|
|
|
|
| |
Archer-Daniels-Midland Co. |
|
| 25,400 |
| 923,290 | |
|
|
|
|
|
|
|
Gold and Silver Ores - 6.12% |
|
|
|
|
| |
Coeur d' Alene Mines Corp. (a) |
|
| 174,810 |
| 728,958 | |
Harmony Gold Mining Co., Ltd. (a) (b) |
|
| 48,370 |
| 504,983 | |
|
|
|
|
|
| 1,233,941 |
|
|
|
|
|
|
|
Heating Equipment, Except Electric & Warm Air & Plumbing Fixtures - 3.14% |
|
| ||||
Fortune Brands, Inc. |
|
| 8,275 |
| 634,279 | |
|
|
|
|
|
|
|
Operative Builders - 1.69% |
|
|
|
|
| |
KB HOME |
|
|
| 16,330 |
| 341,134 |
|
|
|
|
|
|
|
Perfumes, Cosmetics & Other Toilet Preparations - 2.48% |
|
|
|
|
| |
Bare Escentuals, Inc. (a) |
|
| 23,750 |
| 499,937 | |
|
|
|
|
|
|
|
Pharmaceutical Preparations - 4.74% |
|
|
|
|
| |
Pfizer, Inc. |
|
|
| 40,270 |
| 956,815 |
|
|
|
|
|
|
|
Radiotelephone Communications - 4.03% |
|
|
|
|
| |
NII Holdings, Inc. (a) |
|
| 14,730 |
| 812,507 | |
|
|
|
|
|
|
|
Retail - Catalog & Mail-Order Houses - 1.76% |
|
|
|
|
| |
NutriSystem, Inc. (a) |
|
| 14,090 |
| 354,363 | |
|
|
|
|
|
|
|
Retail - Drug Stores and Proprietary Stores - 4.08% |
|
|
|
|
| |
Walgreen Co. |
|
|
| 22,470 |
| 822,177 |
|
|
|
|
|
|
|
Retail - Eating & Drinking Places - 2.86% |
|
|
|
|
| |
Starbucks Corp. (a) |
|
|
| 24,640 |
| 576,330 |
*See accompanying notes which are an integral part of these financial statements.
Symons Institutional Funds | ||||||
Symons Alpha Growth Institutional Fund | ||||||
Schedule of Investments - continued | ||||||
November 30, 2007 | ||||||
|
|
|
|
|
|
|
|
|
|
|
|
|
|
|
|
|
|
|
|
|
Common Stocks - 92.38% - continued |
|
| Shares |
| Value | |
|
|
|
|
|
|
|
Retail - Eating Places - 6.25% |
|
|
|
|
| |
McDonald's Corp. |
|
| 13,330 |
| $ 779,405 | |
Panera Bread Co. - Class A (a) |
|
| 12,000 |
| 480,840 | |
|
|
|
|
|
| 1,260,245 |
|
|
|
|
|
|
|
Retail - Grocery Stores - 4.34% |
|
|
|
|
| |
Whole Foods Market, Inc. |
|
| 20,360 |
| 875,684 | |
|
|
|
|
|
|
|
Semiconductors & Related Devices - 8.80% |
|
|
|
|
| |
Advanced Micro Devices, Inc. (a) |
|
| 62,720 |
| 612,147 | |
Broadcom Corp. - Class A (a) |
|
| 29,670 |
| 793,376 | |
QLogic Corp. (a) |
|
|
| 27,360 |
| 369,907 |
|
|
|
|
|
| 1,775,430 |
|
|
|
|
|
|
|
Services - Miscellaneous Amusement & Recreation - 3.36% |
|
|
|
|
| |
Ameristar Casinos, Inc. |
|
| 21,580 |
| 677,396 | |
|
|
|
|
|
|
|
Services - Motion Picture & Video Tape Production - 3.00% |
|
|
|
|
| |
DreamWorks Animation SKG, Inc. - Class A (a) |
|
| 23,000 |
| 604,900 | |
|
|
|
|
|
|
|
Surgical & Medical Instruments & Apparatus - 4.44% |
|
|
|
|
| |
Boston Scientific Corp. (a) |
|
| 70,840 |
| 894,709 | |
|
|
|
|
|
|
|
TOTAL COMMON STOCKS (Cost $19,966,744) |
|
|
|
| 18,632,076 | |
|
|
|
|
|
|
|
Money Market Securities - 9.54% |
|
|
|
|
| |
|
|
|
|
|
|
|
Fidelity Institutional Money Market Portfolio, 4.96% (c) |
|
| 1,924,578 |
| 1,924,578 | |
|
|
|
|
|
|
|
TOTAL MONEY MARKET SECURITIES (Cost $1,924,578) |
|
|
| 1,924,578 | ||
|
|
|
|
|
|
|
TOTAL INVESTMENTS (Cost $21,891,322) - 101.92% |
|
|
|
| $ 20,556,654 | |
|
|
|
|
|
|
|
Liabilities in excess of other assets - (1.92)% |
|
|
|
| (386,610) | |
|
|
|
|
|
|
|
TOTAL NET ASSETS - 100.00% |
|
|
|
| $ 20,170,044 | |
|
|
|
|
|
|
|
|
|
|
|
|
|
|
(a) Non-income producing. |
|
|
|
|
| |
(b) American Depositary Receipt. |
|
|
|
|
| |
(c) Variable rate security; the money market rate shown represents the rate at November 30, 2007. |
| |||||
*See accompanying notes which are an integral part of these financial statements.
Symons Institutional Funds |
|
|
|
| |
Symons Alpha Value Institutional Fund |
|
|
|
| |
Schedule of Investments |
|
|
|
| |
November 30, 2007 |
|
|
|
| |
|
|
|
|
|
|
|
|
|
|
|
|
|
|
|
|
|
|
Common Stocks - 88.04% |
| Shares |
| Value | |
|
|
|
|
|
|
Agriculture Product - 4.03% |
|
|
|
| |
Fresh Del Monte Produce, Inc. (a) |
| 5,550 |
| $ 171,606 | |
|
|
|
|
|
|
Biological Products, No Diagnostic Substances - 3.92% |
|
|
|
| |
Amgen, Inc. (a) |
|
| 3,025 |
| 167,131 |
|
|
|
|
|
|
Canned, Frozen & Preserved Fruit, Vegetables - 2.40% |
|
|
|
| |
Corn Products International, Inc. |
| 2,600 |
| 102,258 | |
|
|
|
|
|
|
Crude Petroleum & Natural Gas - 2.21% |
|
|
|
| |
Energy Partners, Ltd. (a) |
| 7,602 |
| 94,113 | |
|
|
|
|
|
|
Drilling Oil & Gas Wells - 2.95% |
|
|
|
| |
Hercules Offshore, Inc. (a) |
| 5,040 |
| 126,050 | |
|
|
|
|
|
|
Electric Services - 2.15% |
|
|
|
| |
Southern Co. |
|
| 2,440 |
| 91,793 |
|
|
|
|
|
|
Food & Kindred Products - 9.05% |
|
|
|
| |
Kraft Foods, Inc. - Class A |
| 6,160 |
| 212,828 | |
Sara Lee Corp. |
|
| 10,280 |
| 173,012 |
|
|
|
|
| 385,840 |
|
|
|
|
|
|
Games, Toys, & Childrens Vehicles - 4.50% |
|
|
|
| |
Hasbro, Inc. |
|
| 6,900 |
| 191,613 |
|
|
|
|
|
|
Gold & Silver Ores - 4.04% |
|
|
|
| |
Barrick Gold Corp. |
| 4,250 |
| 172,168 | |
|
|
|
|
|
|
Grain Mill Products - 4.97% |
|
|
|
| |
General Mills, Inc. |
| 3,520 |
| 211,728 | |
|
|
|
|
|
|
Ice Cream & Frozen Desserts - 2.77% |
|
|
|
| |
Dean Foods Co. |
|
| 4,740 |
| 118,216 |
|
|
|
|
|
|
Malt Beverages - 3.31% |
|
|
|
| |
Anheuser-Busch Companies, Inc. |
| 2,675 |
| 141,026 | |
|
|
|
|
|
|
Perfumes, Cosmetics & Other Toilet Preparations - 4.13% |
|
|
|
| |
The Estee Lauder Companies, Inc. - Class A |
| 3,920 |
| 175,930 | |
|
|
|
|
|
|
Pharmaceutical Preparations - 9.20% |
|
|
|
| |
GlaxoSmithKline plc (b) |
| 3,500 |
| 184,380 | |
King Pharmaceuticals, Inc. (a) |
| 4,500 |
| 47,655 | |
Eli Lilly & Co. |
|
| 3,020 |
| 159,909 |
|
|
|
|
| 391,944 |
*See accompanying notes which are an integral part of these financial statements.
Symons Institutional Funds |
|
|
|
| |
Symons Alpha Value Institutional Fund |
|
|
|
| |
Schedule of Investments - continued |
|
|
|
| |
November 30, 2007 |
|
|
|
| |
|
|
|
|
|
|
|
|
|
|
|
|
|
|
|
|
|
|
Common Stocks - 88.04% - continued |
| Shares |
| Value | |
|
|
|
|
|
|
Plastics Products - 3.82% |
|
|
|
| |
Newell Rubbermaid, Inc. |
| 6,080 |
| $ 162,822 | |
|
|
|
|
|
|
Radio Broadcasting Stations - 2.68% |
|
|
|
| |
Clear Channel Communications, Inc. |
| 3,180 |
| 114,162 | |
|
|
|
|
|
|
Retail - Eating Places - 2.96% |
|
|
|
| |
Wendys International, Inc. |
| 4,500 |
| 126,135 | |
|
|
|
|
|
|
Retail - Miscellaneous Shopping Goods Stores - 2.41% |
|
|
|
| |
Borders Group, Inc. |
| 8,200 |
| 102,582 | |
|
|
|
|
|
|
Retail - Radio, TV & Consumer Electronics Stores - 4.76% |
|
|
|
| |
Best Buy Co., Inc. |
| 3,970 |
| 202,669 | |
|
|
|
|
|
|
Sugar & Confectionery Products - 3.32% |
|
|
|
| |
The Hershey Co. |
|
| 3,550 |
| 141,680 |
|
|
|
|
|
|
Telecommunication - 2.84% |
|
|
|
| |
Telecom Corp. of New Zealand, Ltd. (b) |
| 7,386 |
| 121,278 | |
|
|
|
|
|
|
Telecommunications Equipment Fiber Optics - 2.01% |
|
|
|
| |
JDS Uniphase Corp. (a) |
| 6,350 |
| 85,471 | |
|
|
|
|
|
|
Tobacco Products - 3.61% |
|
|
|
| |
UST, Inc. |
|
| 2,660 |
| 154,014 |
|
|
|
|
|
|
TOTAL COMMON STOCKS (Cost $3,807,392) |
|
|
| 3,752,229 | |
|
|
|
|
|
|
Unit Investment Trust - 2.96% |
|
|
|
| |
|
|
|
|
|
|
Enerplus Resources Fund |
| 3,090 |
| 126,288 | |
|
|
|
|
|
|
TOTAL UNIT INVESTMENT TRUST (Cost $133,430) |
|
|
| 126,288 | |
|
|
|
|
|
|
Money Market Securities - 9.28% |
|
|
|
| |
|
|
|
|
|
|
Fidelity Institutional Money Market Portfolio, 4.96% (c) |
| 395,396 |
| 395,396 | |
|
|
|
|
|
|
TOTAL MONEY MARKET SECURITIES (Cost $395,396) |
|
| 395,396 | ||
|
|
|
|
|
|
TOTAL INVESTMENTS (Cost $4,336,218) - 100.28% |
|
|
| $ 4,273,913 | |
|
|
|
|
|
|
Liabilities in excess of other assets - (0.28)% |
|
|
| (11,769) | |
|
|
|
|
|
|
TOTAL NET ASSETS - 100.00% |
|
|
| $ 4,262,144 | |
|
|
|
|
|
|
(a) Non-income producing. |
|
|
|
|
(b) American Depositary Receipt. |
|
|
|
|
(c) Variable rate security; the money market rate shown represents the rate at November 30, 2007. | ||||
*See accompanying notes which are an integral part of these financial statements.
Symons Institutional Funds |
|
|
|
|
|
|
|
Statements of Assets and Liabilities |
|
|
|
|
|
|
|
November 30, 2007 |
|
|
|
|
|
|
|
|
|
|
|
|
|
|
|
|
|
|
|
| Symons Alpha |
| Symons Alpha |
|
|
|
|
| Growth Institutional |
| Value Institutional |
|
|
|
|
| Fund |
| Fund |
Assets |
|
|
|
|
|
|
|
Investment in securities: |
|
|
|
|
|
|
|
At cost |
|
|
|
| $ 21,891,322 |
| $ 4,336,218 |
At value |
|
|
|
| $ 20,556,654 |
| $ 4,273,913 |
|
|
|
|
|
|
|
|
Receivable for fund shares sold |
|
|
|
| 18,805 |
| - |
Dividends receivable |
|
|
|
| 67,536 |
| 9,914 |
Interest receivable |
|
|
|
| 12,186 |
| 1,933 |
Prepaid expenses |
|
|
|
| 9,543 |
| 8,803 |
Receivable due from Adviser (a) |
|
|
|
| 5,196 |
| 888 |
Total assets |
|
|
|
| 20,669,920 |
| 4,295,451 |
|
|
|
|
|
|
|
|
Liabilities |
|
|
|
|
|
|
|
Payable for investments purchased |
|
| 453,396 |
| - | ||
Payable for fund shares purchased |
|
| 7,057 |
| - | ||
Payable to administrator, transfer agent, and fund accountant |
|
| 13,801 |
| 13,510 | ||
Payable to trustees and officers |
|
|
|
| 1,913 |
| 1,913 |
Payable to custodian |
|
|
|
| 3,282 |
| 1,634 |
Accrued 12b-1 fees |
|
|
|
| 4,110 |
| 863 |
Other accrued expenses |
|
|
|
| 16,317 |
| 15,387 |
Total liabilities |
|
|
|
| 499,876 |
| 33,307 |
|
|
|
|
|
|
|
|
Net Assets |
|
|
|
| $ 20,170,044 |
| $ 4,262,144 |
|
|
|
|
|
|
|
|
Net Assets consist of: |
|
|
|
|
|
|
|
Paid in capital |
|
|
|
| $ 21,370,824 |
| $ 4,225,073 |
Accumulated undistributed net investment income |
|
| 63,612 |
| 22,863 | ||
Accumulated undistributed net realized gain from investment transactions |
| 70,276 |
| 76,513 | |||
Net unrealized (depreciation) on investments |
|
| (1,334,668) |
| (62,305) | ||
|
|
|
|
|
|
|
|
Net Assets |
|
|
|
| $ 20,170,044 |
| $ 4,262,144 |
|
|
|
|
|
|
|
|
Shares outstanding (unlimited number of shares authorized) |
|
| 1,975,984 |
| 409,607 | ||
|
|
|
|
|
|
|
|
|
|
|
|
|
|
|
|
Net Asset Value and offering price per share |
|
| $ 10.21 |
| $ 10.41 | ||
|
|
|
|
|
|
|
|
Redemption price per share (Net Asset Value * 98%) (b) |
|
| $ 10.01 |
| $ 10.20 | ||
|
|
|
|
|
|
|
|
(a) See Note 3 in the Notes to the Financial Statements. | |||||||
(b) The Funds charge a 2% redemption fee on shares redeemed within 60 calendar days of purchase. | |||||||
Shares are redeemed at the net asset value if held longer than 60 calendar days. | |||||||
*See accompanying notes which are an integral part of these financial statements.
Symons Institutional Funds | ||||||||
Statements of Operations | ||||||||
For the period ended November 30, 2007 (a) | ||||||||
|
| Symons Alpha |
| Symons Alpha | ||||
|
| Growth Institutional |
| Value Institutional | ||||
|
| Fund |
| Fund | ||||
|
|
|
|
| ||||
Investment Income |
|
|
|
| ||||
Dividend income (net of withholding tax of $134 and $1,325 respectively) |
| $ 112,682 |
| $ 37,994 | ||||
Interest income |
| 70,254 |
| 14,656 | ||||
Total Income |
| 182,936 |
| 52,650 | ||||
| ||||||||
Expenses |
|
|
|
| ||||
Investment adviser fee (b) |
| 79,331 |
| 19,835 | ||||
Administration expenses |
| 29,970 |
| 29,970 | ||||
Transfer agent expenses |
| 29,853 |
| 29,476 | ||||
Fund accounting expenses |
| 24,724 |
| 24,724 | ||||
Registration expenses |
| 20,590 |
| 20,035 | ||||
12b-1 fee |
| 19,833 |
| 4,959 | ||||
Custodian expenses |
| 16,729 |
| 8,011 | ||||
Audit expenses |
| 11,475 |
| 11,475 | ||||
Legal expenses |
| 7,540 |
| 7,540 | ||||
CCO expenses |
| 5,042 |
| 5,042 | ||||
Trustee expenses |
| 4,477 |
| 4,477 | ||||
Pricing expenses |
| 3,063 |
| 3,157 | ||||
Miscellaneous expenses |
| 2,688 |
| 2,338 | ||||
Report printing expenses |
| 1,143 |
| 1,082 | ||||
24f-2 expenses |
| 670 |
| 130 | ||||
Total Expenses |
| 257,128 |
| 172,251 | ||||
Fees waived and expenses reimbursed by Adviser (b) |
| (137,832) |
| (142,522) | ||||
Net operating expenses |
| 119,296 |
| 29,729 | ||||
Net investment income |
| 63,640 |
| 22,921 | ||||
|
|
|
|
|
|
|
|
|
|
|
|
|
|
|
|
|
|
Realized & Unrealized Gain (Loss) |
|
|
|
|
|
| ||
Net realized gain on investment securities |
| 70,276 |
| 76,513 | ||||
Change in unrealized appreciation (depreciation) |
|
|
|
| ||||
on investment securities |
| (1,334,668) |
| (62,305) | ||||
Net realized and unrealized gain (loss) on investment securities |
| (1,264,392) |
| 14,208 | ||||
Net increase (decrease) in net assets resulting from operations |
| $ (1,200,752) |
| $ 37,129 | ||||
|
|
|
|
|
|
|
|
|
|
|
|
|
|
|
|
|
|
(a) For the period December 22, 2006 (Commencement of Operations) to November 30, 2007. | ||||||||
(b) See Note 3 in the Notes to the Financial Statements. | ||||||||
*See accompanying notes which are an integral part of these financial statements.
Symons Institutional Funds |
|
|
|
|
|
Statements of Changes In Net Assets |
| Symons Alpha |
| Symons Alpha |
|
|
| Growth |
| Value |
|
|
| Institutional |
| Institutional |
|
|
| Fund |
| Fund |
|
|
|
|
|
|
|
|
| Period ended November 30, 2007 | (a) | ||
Operations |
|
|
|
|
|
Net investment income |
| $ 63,640 |
| $ 22,921 |
|
Net realized gain on investment securities |
| 70,276 |
| 76,513 |
|
Change in unrealized appreciation (depreciation) |
|
|
|
|
|
on investment securities |
| (1,334,668) |
| (62,305) |
|
Net increase (decrease) in net assets resulting from operations |
| (1,200,752) |
| 37,129 |
|
|
|
|
|
|
|
Distributions |
|
|
|
|
|
From net investment income |
| (28) |
| (58) |
|
Total distributions |
| (28) |
| (58) |
|
|
|
|
|
|
|
Capital Share Transactions |
|
|
|
|
|
Proceeds from shares sold |
| 21,711,616 |
| 4,236,179 |
|
Reinvestment of distributions |
| 28 |
| 58 |
|
Amount paid for shares repurchased |
| (340,820) |
| (11,164) |
|
Net increase in net assets resulting |
|
|
|
|
|
from share transactions |
| 21,370,824 |
| 4,225,073 |
|
|
|
|
|
|
|
Total Increase in Net Assets |
| 20,170,044 |
| 4,262,144 |
|
|
|
|
|
|
|
Net Assets |
|
|
|
|
|
Beginning of period |
| - |
| - |
|
|
|
|
|
|
|
End of period |
| $ 20,170,044 |
| $ 4,262,144 |
|
|
|
|
|
|
|
Accumulated undistributed net investment income |
|
|
|
|
|
included in net assets at end of period |
| $ 63,612 |
| $ 22,863 |
|
|
|
|
|
|
|
Capital Share Transactions |
|
|
|
|
|
Shares sold |
| 2,008,230 |
| 410,675 |
|
Shares issued in reinvestment of distributions |
| 3 |
| 6 |
|
Shares repurchased |
| (32,249) |
| (1,074) |
|
|
|
|
|
|
|
Net increase from capital share transactions |
| 1,975,984 |
| 409,607 | ` |
|
|
|
|
|
|
|
|
|
|
|
|
(a) For the period December 22, 2006 (Commencement of Operations) to November 30, 2007. |
| ||||
*See accompanying notes which are an integral part of these financial statements.
Symons Institutional Funds |
|
|
|
|
|
| ||
Financial Highlights |
|
|
|
|
|
|
| |
(For a share outstanding throughout the period) | Symons Alpha |
| Symons Alpha |
| ||||
|
|
|
|
| Growth |
| Value |
|
|
|
|
|
| Institutional |
| Institutional |
|
|
|
|
|
| Fund |
| Fund |
|
|
|
|
|
|
|
|
|
|
|
|
|
|
| Period ended November 30, 2007 | (a) | ||
|
|
|
|
|
|
|
|
|
Selected Per Share Data: |
|
|
|
|
|
|
| |
Net asset value, beginning of period |
|
| $ 10.00 |
| $ 10.00 |
| ||
Income from investment operations: |
|
|
|
|
|
| ||
Net investment income |
|
|
| 0.04 |
| 0.07 |
| |
Net realized and unrealized gain on investments |
| 0.18 | (b) | 0.35 |
| |||
Total income from investment operations |
| 0.22 |
| 0.42 |
| |||
|
|
|
|
|
|
|
|
|
Less distributions: |
|
|
|
|
|
|
| |
From net investment income |
|
| (0.01) |
| (0.01) |
| ||
Total distributions |
|
|
| (0.01) |
| (0.01) |
| |
|
|
|
|
|
|
|
|
|
Paid in capital from redemption fees (c) |
|
| - |
| - |
| ||
|
|
|
|
|
|
|
|
|
Net asset value, end of period |
|
| $ 10.21 |
| $ 10.41 |
| ||
|
|
|
|
|
|
|
|
|
Total Return (d)(e) |
|
|
| 2.16% |
| 4.22% |
| |
|
|
|
|
|
|
|
|
|
Ratios and Supplemental Data: |
|
|
|
|
| |||
Net assets, end of period (000) |
|
|
| $ 20,170 |
| $ 4,262 |
| |
|
|
|
|
|
|
|
|
|
Ratio of expenses to average net assets (f) |
|
| 1.49% |
| 1.49% |
| ||
Ratio of expenses to average net assets |
|
|
|
|
|
| ||
before reimbursement (f) |
|
|
| 3.22% |
| 8.63% |
| |
Ratio of net investment income to |
|
|
|
|
|
| ||
average net assets (f) |
|
|
| 0.80% |
| 1.15% |
| |
Ratio of net investment income (loss) to |
|
|
|
|
| |||
average net assets before reimbursement (f) |
| (0.93)% |
| (5.99)% |
| |||
Portfolio turnover rate |
|
|
| 75.78% |
| 41.42% |
| |
(a) For the period December 22, 2006 (Commencement of Operations) to November 30, 2007.
(b) Realized and unrealized gains and losses per share in this caption are balancing amounts necessary to reconcile the change in net asset value per share in the period. It does not agree to the aggregate gains and losses in the statement of operations due to the fluctuation in share transactions in the period.
(c) Redemption fees resulted in less than $0.005 per share.
(d) Total return in the above table represents the rate that the investor would have earned or lost on an investment in the Fund, assuming reinvestment of dividends.
(e) Not annualized.
(f) Annualized.
*See accompanying notes which are an integral part of these financial statements.
Symons Institutional Funds
Notes to the Financial Statements
November 30, 2007
NOTE 1. ORGANIZATION
The Symons Alpha Growth Institutional Fund (the “Growth Fund”) and Symons Alpha Value Institutional Fund (the “Value Fund”) (each, a “Fund” and collectively, the “Funds”) were organized as diversified series of Unified Series Trust (the “Trust”) on November 13, 2006. The Trust is an open-end investment company established under the laws of Ohio by an Agreement and Declaration of Trust dated October 17, 2002 (the “Trust Agreement”). The Trust Agreement permits the Board of Trustees (the “Board”) to issue an unlimited number of shares of beneficial interest of separate series. Each Fund is one of a series of funds currently authorized by the Board. The investment adviser to the Funds is Symons Capital Management, Inc. (the “Adviser”). The Funds commenced operations on December 22, 2006. The Funds seek to provide long-term capital appreciation.
NOTE 2. SIGNIFICANT ACCOUNTING POLICIES
The following is a summary of significant accounting policies followed by the Funds in the preparation of their financial statements.
Securities Valuation - Equity securities are valued by using market quotations, but may be valued on the basis of prices furnished by a pricing service when the Adviser believes such prices more accurately reflect the fair market value of such securities. Securities that are traded on any stock exchange are valued by the pricing service at the last quoted sale price. Lacking a last sale price, an exchange traded security is valued by the pricing service at its last bid price. Securities traded in the NASDAQ over-the-counter market are valued by the pricing service at the NASDAQ Official Closing Price. When market quotations are not readily available, when the Adviser determines that the market quotation or the price provided by the pricing service does not accurately reflect the current market value or when restricted or illiquid securities are being valued, such securities are valued as determined in good faith by the Adviser in conformity with guidelines adopted by and subject to review by the Pricing Committee of the Board.
Fixed income securities are valued by using market quotations, but may be valued on the basis of prices furnished by a pricing service when the Adviser believes such prices more accurately reflect the fair market value of such securities. A pricing service utilizes electronic data processing techniques based on yield spreads relating to securities with similar characteristics to determine prices for normal institutional-size trading units of debt securities without regard to sale or bid prices. If the Adviser decides that a price provided by the pricing service does not accurately reflect the fair market value of the securities, when prices are not readily available from a pricing service or when restricted or illiquid securities are being valued, securities are valued at fair value as determined in good faith by the Adviser, in conformity with guidelines adopted by and subject to review of the Pricing Committee of the Board. Short-term investments in fixed income securities with maturities of less than 60 days when acquired, or which subsequently are within 60 days of maturity, are valued by using the amortized cost method of valuation, which the Board has determined will represent fair value. The ability of issuers of debt securities held by the Fund to meet their obligations may be affected by economic and political developments in a specific country or region.
In accordance with the Trust’s good faith pricing guidelines, the Adviser is required to consider all appropriate factors relevant to the value of securities for which it has determined other pricing sources are not available or reliable as described above. No single standard exists for determining fair value controls, since fair value depends upon the circumstances of each individual case. As a general principle, the current fair value of an issue of securities being valued by the Adviser would appear to be the amount which the owner might reasonably expect to receive for them upon their current sale. Methods which are in accordance with this principle may, for example, be based on (i) a multiple of earnings; (ii) a discount from market of a similar freely traded security (including a derivative security or a basket of securities traded on other markets, exchanges or among dealers); or (iii) yield to maturity with respect to debt issues, or a combination of these and other methods. Good faith pricing is permitted if, in the Adviser’s opinion, the validity of market quotations appears to be questionable based on factors such as evidence of a thin market in the security based on a small number of quotations, a significant event occurs after the close of a market but before the Fund’s NAV calculation that may affect a security’s value, or the Adviser is aware of any other data that calls into question the reliability of market quotations. Good faith pricing may also be used in instances where the bonds the Fund invests in default or otherwise cease to have market quotations readily available. Investments in foreign securities, junk bonds, or other thinly traded securities are more likely to trigger fair valuation than other securities.
Symons Institutional Funds
Notes to the Financial Statements - continued
November 30, 2007
NOTE 2. SIGNIFICANT ACCOUNTING POLICIES – continued
Federal Income Taxes – The Funds make no provision for federal income tax. Each Fund intends to continue to qualify each year as a “regulated investment company” under subchapter M of the Internal Revenue Code of 1986, as amended, by distributing all of its taxable income. If the required amount of net investment income is not distributed, a Fund could incur a tax expense.
Expenses – Expenses incurred by the Trust that do not relate to a specific fund of the Trust are allocated to the individual funds based on each fund’s relative net assets or another appropriate basis (as determined by the Board).
Security Transactions and Related Income - The Funds follow industry practice and record security transactions on the trade date. The specific identification method is used for determining gains or losses for financial statements and income tax purposes. Dividend income is recorded on the ex-dividend date and interest income is recorded on an accrual basis. Discounts and premiums on securities purchased are amortized or accreted using the effective interest method. Withholding taxes on foreign dividends have been provided for in accordance with the Funds’ understanding of the applicable country’s tax rules and rates.
Dividends and Distributions - The Funds intend to distribute substantially all of their net investment income as dividends to their shareholders on at least an annual basis. The Funds intend to distribute their net realized long-term capital gains and their net realized short-term capital gains at least once a year. Distributions to shareholders, which are determined in accordance with income tax regulations, are recorded on the ex-dividend date. The treatment for financial reporting purposes of distributions made to shareholders during the year from net investment income or net realized capital gains may differ from their ultimate treatment for federal income tax purposes. These differences are caused primarly by differences in the timing of the recognition of certain components of income, expense or realized capital gain for federal income tax purposes. Where such differences are permanent in nature, they are reclassified in the components of the net assets based on their ultimate characterization for federal income tax purposes. Any such reclassifications will have no effect on net assets, results of operations or net asset values per share of a Fund. For the period ended November 30, 2007, there were no such reclassifications.
Accounting for Uncertainty in Income Taxes – The Funds adopted the provisions of Financial Accounting Standards Board (FASB) Interpretation No. 48 (“FIN 48”), Accounting for Uncertainty in Income Taxes on June 29, 2007. The implementation of FIN 48 resulted in no material liability for unrecognized tax benefits and no material change to the beginning net asset value of the Funds.
As of and during the period ended November 30, 2007, the Funds did not have a liability for any unrecognized tax benefits. The Funds recognize interest and penalities, if any, related to unrecognized tax benefits as income tax expense in the statement of operations. During the period, the Funds did not incur any interest or penalities.
Fair Value Measurements – In September 2006, FASB issued Statement on Financial Accounting Standards (SFAS) No. 157 “Fair Value Measurements.” This standard establishes a single authoritative definition of fair value, sets out a framework for measuring fair value and requires additional disclosure about fair value measurements. SFAS No. 157 applies to fair value measurements already required or permitted by existing standards. SFAS No. 157 applies to fair value measurements already required or permitted by existing standards. SFAS No. 157 is effective for financial statements issued for fiscal years beginning after November 15, 2007 and interim periods within those fiscal years. The changes to current generally accepted accounting principles from the application of this Statement relate to the definition of fair value, the methods used to measure fair value, and the expanded disclosures about fair value measurements. As of November 30, 2007, the Funds do not believe that the adoption of SFAS No. 157 will impact the amounts reported in the financial statements; however, additional disclosures may be required about the inputs used to develop the measurements and the effect of certain measurements reported on the statement of changes in net assets for a fiscal period.
Symons Institutional Funds
Notes to the Financial Statements - continued
November 30, 2007
NOTE 3. FEES AND OTHER TRANSACTIONS WITH AFFILIATES
The Adviser of the Funds under the terms of the management agreements (the “Agreements”), manages the Funds’ investments subject to approval of the Board. As compensation for its management services, each Fund is obligated to pay the Adviser a fee computed and accrued daily and paid monthly at an annual rate of 1.00% of the average daily net assets of each Fund. For the period December 22, 2006 (commencement of operations) through November 30, 2007, the Adviser earned a fee of $79,331 and $19,835 from the Growth Fund and the Value Fund, respectively, before waiving a portion of those fees, as described below.
The Adviser has contractually agreed to waive its management fee and/or reimburse expenses so that total annual fund operating expenses, excluding brokerage fees and commissions, borrowing costs (such as interest and dividend expenses on securities sold short), taxes, extraordinary expenses, and any indirect expenses (such as expenses incurred by other investment companies in which the Funds invest) do not exceed 1.49% of each Fund’s average daily net assets through November 30, 2008. For the period December 22, 2006 (commencement of operations) through November 30, 2007, the Adviser waived fees and reimbursed expenses of $137,832 and $142,522 for the Growth Fund and the Value Fund, respectively. Each waiver or reimbursement by the Adviser with respect to a Fund is subject to repayment by that Fund within the three fiscal years following the fiscal year in which that particular waiver or reimbursement occurred, provided that the Fund is able to make the repayment without exceeding the 1.49% expense limitation. As of November 30, 2007, $137,832 and $142,522 is subject to repayment by the Growth Fund and the Value Fund, respectively, through November 30, 2010. At November 30, 2007, the Adviser owed $5,196 and $888 to the Growth Fund and the Value Fund, respectively.
The Trust retains Unified Fund Services, Inc. (“Unified”) to manage the Funds’ business affairs and to provide the Funds with administrative services, including all regulatory reporting and necessary office equipment and personnel. For the period December 22, 2006 (commencement of operations) through November 30, 2007, Unified earned fees of $29,970 and $29,970 for administrative services provided to the Growth Fund and the Value Fund, respectively. At November 30, 2007, Unified was owed $5,253 and $5,253 by the Growth Fund and the Value Fund, respectively, for administrative services. Certain officers of the Trust are members of management and/or employees of Unified. Unified operates as a wholly-owned subsidiary of Huntington Bancshares, Inc., the parent company of the principal distributor of the Funds and Huntington National Bank, the custodian of the Funds’ investments (the “Custodian”). For the period December 22, 2006 (commencement of operations) through November 30, 2007, the Custodian earned fees of $16,729 and $8,011 from the Growth Fund and the Value Fund, respectively, for custody services. At November 30, 2007, the Custodian was owed $3,282 and $1,634 by the Growth Fund and the Value Fund, respectively, for custody services.
The Trust retains Unified to act as each Fund’s transfer agent and to provide fund accounting services. For the period December 22, 2006 (commencement of operations) through November 30, 2007, Unified earned fees of $19,863 and $19,863 from the Growth Fund and the Value Fund, respectively, for transfer agent services and $9,990 and $9,613 from the Growth Fund and the Value Fund, respectively, in reimbursement for out-of-pocket expenses incurred in providing transfer agent services. At November 30, 2007, Unified was owed $3,012 and $3,015 by the Growth Fund and the Value Fund, respectively, for transfer agent services. At November 30, 2007, Unified was owed $1,369 and $1,075 by the Growth Fund and the Value Fund, respectively, for reimbursement of out-of-pocket expenses. For period December 22, 2006 (commencement of operations) through November 30, 2007, Unified earned fees of $24,724 and $24,724 from the Growth Fund and the Value Fund, respectively, for fund accounting services. At November 30, 2007, Unified was owed $4,167 and $4,167 by the Growth Fund and the Value Fund, respectively, for fund accounting services.
The Funds have adopted Distribution Plans pursuant to Rule 12b-1 under the Investment Company Act of 1940 (each a “Plan”, collectively, “Plans”). The Plans provide that each Fund will pay the Adviser and/or any registered securities dealer, financial institution or any other person (the “Recipient”) a shareholder servicing fee of 0.25% of the average daily net assets of each Fund in connection with the promotion and distribution of a Fund’s shares or the provision of personal services to shareholders, including, but not necessarily limited to, advertising, compensation to underwriters, dealers and selling personnel, the printing and mailing of prospectuses to other than current Fund shareholders, the printing and mailing of sales literature and servicing shareholder accounts (“12b-1 expenses”). The Funds or Adviser may
Symons Institutional Funds
Notes to the Financial Statements - continued
November 30, 2007
NOTE 3. FEES AND OTHER TRANSACTIONS WITH AFFILIATES - continued
pay all or a portion of these fees to any Recipient who renders assistance in distributing or promoting the sale of shares, or who provides certain shareholder services, pursuant to a written agreement. Each Plan is a compensation plan, which means that compensation is provided regardless of 12b-1 expenses actually incurred. It is anticipated that the Plans will benefit shareholders because an effective sales program typically is necessary in order for the Funds to reach and maintain a sufficient size to achieve efficiently its investment objectives and to realize economies of scale. For the period December 22, 2006 (commencement of operations) through November 30, 2007, the Growth Fund and Value Fund accrued 12b-1 fees of $19,833 and $4,959, respectively. As of November 30, 2007, Unified was owed $4,110 and $863 by the Growth Fund and the Value Fund, respectively, for 12b-1 fees.
Unified Financial Securities, Inc. (the “Distributor”) acts as the principal distributor of the Funds. There were no payments made by the Funds to the Distributor during the period December 22, 2006 (commencement of operations) through November 30, 2007. The Distributor, Unified and the Custodian are controlled by Huntington Bancshares, Inc.
NOTE 4. INVESTMENTS
For the period ended November 30, 2007, purchases and sales of investment securities, other than short-term investments and short-term U.S. government obligations, were as follows:

As of November 30, 2007, the net unrealized depreciation of investments for tax purposes was as follows:

At November 30, 2007, the aggregate cost of securities for federal income tax purposes was $21,998,100 for the Growth Fund and $4,340,526 for the Value Fund.
NOTE 5. ESTIMATES
The preparation of financial statements in conformity with accounting principles generally accepted in the United States of America requires management to make estimates and assumptions that affect the reported amounts of assets and liabilities and disclosure of contingent assets and liabilities at the date of the financial statements and the reported amounts of increases and decreases in net assets from operations during the reporting period. Actual results could differ from those estimates.
Symons Institutional Funds
Notes to the Financial Statements - continued
November 30, 2007
NOTE 6. BENEFICIAL OWNERSHIP
The beneficial ownership, either directly or indirectly, of 25% or more of the voting securities of a fund creates a presumption of control of a fund, under Section 2(a)(9) of the Investment Company Act of 1940. As of November 30, 2007, NFSC, for the benefit of its customers, owned 34.18% and 68.64% of the Growth Fund and the Value Fund, respectively. As of November 30, 2007, Ameritrade, Inc., for the benefit of its customers, owned 31.61% of the Growth Fund and Schwab, for the benefit of its customers, owned 27.86% of the Growth Fund. As a result, NFSC may be deemed to control each of the Funds and Schwab and Ameritrade may be deemed to control the Growth Fund.
NOTE 7. DISTRIBUTIONS TO SHAREHOLDERS
Growth Fund: On December 28, 2006 the Growth Fund paid an income distribution of $0.0056 per share to shareholders of record on December 27, 2006.
The tax characterization of distributions for the fiscal period ended November 30, 2007 was as follows:

On December 17, 2007, the Growth Fund paid an income distribution of $0.0315 per share and a short-term capital gain distribution of $0.0959 per share to shareholders of record on December 14, 2007.
Value Fund: On December 28, 2006, the Value Fund paid an income distribution of $0.0116 per share to shareholders of record on December 27, 2006.
The tax characterization of distributions for the fiscal period ended November 30, 2007 was as follows:

On December 17, 2007, the Value Fund paid an income distribution of $0.0558 per share and a short-term capital gain distribution of $0.1973 per share to shareholders of record on December 14, 2007.
Symons Institutional Funds
Notes to the Financial Statements - continued
November 30, 2007
NOTE 7. DISTRIBUTIONS TO SHAREHOLDERS - continued
As of November 30, 2007, the components of distributable earnings (accumulated losses) on a tax basis were as follows:

The difference between book basis and tax basis unrealized depreciation is attributable primarily to the tax deferral of losses on wash sales for both Funds.
NOTE 8. SUBSEQUENT EVENT
At a meeting of the Board of Trustees held on December 10, 2007, at the request of the Adviser, the Board of Trustees determined to terminate each Funds’ 12b-1 distribution plan, effective January 1, 2008. The elimination of the 0.25% 12b-1 fee will reduce expenses for shareholders.
REPORT OF INDEPENDENT REGISTERED PUBLIC ACCOUNTING FIRM
To The Shareholders and
Board of Trustees of
Symons Institutional Funds
(Unified Series Trust)
We have audited the accompanying statements of assets and liabilities, including the schedules of investments, of the Symons Institutional Funds (the “Funds”), comprising the Symons Alpha Growth Institutional Fund and the Symons Alpha Value Institutional Fund, each a series of the Unified Series Trust, as of November 30, 2007, and the related statements of operations and changes in net assets, and the financial highlights for the period December 22, 2006 (commencement of operations) through November 30, 2007. These financial statements and financial highlights are the responsibility of Fund management. Our responsibility is to express an opinion on these financial statements and financial highlights based on our audit.
We conducted our audit in accordance with the standards of the Public Company Accounting Oversight Board (United States). Those standards require that we plan and perform the audit to obtain reasonable assurance about whether the financial statements and financial highlights are free of material misstatement. An audit includes examining, on a test basis, evidence supporting the amounts and disclosures in the financial statements. Our procedures included confirmation of securities owned as of November 30, 2007, by correspondence with the Funds’ custodian and brokers. An audit also includes assessing the accounting principles used and significant estimates made by management, as well as evaluating the overall financial statement presentation. We believe that our audit provides a reasonable basis for our opinion.
In our opinion, the financial statements and financial highlights referred to above present fairly, in all material respects, the financial position of each of the Funds constituting the Symons Institutional Funds as of November 30, 2007 and the results of their operations, the changes in their net assets, and the financial highlights for the period then ended, in conformity with accounting principles generally accepted in the United States of America.
COHEN FUND AUDIT SERVICES, LTD.
Westlake, Ohio
January 24, 2008
TRUSTEES AND OFFICERS - (Unaudited)
The Board of Trustees supervises the business activities of the Trust. Each Trustee serves as a trustee until termination of the Trust unless the Trustee dies, resigns, retires or is removed.
The following tables provide information regarding the Trustees and officers.
Independent Trustees
Name, Address*, (Age), Position with Trust**, Term of Position with Trust | Principal Occupation During Past 5 Years and Other Directorships |
Gary E. Hippenstiel (Age 60)
Independent Trustee, December 2002 to present | Director, Vice President and Chief Investment Officer of Legacy Trust Company, N.A. since 1992; Chairman of the investment committee for W.H. Donner Foundation and Donner Canadian Foundation, since June 2005; Trustee of AmeriPrime Advisors Trust from July 2002 to September 2005; Trustee of Access Variable Insurance Trust from April 2003 to August 2005; Trustee of AmeriPrime Funds from 1995 to July 2005; Trustee of CCMI Funds from June 2003 to March 2005. |
Stephen A. Little (Age 61)
Chairman, December 2004 to present; Independent Trustee, December 2002 to present | President and founder of The Rose, Inc., a registered investment advisor, since April 1993; Trustee of AmeriPrime Advisors Trust from November 2002 to September 2005; Trustee of AmeriPrime Funds from December 2002 to July 2005; Trustee of CCMI Funds from June 2003 to March 2005. |
Daniel J. Condon (Age 57)
Independent Trustee, December 2002 to present | President of International Crankshaft Inc., an automotive equipment manufacturing company, since 2004, Vice President and General Manager from 1990 to 2003; Trustee of AmeriPrime Advisors Trust from November 2002 to September 2005; Trustee of The Unified Funds from 1994 to 2002; Trustee of Firstar Select Funds, a REIT mutual fund, from 1997 to 2000; Trustee of AmeriPrime Funds from December 2002 to July 2005; Trustee of CCMI Funds from June 2003 to March 2005. |
Ronald C. Tritschler (Age 55)
Independent Trustee, December 2002 to present | Chief Executive Officer, Director and Legal Counsel of The Webb Companies, a national real estate company, since 2001, Executive Vice President and Director from 1990 to 2000; Director of First State Financial since 1998; Director, Vice President and Legal Counsel of The Traxx Companies, an owner and operator of convenience stores, since 1989; Trustee of AmeriPrime Advisors Trust from November 2002 to September 2005; Trustee of AmeriPrime Funds from December 2002 to July 2005; Trustee of CCMI Funds from June 2003 to March 2005. |
Principal Officers
Name, Address*, (Age), Position with Trust,** Term of Position with Trust | Principal Occupation During Past 5 Years and Other Directorships |
| ||
Anthony J. Ghoston (Age 48)
President, July 2004 to present | President of Unified Fund Services, Inc., the Trust’s administrator, since June 2005, Executive Vice President from June 2004 to June 2005, Senior Vice President from April 2003 to June 2004; Senior Vice President and Chief Information Officer of Unified Financial Services, Inc., the parent company of the Trust’s administrator and distributor, from 1997 to November 2004; President of AmeriPrime Advisors Trust from July 2004 to September 2005; President of AmeriPrime Funds from July 2004 to July 2005; President of CCMI Funds from July 2004 to March 2005. |
| ||
John C. Swhear (Age 46)
Senior Vice President, May 2007 to present | Vice President of Legal Administration and Compliance for Unified Fund Services, Inc., the Trust’s administrator, since April, 2007; Chief Compliance Officer of Unified Financial Securities, Inc., the Trust’s distributor, since May 2007; Employed in various positions with American United Life Insurance Company from 1983 to April 2007, including: Associate General Counsel, April 2007, Investment Adviser Chief Compliance Officer, June 2004 to April 2007, Assistant Secretary to the Board of Directors, December 2002 to April 2007, Chief Compliance Officer of OneAmerica Funds, Inc., June 2004 to April 2007, Chief Counsel and Secretary, OneAmerica Securities, Inc., December 2002 to April 2007. |
| ||
J. Michael Landis (Age 36)
Interim Chief Financial Officer and Treasurer, March 2007 to present
| Vice President Fund Accounting and Fund Administration for Unified Fund Services, since October, 2006; Director of Fund Accounting and Fund Administration for PFPC July 2006 - October 2006; Manager Fund Accounting for Unified Fund Services November 2004 – July 2006; Manager Fund Accounting for Mellon Financial Corporation November 1998 – November 2004. |
| ||
Lynn E. Wood (Age 61)
Chief Compliance Officer, October 2004 to present | Chief Compliance Officer of AmeriPrime Advisors Trust from October 2004 to September 2005; Chief Compliance Officer of AmeriPrime Funds from October 2004 to July 2005; Chief Compliance Officer of CCMI Funds from October 2004 to March 2005; Chief Compliance Officer of Unified Financial Securities, Inc., the Trust’s distributor, from December 2004 to October 2005 and from 1997 to 2000, Chairman from 1997 to December 2004, President from 1997 to 2000; Director of Compliance of Unified Fund Services, Inc., the Trust’s administrator, from October 2003 to September 2004; Chief Compliance Officer of Unified Financial Services, Inc., the parent company of the Trust’s administrator and distributor, from 2000 to 2004. |
| ||
Heather Bonds (Age 31)
Secretary, July 2005 to present; Assistant Secretary, September 2004 to June 2005 | Employed by Unified Fund Services, Inc., the Trust’s administrator, since January 2004 and from December 1999 to January 2002; Student at Indiana University School of Law – Indianapolis, J.D. Candidate in December 2007; Assistant Secretary of Dean Family of Funds since August 2004; Regional Administrative Assistant of The Standard Register Company from February 2003 to January 2004; Full time student at Indiana University from January 2002 to June 2002; Secretary of AmeriPrime Advisors Trust from July 2005 to September 2005, Assistant Secretary from September 2004 to June 2005; Assistant Secretary of AmeriPrime Funds from September 2004 to July 2005; Assistant Secretary of CCMI Funds from September 2004 to March 2005. |
| ||
* The address for each officer is 2960 N. Meridian St. Suite 300, Indianapolis, IN 46208.
** The Trust currently consists of 37 series.
OTHER INFORMATION
The Funds Statement of Additional Information (“SAI”) includes information about the trustees and is available, without charge, upon request. You may call toll-free (877) 679-6667 to request a copy of the SAI or to make shareholder inquiries.
PROXY VOTING
A description of the policies and procedures that the Funds use to determine how to vote proxies relating to portfolio securities and information regarding how the Funds voted those proxies during the most recent twelve month period ended June 30, is available without charge upon request by (1) calling the Funds at (877) 679-6667 and (2) from Fund documents filed with the Securities and Exchange Commission (“SEC”) on the SEC’s website at www.sec.gov.
TRUSTEES
Stephen A. Little, Chairman
Gary E. Hippenstiel
Daniel J. Condon
Ronald C. Tritschler
OFFICERS
Anthony J. Ghoston, President
John Swhear, Senior Vice-President
J. Michael Landis, Interim Chief Financial Officer and Treasurer
Heather A. Bonds, Secretary
Lynn Wood, Chief Compliance Officer
INVESTMENT ADVISER
Symons Capital Management, Inc.
650 Washington Road, Suite 800
Pittsburgh, PA 15228
DISTRIBUTOR
Unified Financial Securities, Inc.
2960 North Meridian Street, Suite 300
Indianapolis, IN 46208
INDEPENDENT REGISTERED PUBLIC ACCOUNTING FIRM
Cohen Fund Audit Services, Ltd.
800 Westpoint Parkway, Suite 1100
Westlake, OH 44145
LEGAL COUNSEL
Thompson Coburn LLP
One US Bank Plaza
St. Louis, MO 63101
LEGAL COUNSEL TO THE INDEPENDENT TRUSTEES
Thompson Hine, LLP
312 Walnut Street, 14th Floor
Cincinnati, OH 45202
CUSTODIAN
Huntington National Bank
41 South Street
Columbus, OH 43125
ADMINISTRATOR, TRANSFER AGENT AND FUND ACCOUNTANT
Unified Fund Services, Inc.
2960 North Meridian Street, Suite 300
Indianapolis, IN 46208
This report is intended only for the information of shareholders or those who have received the Fund’s prospectus which contains information about the Fund’s management fee and expenses. Please read the prospectus carefully before investing.
Distributed by Unified Financial Securities, Inc.
Member FINRA/SIPC

Annual Report
November 30, 2007
Fund Advisor:
Chinook Capital Management, LLC
4380 SW Macadam Ave.
Suite 250
Portland, OR 97239
Toll Free (800) 440-6895
Management’s Discussion & Analysis
The Chinook Emerging Growth Fund generated a return of 9.30% outperforming the Russell 2000 Growth Index, which advanced 6.12% for the fiscal year covering December 1, 2006 through November 30, 2007. The Fund out performed its benchmark despite being underweighted in the materials, industrials and energy sectors, which contributed disproportionately to benchmark performance during this time period. Our investment style favors secular growth trends, which are more prevalent in technology, health care and consumer discretionary. Positive stock selection more than compensated for a lack of exposure to the more cyclical components of the benchmark.
Just a few examples of contributors to performance during the fiscal year were the following:
Volcom (VLCM), a maker of premium priced sports apparel was an early contributor as we sold the position early in the calendar year following a quick run up beyond our price target.
In the technology sector, Silicon Motion (SIMO), a provider of controller technology for removable memory, and DealerTrack (TRAK), which provides an electronic application network to auto dealerships and lenders, both contributed nicely to performance.
Examples of healthcare names that contributed to performance were Stericycle (SRCL), which processes healthcare waste, and ArthroCare (ARTC), a provider of orthopedic surgical devices.
Performance also benefited from several companies held by the Fund that were acquired by other companies at significant premiums. These holdings included Open Solutions (OPEN), Adeza Biopharmaceuticals (ADZA), WebEx Communications (WEBX), Kyphon (KYPH), and DJO, Inc. (DJO).
Examples of holdings that underperformed during the period include Cutera (CUTR), a provider of aesthetic lasers, Navigant Consulting (NCI), a business services firm, SRS Labs (SRSL), an audio technology company, and Websense (WBSN), which provides web monitoring technology.
We continue to rely on our experience, investment process, and disciplines in attempting to exceed benchmark returns. We employ a team-oriented approach in an effort to find exciting investment opportunities that represent compelling valuation characteristics. We will continue to own a majority of Fund holdings in the technology, healthcare, and consumer discretionary sectors. We also continue to focus on two types of stocks which give the portfolio diversity and balance; stable growth stocks of companies that have more seasoned managements, products and operating histories, along with opportunistic growth stocks which are typically short-lived companies with more embryonic products and growth potential.
We believe that we have invested in high quality growth companies that offer above average potential for earnings and cash flow growth. We remain committed to our disciplined investment approach and are confident that the Chinook Emerging Growth Fund has the continuing potential to generate long-term capital appreciation.
Investment Results (Unaudited)
|

The performance quoted represents past performance, which does not guarantee future results. The returns shown do not reflect deduction of taxes that a shareholder would pay on Fund distributions or the redemption of Fund shares.
* Return figures reflect any change in price per share and assume the reinvestment of all distributions.
** The Fund commenced operations on March 28, 2005. For performance calculations, the inception date is March 30, 2005, the date the Fund first began to invest in accordance with its stated objective.
*** The Index is an unmanaged benchmark that assumes reinvestment of all distributions and excludes the effect of taxes and fees. The Russell 2000 Growth Index is a widely recognized unmanaged index of equity prices and is representative of a broader market and range of securities than is found in the Fund’s portfolio. Individuals cannot invest directly in this Index; however, an individual can invest in exchange traded funds or other investment vehicles that attempt to track the performance of a benchmark index.

The chart above assumes an initial investment of $100,000 made on March 30, 2005 (commencement of Fund operations) and held through November 30, 2007. The Russell 2000 Growth Index is a widely recognized unmanaged index of equity prices and is representative of a broader market and range of securities than is found in the Fund’s portfolio. Individuals cannot invest directly in the index; however, an individual can invest in ETF’s or other investment vehicles that attempt to tract the performance of a benchmark index. THE FUND’S RETURN REPRESENTS PAST PERFORMANCE AND DOES NOT GUARANTEE FUTURE RESULTS. The returns shown do not reflect deduction of taxes that a shareholder would pay on Fund distributions or the redemption of Fund shares. Investment returns and principal values will fluctuate so that your shares, when redeemed, may be worth more or less than their original purchase price.
Current performance may be lower or higher than the performance data quoted. For more information on Fund and to obtain performance data current to the most recent month end, please call 1-800-440-6895. Investing in the Fund involves certain risks that are discussed in the Fund’s prospectus. Please read the prospectus carefully before you invest or send money.
The Fund is distributed by Unified Financial Securities, Inc., member FINRA.
Fund Holdings (Unaudited)

1As a percentage of net assets. |
The Fund invests primarily in common stocks of small-cap companies that the Fund’s advisor, Chinook Capital Management, LLC, believes offer growth opportunities at a reasonable price. Small-cap companies selected generally will have total market capitalizations that do not exceed $2 billion.
Availability of Portfolio Schedule
The Fund files its complete schedule of portfolio holdings with the Securities and Exchange Commission (“SEC”) for the first and third quarters of each fiscal year on Form N-Q. The Fund’s Forms N-Q are available at the SEC’s website at www.sec.gov. The Fund’s Forms N-Q may be reviewed and copied at the Public Reference Room in Washington DC. Information on the operation of the Public Reference Room may be obtained by calling 1-800-SEC-0330.
Summary of Fund’s Expenses (Unaudited)
As a shareholder of the Fund, you incur two types of costs: (1) transaction costs (such as short-term redemption fees); and (2) ongoing costs, including management fees and other Fund expenses. This Example is intended to help you understand your ongoing costs (in dollars) of investing in the Fund and to compare these costs with the ongoing costs of investing in other mutual funds. The Example is based on an investment of $1,000 invested at the beginning of the period and held for the six months period (June 1, 2007 through November 30, 2007).
Actual Expenses
The first line of the table below provides information about actual account values and actual expenses. You may use the information in this line, together with the amount you invested, to estimate the expenses that you paid over the period. Simply divide your account value by $1,000 (for example, an $8,600 account value divided by $1,000 = 8.60), then multiply the result by the number in the first line under the heading entitled “Expenses Paid During Period” to estimate the expenses you paid on your account during this period.
Hypothetical Example for Comparison Purposes
The second line of the table below provides information about hypothetical account values and hypothetical expenses based on the Fund’s actual expense ratio and an assumed rate of return of 5% per year before expenses, which is not the Fund’s actual return. The hypothetical account values and expenses may not be used to estimate the actual ending account balance or expenses you paid for the period. You may use this information to compare the ongoing costs of investing in the Fund and other funds. To do so, compare this 5% hypothetical example with the 5% hypothetical examples that appear in the shareholder reports of the other funds.
Expenses shown are meant to highlight your ongoing costs only and do not reflect any transactional costs such as the redemption fee imposed on short-term redemptions. The second line of the table below is useful in comparing ongoing costs only and will not help you determine the relative costs of owning different funds. If incurred, the short-term redemption fee imposed by the Fund would increase your expenses.
Chinook Emerging Growth Fund | Beginning Account Value June 1, 2007 | Ending Account Value November 30, 2007 | Expenses Paid during the Period June 1, 2007 - November 30, 2007 * |
Actual
| $1,000.00 | $993.33 | $7.35 |
Hypothetical**
| $1,000.00 | $1,017.69 | $7.44 |
* Expenses are equal to the Fund’s annualized expense ratio of 1.47%, multiplied by the average account value over the period, multiplied by 183/365 (to reflect the partial year period).
**Assumes a 5% return before expenses.
Chinook Emerging Growth Fund |
|
|
|
|
Schedule of Investments |
|
|
|
|
November 30, 2007 |
|
|
|
|
|
|
|
|
|
|
|
|
|
|
Common Stocks - 99.86% |
| Shares |
| Value |
|
|
|
|
|
Computer Communications Equipment - 6.14% |
|
|
|
|
Acme Packet, Inc. (a) |
| 43,768 |
| $ 538,346 |
Digi International, Inc. (a) |
| 27,064 |
| 416,244 |
|
|
|
| 954,590 |
|
|
|
|
|
Electromedical & Electrotherapeutic Apparatus - 1.37% |
|
|
|
|
ArthroCare Corp. (a) |
| 3,927 |
| 212,569 |
|
|
|
|
|
Footwear (No Rubber) - 3.48% |
|
|
|
|
Iconix Brand Group, Inc. (a) |
| 23,741 |
| 541,057 |
|
|
|
|
|
General Industrial Machinery & Equipment - 2.02% |
|
|
|
|
Twin Disc, Inc. |
| 5,054 |
| 314,005 |
|
|
|
|
|
Instruments for Measures & Testing of Electricity & Electrical Supplies - 1.69% |
|
|
| |
Exfo Electro-Optical Engineering, Inc. (a) |
| 50,448 |
| 263,339 |
|
|
|
|
|
Insurance Agents, Brokers& Service - 2.64% |
|
|
|
|
HealthExtras, Inc. (a) |
| 15,439 |
| 410,214 |
|
|
|
|
|
Laboratory Analytical Instruments - 2.75% |
|
|
|
|
Integra LifeSciences Holding (a) |
| 10,336 |
| 428,427 |
|
|
|
|
|
Measuring & Controlling Devices - 3.82% |
|
|
|
|
ION Geophysical Corp. (a) |
| 38,497 |
| 594,009 |
|
|
|
|
|
Pharmaceutical Preparations - 5.73% |
|
|
|
|
Medicis Pharmaceutical Corp. - Class A |
| 16,770 |
| 451,113 |
Sciele Pharma, Inc. (a) |
| 19,757 |
| 440,976 |
|
|
|
| 892,089 |
|
|
|
|
|
Retail - Apparel & Accessory Stores - 2.53% |
|
|
|
|
Aeropostale, Inc. (a) |
| 15,400 |
| 393,470 |
|
|
|
|
|
Retail - Catalog & Mail-Order Houses - 2.47% |
|
|
|
|
GSI Commerce, Inc. (a) |
| 14,686 |
| 383,598 |
|
|
|
|
|
Retail - Drug Stores and Proprietary Stores - 2.19% |
|
|
|
|
PetMed Express, Inc. (a) |
| 26,746 |
| 340,744 |
|
|
|
|
|
Retail - Eating Places - 2.09% |
|
|
|
|
Buffalo Wild Wings, Inc. (a) |
| 11,259 |
| 325,498 |
|
|
|
|
|
Retail - Miscellaneous Retail - 2.88% |
|
|
|
|
EZCORP, Inc. - Class A (a) |
| 35,725 |
| 448,706 |
|
|
|
|
|
*See accompanying notes which are an integral part of these financial statements.
Chinook Emerging Growth Fund |
|
|
|
|
Schedule of Investments - continued |
|
|
|
|
November 30, 2007 |
|
|
|
|
|
|
|
|
|
|
|
|
|
|
Common Stocks - 99.86% - continued |
| Shares |
| Value |
|
|
|
|
|
Security Brokers, Dealers & Flotation Companies - 3.51% |
|
|
|
|
optionsXpress Holdings, Inc. |
| 17,965 |
| $ 546,316 |
|
|
|
|
|
Semiconductors & Related Devices - 7.67% |
|
|
|
|
Advanced Analogic Technologies, Inc. (a) |
| 18,231 |
| 196,348 |
Diodes, Inc. (a) |
| 12,036 |
| 354,099 |
Silicon Motion Technology Corp. (a) (b) |
| 12,769 |
| 241,206 |
SiRF Technology Holdings, Inc. (a) |
| 16,701 |
| 402,327 |
|
|
|
| 1,193,980 |
|
|
|
|
|
Services - Advertising - 1.99% |
|
|
|
|
Global Sources Ltd. (a) |
| 10,194 |
| 310,203 |
|
|
|
|
|
Services - Business Services - 5.38% |
|
|
|
|
Liquidity Services, Inc. (a) |
| 26,950 |
| 321,783 |
Phase Forward, Inc. (a) |
| 9,482 |
| 231,361 |
TeleTech Holdings, Inc. (a) |
| 13,713 |
| 283,996 |
|
|
|
| 837,140 |
|
|
|
|
|
Services - Computer Integrated Systems Design - 5.57% |
|
|
|
|
DealerTrack Holdings, Inc. (a) |
| 8,613 |
| 366,397 |
Macrovision Corp. (a) |
| 20,094 |
| 500,743 |
|
|
|
| 867,140 |
|
|
|
|
|
Services - Computer Processing & Data Preparation - 3.34% |
|
|
|
|
CyberSource Corp. (a) |
| 26,903 |
| 393,053 |
The TriZetto Group, Inc. (a) |
| 8,198 |
| 126,495 |
|
|
|
| 519,548 |
|
|
|
|
|
Services - Computer Programming Services - 2.84% |
|
|
|
|
JDA Software Group, Inc. (a) |
| 21,120 |
| 442,253 |
|
|
|
|
|
Services - Legal Services - 2.38% |
|
|
|
|
CRA International, Inc. (a) |
| 7,994 |
| 369,803 |
|
|
|
|
|
Services - Management Consulting Services - 4.56% |
|
|
|
|
NIC, Inc. |
| 69,049 |
| 538,582 |
Rainmaker Systems, Inc. (a) |
| 24,881 |
| 170,435 |
|
|
|
| 709,017 |
|
|
|
|
|
Services - Miscellaneous Health & Allied Services - 3.37% |
|
|
|
|
Nighthawk Radiology Holdings, Inc. (a) |
| 24,829 |
| 524,885 |
|
|
|
|
|
*See accompanying notes which are an integral part of these financial statements.
Chinook Emerging Growth Fund |
|
|
|
|
Schedule of Investments - continued |
|
|
|
|
November 30, 2007 |
|
|
|
|
|
|
|
|
|
Common Stocks - 99.86% - continued |
| Shares |
| Value |
|
|
|
|
|
Services - Prepackaged Software - 8.65% |
|
|
|
|
Actuate Corp. (a) |
| 61,563 |
| $ 466,032 |
Blackbaud, Inc. |
| 22,177 |
| 631,157 |
Kenexa Corp. (a) |
| 12,827 |
| 248,459 |
|
|
|
| 1,345,648 |
|
|
|
|
|
Services - Specialty Outpatient Facilities - 3.35% |
|
|
|
|
Psychiatric Solutions, Inc. (a) |
| 14,287 |
| 521,904 |
|
|
|
|
|
Surgical & Medical Instruments & Apparatus - 5.45% |
|
|
|
|
ICU Medical, Inc. (a) |
| 11,787 |
| 437,534 |
LifeCell Corp. (a) |
| 10,109 |
| 409,920 |
|
|
|
| 847,454 |
|
|
|
|
|
TOTAL COMMON STOCKS (Cost $14,553,669) |
|
|
| 15,537,606 |
|
|
|
|
|
Money Market Securities - 0.32% |
|
|
|
|
Huntington Money Market Fund, 3.83% (c) |
| 49,966 |
| 49,966 |
|
|
|
|
|
TOTAL MONEY MARKET SECURITIES (Cost $49,966) |
|
|
| 49,966 |
|
|
|
|
|
TOTAL INVESTMENTS (Cost $14,603,635) - 100.18% |
|
|
| $ 15,587,572 |
|
|
|
|
|
Liabilities in excess of other assets - (0.18)% |
|
|
| (28,694) |
|
|
|
|
|
TOTAL NET ASSETS - 100.00% |
|
|
| $ 15,558,878 |
|
|
|
|
|
|
|
|
|
|
(a) Non-income producing. |
|
|
|
|
(b) American Depositary Receipt. |
|
|
|
|
(c) Variable rate security; the money market rate shown represents the rate at November 30, 2007. |
| |||
*See accompanying notes which are an integral part of these financial statements.
Chinook Emerging Growth Fund |
|
Statement of Assets and Liabilities |
|
November 30, 2007 |
|
|
|
|
|
|
|
Assets |
|
Investments in securities, at fair value (cost $14,603,635) | $ 15,587,572 |
Interest receivable | 1,244 |
Dividend receivable | 1,885 |
Receivable for fund shares sold | 420 |
Prepaid expenses | 12,144 |
Total assets | 15,603,265 |
|
|
Liabilities |
|
Payable for fund shares purchased | 2,361 |
Payable to administrator, fund accountant, and transfer agent | 12,351 |
Payable to advisor (a) | 8,012 |
Payable to custodian | 2,092 |
Payable to trustees and officers | 1,919 |
Other accrued expenses | 17,652 |
Total liabilities | 44,387 |
|
|
Net Assets | $ 15,558,878 |
|
|
Net Assets consist of: |
|
Paid in capital | $ 14,316,327 |
Accumulated undistributed net realized gain from investment transactions | 258,614 |
Net unrealized appreciation on investments | 983,937 |
|
|
Net Assets | $ 15,558,878 |
|
|
Shares outstanding (unlimited number of shares authorized) | 1,633,153 |
|
|
Net Asset Value and offering price per share | $ 9.53 |
|
|
Redemption price per share ($9.53 * 99%) (b) | $ 9.43 |
|
|
|
|
(a) See Note 3 in the Notes to the Financial Statements. |
|
(b) The Fund charges a 1.00% redemption fee on shares redeemed within 30 calendar days of purchase. | |
Shares are redeemed at the Net Asset Value if held longer than 30 calendar days. |
|
*See accompanying notes which are an integral part of these financial statements.
Chinook Emerging Growth Fund |
|
Statement of Operations |
|
For the fiscal year ended November 30, 2007 |
|
|
|
|
|
|
|
Investment Income |
|
Dividend income | $ 44,766 |
Interest income | 22,109 |
Total Investment Income | 66,875 |
|
|
Expenses |
|
Investment advisor fee (a) | 139,312 |
Administration expenses | 31,500 |
Transfer agent expenses | 19,744 |
Fund accounting expenses | 19,333 |
Auditing expenses | 16,350 |
Legal expenses | 15,194 |
Registration expenses | 10,411 |
Custodian expenses | 8,080 |
CCO expenses | 5,067 |
Trustee expenses | 4,536 |
Pricing expenses | 3,528 |
Printing expenses | 1,793 |
Insurance expenses | 1,272 |
Miscellaneous expenses | 2,916 |
Total Expenses | 279,036 |
Less: Fees waived by Advisor (a) | (88,270) |
Net operating expenses | 190,766 |
Net Investment (Loss) | (123,891) |
|
|
|
|
Realized & Unrealized Gain (Loss) on Investments |
|
Net realized gain on investment securities | 332,411 |
Change in unrealized appreciation (depreciation) |
|
on investment securities | 450,984 |
Net realized and unrealized gain on investment securities | 783,395 |
Net increase in net assets resulting from operations | $ 659,504 |
|
|
(a) See Note 3 in the Notes to the Financial Statements. |
|
*See accompanying notes which are an integral part of these financial statements.
Chinook Emerging Growth Fund |
|
|
|
Statements of Changes In Net Assets |
|
|
|
|
|
|
|
|
|
|
|
| Year Ended |
| Year Ended |
| November 30, 2007 |
| November 30, 2006 |
Operations |
|
|
|
Net investment (loss) | $ (123,891) |
| $ (148,438) |
Net realized gain on investment securities | 332,411 |
| 3,040,303 |
Change in unrealized appreciation (depreciation) on investment securities | 450,984 |
| (1,711,290) |
Net increase in net assets resulting from operations | 659,504 |
| 1,180,575 |
|
|
|
|
Distributions |
|
|
|
From net realized gain | (2,089,797) |
| (506,998) |
Total distributions | (2,089,797) |
| (506,998) |
|
|
|
|
Capital Share Transactions |
|
|
|
Proceeds from Fund shares sold | 14,530,622 |
| 1,865,722 |
Reinvestment of distributions | 2,089,797 |
| 506,998 |
Amount paid for Fund shares repurchased | (6,495,307) |
| (12,143,940) |
Net increase (decrease) in net assets resulting |
|
|
|
from capital share transactions | 10,125,112 |
| (9,771,220) |
|
|
|
|
Total Increase (Decrease) in Net Assets | 8,694,819 |
| (9,097,643) |
|
|
|
|
Net Assets |
|
|
|
Beginning of year | 6,864,059 |
| 15,961,702 |
|
|
|
|
End of year | $ 15,558,878 |
| $ 6,864,059 |
|
|
|
|
Accumulated net investment income |
|
|
|
included in net assets at end of period | $ - |
| $ - |
|
|
|
|
Capital Share Transactions |
|
|
|
Shares sold | 1,428,773 |
| 149,931 |
Shares issued in reinvestment of distributions | 227,679 |
| 43,296 |
Shares repurchased | (550,453) |
| (985,722) |
|
|
|
|
Net increase (decrease) from capital share transactions | 1,105,999 |
| (792,495) |
*See accompanying notes which are an integral part of these financial statements.
Chinook Emerging Growth Fund |
|
|
|
|
|
|
Financial Highlights |
|
|
|
|
|
|
(For a share outstanding during the period) |
|
|
|
|
|
|
|
|
|
|
|
|
|
| Year Ended |
| Year Ended |
| Period Ended |
|
| November |
| November |
| November |
|
| 30, 2007 |
| 30, 2006 |
| 30, 2005 | (a) |
|
|
|
|
|
|
|
Selected Per Share Data: |
|
|
|
|
|
|
Net asset value, beginning of period | $ 13.02 |
| $ 12.10 |
| $ 10.00 |
|
|
|
|
|
|
|
|
Income from investment operations: |
|
|
|
|
|
|
Net investment (loss) | (0.08) |
| (0.28) |
| (0.12) |
|
Net realized and unrealized gain on investments | 0.96 |
| 1.67 |
| 2.22 |
|
Total from investment operations | 0.88 |
| 1.39 |
| 2.10 |
|
|
|
|
|
|
|
|
Less Distributions to shareholders: |
|
|
|
|
|
|
From net realized gain | (4.37) |
| (0.47) |
| - |
|
Total distributions | (4.37) |
| (0.47) |
| - |
|
|
|
|
|
|
|
|
Paid in capital from redemption fees | - | (b) | - |
| - |
|
|
|
|
|
|
|
|
Net asset value, end of period | $ 9.53 |
| $ 13.02 |
| $ 12.10 |
|
|
|
|
|
|
|
|
Total Return (c) | 9.30% |
| 11.93% |
| 21.00% | (d) |
|
|
|
|
|
|
|
Ratios and Supplemental Data: |
|
|
|
|
|
|
Net assets, end of period (000) | $ 15,559 |
| $ 6,864 |
| $ 15,961 |
|
Ratio of expenses to average net assets | 1.61% | (f) | 1.85% |
| 1.85% | (e) |
Ratio of expenses to average net assets |
|
|
|
|
|
|
before reimbursement | 2.35% |
| 2.82% |
| 2.37% | (e) |
Ratio of net investment income (loss) to |
|
|
|
|
|
|
average net assets | (1.05)% |
| (1.65)% |
| (1.58)% | (e) |
Ratio of net investment income (loss) to |
|
|
|
|
|
|
average net assets before reimbursement | (1.79)% |
| (2.62)% |
| (2.10)% | (e) |
Portfolio turnover rate | 122.74% |
| 126.87% |
| 85.33% |
|
(a) For the period March 28, 2005 (the date the Fund commenced operations) through November 30, 2005; except performance calculations which use the inception date of March 30, 2005, the date the Fund first began to invest in its stated objective.
(b) Redemption fees resulted in less than $0.005 per share.
(c) Total return in the above table represents the rate that the investor would have earned or lost on an investment in the Fund, assuming reinvestment of dividends.
(d) Not annualized.
(e) Annualized.
(f) Effective May 31, 2007, the Fund contractually agreed to reduce its expense cap from 1.85% to 1.40%. As a result, the expense ratio shown reflects an expense cap of 1.85% for the period December 1, 2006 to May 30, 2007 and an expense cap of 1.40% for the period May 31, 2007 to November 30, 2007.
*See accompanying notes which are an integral part of these financial statements.
Chinook Emerging Growth Fund
Notes to the Financial Statements
November 30, 2007
NOTE 1. ORGANIZATION |
Chinook Emerging Growth Fund (the “Fund”) was organized as a diversified series of the Unified Series Trust (the “Trust”) on September 13, 2004. The Trust is an open-end investment company established under the laws of Ohio by an Agreement and Declaration of Trust dated October 17, 2002 (the “Trust Agreement”). The Trust Agreement permits the Board of Trustees to issue an unlimited number of shares of beneficial interest of separate series. The Fund is one of a series of funds currently authorized by the Board of Trustees. The Fund commenced operations on March 28, 2005. For performance calculations, the inception date is March 30, 2005, the date the Fund first began to invest in accordance with its stated objective. The investment advisor to the Fund is Chinook Capital Management, LLC (the “Advisor”). The investment objective of the Fund is to provide long-term capital appreciation.
NOTE 2. SIGNIFICANT ACCOUNTING POLICIES
The following is a summary of significant accounting policies followed by the Fund in the preparation of its financial statements.
Securities Valuations - Equity securities are valued by using market quotations, but may be valued on the basis of prices furnished by a pricing service when the Advisor believes such prices more accurately reflect the fair market value of such securities. Securities that are traded on any stock exchange are generally valued by the pricing service at the last quoted sale price. Lacking a last sale price, an exchange traded security is generally valued by the pricing service at its last bid price. Securities traded in the NASDAQ over-the-counter market are generally valued by the pricing service at the NASDAQ Official Closing Price. When market quotations are not readily available, when the Advisor determines that the market quotation or the price provided by the pricing service does not accurately reflect the current market value or when restricted or illiquid securities are being valued, such securities are valued as determined in good faith by the Advisor, in conformity with guidelines adopted by and subject to review by the Board of Trustees of the Trust (the “Board”).
Fixed income securities are valued by using market quotations, but may be valued on the basis of prices furnished by a pricing service when the Advisor believes such prices accurately reflect the fair market value of such securities. A pricing service utilizes electronic data processing techniques based on yield spreads relating to securities with similar characteristics to determine prices for normal institutional-size trading units of debt securities without regard to sale or bid prices. If the Advisor decides that a price provided by the pricing service does not accurately reflect the fair market value of the securities, when prices are not readily available from a pricing service or when restricted or illiquid securities are being valued, securities are valued at fair value as determined in good faith by the Advisor, in conformity with guidelines adopted by and subject to review of the Board. Short-term investments in fixed income securities with maturities of less than 60 days when acquired, or which subsequently are within 60 days of maturity, are valued by using the amortized cost method of valuation, which the Board has determined will represent fair value. The ability of issuers of debt securities held by the company to meet their obligations may be affected by economic and political developments in a specific country or region.
In accordance with the Trust’s good faith pricing guidelines, the Advisor is required to consider all appropriate factors relevant to the value of securities for which it has determined other pricing sources are not available or reliable as described above. No single standard exists for determining fair value controls, since fair value depends upon the circumstances of each individual case. As a general principle, the current fair value of an issue of securities being valued by the Advisor would appear to be the amount which the owner might reasonably expect to receive for them upon their current sale. Methods which are in accord with this principle may, for example, be based on (i) a multiple of earnings; (ii) a discount from market of a similar freely traded security (including a derivative security or a basket of securities traded on other markets, exchanges or among dealers); or (iii) yield to maturity with respect to debt issues, or a combination of these and other methods. Good faith pricing is permitted if, in the Adviser’s opinion, the validity of market quotations appears to be questionable based on factors such as evidence of a thin market in the security based on a small number of quotations, a significant event occurs after the close of a market but before the Fund’s NAV calculation that may affect a security’s value, or the Advisor is aware of any other data that calls into question the reliability of market quotations. Investments in foreign securities, junk bonds, or other thinly traded securities are more likely to trigger fair valuation than other securities.
Chinook Emerging Growth Fund
Notes to the Financial Statements – continued
November 30, 2007
NOTE 2. SIGNIFICANT ACCOUNTING POLICIES – continued
Federal Income Taxes – The Fund makes no provision for federal income tax. The Fund intends to qualify each year as a “regulated investment company” under subchapter M of the Internal Revenue Code of 1986, as amended, by distributing all of its net investment income and net realized capital gains. If the required amount of net investment income is not distributed, the Fund could incur a tax expense.
Security Transactions and Related Income - The Fund follows industry practice and records security transactions on the trade date. The specific identification method is used for determining gains or losses for financial statements and income
tax purposes. Dividend income is recorded on the ex-dividend date and interest income is recorded on an accrual basis. Discounts and premiums on securities purchased are amortized or accreted using the effective interest method. Withholding taxes on foreign dividends have been provided for in accordance with the Fund’s understanding of the applicable country’s tax rules and rates.
Expenses – Expenses incurred by the Trust that do not relate to a specific fund of the Trust are allocated to the individual funds based on each fund’s relative net assets or other appropriate basis (as determined by the Board).
Dividends and Distributions – Distributions to shareholders, which are determined in accordance with income tax regulations, are recorded on the ex-dividend date. The Fund intends to distribute its net realized long-term capital gains and its net realized short-term capital gains at least once a year. The treatment for financial reporting purposes of distributions made to shareholders during the year from net investment income or net realized capital gains may differ from their ultimate treatment for federal income tax purposes. These differences are caused primarily by differences in the timing of the recognition of certain components of income, expenses or realized capital gain for federal income tax purposes. Where such differences are permanent in nature, they are reclassified in the components of the net assets based on their ultimate characterization for federal income tax purposes. Any such reclassifications will have no effect on net assets, results of operations or net asset values per share of the Fund. For the fiscal year ended November 30, 2007, net investment loss in the amount of $67,080 was reclassified to short-term capital gain and $56,811 was reclassified to paid-in-capital.
Accounting for Uncertainty in Income Taxes - In June 2006, the Financial Accounting Standards Board (FASB) issued FASB Interpretation No. 48 – Accounting for Uncertainty in Income Taxes that requires the tax effects of certain tax positions to be recognized. These tax positions must meet a “more likely than not” standard that, based on their technical merits, the positions have a more than 50 percent likelihood of being sustained upon examination. FASB Interpretation No. 48 is effective for fiscal periods beginning after December 15, 2006. At adoption, the financial statements must be adjusted to reflect only those tax positions that are more likely than not of being sustained. Management of the Fund is currently evaluating the impact that FASB Interpretation No. 48 will have on the Fund’s financial statements.
Fair Value Measurements - In September 2006, FASB issued Statement on Financial Accounting Standards (SFAS) No. 157 “Fair Value Measurements.” This standard establishes a single authoritative definition of fair value, sets out a framework for measuring fair value and requires additional disclosure about fair value measurements. SFAS No. 157 applies to fair value measurements already required or permitted by existing standards. SFAS No. 157 is effective for financial statements issued for fiscal years beginning after November 15, 2007 and interim periods within those fiscal years. The changes to current generally accepted accounting principles from the application of this Statement relate to the definition of fair value, the methods used to measure fair value, and the expanded disclosures about fair value measurements. As of November 30, 2007, the Trust does not believe the adoption of SFAS No. 157 will impact the amounts reported in the financial statements, however, additional disclosures may be required about the inputs used to develop the measurements and the effect of certain measurements reported on the statement of changes in net assets for a fiscal period.
NOTE 3. FEES AND OTHER TRANSACTIONS WITH AFFILIATES
The Advisor, under the terms of the management agreement (the “Agreement”), manages the Fund’s investments. As compensation for its management services, the Fund is obligated to pay the Advisor a fee computed and accrued daily and paid monthly at an annual permanent rate of 1.05% of the Fund’s average net assets up to $250 million and a permanent reduced rate of 1.00% of the Fund’s average net assets over $750 million. Prior to May 31, 2007, the
Chinook Emerging Growth Fund
Notes to the Financial Statements – continued
November 30, 2007
NOTE 3. FEES AND OTHER TRANSACTIONS WITH AFFILIATES - continued
Advisor fee rate was 1.35% of the Fund’s average net assets up to $50 million, 1.25% of the Fund’s average net assets from $50 million to $150 million, 1.15% of the Fund’s average net assets from $150 million to $250 million, and 1.00% of the Fund’s average net assets over $250 million. For the fiscal year ended November 30, 2007, the Advisor earned fees, before the waiver described below, of $139,312 from the Fund. At November 30, 2007, the Fund owed $8,012 to the Advisor.
Effective May 31, 2007 the Advisor has contractually agreed through November 30, 2008 to waive its management fee and/or reimburse expenses so that total annual fund operating expenses, excluding brokerage fees and commissions, borrowing costs (such as interest and dividend expenses on securities sold short), 12b-1 fees, taxes extraordinary expenses, and any indirect expenses (such as expenses incurred by other investment companies in which the Fund may invest) do not exceed 1.40% of the Fund’s average daily net assets. Prior to the May 31, 2007 amended agreement such expenses above were not to exceed 1.85% of the Fund’s average daily net assets. For the fiscal year ended November 30, 2007, the Advisor waived fees of $88,270. Each waiver or reimbursement of an expense by the Advisor is subject to repayment by the Fund within the three fiscal years following the fiscal year in which the expense was incurred, provided the Fund can make the repayment without exceeding the 1.40% expense limitation. At November 30, 2007, the amounts subject to recoupment are as follows:
| Recoverable Through | ||
Amount | November 30, |
| |
$ 88,270 | 2010 |
The Trust retains Unified Fund Services, Inc. (“Unified”) to manage the Fund’s business affairs and provide the Fund with administrative services, including all regulatory reporting and necessary office equipment and personnel. For the fiscal year ended November 30, 2007, Unified earned fees of $31,500 for administrative services provided to the Fund. At November 30, 2007, the Fund owed Unified $5,500 for administrative services. Certain officers of the Trust are members of management and/or employees of Unified. Unified operates as a wholly-owned subsidiary of Huntington Bancshares, Inc., the parent company of the Distributor and Huntington National Bank, the custodian of the Fund’s investments (the “Custodian”). For the fiscal year ended November 30, 2007, the Custodian earned fees of $8,080 for custody services. At November 30, 2007, the Fund owed $2,092 to the Custodian for custody services.
The Trust also retains Unified to act as the Fund’s transfer agent and to provide fund accounting services. For the fiscal year ended November 30, 2007, Unified earned fees of $14,585 from the Fund for transfer agent services and $5,159 in reimbursement for out-of-pocket expenses incurred in providing transfer agent services. For the fiscal year ended November 30, 2007, Unified earned fees of $19,333 from the Fund for fund accounting services. At November 30, 2007, the Fund owed Unified $2,521 for transfer agent services, $997 in reimbursement of out-of-pocket expenses and $3,333 for fund accounting services.
Unified Financial Securities, Inc. (the “Distributor”) acts as the principal distributor of the Fund. There were no payments made to the Distributor by the Fund for the fiscal year ended November 30, 2007. The Distributor, Unified and the Custodian are controlled by Huntington Bancshares, Inc.
The Fund has adopted a distribution plan in accordance with Rule 12b-1 (“Plan”) under the Investment Company Act of 1940. Under the Plan, the Fund can pay a fee of up to 0.25% of the average daily net assets of the Fund to the Advisor or any bank, broker-dealer or other financial institution that assists the Fund in the sale and distribution of its shares or that provides shareholder services to help defray the cost of servicing such shareholders. The Plan has not yet been activated, but can be at any time.
NOTE 4. INVESTMENTS
For the fiscal year ended November 30, 2007, purchases and sales of investment securities, other than short-term investments and short-term U.S. government obligations were as follows:
Chinook Emerging Growth Fund
Notes to the Financial Statements – continued
November 30, 2007
NOTE 4. INVESTMENTS - continued

As of November 30, 2007, the net unrealized appreciation of investments for tax purposes was as follows:
|

At November 30, 2007 the aggregate cost of securities for federal income tax purposes was $14,696,064.
NOTE 5. ESTIMATES
The preparation of financial statements in conformity with accounting principles generally accepted in the United States of America requires management to make estimates and assumptions that affect the reported amounts of assets and liabilities and disclosure of contingent assets and liabilities at the date of the financial statements and the reported amounts of increases and decreases in net assets from operations during the reporting period. Actual results could differ from those estimates.
NOTE 6. BENEFICIAL OWNERSHIP
The beneficial ownership, either directly or indirectly, of more than 25% of the voting securities of a fund creates a presumption of control of the Fund, under Section 2(a) (9) of the Investment Company Act of 1940. As of November 30, 2007, Charles Schwab, for the benefit of others, was the record owner of 82.64% of the outstanding shares of the Fund. As a result, Charles Schwab may be deemed to control the Fund.
NOTE 7. DISTRIBUTIONS TO SHAREHOLDERS
On December 26, 2006, the Fund paid a short-term capital gain distribution of $3.8158 per share and a long-term capital gain distribution of $0.2839 per share to shareholders of record on December 22, 2006.
On November 28, 2007, the Fund paid a short-term capital gain distribution of $0.253 per share and a long-term capital gains distribution of $0.022 per share to shareholders of record on November 27, 2007.
The tax character of distributions paid for the fiscal years ended November 30, 2007 and 2006 were as follows:
|

Chinook Emerging Growth Fund
Notes to the Financial Statements – continued
November 30, 2007
NOTE 7. DISTRIBUTIONS TO SHAREHOLDERS - continued
As of November 30, 2007, the components of distributable earnings (accumulated losses) on a tax basis were as follows:

As of November 30, 2007, the difference between book and tax basis unrealized appreciation is attributable primarily to the tax deferral of Post-October losses on wash sales in the amount of $92,429.
REPORT OF INDEPENDENT REGISTERED PUBLIC ACCOUNTING FIRM
To The Shareholders and Board of Trustees
Chinook Emerging Growth Fund
(Unified Series Trust)
We have audited the accompanying statement of assets and liabilities, including the schedule of investments, of Chinook Emerging Growth Fund (the “Fund), a series of the Unified Series Trust, as of November 30, 2007, and the related statement of operations for the year then ended, the statements of changes in net assets for each of the two years then ended, and financial highlights for each of the three periods then ended. These financial statements and financial highlights are the responsibility of Fund management. Our responsibility is to express an opinion on these financial statements and financial highlights based on our audits.
We conducted our audits in accordance with the standards of the Public Company Accounting Oversight Board (United States). Those standards require that we plan and perform the audit to obtain reasonable assurance about whether the financial statements and financial highlights are free of material misstatement. An audit includes examining, on a test basis, evidence supporting the amounts and disclosures in the financial statements. Our procedures included confirmation of securities owned as of November 30, 2007 by correspondence with the Fund’s custodian. An audit also includes assessing the accounting principles used and significant estimates made by management, as well as evaluating the overall financial statement presentation. We believe that our audit provides a reasonable basis for our opinion.
In our opinion, the financial statements and financial highlights referred to above present fairly, in all material respects, the financial position of Chinook Emerging Growth Fund as of November 30, 2007, the results of its operations for the year then ended, the changes in its net assets for each of the two years then ended, and the financial highlights for each of the three periods then ended, in conformity with accounting principles generally accepted in the United States of America.
COHEN FUND AUDIT SERVICES, LTD.
Westlake, Ohio
January 22, 2008
TRUSTEES AND OFFICERS
The Board of Trustees supervises the business activities of the Trust. Each Trustee serves as a trustee until termination of the Trust unless the Trustee dies, resigns, retires or is removed.
The following tables provide information regarding the Trustees and officers.
Independent Trustees
Name, Address*, (Age), Position with Trust**, Term of Position with Trust | Principal Occupation During Past 5 Years and Other Directorships |
Gary E. Hippenstiel (Age 60) Independent Trustee, December 2002 to present | Director, Vice President and Chief Investment Officer of Legacy Trust Company, N.A. since 1992; Chairman of the investment committee for W.H. Donner Foundation and Donner Canadian Foundation, since June 2005; Trustee of AmeriPrime Advisors Trust from July 2002 to September 2005; Trustee of Access Variable Insurance Trust from April 2003 to August 2005; Trustee of AmeriPrime Funds from 1995 to July 2005; Trustee of CCMI Funds from June 2003 to March 2005. |
Stephen A. Little (Age 61) Chairman, December 2004 to present; Independent Trustee, December 2002 to present | President and founder of The Rose, Inc., a registered investment advisor, since April 1993; Trustee of AmeriPrime Advisors Trust from November 2002 to September 2005; Trustee of AmeriPrime Funds from December 2002 to July 2005; Trustee of CCMI Funds from June 2003 to March 2005. |
Daniel J. Condon (Age 57) Independent Trustee, December 2002 to present | President of International Crankshaft Inc., an automotive equipment manufacturing company, since 2004, Vice President and General Manager from 1990 to 2003; Trustee of AmeriPrime Advisors Trust from November 2002 to September 2005; Trustee of The Unified Funds from 1994 to 2002; Trustee of Firstar Select Funds, a REIT mutual fund, from 1997 to 2000; Trustee of AmeriPrime Funds from December 2002 to July 2005; Trustee of CCMI Funds from June 2003 to March 2005. |
Ronald C. Tritschler (Age 55) Independent Trustee, December 2002 to present | Chief Executive Officer, Director and Legal Counsel of The Webb Companies, a national real estate company, since 2001, Executive Vice President and Director from 1990 to 2000; Director of First State Financial since 1998; Director, Vice President and Legal Counsel of The Traxx Companies, an owner and operator of convenience stores, since 1989; Trustee of AmeriPrime Advisors Trust from November 2002 to September 2005; Trustee of AmeriPrime Funds from December 2002 to July 2005; Trustee of CCMI Funds from June 2003 to March 2005. |
Principal Officers
Name, Address*, (Age), Position with Trust,** Term of Position with Trust | Principal Occupation During Past 5 Years and Other Directorships |
Anthony J. Ghoston (Age 48) President, July 2004 to present | President of Unified Fund Services, Inc., the Trust’s administrator, since June 2005, Executive Vice President from June 2004 to June 2005, Senior Vice President from April 2003 to June 2004; Senior Vice President and Chief Information Officer of Unified Financial Services, Inc., the parent company of the Trust’s administrator and distributor, from 1997 to November 2004; President of AmeriPrime Advisors Trust from July 2004 to September 2005; President of AmeriPrime Funds from July 2004 to July 2005; President of CCMI Funds from July 2004 to March 2005. |
John C. Swhear (Age 46) Senior Vice President, May 2007 to present | Vice President of Legal Administration and Compliance for Unified Fund Services, Inc., the Trust’s administrator, since April, 2007; Chief Compliance Officer of Unified Financial Securities, Inc., the Trust’s distributor, since May 2007; Employed in various positions with American United Life Insurance Company from 1983 to April 2007, including: Associate General Counsel, April 2007, Investment Adviser Chief Compliance Officer, June 2004 to April 2007, Assistant Secretary to the Board of Directors, December 2002 to April 2007, Chief Compliance Officer of OneAmerica Funds, Inc., June 2004 to April 2007, Chief Counsel and Secretary, OneAmerica Securities, Inc., December 2002 to April 2007. |
J. Michael Landis (Age 36) Interim Chief Financial Officer and Treasurer, March 2007 to present | Vice President Fund Accounting and Fund Administration for Unified Fund Services, since October, 2006; Director of Fund Accounting and Fund Administration for PFPC July 2006 - October 2006; Manager Fund Accounting for Unified Fund Services November 2004 – July 2006; Manager Fund Accounting for Mellon Financial Corporation November 1998 – November 2004. |
Lynn E. Wood (Age 61) Chief Compliance Officer, October 2004 to present | Chief Compliance Officer of AmeriPrime Advisors Trust from October 2004 to September 2005; Chief Compliance Officer of AmeriPrime Funds from October 2004 to July 2005; Chief Compliance Officer of CCMI Funds from October 2004 to March 2005; Chief Compliance Officer of Unified Financial Securities, Inc., the Trust’s distributor, from December 2004 to October 2005 and from 1997 to 2000, Chairman from 1997 to December 2004, President from 1997 to 2000; Director of Compliance of Unified Fund Services, Inc., the Trust’s administrator, from October 2003 to September 2004; Chief Compliance Officer of Unified Financial Services, Inc., the parent company of the Trust’s administrator and distributor, from 2000 to 2004. |
Heather Bonds (Age 31) Secretary, July 2005 to present; Assistant Secretary, September 2004 to June 2005 | Employed by Unified Fund Services, Inc., the Trust’s administrator, since January 2004 and from December 1999 to January 2002; Student at Indiana University School of Law – Indianapolis, J.D. Candidate in December 2007; Assistant Secretary of Dean Family of Funds since August 2004; Regional Administrative Assistant of The Standard Register Company from February 2003 to January 2004; Full time student at Indiana University from January 2002 to June 2002; Secretary of AmeriPrime Advisors Trust from July 2005 to September 2005, Assistant Secretary from September 2004 to June 2005; Assistant Secretary of AmeriPrime Funds from September 2004 to July 2005; Assistant Secretary of CCMI Funds from September 2004 to March 2005. |
* The address for each officer is 2960 North Meridian Street, Suite 300, Indianapolis, IN 46208.
** The Trust currently consists of 37 series.
OTHER INFORMATION
The Fund’s Statement of Additional Information (“SAI”) includes additional information about the trustees and is available without charge, upon request. You may call toll-free at (800) 440-6895 to request a copy of the SAI or to make shareholder inquiries.
RENEWAL OF MANAGEMENT AGREEMENT (Unaudited)
The continuation of the Management Agreement of the Chinook Emerging Growth Fund (the “Fund”) with the Chinook Capital Management, LLC (the “Advisor”) was recommended to the Board by the Advisor Contract Renewal Committee (the “Committee”) and approved by the full Board, including a majority of Trustees who are not interested persons of the Trust or interested parties to the Agreement (collectively, the “Independent Trustees” and each an “Independent Trustee”) at an in-person meeting held on November 11, 2007. The Chairman noted that no changes had been proposed to the Fund’s management agreement and the Advisor had agreed to extend its obligation to cap Fund expenses through November 30, 2008. Materials provided to the Committee included: (i) executed copies of the Fund’s management agreement and current expense cap side letter, (ii) a letter from the Administrator to the Advisor setting forth, and the Advisor’s response to, a detailed series of questions regarding, among other things, the Advisor’s services to the Fund, its profitability from managing the Fund and ideas for future growth for the Fund, (iii) a certification from the Advisor that it had adopted a compliance program that is reasonably designed to prevent violations of federal securities laws by the Fund, (iv) a summary of any recent SEC staff examination of the Fund or the Advisor, (v) the Advisor’s Form ADV Parts I and II and accompanying schedules, (vi) recent financial statements for the Advisor (vii) reports regarding the Fund’s performance for the past three months, and 1-, 3- and 5-years (or since inception) and comparisons of the same to the Fund’s benchmark(s) and peer group for the same periods, and (viii) reports comparing the Fund’s advisory fee and total expenses (after fee waivers and reimbursements) to the Fund’s peer group. The Committee also interviewed the Advisor’s compliance officer and portfolio managers with respect to these and other issues.
The Committee members noted that they had received and evaluated such information as they deemed necessary to make their recommendation. The Committee also noted that it had taken into account a number of factors that they believed to be relevant, using their own business judgment. They noted that this included information regarding the Advisor that had been provided to the Board throughout the year at regular meetings of the Board, as well as information that was specifically furnished to the Committee in connection with its review of the Fund’s management arrangement. The Committee noted with approval that the Advisor contractually had agreed in May 2007 to reduce the maximum management fee for the Fund from 1.35% to 1.05%, and to further decrease the management fee to 1.00% for Fund assets in excess of $750 million.
Further, with respect to the nature, extent, and quality of the services, the Committee reviewed the responses from the Advisor as to the resources provided to the Fund, and considered the adequacy of such resources in light of the expected growth in the level of Fund assets, and whether the resources are sufficient to sustain positive performance, compliance and other needs. The Committee determined that the Advisor’s resources appear adequate, and specifically noted that the Advisor provides three portfolio managers to manage the Fund, each of whom appears to have the necessary experience to manage the Fund. The Committee noted that one of the portfolio managers dedicates 100% of his time to Fund-related matters. It noted that the Advisor also provides the support of various administrative staff, including a compliance officer, who monitor the Fund’s portfolio on a regular basis. The Committee noted that the Advisor was not proposing any changes to the level of services provided to the Fund.
The Committee noted that the Fund’s portfolio managers also manage other accounts in addition to the Fund. The Committee sought and received assurances from the Advisor’s President that the portfolio managers’ current work load allows sufficient time to devote to Fund matters. The Committee also noted that certain portfolio managers manage separate accounts included in the Advisor’s Small Cap Growth Composite using similar strategies. As a result, the Committee sought assurances from the Advisor that trades were being allocated fairly among the Fund and private accounts. The portfolio managers assured the Committee that trades were effected in compliance with the Advisor’s Trade Allocation Policy, which had been reviewed by the Trust’s Chief Compliance Officer (“CCO”). The Committee also noted that various compliance reports had been provided by the Advisor and the Trust’s CCO to the Board throughout the year, and noted, based on such reports, that the Fund’s investment policies and restrictions were consistently complied with during the last year.
The Committee then discussed the Fund’s performance with the portfolio managers and reviewed other materials provided by the Advisor and the Administrator with respect to such performance. The Committee noted that the Fund reported a 20.18% return for the past 1-year period, which was higher than the performance of the Fund’s benchmark, the Russell 2000 Growth Index (18.94%), as well as that of its peer group (Morningstar’s “small growth equity” funds group), which was 19.06%. The Committee also noted that, at 10.67%, the Fund’s year-to-date performance was higher than its benchmark’s at 9.35%, and in-line with the average of its peer group at 10.75%.
The Committee then discussed the Advisor’s fee rates and profitability. The Committee noted the reduced fee of 1.05%, which went into effect in May 2007. The Committee also noted that the Advisor had agreed to extend its obligation to cap certain Fund operating expenses at 1.40% through November 2008.
The Committee then compared the Fund’s expenses to its peer group. It noted that, at 1.05%, the Fund’s management fee was slightly higher than its peer group average of 0.91%, but significantly lower than the maximum at 1.50%. Most importantly, the Board noted that, after fee waiver and reimbursement, the Fund’s total expenses were well below its peer group average (1.44% compared to 1.67%).
The Committee reviewed the Advisor’s financial statements as of September 30, 2007 and it was advised that the Advisor had experienced a net loss from providing services to the Fund during its last fiscal year due to its small asset size. The Committee noted that the Advisor reported entering into soft dollar arrangements pursuant to which a portion of the Fund’s brokerage commissions are directed to brokers and dealers who provide the Advisor with research services. It also noted that during the prior fiscal year, the Fund had paid commissions to brokers who provide research in an amount equal to less than 30% of the Fund’s total brokerage commissions. The Committee sought and received assurances from the Advisor that it had adopted sufficient trading policies, including policies to ensure that its soft dollar practices were in compliance with regulatory requirements, and were in the best interest of the Fund and its shareholders. The Committee also noted that the advisor does not receive any 12b-1 fees from the Fund.
In determining the reasonableness of the advisory fees, the Committee also considered whether economies of scale will be realized as the Fund grows larger, and the extent to which this is reflected in the advisory fees. The Committee noted with approval that the Fund’s management fee will drop from 1.05% to 1.00% for Fund assets in excess of $750 million.
After reviewing all the foregoing, the Committees determined that the Fund’s advisory fees were reasonable, based on the quality of services provided to the Fund, and then unanimously voted to recommend that the Board approve the continuation of the Fund’s management agreement. Upon such recommendation, the Board, which is comprised solely of trustees who are not “interested” persons (within the meaning of the Investment Company Act of 1940, as amended) of the Trust or the Chinook Capital Management followed the Committee’s recommendation and renewed the management agreement of the Fund.
PROXY VOTING
A description of the policies and procedures that the Fund uses to determine how to vote proxies relating to portfolio securities and information regarding how the Fund voted those proxies during the most recent twelve month period ended June 30, is available without charge upon request by (1) calling the Funds at (800) 440-6895 and (2) from Fund documents filed with the Securities and Exchange Commission (“SEC”) on the SEC’s website at www.sec.gov.
TRUSTEES
Stephen A. Little, Chairman
Gary E. Hippenstiel
Daniel J. Condon
Ronald C. Tritschler
OFFICERS
Anthony J. Ghoston, President
John Swhear, Senior Vice-President
James M. Landis, Interim Chief Financial Officer and Treasurer
Heather A. Bonds, Secretary
Lynn Wood, Chief Compliance Officer
INVESTMENT ADVISOR
Chinook Capital Management, LLC. |
4380 SW Macadam Avenue, Suite 250
Portland, OR 97239
DISTRIBUTOR
Unified Financial Securities, Inc.
2960 North Meridian Street, Suite 300
Indianapolis, IN 46208
INDEPENDENT REGISTERED PUBLIC ACCOUNTING FIRM
Cohen Fund Audit Services, Ltd.
800 Westpoint Parkway, Suite 1100
Westlake, OH 44145
LEGAL COUNSEL
Thompson Coburn LLP
One US Bank Plaza
St. Louis, MO 63101
LEGAL COUNSEL TO THE INDEPENDENT TRUSTEES
Thompson Hine, LLP
312 Walnut Street, 14th Floor
Cincinnati, OH 45202
CUSTODIAN
Huntington National Bank
41 South Street
Columbus, OH 43125
ADMINISTRATOR, TRANSFER AGENT AND FUND ACCOUNTANT
Unified Fund Services, Inc.
2960 North Meridian Street, Suite 300
Indianapolis, IN 46208
This report is intended only for the information of shareholders or those who have received the Fund’s prospectus which contains information about the Fund’s management fee and expenses. Please read the prospectus carefully before investing.
Distributed by Unified Financial Securities, Inc.
Member FINRA/SIPC

Annual Report
November 30, 2007
Fund Adviser:
The Roosevelt Investment Group
317 Madison Avenue
Suite 1004
New York, NY 10017
Toll Free: (877) 322-0576
Investment Results | (Unaudited) |
Management’s Discussion and Analysis
In a fiscal year (ending November 30, 2007) where the financial markets were affected by the housing market, sub-prime mortgage and credit market debacle, weak dollar, and rising energy prices, your Fund recorded a gain of 20.90% that substantially outperformed both the NASDAQ Composite Index and S&P 500 Index (See below). Most of the Fund’s investments grew steadily during the year led by the agricultural sector, which constituted 12.45% of the portfolio, and energy. Sales of tobacco, technology, mining and metals issues during the year contributed positively to the performance of the portfolio. Another key factor was that the Fund was not exposed to the housing stocks and the sub-prime and the credit market debacle through the financial service sectors. We liked our exposure to the agricultural sector since we believed that the cycle was still strong. Our exposure to energy focused on oil and gas exploration companies and coal plays since the investors were mostly focused on the big oil producers where the market had reached its apex. We hope to continue our success in the coming year as we are constantly looking for new investment opportunities.
You should carefully consider the investment objectives, potential risks, management fees, and charges and expenses of the Fund before investing. The Fund's prospectus contains this and other information about the Fund, and should be read carefully before investing. You may obtain a current copy of the Fund's prospectus by calling 1-877-322-0576. Past performance is no guarantee of future results. The investment return and principal value of an investment in the Fund will fluctuate so that an investor’s shares, when redeemed, may be worth more or less than their original cost.
|

The performance quoted represents past performance, which does not guarantee future results. The returns shown do not reflect deduction of taxes that a shareholder would pay on Fund distributions or the redemption of Fund shares.
* Return figures reflect any change in price per share and assume the reinvestment of all distributions.
** The Indices are unmanaged benchmarks that assume reinvestment of all distributions and exclude the effect of taxes and fees. The S&P 500 Index and NASDAQ Composite Index are widely recognized unmanaged indices of equity prices and are representative of a broader market and range of securities than are found in the Fund’s portfolio. Individuals cannot invest directly in these Indices; however, an individual can invest in exchange traded funds or other investment vehicles that attempt to track the performance of a benchmark index.
The chart above assumes an initial investment of $10,000 made on December 21, 2001 (commencement of Fund operations) and held through November 30, 2007. The S&P 500 Index and NASDAQ Composite Index are widely recognized unmanaged indices of equity prices and are representative of a broader market and range of securities than are found in the Fund’s portfolio. Individuals cannot invest directly in these Indices; however, an individual can invest in exchange traded funds or other investment vehicles that attempt to track the performance of a benchmark index. THE FUND’S RETURN REPRESENTS PAST PERFORMANCE AND DOES NOT GUARANTEE FUTURE RESULTS. The returns shown do not reflect deduction of taxes that a shareholder would pay on Fund distributions or the redemption of Fund shares.
Current performance may be higher or lower than the performance quoted. Performance data current to the most recent month-end may be obtained by call 1-877-322-0576.
The Fund is distributed by Unified Financial Securities, Inc., member FINRA.
Fund Holdings | (Unaudited) |

1As a percentage of net assets. |
The Fund invests primarily in common stock of U.S. companies of all capitalization ranges.
Availability of Portfolio Schedule
The Fund files its complete schedule of portfolio holdings with the Securities and Exchange Commission (“SEC”) for the first and third quarters of each fiscal year on Form N-Q. The Fund’s Form N-Qs are available at the SEC’s website at www.sec.gov. The Fund’s Form N-Qs may be reviewed and copied at the Public Reference Room in Washington, DC. Information on the operation of the Public Reference Room may be obtained by calling 1-800-SEC-0330.
Summary of Fund’s Expenses (Unaudited)
As a shareholder of the Fund, you incur ongoing costs, consisting of management fees; distribution and/or service (12b-1) fees; and trustee expenses. This Example is intended to help you understand your ongoing costs (in dollars) of investing in the Fund and to compare these costs with the ongoing costs of investing in other mutual funds. The Example is based on an investment of $1,000 invested at the beginning of the period and held for the entire period (June 1, 2007 through November 30, 2007).
Actual Expenses
The first line of the table below provides information about actual account values and actual expenses. You may use the information in this line, together with the amount you invested, to estimate the expenses that you paid over the period. Simply divide your account value by $1,000 (for example, an $8,600 account value divided by $1,000 = 8.60), then multiply the result by the number in the first line under the heading entitled “Expenses Paid During Period” to estimate the expenses you paid on your account during this period.
Hypothetical Example for Comparison Purposes
The second line of the table below provides information about hypothetical account values and hypothetical expenses based on the Fund’s actual expense ratio and an assumed rate of return of 5% per year before expenses, which is not the Fund’s actual return. The hypothetical account values and expenses may not be used to estimate the actual ending account balance or expenses you paid for the period. You may use this information to compare the ongoing costs of investing in the Fund and other funds. To do so, compare this 5% hypothetical example with the 5% hypothetical examples that appear in the shareholder reports of the other funds.
Roosevelt Anti-Terror Multi-Cap Fund | Beginning Account Value June 1, 2007 | Ending Account Value November 30, 2007 | Expenses Paid for the Period June 1, 2007 – November 30, 2007* |
Actual |
$1,000.00 |
$1,044.80 |
$6.48 |
Hypothetical** |
$1,000.00 |
$1,018.73 |
$6.39 |
*Expenses are equal to the Fund’s annualized expense ratio of 1.26%, multiplied by the average account value over the period, multiplied by 183/365 (to reflect the partial year period).
**Assumes a 5% return before expenses. |
Roosevelt Anti-Terror Multi-Cap Fund |
|
|
|
Schedule of Investments |
|
|
|
November 30, 2007 |
|
|
|
|
|
|
|
|
|
|
|
Common Stocks - 84.25% | Shares |
| Value |
|
|
|
|
Agricultural Chemicals - 1.91% |
|
|
|
The Mosaic Co. (a) | 7,495 |
| $ 518,279 |
|
|
|
|
Agricultural Products - Livestock & Animal Specialties - 2.43% |
|
|
|
Potash Corp. of Saskatchewan, Inc. | 4,155 |
| 498,143 |
Saskatchewan Wheat Pool, Inc. (a) | 14,550 |
| 162,378 |
|
|
| 660,521 |
|
|
|
|
Aircraft Parts & Auxiliary Equipment - 0.72% |
|
|
|
Spirit Aerosystems Holdings, Inc. - Class A (a) | 5,575 |
| 194,846 |
|
|
|
|
Beverages - 2.05% |
|
|
|
Diageo plc. (b) | 6,135 |
| 555,708 |
|
|
|
|
Biological Products (No Diagnostic Substances) - 1.32% |
|
|
|
Genzyme Corp. (a) | 4,775 |
| 357,791 |
|
|
|
|
Bituminous Coal & Lignite Surface Mining - 1.51% |
|
|
|
Peabody Energy Corp. | 7,365 |
| 409,789 |
|
|
|
|
Chemical & Allied Products - 2.56% |
|
|
|
Monsanto Co. | 7,000 |
| 695,590 |
|
|
|
|
Computer Communications Equipments - 1.53% |
|
|
|
Cisco Systems, Inc. (a) | 14,800 |
| 414,696 |
|
|
|
|
Computer & Office Equipment - 1.61% |
|
|
|
International Business Machines Corp. | 4,150 |
| 436,497 |
|
|
|
|
Computer Storage Devices - 1.76% |
|
|
|
EMC Corp. (a) | 24,790 |
| 477,703 |
|
|
|
|
Crude Petroleum & Natural Gas - 1.22% |
|
|
|
Anadarko Petroleum Corp. | 5,845 |
| 330,827 |
|
|
|
|
Drawing & Insulating of Nonferrous Wire - 2.11% |
|
|
|
Corning, Inc. | 23,640 |
| 574,216 |
|
|
|
|
Electric Services - 2.92% |
|
|
|
FPL Group, Inc. | 4,860 |
| 339,034 |
Northeast Utilities | 7,245 |
| 228,797 |
Southern Co. | 6,000 |
| 225,720 |
|
|
| 793,551 |
|
|
|
|
Electrical Work - 1.48% |
|
|
|
Quanta Services, Inc. (a) | 14,676 |
| 401,829 |
|
|
|
|
Farm Machinery & Equipment - 2.62% |
|
|
|
Deere & Co. | 4,140 |
| 711,252 |
|
|
|
|
Fats & Oils - 1.11% |
|
|
|
Archer-Daniels-Midland Co. | 8,300 |
| 301,705 |
*See accompanying notes which are an integral part of these financial statements.
Roosevelt Anti-Terror Multi-Cap Fund |
|
|
|
Schedule of Investments - continued |
|
|
|
November 30, 2007 |
|
|
|
|
|
|
|
|
|
|
|
Common Stocks - 84.25% - continued | Shares |
| Value |
|
|
|
|
General Industrial Machinery & Equipment - 1.55% |
|
|
|
Onex Corp. | 11,600 |
| $ 420,848 |
|
|
|
|
Hazardous Waste Management - 1.82% |
|
|
|
Stericycle, Inc. (a) | 8,400 |
| 494,340 |
|
|
|
|
Industrial Inorganic Chemicals - 1.52% |
|
|
|
Praxair, Inc. | 4,845 |
| 413,666 |
|
|
|
|
Industrial Instruments for Measurement, Display, and Control - 1.68% |
|
|
|
Roper Industries, Inc. | 7,180 |
| 455,571 |
|
|
|
|
Industrial Organic Chemicals - 1.50% |
|
|
|
International Flavors & Fragrances, Inc. | 8,135 |
| 407,889 |
|
|
|
|
Instruments for Measurement & Testing of Electricity & Electronics Signals - 1.29% |
|
| |
Itron, Inc. (a) | 4,525 |
| 350,914 |
|
|
|
|
Investment Advice - 2.34% |
|
|
|
Morningstar, Inc. (a) | 7,825 |
| 636,564 |
|
|
|
|
Metal Forgings & Stampings - 0.92% |
|
|
|
Brush Engineered Materials, Inc. (a) | 5,560 |
| 248,699 |
|
|
|
|
Metalworking Machinery & Equipment - 1.33% |
|
|
|
SPX Corp. | 3,555 |
| 361,757 |
|
|
|
|
Mining & Quarrying of Nonmetallic Minerals - 1.66% |
|
|
|
Compass Minerals International, Inc. | 12,300 |
| 451,656 |
|
|
|
|
Miscellaneous Manufacturing Industries - 1.63% |
|
|
|
WMS Industries, Inc. (a) | 13,275 |
| 443,385 |
|
|
|
|
Miscellaneous Publishing - 2.04% |
|
|
|
Reed Elsevier plc. (b) | 11,050 |
| 555,041 |
|
|
|
|
Motor Vehicle Parts & Accessories - 1.95% |
|
|
|
Honeywell International, Inc. | 9,370 |
| 530,529 |
|
|
|
|
National Commercial Banks - 1.64% |
|
|
|
PNC Financial Services Group, Inc. | 6,085 |
| 445,483 |
|
|
|
|
Oil & Gas Field Machinery & Equipment - 1.84% |
|
|
|
FMC Technologies, Inc. (a) | 9,000 |
| 500,220 |
|
|
|
|
Oil Field Machinery & Equipment - 0.56% |
|
|
|
Tesco Corp. (a) | 7,000 |
| 153,160 |
|
|
|
|
Oil & Gas Field Services - 2.56% |
|
|
|
Electromagnetic GeoServices AS (a) | 15,000 |
| 150,750 |
Willbros Group, Inc. (a) | 14,500 |
| 543,315 |
|
|
| 694,065 |
|
|
|
|
*See accompanying notes which are an integral part of these financial statements.
Roosevelt Anti-Terror Multi-Cap Fund |
|
|
|
Schedule of Investments - continued |
|
|
|
November 30, 2007 |
|
|
|
|
|
|
|
|
|
|
|
Common Stocks - 84.25% - continued | Shares |
| Value |
|
|
|
|
Perfumes, Cosmetics, & Other Toilet Preparations - 1.03% |
|
|
|
Avon Products, Inc. | 6,830 |
| $ 280,371 |
|
|
|
|
Pharmaceutical Preparations - 1.94% |
|
|
|
Novozymes A/S - B Shares | 4,750 |
| 526,063 |
|
|
|
|
Plastic Materials, Synthetic Resins & Nonvulcan Elastomers - 1.83% |
|
|
|
Hexcel Corp. (a) | 19,500 |
| 496,665 |
|
|
|
|
Retail - Eating Places - 1.96% |
|
|
|
McDonald's Corp. | 9,100 |
| 532,077 |
|
|
|
|
Retail - Grocery Stores - 3.45% |
|
|
|
The Kroger Co. | 17,250 |
| 495,937 |
Safeway, Inc. | 12,670 |
| 440,916 |
|
|
| 936,853 |
|
|
|
|
Retail - Retail Stores - 0.96% |
|
|
|
IAC/InterActiveCorp (a) | 9,395 |
| 261,463 |
|
|
|
|
Security & Commodity Brokers, Dealers, Exchanges & Services - 1.03% |
|
|
|
CME Group, Inc. | 426 |
| 280,399 |
|
|
|
|
Semiconductors & Related Devices - 2.24% |
|
|
|
MEMC Electronic Materials, Inc. (a) | 7,835 |
| 607,839 |
|
|
|
|
Services - Business Services - 0.47% |
|
|
|
EnerNOC, Inc. (a) | 2,810 |
| 128,614 |
|
|
|
|
Services - Commercial Physical & Biological Research - 1.17% |
|
|
|
Medarex, Inc. (a) | 25,000 |
| 317,500 |
|
|
|
|
Services - Computer Integrated Systems Design - 2.95% |
|
|
|
Cerner Corp. (a) | 8,275 |
| 494,431 |
Scientific Games Corp. - Class A (a) | 9,430 |
| 305,438 |
|
|
| 799,869 |
|
|
|
|
Services - Computer Programming, Data Processing, Etc. - 1.74% |
|
|
|
IHS, Inc. - Class A (a) | 6,720 |
| 471,341 |
|
|
|
|
Services - Engineering Services - 1.26% |
|
|
|
URS Corp. (a) | 5,964 |
| 342,889 |
|
|
|
|
Services - Miscellaneous Amusement & Recreation - 1.24% |
|
|
|
Pinnacle Entertainment, Inc. (a) | 12,300 |
| 337,635 |
|
|
|
|
Services - Prepackaged Software - 2.10% |
|
|
|
Microsoft Corp. | 16,950 |
| 569,520 |
|
|
|
|
Silver Ores - 0.09% |
|
|
|
Patriot Coal Corp. (a) | 736 |
| 24,901 |
|
|
|
|
|
|
|
|
*See accompanying notes which are an integral part of these financial statements.
Roosevelt Anti-Terror Multi-Cap Fund |
|
|
|
Schedule of Investments - continued |
|
|
|
November 30, 2007 |
|
|
|
|
|
|
|
|
|
|
|
Common Stocks - 84.25% - continued | Shares |
| Value |
|
|
|
|
Tobacco Products - 2.10% |
|
|
|
Altria Group, Inc. | 7,360 |
| $ 570,841 |
|
|
|
|
TOTAL COMMON STOCKS (Cost $19,475,880) |
|
| 22,883,427 |
|
|
|
|
Exchange-Traded Funds - 5.79% |
|
|
|
UltraShort Industrials Proshares | 4,560 |
| 257,594 |
UltraShort Basic Materials Proshares | 3,550 |
| 156,399 |
UltraShort Financials Proshares | 1,390 |
| 126,601 |
UltraShort Russell2000 Proshares | 7,690 |
| 547,605 |
UltraShort S&P500 Proshares | 7,885 |
| 420,428 |
UltraShort QQQ Proshares | 1,670 |
| 63,978 |
|
|
|
|
TOTAL EXCHANGE-TRADED FUNDS (Cost $1,655,685) |
|
| 1,572,605 |
|
|
|
|
| Principal |
|
|
Treasury Bonds - 1.52% | Amount |
|
|
U.S. Treasury Strip, 4.750%, 02/15/2037 | $ 1,493,000 |
| 414,157 |
|
|
|
|
TOTAL TREASURY BONDS (Cost $380,082) |
|
| 414,157 |
|
|
|
|
| Shares |
|
|
Money Market Securities - 10.81% |
|
|
|
Huntington Money Market Fund, 3.83% (c) | 2,936,749 |
| 2,936,749 |
|
|
|
|
TOTAL MONEY MARKET SECURITIES (Cost $2,936,749) |
|
| 2,936,749 |
|
|
|
|
|
|
|
|
TOTAL INVESTMENTS (Cost $24,448,396) - 102.37% |
|
| $ 27,806,938 |
|
|
|
|
Liabilities in excess of other assets - (2.37)% |
|
| (644,086) |
|
|
|
|
TOTAL NET ASSETS - 100.00% |
|
| $ 27,162,852 |
|
|
|
|
(a) Non-income producing. |
|
|
|
(b) American Depositary Receipt. |
|
|
|
(c) Variable rate security; the money market rate shown represents the rate at November 30, 2007. |
| ||
*See accompanying notes which are an integral part of these financial statements.
Roosevelt Anti-Terror Multi-Cap Fund |
|
|
|
| |
Statement of Assets and Liabilities |
|
|
|
| |
November 30, 2007 |
|
|
|
|
|
|
|
|
|
|
|
|
|
|
|
|
|
|
|
|
|
|
|
Assets |
|
|
|
|
|
Investments in securities, at fair value (cost $24,448,396) |
| $ 27,806,938 | |||
Receivable for investments sold |
|
|
| 502,259 | |
Receivable for fund shares sold |
|
|
| 18,247 | |
Dividends receivable |
|
|
|
| 33,003 |
Interest receivable |
|
|
|
| 6,655 |
Total assets |
|
|
|
| 28,367,102 |
|
|
|
|
|
|
Liabilities |
|
|
|
|
|
Payable for investments purchased |
|
|
| 1,175,578 | |
Payable to adviser (a) |
|
|
|
| 22,070 |
Payable to trustees |
|
|
|
| 1,085 |
Accrued 12b-1 fees |
|
|
|
| 5,517 |
Total liabilities |
|
|
|
| 1,204,250 |
|
|
|
|
|
|
Net Assets |
|
|
|
| $ 27,162,852 |
|
|
|
|
|
|
Net Assets consist of: |
|
|
|
|
|
Paid in capital |
|
|
|
| $ 22,065,532 |
Accumulated undistributed net investment income |
|
| 10,288 | ||
Accumulated undistributed net realized gain from investment transactions | 1,728,490 | ||||
Net unrealized appreciation on investments |
|
|
| 3,358,542 | |
|
|
|
|
|
|
Net Assets |
|
|
|
| $ 27,162,852 |
|
|
|
|
|
|
Shares outstanding (unlimited number of shares authorized) |
| 1,439,204 | |||
|
|
|
|
|
|
Net Asset Value |
|
|
|
|
|
Offering and redemption price per share |
|
|
| $ 18.87 | |
|
|
|
|
|
|
|
|
|
|
|
|
(a) See Note 3 in the Notes to the Financial Statements. |
|
|
| ||
*See accompanying notes which are an integral part of these financial statements.
Roosevelt Anti-Terror Multi-Cap Fund |
|
| |||
Statement of Operations |
|
|
| ||
For the fiscal year ended November 30, 2007 |
|
| |||
|
|
|
|
|
|
|
|
|
|
|
|
|
|
|
|
|
|
Investment Income |
|
|
|
| |
Dividend income (net of foreign withholding tax of $781) | $ 193,000 | ||||
Interest income |
|
|
| 67,656 | |
Total Investment Income |
|
| 260,656 | ||
|
|
|
|
|
|
Expenses |
|
|
|
|
|
Investment Adviser fee |
|
|
| 196,772 | |
12b-1 expense |
|
|
| 49,193 | |
Trustee expenses |
|
|
| 4,219 | |
Overdraft fees |
|
|
| 181 | |
Total Expenses |
|
|
| 250,365 | |
Net Investment Income |
|
|
| 10,291 | |
|
|
|
|
|
|
|
|
|
|
|
|
Realized and Unrealized Gain on Investments |
|
| |||
Net realized gain on investments |
|
| 1,802,463 | ||
Change in unrealized appreciation (depreciation) |
| ||||
on investments |
|
|
| 1,729,849 | |
Net realized and unrealized gain on investments |
| 3,532,312 | |||
Net increase in net assets resulting from operations | $ 3,542,603 | ||||
*See accompanying notes which are an integral part of these financial statements.
Roosevelt Anti-Terror Multi-Cap Fund |
|
|
|
| |||
Statements of Changes in Net Assets |
|
|
|
|
| ||
|
|
|
|
|
|
|
|
|
|
|
|
|
|
|
|
|
|
|
|
| Year Ended |
| Year Ended |
|
|
|
|
| November 30, 2007 |
| November 30, 2006 |
Operations |
|
|
|
|
|
|
|
Net investment income |
|
|
| $ 10,291 |
| $ 38,096 | |
Net realized gain on investment securities |
| 1,802,463 |
| 233,595 | |||
Change in unrealized appreciation (depreciation) |
| 1,729,849 |
| 883,431 | |||
Net increase in net assets resulting from operations | 3,542,603 |
| 1,155,122 | ||||
|
|
|
|
|
|
|
|
Distributions |
|
|
|
|
|
| |
From net investment income |
|
| (37,852) |
| (10,032) | ||
From net realized gain |
|
|
| (252,771) |
| (390,181) | |
Total distributions |
|
|
| (290,623) |
| (400,213) | |
|
|
|
|
|
|
|
|
Capital Share Transactions |
|
|
|
|
| ||
Proceeds from shares sold |
|
| 13,497,468 |
| 8,037,355 | ||
Reinvestment of distributions |
|
| 289,326 |
| 397,389 | ||
Amount paid for shares repurchased |
| (3,663,644) |
| (1,816,464) | |||
Net increase in net assets resulting |
|
|
|
|
| ||
from share transactions |
|
| 10,123,150 |
| 6,618,280 | ||
|
|
|
|
|
|
|
|
Total Increase in Net Assets |
|
| 13,375,130 |
| 7,373,189 | ||
|
|
|
|
|
|
|
|
Net Assets |
|
|
|
|
|
|
|
Beginning of year |
|
|
| 13,787,722 |
| 6,414,533 | |
|
|
|
|
|
|
|
|
End of year |
|
|
| $ 27,162,852 |
| $ 13,787,722 | |
|
|
|
|
|
|
|
|
|
|
|
|
|
|
|
|
Accumulated undistributed net investment |
|
|
|
| |||
income included in net assets |
|
| $ 10,288 |
| $ 37,849 | ||
|
|
|
|
|
|
|
|
Capital Share Transactions |
|
|
|
|
| ||
Shares sold |
|
|
| 764,047 |
| 532,777 | |
Shares issued in reinvestment of distributions |
| 18,049 |
| 27,163 | |||
Shares repurchased |
|
|
| (207,671) |
| (120,737) | |
|
|
|
|
|
|
|
|
Net increase from capital share transactions |
| 574,425 |
| 439,203 | |||
*See accompanying notes which are an integral part of these financial statements.
Roosevelt Anti-Terror Multi-Cap Fund |
|
|
|
|
|
|
|
|
|
Financial Highlights |
|
|
|
|
|
|
|
|
|
The tables below set forth financial data for a share outstanding throughout each period presented. |
|
| |||||||
|
|
|
|
|
|
|
|
|
|
| Year Ended |
| Year Ended |
| Year Ended |
| Year Ended |
| Year Ended |
| November |
| November |
| November |
| November |
| November |
| 30, 2007 |
| 30, 2006 |
| 30, 2005 |
| 30, 2004 |
| 30, 2003 |
|
|
|
|
|
|
|
|
|
|
Selected Per Share Data |
|
|
|
|
|
|
|
|
|
Net asset value, beginning of period | $ 15.94 |
| $ 15.07 |
| $ 14.18 |
| $ 12.89 |
| $ 9.84 |
|
|
|
|
|
|
|
|
|
|
Income from investment operations |
|
|
|
|
|
|
|
|
|
Net investment income (loss) | 0.01 |
| 0.04 |
| 0.02 |
| (0.01) |
| (0.01) |
Net realized and unrealized gain (loss) | 3.26 |
| 1.67 |
| 1.92 |
| 1.62 |
| 3.06 |
Total from investment operations | 3.27 |
| 1.71 |
| 1.94 |
| 1.61 |
| 3.05 |
|
|
|
|
|
|
|
|
|
|
Less Distributions to shareholders: |
|
|
|
|
|
|
|
|
|
From net investment income | (0.04) |
| (0.02) |
| - |
| - |
| - |
From net realized gain | (0.30) |
| (0.82) |
| (1.05) |
| (0.32) |
| - |
Total distributions | (0.34) |
| (0.84) |
| (1.05) |
| (0.32) |
| - |
|
|
|
|
|
|
|
|
|
|
Net asset value, end of period | $ 18.87 |
| $ 15.94 |
| $ 15.07 |
| $ 14.18 |
| $ 12.89 |
|
|
|
|
|
|
|
|
|
|
Total Return (a) | 20.90% |
| 11.82% |
| 14.47% |
| 12.70% |
| 31.00% |
|
|
|
|
|
|
|
|
|
|
Ratios and Supplemental Data |
|
|
|
|
|
|
|
|
|
Net assets, end of period (000) | $ 27,163 |
| $ 13,788 |
| $ 6,415 |
| $ 3,091 |
| $ 2,345 |
Ratio of expenses to average net assets | 1.27% |
| 1.28% |
| 1.10% |
| 1.07% |
| 1.15% |
Ratio of net investment income (loss) to |
|
|
|
|
|
|
|
| |
average net assets | 0.05% |
| 0.36% |
| 0.21% |
| (0.08)% |
| (0.06)% |
Portfolio turnover rate | 146.35% |
| 102.70% |
| 85.58% |
| 82.28% |
| 54.18% |
|
|
|
|
|
|
|
|
|
|
|
|
|
|
|
|
|
|
|
|
|
|
|
|
|
|
|
|
|
|
(a) Total return in the above table represents the rate that the investor would have earned or |
|
| |||||||
lost on an investment in the Fund, assuming reinvestment of dividends. |
|
|
|
| |||||
*See accompanying notes which are an integral part of these financial statements.
Roosevelt Anti-Terror Multi-Cap Fund
Notes to the Financial Statements
November 30, 2007
NOTE 1. ORGANIZATION |
The Roosevelt Anti-Terror Multi-Cap Fund (the “Fund”) was organized as a diversified series of Unified Series Trust (the “Trust”) to acquire all the assets of the Bull Moose Growth Fund, a series of AmeriPrime Advisors Trust (the “Predecessor Fund”), in a tax-free reorganization, effective September 23, 2005. The Predecessor Fund commenced operations on December 21, 2001. The Fund was known as the Abacus Bull Moose Growth Fund prior to November 30, 2006. . The Trust is an open-end management investment company established under the laws of Ohio by an Agreement and Declaration of Trust dated October 17, 2002 (the “Trust Agreement”). The Trust Agreement permits the Board of Trustees of the Trust (the “Board”) to issue an unlimited number of shares of beneficial interest of separate series. The Fund is one of a series of funds currently authorized by the Board. The objective of the Fund is long term capital appreciation. The investment adviser to the Fund is The Roosevelt Investment Group (the “Adviser”).
NOTE 2. SIGNIFICANT ACCOUNTING POLICIES
The following is a summary of significant accounting policies followed by the Fund in the preparation of its financial statements.
Securities Valuations - Equity securities are valued by using market quotations, but may be valued on the basis of prices furnished by a pricing service when the Adviser believes such prices more accurately reflect the fair market value of such securities. Securities that are traded on any stock exchange are generally valued by the pricing service at the last quoted sale price. Lacking a last sale price, an exchange-traded security is generally valued by the pricing service at its last bid price. Securities traded in the NASDAQ over-the-counter market are generally valued by the pricing service at the NASDAQ Official Closing Price. When market quotations are not readily available, when the Adviser determines that the market quotation or the price provided by the pricing service does not accurately reflect the current market value, or when restricted or illiquid securities are being valued, such securities are valued as determined in good faith by the Adviser, in conformity with guidelines adopted by and subject to review of the Board.
Fixed income securities are valued by using market quotations, but may be valued on the basis of prices furnished by a pricing service when the Adviser believes such prices accurately reflect the fair market value of such securities. A pricing service utilizes electronic data processing techniques based on yield spreads relating to securities with similar characteristics to determine prices for normal institutional-size trading units of debt securities without regard to sale or bid prices. If the Adviser decides that a price provided by the pricing service does not accurately reflect the fair market value of the securities, when prices are not readily available from a pricing service, or when restricted or illiquid securities are being valued, securities are valued at fair value as determined in good faith by the Adviser, subject to review of the Board. Short term investments in fixed income securities with maturities of less than 60 days when acquired, or which subsequently are within 60 days of maturity, are valued by using the amortized cost method of valuation, which the Board has determined will represent fair value. The ability of issuers of debt securities held by the Fund to meet their obligations may be affected by economic and political developments in a specific country or region.
In accordance with the Trust’s good faith pricing guidelines, the Adviser is required to consider all appropriate factors relevant to the value of securities for which it has determined other pricing sources are not available or reliable as described above. No single standard exists for determining fair value controls, since fair value depends upon the circumstances of each individual case. As a general principle, the current fair value of an issue of securities being valued by the Adviser would appear to be the amount which the owner might reasonably expect to receive for them upon their current sale. Methods which are in accord with this principle may, for example, be based on (i) a multiple of earnings; (ii) a discount from market of a similar freely traded security (including a derivative security or a basket of securities traded on other markets, exchanges or among dealers); or (iii) yield to maturity with respect to debt issues, or a combination of these and other methods. Good faith pricing is permitted if, in the Adviser’s opinion, the validity of market quotations appears to be questionable based on factors such as evidence of a thin market in the security based on a small number of quotations, a significant event occurs after the close of a market but before the Fund’s NAV calculation that may affect a security’s value, or the Adviser is aware of any other data that calls into question the reliability of market quotations. Investments in foreign securities, junk bonds, or other thinly traded securities are more likely to trigger fair valuation than other securities.
Roosevelt Anti-Terror Multi-Cap Fund
Notes to the Financial Statements – continued
November 30, 2007
NOTE 2. SIGNIFICANT ACCOUNTING POLICIES – continued
Federal Income Taxes – The Fund makes no provision for federal income tax. The Fund intends to qualify each year as a “regulated investment company” under subchapter M of the Internal Revenue Code of 1986, as amended, by distributing all of its net investment income and net realized capital gains. If the required amount of net investment income is not distributed, the Fund could incur a tax expense.
Security Transactions and Related Income- The Fund follows industry practice and records security transactions on the trade date. The specific identification method is used for determining gains or losses for financial statements and income tax purposes. Dividend income is recorded on the ex-dividend date and interest income is recorded on an accrual basis. Discounts and premiums on securities purchased are amortized or accreted using the effective interest method. Withholding taxes on foreign dividends have been provided for in accordance with the Fund’s understanding of the applicable country’s tax rules and rates.
Dividends and Distributions – Distributions to shareholders, which are determined in accordance with income tax regulations, are recorded on the ex-dividend date. The Fund intends to distribute its net realized long-term capital gains and its net realized short-term capital gains at least once a year. The treatment for financial reporting purposes of distributions made to shareholders during the year from net investment income or net realized capital gains may differ from their ultimate treatment for federal income tax purposes. These differences are caused primarily by differences in the timing of the recognition of certain components of income, expenses or realized capital gain for federal income tax purposes. Where such differences are permanent in nature, they are reclassified in the components of the net assets based on their ultimate characterization for federal income tax purposes. Any such reclassifications will have no effect on net assets, results of operations or net asset values per share of each Fund. For the fiscal year ended November 30, 2007 there were no such reclassifications.
Expenses – Expenses incurred by the Trust that do not relate to a specific fund of the Trust are allocated to the individual funds based on each fund’s relative net assets or other appropriate basis (as determined by the Board).
Accounting for Uncertainty in Income Taxes- In June 2006, the Financial Accounting Standards Board (FASB) issued FASB Interpretation No. 48 – Accounting for Uncertainty in Income Taxes that requires the tax effects of certain tax positions to be recognized. These tax positions must meet a “more likely than not” standard that, based on their technical merits, have a more than 50 percent likelihood of being sustained upon examination. FASB Interpretation No. 48 is effective for fiscal periods beginning after December 15, 2006. At adoption, the financial statements must be adjusted to reflect only those tax positions that are more likely than not of being sustained. Management of the Fund is currently evaluating the impact that FASB Interpretation No. 48 will have on the Fund’s financial statements.
Fair Value Measurements - In September 2006, FASB issued Statement on Financial Accounting Standards (SFAS) No. 157 “Fair Value Measurements.” This standard establishes a single authoritative definition of fair value, sets out a framework for measuring fair value and requires additional disclosure about fair value measurements. SFAS No. 157 applies to fair value measurements already required or permitted by existing standards. SFAS No. 157 is effective for financial statements issued for fiscal years beginning after November 15, 2007 and interim periods within those fiscal years. The changes to current generally accepted accounting principles from the application of this Statement relate to the definition of fair value, the methods used to measure fair value, and the expanded disclosures about fair value measurements. As of November 30, 2007, the Management of the Fund does not believe the adoption of SFAS No. 157 will impact the amounts reported in the financial statements, however, additional disclosures may be required about the inputs used to develop the measurements and the effect of certain measurements reported on the statement of changes in net assets for a fiscal period.
NOTE 3. FEES AND OTHER TRANSACTIONS WITH AFFILIATES
Under the terms of the management agreement (the “Agreement”), the Adviser has agreed to provide investment advisory services to the Fund, and to pay most operating expenses of the Fund, in return for a "universal fee." The Agreement states that the Fund, not the Adviser, is obligated to pay the following expenses: brokerage fees and commissions, taxes, borrowing costs (such as (a) interest and (b) dividend expenses on securities sold short), fees and expenses of independent trustees, advertising, promotion and other expenses incurred in connection with the sale or distribution of the Fund’s shares (including
Roosevelt Anti-Terror Multi-Cap Fund
Notes to the Financial Statements – continued
November 30, 2007
NOTE 3. FEES AND OTHER TRANSACTIONS WITH AFFILIATES - continued
expenses which the Fund is authorized to pay pursuant to Rule 12b-1 under the Investment Company Act of 1940, as amended),and extraordinary or nonrecurring expenses. The Agreement does not require the Adviser to pay indirect expenses incurred by the Fund, such as fees and expenses of other investment companies in which the Fund may invest. As compensation for its management services, the Fund is obligated to pay the Adviser a fee computed and accrued daily and paid monthly at an annual rate of 1.00% of the average daily net assets of the Fund. For the fiscal year ended November 30, 2007, the Adviser earned $196,772 from the Fund for advisory services. At November 30, 2007, the Fund owed the Adviser $22,070 for these services.
The Trust retains Unified Fund Services, Inc. (“Unified”) to manage the Fund’s business affairs and provides the Fund with administrative services, fund accounting and transfer agency services, including all regulatory reporting and necessary office
equipment and personnel. The Adviser pays all administrative, transfer agency and fund accounting fees on behalf of the Fund per the Agreement. A trustee and certain officers of the Trust are members of management and/or employees of Unified. Unified operates as a wholly-owned subsidiary of Huntington Bancshares, Inc., the parent company of the Distributor and Huntington National Bank, the custodian of the Fund’s investments (the “Custodian”).
Unified Financial Securities, Inc. (The “Distributor”) acts as the principal distributor of the Fund. There were no payments made to the Distributor by the Fund during the fiscal year ended November 30, 2007. The Distributor, Unified and the Custodian are controlled by Huntington Bancshares, Inc.
The Fund has adopted a plan pursuant to Rule 12b-1 under the 1940 Act (the “Plan”). The Plan provides that the Fund will pay the Adviser a fee aggregating 0.25% of the average daily net assets of the Fund in connection with the promotion and distribution of Fund shares or the provision of services to shareholders, including, but not necessarily limited to, advertising, compensation to dealers and selling personnel, the printing and mailing of prospectuses to other than current Fund shareholders, the printing and mailing of sales literature and servicing shareholder accounts (“12b-1 Expenses”). The Adviser may pay all or a portion of these fees to any registered securities dealer, financial institution or any other person who renders assistance in distributing or promoting the sale of shares, or who provides certain shareholder services, pursuant to a written agreement. For the fiscal year ended November 30, 2007, the Fund accrued 12b-1 fees of $49,193, of which $5,517 was unpaid at November 30, 2007.
NOTE 4. INVESTMENTS
For the fiscal year ended November 30, 2007, purchases and sales of investment securities, other than short-term investments and short-term U.S. government obligations were as follows:
|

As of November 30, 2007, the net unrealized appreciation of investments for tax purposes was as follows:
|

At November 30, 2007, the aggregate cost of securities for federal income tax purposes was $24,480,687.
Roosevelt Anti-Terror Multi-Cap Fund
Notes to the Financial Statements – continued
November 30, 2007
NOTE 5. ESTIMATES
The preparation of financial statements in conformity with accounting principles generally accepted in the United States of America requires management to make estimates and assumptions that affect the reported amounts of assets and liabilities and disclosure of contingent assets and liabilities at the date of the financial statements and the reported amounts of increases and decreases in net assets from operations during the reporting period. Actual results could differ from those estimates.
NOTE 6. BENEFICIAL OWNERSHIP
The beneficial ownership, either directly or indirectly, of more than 25% of the voting securities of a fund creates a presumption of control of the fund, under Section 2(a) (9) of the Investment Company Act of 1940. As of November 30, 2007, Charles Schwab, for the benefit of others, was the record owner of 33.25% of the outstanding shares of the Fund. As a result, Charles Schwab may be deemed to control the Fund.
NOTE 7. DISTRIBUTIONS TO SHAREHOLDERS
On December 27, 2006, an income distribution of $0.0444 per share and a long-term capital gain distribution of $0.2965 per share were declared and paid to shareholders of record on December 26, 2006.
The tax character of distributions paid during the fiscal years ended November 30, 2007 and 2006 is as follows:
|

On December 21, 2007, a long-term capital gain distribution of $0.5196 per share and a short-term capital gain distribution of $0.4570 were declared and paid to shareholders of record on December 20, 2007.
As of November 30, 2007, the components of distributable earnings on a tax basis were as follows:
|

As of November 30, 2007, the difference between book basis and tax-basis unrealized appreciation was attributable primarily to the tax deferral of losses on wash sales of $32,291.
REPORT OF INDEPENDENT REGISTERED PUBLIC ACCOUNTING FIRM
To The Shareholders and Board of Trustees
Roosevelt Anti-Terror Multi-Cap Fund
(Unified Series Trust)
We have audited the accompanying statement of assets and liabilities, including the schedule of investments, of Roosevelt Anti-Terror Multi-Cap Fund (the “Fund), a series of the Unified Series Trust, as of November 30, 2007, and the related statement of operations for the year then ended, the statements of changes in net assets for each of the two years in the period then ended, and financial highlights for each of the four years in the period then ended. These financial statements and financial highlights are the responsibility of Fund management. Our responsibility is to express an opinion on these financial statements and financial highlights based on our audits. The financial highlights for the periods indicated prior to November 30, 2004 were audited by another independent accounting firm, which expressed an unqualified opinion on those highlights.
We conducted our audits in accordance with the standards of the Public Company Accounting Oversight Board (United States). Those standards require that we plan and perform the audit to obtain reasonable assurance about whether the financial statements and financial highlights are free of material misstatement. An audit includes examining, on a test basis, evidence supporting the amounts and disclosures in the financial statements. Our procedures included confirmation of securities owned as of November 30, 2007 by correspondence with the Fund’s custodian and brokers or by other appropriate auditing procedures where replies from brokers were not received. An audit also includes assessing the accounting principles used and significant estimates made by management, as well as evaluating the overall financial statement presentation. We believe that our audits provide a reasonable basis for our opinion.
In our opinion, the financial statements and financial highlights referred to above present fairly, in all material respects, the financial position of Roosevelt Anti-Terror Multi-Cap Fund as of November 30, 2007, the results of its operations for the year then ended, the changes in its net assets for each of the two years in the period then ended, and the financial highlights for each of the four years in the period then ended, in conformity with accounting principles generally accepted in the United States of America.
COHEN FUND AUDIT SERVICES, LTD.
Westlake, Ohio
1/29/2008
TRUSTEES AND OFFICERS
The Board of Trustees supervises the business activities of the Trust. Each Trustee serves as a trustee until termination of the Trust unless the Trustee dies, resigns, retires or is removed.
The following tables provide information regarding the Trustees and officers.
Independent Trustees
Name, Address*, (Age), Position with Trust**, Term of Position with Trust | Principal Occupation During Past 5 Years and Other Directorships |
Gary E. Hippenstiel (Age 60) Independent Trustee, December 2002 to present | Director, Vice President and Chief Investment Officer of Legacy Trust Company, N.A. since 1992; Chairman of the investment committee for W.H. Donner Foundation and Donner Canadian Foundation, since June 2005; Trustee of AmeriPrime Advisors Trust from July 2002 to September 2005; Trustee of Access Variable Insurance Trust from April 2003 to August 2005; Trustee of AmeriPrime Funds from 1995 to July 2005; Trustee of CCMI Funds from June 2003 to March 2005. |
Stephen A. Little (Age 61) Chairman, December 2004 to present; Independent Trustee, December 2002 to present | President and founder of The Rose, Inc., a registered investment advisor, since April 1993; Trustee of AmeriPrime Advisors Trust from November 2002 to September 2005; Trustee of AmeriPrime Funds from December 2002 to July 2005; Trustee of CCMI Funds from June 2003 to March 2005. |
Daniel J. Condon (Age 57) Independent Trustee, December 2002 to present | President of International Crankshaft Inc., an automotive equipment manufacturing company, since 2004, Vice President and General Manager from 1990 to 2003; Trustee of AmeriPrime Advisors Trust from November 2002 to September 2005; Trustee of The Unified Funds from 1994 to 2002; Trustee of Firstar Select Funds, a REIT mutual fund, from 1997 to 2000; Trustee of AmeriPrime Funds from December 2002 to July 2005; Trustee of CCMI Funds from June 2003 to March 2005. |
Ronald C. Tritschler (Age 55) Independent Trustee, December 2002 to present | Chief Executive Officer, Director and Legal Counsel of The Webb Companies, a national real estate company, since 2001, Executive Vice President and Director from 1990 to 2000; Director of First State Financial since 1998; Director, Vice President and Legal Counsel of The Traxx Companies, an owner and operator of convenience stores, since 1989; Trustee of AmeriPrime Advisors Trust from November 2002 to September 2005; Trustee of AmeriPrime Funds from December 2002 to July 2005; Trustee of CCMI Funds from June 2003 to March 2005. |
Principal Officers
Name, Address*, (Age), Position with Trust,** Term of Position with Trust | Principal Occupation During Past 5 Years and Other Directorships |
| ||
Anthony J. Ghoston (Age 48) President, July 2004 to present | President of Unified Fund Services, Inc., the Trust’s administrator, since June 2005, Executive Vice President from June 2004 to June 2005, Senior Vice President from April 2003 to June 2004; Senior Vice President and Chief Information Officer of Unified Financial Services, Inc., the parent company of the Trust’s administrator and distributor, from 1997 to November 2004; President of AmeriPrime Advisors Trust from July 2004 to September 2005; President of AmeriPrime Funds from July 2004 to July 2005; President of CCMI Funds from July 2004 to March 2005. |
| ||
John C. Swhear (Age 46) Senior Vice President, May 2007 to present | Vice President of Legal Administration and Compliance for Unified Fund Services, Inc., the Trust’s administrator, since April, 2007; Chief Compliance Officer of Unified Financial Securities, Inc., the Trust’s distributor, since May 2007; Employed in various positions with American United Life Insurance Company from 1983 to April 2007, including: Associate General Counsel, April 2007, Investment Adviser Chief Compliance Officer, June 2004 to April 2007, Assistant Secretary to the Board of Directors, December 2002 to April 2007, Chief Compliance Officer of OneAmerica Funds, Inc., June 2004 to April 2007, Chief Counsel and Secretary, OneAmerica Securities, Inc., December 2002 to April 2007. |
| ||
J. Michael Landis (Age 36) Interim Chief Financial Officer and Treasurer, March 2007 to present | Vice President Fund Accounting and Fund Administration for Unified Fund Services, since October, 2006; Director of Fund Accounting and Fund Administration for PFPC July 2006 - October 2006; Manager Fund Accounting for Unified Fund Services November 2004 – July 2006; Manager Fund Accounting for Mellon Financial Corporation November 1998 – November 2004. |
| ||
Lynn E. Wood (Age 61) Chief Compliance Officer, October 2004 to present | Chief Compliance Officer of AmeriPrime Advisors Trust from October 2004 to September 2005; Chief Compliance Officer of AmeriPrime Funds from October 2004 to July 2005; Chief Compliance Officer of CCMI Funds from October 2004 to March 2005; Chief Compliance Officer of Unified Financial Securities, Inc., the Trust’s distributor, from December 2004 to October 2005 and from 1997 to 2000, Chairman from 1997 to December 2004, President from 1997 to 2000; Director of Compliance of Unified Fund Services, Inc., the Trust’s administrator, from October 2003 to September 2004; Chief Compliance Officer of Unified Financial Services, Inc., the parent company of the Trust’s administrator and distributor, from 2000 to 2004. |
| ||
Heather Bonds (Age 31) Secretary, July 2005 to present; Assistant Secretary, September 2004 to June 2005 | Employed by Unified Fund Services, Inc., the Trust’s administrator, since January 2004 and from December 1999 to January 2002; Student at Indiana University School of Law – Indianapolis, J.D. Candidate in December 2007; Assistant Secretary of Dean Family of Funds since August 2004; Regional Administrative Assistant of The Standard Register Company from February 2003 to January 2004; Full time student at Indiana University from January 2002 to June 2002; Secretary of AmeriPrime Advisors Trust from July 2005 to September 2005, Assistant Secretary from September 2004 to June 2005; Assistant Secretary of AmeriPrime Funds from September 2004 to July 2005; Assistant Secretary of CCMI Funds from September 2004 to March 2005. |
| ||
* The address for each officer is 2960 North Meridian Street, Suite 300, Indianapolis, IN 46208.
** The Trust currently consists of 37 series.
OTHER INFORMATION
The Fund’s Statement of Additional Information (“SAI”) includes additional information about the trustees and is available without charge, upon request. You may call toll-free at (877) 322-0576 to request a copy of the SAI or to make shareholder inquiries.
RENEWAL OF MANAGEMENT AGREEMENT (Unaudited)
The continuation of the Management Agreement of The Roosevelt Anti-Terror Multi-Cap Fund (the “Fund”) with The Roosevelt Investment Group (the “Adviser”) was reviewed by the Advisor Contract Renewal Committee (the “Committee”) of the Board and approved by the Board, including a majority of Trustees who are not interested persons of the Trust or interested parties to the Agreement (collectively, the Independent Trustees and each an “Independent Trustee”) at an in-person meeting held on August 20, 2007. Materials provided to the Committee included: (i) executed copies of the Fund’s management agreement, (ii) a letter from the Administrator to the Adviser setting forth, and the Adviser’s response to, a detailed series of questions regarding, among other things, the Adviser’s services to the Fund, its profitability from managing the Fund and ideas for future growth for the Fund, (iii) a certification from the Adviser that it had adopted a compliance program that is reasonably designed to prevent violations of federal securities laws by the Fund, (iv) a summary of any recent SEC staff examination of the Fund or the Adviser, (v) the Adviser’s Form ADV Parts I and II and accompanying schedules, (vi) balance sheet for the Adviser as of May 31, 2007 and income statement as of December 31, 2006, (vii) reports regarding the Fund’s performance for the past three months, year-to-date and one year, and comparisons of the same to the Fund’s benchmark(s) and peer group for the same periods, and (viii) reports comparing the Fund’s advisory fee and total expenses (after fee waivers and reimbursements) to the Fund’s peer group. The Committee also interviewed the Adviser’s compliance officer with respect to these and other issues.
The Committee members noted that they had received and evaluated such information as they deemed necessary to make their recommendation. The Committee also noted that it had taken into account a number of factors that they believed to be relevant, in light of the legal advice provided by legal counsel to the Trust and legal counsel to the Independent Trustees, and their own business judgment. They noted that this included information regarding the Adviser that had been provided to the Board throughout the year at regular meetings of the Board, as well as information that was specifically furnished to the Committee in connection with its review of the Fund’s management arrangement. The Committee noted that the Adviser manages approximately $1.13 billion in assets, and that the Fund had $20 million in assets as of June 30, 2007. The Committee reviewed the responses from the Adviser as to the resources provided to the Fund, and considered the adequacy of such resources in light of the expected growth in the levels of Fund assets, and whether the resources are sufficient to sustain positive performance, compliance and other needs. The Committee noted that the Adviser has engaged an independent consultant to assist it in meeting the Fund’s “anti-terror” investment policy. The Committee determined that the Adviser’s resources to the Fund appear adequate, and specifically noted that the Adviser provides a portfolio manager, and various other staff, to provide services to the Fund (including research analysts, and the Adviser’s Chief Compliance Officer who monitors the Fund’s compliance matters). The Committee noted the Fund’s portfolio manager and support staff appeared to have adequate experience to manage the Fund and that the Fund’s portfolio manager does not manage any other investment companies. The Committee also noted the Adviser was not proposing any changes to the level of services provided to the Fund.
The Committee then reviewed various compliance reports provided by the Adviser and the Administrator to the Board throughout the year and, based on such reports, determined that the Fund’s investment policies and restrictions were consistently complied with during the last year. The Committee noted that the Trust had engaged ISS to vote the Fund’s proxies at the Adviser’s expense. The Adviser’s Chief Compliance Officer advised the Committee that the Adviser had engaged an independent consultant to conduct its annual compliance program review, and confirmed that the review did not uncover any material issues, and that no material amendments were being proposed at this time.
The Committee then reviewed a report provided by the Administrator setting forth the Fund’s performance during the 3-months, 12-months, 3-year and 5-year periods ended June 30, 2007. The Committee noted that the Fund had excellent prior performance. Specifically, they noted that the Fund’s performance during each of the periods above was higher than the average in its multi-cap core equity peer group and, further, that it had outperformed its benchmark, the S&P 500 Index, during the same periods.
The Committee then discussed the Adviser’s fee rates and profitability. The Committee reviewed the Adviser’s unaudited financial statements, including a Balance Sheet dated May 31, 2007 and an Income Statement for the 12-months ended December 31, 2006. The Committee noted that during the Fund’s last fiscal year ended November 30, 2006 the fees earned by the Adviser from the Fund were a small percentage of its total revenues from all operations. The Committee also noted that the Fund’s management fee, at 1.00%, is higher than the average of its peer group; however, they also noted that the Adviser pays for all the Fund’s operating expenses (with certain typical exceptions). The Committee also noted that, as of its last fiscal year end, the Fund’s total expense ratio was 1.36%, which was lower than its peer group’s average expense ratio of 1.57%.
The Committee noted that the Adviser has entered into soft dollar arrangements with respect to clients’ brokerage commissions, including the Fund. They noted that approximately one half of the Fund’s total brokerage commissions during the prior fiscal year were directed by the Adviser to broker-dealers who provide research to the Adviser. The Adviser represented that these research services assist the Adviser in providing portfolio management services to the Fund. The Adviser’s Chief Compliance Officer stated that the Adviser’s soft dollar practices were in compliance with regulatory requirements, and in the best interest of the Fund and its shareholders. The Committee also noted that, as permitted by the Fund’s Rule 12b-1 Plan, the Adviser receives 12b-1 fees of 0.25% of the Fund’s daily net assets from the Fund for providing shareholder services. The Administrator reported that the Adviser pays a significant portion of these fees to brokers and other financial institutions that sell Fund shares or otherwise provide services to Fund shareholders, and used the rest to pay for marketing and sales expenses related to the Fund. The Committee noted that the Fund’s assets had grown substantially after the 12b-1 Plan was implemented.
In determining the reasonableness of the advisory fees, the Committee considered whether economies of scale will be realized as the Fund grows larger, and the extent to which this is reflected in the management fees charged. The Committee noted that the Fund’s Management Agreement does not include breakpoints in advisory fees as the Fund’s assets grow larger. However, it also noted that Adviser pays all of the Fund’s operating expenses (except for typical excluded expenses), and that the Fund’s total expenses are lower than its peer group’s average. The Committee also noted that, based on the Adviser’s financial statements, it is unlikely that the Adviser has realized any significant economies of scale from managing the Fund.
The Committee reviewed the foregoing with the Board, indicating that its members had determined that the Fund’s advisory fees were reasonable and that they were unanimously recommending that the Board approve the Fund’s Management Agreement.
After reviewing and discussing the materials and the Committee’s recommendation, the Board, which is comprised solely of trustees who are not “interested persons” (within the meaning of the Investment Company Act of 1940, as amended) of the Trust determined that the Management Agreement was reasonable and renewed it for an additional year.
PROXY VOTING
A description of the policies and procedures that the Fund uses to determine how to vote proxies relating to portfolio securities and information regarding how the Fund voted those proxies during the most recent twelve month period ended November 30, is available without charge upon request by (1) calling the Fund at (877) 322-0576 and (2) from Fund documents filed with the Securities and Exchange Commission (“SEC”) on the SEC’s website at www.sec.gov.
TRUSTEES
Stephen A. Little, Chairman
Gary E. Hippenstiel
Daniel J. Condon
Ronald C. Tritschler
OFFICERS
Anthony J. Ghoston, President
John Swhear, Senior Vice-President
James M. Landis, Interim Chief Financial Officer and Treasurer
Heather A. Bonds, Secretary
Lynn Wood, Chief Compliance Officer
INVESTMENT ADVISOR
The Roosevelt Investment Group
317 Madison Avenue, Suite 1004
New York, NY 10017
DISTRIBUTOR
Unified Financial Securities, Inc.
2960 North Meridian Street, Suite 300
Indianapolis, IN 46208
INDEPENDENT REGISTERED PUBLIC ACCOUNTING FIRM
Cohen Fund Audit Services, Ltd.
800 Westpoint Parkway, Suite 1100
Westlake, OH 44145
LEGAL COUNSEL
Thompson Coburn LLP
One US Bank Plaza
St. Louis, MO 63101
LEGAL COUNSEL TO THE INDEPENDENT TRUSTEES
Thompson Hine, LLP
312 Walnut Street, 14th Floor
Cincinnati, OH 45202
CUSTODIAN
Huntington National Bank
41 South Street
Columbus, OH 43125
ADMINISTRATOR, TRANSFER AGENT AND FUND ACCOUNTANT
Unified Fund Services, Inc.
2960 North Meridian Street, Suite 300
Indianapolis, IN 46208
This report is intended only for the information of shareholders or those who have received the Fund’s prospectus which contains information about the Fund’s management fee and expenses. Please read the prospectus carefully before investing.
Distributed by Unified Financial Securities, Inc.
Member FINRA/SIPC
Item 2. Code of Ethics.
(a) As of the end of the period covered by this report, the registrant has adopted a code of ethics that applies to the registrant's principal executive officer, principal financial officer, principal accounting officer or controller, or persons performing similar functions, regardless of whether these individuals are employed by the registrant or a third party.
(b) For purposes of this item, “code of ethics” means written standards that are reasonably designed to deter wrongdoing and to promote:
(1) | Honest and ethical conduct, including the ethical handling of actual or apparent conflicts of interest between personal and professional relationships; |
| |
(2) | Full, fair, accurate, timely, and understandable disclosure in reports and documents that a registrant files with, or submits to, the Commission and in other public communications made by the registrant; |
| |
(3) | Compliance with applicable governmental laws, rules, and regulations; | ||
(4) | The prompt internal reporting of violations of the code to an appropriate person or persons identified in the code; and |
| |
(5) | Accountability for adherence to the code. | ||
(c) Amendments: During the period covered by the report, there have not been any amendments to the provisions of the code of ethics.
(d) Waivers: During the period covered by the report, the registrant has not granted any express or implicit waivers from the provisions of the code of ethics.
(e) Posting: We do not intend to post the Code of Ethics for the Officers or any amendments or waivers on a website.
(f) Availability: The Code of Ethics for the Officers can be obtained, free of charge by calling the toll free number for the appropriate Fund.
Item 3. Audit Committee Financial Expert.
(a) The registrant’s board of trustees has determined that the registrant does not have an audit committee financial expert. The committee members and the full Board considered a possibility of adding a member that would qualify as an expert. The audit committee determined that, although none of its members meet the technical definition of an audit committee expert, the committee has sufficient financial expertise to adequately perform its duties under the Audit Committee Charter without the addition of a qualified expert.
Item 4. Principal Accountant Fees and Services.
(a) | Audit Fees |
|
|
|
|
|
|
| Marco Targeted Return Fund: | FY 2007 | $13,000 |
|
| FY 2006 | $12,850 |
|
|
|
|
| Leeb Focus Fund: | FY 2007 | $12,500 |
|
| FY 2006 | N/A |
|
|
|
|
| Symons Alpha Funds: | FY 2007 | $21,250 |
|
| FY 2006 | N/A |
|
|
|
|
| Roosevelt Anti-Terror Fund: | FY 2007 | $11,000 |
|
| FY 2006 | $10,400 |
|
|
|
|
| Chinook Emerging Growth Fund: | FY 2007 | $12,500 |
|
| FY 2006 | $13,200 |
|
|
|
|
| Appleseed Fund: | FY 2007 | $12,500 |
|
| FY 2006 | N/A |
(b) | Audit-Related Fees |
|
|
|
|
|
|
| Registrant |
|
|
|
|
|
|
| Marco Targeted Return Fund: | FY 2007 | $0 |
|
| FY 2006 | $0 |
|
|
|
|
| Leeb Focus Fund: | FY 2007 | $0 |
|
| FY 2006 | N/A |
|
|
|
|
| Symons Alpha Funds: | FY 2007 | $0 |
|
| FY 2006 | N/A |
|
|
|
|
| Roosevelt Anti-Terror Fund: | FY 2007 | $0 |
|
| FY 2006 | $0 |
|
|
|
|
| Chinook Emerging Growth Fund: | FY 2007 | $0 |
|
| FY 2006 | $0 |
|
|
|
|
| Appleseed Fund: | FY 2007 | $0 |
|
| FY 2006 | N/A |
(c) | Tax Fees |
|
|
| Registrant |
|
|
|
|
|
|
| Marco Targeted Return Fund: | FY 2007 | $1,950 |
|
| FY 2006 | $1,950 |
|
|
|
|
| Leeb Focus Fund: | FY 2007 | $1,950 |
|
| FY 2006 | N/A |
|
|
|
|
| Symons Alpha Funds: | FY 2007 | $3,900 |
|
| FY 2006 | N/A |
|
|
|
|
| Roosevelt Anti-Terror Fund: | FY 2007 | $1,950 |
|
| FY 2006 | $1,950 |
|
|
|
|
| Chinook Emerging Growth Fund: | FY 2007 | $1,950 |
|
| FY 2006 | $3,950 |
|
|
|
|
| Appleseed Fund: | FY 2007 | $1,950 |
|
| FY 2006 | N/A |
|
|
|
|
| Nature of the fees: | Preparation of the 1120 RIC and Excise review | |
(d) | All Other Fees |
|
|
|
|
|
|
| Registrant |
|
|
|
|
|
|
| Marco Targeted Return Fund: | FY 2007 | $0 |
|
| FY 2006 | $0 |
|
|
|
|
| Leeb Focus Fund: | FY 2007 | $0 |
|
| FY 2006 | N/A |
|
|
|
|
| Symons Alpha Funds: | FY 2007 | $0 |
|
| FY 2006 | N/A |
|
|
|
|
| Roosevelt Anti-Terror Fund: | FY 2007 | $0 |
|
| FY 2006 | $0 |
|
|
|
|
| Chinook Emerging Growth Fund: | FY 2007 | $0 |
|
| FY 2006 | $0 |
|
|
|
|
| Appleseed Fund: | FY 2007 | $0 |
|
| FY 2006 | N/A |
(e) |
(1) | Audit Committee’s Pre-Approval Policies |
The Audit Committee Charter requires the Audit Committee to be responsible for the selection, retention or termination of auditors and, in connection therewith, to (i) evaluate the proposed fees and other compensation, if any, to be paid to the auditors, (ii) evaluate the independence of the auditors, (iii) pre-approve all audit services and, when appropriate, any non-audit services provided by the independent auditors to the Trust, (iv) pre-approve, when appropriate, any non-audit services provided by the independent auditors to the Trust's investment adviser, or any entity controlling, controlled by, or under common control with the investment adviser and that provides ongoing services to the Trust if the engagement relates directly to the operations and financial reporting of the Trust, and (v) receive the auditors’ specific representations as to their independence;
(2) | Percentages of Services Approved by the Audit Committee |
Registrant |
|
|
|
|
|
Audit-Related Fees: | 100 | % |
Tax Fees: | 100 | % |
All Other Fees: | 100 | % |
(f) During audit of registrant's financial statements for the most recent fiscal year, less than 50 percent of the hours expended on the principal accountant's engagement were attributed to work performed by persons other than the principal accountant's full-time, permanent employees.
(g) The aggregate non-audit fees billed by the registrant's accountant for services rendered to the registrant, and rendered to the registrant's investment adviser (not including any sub-adviser whose role is primarily portfolio management and is subcontracted with or overseen by another investment adviser), and any entity controlling, controlled by, or under common control with the adviser that provides ongoing services to the registrant:
| Registrant | Adviser |
|
|
|
FY 2007 | $ 0 | $ 0 |
FY 2006 | $ 0 | $ 0 |
(h) Not applicable. The auditor performed no services for the registrant’s investment adviser or any entity controlling, controlled by, or under common control with the investment adviser that provides ongoing services to the registrant.
Item 5. Audit Committee of Listed Companies. Not applicable.
Item 6. Schedule of Investments. | Not applicable – schedule filed with Item 1. |
Item 7. Disclosure of Proxy Voting Policies and Procedures for Closed-End Funds. Not applicable.
Item 8. Portfolio Managers of Closed-End Management Investment Companies. Not applicable.
Item 9. Purchases of Equity Securities by Closed-End Management Investment Company and Affiliated Purchasers. Not applicable.
Item 10. Submission of Matters to a Vote of Security Holders
The registrant has not adopted procedures by which shareholders may recommend nominees to the registrant’s board of trustees.
Item 11. Controls and Procedures.
(a) Based on an evaluation of the registrant’s disclosure controls and procedures as of December 11, 2007, the disclosure controls and procedures are reasonably designed to ensure that the information required in filings on Forms N-CSR is recorded, processed, summarized, and reported on a timely basis.
(b) There were no significant changes in the registrant’s internal control over financial reporting that occurred during the registrant’s second fiscal quarter of the period covered by this report that has materially affected, or is reasonably likely to materially affect, the registrant’s internal control over financial reporting.
Item 12. Exhibits.
(a)(1) | Code is filed herewith |
(a)(2) | Certifications by the registrant's principal executive officer and principal financial officer, pursuant to Section 302 of the Sarbanes- Oxley Act of 2002 and required by Rule 30a-2under the Investment Company Act of 1940 are filed herewith. |
(a)(3) | Not Applicable |
(b) | Certification pursuant to 18 U.S.C. Section 1350, as adopted pursuant to Section 906 of the Sarbanes-Oxley Act of 2002 is filed herewith. |
SIGNATURES
Pursuant to the requirements of the Securities Exchange Act of 1934 and the Investment Company Act of 1940, the registrant has duly caused this report to be signed on its behalf by the undersigned, thereunto duly authorized.
(Registrant) | Unified Series Trust |
By
*____ /s/ Anthony Ghoston__________________
Anthony Ghoston, President |
Date | 2/8/08 |
Pursuant to the requirements of the Securities Exchange Act of 1934 and the Investment Company Act of 1940, this report has been signed below by the following persons on behalf of the registrant and in the capacities and on the dates indicated.
By
*____/s/ Anthony Ghoston __________________
Anthony Ghoston, President
Date | 2/8/08 |
By
*____/s/ J Michael Landis__ __________________
J. Michael Landis, Treasurer
Date | 2/6/08 |