UNITED STATES
SECURITIES AND EXCHANGE COMMISSION
WASHINGTON, D.C. 20549
FORM N-CSR
CERTIFIED SHAREHOLDER REPORT OF REGISTERED MANAGEMENT
INVESTMENT COMPANIES
Investment Company Act file number 811-21237
Unified Series Trust
2960 N. Meridian Street, Ste.300, Indianapolis, In 46208
Christopher E. Kashmerick
Unified Fund Services, Inc.
2960 N. Meridian Street, Ste. 300
Indianapolis, IN 46208
(Name and address of agent for service)
Registrant's telephone number, including area code: 317-917-7000
Date of fiscal year end: 03/31
Date of reporting period: 03/31/10
Form N-CSR is to be used by management investment companies to file reports with the Commission not later than 10 days after the transmission to stockholders of any report that is required to be transmitted to stockholders under Rule 30e-1 under the Investment Company Act of 1940 (17 CFR 270.30e-1). The Commission may use the information provided on Form N-CSR in its regulatory, disclosure review, inspection and policymaking roles.
A registrant is required to disclose the information specified by Form N-CSR, and the Commission will make this information public. A registrant is not required to respond to the collection of information contained in Form N-CSR unless the Form displays a currently valid Office of Management and Budget ("OMB") control number. Please direct comments concerning the accuracy of the information collection burden estimate and any suggestions for reducing the burden to Secretary, Securities and Exchange Commission, 450 Fifth Street, NW, Washington, DC 20549-0609. The OMB has reviewed this collection of information under the clearance requirements of 44 U.S.C. § 3507.
Item 1. Reports to Stockholders.
Dean Small Cap Value Fund (DASCX)
Management’s Discussion & Analysis – Fiscal Year ending March 31, 2010
Past Year Review
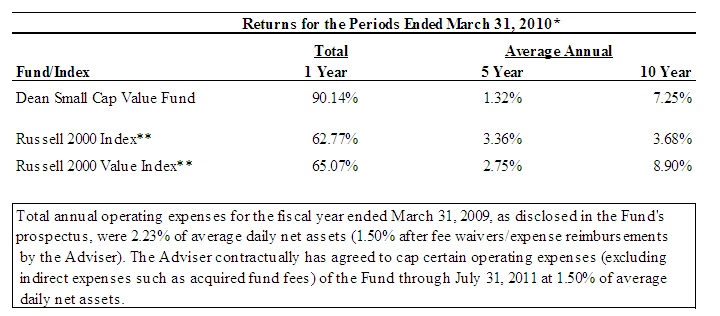
Small cap stocks have dramatically rebounded from their historic fall in late 2008 and early 2009 with an equally historic rise over the past fiscal year. For the 12 months ending March 31, 2010, the Dean Small Cap Value Fund returned a positive 90.14% net of fees compared with a positive 65.07% for the Russell 2000 Value Index and a positive 62.77% for the Russell 2000 Index.
We were extremely pleased to be up over 90% and to have outperformed our index (the Russell 2000 Value) by 25% this past fiscal year. Better yet, we accomplished this performance in an environment that was not one in which we typically would perform well.
Since the low on March 9, 2009, the market rally has been led by the lowest quality stocks; (meaning, companies that have balance sheets loaded with debt, companies that do not pay a dividend or have earnings, and companies whose stocks have historically been the most volatile). This is usually not a friendly environment for our investing style, as we tend to favor stocks with the opposite attributes: companies that have minimal debt, companies that pay a dividend and have steady earnings, and companies whose stocks have historically been less volatile than the market with a narrower range of outcomes.
So how did we outperform in such a dramatic way while operating in an unfavorable environment for our investing style? We feel it is because of our proprietary process of calculating normalized earnings.
By focusing on normalized earnings power, we felt comfortable holding large weights in high quality companies that were in the most economically sensitive industries in late 2008 and early 2009. We believed we owned asymmetrical risk versus reward situations; (meaning, we had limited downside risk, with a great deal of upside potential, as long as the business cycle eventually came back and as long as we were remotely accurate in our calculation of normalized earnings). We believe it was our disciplined process of calculating normal earnings power that led us to the economically sensitive stocks at a time when not many investors were willing to own them, thus helping us outperform this past year.
We believe that our calculation of normalized earnings is one of our competitive advantages at Dean Capital Management (DCM). Instead of using historical or next year’s projected earnings to value a company, we calculate normalized earnings (what we think a company can earn in a typical business environment over a full business cycle) for every company we purchase. We believe it is more prudent to focus on a longer time horizon by looking three to five years out versus focusing on what a company might earn in the next year. By doing this, we seek to eliminate the tendency to allow emotion to cause extrapolation of the most recent trends. We believe it provides a stable number upon which we can calculate valuations that are comparable across companies and sectors. The stabilit y of our normal earnings number was the reason we had conviction owning the most neglected stocks in March of 2009.
While we would love to have 90% absolute returns that are 25% above our benchmark every year, we recognize this will most certainly not happen. We feel it is important that we give our shareholders a sense of what they can expect from us in different types of markets.
A residual of adhering to our process is the tendency to perform well at inflection points in the market, which can be seen in our strong outperformance relative to the benchmark at the bottom of the market in March 2009 through the past fiscal year. Conversely, we tend to underperform in a momentum market; and, wherein the longer a market continues on a trend, the greater our underperformance becomes. This is evidenced by our struggles in late 2008 and early 2009 when the market had strong momentum to the downside. We held up well in the initial downturn; however, our underperformance grew as the market became more and more irrational in its behavior. Ultimately, we were rewarded for our patience and discipline when the market turned the corner in March 2009 and we more than made up fo r being a little early.
This dynamic is a function of our underemphasizing those parts of the market that are becoming popular and overvalued, while embracing those parts of the market that are becoming neglected and undervalued. By doing so, we believe we are properly being compensated for the risk we are taking in the market. We feel that continuing in the disciplined process we have always followed serves our shareholders well over the long term.
Please know that we will continue to do our best to be good stewards of your capital as we invest alongside you. You can feel comfortable that our financial interests are aligned with yours as each of our portfolio managers holds a significant portion of his investable assets in DASCX. We definitely, as the saying goes, “eat our own cooking.”
Market Perspective
Small cap stocks have historically been one of the best performing asset classes coming out of a recession, and this recession has been no different. Below is a chart comparing the Russell 2000 Index to the S&P 500 Index from the March 9, 2009 market low. The small cap outperformance has been substantial:

Even though small cap stocks have had a big run, we think they can continue to perform well going forward. Small caps could continue to benefit as the economic recovery takes hold, even if that recovery is slower than normal. They could also benefit from merger and acquisition activity picking up again after a long period of dormancy while the credit markets were frozen.
Large corporations have significant amounts of cash on their balance sheets and, given the slower growth environment the economy may be facing in the future, these companies will attempt to supplement slow organic growth through acquisitions of smaller companies. We feel this could be favorable to our investment style as the attributes we look for in companies, such as high free cash flow generation, high returns on capital, market dominance in niche businesses, and attractive valuations, are attributes that private equity buyers, as well as strategic buyers, might look for in an acquisition target.
We have already benefited from this trend with the acquisition of Foundation Coal (FCL) by Alpha Natural Resources (ANR) and the leveraged buyout of IMS Health (RX).
FCL is a coal producer in the Powder River Basin in Wyoming, as well as the North and Central Appalachian Mountains. ANR purchased FCL in order to gain access to the Powder River Basin for a 37% premium over where the stock was trading and an 85% premium from our original purchase price.
RX is a medical information and intelligence provider to large pharmaceutical companies and was a sizeable holding for DASCX in 2009. It was purchased by TPG and the CPP Investment Board for a 31% premium over where the stock was trading and a 59% premium from where we originally bought the stock. Merger and acquisition activity will likely continue to be an important performance driver of small cap stocks.
According to our work on the valuation level of the market, we see valuations of economically sensitive stocks as being stretched. We have started to rotate towards traditionally defensive stocks as they look to have much more attractive valuations. Given where we are at this point in the cycle, we feel we are getting paid more to own steady companies with good balance sheets and cash flows that are persistent regardless of the economy, versus those companies that could see a sharp rebound in earnings from an economic recovery. To put it simply, we believe an economic recovery is largely priced into the market at this point in time.
By way of reference, below is a chart of the price to DCM’s calculation of normal earnings over the last two years for the small cap universe:
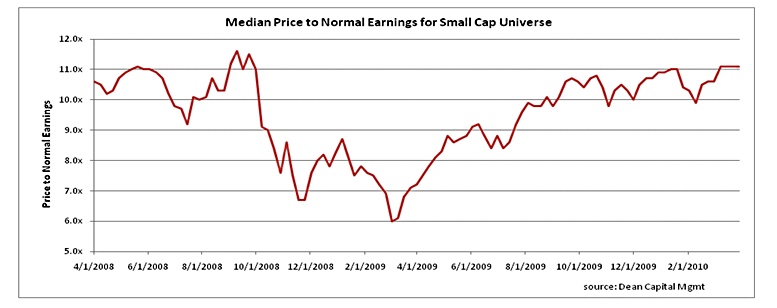
As seen in the chart, the small cap market (according to DCM’s calculations) is now at a pre-credit crisis valuation level. While this level is not extremely overvalued, it isn’t irrationally cheap like it was in March 2009, and the market seems to be pricing in a normal post World War II recovery. We believe a normal recovery is still very much in question given that we are in the midst of the largest deleveraging cycle we have seen since the Great Depression. Attractive investments in the current environment will be much less broad-based and tied to the economy then they were in 2009 and will need to be more opportunistic in nature, in our opinion.
Current Opportunities
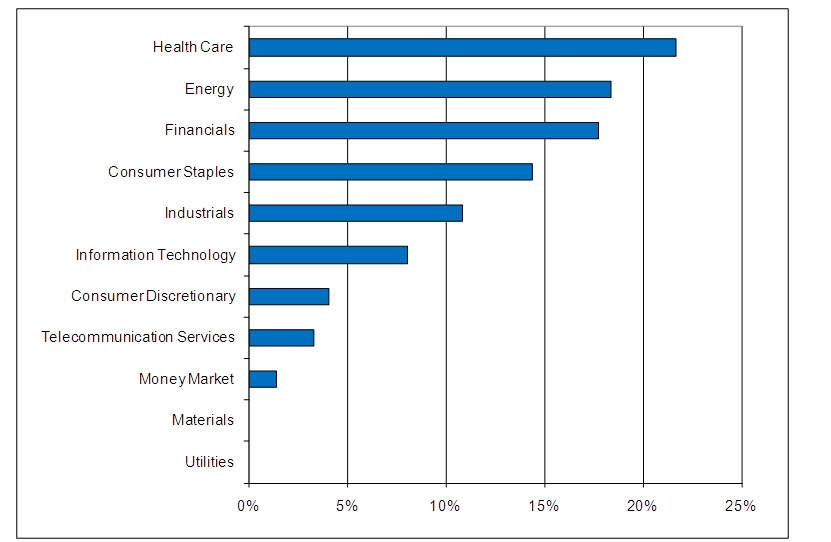
Through our bottom up, fundamental analysis, and using normal earnings as our valuation guide, we have been lowering our weight in Industrial and Consumer Discretionary companies while increasing our weight in Health Care and Consumer Staples.
Another area where we have been finding what we believe are attractive investment opportunities is in the banking industry. This is our largest industry weight with nearly 25% of the portfolio invested in small cap banks. We feel this is a large differentiating factor for DASCX relative to our benchmark and peers. It also demonstrates how we can find tremendous value in our search for good companies in neglected industries.
We own a basket of 17 bank stocks that we believe can take advantage of the current dislocations in the banking industry by acquiring failed institutions through FDIC-assisted transactions. FDIC-assisted transactions can generate a tremendous amount of value for shareholders of the acquiring firm. These types of acquisitions instantly increase the acquiring bank’s normalized earnings power, book value, and franchise value while the FDIC usually shares in 80% of the losses of the failed bank.
Our prime example to illustrate the potential from these types of situations is First Financial Bancorp (FFBC) out of Cincinnati, Ohio, which is one of our largest holdings. FFBC announced two FDIC-assisted transactions in September 2009. Prior to the acquisitions, the stock was trading around $8 per share. Following the acquisitions, and after the market recognized the earnings potential of the deals, the stock is now trading at just under $20 per share for a nearly 150% gain. This has handily outperformed the market over that time frame. We hope to have more stocks like FFBC in our basket of bank stocks.
One of our most recent purchases, GeoEye, Inc. (GEOY), is an example of an opportunistic investment, and also demonstrates how we like to find companies that dominate a niche market.
GEOY provides satellite imagery services worldwide by operating high resolution satellites. The company’s satellites support a variety of applications, including defense and military planning, agriculture and environmental monitoring, as well as general charting and mapping. One of GEOY’s applications is used in providing images to Google Earth and Google Maps. GEOY is one of two major players in the high resolution commercial satellite imagery industry and it holds significant market share. The stock sold off in December 2009 because of a glitch in one of its satellites. We felt the market overreacted to the situation, and this event provided us the opportunity to start a position in a unique company that dominates a niche market with the stock temporarily undervalued because of a transitory event.
Sector Highlights
The best performing sector relative to our benchmark in the last 12 months was the Financials sector, which accounted for nearly 50% of our outperformance. We benefited from our overweight in the sector, as well as from our stock selection, with our stocks returning 92% versus 49% for the index. As we mentioned, we are still finding excellent opportunities in the Financial sector, especially in small cap banks.
The worst performing sector in the last year was Consumer Staples. Most of this underperformance came in the last four months while we were increasing the weight in this underperforming sector. The market continues to favor economically sensitive sectors such as Consumer Discretionary, as well as commodity related industries, while neglecting Consumer Staples. This is providing us with some attractive opportunities.
The Last Year’s Standout Stocks
PZN:
Pzena Investment Management (PZN) was the largest contributing stock over the last year. PZN is an institutional boutique asset management firm that focuses solely on deep value equity investing. This investment style was out of favor through most of 2008 and early 2009, and the stock was under pressure as a result. We continued to believe in the process and niche focus of the firm and thought it would benefit from the market rotating back to Pzena’s investment style. Deep value investing usually does extremely well when the economy starts to come out of a recession. Our theory took hold in the second quarter of 2009 and, given the enormous appreciation of the stock, we felt it had gotten ahead of its fundamentals. Because of its stretched valuation, we exited the position.
BH (formerly SNS):
The second largest individual contributor for the period was Biglari Holdings (BH), formerly named Steak ‘n Shake (SNS). Steak ‘n Shake is a good example of the type of situation we think will be instrumental in driving outperformance in the future.
Steak ‘n Shake, which we have owned since June 2008, is a fast food restaurant franchise that is highly concentrated in the Midwest and the South. Steak ‘n Shake was a company with solid brand recognition, but the previous management team was more interested in “growth for growth’s sake” versus increasing return on invested capital. Activist investor, Sardar Biglari, agitated for change while garnering a seat on the Board and eventually becoming Chairman and CEO. Since gaining these titles, Mr. Biglari has dramatically slowed the store growth and rationalized the store base while turning around the operations in the existing restaurants. In addition, Mr. Biglari is attempting to turn the company into a mini Berkshire Hathaway by changing it into a holding company structure where he uses the cash flow generated from franchisee royalty streams to invest in unrelated businesses that offer what he feels are the best opportunities for return on invested capital. Meanwhile, he has changed the name to Biglari Holdings to alleviate the stigma a potential acquisition target might have from being acquired by a fast food company.
HMPR:
Our largest detractor over the last year was Hampton Roads Bankshares (HMPR). We underestimated the negative impact that two large acquisitions would have on the very solid balance sheet that Hampton Roads had always maintained. The two banks HMPR acquired were fraught with bad loans and it has begun to strain Hampton Roads’ balance sheet. Recognizing our mistake, we quickly sold the stock before it deteriorated further.
KNDL:
Our second largest detractor for the period was Kendle International (KNDL). Kendle is a contract research organization that provides Phase I through IV clinical research and drug development services to the pharmaceutical and biotechnology industries. Kendle announced that it would not meet analysts’ estimates due to pricing pressure, project delays, and cancellations, which caused the stock to plummet over 50% in one day. Many of Kendle’s competitors missed estimates because of the same issues. We waited for a small bounce in Kendle’s stock price and we exited the position because of deteriorating fundamentals and better opportunities elsewhere.
Bottom Line
Over the last year, we believe we have had a nice run in the market in general, and in the Dean Small Cap Value Fund in particular; however, we feel the market dynamic has changed meaningfully since March 2009. The market is beginning to price in a recovery, yet while much improved, the evidence of a full recovery is still in question. We feel there are still many great opportunities currently in the small cap space; there just aren’t as many extraordinary opportunities that we saw last year. More importantly, we believe that over long periods of time, the small cap value asset class is a superior asset class in which to be invested. This is why, as portfolio managers of the Fund, we hold such significant personal stakes in DASCX.
Thank you for your continued confidence in Dean.
Small-Cap investing involves greater risk not associated with investing in more established companies, such as greater price volatility, business risk, less liquidity and increased competitive threat.
Performance Summary
The performance quoted represents past performance, which does not guarantee future results. The investment return and principal value of an investment will fluctuate so that an investor’s shares, when redeemed, may be worth more or less than their original cost. The returns shown do not reflect deduction of taxes that a shareholder would pay on Fund distributions or the redemption of Fund shares. Current performance may be lower or higher than the performance data quoted. For more infor mation on the Dean Small Cap Value Fund, and to obtain performance data current to the most recent month-end, or to request a prospectus, please call 1-888-899-8343.
You should carefully consider the investment objectives, potential risks, management fees, and charges and expenses of the Fund before investing. The Fund’s prospectus contains this and other information about the Fund, and should be read carefully before investing.
* Return figures reflect any change in price per share and assume the reinvestment of all distributions.
**The Russell 2000 and Russell 2000 Value Indices are unmanaged benchmarks that assume reinvestment of all distributions and exclude the effect of taxes and fees. The Indices are widely recognized unmanaged indices of equity prices and are representative of a broader market and range of securities than are found in the Fund’s portfolio. Individuals cannot invest directly in the Indices; however, an individual can invest in exchange-traded Funds or other investment vehicles that attempt to track the performance of a benchmark index.

This graph shows the value of a hypothetical initial investment of $10,000 in the Fund, the Russell 2000 Index and the Russell 2000 Value Index on March 31, 2000 and held through March 31, 2010.
The Russell 2000 Index and the Russell 2000 Value Index are widely recognized unmanaged indices of common stock prices and are representative of a broader market and range of securities than are found in the Fund’s portfolio. Individuals cannot invest directly in the Indices; however, an individual can invest in exchange-traded Funds or other investment vehicles that attempt to track the performance of a benchmark index. The Index returns do not include expenses, which have been deducted from the Fund’s return. These performance figures include the change in value of the stocks in the index plus the reinvestment of dividends and are not annualized. The returns shown do not reflect deduction of taxes that a shareholder would pay on Fund distributions or the redemption of Fund shares. THE FUND’S RETU RN REPRESENTS PAST PERFORMANCE AND DOES NOT GUARANTEE OR PREDICT FUTURE RESULTS. Investment returns and principal values will fluctuate so that an investor’s shares, when redeemed, may be worth more or less than their original cost. Current performance may be lower or higher than the performance data quoted. For more information on the Dean Small Cap Value Fund, and to obtain performance data current to the most recent month-end, or to request a prospectus, please call 1-888-899-8343.
You should carefully consider the investment objectives, potential risks, management fees, and charges and expenses of the Fund before investing. The Fund’s prospectus contains this and other information about the Fund, and should be read carefully before investing.
The Fund is distributed by Unified Financial Securities, Inc., Indianapolis, IN 46208, Member FINRA.
Dean Large Cap Value Fund (DALCX)
Management’s Discussion & Analysis – Fiscal Year ending March 31, 2010
“Many shall be restored that now are fallen and many shall fall that now are in honor.” – Horace
This quote opened the classic investment tome, Security Analysis, by Benjamin Graham and David Dodd. Among a great deal of insights from this book that we use on a daily basis, this quote may be the most applicable for the last year. During the climax of the market drop in the winter of 2009, any stock with cyclical earnings and a less than exceptionally good balance sheet fell in price far beyond the massive market move down 50% or so. In contrast, utilities, packaged food companies and similar noncyclical businesses held their value and thus may be seen to have been held in honor (at least in a relative sense). Fast forward one year and nearly the opposite is true. The market does not appear to have the s ame magnitude of froth as it then was cheap. However, cyclical businesses with generally weaker fundamentals are leading the market higher seemingly every day. The Dean Large Cap Value Fund was well-positioned for this change in sentiment. We didn’t know when it might come, but every day the market continued to fall (to seemingly irrational lows), the more confident we became in our holdings. In hindsight, it feels like we should have done much more. Our conservative nature may have helped us during the fall and restrained us somewhat on the rebound. The net result, however, is that we finished the last couple of years well ahead of our benchmark indexes, as well as many funds within the same category.
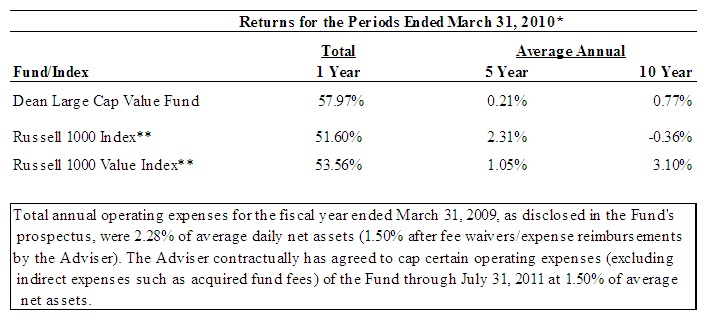
Last year, every sector in the market was up in an absolute sense. Interpreting how well an investor performed, therefore, is about comparing the results versus what he or she might have received in other opportunities (such as an index fund or peer mutual fund). In the one year period ended March 31, 2010, the Dean Large Cap Value Fund had a total return of 57.97% versus 53.56% for the benchmark Russell 1000 Value Index. The Fund performed better than 87% of Large Cap Value managers during this time, with the Morningstar median peer fund up 50.5%.
What worked in the market:
As mentioned above, the best performing stocks from March 31, 2009 to March 31, 2010 were cyclical stocks of lower quality. The market sectors led by such businesses in the period were Materials (+99%) and Consumer Discretionary (+92%). Two other leading sectors that also have a considerable cyclical nature to earnings are Industrials (+83%) and Financials (+79%).
Dean Large Cap Value suffered a little for holding a smaller portfolio weight in Materials and Consumer Discretionary. This makes sense since many of the same stocks that did so well in the period were facing the precarious fundamental position of losing money on a cash basis while being heavily indebted. In other words, bankruptcy was a very real possibility. We try to avoid such “deep value” situations where the expected payout is an all or nothing proposition. Instead, we aim to invest in the best quality businesses in these neglected groups.
The Industrial and Financials sectors were relatively profitable for us. (Remember that every sector was profitable in an absolute sense. We are discussing what worked better or worse than average). The Fund’s Industrial selections performed very well. Arguably, we rotated out of some of the winners and into more defensive names (literally and figuratively) too early. However, investments in such high-quality companies as United Technologies (UTX), Dover Corp (DOV), and Ingersoll-Rand (IR) proved very profitable.
Despite a large underweight position in Financials, the Fund did well in the group. Stocks such as Aflac (AFL) and SunTrust Banks (STI) made up for holding less Financials in total with solid returns. They are also good examples that can be argued to have been sold too soon. We feel there is a wide range of outcome situations. If the market price discounts lower value than the bottom of the wide range, then investment appears justified. However, when the price appreciates well within that implied by the range of outcomes, we are much less likely to hold on to medium quality situations. In this case, stock prices seem to have moved from below pessimistic expectations to perhaps overly optimistic fundamental expectations. The opportunity today is in avoiding suc h poor risk/reward situations.
What didn’t work:
We added significant value last year by being largely absent from poor performing sectors. In a nearly 180 degree turn from the prior period, the worst sectors last year were Telecommunications (+14%), Utilities (+22%), Energy (+28%), and Consumer Staples (+39%). We were underweight three of these for most of the year. Only in Energy did we have a modest overweight position (average 1.4% more), and this was a very small drag on performance. Consumer Staples went from being underweight to the second largest overweight late in the year.
Telecommunications was the worst performing sector and we were fortunate to hold a lower weight than the benchmark. Both AT&T (T) and Verizon (VZ) significantly underperformed the benchmark, up 9.3% and 9.2%, respectively.
The Utilities sector was the Fund’s single best group in terms of contribution to relative performance. The Fund did not own any Utilities during the year, while the benchmark holdings appreciated only 22% during this massive market recovery. Only recently have some quality utility stocks begun to be somewhat appealing from an investment point of view.
Energy was an underperforming sector last year. With an improving economic recovery underway, crude oil prices increased nearly 70% year over year. The other half of the energy commodity equation, natural gas, managed only a 2.5% increase in prices year over year. The natural gas market is suffering from a significant over-supply situation. The dynamics of the industry are somewhat different due to recent improvements in field development technology. We expect a strengthening of natural gas prices, but it may be slower in coming with improvements in the North American industrial economy. Downstream profits from refining crude oil into gasoline and other products are at decade lows. This has weighed on the stock prices, as well. The Fund’s aver age weight near 20% during the year (compared with approximately 18% for the benchmark) detracted from the Fund’s overall strong performance in the year.
The Fund’s holdings in Consumer Staples went from being more than 3% under the benchmark weight at the beginning of the year to nearly 9% over the benchmark at the end of the year. This served us well, as Consumer Staples significantly underperformed the benchmark. This massive change in sentiment (and relative value) has provided a good investment opportunity that we are positioned to take advantage of.
Other stock market return factors:
As alluded to a number of times already, the most significant event this past year has been the historic rebound in the market. It seems fitting, and perhaps predictable, that one of the largest and steepest market drops would be followed by one of the largest and steepest market recoveries. The economy most certainly has improved for most of the past year. To begin with, all the market needed was the economy to stop getting worse. In the summer of 2009, economic indicators began to move a step better by actually improving instead of simply being less bad. As such, the market recovery was very well justified by underlying fundamentals. That being said, the market finished our fiscal year end with prices up 80% from the low reached March 9, 2009. The question d u jour is whether it has gone too far, too fast. In our opinion, the answer is yes and no. There are parts of the market where prices indicate overly optimistic expectations. Still, we continue to find a number of very good companies with stock prices significantly below what we feel are justified by business fundamentals.
Value indexes outperformed growth in the year ended March 31, 2010. The simplest explanation for this deviation is that there is significantly greater weight in Financials within value benchmarks and less weight in the Consumer Staples sector.
The Russell 1000 benchmarks include the Russell Top 200 Index (largest market capitalization stocks), as well as the Russell Mid Cap Index (the next 800). Last year, mid cap stocks were up 68% compared with the Russell Top 200 Index (up 47%). As the Dean Large Cap Value Fund is predominantly large cap, this disparity was a drag on performance. Over time, this is expected to even out, but market capitalization ebbs and flows can affect performance for extended periods. We plan to remain predominately invested in the largest capitalization stocks as our name suggests.
For two years now, in our opinion, the single biggest quantitative attribute separating the winners and the losers was volatility. Volatility represents the degree of variation in the price of a stock from day to day. Usually, the greater the volatility, the more risk associated with the security or underlying business. As the economy and market were imploding, stocks with the greatest volatility led the way down, underperforming the market dramatically. When the market and economy reversed, the most volatile stocks led the way once again, this time upward. Over time, we expect the Dean Large Cap Value Fund to be invested principally in lower volatility stocks than the overall market or our benchmark index. However, when prices justify it (such as in early 2009), we will buy into the fear increasing our exposure to higher volatility stocks – while remaining in what we deem higher quality companies. The net effect for last year is that the Fund benefited significantly from buying risk (buying fear and selling safety). From the summer of 2009 through the winter of 2010 we reversed this position, which greatly reduced the exposure to higher volatility stocks more in line with historic and expected levels. This has hurt the Fund performance the last month or so of the year (March 2010), but we expect it will be a positive factor going forward.
With similar logic in opposing direction, a stock’s valuation and dividend yield was a significant factor in how stocks performed in the last couple of years. When the market was falling, higher valuation and low/no dividend yield stocks dramatically underperformed. When the market reversed, so did this factor. Last year, stocks with the highest price to earnings ratio and lowest yields led the market. A companies whose earnings were down more than other companies and that did not pay much of a dividend were deemed the most risky and sold en masse. During this past year investors changed course and flocked to weaker cyclical companies. They have led the market higher since.
Another significant event this past year is the passing of health care reform. For the first half of the year, Health Care stocks underperformed, at least partly due to investor fears over what reform might mean to their bottom line. During this time, we were buying into the fear as we felt that any bill that was passed would be significantly diluted in terms of actual change. Additionally, it was as likely as not that for many health care companies, the proposed legislation would be additive to firm value. We built the largest overweight position in the portfolio through adding medical device makers and pharmaceutical/biotech firms, in addition to the strongest health care insurer – United HealthCare (UNH). As the market’s appetite for risk has come back with a vengean ce, this group was left behind to some extent. Our stock positions have done relatively well within the group and we continue to feel that health care is one of the most opportunity rich sectors of the market.
Portfolio Positioning
Moving beyond Health Care, Dean Large Cap Value’s second largest sector overweight is in Consumer Staples. Similar to Health Care, this group is comprised of many high-quality businesses with very consistent and high returns on capital, cash generation and solid balance sheets. However, such quality is not what the market is buying today. It is our belief that the group has dramatically underperformed. The popular market strategy is to buy what could benefit most from an economic recovery. This makes sense absent the consideration of stock market prices. Much as we bought fear when it was on sale, today we are full of stocks in which we bought safety when such stocks are not popular.
On the other end of the spectrum, the Fund has relatively small weights in both Financials and Consumer Discretionary sectors. Both these groups have done very well in the market recovery. Many seem to have moved farther than justified by the fundamentals. Expectations for a complete recovery in earning power at these cyclical businesses seem premature. While there is little doubt earnings will get there, it is unlikely that it will be this year, or even next – but that is what the market prices imply expectations are. As such, we own much less than the benchmark index and what we do own are relatively higher quality and lower volatility than average.
In conclusion, we believe this has been a very good year for investors in the Dean Large Cap Value Fund. Financial disaster was largely sidestepped and the economy has started the long road back to sustained expansion. Much opportunity exists in the market and we hope and expect to profit from it. We thank you for your continued investment.
Performance Summary
The performance quoted represents past performance, which does not guarantee future results. The investment return and principal value of an investment will fluctuate so that an investor’s shares, when redeemed, may be worth more or less than their original cost. The returns shown do not reflect deduction of taxes that a shareholder would pay on Fund distributions or the redemption of Fund shares. Current performance may be lower or higher than the performance data quoted. For more infor mation on the Dean Large Cap Value Fund, and to obtain performance data current to the most recent month-end, or to request a prospectus, please call 1-888-899-8343.
You should carefully consider the investment objectives, potential risks, management fees, and charges and expenses of the Fund before investing. The Fund’s prospectus contains this and other information about the Fund, and should be read carefully before investing.
* Return figures reflect any change in price per share and assume the reinvestment of all distributions.
**The Russell 1000 and Russell 1000 Value Indices are unmanaged benchmarks that assume reinvestment of all distributions and exclude the effect of taxes and fees. The Indices are widely recognized unmanaged indices of equity prices and are representative of a broader market and range of securities than are found in the Fund’s portfolio. Individuals cannot invest directly in the Indices; however, an individual can invest in exchange-traded funds or other investment vehicles that attempt to track the performance of a benchmark index.

This graph shows the value of a hypothetical initial investment of $10,000 in the Fund, the Russell 1000 Index and the Russell 1000 Value Index on March 31, 2000 and held through March 31, 2010.
The Russell 1000 Index and the Russell 1000 Value Index are widely recognized unmanaged indices of common stock prices and are representative of a broader market and range of securities than are found in the Fund’s portfolio. Individuals cannot invest directly in the Indices; however, an individual can invest in exchange-traded funds or other investment vehicles that attempt to track the performance of a benchmark index. The Index returns do not include expenses, which have been deducted from the Fund’s return. These performance figures include the change in value of the stocks in the index plus the reinvestment of dividends and are not annualized. The returns shown do not reflect deduction of taxes that a shareholder would pay on Fund distributions or the redemption of Fund shares. THE FUND’S RETU RN REPRESENTS PAST PERFORMANCE AND DOES NOT GUARANTEE OR PREDICT FUTURE RESULTS. Investment returns and principal values will fluctuate so that an investor’s shares, when redeemed, may be worth more or less than their original cost. Current performance may be lower or higher than the performance data quoted. For more information on the Dean Large Cap Value Fund, and to obtain performance data current to the most recent month-end, or to request a prospectus, please call 1-888-899-8343.
You should carefully consider the investment objectives, potential risks, management fees, and charges and expenses of the Fund before investing. The Fund’s prospectus contains this and other information about the Fund, and should be read carefully before investing.
The Fund is distributed by Unified Financial Securities, Inc., Indianapolis, IN 46208, Member FINRA.
DEAN SMALL CAP VALUE FUND HOLDINGS - (UNAUDITED)

1As a percent of total investments.
DEAN LARGE CAP VALUE FUND HOLDINGS - (UNAUDITED)
1As a percent of total investments.
PORTFOLIO HOLDINGS
The Funds file a complete schedule of portfolio holdings with the U.S. Securities and Exchange Commission (the SEC) for the first and third quarters of each fiscal year on Form N-Q. The Funds’ Forms N-Q are available on the SEC’s website at http://www.sec.gov. In addition, the Funds’ Forms N-Q may be reviewed and copied at the Commission’s Public Reference Room in Washington, D.C. Information on the operation of the Public Reference Room may be obtained by calling 1-800-SEC-0330.
ABOUT THE FUNDS’ EXPENSES
As a shareholder of each Fund, you incur ongoing costs, including management fees, and other Fund expenses. This Example is intended to help you understand your ongoing costs (in dollars) of investing in each Fund and to compare these costs with the ongoing costs of investing in other mutual funds.
The Example is based on an investment of $1,000 invested at the beginning and held for the six month period, October 1, 2009 to March 31, 2010.
Actual Expenses
The first line of the table below provides information about actual account values and actual expenses. You may use the information in this line, together with the amount you invested, to estimate the expenses that you paid over the period. Simply divide your account value by $1,000 (for example, an $8,600 account value divided by $1,000 = 8.6), then multiply the result by the number in the first line under the heading entitled “Expenses Paid During Period” to estimate the expenses you paid on your account during this period.
Hypothetical Example for Comparison Purposes
The second line of the table below provides information about hypothetical account values and hypothetical expenses based on each Fund’s actual expense ratio and an assumed rate of return of 5% per year before expenses, which is not each Fund’s actual return. The hypothetical account values and expenses may not be used to estimate the actual ending account balance or expenses you paid for the period. You may use this information to compare the ongoing costs of investing in each Fund and other funds. To do so, compare this 5% hypothetical example with the 5% hypothetical examples that appear in the shareholder reports of other funds.
| Dean Small Cap Value Fund | Beginning Account Value October 1, 2009 | Ending Account Value March 31, 2010 | Expenses Paid During Period October 1, 2009 – March 31, 2010* | |||||||||
| Actual | $ | 1,000.00 | $ | 1,155.40 | $ | 8.06 | ||||||
| Hypothetical** | $ | 1,000.00 | $ | 1,017.45 | $ | 7.54 | ||||||
*Expenses are equal to the Fund’s annualized expense ratio of 1.50%, multiplied by the average account value over the period, multiplied by 182/365 (to reflect the partial year period).
** Assumes a 5% return before expenses.
| Dean Large Cap Value Fund | Beginning Account Value October 1, 2009 | Ending Account Value March 31, 2010 | Expenses Paid During Period October 1, 2009 – March 31, 2010* | |||||||||
| Actual | $ | 1,000.00 | $ | 1,119.23 | $ | 7.92 | ||||||
| Hypothetical** | $ | 1,000.00 | $ | 1,017.45 | $ | 7.54 | ||||||
*Expenses are equal to the Fund’s annualized expense ratio of 1.50%, multiplied by the average account value over the period, multiplied by 182/365 (to reflect the partial year period).
** Assumes a 5% return before expenses.
| DEAN SMALL CAP VALUE FUND | |||||||
| SCHEDULE OF INVESTMENTS | |||||||
| March 31, 2010 | |||||||
| Shares | COMMON STOCKS - 88.89% | Value | |||||
| Agricultural Production - Crops - 1.47% | |||||||
| 17,775 | Chiquita Brands International, Inc. * | $ | 279,601 | ||||
| Aircraft & Parts - 1.49% | |||||||
| 4,045 | Triumph Group, Inc. | 283,514 | |||||
| Book Printing - 2.89% | |||||||
| 33,235 | Courier Corp. | 548,710 | |||||
| Communication Services - 1.08% | |||||||
| 6,925 | GeoEye, Inc. * | 204,287 | |||||
| Crude Petroleum & Natural Gas - 4.24% | |||||||
| 9,420 | Berry Petroleum Co. - Class A | 265,267 | |||||
| 20,880 | Forest Oil Corp. * | 539,122 | |||||
| 804,389 | |||||||
| Electric Services - 3.22% | |||||||
| 31,645 | Portland General Electric Co. | 611,065 | |||||
| Fire, Marine & Casualty Insurance - 2.05% | |||||||
| 14,595 | Greenlight Capital Re., Ltd. - Class A * | 389,395 | |||||
| In Vitro & In Vivo Diagnostics Substances - 1.57% | |||||||
| 13,260 | Immucor, Inc. * | 296,891 | |||||
| Investment Companies - 2.59% | |||||||
| 40,352 | Prospect Capital Corp. | 490,277 | |||||
| Life Insurance - 5.64% | |||||||
| 26,605 | Delphi Financial Group, Inc. - Class A | 669,382 | |||||
| 7,465 | Torchmark Corp. | 399,452 | |||||
| 1,068,834 | |||||||
| National Commercial Banks - 15.95% | |||||||
| 33,645 | American National Bankshares, Inc. | 677,947 | |||||
| 19,165 | Centerstate Banks, Inc. | 234,771 | |||||
| 34,385 | First Financial Bancorp | 611,709 | |||||
| 12,220 | FirstMerit Corp. | 263,585 | |||||
| 23,555 | National Bankshares, Inc. | 641,874 | |||||
| 14,530 | NewAlliance Bancshares, Inc. | 183,369 | |||||
| 15,070 | Old National Bancorp | 180,086 | |||||
| 10,170 | PacWest Bancorp | 232,079 | |||||
| 3,025,420 | |||||||
*See accompanying notes for they are integral part of these financial statements.
| DEAN FUNDS | |||||||
| DEAN SMALL CAP VALUE FUND | |||||||
| SCHEDULE OF INVESTMENTS - continued | |||||||
| March 31, 2010 | |||||||
| Shares | COMMON STOCKS - 88.89% - continued | Value | |||||
| Oil & Gas Services - 1.38% | |||||||
| 12,465 | Superior Energy Services, Inc. * | $ | 262,014 | ||||
| Orthopedic, Prosthetic & Surgical Appliances & Supplies - 0.99% | |||||||
| 5,560 | STERIS Corp. | 187,150 | |||||
| Paperboard Containers & Boxes - 2.01% | |||||||
| 8,375 | Rock-Tenn Co. - Class A | 381,649 | |||||
| Pharmaceutical Preparations - 1.04% | |||||||
| 21,875 | Prestige Brands Holdings, Inc. * | 196,875 | |||||
| Radio & TV Broadcasting & Communications Equipment - 1.99% | |||||||
| 20,780 | Tekelec * | 377,365 | |||||
| Refuse Systems - 1.02% | |||||||
| 11,265 | IESI-BFC, Ltd. | 193,195 | |||||
| Retail - Eating & Drinking Places - 3.44% | |||||||
| 11,795 | Jack in the Box, Inc. * | 277,772 | |||||
| 16,920 | Sonic Corp. * | 186,966 | |||||
| 493 | Steak n Shake Co./The * | 187,966 | |||||
| 652,704 | |||||||
| Retail - Family Clothing - 1.00% | |||||||
| 5,140 | Buckle, Inc./The | 188,946 | |||||
| Retail - Grocery Stores - 2.08% | |||||||
| 14,045 | Village Super Market, Inc. - Class A | 393,681 | |||||
| Retail - Miscellaneous Shopping Goods Stores - 1.04% | |||||||
| 11,330 | Cabela's, Inc. * | 198,162 | |||||
| Savings Institution, Not Federally Chartered - 4.16% | |||||||
| 12,510 | First Niagara Financial Group, Inc. | 177,892 | |||||
| 13,910 | Home Federal Bancorp, Inc. | 201,834 | |||||
| 8,890 | MB Financial, Inc. | 200,292 | |||||
| 15,815 | Umpqua Holdings Corp. | 209,707 | |||||
| 789,725 | |||||||
| Services - Commercial Physical & Biological Research - 4.40% | |||||||
| 4,645 | Charles River Laboratories International, Inc. * | 182,595 | |||||
| 27,445 | Pharmaceutical Product Development, Inc. | 651,819 | |||||
| 834,414 | |||||||
| Services - Computer Processing & Data Preparation - 1.97% | |||||||
| 17,865 | CSG Systems International, Inc. * | 374,450 | |||||
| Services - Computer Programming Services - 1.32% | |||||||
| 66,665 | CIBER, Inc. * | 249,327 | |||||
| Services - Educational Services - 1.04% | |||||||
| 6,225 | Career Education Corp. * | 196,959 | |||||
| Services - Engineering Services - 1.98% | |||||||
| 26,814 | Ecology & Environment, Inc. - Class A | 375,932 | |||||
| Services - Management Consulting Services - 2.25% | |||||||
| 10,865 | FTI Consulting, Inc. * | 427,212 | |||||
*See accompanying notes for they are integral part of these financial statements.
| DEAN FUNDS | |||||||
| DEAN SMALL CAP VALUE FUND | |||||||
| SCHEDULE OF INVESTMENTS - continued | |||||||
| March 31, 2010 | |||||||
| Shares | COMMON STOCKS - 88.89% - continued | Value | |||||
| State Commercial Banks - 5.60% | |||||||
| 11,815 | Columbia Banking System, Inc. | $ | 239,963 | ||||
| 21,365 | CVB Financial Corp. | 212,154 | |||||
| 4,455 | Hancock Holding Co. | 186,264 | |||||
| 42,305 | United Community Banks, Inc. * | 186,565 | |||||
| 41,590 | Western Alliance Bancorp * | 236,647 | |||||
| 1,061,593 | |||||||
| Steel Works, Blast Furnaces, Rolling Mills - 2.38% | |||||||
| 10,915 | Commercial Metals Co. | 164,380 | |||||
| 50,060 | Friedman Industries, Inc. | 286,343 | |||||
| 450,723 | |||||||
| Surety Insurance - 1.10% | |||||||
| 16,495 | Old Republic International Corp. | 209,157 | |||||
| Surgical & Medical Instruments & Apparatus - 1.72% | |||||||
| 11,575 | Utah Medical Products, Inc. | 325,605 | |||||
| Telephone Communications - 1.45% | |||||||
| 17,145 | Neutral Tandem, Inc. * | 273,977 | |||||
| Wholesale - Groceries & Related Products - 1.34% | |||||||
| 7,565 | Nash Finch Co. | 254,562 | |||||
| TOTAL COMMON STOCKS (Cost $14,468,164) | 16,857,760 | ||||||
| EXCHANGE-TRADED NOTES - 1.40% | |||||||
| 12,690 | iPath S&P 500 VIX Short-Term Futures | 266,617 | |||||
| TOTAL EXCHANGE-TRADED NOTES (Cost $301,785) | 266,617 | ||||||
| MONEY MARKET SECURITIES - 4.38% | |||||||
| 829,919 | AIM STIT-STIC Prime Portfolio - Class I, 0.11% (a) | 829,919 | |||||
| TOTAL MONEY MARKET SECURITIES (Cost $829,919) | 829,919 | ||||||
| Principal | |||||||
| Amount | |||||||
| CONVERTIBLE CORPORATE BONDS - 5.30% | |||||||
| $ | 398,000 | ADC Telecommunications, Inc., 3.50%, 7/15/2015 | 326,857 | ||||
| 184,000 | Chemed Corp., 1.875%, 5/15/2014 | 169,050 | |||||
| 158,000 | DST Systems, Inc., 4.125%, 8/15/2023 (b) | 162,937 | |||||
| 179,000 | LifePoint Hospitals, Inc., 3.50%, 5/15/2014 | 179,448 | |||||
| 188,000 | Pantry, Inc., 3.00%, 11/15/2012 | 166,850 | |||||
| TOTAL CONVERTIBLE CORPORATE BONDS (Cost $945,723) | 1,005,142 | ||||||
| TOTAL INVESTMENTS (Cost $16,545,591) - 99.97% | $ | 18,959,438 | |||||
| Other assets less liabilities - 0.03% | 5,909 | ||||||
| TOTAL NET ASSETS - 100.00% | $ | 18,965,347 | |||||
| * Non-income producing securities. | |||||||
| (a) Variable rate security; the money market rate shown represents the rate at March 31, 2010. | |||||||
| (b) Variable rate security; the interest rate shown represents the rate at March 31, 2010. | |||||||
*See accompanying notes for they are integral part of these financial statements.
| DEAN LARGE CAP VALUE FUND | |||||||
| SCHEDULE OF INVESTMENTS | |||||||
| March 31, 2010 | |||||||
| Shares | COMMON STOCKS - 98.57% | Value | |||||
| Beverages - 2.09% | |||||||
| 4,488 | PepsiCo, Inc. | $ | 296,926 | ||||
| Biological Products - 2.29% | |||||||
| 5,448 | Amgen, Inc. * | 325,573 | |||||
| Books: Publishing or Publishing and Printing - 2.06% | |||||||
| 8,220 | McGraw-Hill Companies, Inc. | 293,043 | |||||
| Computer & Office Equipment - 1.97% | |||||||
| 5,277 | Hewlett-Packard Co. | 280,473 | |||||
| Converted Paper & Paperboard Products - 1.45% | |||||||
| 3,288 | Kimberly-Clark Corp. | 206,749 | |||||
| Crude Petroleum & Natural Gas - 4.79% | |||||||
| 4,553 | Apache Corp. | 462,130 | |||||
| 3,389 | Devon Energy Corp. | 218,353 | |||||
| 680,483 | |||||||
| Electromedical & Electrotherapeutic Apparatus - 3.37% | |||||||
| 10,645 | Medtronic, Inc. | 479,344 | |||||
| Fire, Marine & Casualty Insurance - 3.60% | |||||||
| 9,611 | Allstate Corp. | 310,531 | |||||
| 10,535 | Progressive Corp. | 201,113 | |||||
| 511,644 | |||||||
| Food & Kindred Products - 2.02% | |||||||
| 8,107 | Campbell Soup Co. | 286,582 | |||||
| Guided Missiles & Space Vehicles & Parts - 2.03% | |||||||
| 3,465 | Lockheed Martin Corp. | 288,357 | |||||
| Hospital & Medical Service Plans - 1.98% | |||||||
| 8,600 | UnitedHealth Group, Inc. | 280,962 | |||||
| Insurance Agents Brokers & Services - 1.51% | |||||||
| 4,940 | MetLife, Inc. | 214,100 | |||||
| National Commercial Banks - 8.89% | |||||||
| 14,569 | Bank of America Corp. | 260,057 | |||||
| 11,584 | JPMorgan Chase & Co. | 518,384 | |||||
| 7,815 | U.S. Bancorp | 202,252 | |||||
| 9,105 | Wells Fargo & Co. | 283,348 | |||||
| 1,264,041 | |||||||
| Oil & Gas Field Machinery & Equipment - 1.87% | |||||||
| 5,691 | Baker Hughes, Inc. | 266,566 | |||||
*See accompanying notes for they are integral part of these financial statements.
| DEAN FUNDS | |||||||
| DEAN LARGE CAP VALUE FUND | |||||||
| SCHEDULE OF INVESTMENTS - continued | |||||||
| March 31, 2010 | |||||||
| Shares | COMMON STOCKS - 98.57% - continued | Value | |||||
| Petroleum Refining - 11.73% | |||||||
| 6,070 | Chevron Corp. | $ | 460,288 | ||||
| 10,749 | ConocoPhillips | 550,026 | |||||
| 6,300 | Exxon Mobil Corp. | 421,974 | |||||
| 4,199 | Murphy Oil Corp. | 235,942 | |||||
| 1,668,230 | |||||||
| Pharmaceutical Preparations - 7.67% | |||||||
| 12,490 | Eli Lilly & Co. | 452,388 | |||||
| 5,311 | Johnson & Johnson | 346,277 | |||||
| 17,030 | Pfizer, Inc. | 292,065 | |||||
| 1,090,730 | |||||||
| Pumps & Pumping Equipment - 3.03% | |||||||
| 8,022 | ITT Corp. | 430,059 | |||||
| Radio & TV Broadcasting & Communications Equipment - 3.32% | |||||||
| 5,147 | L-3 Communications Holdings, Inc. | 471,620 | |||||
| Retail - Drug Stores and Proprietary Stores - 2.21% | |||||||
| 8,579 | CVS Caremark Corp. | 313,648 | |||||
| Retail - Grocery Stores - 2.22% | |||||||
| 12,688 | Safeway, Inc. | 315,424 | |||||
| Services - Advertising Agencies - 2.05% | |||||||
| 7,512 | Omnicom Group, Inc. | 291,541 | |||||
| Services - Computer Integrated Systems Design - 2.82% | |||||||
| 7,368 | Computer Sciences Corp. * | 401,482 | |||||
| Services - Prepackaged Software - 3.27% | |||||||
| 15,900 | Microsoft Corp. | 465,393 | |||||
| Ship & Boat Building & Repairing - 2.46% | |||||||
| 4,527 | General Dynamics Corp. | 349,484 | |||||
| Specialty Cleaning, Polishing and Sanitation Preparations - 2.44% | |||||||
| 5,419 | Clorox Co. | 347,575 | |||||
| State Commercial Banks - 3.75% | |||||||
| 7,633 | Bank of New York Mellon Corp. | 235,707 | |||||
| 5,386 | Northern Trust Corp. | 297,630 | |||||
| 533,337 | |||||||
| Surgical & Medical Instruments & Apparatus - 6.36% | |||||||
| 4,383 | C.R. Bard, Inc. | 379,655 | |||||
| 9,162 | Stryker Corp. | 524,250 | |||||
| 903,905 | |||||||
*See accompanying notes for they are integral part of these financial statements.
| DEAN FUNDS | |||||||
| DEAN LARGE CAP VALUE FUND | |||||||
| SCHEDULE OF INVESTMENTS - continued | |||||||
| March 31, 2010 | |||||||
| Shares | COMMON STOCKS - 98.57% - continued | Value | |||||
| Telephone Communications (No Radiotelephone) - 3.33% | |||||||
| 8,600 | AT&T, Inc. | $ | 222,224 | ||||
| 8,100 | Verizon Communications, Inc. | 251,262 | |||||
| 473,486 | |||||||
| Wholesale - Groceries & Related Products - 1.99% | |||||||
| 9,611 | Sysco Corp. | 283,525 | |||||
| TOTAL COMMON STOCKS (Cost $13,218,423) | 14,014,282 | ||||||
| MONEY MARKET SECURITIES - 1.45% | |||||||
| 206,108 | AIM STIT-STIC Prime Portfolio - Class I, 0.11% (a) | 206,108 | |||||
| TOTAL MONEY MARKET SECURITIES (Cost $206,108) | 206,108 | ||||||
| TOTAL INVESTMENTS (Cost $13,424,531) - 100.02% | $ | 14,220,390 | |||||
| Liabilities in excess of other assets - (0.02)% | (2,677 | ) | |||||
| TOTAL NET ASSETS - 100.00% | $ | 14,217,713 | |||||
| * Non-income producing securities. | |||||||
| (a) Variable rate security; the money market rate shown represents the rate at March 31, 2010. | |||||||
*See accompanying notes for they are integral part of these financial statements.
| DEAN FUNDS | ||||||||
| STATEMENTS OF ASSETS & LIABILITIES | ||||||||
| March 31, 2010 | ||||||||
| Small Cap | Large Cap | |||||||
| Value Fund | Value Fund | |||||||
| ASSETS | ||||||||
| Investment in securities: | ||||||||
| At cost | $ | 16,545,591 | $ | 13,424,531 | ||||
| At value | $ | 18,959,438 | $ | 14,220,390 | ||||
| Receivable for investments sold | 96,904 | - | ||||||
| Dividends receivable | 40,454 | 17,196 | ||||||
| Prepaid expenses | 10,731 | 10,816 | ||||||
| Interest receivable | 9,600 | 15 | ||||||
| Receivable for fund shares sold | 5,275 | - | ||||||
| TOTAL ASSETS | 19,122,402 | 14,248,417 | ||||||
| LIABILITIES | ||||||||
| Payable for investments purchased | 124,683 | - | ||||||
| Payable to Adviser (a) | 4,149 | 5,527 | ||||||
| Payable to Administrator | 7,874 | 6,283 | ||||||
| Payable to trustees & officers | 858 | 857 | ||||||
| Accrued expenses | 19,491 | 18,037 | ||||||
| TOTAL LIABILITIES | 157,055 | 30,704 | ||||||
| NET ASSETS | $ | 18,965,347 | $ | 14,217,713 | ||||
| NET ASSETS CONSIST OF: | ||||||||
| Paid in capital | $ | 21,684,473 | $ | 18,969,429 | ||||
| Accumulated undistributed net investment income | 249,986 | 55,456 | ||||||
| Accumulated net realized gains (losses) from security | ||||||||
| transactions | (5,382,959 | ) | (5,603,031 | ) | ||||
| Net unrealized appreciation (depreciation) on investments | 2,413,847 | 795,859 | ||||||
| NET ASSETS | $ | 18,965,347 | $ | 14,217,713 | ||||
| Shares of beneficial interest outstanding (unlimited | ||||||||
| numbers of shares authorized) | 1,981,584 | 1,437,730 | ||||||
| Net asset value, offering, and redemption price per share | $ | 9.57 | $ | 9.89 | ||||
| (a) See Note 4 in the Notes to the Financial Statements. | ||||||||
*See accompanying notes for they are integral part of these financial statements.
| DEAN FUNDS | ||||||||
| STATEMENTS OF OPERATIONS | ||||||||
| For the fiscal year ended March 31, 2010 | ||||||||
| Small Cap | Large Cap | |||||||
| Value Fund | Value Fund | |||||||
| Investment Income | ||||||||
| Dividend income (Net of foreign tax withheld of $1,212 and $0, respectively) | $ | 434,435 | $ | 286,196 | ||||
| Interest | 37,776 | 240 | ||||||
| Total Income | 472,211 | 286,436 | ||||||
| Expenses | ||||||||
| Investment advisory fees (a) | 153,007 | 124,585 | ||||||
| Administration expenses | 78,462 | 62,167 | ||||||
| Out-of-pocket expenses | 25,769 | 26,380 | ||||||
| Legal expenses | 23,823 | 22,687 | ||||||
| Registration expenses | 14,549 | 14,467 | ||||||
| Audit expenses | 13,501 | 13,501 | ||||||
| Custody expenses | 16,695 | 9,074 | ||||||
| CCO expenses | 8,081 | 8,169 | ||||||
| Trustees expenses | 8,187 | 7,760 | ||||||
| Pricing expenses | 5,216 | 4,779 | ||||||
| Miscellaneous expenses | 2,696 | 2,640 | ||||||
| Insurance expenses | 1,176 | 1,175 | ||||||
| Printing expenses | 918 | 636 | ||||||
| Total Expenses | 352,080 | 298,020 | ||||||
| Fees waived by Adviser (a) | (122,570 | ) | (111,143 | ) | ||||
| Net Expenses | 229,510 | 186,877 | ||||||
| Net Investment Income | 242,701 | 99,559 | ||||||
| Realized & Unrealized Gain (Loss) | ||||||||
| Net realized gains (losses) on security transactions | 1,265,355 | (224,534 | ) | |||||
| Change in unrealized appreciation (depreciation) on investments | 7,231,116 | 5,379,292 | ||||||
| Net realized & unrealized gains (losses) on investments | 8,496,471 | 5,154,758 | ||||||
| Net increase (decrease) in net assets resulting from operations | $ | 8,739,172 | $ | 5,254,317 | ||||
| (a) See Note 4 in the Notes to the Financial Statements. | ||||||||
*See accompanying notes for they are integral part of these financial statements.
| DEAN FUNDS | |||||||||
| STATEMENTS OF CHANGES IN NET ASSETS | |||||||||
| Small Cap Value Fund | |||||||||
| Year | Year | ||||||||
| Ended | Ended | ||||||||
| March 31, | March 31, | ||||||||
| 2010 | 2009 | ||||||||
| Increase (Decrease) in Net Assets from: | |||||||||
| Operations | |||||||||
| Net investment income (loss) | $ | 242,701 | $ | 161,637 | |||||
| Net realized gains (losses) from security transactions | 1,265,355 | (2,745,582 | ) | ||||||
| Change in unrealized appreciation (depreciation) on investments | 7,231,116 | (4,008,360 | ) | ||||||
| Net increase (decrease) in net assets from operations | 8,739,172 | (6,592,305 | ) | ||||||
| Distributions | |||||||||
| From net investment income | (161,826 | ) | (172,855 | ) | |||||
| From capital gains | - | (40,651 | ) | ||||||
| Decrease in net assets from distributions to shareholders | (161,826 | ) | (213,506 | ) | |||||
| Capital Share Transactions | |||||||||
| Proceeds from shares sold | 986,097 | 1,765,715 | |||||||
| Reinvestment of distributions | 159,822 | 209,704 | |||||||
| Amounts paid for shares redeemed | (319,340 | ) | (750,029 | ) | |||||
| Net increase (decrease) in net assets from capital share transactions | 826,579 | 1,225,390 | |||||||
| Total Increase (Decrease) in Net Assets | 9,403,925 | (5,580,421 | ) | ||||||
| Net Assets | |||||||||
| Beginning of year | 9,561,422 | 15,141,843 | |||||||
| End of year | $ | 18,965,347 | $ | 9,561,422 | |||||
| Accumulated undistributed net investment income included in net assets | $ | 249,986 | $ | 161,867 | |||||
| Capital Share Transactions | |||||||||
| Shares sold | 123,453 | 214,280 | |||||||
| Shares issued in reinvestment of distributions | 17,917 | 36,281 | |||||||
| Shares redeemed | (41,622 | ) | (89,928 | ) | |||||
| Net increase (decrease) in shares outstanding | 99,748 | 160,633 | |||||||
*See accompanying notes for they are integral part of these financial statements.
| DEAN FUNDS | ||||||||
| STATEMENTS OF CHANGES IN NET ASSETS - continued | ||||||||
| Large Cap Value Fund | ||||||||
| Year | Year | |||||||
| Ended | Ended | |||||||
| March 31, | March 31, | |||||||
| 2010 | 2009 | |||||||
| Increase (Decrease) in Net Assets from: | ||||||||
| Operations | ||||||||
| Net investment income (loss) | $ | 99,559 | $ | 211,271 | ||||
| Net realized gains (losses) from security transactions | (224,534 | ) | (3,883,676 | ) | ||||
| Change in unrealized appreciation (depreciation) on investments | 5,379,292 | (2,124,415 | ) | |||||
| Net increase (decrease) in net assets resulting from operations | 5,254,317 | (5,796,820 | ) | |||||
| Distributions | ||||||||
| From net investment income | (128,145 | ) | (193,326 | ) | ||||
| Decrease in net assets from distributions to shareholders | (128,145 | ) | (193,326 | ) | ||||
| Capital Share Transactions | ||||||||
| Proceeds from shares sold | 265,249 | 1,314,973 | ||||||
| Reinvestment of distributions | 121,983 | 183,005 | ||||||
| Amounts paid for shares redeemed | (395,251 | ) | (590,041 | ) | ||||
| Net increase (decrease) in net assets from capital share transactions | (8,019 | ) | 907,937 | |||||
| Total Increase (Decrease) in Net Assets | 5,118,153 | (5,082,209 | ) | |||||
| Net Assets | ||||||||
| Beginning of year | 9,099,560 | 14,181,769 | ||||||
| End of year | $ | 14,217,713 | $ | 9,099,560 | ||||
| Accumulated undistributed net investment income included in net assets | $ | 55,456 | $ | 84,042 | ||||
| Capital Share Transactions | ||||||||
| Shares sold | 32,049 | 142,743 | ||||||
| Shares issued in reinvestment of distributions | 12,813 | 25,069 | ||||||
| Shares redeemed | (45,869 | ) | (60,931 | ) | ||||
| Net increase (decrease) in shares outstanding | (1,007 | ) | 106,881 | |||||
*See accompanying notes for they are integral part of these financial statements.
| SMALL CAP VALUE FUND | ||||||||||||||||||||||||
| FINANCIAL HIGHLIGHTS | ||||||||||||||||||||||||
| Per Share Data for a Share Outstanding Throughout Each Period | ||||||||||||||||||||||||
| For the Years ended | ||||||||||||||||||||||||
| March 31, | March 31, | March 31, | March 31, | March 31, | ||||||||||||||||||||
| 2010 | 2009 | 2008 | 2007 | 2006 | ||||||||||||||||||||
| Net asset value, beginning of year | $ | 5.08 | $ | 8.80 | $ | 15.71 | $ | 16.01 | $ | 14.33 | ||||||||||||||
| Income (loss) from investment operations: | ||||||||||||||||||||||||
| Net investment income (loss) | 0.12 | 0.08 | 0.10 | (0.07 | ) | (0.11 | ) | |||||||||||||||||
| Net realized and unrealized gains (losses) | ||||||||||||||||||||||||
| on investments | 4.45 | (3.68 | ) | (3.17 | ) | 0.53 | 2.64 | |||||||||||||||||
| Total income (loss) from investment operations | 4.57 | (3.60 | ) | (3.07 | ) | 0.46 | 2.53 | |||||||||||||||||
| Less distributions: | ||||||||||||||||||||||||
| From net investment income | (0.08 | ) | (0.10 | ) | (0.01 | ) | - | - | ||||||||||||||||
| From net realized gains | - | (0.02 | ) | (3.83 | ) | (0.76 | ) | (0.85 | ) | |||||||||||||||
| Total distributions | (0.08 | ) | (0.12 | ) | (3.84 | ) | (0.76 | ) | (0.85 | ) | ||||||||||||||
| Net asset value, end of year | $ | 9.57 | $ | 5.08 | $ | 8.80 | $ | 15.71 | $ | 16.01 | ||||||||||||||
Total Return (a) | 90.14 | % | -41.11 | % | -21.57 | % | (b) | 2.95 | % | (b) | 18.22 | % | (b) | |||||||||||
| Ratios and Supplemental Data | ||||||||||||||||||||||||
| Net assets, end of year | $ | 18,965,347 | $ | 9,561,422 | $ | 15,141,843 | $ | 20,890,814 | $ | 19,007,165 | ||||||||||||||
| Ratio of expenses to average net assets: | ||||||||||||||||||||||||
| After fee waivers and/or expense | ||||||||||||||||||||||||
| reimbursement by Adviser | ||||||||||||||||||||||||
| and Administrator | 1.50 | % | 1.50 | % | (d) | 1.50 | % | 1.83 | % | 1.85 | % | |||||||||||||
| Before fee waivers and/or expense | ||||||||||||||||||||||||
| reimbursement by Adviser | ||||||||||||||||||||||||
| and Administrator | 2.30 | % | 2.42 | % | 2.14 | % | 2.16 | % | 2.15 | % | ||||||||||||||
| Ratio of net investment income (loss) to average net assets: | ||||||||||||||||||||||||
| After fee waivers and/or expense | ||||||||||||||||||||||||
| reimbursement by Adviser | ||||||||||||||||||||||||
| and Administrator | 1.58 | % | 1.22 | % | (d) | 0.77 | % | (0.45 | )% | (0.75 | )% | |||||||||||||
| Before fee waivers and/or expense | ||||||||||||||||||||||||
| reimbursement by Adviser | ||||||||||||||||||||||||
| and Administrator | 0.78 | % | 0.30 | % | 0.13 | % | (0.78 | )% | (c) | |||||||||||||||
| Portfolio turnover rate | 165 | % | 141 | % | 85 | % | 149 | % | 48 | % | ||||||||||||||
| (a) Total return represents the rate that the investor would have earned or lost on an investment in the Fund, assuming reinvestment of dividends. | ||||||||||||||||||||||||
| (b) Total returns shown exclude the effect of applicable sales loads. | ||||||||||||||||||||||||
| (c) Ratio not presented prior to March 31, 2007. | ||||||||||||||||||||||||
| (d) A portion of the waiver was related to 12b-1 expenses voluntarily waived by the Adviser, equal to 0.19% of average net assets. | ||||||||||||||||||||||||
*See accompanying notes for they are integral part of these financial statements.
| DEAN FUNDS | ||||||||||||||||||||||||
| LARGE CAP VALUE FUND | ||||||||||||||||||||||||
| FINANCIAL HIGHLIGHTS (Continued) | ||||||||||||||||||||||||
| Per Share Data for a Share Outstanding Throughout Each Period | ||||||||||||||||||||||||
| For the Years ended | ||||||||||||||||||||||||
| March 31, | March 31, | March 31, | March 31, | March 31, | ||||||||||||||||||||
| 2010 | 2009 | 2008 | 2007 | 2006 | ||||||||||||||||||||
| Net asset value, beginning of year | $ | 6.32 | $ | 10.65 | $ | 12.52 | $ | 11.40 | $ | 10.18 | ||||||||||||||
| Income (loss) from investment operations: | ||||||||||||||||||||||||
| Net investment income (loss) | 0.07 | 0.15 | 0.18 | (0.01 | ) | (0.01 | ) | |||||||||||||||||
| Net realized and unrealized gains (losses) | ||||||||||||||||||||||||
| on investments | 3.59 | (4.34 | ) | (1.92 | ) | 1.13 | 1.23 | |||||||||||||||||
| Total income (loss) from investment operations | 3.66 | (4.19 | ) | (1.74 | ) | 1.12 | 1.22 | |||||||||||||||||
| Less distributions: | ||||||||||||||||||||||||
| From net investment income | (0.09 | ) | (0.14 | ) | (0.13 | ) | - | - | ||||||||||||||||
| Total distributions | (0.09 | ) | (0.14 | ) | (0.13 | ) | - | - | ||||||||||||||||
| Net asset value, end of year | $ | 9.89 | $ | 6.32 | $ | 10.65 | $ | 12.52 | $ | 11.40 | ||||||||||||||
Total Return (a) | 57.97 | % | -39.52 | % | -14.02 | % | (b) | 9.85 | % | (b) | 11.98 | % | (b) | |||||||||||
| Ratios and Supplemental Data | ||||||||||||||||||||||||
| Net assets, end of year | $ | 14,217,713 | $ | 9,099,560 | $ | 14,181,769 | $ | 16,875,525 | $ | 8,167,690 | ||||||||||||||
| Ratio of expenses to average net assets: | ||||||||||||||||||||||||
| After fee waivers and/or expense | ||||||||||||||||||||||||
| reimbursement by Adviser | ||||||||||||||||||||||||
| and Administrator | 1.50 | % | 1.50 | % | (d) | 1.50 | % | 1.85 | % | 1.85 | % | |||||||||||||
| Before fee waivers and/or expense | ||||||||||||||||||||||||
| reimbursement by Adviser | ||||||||||||||||||||||||
| and Administrator | 2.39 | % | 2.47 | % | 2.23 | % | 2.44 | % | 2.73 | % | ||||||||||||||
| Ratio of net investment income (loss) to average net assets: | ||||||||||||||||||||||||
| After fee waivers and/or expense | ||||||||||||||||||||||||
| reimbursement by Adviser | ||||||||||||||||||||||||
| and Administrator | 0.80 | % | 1.73 | % | (d) | 1.46 | % | (0.69 | )% | (0.07 | )% | |||||||||||||
| Before fee waivers and/or expense | ||||||||||||||||||||||||
| reimbursement by Adviser | ||||||||||||||||||||||||
| and Administrator | (0.09 | )% | 0.76 | % | 0.73 | % | (0.10 | )% | (c) | |||||||||||||||
| Portfolio turnover rate | 62 | % | 77 | % | 24 | % | 124 | % | 62 | % | ||||||||||||||
| (a) Total return represents the rate that the investor would have earned or lost on an investment in the Fund, assuming reinvestment of dividends. | ||||||||||||||||||||||||
| (b) Total returns shown exclude the effect of applicable sales loads. | ||||||||||||||||||||||||
| (c) Ratio not presented prior to March 31, 2007. | ||||||||||||||||||||||||
| (d) A portion of the waiver was related to 12b-1 expenses voluntarily waived by the Adviser, equal to 0.19% of average net assets. | ||||||||||||||||||||||||
*See accompanying notes for they are integral part of these financial statements.
DEAN FUNDS
NOTES TO THE FINANCIAL STATEMENTS
March 31, 2010
NOTE 1. Organization
The Dean Small Cap Value Fund (the “Small Cap Fund”) and the Dean Large Cap Value Fund (the “Large Cap Fund”) (each a “Fund” and, collectively the “Funds”) were organized as diversified series of Unified Series Trust (the “Trust”) on November 13, 2006. The Trust is an open-end investment company established under the laws of Ohio by an Agreement and Declaration of Trust dated October 17, 2002 (the “Trust Agreement”).
The Small Cap Fund acquired all of the assets and liabilities of the Dean Small Cap Value Fund, a series of Dean Family of Funds, and Class A shares of the acquired funds were exchanged for shares of the identically named Fund. In the same reorganization, the Large Cap Fund acquired all of the assets and liabilities of each of the Dean Large Cap Value Fund and the Dean Balanced Fund, each a series of the Dean Family of Funds (each “Predecessor Fund”, collectively, “Predecessor Funds”), in a tax-free reorganization at the close of business on March 30, 2007. In connection with this acquisition, Class A shares of the acquired funds were exchanged for shares of the Large Cap Value Fund. The Small Cap Fund’s and Large Cap Fund’s predecessor each commenced operations on May 28, 1997. For the periods prior to March 31, 2007, the financial highlight information included herein or incorporated by reference into these Financial Statements, is that of the predecessor Dean Small Cap Value and Dean Large Cap Value Class A shares. Prior to October 28, 2006, each of the Funds’ Predecessors offered Class C shares for purchase. On October 27, 2006, the Class C shares of each Predecessor Fund were reclassified to the Class A shares of each respective Predecessor Fund.
The Trust Agreement permits the Trustees to issue an unlimited number of shares of beneficial interest of separate series. The Funds are series of funds currently authorized by the Trustees. The investment adviser to each Fund is Dean Investment Associates, LLC (“Dean Investment Associates” or “Adviser”). In addition, the Adviser has retained Dean Capital Management, LLC (“DCM” or “Sub-Adviser”) to serve as sub-adviser to the Funds. DCM is an affiliate of the Adviser. The investment objective of the Small Cap Fund and the Large Cap Fund is long-term capital appreciation and, secondarily, dividend income.
NOTE 2. Significant Accounting Policies
The following is a summary of significant accounting policies followed by the Funds in the preparation of their financial statements.
Securities Valuation – All investments in securities are recorded at their estimated fair value as described in Note 3.
Federal Income Taxes – The Funds make no provision for federal income or excise tax. The Funds intend to qualify each year as regulated investment companies (“RICs”) under subchapter M of the Internal Revenue Code of 1986, as amended, by complying with the requirements applicable to RICs and by distributing substantially all of their taxable income. The Funds also intend to distribute sufficient net investment income and net capital gains, if any, so that they will not be subject to excise tax on undistributed income and gains. If the required amount of net investment income or gains is not distributed, the Funds could incur a tax expense.
As of and during the fiscal year ended March 31, 2010, the Funds did not have a liability for any unrecognized tax benefits. The Funds recognize interest and penalties, if any, related to unrecognized tax benefits as income tax expense in the statement of operations. During the year, the Funds did not incur any interest or penalties. The Funds are not subject to examination by U.S. federal tax authorities for tax years prior to 2006.
Expenses – Expenses incurred by the Trust that do not relate to a specific fund of the Trust are allocated to the individual funds based on each fund’s relative net assets or another appropriate basis (as determined by the Board).
Security Transactions and Related Income - The Funds follow industry practice and record security transactions on the trade date. The specific identification method is used for determining gains or losses for financial statements and income tax purposes. Dividend income is recorded on the ex-dividend date and interest income is recorded on an accrual basis. Discounts and premiums on securities purchased are amortized or accreted using the effective interest method. Distributions received from investments in real estate investment trusts (“REITS”) that represent a return of capital or capital gain are recorded as a reduction of the cost of investment or as a realized gain, respectively. The calendar year-end amounts of ordinary income, capital gains, and return of capital included in distributions received from the Funds’ investments in REITS are reported to the Funds after the end of the calendar year; accordingly, the Funds estimate these amounts for accounting purposes until the characterization of REIT distributions is reported to the Funds after the end of the calendar year.
DEAN FUNDS
NOTES TO THE FINANCIAL STATEMENTS
March 31, 2010
NOTE 2. Significant Accounting Policies - continued
Estimates are based on the most recent REIT distributions information available. Distributions received from investments in publicly traded partnerships are recorded as a reduction of the cost of the investment. Withholding taxes on foreign dividends and related reclaims have been provided for in accordance with the Funds’ understanding of the applicable country’s tax rules and rates. The ability of issuers of debt securities held by the Funds to meet their obligations may be affected by economic and political developments in a specific country or region. For bonds that miss a scheduled interest payment, after the grace period, all interest accrued on the bond is written off and no additional interest will be accrued. However, for illiquid or fair valued bonds, if the Adviser’s research indicates a high recovery rate in restructuring, and the Funds expect to hold the bond until the issue is restructured, past due interest may not be written off in its entirety.
Dividends and Distributions - The Funds intend to distribute substantially all of their net investment income as dividends to their shareholders on at least an annual basis. The Funds intend to distribute their net realized long-term capital gains and their net realized short-term capital gains at least once a year. Distributions to shareholders, which are determined in accordance with income tax regulations, are recorded on the ex-dividend date. The treatment for financial reporting purposes of distributions made to shareholders during the year from net investment income or net realized capital gains may differ from their ultimate treatment for federal income tax purposes. These differences are caused primarily by differences in the ti ming of the recognition of certain components of income, expense or realized capital gain for federal income tax purposes. Where such differences are permanent in nature, they are reclassified in the components of the net assets based on their ultimate characterization for federal income tax purposes. Any such reclassifications will have no effect on net assets, results of operations or net asset values per share of the Funds. For the fiscal year ended March 31, 2010, the Small Cap Fund reclassified $5,701 from paid in capital to accumulated net investment income, and reclassified $1,543 from accumulated realized gains to accumulated net investment income, related to the tax treatment of income from certain investments.
Subsequent Events – In accordance with accounting principles generally accepted in the United States of America (“GAAP”), management has evaluated subsequent events through the date these financial statements were issued and determined there were no material subsequent events, except as otherwise noted in these notes.
NOTE 3. Securities Valuation and Fair Value Measurements
Fair value is defined as the price that a fund would receive upon selling an investment in a timely transaction to an independent buyer in the principal or most advantageous market of the investment. GAAP establishes a three-tier hierarchy to maximize the use of observable market data and minimize the use of unobservable inputs and to establish classification of fair value measurements for disclosure purposes.
Inputs refer broadly to the assumptions that market participants would use in pricing the asset or liability, including assumptions about risk (the risk inherent in a particular valuation technique used to measure fair value including such a pricing model and/or the risk inherent in the inputs to the valuation technique). Inputs may be observable or unobservable. Observable inputs are inputs that reflect the assumptions market participants would use in pricing the asset or liability developed based on market data obtained from sources independent of the reporting entity. Unobservable inputs are inputs that reflect the reporting entity’s own assumptions about the assumptions market participants would use in pricing the asset or liability developed based on the best information available in the circumstances.
DEAN FUNDS
NOTES TO THE FINANCIAL STATEMENTS
March 31, 2010
NOTE 3. Securities Valuation and Fair Value Measurements - continued
Various inputs are used in determining the value of the Funds’ investments. These inputs are summarized in the three broad levels listed below.
| · | Level 1 – quoted prices in active markets for identical securities |
| · | Level 2 – other significant observable inputs (including, but not limited to, quoted prices for an identical security in an inactive market, quoted prices for similar securities, interest rates, prepayment speeds, credit risk, etc.) |
| · | Level 3 – significant unobservable inputs (including each Fund’s own assumptions in determining fair value of investments based on the best information available) |
The inputs used to measure fair value may fall into different levels of the fair value hierarchy. In such cases, for disclosure purposes, the level in the fair value hierarchy within which the fair value measurement falls in its entirety, is determined based on the lowest level input that is significant to the fair value measurement in its entirety.
Equity securities, including common stocks and exchange-traded notes, are generally valued by using market quotations, but may be valued on the basis of prices furnished by a pricing service when the Adviser believes such prices more accurately reflect the fair value of such securities. Securities that are traded on any stock exchange are generally valued by the pricing service at the last quoted sale price. Lacking a last sale price, an exchange traded security is generally valued by the pricing service at its last bid price. Securities traded in the NASDAQ over-the-counter market are generally valued by the pricing service at the NASDAQ Official Closing Price. When using the market quotations or close prices provided by the pricing service and when the market is considered active, the secur ity will be classified as a Level 1 security. Sometimes, an equity security owned by the Funds will be valued by the pricing service with factors other than market quotations or when the market is considered inactive. When this happens, the security will be classified as a Level 2 security. When market quotations are not readily available, when the Adviser determines that the market quotation or the price provided by the pricing service does not accurately reflect the current fair value, or when restricted or illiquid securities are being valued, such securities are valued as determined in good faith by the Adviser, in conformity with guidelines adopted by and subject to review by the Board. These securities will be categorized as Level 3 securities.
Investments in mutual funds, including money market mutual funds, are generally priced at the ending net asset value (NAV) provided by the service agent of the funds. These securities will be categorized as Level 1 securities.
Fixed income securities, such as convertible corporate bonds, when valued using market quotations in an active market, will be categorized as Level 1 securities. However, they may be valued on the basis of prices furnished by a pricing service when the Adviser believes such prices more accurately reflect the fair value of such securities. A pricing service utilizes electronic data processing techniques based on yield spreads relating to securities with similar characteristics to determine prices for normal institutional-size trading units of debt securities without regard to sale or bid prices. These securities will generally be categorized as Level 2 securities. If the Adviser decides that a price provided by the pricing service does not accurately reflect the fair value of the securities, when prices are not readily available from a pricing service, or when restricted or illiquid securities are being valued, securities are valued at fair value as determined in good faith by the Advisor, in conformity with guidelines adopted by and subject to review of the Board. These securities will be categorized as Level 3 securities.
Short-term investments in fixed income securities (those with maturities of less than 60 days when acquired, or which subsequently are within 60 days of maturity) are valued by using the amortized cost method of valuation, which the Board has determined will represent fair value. These securities will be classified as Level 2 securities.
DEAN FUNDS
NOTES TO THE FINANCIAL STATEMENTS
March 31, 2010
NOTE 3. Securities Valuation and Fair Value Measurements - continued
In accordance with the Trust’s good faith pricing guidelines, the Adviser is required to consider all appropriate factors relevant to the value of securities for which it has determined other pricing sources are not available or reliable as described above. No single standard exists for determining fair value, because fair value depends upon the circumstances of each individual case. As a general principle, the current fair value of an issue of securities being valued by the Adviser would appear to be the amount which the owner might reasonably expect to receive for them upon their current sale. Methods which are in accordance with this principle may, for example, be based on (i) a multiple of earnings; (ii) a discount from market of a similar freely traded security (including a derivative security or a basket of securities trade d on other markets, exchanges or among dealers); or (iii) yield to maturity with respect to debt issues, or a combination of these and other methods. Good faith pricing is permitted if, in the Adviser’s opinion, the validity of market quotations appears to be questionable based on factors such as evidence of a thin market in the security based on a small number of quotations, a significant event occurs after the close of a market but before a Fund’s NAV calculation that may affect a security’s value, or the Adviser is aware of any other data that calls into question the reliability of market quotations. Good faith pricing may also be used in instances when the bonds the Funds invest in may default or otherwise cease to have market quotations readily available.
The following is a summary of the inputs used at March 31, 2010 in valuing the Small Cap Fund’s investments:
| Valuation Inputs | ||||||||||||||||
| Assets | Level 1 - Quoted Prices in Active Markets | Level 2 - Other Significant Observable Inputs | Level 3 - Significant Unobservable Inputs | Total | ||||||||||||
| Common Stocks* | $ | 16,857,760 | $ | - | $ | - | $ | 16,857,760 | ||||||||
| Exchange-Traded Notes | 266,617 | - | - | 266,617 | ||||||||||||
| Convertible Corporate Bonds | - | 1,005,142 | - | 1,005,142 | ||||||||||||
| Money Market Securities | 829,919 | - | - | 829,919 | ||||||||||||
| Total | $ | 17,954,296 | $ | 1,005,142 | $ | - | $ | 18,959,438 | ||||||||
| *Refer to the Schedule of Investments for industry classifications. | ||||||||||||||||
The following is a summary of the inputs used at March 31, 2010 in valuing the Large Cap Fund’s investments:
| Valuation Inputs | ||||||||||||||||
| Assets | Level 1 - Quoted Prices in Active Markets | Level 2 - Other Significant Observable Inputs | Level 3 - Significant Unobservable Inputs | Total | ||||||||||||
| Common Stocks* | $ | 14,014,282 | $ | - | $ | - | $ | 14,014,282 | ||||||||
| Money Market Securities | 206,108 | - | - | 206,108 | ||||||||||||
| Total | $ | 14,220,390 | $ | - | $ | - | $ | 14,220,390 | ||||||||
| *Refer to the Schedule of Investments for industry classifications. | ||||||||||||||||
The Funds did not hold any investments at any time during the reporting period in which significant unobservable inputs were used in determining fair value; therefore, no reconciliation of Level 3 securities is included for this reporting period. The Funds did not hold any derivative instruments during the reporting period.
DEAN FUNDS
NOTES TO THE FINANCIAL STATEMENTS - continued
March 31, 2010
NOTE 4. Transactions with Affiliates and Related Parties
The Funds’ investments are managed by the Adviser pursuant to the terms of an advisory agreement. The Adviser has hired the Sub-Adviser to manage the Funds’ assets on a day-to-day basis. The Sub-Adviser is paid by the Adviser. In accordance with the advisory agreement, the Adviser is entitled to an investment management fee, computed and accrued daily and paid monthly, at an annual rate of 1.00% of the average daily net assets of each Fund. For the fiscal year ended March 31, 2010, the Adviser earned fees, before the waiver described below, of $153,007 and $124,585 from the Small Cap Fund and the Large Cap Fund, respectively. The Adviser has contractually agreed to waive all or a portion of its fees and/or reimburse expenses of each Fund, but only to the extent necessary to mainta in total operating expenses, excluding brokerage fees and commissions, borrowing costs (such as interest and dividend expense on securities sold short), taxes, extraordinary expenses and any indirect expenses (such as expenses incurred by other investment companies in which the Funds may invest) at 1.50% of average daily net assets through July 31, 2011. For the fiscal year ended March 31, 2010, the Adviser waived fees of $122,570 and $111,143 for the Small Cap Fund and Large Cap Fund, respectively. Any such waiver or reimbursement of operating expenses by the Adviser is subject to repayment by the applicable Fund in the first, second, and third fiscal years following the year in which the waiver or reimbursement occurs, if the Fund is able to make the payment without exceeding the above described expense limitations. As of March 31, 2010, the following amounts are subject to repayment by the Funds to the Adviser:
| Small Cap Value Fund | $ 117,987 | 2011 | ||
| 95,763 | 2012 | |||
| 122,570 | 2013 | |||
| Large Cap Value Fund | $ 120,417 | 2011 | ||
| 94,684 | 2012 | |||
| 111,143 | 2013 |
Each Fund retains Unified Fund Services, Inc. (“Unified”) to manage the Fund’s business affairs and provide the Fund with administrative services, including all regulatory reporting and necessary office equipment and personnel. These administrative services also include fund accounting and transfer agency services. For the fiscal year ended March 31, 2010, Unified earned fees of $78,462 and $62,167 from the Small Cap Fund and Large Cap Fund, respectively, for administrative, fund accounting, and transfer agency services. For the fiscal year ended March 31, 2010, Unified was reimbursed $25,769 and $26,380 by the Small Cap Fund and Large Cap Fund, respectively, for out-of-pocket expenses. As of March 31, 2010, Unified was owed $7,874 and $6,283 by the Small Cap Fund and Large Cap Fund, respectively, for administrative s ervices and reimbursement of out-of-pocket expenses. Certain officers of the Trust are members of management and/or employees of Unified. Unified is a wholly-owned subsidiary of Huntington Bancshares, Inc., the parent company of the principal distributor of the Funds.
Unified Financial Securities, Inc. (the “Distributor”) acts as the principal distributor of the Funds. There were no payments made to the Distributor by the Funds for the fiscal year ended March 31, 2010. The Distributor and Unified are controlled by Huntington Bancshares, Inc. A Trustee of the Trust is a member of management of Huntington National Bank, a subsidiary of Huntington Bancshares, Inc. (the parent of the Distributor) and officers of the Trust are officers of the Distributor and such persons may be deemed to be affiliates of the Distributor.
Each Fund has adopted a Rule 12b-1 Plan (“Plan” or “Plans”) that allows the Fund to pay an annual fee of 0.25% to financial institutions that provide distribution services and/or shareholder servicing. The Funds do not currently intend to activate the Plans prior to July 31, 2010.
DEAN FUNDS
NOTES TO THE FINANCIAL STATEMENTS - continued
March 31, 2010
NOTE 5. Investments
For the fiscal year ended March 31, 2010, purchases and sales of investment securities, other than short-term investments and short-term U.S. government obligations, were as follows:
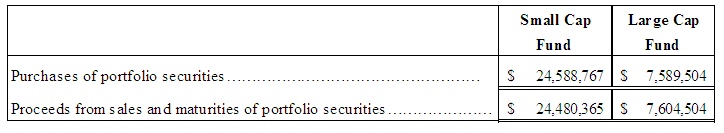
As of March 31, 2010, the net unrealized appreciation (depreciation) of investments for tax purposes was as follows:
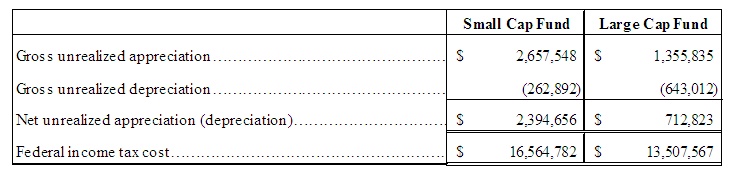
NOTE 6. Estimates
The preparation of financial statements in conformity with GAAP requires management to make estimates and assumptions that affect the reported amounts of assets and liabilities and disclosure of contingent assets and liabilities at the date of the financial statements and the reported amounts of increases and decreases in net assets from operations during the reporting period. Actual results could differ from those estimates.
NOTE 7. Beneficial Ownership
The beneficial ownership, either directly or indirectly, of more than 25% of the voting securities of a fund creates a presumption of control of the fund, under Section 2(a)(9) of the Investment Company Act of 1940. As of March 31, 2010, Dean Wealth Management, LP, for the benefit of its partners, owned 54.88% and 69.04% of the Small Cap Fund and the Large Cap Fund, respectively. As a result, Dean Wealth Management, LP, an affiliate of the Adviser, may be deemed to control each of the Funds.
DEAN FUNDS
NOTES TO THE FINANCIAL STATEMENTS - continued
March 31, 2010
NOTE 8. Distributions to Shareholders
Small Cap Fund. On December 28, 2009, the Small Cap Value Fund paid an income distribution of $0.0831 per share to shareholders of record on December 24, 2009.
The tax character of distributions paid during the fiscal years ended March 31, 2010 and 2009 was as follows:
| 2010 | 2009 | ||||||
| Distributions paid from: | |||||||
| Ordinary income…………………. | $ | 161,826 | $ | 172,875 | |||
| Long-term capital gains…………. | - | 40,631 | |||||
| $ | 161,826 | $ | 213,506 | ||||
Large Cap Fund. On December 28, 2009, the Large Cap Fund paid an income distribution of $0.090 per share to shareholders of record on December 24, 2009.
The tax character of distributions paid during the fiscal years ended March 31, 2010 and 2009 was as follows:
| 2010 | 2009 | ||||||
| Distributions paid from: | |||||||
| Ordinary income…………………. | $ | 128,145 | $ | 193,326 | |||
| $ | 128,145 | $ | 193,326 | ||||
As of March 31, 2010, the components of distributable earnings (accumulated losses) on a tax basis are as follows:
| Small Cap Value Fund | Large Cap Value Fund | |||||||
| Undistributed ordinary income | $ | 249,986 | $ | 55,456 | ||||
| Capital loss carryforward | (5,363,768 | ) | (5,519,995 | ) | ||||
| Undistributed long-term realized gain | - | |||||||
| Unrealized appreciation (depreciation) | 2,394,656 | 712,823 | ||||||
| $ | (2,719,126 | ) | $ | (4,751,716 | ) | |||
As of March 31, 2010, the difference between book basis and tax basis unrealized appreciation (depreciation) is primarily attributable to the deferral of losses on wash sales and post-October losses. As of March 31, 2010 wash sales losses deferred for the Small Cap Fund and the Large Cap Fund were $19,191 and $0, respectively, and post-October losses deferred for the Small Cap Fund and Large Cap Fund were $0 and $83,036, respectively.
DEAN FUNDS
NOTES TO THE FINANCIAL STATEMENTS - continued
March 31, 2010
NOTE 9. Capital Loss Carryforwards
As of March 31, 2010, for federal income tax purposes, the Funds have capital loss carryforwards available to offset future capital gains, if any, in the following amounts:
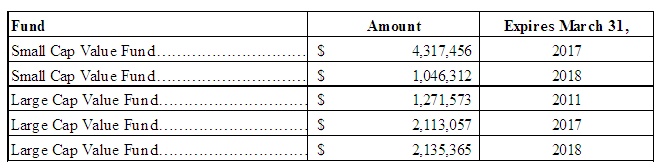
REPORT OF INDEPENDENT REGISTERED PUBLIC ACCOUNTING FIRM
To the Shareholders and Board of Trustees
Dean Funds
(Unified Series Trust)
We have audited the accompanying statements of assets and liabilities, including the schedules of investments, of the Dean Funds (the “Funds”), comprised of the Dean Small Cap Value Fund and the Dean Large Cap Value Fund, each a series of the Unified Series Trust, as of March 31, 2010, and the related statements of operations for the year then ended, the statements of changes in net assets for each of the two years in the period then ended, and the financial highlights for each of the four years in the period then ended. These financial statements and financial highlights are the responsibility of Fund management. Our responsibility is to express an opinion on these financial statements and financial highlights based on our audits. The financial highlights for the periods indicated prior to March 31, 2007 were au dited by another independent registered public accounting firm which expressed unqualified opinions on those financial highlights.
We conducted our audits in accordance with the standards of the Public Company Accounting Oversight Board (United States). Those standards require that we plan and perform the audit to obtain reasonable assurance about whether the financial statements and financial highlights are free of material misstatement. An audit includes examining, on a test basis, evidence supporting the amounts and disclosures in the financial statements. Our procedures included confirmation of securities owned as of March 31, 2010 by correspondence with the custodian and broker. An audit also includes assessing the accounting principles used and significant estimates made by management, as well as evaluating the overall financial statement presentation. We believe that our audits provide a reasonable basi s for our opinion.
In our opinion, the financial statements and financial highlights referred to above present fairly, in all material respects, the financial position of each of the funds constituting the Dean Funds as of March 31, 2010 , the results of their operations for the year then ended, the changes in their net assets for each of the two years in the period then ended, and their financial highlights for the periods indicated therein, in conformity with accounting principles generally accepted in the United States of America.
COHEN FUND AUDIT SERVICES, LTD.
Westlake, Ohio
June 1, 2010
TRUSTEES AND OFFICERS
The Board of Trustees supervises the business activities of the Trust. Each Trustee serves as a trustee until termination of the Trust unless the Trustee dies, resigns, retires or is removed.
The following tables provide information regarding the Trustees and Officers.
Independent Trustees
Name, Address*, (Age), Position with Trust**, Term of Position with Trust | Principal Occupation During Past 5 Years and Other Directorships |
Gary E. Hippenstiel (Age - 62) Independent Trustee, December 2002 to present | President and founder of Hippenstiel Investment Counsel LLC, a registered investment advisor, since November 2008; Director, Vice President and Chief Investment Officer of Legacy Trust Company, N.A. from September 1991 to September 2008; Chairman of the investment committee for W.H. Donner Foundation and Donner Canadian Foundation since June 2005; Trustee of AmeriPrime Advisors Trust from July 2002 to September 2005; Trustee of Access Variable Insurance Trust from April 2003 to August 2005; Trustee of AmeriPrime Funds from September 1995 to July 2005; Trustee of CCMI Funds from June 2003 to March 2005. |
Stephen A. Little (Age - 63) Chairman, December 2004 to present; Independent Trustee, December 2002 to present | President and founder of The Rose, Inc., a registered investment advisor, since April 1993; Trustee of AmeriPrime Advisors Trust from November 2002 to September 2005; Trustee of AmeriPrime Funds from December 2002 to July 2005; Trustee of CCMI Funds from June 2003 to March 2005. |
Daniel J. Condon (Age - 59) Independent Trustee, December 2002 to present | President of International Crankshaft Inc., an automotive equipment manufacturing company, since 2004 ; Director, International Crankshaft, Inc. since January 2004; Trustee of AmeriPrime Advisors Trust from November 2002 to September 2005; Trustee of AmeriPrime Funds from December 2002 to July 2005; Trustee of CCMI Funds from June 2003 to March 2005. |
Ronald C. Tritschler (Age - 57) Independent Trustee, January 2007 to present; Interested Trustee, December 2002 to December 2006 | Chief Executive Officer, Director and Legal Counsel of The Webb Companies, a national real estate company, since 2001; Director of First State Financial since 1998; Director, Vice President and Legal Counsel of The Traxx Companies, an owner and operator of convenience stores, since 1989; Trustee of AmeriPrime Advisors Trust from November 2002 to September 2005; Trustee of AmeriPrime Funds from December 2002 to July 2005; Trustee of CCMI Funds from June 2003 to March 2005. |
Kenneth G.Y. Grant (Age – 60) Independent Trustee, May 2008 to present | Senior Vice President of Global Trust Company since 2008; Senior Vice President of Advisors Charitable Gift Fund since May 2005; Senior Vice President and Chief Officer, Corporate Development, of Northeast Retirement Services, Inc. since February 2003; Senior Vice President of Savings Banks Employees Retirement Association since February 2003; Treasurer (since January 2004) and past Chair, Board of Directors of Massachusetts Council of Churches; Member, Presbytery of Boston, Presbyterian Church (U.S.A.) since June 1975. |
Interested Trustees & Officers
| Name, Address*, (Age), Position with Trust,** Term of Position with Trust | Principal Occupation During Past 5 Years and Other Directorships |
Nancy V. Kelly (Age - 54)*** Trustee, November 2007 to present | Executive Vice President of Huntington National Bank, the Trust’s custodian, since December 2001; Director, Wedgewood Golf & Country Club since October, 2008; Director, Greenlawn Cemetery since October, 2007; Director, Directions for Youth and Families, a social service agency, since August 2006. |
Melissa K. Gallagher (Age - 44) President, November 2009 to present | Senior Vice President of Unified Fund Services, Inc., the Trust’s Administrator; President and Treasurer of Unified Financial Securities, Inc., the Trust’s Distributor; Employed in various positions with Unified Fund Services, Inc. and Unified Financial Securities, Inc., since September 2000. |
John C. Swhear (Age - 48) Senior Vice President, May 2007 to present | Vice President of Legal Administration and Compliance for Unified Fund Services, Inc., the Trust’s administrator, since April 2007; Chief Compliance Officer of the Valued Advisers Trust since August 2008; Chief Compliance Officer of Unified Financial Securities, Inc., the Trust’s distributor, since May 2007; Employed in various positions with American United Life Insurance Company from June 1983 to April 2007, including: Associate General Counsel, April 2007; Investment Adviser Chief Compliance Officer, June 2004 to April 2007; Assistant Secretary to the Board of Directors, December 2002 to April 2007 and Chief Compliance Officer of OneAmerica Funds, Inc., June 2004 to April 2007; Chief Counsel, OneAmerica Securities Inc., February 2007 to April 2007; Secretary, OneAmerica Securities, Inc., December 2002 to April 2007. |
Christopher E. Kashmerick (Age - 35) Treasurer and Chief Financial Officer, November 2008 to present | Vice President of Fund Accounting, Financial and Tax Reporting for Unified Fund Services, Inc., the Trust's Administrator, since April 2008; Assistant Vice President, Compliance Officer and Compliance Administrator for U.S. Bancorp Fund Services, LLC, a mutual fund servicing company, from February 2005 to April 2008; Employed in various positions with UMB Fund Services, a mutual fund servicing company including: Senior Accounting Analyst, Accounting Analyst and Fund Balancing Supervisor, from May 2000 through February 2005. |
Lynn E. Wood (Age - 63) Chief Compliance Officer, October 2004 to present | Chief Compliance Officer of AmeriPrime Advisors Trust from October 2004 to September 2005; Chief Compliance Officer of AmeriPrime Funds from October 2004 to July 2005; Chief Compliance Officer of CCMI Funds from October 2004 to March 2005; Chairman and Chief Compliance Officer of Unified Financial Securities, Inc., the Trust’s distributor, from September 2000 to December 2004; Director of Compliance of Unified Fund Services, Inc., the Trust’s administrator, from October 2003 to September 2004; Chief Compliance Officer of Unified Financial Services, Inc., the parent company of the Trust’s administrator and distributor, from September 2000 to Octob er 2004. |
Heather Bonds (Age - 34) Secretary, July 2005 to present; Assistant Secretary, September 2004 to June 2005 | Employed by Unified Fund Services, Inc., the Trust’s administrator, since January 2004 and from December 1999 to January 2002, currently Manager, Board Relations and Legal Administration, since March 2008; Secretary of the Valued Advisers Trust since August 2008; Secretary of RiverNorth Funds since February 2009; Assistant Secretary of Dean Family of Funds August 2004 to March 2007; Secretary of AmeriPrime Advisors Trust from July 2005 to September 2005; Assistant Secretary of AmeriPrime Funds from September 2004 to July 2005; Assistant Secretary of CCMI Funds from September 2004 to March 2005; Regional Administrative Assistant of The Standard Register Company from February 2003 to January 2004. |
* The address for each officer is 2960 North Meridian Street, Suite 300, Indianapolis, IN 46208
** The Trust currently consists of 27 series.
*** Ms. Kelly is deemed an interested trustee because she is an officer of an entity that is under common control with Unified Financial Securities, Inc., the Distributor, as of March 31, 2010.
OTHER INFORMATION
The Funds’ Statement of Additional Information (“SAI”) includes information about the trustees and is available, without charge, upon request. You may call toll-free 1-888-899-8343 to request a copy of the SAI or to make shareholder inquiries.
ADISORY AND SUBADVISORY AGREEMENT RENEWAL – (Unaudited)
Renewal of the Advisory Agreements between the Trust and Dean Investment Associates, LLC (the Adviser) and the Subadvisory Agreement between the Adviser and Dean Capital Management, LLC (the Subadviser) were considered by the Board, including a majority of Trustees who are not interested persons of the Trust or interested parties to the Agreements (collectively, the Independent Trustees and, each an “Independent Trustee”) at an in-person meeting held on February 7-8, 2010 (The Advisory Agreements with the Subadvisory Agreement, each an “Agreement” and collectively the “Agreements”). At the meeting the Chairman reported that on January 25, 2010, the Adviser Contract Renewal Committee (the “Committee”) of the Board convened via teleconference to consider whether to recommend that the full Board approve the continuance of the Agreements between the Trust, on behalf of each Fund and the Adviser and between the Adviser and Subadviser.
The Chairman of the Board noted that all participants acknowledged receiving and reviewing the materials furnished by the Administrator and provided in advance of the meeting. He also noted that no changes had been proposed to the Funds’ Agreements, and that the Adviser had agreed to renew its obligation to cap the Funds’ expenses for an additional year. Materials specifically provided to the Board included the following information: (i) executed copies of the Funds’ advisory agreements, sub-advisory agreement and current expense cap side letters; (ii) letters setting forth the Adviser’s and Subadviser’s responses to a de tailed series of questions from the Administrator regarding, among other things, the services provided to the Funds, profitability from managing the Funds and ideas for future growth of the Funds, (iii) certifications from Trust’s Chief Compliance Officer (“CCO”) that the Adviser and Subadviser each has adopted a compliance program that is reasonably designed to prevent violation of federal securities laws by the Funds, (iv) the Adviser’s and the Subadviser’s Form ADV Part I and II and accompanying schedules, (v) reports provided by the Administrator regarding the Funds’ performance for the past three month, one, three, five, and ten year periods ending December 31, 2009 and comparisons of the same to the applicable benchmark and peer group for the same periods, and (vi) reports provided by the Administrator comparing each Fund’s advisory fee and total expenses (after fee waivers and reimbursements) to such Fund’s peer group as determined by the Administra tor.
The Nature, Extent and Quality of Service: The Committee noted that the Adviser and Subadviser provide the support of various administrative and professional staff, including those of their chief compliance officers. Pursuant to the subadvisory agreement, the services of the Funds’ portfolio managers, who make all investment decisions for the Fund and who appear to have adequate experience to manage the Funds, are provided through the Subadviser. The Committee also noted that the Subadviser provides two portfolio managers and two other investment personnel to each of the Funds. The Committee determined that the Adviser’s and Subadviser’s resources appear adequate. The Commit tee noted that neither the Adviser, nor the Subadviser was proposing any changes to the level of services provided to the Fund. The Committee noted that various compliance reports had been provided by the Adviser and the Trust’s CCO to the Board of Trustees throughout the year, and noted, based on such reports, that each Fund’s investment policies and restrictions were consistently complied with during the last year. The CCO reported that he had reviewed the Adviser’s compliance policies and procedures and determined that they appeared reasonably designed to prevent violation of federal securities laws. The CCO stated that he also had reviewed the Subadviser’s compliance policies and procedures and, pending the Subadviser’s completion of its annual review and assessment of its compliance program, determined that they appeared reasonably designed to prevent violation of federal securities laws.
Fund Performance: The Committee discussed the Funds’ performance and reviewed other materials provided by the Administrator with respect to such performance. The Committee noted that the Administrator reported that for the three- and five-year periods ended December 31, 2009, the Small Cap Fund had underperformed its benchmarks (the Russell 2000 Value and Russell 2000 indices) and its peer group average, but that the Small Cap Fund had outperformed its benchmarks and peer group average for the past three month and one year periods. They further noted that for the ten year period, the Small Cap Fund had outperformed both its peer group average and the Russell 2000. They noted that the Administrator reported that for th e five- and ten- year periods ended December 31, 2009, the Large Cap Fund had underperformed its primary benchmark, the Russell 1000 Value, but had outperformed the Russell 1000 Value for the 3 month, and one and three year periods. They further noted that the Large Cap Fund had underperformed its other comparative benchmark, the Russell 1000 for the one, three, and five year periods, but had outperformed the Russell 1000 for the ten year period and more recently, over the three month period. The Committee noted that the Large Cap Fund had underperformed its peer group average for the past one year, but also noted that relative performance had recently improved so that the Large Cap Fund had outperformed its peer group average for the past three month period.
ADISORY AND SUBADVISORY AGREEMENT RENEWAL – (Unaudited) – continued
The Committee noted that the Small Cap Fund had slightly underperformed the Adviser’s similarly-managed separate accounts and the Large Cap Fund had outperformed the Adviser’s similarly-managed separate accounts. The Committee recalled that the Adviser had assured them that it monitors any differences in performance and that the slight difference was attributable to and in line with the different investment strategies.
Fees and Profitability: The Adviser’s compliance officer confirmed that the Adviser contractually has agreed to continue capping certain operating expenses of each Fund at 1.50% through July 31, 2011. The Committee noted that the Adviser’s fee of 1.00% was in line with the Small Cap Fund’s peer group average. The Committee noted that, although the Adviser’s fee of 1.00% was higher than the Large Cap Fund’s peer group average, the Large Cap Fund’s net expense ratio was lower than its peer group average. They noted that the Subadviser’s fees of 0.90% for the Small Cap Fund and 0.50% for the Large Cap Fund were paid out of the Adviser’s fees. They further noted that advisory fees were higher than those of separate accounts managed by the Adviser, which the Adviser reported was due to the Fund’s higher regulatory, distribution, and servicing costs. The Committee reviewed the Adviser’s preliminary financial statements as of the calendar year end, and noted that each Fund’s assets constituted only a small portion of the Adviser’s total assets under management. They noted that the Adviser had waived 90% of its advisory fee for the Small Cap Fund. They further noted that the Adviser had waived its entire advisory fee and reimbursed expenses in order to maintain the Large Cap Fund’s expense cap. The Committee noted that the Adviser was not realizing a profit as a result of managing the Funds. Finally, the Committee noted that the Adviser reported that it had entered into a soft dollar arrangement and was executing brokerage transactions on behalf of the Funds on the basis of best executi on and research provided by executing brokers. They noted that the Subadviser reported that it had not entered into any soft dollar arrangements.
Economies of Scales: In determining the reasonableness of the advisory fees, the Committee members also considered whether economies of scale will be realized as the Funds grow larger, and the extent to which this is reflected in the advisory fees. They noted that although the Adviser had dedicated business development personnel working to expand distribution through various channels, it does not appear that the Adviser has begun to realize any significant economies of scale from managing the Funds.
The Committee reviewed the foregoing with the Board, indicating that its members had determined that the terms of the Agreements were reasonable and that its members were recommending that the Board renew the Agreements. Based on the above, the Board, including all of the Trustees who are not “interested persons” (within the meaning of the 1940 Act) of the Trust or the Adviser, determined that the Advisory Agreements with the Adviser and the Subadviser Agreement with the Subadviser were reasonable and unanimously approved the continuance of the Advisory Agreements with the Adviser and the Subadviser Agreement with the Subadviser for an additional year.
Proxy Voting
A description of the policies and procedures that the Funds use to determine how to vote proxies relating to portfolio securities and information regarding how the Funds voted those proxies during the most recent twelve month period ended June 30 are available, without charge, upon request by calling 1-800-327-3656 or on the SEC’s website at http://www.sec.gov.
TRUSTEES
Daniel J. Condon
Kenneth G. Y. Grant
Gary E. Hippenstiel
Nancy V. Kelly
Stephen A. Little
Ronald C. Tritschler
OFFICERS
Melissa K. Gallagher, President
John Swhear, Senior Vice President
Christopher E. Kashmerick, Chief Financial Officer and Treasurer
Heather A. Bonds, Secretary
Lynn Wood, Chief Compliance Officer
INVESTMENT ADVISER
Dean Investment Associates LLC
2200 Kettering Tower
Dayton, Ohio 45423
DISTRIBUTOR
Unified Financial Securities, Inc.
2960 North Meridian Street, Suite 300
Indianapolis, IN 46208
INDEPENDENT REGISTERED PUBLIC ACCOUNTING FIRM
Cohen Fund Audit Services, Ltd.
800 Westpoint Parkway, Suite 1100
Westlake, OH 44145
LEGAL COUNSEL
Thompson Coburn LLP
One US Bank Plaza
St. Louis, MO 63101
LEGAL COUNSEL TO THE INDEPENDENT TRUSTEES
Thompson Hine, LLP
312 Walnut Street, 14th Floor
Cincinnati, OH 45202
CUSTODIAN
U.S. Bank, N.A.
425 Walnut St.
Cincinnati, OH 45202
ADMINISTRATOR, TRANSFER AGENT AND FUND ACCOUNTANT
Unified Fund Services, Inc.
2960 North Meridian Street, Suite 300
Indianapolis, IN 46208
This report is intended only for the information of shareholders or those who have received the Funds’ prospectus which contains information about each Fund’s management fee and expenses. Please read the prospectus carefully before investing.
Distributed by Unified Financial Securities, Inc.
Member FINRA/SIPC
Item 2. Code of Ethics.
(a) As of the end of the period covered by this report, the registrant has adopted a code of ethics that applies to the registrant's principal executive officer, principal financial officer, principal accounting officer or controller, or persons performing similar functions, regardless of whether these individuals are employed by the registrant or a third party.
(b) For purposes of this item, “code of ethics” means written standards that are reasonably designed to deter wrongdoing and to promote:
| (1) | Honest and ethical conduct, including the ethical handling of actual or apparent conflicts of interest between personal and professional relationships; |
| (2) | Full, fair, accurate, timely, and understandable disclosure in reports and documents that a registrant files with, or submits to, the Commission and in other public communications made by the registrant; |
(3) Compliance with applicable governmental laws, rules, and regulations;
| (4) | The prompt internal reporting of violations of the code to an appropriate person or persons identified in the code; and |
(5) Accountability for adherence to the code.
(c) Amendments: During the period covered by the report, there have not been any amendments to the provisions of the code of ethics.
(d) Waivers: During the period covered by the report, the registrant has not granted any express or implicit waivers from the provisions of the code of ethics.
(e) Posting: We do not intend to post the Code of Ethics for the Officers or any amendments or waivers on a website.
(f) Availability: The Code of Ethics for the Officers can be obtained, free of charge by calling the toll free number for the appropriate Fund.
Item 3. Audit Committee Financial Expert.
(a) The registrant’s board of trustees has determined that the registrant does not have an audit committee financial expert. The committee members and the full Board considered a possibility of adding a member that would qualify as an expert. The audit committee determined that, although none of its members meet the technical definition of an audit committee expert, the committee has sufficient financial expertise to adequately perform its duties under the Audit Committee Charter without the addition of a qualified expert.
Item 4. Principal Accountant Fees and Services.
(a) Audit Fees | ||||
| Dean Large Cap Value Fund: | FY 2010 | $11,000 | ||
| FY 2009 | $11,000 | |||
| Dean Small Cap Value Fund: | FY 2010 | $11,000 | ||
| FY 2009 | $11,000 | |||
(b) Audit-Related Fees | ||||
| Registrant | ||||
| Dean Large Cap Value Fund: | FY 2010 | $0 | ||
| FY 2009 | $0 | |||
| Dean Small Cap Value Fund: | FY 2010 | $0 | ||
| FY 2009 | $0 | |||
(c) Tax Fees | ||||
| Registrant | ||||
| Dean Large Cap Value Fund: | FY 2010 | $2,500 | ||
| FY 2009 | $2,000 | |||
| Dean Small Cap Value Fund: | FY 2010 | $2,500 | ||
| FY 2009 | $2,000 | |||
| Nature of the fees: | Preparation of the 1120 RIC and Excise review | |||
(d) All Other Fees | ||||
| Registrant | ||||
| Dean Large Cap Value Fund: | FY 2010 | $0 | ||
| FY 2009 | $0 | |||
| Dean Small Cap Value Fund: | FY 2010 | $0 | ||
| FY 2009 | $0 | |||
| (e) | (1) | Audit Committee’s Pre-Approval Policies |
The Audit Committee Charter requires the Audit Committee to be responsible for the selection, retention or termination of auditors and, in connection therewith, to (i) evaluate the proposed fees and other compensation, if any, to be paid to the auditors, (ii) evaluate the independence of the auditors, (iii) pre-approve all audit services and, when appropriate, any non-audit services provided by the independent auditors to the Trust, (iv) pre-approve, when appropriate, any non-audit services provided by the independent auditors to the Trust's investment adviser, or any entity controlling, controlled by, or under common control with the investment adviser and that provides ongoing services to the Trust if the engagement relates directly to the operations and financial reporting of the Trust, and (v) receive the auditors’ specific representations as to their independence;
| (2) | Percentages of Services Approved by the Audit Committee |
| Registrant |
Audit-Related Fees: 0%
Tax Fees: 0%
All Other Fees: 0%
(f) During audit of registrant's financial statements for the most recent fiscal year, less than 50 percent of the hours expended on the principal accountant's engagement were attributed to work performed by persons other than the principal accountant's full-time, permanent employees.
(g) The aggregate non-audit fees billed by the registrant's accountant for services rendered to the registrant, and rendered to the registrant's investment adviser (not including any sub-adviser whose role is primarily portfolio management and is subcontracted with or overseen by another investment adviser), and any entity controlling, controlled by, or under common control with the adviser that provides ongoing services to the registrant:
| Registrant | Adviser |
| FY 2010 | $ 0 | $ 0 |
| FY 2009 | $ 0 | $ 0 |
(h) Not applicable. The auditor performed no services for the registrant’s investment adviser or any entity controlling, controlled by, or under common control with the investment adviser that provides ongoing services to the registrant.
Item 5. Audit Committee of Listed Companies. NOT APPLICABLE – applies to listed companies only
Item 6. Schedule of Investments. Schedule filed with Item 1.
Item 7. Disclosure of Proxy Voting Policies and Procedures for Closed-End Management Investment Companies. NOT APPLICABLE – applies to closed-end funds only
Item 8. Portfolio Managers of Closed-End Investment Companies. NOT APPLICABLE – applies to closed-end funds only
Item 9. Purchases of Equity Securities by Closed-End Management Investment Company and Affiliated Purchasers. NOT APPLICABLE – applies to closed-end funds only
Item 10. Submission of Matters to a Vote of Security Holders.
The registrant has not adopted procedures by which shareholders may recommend nominees to the registrant’s board of trustees.
Item 11. Controls and Procedures.
(a) Based on an evaluation of the registrant’s disclosure controls and procedures as of May 17, 2010 the disclosure controls and procedures are reasonably designed to ensure that the information required in filings on Forms N-CSR is recorded, processed, summarized, and reported on a timely basis.
(b) There were no significant changes in the registrant’s internal control over financial reporting that occurred during the registrant’s second fiscal quarter of the period covered by this report that have materially affected, or are reasonably likely to materially affect, the registrant’s internal control over financial reporting.
Item 12. Exhibits.
(a) (1) Code is filed herewith
| (2) | Certifications by the registrant's principal executive officer and principal financial officer, pursuant to Section 302 of the Sarbanes- Oxley Act of 2002 and required by Rule 30a-2under the Investment Company Act of 1940 are filed herewith. |
(3) Not Applicable
| (b) | Certification pursuant to 18 U.S.C. Section 1350, as adopted pursuant to Section 906 of the Sarbanes-Oxley Act of 2002 is filed herewith. |
SIGNATURES
Pursuant to the requirements of the Securities Exchange Act of 1934 and the Investment Company Act of 1940, the registrant has duly caused this report to be signed on its behalf by the undersigned, thereunto duly authorized.
(Registrant) Unified Series Trust
By
/s/ Melissa K. Gallagher
Melissa K. Gallagher, President
Date 6/8/10
Pursuant to the requirements of the Securities Exchange Act of 1934 and the Investment Company Act of 1940, this report has been signed below by the following persons on behalf of the registrant and in the capacities and on the dates indicated.
By
/s/ Melissa K. Gallagher
Melissa K. Gallagher, President
Date 6/8/10
By
/s/ Christopher E. Kashmerick
Christopher E. Kashmerick, Treasurer
Date 6/8/10